The Formation of Giant Elliptical Galaxies and Their Globular Cluster Systems
39
arXiv:astro-ph/9804319v1 29 Apr 1998 Accepted to the Astrophysical Journal, July 10 issue The Formation of Giant Elliptical Galaxies and Their Globular Cluster Systems Patrick Cˆ ot´ e 1 Dominion Astrophysical Observatory, Herzberg Institute of Astrophysics, National Research Council of Canada, 5071 W. Saanich Road, Victoria, BC, V8X 4M6, Canada, and California Institute of Technology, Mail Stop 105-24, Pasadena, CA 91125 [email protected] Ronald O. Marzke 2 Dominion Astrophysical Observatory, Herzberg Institute of Astrophysics, National Research Council of Canada, 5071 W. Saanich Road, Victoria, BC, V8X 4M6, Canada, and Observatories of the Carnegie Institution of Washington, 813 Santa Barbara Street, Pasadena, CA 91101 [email protected] and Michael J. West 3 Department of Astronomy and Physics, Saint Mary’s University, Halifax, NS, B3H 3C3, Canada [email protected] ABSTRACT We examine the formation of giant elliptical galaxies using their globular cluster (GC) systems as probes of their evolutionary history. The bimodal distributions of GC metallicities in such galaxies are often cited as evidence for the formation of giant elliptical galaxies through mergers involving gas-rich spirals, with the metal-rich GCs forming during the merger process. We explore an alternative possibility: that these metal-rich clusters represent the galaxy’s intrinsic GC population and that the metal-poor component of the observed GC metallicity distribution arises from the capture of GCs from other galaxies, either through mergers or through tidal stripping. Starting with plausible assumptions for the luminosity function of galaxies in the host 1 Sherman M. Fairchild Fellow 2 Hubble Fellow 3 Also CITA Senior Visiting Fellow, Canadian Institute for Theoretical Astrophysics, University of Toronto, 60 Saint George Street, Toronto, ON M5S 1A7, Canada.
-
Upload
independent -
Category
Documents
-
view
0 -
download
0
Transcript of The Formation of Giant Elliptical Galaxies and Their Globular Cluster Systems

arX
iv:a
stro
-ph/
9804
319v
1 2
9 A
pr 1
998
Accepted to the Astrophysical Journal, July 10 issue
The Formation of Giant Elliptical Galaxies and Their Globular Cluster Systems
Patrick Cote1
Dominion Astrophysical Observatory, Herzberg Institute of Astrophysics, National Research
Council of Canada, 5071 W. Saanich Road, Victoria, BC, V8X 4M6, Canada, and
California Institute of Technology, Mail Stop 105-24, Pasadena, CA 91125
Ronald O. Marzke2
Dominion Astrophysical Observatory, Herzberg Institute of Astrophysics, National Research
Council of Canada, 5071 W. Saanich Road, Victoria, BC, V8X 4M6, Canada, and
Observatories of the Carnegie Institution of Washington,
813 Santa Barbara Street, Pasadena, CA 91101
and
Michael J. West3
Department of Astronomy and Physics, Saint Mary’s University,
Halifax, NS, B3H 3C3, Canada
ABSTRACT
We examine the formation of giant elliptical galaxies using their globular cluster
(GC) systems as probes of their evolutionary history. The bimodal distributions of
GC metallicities in such galaxies are often cited as evidence for the formation of
giant elliptical galaxies through mergers involving gas-rich spirals, with the metal-rich
GCs forming during the merger process. We explore an alternative possibility: that
these metal-rich clusters represent the galaxy’s intrinsic GC population and that the
metal-poor component of the observed GC metallicity distribution arises from the
capture of GCs from other galaxies, either through mergers or through tidal stripping.
Starting with plausible assumptions for the luminosity function of galaxies in the host
1Sherman M. Fairchild Fellow
2Hubble Fellow
3Also CITA Senior Visiting Fellow, Canadian Institute for Theoretical Astrophysics, University of Toronto, 60
Saint George Street, Toronto, ON M5S 1A7, Canada.

– 2 –
cluster and for the dependence of GC metallicity on parent galaxy luminosity, we show
using Monte-Carlo simulations that the growth of a pre-existing seed galaxy through
mergers and tidal stripping is accompanied naturally by the capture of metal-poor
GCs whose chemical abundances are similar to those which are observed to surround
giant ellipticals.
We also investigate the spatial distribution of GCs in isolated galaxies of low and
intermediate luminosity and conclude that, at the epoch of formation, the GCSs of
such galaxies are likely to have been more spatially extended than their constituent
stars. Thus, the capture of GCs through tidal stripping, unlike mergers, does not
necessarily conserve GC specific frequency. Comparisons of model GC metallicity
distributions and specific frequencies to those observed for the well-studied galaxies
NGC 4472 (=M49) and NGC 4486 (=M87), the two brightest cluster members of the
nearby Virgo cluster, show that it is possible to explain their bimodal GC metallicity
distributions and discordant specific frequencies without resorting to the formation
of new GCs in mergers or by invoking multiple bursts of GC formation. Finally, we
discuss the possibility of using the ratio of the number of metal-poor and metal-rich
GCs in giant elliptical galaxies as a diagnostic of their merger histories. We use this
method to derive upper limits on the number of galaxies and total luminosity accreted
to date by NGC 4472.
Subject headings: galaxies: clusters: general — galaxies: elliptical and lenticular, cD
— galaxies: star clusters
1. Introduction
An understanding of galaxy formation is one of the principal goals of modern astrophysics.
An important first step in this campaign came with the demonstration by Toomre (1977) that
mergers of late-type galaxies often produce end-products which bear a striking resemblance to
giant ellipticals (gEs). In subsequent years, support has grown for the notion that mergers play an
important, if not dominant, role in the formation of gE galaxies. Not only have investigations into
the structure and kinematics of low-redshift gEs revealed fossil evidence of past mergers (Bender
& Surma 1992; Tremblay & Merritt 1996; Faber et al. 1997), but theoretical models of galaxy
formation invariably predict the growth of such galaxies through mergers (Kauffmann, White &
Guiderdoni 1993; Cole et al. 1994; Navarro, Frenk & White 1995). Particularly close attention
has been paid to cD galaxies and centrally dominant ellipticals in rich clusters since it is widely
believed that the formation of these rare objects is fundamentally connected to the formation of
the clusters themselves (e.g., Ostriker & Tremaine 1975; Hausman & Ostriker 1978; Merritt 1984,
1985; Mackie 1992; West 1994).

– 3 –
The globular cluster systems (GCSs) of gE galaxies have traditionally provided some of the
most stringent constraints on models for the formation and evolution of these objects (e.g., Harris
1986). Since GCs are the oldest and brightest objects which can be identified in gE galaxies, they
are powerful tools for investigating the structure and chemical evolution of their host galaxies at
the epoch of formation. Indeed, any model which seeks to explain the formation of gEs must be
able to account for the number, chemical abundance and spatial distribution of their associated
systems of GCs.
One of the strongest arguments against the view that gE galaxies represent the remains of
merged spirals (e.g., Toomre 1977) is that of van den Bergh (1982). Simply stated, ellipticals have
GC specific frequencies (i.e., the number of GCs per unit parent galaxy luminosity; see §2.3) which
are two to three times higher than those of spirals and irregulars (Harris 1991). Of course, these
morphologically disparate galaxies exhibit very different clustering properties, so the extent to
which their GCSs have been influenced by environment is unclear (see West 1993). For instance,
Forte, Martinez & Muzzio (1982) suggested that the high specific frequency of NGC 4486, the
centrally dominant galaxy in the Virgo cluster, might be explained by the capture of GCs through
tidal-stripping of less massive galaxies (c.f. Muzzio 1987).
An additional constraint on galaxy formation models comes from the observed distribution of
GC metallicities. Following initial suggestions of non-Gaussian metallicity distributions based on
rather small samples of GCs (Ostrov, Geisler & Forte 1993; Lee & Geisler 1993), a flurry of activity
has now demonstrated beyond question that many, and perhaps most, luminous ellipticals show
distinctly bimodal GC metallicity distributions (e.g., Whitmore et al. 1995; Elson & Santiago
1996). The number of gEs having reliable GC metallicity distributions has now risen to roughly
a dozen (see the recent compilation of Forbes, Brodie & Grillmair 1997; hereafter FBG97). As
these authors point out, the mean metallicity of the metal-rich component increases with the
luminosity of the parent galaxy in a manner which is entirely consistent with that originally
proposed by van den Bergh (1975). However, the position of the metal-poor peak shows no strong
correlation with the properties of the host galaxy: it falls in the range −1.5 <∼ [Fe/H] <∼ −0.7 with
little or no dependence on parent galaxy luminosity. The challenge for models of gE formation is
therefore to explain not just the origin and size of these chemically-distinct GC populations, but
also to understand why the location of the metal-poor component peak depends so weakly on the
luminosity of the parent galaxy.
One possible explanation for the high specific frequencies and bimodal GC metallicity
distributions of gEs is that the same mergers which give rise to the galaxies themselves also serve
as catalysts for the formation of new GCs (Schweizer 1986; Ashman & Zepf 1992). In other words,
the populations of metal-rich GCs associated with galaxies such as NGC 4486 (Whitmore et al.
1995; Elson & Santiago 1996) and NGC 4472 (Geisler, Lee & Kim 1996) are interpreted as being
the relics of merger-induced GC formation, whereas the metal-poor components are assumed to
constitute the pre-existing GCSs. However, as Geisler, Lee & Kim (1996) point out, both of these
galaxies show bimodal GC metallicity distributions yet have specific frequencies which differ by
– 4 –
nearly a factor of three (Harris 1986), so it seems unlikely that any single mechanism, such as
merger-induced GC formation, can explain entirely the properties of their GCSs. In light of these
difficulties, FBG97 have argued that the chemically-distinct GC populations in gEs are indigenous
to their parent galaxies and are formed in “two distinct phases of star formation from gas of
differing metallicity”. Nevertheless, it is difficult to identify the mechanism responsible for the
separate GC-formation episodes and for delaying the onset of the second burst.
In this paper, we show that bimodal GC metallicity distributions in gEs are a natural
consequence of the capture of GCs through mergers and tidal-stripping of other galaxies. Our
model differs from that of Ashman & Zepf (1992) in that we identify the metal-rich component
of the GC metallicity distributions as the gE’s intrinsic GCS; mergers and tidal stripping will
lead almost inevitably to a second peak in the range −1.5 <∼ [Fe/H] <∼ −0.7, with the exact
position depending weakly on the shape of the luminosity function in the host cluster. We also
conclude that, contrary to some earlier claims, the capture of GCs through tidal-stripping of other
cluster galaxies does not necessarily conserve specific frequency, particularly if the bulk of the
tidally-stripped GCs originated in low- and intermediate-luminosity galaxies. Finally, we use this
model to explain the bimodal GC metallicity distributions and discordant specific frequencies of
NGC 4472 and NGC 4486 — the two brightest members of the Virgo cluster.
2. GC Metallicity Distributions in gE Galaxies: Evolution Due to Mergers and
Tidal Stripping
We seek to model the GC metallicity distributions of gE galaxies, particularly those located
in rich galaxy clusters. Simply stated, our goal is to predict the metallicity distribution of GCs
acquired through mergers or through tidal-stripping of other cluster galaxies. To do this we must
first consider three factors which together determine the total number of GCs of a given metallicity
that are present in any ensemble of galaxies: (1) the number of GCs as a function of parent galaxy
luminosity; (2) the relationship between GC metallicity and parent galaxy luminosity; and (3)
the distribution of galaxy luminosities. Combining these three relations allows us to predict the
metallicity distribution of GCs which may be captured by gEs from other galaxies.
2.1. The “Zero-Age” [Fe/H]-M iV Relation
There have been numerous compilations of mean GC metallicity, [Fe/H], and parent galaxy
absolute magnitude, MV , in the recent literature. Although it is now established that the two
parameters are related in a manner which is consistent with that originally proposed by van den
Bergh (1975), the exact form of the correlation remains an open question. Harris (1991) and
Durrell et al. (1997) have found a slope of d[Fe/H]/dMV = −0.17 ± 0.04, whereas Ashman &
Bird (1993) have argued that genuine halo GCs have similar [Fe/H], irrespective of parent galaxy

– 5 –
luminosity. Part of this discrepancy arises from the sample definition, as some investigators have
chosen to exclude the GCSs of massive galaxies such as gEs and luminous spirals from their
analyses since, at the high luminosities which are characteristic of these objects, the observed
[Fe/H]-MV relation shows large scatter.
Here, we attempt to go a step further and reconstruct the initial, ”zero-age” [Fe/H]-M iV
relation over the entire range of spheroidal galaxy luminosities. As a result of the detailed
observations of GC colors in gEs, we now know that the scatter at the bright end of the present-
day [Fe/H]-MV relation reflects the observed bimodality in the gE metallicity distributions. Using
these detailed color distributions, FBG97 showed that it is the position of the metal-rich peak
which correlates best with the gE luminosity. The existence of such a correlation suggests that the
metal-rich GCs in these galaxies formed via the same mechanism as the GCs in galaxies of low-
and intermediate-luminosity, and we are thus led to identify the metal-rich population as the gE’s
primordial GCS. Our identification of the metal-rich GCs as the intrinsic component of the GCSs
in these galaxies may seem odd at first glance, particularly since GCs are believed to be among
the first objects to have formed in the early universe. However, analyses of absorption line indices
in gE galaxies using stellar population models suggest that the gas from which these systems
formed was likely to be pre-enriched, and that the galaxies themselves underwent rapid chemical
enrichment by massive stars (e.g., de Freitas Pacheco 1996; Greggio 1997). Likewise, the extremely
high star formation rates found by Pettini et al. (1997) for primeval galaxies at redshifts of z ∼ 3
provide additional evidence for rapid chemical enrichment in such massive galaxies. Regardless of
the exact mechanism responsible for the early chemical enrichment, Cohen, Blakeslee & Ryzhov
(1998) have recently provided compelling evidence that it must have proceeded on a very short
time-scale: Balmer-line indices for 150 GCs surrounding NGC 4486 indicate that the metal-rich
GCs have ages of ∼ 13 Gyr, indistinguishable from those of their metal-poor counterparts.
If the metal-rich GCs are the intrinsic population (i.e., those originally associated with the
seed galaxy which we now observe as a gE), then the zero-age [Fe/H]-M iV relation must be defined
by the correlation between the seed galaxy luminosity and the position of the metal-rich peak of
the GC metallicity distribution. The latter is an observed quantity; unfortunately, the seed galaxy
luminosity is not. However, under the assumption that the total number of GCs in the galaxy
population is conserved during the merger process, we can establish the range of possible seed
galaxy luminosities from the observed distribution of GC metallicities. We explore two limiting
cases: first, we posit that all of the metal-poor GCs were acquired through mergers. In this case,
the observed fraction of GCs in the metal-rich peak is a direct measure of the luminosity of the
initial seed (provided that the captured galaxies have roughly the same GC specific frequency; see
§2.3):Linit = Lfinal
Nmr
Nmr + Nmp, (1)
or equivalently,
M iV = Mf
V − 2.5 log( Nmr
Nmr + Nmp
)
, (2)

– 6 –
where MfV is the final absolute magnitude of the gE galaxy, and Nmr and Nmp refer to the number
of metal-rich and metal-poor GCs, respectively. Since all three of these present-day quantities are
available from FBG97, we can compute an initial, pre-merger [Fe/H]-M iV relation directly from
these observations (assuming that the dynamical friction time-scale in the merged system is long,
and that the metal-rich and metal-poor GCs are equally susceptible to destruction; see §4.3).Strictly speaking, our “zero-age” relation is more accurately described as the initial [Fe/H]-M i
V
relation as it would appear today provided the subsequent evolution has been totally passive (i.e.,
we apply no magnitude correction to account for the fading stellar populations in the original
galaxies, since the same correction would then need to be subtracted when comparing to nearby
gEs).
In the opposite limit, we make the extreme assumption that the initial luminosity is the same
as the final luminosity: i.e., that the metal-poor GCs are stripped from neighboring galaxies
without any accompanying field stars. This is obviously a firm upper limit to the seed luminosity
and a conservative bound at that; stripping will inevitably transfer at least some field stars to the
seed galaxy.4
The resulting range of possible [Fe/H]-M iV relations is shown in Figure 1. For the gEs, we plot
the eleven gEs listed in FBG97. For each galaxy, we adopt the mean metallicity for the metal-rich
GC population reported in FBG97 and assume an uncertainty in [Fe/H] of ±0.2 dex. The modest
corrections derived from Equation 2 (e.g., M iV −Mf
V ≃ 1 mag) are shown as the horizontal arrows
in Figure 1, where we have assumed an uncertainty of ±0.3 mag in M iV for each galaxy.
Because dwarf galaxies are less likely to have merged with smaller systems, they provide
a more direct view of the original [Fe/H]-M iV relation. A search of the literature revealed nine
dwarf elliptical galaxies for which there exist data on the chemical abundance of their GCSs. For
these galaxies, we have plotted the raw values of [Fe/H] and MV in Figure 1. For each galaxy,
we have taken the best available estimate for the metallicity of each individual GC. For a few of
the galaxies, there exist multiple determinations of the metallicities of some GCs; in such cases,
we give preference to spectroscopic measurements. We then calculate the mean GC metallicity
[Fe/H], the intrinsic metallicity dispersion σi, and their respective uncertainties for each galaxy.
We also include in our sample NGC 1380: the only lenticular (S0) galaxy in which accurate
metallicities have been measured for a large number of GCs (Kissler-Patig et al. 1997). Like most
gE galaxies, NGC 1380 shows a bimodal GC metallicity distribution. Following Kissler-Patig et
al. (1997), we adopt [Fe/H] = 0.15 ± 0.5, Nmr = 382 ± 20 and Nmp = 182 ± 20.
Our sample of 21 galaxies is listed in Table 1, whose columns record the name, morphological
type and absolute visual magnitude for the parent galaxy of each GCS, the total number of
4One might also consider a third case: that field stars are actually accreted more efficiently than GCs. However,
the fact that no GCSs are observed to be less extended that the underlying stellar halo makes this possibility seem
very remote.

– 7 –
GCs having measured metallicities, and the corresponding mean GC metallicity and intrinsic
dispersion; references are given in the final two columns. Since it is clear that the relationship
between [Fe/H] and M iV is non-linear, we parameterize the [Fe/H]-M i
V relation in the form
[Fe/H] = a0 + a1MiV + a2M
iV
2. (3)
We then find the constants a0, a1 and a2 which minimize the goodness-of-fit statistic
χ2(a0, a1, a2) =N
∑
j=1
( [Fe/H]j − a0 − a1MiV,j − a2M
i 2V,j)
2
ǫ2[Fe/H]
+ (a1 + 2a2M iV,j)ǫ
2[Fe/H]
(4)
where ǫ[Fe/H]
is the uncertainty in the mean GC metallicity, and we have made use of the fact that
d[Fe/H]
dM iV
= a1 + 2a2MiV . (5)
Minimizing Equation 4 yields a0 = 2.31, a1 = 0.638 and a2 = 0.0247. The resulting [Fe/H]-M iV
is shown as the dotted line in Figure 1; the dashed line indicates the relation found without the
correction given by Equation 2. The difference between the two fits is never large; we show in §3that our conclusions depend very little on these small variations in the [Fe/H]-M i
V relation.
Finally, we investigate the possibility that the intrinsic dispersion in GC metallicity also
depends on the luminosity of the parent galaxy. Based on the nine galaxies in Table 1 which
have reliable estimates for σi, we find a weighted mean dispersion of σi = 0.28 ± 0.05 dex with
no significant evidence for a correlation between σi and MV . The increased metallicity dispersion
among luminous galaxies noted by previous investigators (e.g., Harris 1991) is likely to be a
consequence of their bimodal GC metallicity distributions which went unnoticed for many years
due to the small sample sizes and the limited metallicity sensitivity of the color indices used in
early photometric surveys (see the discussion in Geisler, Lee & Kim 1996).
2.2. The Initial Luminosity Function of Cluster Galaxies
Galaxies in clusters span an enormous range in luminosity and mass. The present-day
galaxy luminosity function (LF) is determined both by the cosmological conditions when galaxies
began to form and by subsequent evolution of the galaxy population. In the case of an Ω = 1,
cold-dark-matter universe, the predicted mass spectrum is steep at all redshifts; at z = 0,
dN/dM ∝ M−2 at the low-mass end. The corresponding LF follows from the cycle of gas cooling,
star formation, and supernova feedback, none of which (with the possible exception of the first)
are well understood. Nevertheless, solutions derived using quite disparate physical assumptions
yield a remarkably consistent picture. Depending mostly on the strength of the feedback, the
derived LFs are always steep at the faint end: −1.4 ≤ d log N/d log L ≤ −2.0 (e.g., Kauffmann,
Guiderdoni & White 1994, Cole et al. 1994, Baugh et al. 1996).

– 8 –
Unfortunately, our theoretical understanding of galaxy formation remains incomplete, and
direct extrapolation of the redshift-dependent LFs is still our best hope for reconstructing the
initial LF. Of the many analytic expressions proposed to describe the observed galaxy LF, φ(LV ),
the Schechter (1976) function is the most widely used:
φ(LV )dLV = φ∗(
LV /L∗V
)αexp
(
− LV /L∗V
)
d(LV /L∗V ) (6)
where φ∗ a parameter related to the number of galaxies per unit volume, L∗V is a characteristic
luminosity (measured for our purposes in the V band) and α is a parameter which determines the
relative number of faint and bright galaxies.
Enormous effort has gone into measuring the galaxy LF both in the field and in clusters
(e.g., see the reviews by Binggeli, Sandage & Tammann 1988 and Ellis 1997). Virtually all
studies agree that at low redshift, the LF turns over sharply near L∗V and is essentially flat (in
log φ − log LV ) down to approximately three magnitudes below L∗V . Fainter than this, however,
there is considerable disagreement over the LF slope. For instance, Marzke et al. (1994) find
evidence for a steep upturn of α ≃ −1.9 at the faint end of the field LF, while Ellis et al.
(1996) claim that the LF remains flat to at least four and a half magnitudes fainter than L∗.
Recently, Loveday (1997) has suggested that a better parameterization of the field LF is a double
Schechter-function with a very steep faint-end slope of ≃ −2.8.
Several recent studies of the cluster LF have produced generally similar results. For example,
in their study of the Coma cluster, Biviano et al. (1996) have shown that a two-component LF,
consisting of a Gaussian at the bright end and a steep Schechter function at the faint end, closely
resembles the observed LF. Smith, Driver & Phillips (1997), Wilson et al. (1997), Lopez-Cruz et
al. (1997) and Trentham (1997) find similar behaviour in several rich clusters over the redshift
range 0 <∼ z <∼ 0.2. However, these authors disagree on the question of how cluster LFs have
evolved with time; for instance, Smith, Driver & Phillips (1997) find little difference between
clusters at z = 0 and z = 0.2, while Wilson et al. (1997) claim that the galaxy colors suggest the
presence of a fading population of dwarf irregulars whose star formation was truncated soon after
z ≃ 0.2.
Given the uncertainty in both field and cluster LFs at early epochs, we choose to explore a
range of possibilities for the initial LF. We are particularly interested in the initial LF in clusters,
since it is bright cluster ellipticals that we trying to understand. Given the observations, it seems
likely that the present-day LF in, for example, the Virgo cluster represents a lower bound on
the initial faint-end slope: α = −1.2. As an upper bound, we choose a single Schechter function
with the slope of the steep component observed in many low-redshift clusters: α = −1.8. Such a
steep LF might represent a brighter analog of the steep (perhaps faded) dwarf LF observed at low
redshift. Because we find that single Schechter functions covering this range in α yield a range of
metallicity distributions which encompasses those produced by two-component LFs, we restrict
our analysis to the single Schechter function with −1.8 ≤ α ≤ −1.2.
– 9 –
2.3. Choice of GC Specific Frequency
During interactions with other galaxies, the number of GCs available for capture by a gE
galaxy depends on the luminosity of each passing galaxy. To first order, the number of GCs, Ngc,
scales directly with absolute magnitude of the parent galaxy. A convenient means of expressing the
number of GCs per unit galaxy luminosity is the specific frequency, Sn, which was first proposed
by Harris & van den Bergh (1981),
Sn = Ngc100.4(MV +15). (7)
For dwarf ellipticals and gEs in rich clusters, Sn ≃ 5 with a dispersion of σ(Sn) ≃ 1 (e.g., Harris
1991). In what follows, we assume specific frequency to be independent of MV (see Harris 1991
and references therein) and adopt a specific frequency of Sn = 5 ± 1 for the interacting galaxies.
In §3.1, we discuss the implications of this choice of Sn.
3. Monte Carlo Simulations of GC Metallicity Distributions
Having specified the [Fe/H]-M iV relation, the specific frequency Sn, and the initial galaxy LF,
it is possible to simulate the metallicity distribution of GCs captured by a gE galaxy. As discussed
in §2.1, we assume that the luminosity of the initial seed galaxy, Linit, has grown by the amount
Lcap as a result of the capture of smaller galaxies. Therefore, we calculate Lcap for each gE as
follows,
Lcap = LfinalNmp
Nmr + Nmp, (8)
and select at random a galaxy which, based on the probability distribution given by Equation 6,
may have merged with the initial gE galaxy. Since, by definition, the gE galaxy cannot consume
an object larger than itself, we adopt a maximum luminosity of Linit for Equation 6. Likewise, we
assume that the faint-end of the LF is truncated at LV = 107LV,⊙. This is the luminosity of the
Fornax dwarf galaxy, the faintest galaxy known to harbor its own GCS (Mateo et al. 1991; Harris
1991). We repeat this process, recording the combined luminosity of the captured galaxies,
Lcap =
Ncap∑
k=1
Lk, (9)
until the condition
Lcap ≥ Lfinal − Linit (10)
is satisfied. At this point, the simulations are terminated and the total number of captured
galaxies, Ncap, is recorded.
For each captured galaxy we calculate the total number of associated GCs using Equation
7, including a random dispersion of σ(Sn) = 1 for both the captured and seed galaxies. A

– 10 –
metallicity is assigned randomly to each captured GC from an assumed Gaussian distribution with
mean metallicity, [Fe/H], determined from Equation 3, and an intrinsic spread of σi = 0.28 dex,
irrespective of the host galaxy luminosity. We account for the scatter in the [Fe/H]-M iV relation
by including a random dispersion of 0.2 dex when assigning a mean GC metallicity to each galaxy
(as discussed in §2.1). We repeat this process one last time for the initial gE galaxy and combine
the intrinsic and captured GCs to create a final simulated GC metallicity distribution.
For simplicity, we assume that all galaxies have equal merger probabilities; in reality, the
likelihood of capture may be a function of galaxy mass. For instance, circular orbits through an
isothermal dark halo decay on a time-scale inversely proportional to the mass, M (Ostriker &
Tremaine 1975; Tremaine 1976). For a more general distribution of orbits, however, the situation
is more complicated. Cole et al. (1994) have argued on the basis of the N-body/hydrodynamical
simulations of Navarro, Frenk & White (1995) that the merger time-scale, τ , shows a relatively
weak mass dependence: τ ∝ M−0.25. Since the exact form of the dependence is still under debate,
we have chosen not to include an explicit mass dependence in our models. We simply note that for
a constant mass-to-light ratio, the merger probability derived by Cole et al. (1994) is proportional
to L0.25. If this is indeed the correct dependence, then each of the LFs considered in the following
analysis would need to be corrected by an amount ∆α = −0.25 (i.e., an assumed LF slope of
α = −1.5 would correspond to an actual slope of α = −1.75).
As an illustration of this method, we now compare the simulated GC metallicity distributions
to those observed for a well-studied gE galaxy: NGC 4472, the brightest member of the Virgo
cluster.
3.1. The GC Metallicity Distribution of NGC 4472
The GC metallicity distribution of NGC 4472 represents the best existing dataset for any gE
galaxy in terms of calibration, metallicity sensitivity and large sample size (Geisler, Lee & Kim
1996). This last factor is usually the most severe limitation on other datasets, which typically
consist of relatively small numbers of GCs. In such cases, the low-order moments of the GC
metallicity distributions (such as the the mean metallicities of the metal-rich and metal-poor
peaks) are reasonably well constrained, but it is impossible to model the detailed shape of the
distribution function. Recent summaries of bimodal GC metallicity distributions in gE galaxies
can be found in Geisler, Lee & Kim (1996) and FBG97.
As mentioned in §2.2, choosing the values of α and L∗V (or, alternatively, M∗
V ) to be used in the
simulations is complicated by the possibility that the original Virgo LF differs significantly from
the present-day LF. Sandage, Binggeli & Tammann (1985) measure α = −1.25 and m∗B = 10.6 for
the present-day, composite LF in Virgo, although the slope of the LF at the faint end depends
rather strongly on the sample definition. For instance, the best-fit LF for dEs and gEs alone has
α = −1.45. We have therefore carried out simulations for a range of assumed LF slopes, bearing

– 11 –
in mind that α = −1.25 is likely to represent a lower limit on the initial LF slope. The evolution
of M∗V is expected to proceed more slowly, so we have combined the present-day estimate of
m∗B = 10.6 with the Virgo distance modulus of (m − M)0 = 31.04 mag (Ferrarese et al. 1996), a
Galactic reddening of E(B − V ) = 0.10 and a mean galaxy color of (B − V ) = 0.9 at m∗B (e.g.,
Roberts & Haynes 1994) to find M∗V = −21.7.
Figures 2 – 4 compare the results of our simulations with the observed GC metallicity
distribution for NGC 4472 (Geisler, Lee & Kim 1996). As initial conditions for the simulations,
we assume M iV = −21.6 and Mf
V = −22.7 for NGC 4472 (see below). We show four different
simulations for each assumed LF slope, chosen to constitute a representative sample of simulated
GC metallicity distributions. As a measure of the similarity between the observed and simulated
distributions, we calculate the goodness-of-fit statistic
χ2sim =
1
Nbin − 1
Nbin∑
i=1
(Nobs,i − Nsim,i)2
(Nobs,i + Nsim,i)(11)
for each simulation. The corresponding values of χ2sim are recorded in Figure 2 – 4.
If we assume that all of the metal-poor GCs in NGC 4472 were captured in mergers, then it
is possible to calculate the total number of galaxies consumed by NGC 4472.5 Of course, this is
possible simply because the capture of even a single GC in a merger naturally entails the capture
of the entire host galaxy, something which is not true of tidal stripping. The total number of
captured galaxies is recorded in each panel of Figures 2 – 4. Clearly, the stochastic nature of
the merger process strongly influences the final GC metallicity distribution, as a galaxy may
increase its luminosity in any number of ways: by swallowing many small dwarfs or just a few
large galaxies. The effect is, however, less pronounced for steep LFs since there are relatively fewer
luminous galaxies, and hence the initial gE is unlikely to capture a comparably-bright galaxy. In
such cases, the final simulated GC metallicity distribution is almost always bimodal.
According to FBG97, the absolute visual magnitude of NGC 4472 is MfV = −22.7. Since the
the observations of Geisler, Lee & Kim (1996) indicate that 35% of the GCs in NGC 4472 are
metal-rich, our estimate for the absolute magnitude of the captured component in NGC 4472 is
MV = −21.6, which corresponds to ∼ 65% of its present-day luminosity. The number of captured
galaxies depends on both Sn and the assumed LF: for LF slopes of α = −1.2,−1.5 and −1.8,
the median number of captured galaxies found in 1000 Monte Carlo simulations (see below)
are 44+19−16(5/Sn), 148+50
−48(5/Sn) and 508+109−107(5/Sn), respectively. Although the total number of
captures depends very strongly on the assumed LF, the majority of the captured galaxies are
in most cases low-luminosity systems, each of which contributes relatively few GCs. For our
5In §4.2 we argue that the capture of GCs through tidal stripping has been more important in NGC 4486 than in
NGC 4472 since the former is located at the bottom of the potential well of the main Virgo cluster, close to where
the cluster tidal forces reach their maximum.

– 12 –
best-fit slopes of α ∼ −1.8, the bulk of the metal-poor GCs originate in galaxies having absolute
magnitudes in the range −15 <∼ M iV <∼ −19.
It is worth bearing in mind that such estimates for the number of captured galaxies are
best interpreted as upper limits since tidal-stripping may have produced some of the observed
metal-poor GCs. However, in the absence of large variations in Sn within a single galaxy cluster
— or between clusters which are morphologically and dynamically similar — this technique may
provide a useful method of comparing gE merger histories.
3.1.1. Frequency of Bimodality
It is a remarkable fact that the GC metallicity distributions of virtually all well-studied gEs
to date show some evidence for bimodality. How frequently do our simulated GC metallicity
distributions exhibit such bimodality? To answer this question, we have generated 1000 simulated
GC metallicity distributions for NGC 4472, assuming LF slopes of α = −1.2,−1.5 and −1.8. As
before, the simulations have been binned in exactly the same fashion as the observations of Geisler,
Lee & Kim (1996). For each simulation, we fit single- and double-Gaussian distributions to the
resulting GC metallicity distribution, and determine the reduced χ2ν for both parameterizations.6
An F -ratio test is then used to determine if the improvement obtained by including a second
component is warranted (Bevington 1969). In the three left panels of Figure 5, we show histograms
of the F -ratio statistic for 1000 simulated distributions having LF slopes of α = −1.2,−1.5
and −1.8. As expected, bimodality becomes increasingly obvious as LF slope is increased; for
α = −1.8, 94% of the simulated distributions show bimodality. However, even for rather flat LFs,
the majority of the simulations are bimodal. For instance, for an LF slope of α = −1.2, 80% of
the simulated distributions show statistically significant evidence for bimodality. It is also worth
pointing out that although the simulated GC metallicity distributions are, in the vast majority of
cases, well described by double Gaussians, for rather steep LFs there are occasions when more
than two peaks are evident in the simulations.7
Histograms for the goodness-of-fit statistic, χ2sim, are given in the right-hand panels of Figure
5. Since the absolute calibration of this statistic depends on the the appropriateness of our
assumption of Poisson uncertainties in the observed and simulated distributions, it is probably
best to interpret the χ2sim values in a relative sense.
6The number of degrees of freedom, ν, is ten for the single Gaussian and seven for the double Gaussian.
7Note that Lee & Geisler (1993) have suggested that the GC metallicity distribution in M87 shows evidence for
three peaks based on ground-based photometry for ≃ 400 GC candidates, although Whitmore et al. (1995) have
concluded from HST photometry for more than 1000 GC candidates that the GC metallicity distribution is more
likely bimodal in nature.

– 13 –
3.1.2. Dependence on LF Slope
FBG97 have shown that, for the dozen or so gEs which are known to have bimodal GC
metallicity distributions, the location of the metal-poor peak does not appear to obey the relation
between GC metallicity and host galaxy absolute magnitude defined by the GCSs of fainter galaxies
and the metal-rich GCSs of gE galaxies. Instead, the metal-poor peaks for these galaxies fall in
the range −1.5 <∼ [Fe/H] <∼ −0.5, with little or no correlation with MV . A possible explanation
for this curious result is given in Figure 6 which shows the mean location of the metal-poor peak
as a function of LF slope. (The dependence on M∗V is much weaker.) The metallicity distribution
of the captured GCs shows a maximum in the range −1.5 <∼ [Fe/H] <∼ −0.7, though at fixed slope
there is a scatter of ≃ 0.15 dex in the peak location, a consequence of the stochastic nature of
galaxy mergers. Thus, the weak correlation between the location of this peak and the luminosity
of the gE is a result of the fact that the mean metallicity of the metal-poor GCs is determined
primarily by: (1) the detailed merger histories of the individual gEs and; (2) the initial LF of the
host cluster (see §6).
To explore this issue more closely, we have measured the location of the metal-poor GC peak
as a function of both α and final gE magnitude, MfV . Figure 7 shows the data of FBG97 (open
squares) along with the results of our Monte-Carlo experiments. Although the shift in the peak
metallicity with MfV at fixed α is modest (particularly for steep LFs) and the intrinsic scatter in
[Fe/H] is ≃ 0.15 dex, there is a slight tendency for the brighter gEs to capture GC populations
which are more metal-rich than those accreted by their fainter counterparts (since the brighter
gEs are able to accommodate the capture of more luminous intruder galaxies). For simplicity, we
have assumed equal numbers of metal-rich and metal-poor GCs in the simulations; the observed
galaxy-to-galaxy scatter in this ratio (see Table 1 of FBG97) is expected to weaken further the
correlations shown in Figure 7, as are differences in the initial LFs.
4. A Possible Origin for High-Sn Galaxies: The Case of NGC 4486
Up to now, we have made no distinction between GCs acquired through mergers or through
tidal-stripping since the exact mechanism by which they are captured will have little effect on the
shape of the GC metallicity distribution (see §2.1). However, since tidal stripping will remove only
a fraction of the GCS of an individual galaxy, the number of galaxies which must be stripped in
order to explain the observed number of metal-poor GCs will always exceed the number of galaxies
which must be captured. Moreover, the GCSs of many galaxies are known to be more spatially
extended than the underlying halo light (e.g., Harris 1991) so it is possible that the capture of
GCs by tidal stripping will affect the specific frequency of the gE differently than will capture
by mergers (i.e, by preferentially stripping high-Sn material from the outer regions of passing
galaxies). We now explore the consequences of tidal stripping on specific frequency.

– 14 –
4.1. The Initial GCSs of Low- and Intermediate-Luminosity Galaxies
The possibility that the high specific frequencies of some centrally dominant galaxies can be
explained through tidal-stripping of GCs from other cluster members was first suggested by Forte,
Martinez & Muzzio (1982). Several potential problems with this scenario were pointed out by van
den Bergh (1984) and McLaughlin, Harris & Hanes (1994), the most serious being the objections
that: (1) since tidal stripping will remove halo stars and GCs in equal proportion, such a process
cannot explain why the specific frequency of NGC 4486 is roughly three times greater than that
of other Virgo gEs; and (2) the high specific frequency problem in NGC 4486 is not just confined
to the galaxy’s envelope, since even at a galactocentric distance of 1 − 2′, the specific frequency
is Sn ≃ 10. Given that tidal stripping has long been recognized as providing a natural means of
producing the extended envelopes of cD galaxies (e.g., Richstone 1976), it is worth investigating
this issue more closely, particularly in light of several recent detections of probable tidally-stripped
debris in galaxy clusters, including intergalactic stars (Ferguson, Tanvir & von Hippel 1998)
and intergalactic planetary nebulae (Theuns & Warren 1997; Mendez et al. 1997; Ciardullo et
al. 1998 and references therein). The results of the planetary nebulae surveys are particularly
interesting since these studies suggest that ∼ 26 – 50 % of the total Virgo luminosity may reside
in intergalactic stars; if so, and if this diffuse component has a “normal” GC specific frequency of
Sn = 5, then it should be accompanied by a population of 35000 – 75000 tidally-stripped GCs.
For higher specific frequencies (see below), the total number of GCs will of course be larger still.
Apart from this observational evidence, there are theoretical reasons to believe that the
tidal field of the cluster potential well acts to remove matter from galaxy halos on time-scales
comparable to the crossing time (Peebles 1970; Gunn 1977; Merritt 1985). Consequently, this
process, along with collisional stripping produced during galaxy-galaxy encounters (which usually
operates on much longer time-scales; Merritt 1984), may be responsible for the different kinds of
tidal debris mentioned above, particularly since low- and intermediate-luminosity galaxies may be
strongly stripped by the mean cluster tidal field.
It is recognized that the GCSs of many galaxies are more extended than the underlying halo
distributions (e.g., Harris 1991). However, many of the galaxies upon which this conclusion is based
are located in rich clusters, so it is unclear how environment has influenced the presently-observed
distribution of GCs. In other words, are the GCSs more extended as a result of tidal stripping, or
did they form that way? Since tidal limitation by the mean cluster field is likely to occur early on
in the evolution of the cluster (Merritt 1984; 1985) we need to consider the relative spatial extents
of the halo and GC populations of galaxies at the time of galaxy/cluster formation.
To do so, we must identify a sample of isolated galaxies having well-studied GCSs and
accurate surface brightness profiles. We therefore follow Minniti, Meylan & Kissler-Patig (1996) in
defining a “master dE” galaxy using the Local Group dwarf galaxies Fornax, NGC 147, NGC 185
and NGC 205. To characterize the halo light in each galaxy, we adopt the exponential scale-lengths
and central surface brightnesses given by Caldwell et al. (1992). We then correct each galaxy to a

– 15 –
luminosity-weighted mean scale-length of αs = 375 pc, and add the individual surface brightness
profiles to create a composite profile. In converting from angular to linear scales, we adopt the
same values for the distance and reddening of each galaxy which were used to derive the absolute
magnitudes in §2.1. Similarly, we scale the radial positions of the GCs in each galaxy in order to
bring them onto a uniform scale. The composite surface brightness profile is shown in Figure 8,
along with the corrected profiles for each galaxy and for the entire ensemble of 24 GCs.
By considering only isolated dE galaxies (i.e., systems which have probably not interacted
strongly with nearby galaxies), we minimize concerns that their GCSs have been modified by
dynamical effects which are external to the parent galaxies.8 However, internal processes, of which
orbital decay through dynamical friction is most important, will also affect the spatial distribution
of GCSs. To estimate the importance of this effect, we use Equation 7-25 of Binney & Tremaine
(1987),
rdr
dt= −0.428
GM
vtypln Λ, (12)
which gives the orbital decay time for an object moving in a circular orbit around a galaxy with an
isothermal potential. Here M is the mass of the GC in question, vtyp is the typical stellar velocity
in the galaxy, and the Coulomb logarithm ln Λ, is given by
Λ =bmaxv
2typ
GM. (13)
For bmax, which denotes the distance at which the stellar density becomes much smaller than it
is in the neighborhood of the orbiting GC, we adopt the effective radius of each galaxy, given by
reff = 1.678αs (Impey, Bothun & Malin 1988). We take vtyp to be the mean circular velocity,
calculated as√
2σg, where σg is the one-dimensional stellar velocity dispersion in each galaxy
(Mateo 1994).9 Integration of the above equation gives the initial galactocentric distance, Ri, of
each GC in terms of its current galactocentric distance, Rf ,
R2i = 0.856
GM
vtyplnΛ tH + R2
f , (14)
where tH is the time since formation. In practice, we calculate Ri for each of the 24 GCs in
the master dE using the values of vtyp and bmax appropriate for each dwarf, and combine the V
magnitude of each GC (see Da Costa & Mould 1988 and references therein)10 with our adopted
8The proximity of NGC 205 to M31 suggests it may be tidally interacting with its parent galaxy. It is included
in the definition of the master dE since in §4.2 and 4.3 we show that past interactions of this sort are likely to have
preferentially removed GCs rather than field stars. Including NGC 205 in the sample therefore leads to a conservative
estimate of the initial specific frequency profile of the master dE galaxy.
9Our adopted value of σg = 38.5 km s−1 for NGC 205 represents the average of the mean “core” and “halo”
dispersions quoted by Mateo (1994).
10For GCs IV, VI, VII and VIII in NGC 185 (Ford, Jacoby & Jenner 1978), there are no published magnitudes
or colors. We have estimated approximate magnitudes for these objects by performing aperture photometry on a
V -band image taken with the KPNO 4m telescope which was kindly provided by Peter Stetson.

– 16 –
distance estimates to derive individual masses. In doing so, we assume a constant GC mass-to-light
ratio of M/LV = 2M⊙/LV ⊙.
Figure 9 shows the radial dependence of specific frequency in the master dE. Triangles
indicate the net specific frequency, Sfn (> R), outside of the marked positions, obtained from the
presently-observed galactocentric distances of the GCs. Squares show the net specific frequency,
Sin (> R), after correcting the position of each GC for the effects of dynamical friction. Clearly,
the outer regions of such intermediate-luminosity galaxies are likely to have consisted of “high-Sn”
material at the epoch of galaxy/cluster formation. Unfortunately, the short dynamical friction
time-scale for GCs originally confined to the inner regions of their parent galaxies means that
Sin (> R) is essentially unconstrained interior to ∼ 1 kpc. Thus, we cannot determine if this region
also exhibited high initial specific frequencies due to the presence of GCs which have subsequently
been destroyed.
4.2. The Effect of Tidal-Stripping on Specific Frequency
Merritt (1984) has considered the case of a test galaxy moving through a cluster having a
King model density profile. In this case, tidal stripping by the mean field of the cluster will lead
to tidal radii, rt, of the order
rt ≈Rcσg
2σc(15)
where Rc is the “core” radius of the cluster, σc is its velocity dispersion and σg is the velocity
dispersion of the test galaxy. For galaxies similar to our master dE, we expect σg ∼ 30 km s−1,
and the ROSAT observations of Nulsen & Bohringer (1995) imply a Virgo core radius of Rc = 45
kpc for our adopted Virgo distance of 16 Mpc. Since the velocity dispersion of early-type, and
presumably virialized, galaxies in the vicinity of NGC 4486 is known to be σc ≃ 600 km s−1
(Binggeli, Tammann & Sandage 1987), Equation 15 predicts rt ∼ 1 kpc.
It is important to investigate the sensitivity of rt to the assumed density profile, since recent
investigations into the structure of dark halos using high-resolution, N-body simulations have
cast doubt on the very existence of constant-density “cores” in galaxy clusters (Navarro, Frenk &
White 1996; hereafter NFW). These authors suggest that a model of the form
ρ(r) ∝ 1
(r/rs)(1 + r/rs)2, (16)
where rs is a scale radius, is a better representation of the true dark matter distribution. In
Appendix A we show that the above estimate of rt ∼ 1 kpc is unchanged if we adopt a Virgo
density profile of the form of Equation 16.
From Figure 9, we see that the tidally-stripped, outer regions of the master dE galaxy would
have a net specific frequency of Sn >∼ 10, similar to that observed for NGC 4486 (McLaughlin,
Harris & Hanes 1994). Since stripping by the overall cluster potential will be most important near

– 17 –
the dynamical center of the host cluster, it offers a natural explanation for fact that “high-Sn”
galaxies are located, without exception, near the dynamical centers of massive clusters (i.e., where
the tidal forces are greatest and where the tidal debris accumulates). Thus, it may explain the
correlations between the number of “excess” GCs and: (1) cluster mass; and (2) ambient mass
density found by West et al. (1995) and by Blakeslee, Tonry & Metzger (1997). It is worth
bearing in mind, however, that the galaxies which define the specific frequency profile shown in
Figure 9 have a median absolute magnitude of MV = −15.5, whereas the bulk of the captured
GCs associated with M87 probably originated in slightly more luminous galaxies (i.e., MV ∼ −17,
based on Equation 3 and on the observed location of the metal-poor GC peak in M87). Additional
observations of the GCSs of intermediate-luminosity galaxies are clearly warranted.
4.3. The Radial Profile of Tidally-Stripped GCs
Is the spatial distribution of GCs surrounding NGC 4486 consistent with the existence of
two chemically-distinct GC populations, one which formed along with the body of the galaxy
itself, and a second which was tidally stripped from other cluster galaxies? In Figure 10 we show
the surface density profile of NGC 4486 GCs taken from Harris (1986). Though not as deep as
recent CCD surveys of the NGC 4486 GCS (e.g., McLaughlin, Harris & Hanes 1994; Whitmore et
al. 1995; Elson & Santiago 1996), this study offers much greater areal coverage and represents
the best existing survey of the spatial structure of the GCS at large distances from the galaxy’s
center. Note that we have plotted the total counts of unresolved sources in order to investigate the
possibility that the GCS surrounding NGC 4486 has a spatial extent which exceeds that of existing
wide-field surveys. GC candidates are indicated by the open circles. The filled squares show the
arbitrarily shifted surface brightness profile for the galaxy itself. The dashed line represents the
R1/4 law which best fits the halo light interior to 4.′5, the radius which marks the onset of NGC
4486’s cD envelope. If we assume that the population of metal-rich GCs originally followed the
same R1/4 profile as the underlying halo light, we can then use the de Vaucouleurs & Nieto (1978)
relation to define the radial profiles of both intrinsic and captured GCs, provided we know their
relative surface densities at a single position.11 Such an estimate is possible using the deep HST
survey of Elson & Santiago (1996) who obtained V I photometry of 220 GCs in a field located
≃ 2.′5 from the center of NGC 4486.12 According to Elson & Santiago (1996), roughly 44% of
11Unless the metal-rich GCs in NGC 4486 are much more spatially extended than the underlying halo light, this
assumption will have a negligible effect on the derived radial profile of metal-poor GCs in the outermost regions of
the galaxy. For instance, if we assume that the metal-rich GCs are twice as extended as the halo stars, the residual
GC surface densities are reduced by <∼ 6% beyond 1.′5.
12We use the Elson & Santiago (1996) GC photometry instead of that of Whitmore et al. (1995) in order to
minimize concerns that the metal-rich and metal-poor GC populations have suffered different amounts of dynamical
erosion in the innermost regions of the galaxy (i.e., the Elson & Santiago field is located ≃ 2.′5 from the center of
NGC 4486, whereas the field of Whitmore et al. extends to within 14′′ of the galaxy’s center).

– 18 –
the GCs in this field belong to the metal-rich component. Since the Harris (1986) star counts
imply a total GC surface density of 26 arcmin−2 at R = 2.′5, we take the surface density profile
of metal-rich GCs in NGC 4486 to be log Σ = 1.452 − 3.33[(R/1.′6)1/4 − 1]. This profile is shown
by the dotted line in Figure 10. The residuals between the measured GC profile of Harris (1986)
— which is composed of both metal-poor and metal-rich clusters — and that expected for the
metal-rich GCs are plotted as filled triangles.
How does the radial profile of these “residual” GCs compare to that of the dark matter in
the Virgo cluster core? To answer this question, we make use of the dynamical study of Cohen &
Ryzhov (1997) who used radial velocities for more than 200 GCs to measure the cumulative mass
distribution within ∼ 40 kpc of NGC 4486. A least-squares fit to the data in their Table 8 yields
a relation of the form
log M(r) = a + b log r (17)
for the total mass, M(r), within a de-projected radius r. Assuming a spherically symmetric mass
distribution, this implies a density profile, ρ(r), of the form (cf. Equation 16)
ρ(r) =ab
4πrb−3 (18)
where a = 11.08 ± 0.08 and b = 1.70 ± 0.15 (1σ uncertainties). The surface density, Σ(R), of a
population of objects which follows the above mass distribution is therefore
Σ(R) ∝ R−0.30±0.15. (19)
In Figure 10 we plot this radial profile as the solid curve. The associated 1σ confidence limits are
indicated by the upper and lower dotted curves.
Despite the fact that the uncertainties in the derived mass distribution are rather large, and
that the radial profile of the “residual” GCs was calculated under the assumption of negligible
backround contamination, the agreement beween the two profiles is striking. Unfortunately, the
photographic survey of Harris (1986) was carried out in a single bandpass, so no information
is available on the colors of the GCs at large radii. Clearly, it is important to obtain deeper,
multi-color CCD images of the Virgo cluster core having a comparable, or greater, field size. Such
observations are now feasible using wide-field mosaic CCD cameras which are available on many
4m-class telescopes, and would provide a straightforward test of the prediction that appreciable
numbers of metal-poor, tidally-stripped GCs reside at large distances from NGC 4486. For
instance, at a distance of R = 40′ we expect a surface density of ∼ 5 GCs arcmin−2. At such
distances, captured GCs are expected to greatly outnumber intrinsic GCs, so that the metallicity
distribution of the outermost GCs is predicted to be metal-poor and essentially unimodal.
Conversely, the intrinsic population of GCs should dominate near the very center of the
galaxy. Based on Figure 10 and on the GC surface densities for the inner regions of NGC 4486
reported by McLaughlin (1995), we estimate that the metal-rich GCs should outnumber the
metal-poor ones inside R ∼ 30′′, with the exact ratio depending on the exponent governing the

– 19 –
dependence of mass density on radius. Note that only those GCs initially within R ∼ 0.′1 are
expected to have had their orbits decay to the galaxy center through dynamical friction (Equation
14; Lauer & Kormendy 1986). It is also worth pointing out that Equation 19 predicts a surface
density for the metal-poor GCs of 15+7−4 arcmin−2 at a galactocentric distance of R = 1.′5; since
the total GC surface density at this radius is approximately 45 GCs arcmin−2, the implied surface
density of intrinsic GCs is ≃ 30 arcmin−2. Thus, the measured specific frequency of Sn = 10 ± 1
at this distance (McLaughlin, Harris & Hanes 1994) would correspond to Sn = 6.5+1.2−0.9 for the
intrinsic GCS, which is more in accord with that found for other Virgo gE galaxies.
5. A Comparison to Merger-Induced GC Formation Models
There have been several recent reviews of models for the formation of gEs and their associated
GCSs (e.g., Harris, Pritchet & McClure 1995; FBG97; Blakeslee, Tonry & Metzger 1997). One
model which has received particularly close attention — not only in the context of the so-called
“high-Sn problem” but also in terms of bimodal GC metallicity distributions — is that of Ashman
& Zepf (1992) which contends that numerous GCs are formed during mergers of gas-rich galaxies.
The model proposed here also involves mergers, but makes very different predictions for the
formation and evolution of gE galaxies and their systems of GCs. Therefore, we include below
a brief comparison of the present model and that of Ashman & Zepf (1992), focusing on the
well-studied pair of Virgo gE galaxies NGC 4472 and NGC 4486.
Perhaps the strongest evidence against the notion that the formation of new GCs in mergers
can explain both the bimodal GC metallicity distributions and extraordinarily large GCSs of
some gE galaxies is that both NGC 4472 and NGC 4486 exhibit strongly bimodal GC metallicity
distributions despite the fact that NGC 4486, though ∼ 20% less luminous than NGC 4472, has
more than twice as many GCs. If repeated mergers gave rise to the metallicity distributions
observed in both galaxies, then how did NGC 4486 manage to form GCs almost three time more
efficiently than its Virgo counterpart? Indeed, the dichotomy is even more pronounced than
such arguments suggest since the merger rate in the vicinity of NGC 4486 is likely to have been
negligibly small once the deep potential well of the cluster formed (i.e., the merger time-scale
depends very strongly the cluster velocity dispersion; see Equation 31 of Merritt 1985). In the
model proposed here, the proximity of NGC 4486 to the dynamical center of Virgo offers a
straightforward explanation for the different number of GCs associated with the two galaxies.
For gEs having specific frequencies greater than ∼ Sn, we predict that the “excess” GCs
should be metal-poor. This prediction is contrary to that of Ashman & Zepf (1992) who argue
that the excess GCs should be metal-rich, having formed from chemically-enriched gas. Figure
3 of FBG97 demonstrates that, among the dozen or so gE galaxies which are known to have
bimodal GC metallicity distributions, the metal-poor GCs dominate the overall GC population in
high-Sn galaxies. In addition, an age-metallicity relation is expected for GCs in the Ashman &
Zepf (1992) model, in the sense that the metal-rich GCs should be younger than their metal-poor

– 20 –
counterparts. Such a trend is not observed for the NGC 4486 GCS (Cohen, Blakeslee & Ryzhov
1998), nor is one expected within the framework of the model proposed here.
6. Additional Predictions
In addition to our predictions that there should exist appreciable numbers of metal-poor
GCs at large distances from NGC 4486, and that the ratio of metal-poor to metal-rich GCs
should increase steadily with distance from the galaxy’s center (see §4.3), there are a number of
other observations which may be used to test our model for the origin of the metal-poor GCs
associated with gE galaxies. First, we expect no dwarf ellipticals to show bimodal GC metallicity
distributions since these galaxies are unlikely to have complex merger histories. In addition, since
the metal-rich GCs associated with gE galaxies are assumed to have formed in situ, during a
“standard” dissipational collapse scenario, they may show a radial gradient in metallicity and
some net rotation, depending on the amount of dissipation in the collapse of the proto-galactic
gas cloud (see, e.g., Majewski 1993). Based on Figure 6, we also predict a correlation between
the location of the metal-poor GC peak and the slope of the initial galaxy LF, in the sense that
steeper LFs produce lower metallicities for the captured GCs. However, testing this claim will
require large sample sizes since the expected trend will be diluted by differences in the merger
histories of individual galaxies. In a companion paper (Marzke, Cote & West 1998), we discuss
the formation of cD galaxies by tidal stripping and mergers, and show that a similar trend should
exist between initial LF slope and cD envelope color.
The metal-poor GCs surrounding NGC 4486 are predicted to have been tidally stripped from
other cluster galaxies by the overall Virgo cluster potential. Figure 10 suggests that their spatial
distribution is consistent with the idea that they are tidal debris, and that they follow the same
surface density profile as does the mass in the Virgo core. Thus, the metal-poor GCs in NGC 4486
are expected to show a larger velocity dispersion than the metal-rich GCs. Radial velocities for
the most distant GCs (i.e., those beyond R ∼ 25′) should have a dispersion comparable to those
for the Virgo cluster galaxies. Recently, Kissler-Patig (1997) has presented evidence for such an
effect in the Fornax cluster: the distant, and predominantly metal-poor, GCs surrounding the cD
galaxy NGC 1399 have a velocity dispersion which is indistinguishable from that of the innermost
Fornax galaxies.
Finally, since tidal stripping of GCs is dominated by the overall cluster potential and not by
that of the gE galaxy itself, tidally stripped GCs should accumulate in the potential well of any
massive cluster, regardless of the whether or not the potential well coincides with the location of a
bright cluster galaxy (Merritt 1984; White 1987; West et al. 1995).

– 21 –
7. Summary
Many, perhaps most, gE galaxies have GCSs which show bimodal metallicity distributions.
We argue that such bimodal distribution may arise from the capture of other GCs, either through
mergers or tidal stripping. For reasonable choices for the LF of galaxies in the host cluster and
for the dependence of GC metallicity on parent galaxy luminosity, such captured GCs define
a metal-poor population which has a maximum in the range −1.5 <∼ [Fe/H] <∼ −0.7. Since
the precise location of this maximum depends primarily on the LF of the surrounding galaxy
cluster, mergers and tidal stripping provide a natural explanation for not only the origin of the
metal-poor peak, but also its poor correlation with the luminosity of the gE (FBG97). Our
principal conclusion is that it is possible to explain bimodal GC metallicity distributions without
resorting to the formation of new GCs in mergers or by invoking multiple bursts of GC formation.
A comparison between the simulated and the observed GC metallicity distributions for the
well-studied galaxy NGC 4472 shows excellent agreement, particularly for steeper LFs. We argue
that the weaker cluster tidal field near NGC 4472 compared to NGC 4486 is responsible for the
disparity in the sizes of the GCSs of these two galaxies since tidal stripping may, in some cases,
lead to substantial increases in specific frequency. This is particularly true if the metal-poor GCs
in gEs were captured through tidal stripping of low- and intermediate-luminosity galaxies since
the GCSs of such galaxies are likely to have been more extended than their constituent stars at
the epoch of formation. It would seem the time is ripe to re-examine the dynamical evolution
of GCSs using improved numerical simulations (i.e., existing N-body experiments suffer from
limited resolution and restricted dynamic range; Muzzio 1987). With larger simulations and more
sophisticated algorithms it will be possible to investigate the time evolution of the size, spatial
extent and metallicity distribution of the GCSs associated with bright cluster ellipticals.
We describe a new method for placing limits on the fraction of luminous matter which has
been captured by individual gE galaxies. An application of the method to NGC 4472 suggests
that as much as ∼ 65% of its present-day luminosity could have been acquired in this way. This
technique may provide a useful tool for studying the merger histories of gE galaxies.
The authors thank John Blakeslee, Greg Bothun, Doug Johnstone, Jim Hesser, Dean
McLaughlin, David Merritt, Sterl Phinney, Hans-Walter Rix, Scott Tremaine, Sidney van den
Bergh and an anonymous referee for helpful comments which improved the paper. P.C. gratefully
acknowledges support provided by the Sherman M. Fairchild Foundation. Additional support for
this work was provided to R.O.M. by NASA through grant No. HF-0.096.01-97A from the Space
Telescope Science Institute, which is operated by the Association of Universities for Research in
Astronomy, Inc., under NASA contract NAS5-26555. MJ.W. acknowledges financial support from
the Natural Sciences and Engineering Research Council of Canada and the Canadian Institute for
Theoretical Astrophysics.

– 22 –
A. Tidal Radii in an NFW Potential
NFW have suggested that the dark matter distribution in galaxy clusters is given by
ρ(r) =ρcritδc
(r/rs)(1 + r/rs)2(A − 1)
where ρcrit is the critical density, δc is the dark halo’s characteristic overdensity and rs its scale
radius.
The tidal radius, rt, of a galaxy moving in a cluster potential φ(r) is given by (Merritt 1984)
rt =αβσg√
2
[3
r
dφ(r)
dr− 4πGρ(r)
]−1/2(A − 2)
where α and β are parameters related to the internal mass distribution of the test galaxy. Using
Poisson’s equation,1
r2
d
dr
r2 dφ(r)
dr
= 4πGρ(r), (A − 3)
it is possible to calculate the potential gradient
dφ
dr=
4πGρcritδcr3s
r2
[
ln(1 + r/rs) +1
(1 + r/rs)− 1
]
(A − 4)
corresponding to this density profile. Thus, Equation A-2 implies a tidal radius of
rt =αβσg
H0
√3δc
[3r3s
r3
(
ln(1 + r/rs) +1
(1 + r/rs)− 1
)
− 1
(r/rs)(1 + r/rs)2
]−1/2(A − 5)
where we have made use of the fact that ρcrit = 3H20/8πG.
The central velocity dispersion of ≃ 600 km s−1 for early-type galaxies in the Virgo cluster
corresponds to a halo circular velocity of ≃ 850 km s−1. This most closely resembles model 16 of
NFW, which has a scale radius of rs = 190 kpc and a characteristic overdensity of δc = 28200.
Thus, the tidal radius in the vicinity of NGC 4486’s cD envelope is found to be rt ∼ 1 kpc,
assuming H0 = 75 km s−1 Mpc−1, σg = 30 km s−1 and α ≃ β ≃ 1. The agreement with that
found from Equation 15 is not surprising since NFW have shown that the density profile given by
Equation A-1 differs significantly from isothermal only at large and small radii.

– 23 –
Table 1. Dependence of GC Metallicity on Parent Galaxy Luminosity
Galaxy Type M iV Ngc [Fe/H] σi Ref (M i
V )a Ref([Fe/H])a
Dwarf Ellipticals
Fornax dE0 -12.7±0.4 5 -1.77±0.12 0.20±0.07 17 1,7
Sagittarius dE -13.2±0.5 3 -1.79±0.13b 0.21±0.09 13,18 5
M81-F8D1 dE -14.25±0.26 1 -1.8±0.3 2 2
NGC 147 E5p -15.45±0.23 2 -2.06±0.33 0.27±0.16 6,12 4
NGC 185 E3p -15.47±0.23 5 -1.61±0.23 0.31±0.11 6,16 4
VCC 1254 dE0,N -16.65±0.20 13 -1.51±0.13 0.45±0.09 9,10 9
NGC 205 E5p -16.61±0.32 6 -1.48±0.09 0.14±0.06 6,15 6
VCC 1386 dE3,N -16.99±0.21 8 -1.43±0.10 0.21±0.52 9,10 9
NGC 3115 DW1 dE1,N -17.62±0.14 24 -1.25±0.13 0.65±0.09 3,8 8
Lenticulars
NGC 1380 S0 -21.0±0.3 0.15±0.5 14 14
Giant Ellipticals
NGC 1052 E4 -20.25±0.3 -0.4±0.2 11 11
NGC 1399 E1p -20.85±0.3 -0.57±0.2c 11 11
NGC 1404 E1 -20.1±0.3 -0.2±0.2 11 11
NGC 3311 E+2 -21.4±0.3 0.15±0.2 11 11
NGC 3923 E4-5 -21.4±0.3 0.0±0.2 11 11
NGC 4472 E2 -21.6±0.3 1774 -0.05±0.2 0.32±0.10d 11 11
NGC 4486 E+0-1p -21.8±0.3 0.0±0.2e 11 11
NGC 4494 E1-2 -20.0±0.3 -0.3±0.2 11 11
NGC 5128 E0p -21.0±0.3 -0.1±0.2 11 11
NGC 5846 E0-1 -22.3±0.3 -0.2±0.2 11 11
IC 1459 E3 -20.5±0.3 0.0±0.2 11 11
aReferences for Table 1: (1) Buonanno et al. 1985; (2) Caldwell et al. 1998; (3) Ciardullo, Jacoby & Tonry
1993; (4) Da Costa & Mould 1988; (5) Da Costa & Armandroff 1995; (6) de Vaucouleurs et al. 1991; (7) Dubath,
Meylan & Mayor 1992; (8) Durrell et al. 1996; (9) Durrell et al. 1997; (10) Ferrarese et al. 1996; (11) Forbes,
Brodie & Grillmair 1997; (12) Han et al. 1997; (13) Ibata, Gilmore & Irwin 1995; (14) Kissler-Patig et al. 1997;
(15) Lee 1996; (16) Lee, Freedman & Madore 1993; (17) Mateo et al. 1991; (18) Mateo et al. 1996;
bFollowing Durrell et al. (1997) we omit Terzan 7 from the calculation of [Fe/H] since its high metallicity (Da
Costa & Armandroff 1995), younger age (Layden & Sarajedini 1997) and marginally discrepant velocity (Da Costa
& Armandroff 1995) suggest that it may not be a true Sagittarius GC.
cShows marginal evidence for a trimodal GC metallicity distribution (Forbes, Brodie & Grillmair 1997). We
combine their intermediate- and metal-rich populations and find that 55% of the GCs comprise a metal-rich
component with peak at [Fe/H] = −0.57.
dWe adopt the dispersion of the metal-rich component of the double Gaussian which best fits the
photometrically-derived GC metallicity distribution of Geisler, Lee & Kim (1996).
eShows marginal evidence for a trimodal GC metallicity distribution (Forbes, Brodie & Grillmair 1997). We
fit a double Gaussian to the HST data of Whitmore et al. (1995) and adopt [Fe/H] = 0.0 as the location of the
metal-rich peak; 53% of the GCs in this sample belong to the metal-rich component.

– 24 –
REFERENCES
Ashman, K.A., & Zepf, S.E. 1992, ApJ, 384, 50
Ashman, K.A., & Bird, C.M. 1993, AJ, 106, 2281
Baugh, C.M., Cole, S., & Frenk, C.S. 1996, MNRAS, 282, 27
Bender, R., & Surma, P. 1992, A&A, 258, 250
Bevington, P.R. 1969, Data Reduction and Error Analysis for the Physical Sciences, (New York:
McGraw Hill)
Binggeli, B. Tammann, G.A., & Sandage, A. 1987, AJ, 94, 251
Binggeli, B. Sandage, A. & Tammann, G.A. 1988, ARA&A, 26, 509
Binney, J. & Tremaine, S. 1987, Galactic Dynamics, (Princeton: Princeton University Press)
Biviano, A., Durret, F., Gerbal, D., Le Fevre, O., Lobo, C., Mazure, A., & Slezak, E. 1995, A&A,
297, 610
Blakeslee. J.P., Tonry, J.L., & Metzger, M.R. 1997, AJ, 114, 482
Buonanno, R., Corsi, C.E., Fusi Pecci, F., Hardy, E., & Zinn, R. 1985, A&A, 152, 65
Caldwell, N., Armandroff, T.E., Seitzer, P., & Da Costa, G.S. 1992, AJ, 103, 840
Caldwell, N., Armandroff, T.E., Da Costa, G.S., & Seitzer, P. 1998, AJ, 115, 535
Ciardullo, R., Jacoby, G.H., & Tonry, J.L. 1993, ApJ, 419, 479
Ciardullo, R., Jacoby, G., Feldmire, J., & Bartlett, J. 1998, ApJ, 492, 62
Cole, S., Aragon-Salamanca, A., Frenk, C.S., Navarro, J.F., & Zepf, S.E. 1994, MNRAS, 271, 781
Cohen, J.G., & Ryzhov, A. 1997, ApJ, 486, 230
Cohen, J.G., Blakeslee, J.P., & Ryzhov, A. 1998, ApJ, 496, 808
Da Costa, G.S., & Mould, J.R. 1988, ApJ, 334, 159
Da Costa, G.S., & Armandroff, T.E. 1995, AJ, 109, 2533
de Freitas Pacheco, J.A. 1996, MNRAS, 278, 841
de Vaucouleurs, G., & Nieto, J.-L. 1978, ApJ, 220, 449
de Vaucouleurs, G., de Vaucouleurs, A., Corwin, H.G., Buta, R.J., Paturel, G., & Fougue, P. 1991,
Third Reference Catalogue of Bright Galaxies, (Springer, New York)

– 25 –
Dubath, P., Meylan, G., & Mayor, M. 1992, ApJ, 400, 510
Durrell, P.R., McLaughlin, D.E., Harris, W.E., & Hanes, D.A. 1996, ApJ, 463, 543
Durrell, P.R., Harris, W.E., Geisler, D., & Pudritz, R.E. 1997, AJ, 112, 972
Ellis, R.S., Colless, M., Broadhurst, T., Heyl, J., & Glazebrook, K. 1996, MNRAS, 280, 235
Ellis, R.S. 1997, ARA&A, 35, 389
Elson, R.A.W., & Santiago, B.X. 1996, MNRAS, 280, 971
Faber, S.M., Tremaine, S., Ajhar, E.A., Byun, Y.-I., Dressler, A., Gebhardt, K., Grillmair, C.,
Kormendy, J., Lauer, T.R, Richstone, D. 1997, AJ, 114, 1771
Ferguson, H., Tanvir, N., & von Hippel, T. 1998, Nature, 391, 461
Ferrarese, L., Freedman, W.L., Hill, R., Saha, A., Madore, B.F., Kennicutt, R.C., Stetson, P.B.,
Ford, H.C., Graham, J.A., Hoessel, J.G., Han, M., Huchra, J., Hughes, S.M., Illingworth,
G.D., Kelson, D., Mould, J.R., Phelps, R., Silberman, N.A., Sakai, S., Turner, A., Harding,
P., & Bresolin, F. 1996, ApJ, 464, 568
Forbes, D.A., Brodie, J.P., & Grillmair, C.J. 1997, AJ, 113, 1652 (FBG97)
Ford, H.C., Jacoby, G.H., & Jenner, D.C. 1978, ApJ, 213, 18
Forte, J.C., Martinez, R.E., & Muzzio, J.C. 1982, AJ, 87, 1465
Geisler, D. Lee, M.G., & Kim, E. 1996, AJ, 111, 1529
Greggio, L. 1997, MNRAS, 285, 151
Gunn, J.E. 1977, ApJ, 218, 592
Kauffmann, G., White, S.D.M., & Guiderdoni, B. 1993, MNRAS, 264, 201
Kauffmann, G., Guiderdoni, B., & White, S.D.M. 1994, MNRAS, 267, 981
Han, M., Hoessel, J.G., Gallagher, J.S., Holtzman, J., Stetson, P.B., Trauger, J., Ballester, G.E.,
Burrows, C., Clarke, J., Crisp, D., Griffiths, R., Grillmair, C., Hester, J., Krist, J., Mould,
J.R., Scowen, P., Stapelfeldt, K., Watson, W., & Westphal, J. 1997, AJ, 113, 1001
Harris, W.E. 1986, AJ, 91, 822
Harris, W.E. 1991, ARA&A, 29, 543
Harris, W.E., Pritchet, C.J., & McClure, R.D. 1995, ApJ, 441, 120
Harris, W.E., & van den Bergh, S. 1981, AJ, 86, 1627

– 26 –
Hausman, M.A., & Ostriker, J.P. 1978, ApJ, 224, 300
Ibata, R., Gilmore, G., & Irwin, M. 1995, MNRAS, 277, 781
Impey, C., Bothun, G., & Malin, D. 1988, ApJ, 330, 634
Kissler-Patig, M. 1997, preprint (astro-ph/9712059)
Kissler-Patig, M., Richtler, T., Storm, J., & Della Valle, M. 1997, A&A, A&A, 327, 503
Lauer, T.R., & Kormendy, J. 1986, ApJ, 303, L1
Layden, A.C., & Sarajedini, A. 1997, ApJ, 486, L107
Lee, M.G. 1996, AJ, 112, 1438
Lee, M.G., & Geisler, D. 1993, AJ, 106, 493
Lee, M.G., Freedman, W.L., & Madore , B.F. 1993, AJ, 106, 964
Lopez-Cruz, O., Yee, H.K.C., Brown, J.P., Jones, C., & Forman, W. 1997, ApJ, 475, L97
Loveday, J. 1997, ApJ, 489, 29
Mackie, G. 1992, ApJ, 400, 65
Majewski, S.R. 1993, ARA&A, 31, 575
Marzke, R.O., Geller, M.J., Huchra, J.P., & Corwin, H.G. 1994, AJ, 108, 437
Marzke, R.O., Cote, P., & West, M.J. 1998, in preparation
Mateo, M. 1994, in ESO Conference and Workshop Proceedings No. 49, Dwarf Galaxies, edited by
G. Meylan & P. Prugniel (Garching: ESO), 309
Mateo, M., Mirabel, N., Udalski, A., Szymanski, M., Kaluzny, J., Kubiak, M., Krzeminski, W., &
Stanek, K. 1996, ApJ, 458, 13
Mateo, M., Olszewski, E., Welch, D.L., Fischer, P., & Kunkel, W. 1991, AJ, 102, 914
McLaughlin, D.E., Harris, W.E., & Hanes, D.A. 1994, ApJ, 422, 486
McLaughlin, D.E. 1995, AJ, 109, 2034
Mendez, R.H., Guerrero, M.A., Freeman, K.C., Arnaboldi, M., Kudritzki, R.P., Hopp, U.,
Capaccioli, M., & Ford, H.C. 1997, ApJ, 491, L23
Merritt, D. 1984, ApJ, 276, 26
Merritt, D. 1985, ApJ, 289, 18

– 27 –
Minniti, D., Meylan, G., & Kissler-Patig, M. 1996, A&A, 312, 49
Muzzio, J.C. 1987, PASP, 99, 614
Navarro, J.F., Frenk, C., & White, S.D.M. 1995, MNRAS, 275, 56
Navarro, J.F., Frenk, C., & White, S.D.M. 1996, ApJ, 462, 575 (NFW)
Nulsen, P.E.J., & Bohringer, H. 1995, MNRAS, 274, 1093
Ostriker, J.P., & Tremaine, S.D. 1978, ApJ, 202, L113
Ostrov, P., Geisler, D., & Forte, J.C. 1993, ApJ, 105, 1762
Peebles, P.J.E. 1970, AJ, 75, 13
Pettini, M., Steidel, C.C., Aldeberger, K.L., Kellogg, M., Dickinson, M., Giavalisco, M. 1997,
preprint (astro-ph/9708117)
Richstone, D.O. 1976, ApJ, 200, 535
Roberts, M.S., & Haynes, M.P. 1994, ARA&A, 32, 115
Sandage, A., Binggeli, B., & Tammann, G.A. 1985, AJ, 90, 1759
Schechter, P. 1976, ApJ, 203, 297
Schweizer, F. 1986, in Nearly Normal Galaxies, edited by S. Faber (New York: Springer), 18
Smith, R.M., Driver, S.P., & Phillips, S. 1997, MNRAS, 287, 415
Theuns, T. & Warren, S.J. 1997, MNRAS, 284, 11
Toomre, A. 1977, in The Evolution of Galaxies and Stellar Populations, ed. B.M. Tinsley & R.B.
Larson (New Haven: Yale University Observatory), p. 420
Tremaine, S.D. 1976, ApJ, 203, 72
Trentham, N. 1997, MNRAS, 286, 133
Tremblay, B., & Merritt, D. 1996, AJ, 111, 2243
van den Bergh, S. 1975, ARA&A, 13, 217
van den Bergh, S. 1982, PASP, 94, 459
van den Bergh, S. 1984, PASP, 96, 329
West, M.J. 1993, MNRAS, 265, 755
– 28 –
West, M.J. 1994, MNRAS, 268, 79
West, M.J., Cote, P., Jones, C., Forman, W., & Marzke, R.O. 1995, ApJ, 476, L15
White, R.E. 1987, MNRAS, 227, 185
Whitmore, B.C., Sparks, W.B., Lucas, R.A., Macchetto, F.D., & Biretta, J.A. 1995, ApJ, 454, L73
Wilson, G., Smail, I., Ellis, R.S., & Couch, W.J. 1997, MNRAS, 284, 915
This preprint was prepared with the AAS LATEX macros v4.0.

– 29 –
Fig. 1.— Mean GC metallicity, [Fe/H], plotted against absolute visual magnitude, M iV , of the
parent galaxy. For the gE and lenticular galaxies, we plot the mean metallicities of their metal-rich
GCs against the absolute visual magnitudes given by Equation 2. The dotted line shows the second-
order polynomial which best fits the data, taking into account the uncertainties in both observables.
The uncorrected magnitudes for the giant galaxies are indicated by the arrows (see text for details).
Some of the scatter among the corrected magnitudes for the giant galaxies undoubtedly reflects the
presence of radial gradients in the ratio of metal-rich and metal-poor GCs (i.e., the GCSs are not
observed over the same metric radii in all of the galaxies). The dashed line shows the [Fe/H]-M iV
relation obtained using the uncorrected magnitudes.

– 30 –
Fig. 2.— Observed and simulated GC metallicity distributions for NGC 4472. The filled triangles
indicate the observations of Geisler, Lee & Kim (1996) while the open squares indicate simulated
GC metallicity distributions for an assumed LF slope of α = −1.2. The simulated data have been
binned in the same manner as the real data. The simulated GC metallicity distributions shown in
the four different panels are a representative sample for this choice of LF slope. The best-fit double
Gaussian is shown as the solid line, while the dotted lines indicate the two separate components.
The total number of captured galaxies, Ncap, is recorded in the upper left corner of each panel,
along with the goodness-of-fit statistic χ2sim (see text for details).

– 31 –
Fig. 3.— Same as in Figure 2 except for an LF slope of α = −1.5.

– 32 –
Fig. 4.— Same as in Figure 2 except for an LF slope of α = −1.8.
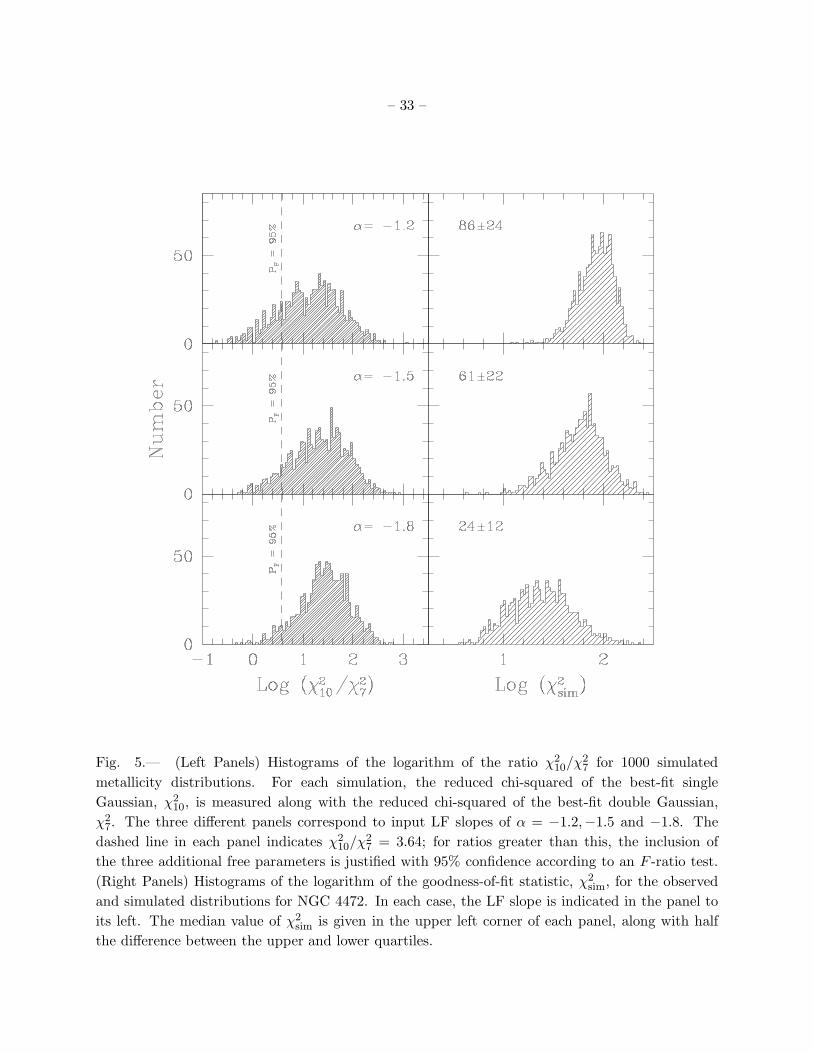
– 33 –
Fig. 5.— (Left Panels) Histograms of the logarithm of the ratio χ210/χ
27 for 1000 simulated
metallicity distributions. For each simulation, the reduced chi-squared of the best-fit single
Gaussian, χ210, is measured along with the reduced chi-squared of the best-fit double Gaussian,
χ27. The three different panels correspond to input LF slopes of α = −1.2,−1.5 and −1.8. The
dashed line in each panel indicates χ210/χ
27 = 3.64; for ratios greater than this, the inclusion of
the three additional free parameters is justified with 95% confidence according to an F -ratio test.
(Right Panels) Histograms of the logarithm of the goodness-of-fit statistic, χ2sim, for the observed
and simulated distributions for NGC 4472. In each case, the LF slope is indicated in the panel to
its left. The median value of χ2sim is given in the upper left corner of each panel, along with half
the difference between the upper and lower quartiles.

– 34 –
Fig. 6.— Variation in the median metallicity of captured GCs as a function of LF slope for a gE
galaxy similar to NGC 4472. The errorbars shows the upper and lower quartiles at each point. The
filled squares in the right panel show the location of the metal-poor peak for the gE galaxies listed
in Table 1 of Forbes, Brodie & Grillmair (1997).

– 35 –
Fig. 7.— Location of the metal-poor peak as a function of the final absolute magnitude, MfV ,
of the gE galaxy. One thousand simulated datasets were generated at each α and MfV , assuming
equal numbers of metal-rich and metal-poor GCs. The dashed lines indicate the median peak
location for LF slopes of α = −1.2,−1.5 and −1.8. The errorbar at the top of the figure shows
the typical standard deviation at each point. The upper and lower points at each MfV indicate the
99% confidence limits according to the simulations. The open squares show the metal-poor peaks
for the gE galaxies listed in Table 1 of Forbes, Brodie & Grillmair (1997).

– 36 –
Fig. 8.— Surface brightness profiles for the four dwarf galaxies used to construct the “master
dE”. The curves represent exponential profiles with scale lengths and central surface brightnesses
taken from Caldwell et al. (1992). We have corrected all four profiles to a common scale-length of
αs = 375 pc before adding them to create the master dE. The radial positions of the GCs in each
galaxy, also corrected to a common scale-length, are indicated at the top of the figure.

– 37 –
Fig. 9.— Specific frequency profiles for the GCS of the master dE galaxy. The triangles indicate
the present-day specific frequencies exterior to the marked positions. The squares indicates the
same profile using the initial GCS distribution (i.e., after correcting the position of each GC for
the effects of dynamical friction). If placed in the core of the Virgo cluster, a galaxy of this mass
would be tidally stripped to a radius of ∼ 1 kpc. The tidal debris would have Sn >∼ 10, similar to
that observed for the halo of NGC 4486 (McLaughlin, Harris & Hanes 1994). The initial and final
GC positions are shown in the top panel by the filled and open symbols, respectively.
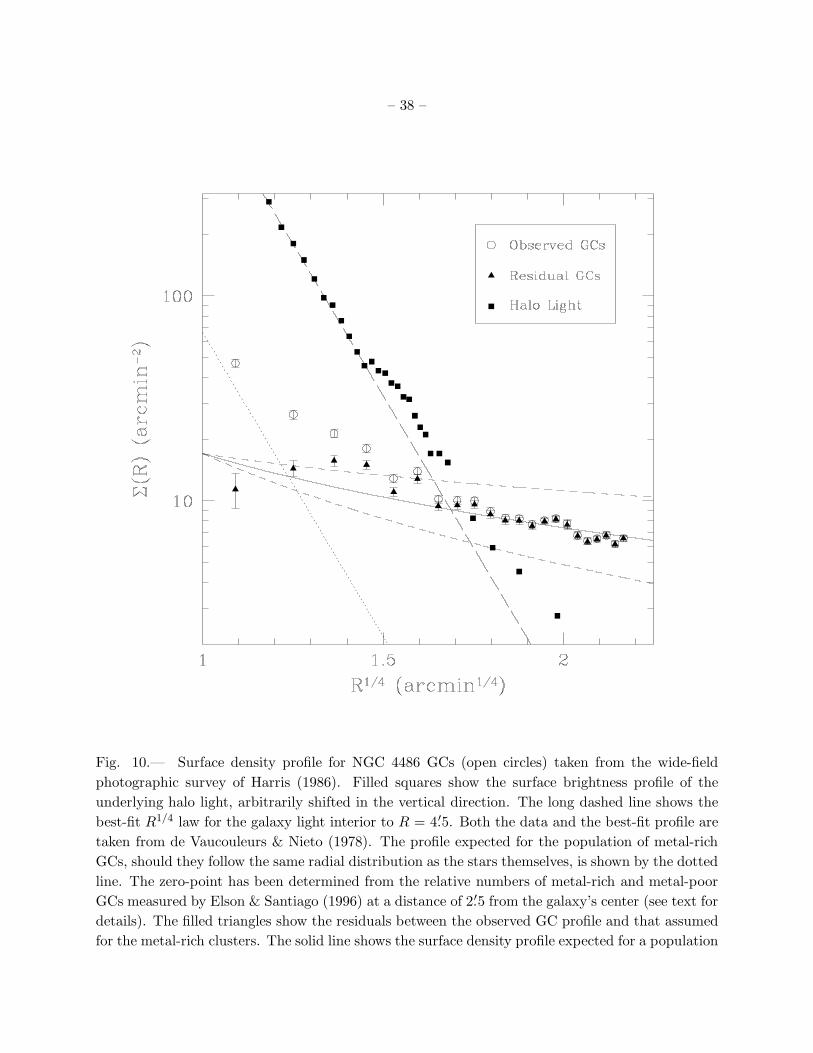
– 38 –
Fig. 10.— Surface density profile for NGC 4486 GCs (open circles) taken from the wide-field
photographic survey of Harris (1986). Filled squares show the surface brightness profile of the
underlying halo light, arbitrarily shifted in the vertical direction. The long dashed line shows the
best-fit R1/4 law for the galaxy light interior to R = 4.′5. Both the data and the best-fit profile are
taken from de Vaucouleurs & Nieto (1978). The profile expected for the population of metal-rich
GCs, should they follow the same radial distribution as the stars themselves, is shown by the dotted
line. The zero-point has been determined from the relative numbers of metal-rich and metal-poor
GCs measured by Elson & Santiago (1996) at a distance of 2.′5 from the galaxy’s center (see text for
details). The filled triangles show the residuals between the observed GC profile and that assumed
for the metal-rich clusters. The solid line shows the surface density profile expected for a population

– 39 –
of objects which trace the total mass in the Virgo core, as measured by Cohen & Ryzhov (1997).
The dotted lines represent the 1σ confidence limits on the slope of the inferred density profile:
ρ(r) ∝ rα where α = 1.7 ± 0.15.