Giant freshwater prawn (Macrobrachium rosenbergii de Man ...
Upload
michiganstateCategory
view
1download
0
230
Journal of Mammalogy, 96(1):230–236, 2015DOI:10.1093/jmammal/gyu031
Space use by endangered giant pandas
Vanessa Hull,*,† Jindong Zhang,† Shiqiang Zhou, Jinyan Huang, Rengui Li, Dian Liu, Weihua Xu, Yan Huang, Zhiyun Ouyang, Hemin Zhang, and Jianguo Liu
Center for Systems Integration and Sustainability, Department of Fisheries and Wildlife, Michigan State University, 115 Manly Miles Building, East Lansing, MI 48823, USA (VH, JZ, JL)State Key Laboratory of Urban and Regional Ecology, Research Center for Eco-Environmental Sciences, Chinese Academy of Sciences, , 18 Shuangqing Road, Beijing 100085, China (JZ, WX, ZO)Institute of Rare Animals and Plants, China West Normal University, 1 Shida Road, Nanchong 637002, China (JZ)China Conservation and Research Center for the Giant Panda, Wolong Nature Reserve, Sichuan 623006, China (SZ, JH, RL, DL, YH, HZ)
* Correspondent: [email protected]
†These authors contributed equally to this paper.
Studies on animal space use can reveal insights into how animals interact with one another and their environment. Research on the space use patterns of the endangered giant panda (Ailuropoda melanoleuca) in China has nevertheless lagged behind that of many other species, as a government moratorium prevented telemetry data collection on pandas from 1995 to 2006. We studied 5 giant pandas using GPS telemetry and estimated home ranges, core areas, and space use using model-based approaches. Home range 95% area was 6 km2 for the single male studied and averaged 4.4 ± 1.2 (± SD) km2 for the 4 females. Pandas occupied several small core areas that they revisited after time lags of up to several months. Pandas also displayed significant space use interactions, especially among the male and 2 different females across several weeks during a fall season, a time of year not previously thought to involve extensive inter-panda interaction.
Key words: Ailuropoda melanoleuca, biased random bridge, core area, giant panda, home range, space use, Wolong Nature Reserve
© 2015 American Society of Mammalogists, www.mammalogy.org
Research on how animals distribute themselves across space provides insights into resource allocation and intrapopulation competition for resources (Kernohan et al. 2001; Powell 2012). Studies on animal space use can also inform conservation of endangered animals by revealing the spatial requirements for individuals, number of animals that a given area can support, and sensitivity of individuals to disturbances (Macdonald and Rushton 2003; Viña et al. 2010; Hull et al. 2011).
The study of space use is important for the giant panda (Ailuropoda melanoleuca), endemic to China and the world’s most endangered ursid. Owing to an increase in human popula-tion size and associated human impacts (Chen et al. 2010; Liu and Raven 2010; Liu et al. 2013), the giant panda population is now limited to 1,600 individuals inhabiting a mere 21,300 km2 in over 20 fragmented, mountainous forests in southwestern China (Loucks et al. 2001; State Forestry Administration 2006; Viña et al. 2008). As obligate bamboo foragers, giant pandas forage in mixed deciduous and coniferous forests with bamboo prevalent in the understory (Schaller et al. 1985; Tuanmu et al. 2010; Viña et al. 2010). Pandas have no known major predators
aside from humans and their daily activities are mainly struc-tured around eating bamboo (for up to 14 h/day) and sleeping (Schaller et al. 1985). Unlike many other ursids, pandas do not hibernate in winter. Pandas are largely solitary and are believed to interact with their neighbors mainly through scent commu-nication outside of the yearly mating season (Schaller et al. 1985). Pandas scent mark from their anogenital glands on trees dispersed throughout their home ranges and these scent marks convey information on their size, sex, estrus state, rank, and identity (Swaisgood et al. 2004).
Studying giant pandas is difficult because they are elusive, avoid humans, and live in rugged, forested landscapes with dense vegetation and poor visibility (Linderman et al. 2006; Hull et al. 2010). Three telemetry studies from the 1980s and early 1990s with sample sizes of 5 (Schaller et al. 1985; Pan et al. 2001; Yong et al. 2004) and 22 pandas (Pan et al. 2001) documented small home ranges for mammals of comparable size (4–29 km2, minimum convex polygons [MCPs] or ellipses). Pandas did not defend spatial areas (as territories) and did not patrol the peripheries of their home ranges (Schaller et al. 1985;

HULL ET AL.—SPACE USE BY GIANT PANDAS 231
Pan et al. 2001). Home ranges of males were slightly larger than those of females, home ranges overlapped extensively, and pandas displayed a distinct seasonal pattern of a summer range and winter range separated by a few hundred meters in eleva-tion. Home ranges expanded as pandas matured to adulthood, home ranges of females shrunk during years when they repro-duced, male cubs inherited parts of their mothers’ home range as adults, males had a dispersed space use pattern for secur-ing mates, and females had a concentrated pattern for rearing young (Pan et al. 2001).
This early research nonetheless suffered from low spatial accuracy and data constrained to daytime and good weather conditions. Then from 1995 until 2006, the Chinese govern-ment banned all telemetry of giant pandas due to concerns over animal safety (Durnin et al. 2004). Using global posi-tioning system (GPS) telemetry on pandas, Zhang et al. (2014) estimated Brownian bridge home ranges of 8–11 km2 (n = 4). Despite considerable spatial overlap among panda home ranges, individuals did not exhibit significant dynamic (spatiotemporal) interactions (Zhang et al. 2014). Zhang et al. (2014) did not investigate core areas (areas of concentrated use within the home range), a topic also understudied in previ-ous literature.
We were afforded a rare opportunity to conduct a GPS-collar study on giant panda space use, allowing us to estimate home ranges, core areas, and space use interactions among pandas using data with high spatial and temporal resolution. This study can inform giant panda conservation by providing insights into how these elusive animals occupy space.
Materials and MethodsStudy area and study animals.—We studied pandas in the 2,000 km2 Wolong Nature Reserve (102°52′–103°24′E, 30°45′–31°25′N), Sichuan, China (Fig. 1). Wolong is within a global biodiversity hotspot (Liu et al. 2003), containing approximately 10% of the total giant panda population (Liu et al. 2001). Panda habitat consists of mixed coniferous and deciduous broad-leaved forests and subalpine coniferous forests (Schaller et al.
1985). The area within Wolong where the pandas were col-lared was called Hetaoping and was located in the northeastern section of the reserve (Fig. 1). Camera trapping and genetic testing of DNA extracted from feces collected throughout the study area suggested a total of 16–25 pandas present (J. Zhang, pers. obs.).
We captured 5 free-ranging giant pandas in 2010 and 2011, outfitted them with GPS collars (GPS_4400 M Lotek Engineering Inc., Newmarket, Ontario, Canada), and released them at their capture sites (Table 1). We anesthetized pandas for short periods using weight-dependent doses of ketamine deposited via compressed air guns. Staff members at the China Conservation and Research Center for the Giant Panda were responsible for the pandas’ safety. Collars weighed approxi-mately 1.2 kg, recorded longitude, latitude, and elevation every 4 h and recorded activity (movement of pandas’ heads along the X and Y axes) every 5 min. Study animals included 3 adult females, 1 subadult (1.5–5 year old) female, and 1 adult male (Table 1). Research followed ASM guidelines (Sikes et al. 2011) and was approved by the Michigan State University Institutional Animal Care and Use Committee.
We excluded data collected within 1 week after capture to minimize effects of capture on behavior. Collars falling off pandas and collar damage limited data to 184–700 days/panda (Table 1). Static testing on collars prior to deployment in a vari-ety of habitat conditions revealed a fix acquisition rate of over 90% for each collar (n = 30 habitat locations). Failure to record fixes did not correlate with any measured habitat characteristics (e.g., slope, forest cover). Actual fix acquisition rate of collars while on the pandas was much lower (31–54%; Table 1). Missed fixes were sporadic and intermixed with successful fixes at least once every 10 days and normally at least every 3 days for all pandas except the male, whose collar malfunctioned and did not record data for 2 lengthy periods (14 November 2011–25 December 2011 and 27 March 2012–6 May 2012). Position error of collars relative to a differentially corrected GPS unit averaged 16–23 m (n = 30 locations per collar).
Giant panda home range estimation.—We estimated home ranges using a biased random bridge model (Benhamou 2011).
Fig. 1.—Study area for GPS-collar tracking of giant pandas (Ailuropoda melanoleuca) in Wolong Nature Reserve, China.
232 JOURNAL OF MAMMALOGY
We chose this model because it incorporates animal movement into the estimation and also includes an advection component for preferred locations and directions of movement (Benhamou 2011). We set the parameters Tmax (maximum step duration), hmin (location uncertainty parameter), and Lmin (minimum dis-tance between successive locations) as 36 h, 10 m, and 20 m, respectively. The diffusion parameter (D) was chosen using the plug-in method (Benhamou 2011) and was taken as the average across all animals to allow for better interindividual compari-son (D = 0.85 m2/s). We also used the collars’ activity data to adjust the time from total time elapsed to “active” time since the previous location (i.e., proportion of time with nonzero activity as measured by the collar activity sensor).
For this portion of the analysis and for the core area analysis, we limited data input to a 1-year period for those individuals with more than 1 year of data available (2 adult females and the male, 11 April 2011–11 April 2012) to improve the compa-rability of models across individuals, but we also provide the full home ranges for reference. We estimated home ranges on a grid cell size of 30 × 30 m (to roughly correspond to the avail-able digital elevation model [DEM]) and defined as that area encompassing the smallest 95% of the predicted utilization dis-tribution (Laver and Kelly 2008). We also performed a surface area correction by overlaying home ranges (and core areas) on a DEM obtained from the Advanced Spaceborne Thermal Emission and Reflection Radiometer (29 × 29 m resolution) and subsequently calculating the surface area using a triangulation method outlined by Jenness (2004). We compared our results to those obtained using the 95% MCP method for comparison to early panda studies.
Core area estimation.—We defined core areas as those areas within home ranges falling below the threshold where percent of home range area increases faster than the predicted probability of use (Seaman and Powell 1990; Vander Wal and Rodgers 2012). We also calculated the proportion of the home range found in the core area, the number of distinct core areas, the number of revis-its to each core area, and the time between revisits. We consid-ered a revisit to have occurred if a panda left a core area and was gone for at least 7 days before returning (a period of time greater than all gaps in fix acquisition except for one 10-day period for 1 female [Zhong] and one 42-day period for the male).
Spatial interactions among pandas.—We calculated the pro-portion of animal i’s home range within animal j’s (Fieberg and Kochanny 2005) and tested for spatial and temporal interaction (Minta 1992). We calculated the coefficients LAA and LBB, which compare the actual use by each animal (A or B) of their shared
space to a predicted use of the shared space under a random use condition (no attraction or avoidance), given the proportion of points in the shared space relative to the entire home range. We also calculated the coefficient Lixn, which compares simul-taneous presence/absence in the shared space versus solitary presence/absence. A chi-square test was used to make statisti-cal inference about whether the frequency of the 2 pandas’ use of the shared space differed from random. We used only data pertaining to time periods in which data were available on both individuals of a pair. We used only 1 point per 24-h period to minimize the effect of temporal autocorrelation. We chose 24 h as a “time to biological independence” (Lair 1987) because a panda can traverse its entire home range in that period of time. We also isolated instances when pandas were less than 200 m from one another to pinpoint the timing of instances of poten-tial direct social interaction. All data analyses were conducted in the R statistical computing software (R Development Core Team 2005), mainly using the adehabitatHR package (Calenge 2011). Minta’s test was conducted in R using DITools (Long 2012).
ResultsGiant panda home range estimation.—The giant pandas’ biased random bridge home ranges spanned 2.75–6.04 km2 and aver-aged 4.38 ± 1.24 km2 ( X SD+ ) after performing surface area correction (Fig. 2; Table 2). The male had the largest surface area-corrected home range size at 6.04 km2. For the 3 pandas who had more than 1 year of available data, home ranges cal-culated on the full data sets spanned 4.59–7.17 km2 and aver-aged 5.76 ± 1.31 km2 after surface area correction. MCP home ranges were larger than surface area-corrected, biased random bridge home ranges (7.08 ± 4.35 km2; Table 2).
Core area estimation.—Pandas showed a slow increase in home range size with home range isopleth level (Fig. 3). The pandas used relatively small areas intensively and used large portions of their home ranges infrequently. Core areas encom-passed the 66–69% isopleth across pandas, but this amounted to only 21–34% of the total home range area (Table 2). With surface area correction, total core areas were 0.77–1.53 km2 divided among 16–39 separate cores (Table 2). Pandas revisited 1–10 of their cores for a total of 1–25 return visits (Table 2). The male revisited more core areas and had a much higher revisit frequency (10 of 16 cores revisited, 25 return visits) than did all females. Pandas revisited a core area after a time frame of 8–191 days (average of 55.15 ± 58.58 days).
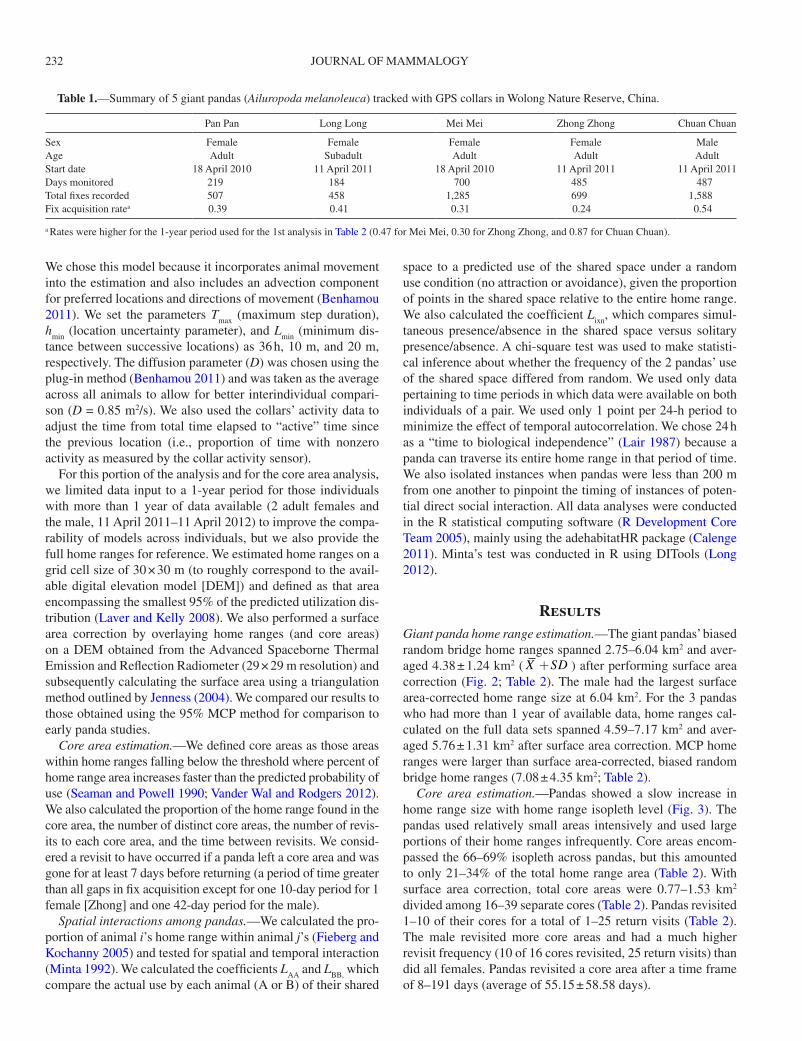
Table 1.—Summary of 5 giant pandas (Ailuropoda melanoleuca) tracked with GPS collars in Wolong Nature Reserve, China.
Pan Pan Long Long Mei Mei Zhong Zhong Chuan Chuan
Sex Female Female Female Female MaleAge Adult Subadult Adult Adult AdultStart date 18 April 2010 11 April 2011 18 April 2010 11 April 2011 11 April 2011Days monitored 219 184 700 485 487Total fixes recorded 507 458 1,285 699 1,588Fix acquisition ratea 0.39 0.41 0.31 0.24 0.54
a Rates were higher for the 1-year period used for the 1st analysis in Table 2 (0.47 for Mei Mei, 0.30 for Zhong Zhong, and 0.87 for Chuan Chuan).

HULL ET AL.—SPACE USE BY GIANT PANDAS 233
Spatial interactions among pandas.—We found 17–35% total home range overlap among 1 adult female, the subadult female, and the adult male (Fig. 4A). The greatest overlap was between the latter 2 pandas, as 48% of the subadult’s 40% home range isopleth (area containing the top 40% of the cumulative prob-ability distribution) was within the male’s home range and 28% of the male’s 40% isopleth was within the subadult female’s home range (Fig. 4A). In addition, the adult female and subadult female overlapped with one another, as 28% of the subadult’s 30% home range isopleth was within the adult female’s home range (Fig. 4A). Other panda pairs had less than 10% home range overlap, including pairings between any 2 adult females.
The male–female dyads formed by these same 3 individu-als exhibited significant simultaneous attraction to shared space (Lixn in Table 3). Pandas were not attracted to the space they shared if the other individual in the pair was not also present (LAA and LBB were not positive and significant). The majority of the 52 recorded interanimal distances that were less than 200 m for the duration of the study occurred from late July to early October (Fig. 4B). An adult female and subadult female were in close proximity to one another during a 2-week period in late August and the subadult female and adult male were in close proximity over the course of a 2-week period in late July and throughout the month of September.
DiscussionPanda home ranges are small relative to other terrestrial mam-mal species of similar body size, including up to several
Fig. 2.—Giant panda (Ailuropoda melanoleuca) 95% home ranges estimated using the biased random bridge model. Names correspond to study pandas (all are adult females except Chuan Chuan is an adult male and Long Long is a subadult female).
Fig. 3.—Space use within the home ranges for 5 giant pandas (Ailuropoda melanoleuca) estimated using the biased random bridge model. Names correspond to study pandas (all are adult females except Chuan Chuan is an adult male and Long Long is a subadult female).
Table 2.—Home ranges and core areas for 5 giant pandas (Ailuropoda melanoleuca) monitored using GPS collars in Wolong Nature Reserve, China. Home ranges are based on 95% isopleths. Pan Pan and Long Long were monitored for 7 and 6 months, respectively, and the remaining pandas were monitored for 1 year. Core areas were estimated using the core area estimation method outlined in Vander Wal and Rodgers (2012). Surface area correction was performed based on overlay with a digital elevation model.
Pan Pan Long Long Mei Mei Zhong Zhong Chuan Chuan
Home range (km2) Minimum convex polygon 2.81 5.03 4.02 11.76 11.79 Biased random bridge movement model 2.29 4.02 3.23 4.05 5.08 Surface area corrected 2.75 4.73 3.68 4.71 6.04Core area Size (km2) 0.67 0.86 0.96 1.33 1.30 Surface area corrected 0.77 1.23 1.10 1.53 1.5 Proportion core (%) 29.2 21.5 34.0 32.8 25.6 Isopleth volume of core (%) 66.5 69.3 66.0 68.7 67.3 Number of separate cores 16 34 31 39 16 Number of cores revisited 2 1 3 6 10 Total number of return visits 2 1 4 7 25 Days elapsed between revisits (X SD+ ) 44.75 ± 32.41 80 68.5 ± 62.78 127.67 ± 84.56 32.54 ± 31.29 Area per separate core (km2, X SD+ ) 0.07 ± 0.09 0.03 ± 0.06 0.04 ± 0.09 0.03 ± 0.08 0.08 ± 0.17

234 JOURNAL OF MAMMALOGY
hundred kilometers smaller than other bears (Garshelis 2004). Pandas have small home ranges likely because their low-energy, yet abundantly available, bamboo food source makes it advantageous to limit cost of travel, while maximizing intake at a given location (Schaller et al. 1985). The home ranges we document here likely included foraging sites, resting sites, scent marking posts, travel routes, and other areas of interest. Use of a movement model approach helped account for the travel routes, but there also may be other areas outside of the
estimated home range that are a part of the pandas’ cognitive map of their environment and are important to them (Powell 2012). Furthermore, our estimates of pandas’ home range sizes continued to increase through 1 year of telemetry and did not reach an asymptote after 16 months for 2 of 3 pandas, suggest-ing that our study (and previous studies that all did not calcu-late beyond yearly home ranges) does not document changes in home range that occur over the course of a panda’s lifetime.
This study is the first to use model-based approaches to define core areas in pandas. The core areas we described here differ markedly from core areas identified for other species, which exhibit a limited number of centralized or high-quality loca-tions (Powell 2000). The pattern of multiple core areas used by each panda is unique and reflects pandas’ unique foraging patterns, as they move from one patch of bamboo to the next, concentrating time in areas of adequate new bamboo shoots (Schaller et al. 1985). Our results suggest that core areas are twice the size predicted by Schaller et al. (1985) using a grid-based approach. Schaller et al. (1985) and Pan et al. (2001) both reported only female pandas using core areas, but Yong et al. (2004) found core areas in both sexes. Our pandas revis-ited core areas, often after long absences (e.g., 6 months), sug-gesting that pandas have strong spatial memories (Tarou et al. 2004). Our male panda’s more frequent revisits than females may be a mating strategy to monitor multiple females through-out the year (Schaller et al. 1985; Pan et al. 2001).
This study is the first to report significant dynamic space use interactions (those including both a spatial and tempo-ral component) among pandas. Such interactions are com-mon in animals living in social groups (e.g., white-tailed deer [Odocoileus virginianus—Bertrand et al. 1996], brown hyena [Hyaena brunnea—Miller 2012]), but not at the close distances we observed in species believed to be largely solitary (e.g., jaguar [Panthera onca—De Azevedo and Murray 2007], lynx [Lynx canadensis—Poole 1995]). The pandas spent several weeks in close proximity to one another in the fall, an unex-pected finding because the mating season is March to May. Anecdotal accounts have suggested a “pseudo” mating season in September and October (Lan et al. 2003). The pandas may also belong to a family group, particularly the adult male, adult female, and subadult female often observed together. Pan et al. (2001) noted unusually high spatial overlap between family group members even into adulthood, an otherwise understud-ied phenomenon in this solitary species. We hope further GPS-collar research on pandas affords larger sample sizes to further explore these findings and incorporate them into conservation design and planning (Xu et al. 2006).
AcknowledgmentsWe are thankful for the ongoing support by the Wolong Nature Reserve Administration for our research. We also gratefully acknowledge the staff and veterinarians at the China Conservation and Research Center for the Giant Panda, including L. Deng, C. Li, and Y. Cheng. We thank all of the individuals who assisted with fieldwork for this
Fig. 4.—Space use interactions among 3 giant pandas (Ailuropoda melanoleuca). A) The home range overlap proportion (HR) index represents the percentage of the 1st animal’s utilization distribution overlapping with the 2nd animal’s utilization distribution at a given isopleth. B) All instances of close distances between individuals (< 200 m) recorded at simultaneous time points throughout the time period of the study.
Table 3.—Minta’s (1992) test for dynamic space use interactions among the 5 giant pandas (Ailuropoda melanoleuca). LAA and LBB represent the relationship between observed and expected use of the area shared by the 2 animals (area of overlap of their respective home ranges) by each individual in the pair, where A is the 1st animal and B is the 2nd animal listed. Lixn is a measure of simultaneous use of the shared area by the animals (ratio of simultaneous use and avoidance to solitary use and avoidance). For all coefficients, values < 0 represent avoidance and values > 0 represent attraction (in bold). * P < 0.05, ** P < 0.01.
Animal pair LAA LBB Lixn
Mei–Pan −0.04 0.01 0.15Mei–Zhong 0 0 −0.87Mei–Long 0 0 −0.7Mei–Chuan — — —Zhong–Long 0.02 0.02 0.38Zhong–Chuan 0.03 0.03 0.56*Long–Chuan 0.02 0.02 0.70**

HULL ET AL.—SPACE USE BY GIANT PANDAS 235
project, particularly S. Fan, W. Yang, and Y. Wang. We acknowledge the following sources of funding: National Science Foundation, the National Aeronautics and Space Administration, the Michigan State University Distinguished Fellowship Program, the William W. and Evelyn M. Taylor International Engagement Program, the National Natural Science Foundation of China (40901289), the State Key Laboratory of Urban and Regional Ecology, Research Center for Eco-Environmental Sciences, Chinese Academy of Sciences (SKLURE2008-1), and the Giant Panda International Collaboration Fund (Grant SD0631; SD1113). We thank R. Powell and anonymous reviewers for their very helpful comments on earlier versions of this manuscript.
Literature CitedBenhamou, S. 2011. Dynamic approach to space and habitat use
based on biased random bridges. PLoS ONE 6:e14592.Bertrand, M. R., A. J. Denicola, S. R. Beissinger, and R.
K. Swihart. 1996. Effects of parturition on home ranges and social affiliations of female white–tailed deer. The Journal of Wildlife Management 60:899–909.
Calenge, C. 2011. Home range estimation. adehabitatHR package for R. Version 0.3. http://cran.r-project.org/web/packages/adehabi-tatHR/index.html. Accessed 8 February 2013.
Chen, X., F. Lupi, A. Viña, G. He, and J. Liu. 2010. Using cost–effective targeting to enhance the efficiency of conservation investments in pay-ments for ecosystem services. Conservation Biology 24:1469–1478.
De Azevedo, F. C. C., and D. L. Murray. 2007. Spatial organization and food habits of jaguars (Panthera onca) in a floodplain forest. Biological Conservation 137:391–402.
Durnin, M. E., R. R. Swaisgood, N. Czekala, and H. Zhang. 2004. Effects of radiocollars on giant panda stress–related behavior and hormones. Journal of Wildlife Management 68:987–992.
Fieberg, J., and C. O. Kochanny. 2005. Quantifying home–range overlap: the importance of the utilization distribution. Journal of Wildlife Management 69:1346–1359.
Garshelis, D. L. 2004. Variation in ursid life histories: is there an outlier? Pp. 53–73 in Giant pandas: biology and conservation (D. Lindburg and K. Baragona, eds.). University of California Press, Berkeley, California.
Hull, V., et al. 2010. The impact of giant panda foraging on bamboo dynamics in an isolated environment. Plant Ecology 212:43–54.
Hull, V., et al. 2011. Evaluating the efficacy of zoning designa-tions for protected area management. Biological Conservation 144:3028–3037.
Jenness, J. S. 2004. Calculating landscape surface area from digital elevation models. Wildlife Society Bulletin 32:829–839.
Kernohan, B. J., R. A. Gitzen, and J. J. Millspaugh. 2001. Analysis of animal space use and movements. Pp. 126–166 in Radio tracking and animal populations (J. J. Millspaugh and J. M. Marzluff, eds.). Academic Press, San Deigo, California.
Lair, H. 1987. Estimating the location of the focal center in red squir-rel home ranges. Ecology 68:1092–1101.
Lan, J.-C., et al. 2003. Fall estrus and mating in a giant panda. Sichuan Journal of Zoology 22:9–11 (in Chinese).
Laver, P. N., and M. J. Kelly. 2008. A critical review of home range studies. Journal of Wildlife Management 72:290–298.
Linderman, M., S. Bearer, L. An, G. He, Z. Ouyang, and J. Liu. 2006. Interactive effects of natural and human disturbances on
vegetation dynamics across landscapes. Ecological Applications 16:452–463.
Liu, J., et al. 2013. Framing sustainability in a telecoupled world. Ecology and Society 18:26.
Liu, J., G. Daily, P. Ehrlich, and G. Luck. 2003. Effects of house-hold dynamics on resource consumption and biodiversity. Nature 421:530–533.
Liu, J., M. Linderman, Z. Ouyang, L. An, J. Yang, and H. Zhang. 2001. Ecological degradation in protected areas: the case of Wolong Nature Reserve for giant pandas. Science 292:98–101.
Liu, J., and P. Raven. 2010. China’s environmental challenges and implications for the world. Critical Reviews in Environmental Science and Technology 40:823–851.
Long, J. A. 2012. A suite of R tools for exploring dynamic interac-tion patterns in wildlife telemetry data. Spatial pattern analysis & research lab technical report. Ver. 0.1. 11p. http://cran.r-project.org/web/packages/wildlifeDI/vignettes/wildlifeDI-vignette.pdf. Accessed 8 February 2013.
Loucks, C. J., et al. 2001. Giant pandas in a changing landscape. Science 294:1465 http://cran.r-project.org/web/packages/wildlifeDI/vignettes/wildlifeDI-vignette.pdf Accessed 8 February 2013.
Macdonald, D. W., and S. Rushton. 2003. Modelling space use and dispersal of mammals in real landscapes: a tool for conservation. Journal of Biogeography 30:607–620.
Miller, J. A. 2012. Using spatially explicit simulated data to analyze animal interactions: a case study with brown hyenas in northern Botswana. Transactions in GIS 16:271–291.
Minta, S. C. 1992. Tests of temporal and spatial interaction among animals. Ecological Applications 2:178–188.
Pan, W., et al. 2001. A chance for lasting survival. Beijing University Press, Beijing, China (in Chinese).
Poole, K. G. 1995. Spatial organization of a lynx population. Canadian Journal of Zoology 73:632–641.
Powell, R. A. 2000. Animal home ranges and territories and home range estimators. Pp. 65–110 in Research techniques in animal ecology: controversies and consequences (L. Boitani and T. K. Fuller, eds.). Columbia University Press, New York.
Powell, R. A. 2012. Movements, home ranges, activity, and dispersal. Pp. 188–217 in Carnivore ecology and conservation: a handbook of techniques (L. Boitani and R. A. Powell, eds.). Oxford University Press, London, United Kingdom.
R Development Core Team. 2005. R: a language and environ-ment for statistical computing. R Foundation for Statistical Computing, Vienna, Austria. www.R-project.org. Accessed 8 February 2013.
Schaller, G. B., J. Hu, W. Pan, and J. Zhu. 1985. The giant pandas of Wolong. University of Chicago Press, Chicago, Illinois.
Seaman, D. E., and R. A. Powell. 1990. Identifying patterns and intensity of home range use. International Conference on Bear Research and Management 8:243–249.
Sikes, R. S., W. L. Gannon, and the Animal Care and Use Committee of the American Society of Mammalogists. 2011. Guidelines of the American Society of Mammalogists for the use of wild mammals in research. Journal of Mammalogy 92:235–253.
State Forestry Administration. 2006. The third national survey report on the giant panda in China. Science Publishing House, Beijing, China (in Chinese).
Swaisgood, R. R., D. Lindburg, A. M. White, H. Zhang, and X. Zhou. 2004. Chemical communication in giant pandas: experi-mentation and application. Pp. 106–120 in Giant pandas: biology and conservation (D. Lindburg and K. Baragona, eds.). University of California Press, Berkeley, California.
236 JOURNAL OF MAMMALOGY
Tarou, L. R., R. J. Snyder, and T. L. Maple. 2004. Spatial mem-ory in the giant panda. Pp. 101–105 in Giant pandas: biology and conservation (D. Lindburg and K. Baragona, eds.). University of California Press, Berkeley, California.
Tuanmu, M. N., A. Viña, S. Bearer, W. Xu, Z. Ouyang, H. Zhang, and J. Liu. 2010. Mapping understory vegetation using pheno-logical characteristics derived from remotely sensed data. Remote Sensing of Environment 114:1833–1844.
Vander Wal, E., and A. R. Rodgers. 2012. An individual–based quantitative approach for delineating core areas of animal space use. Ecological Modelling 224:48–53.
Viña, A., et al. 2010. Range-wide analysis of the giant panda habitat: implications for conservation. Biological Conservation 143:1960–1969.
Viña, A., S. Bearer, H. Zhang, Z. Ouyang, and J. Liu. 2008. Evaluating MODIS data for mapping wildlife habitat distribution. Remote Sensing of Environment 112:2160–2169.
Xu, W., Z. Ouyang, A. Viña, H. Zheng, J. Liu, and Y. Xiao. 2006. Designing a conservation plan for protecting the habitat for giant pandas in the Qionglai mountain range, China. Diversity and Distributions 12:610–619.
Yong, Y., X. Liu, T. Wang, A. K. Skidmore, and H. H. Prins. 2004. Giant panda migration and habitat utilization in Foping Nature Reserve, China. Pp. 159–169 in Giant pandas: biology and conser-vation (D. Lindburg and K. Baragona, eds.). University of California Press, Berkeley, California.
Zhang, Z., et al. 2014. Ecological scale and seasonal heterogene-ity in the spatial behaviors of giant pandas. Integrative Zoology 9:46–60.
Submitted 25 February 2014. Accepted 14 September 2014.
Associate Editor was Roger A. Powell.
Copyright © 2022 FDOKUMEN