Tafel Slope Analyses for Homogeneous Catalytic Reactions
11
catalysts Article Tafel Slope Analyses for Homogeneous Catalytic Reactions Qiushi Yin, Zihao Xu , Tianquan Lian, Djamaladdin G. Musaev, Craig L. Hill and Yurii V. Geletii * Citation: Yin, Q.; Xu, Z.; Lian, T.; Musaev, D.G.; Hill, C.L.; Geletii, Y.V. Tafel Slope Analyses for Homogeneous Catalytic Reactions. Catalysts 2021, 11, 87. https:// doi.org/10.3390/catal11010087 Received: 25 December 2020 Accepted: 8 January 2021 Published: 11 January 2021 Publisher’s Note: MDPI stays neu- tral with regard to jurisdictional clai- ms in published maps and institutio- nal affiliations. Copyright: © 2021 by the authors. Li- censee MDPI, Basel, Switzerland. This article is an open access article distributed under the terms and con- ditions of the Creative Commons At- tribution (CC BY) license (https:// creativecommons.org/licenses/by/ 4.0/). Department of Chemistry, Emory University, Atlanta, GA 30322, USA; [email protected] (Q.Y.); [email protected] (Z.X.); [email protected] (T.L.); [email protected] (D.G.M.); [email protected] (C.L.H.) * Correspondence: [email protected] Abstract: Tafel analysis of electrocatalysts is essential in their characterization. This paper analyzes the application of Tafel-like analysis to the four-electron nonelectrochemical oxidation of water by the stoichiometric homogeneous 1-electron oxidant [Ru(bpy) 3 ] 3+ to dioxygen catalyzed by homoge- neous catalysts, [Ru 4 O 4 (OH) 2 (H 2 O) 4 (γ-SiW 10 O 36 ) 2 ] 10- (Ru 4 POM) and [Co 4 (H 2 O) 2 (PW 9 O 34 ) 2 ] 10– (Co 4 POM). These complexes have slow electron exchange rates with electrodes due to the Frumkin effect, which precludes the use of known electrochemical methods to obtain Tafel plots at ionic strengths lower than 0.5 M. The application of an electron transfer catalyst, [Ru(bpy) 3 ] 3+/2+ , in- creases the rates between the Ru 4 POM and electrode, but a traditional Tafel analysis of such a complex system is precluded due to a lack of appropriate theoretical models for 4-electron pro- cesses. Here, we develop a theoretical framework and experimental procedures for a Tafel-like analysis of Ru 4 POM and Co 4 POM, using a stoichiometric molecular oxidant [Ru(bpy) 3 ] 3+ . The dependence of turnover frequency (TOF) as a function of electrochemical solution potential created by the [Ru(bpy) 3 ] 3+ /[Ru(bpy) 3 ] 2+ redox couple (an analog of the Tafel plot) was obtained from kinetics data and interpreted based on the suggested reaction mechanism. Keywords: Tafel; polyoxometalate; water oxidation; stopped-flow; kinetics; catalyst comparison 1. Introduction Tafel slope analysis has become increasingly popular in this era of solar fuels research and photoelectrochemistry [1–6]. This study addresses the possibility of constructing Tafel plots for homogeneous catalytic multielectron redox processes and the usefulness of this approach. The model homogeneous reaction we have chosen for this study is the oxidation of water in Equation (1). 2H 2 O-4e - → O 2 +4H + (1) 2H + +2e - → H 2 (2) 2H 2 O → O 2 + 2H 2 (3) Equation (1) is very unfavorable thermodynamically and requires an external source of energy such as electricity or light (e.g., solar). The overall reaction of water splitting, Equation (3), includes two half-reactions, water oxidation and reduction, Equations (1) and (2), respectively, which proceed in spatially separated sites: The reverse reaction in Equation (3) takes place in fuel cells to directly convert chemical energy into electricity. In electrochemistry, the potential applied between the cathode and anode and the current is measured. Commonly, the empirically formulated Tafel relation in Equation (4) is used to compare the electrocatalytic activities: η = a + b log(i) (4) where η =E - E 0 is the difference between the electrode and standard potentials, i is the current density, and b is the Tafel slope. Catalysts 2021, 11, 87. https://doi.org/10.3390/catal11010087 https://www.mdpi.com/journal/catalysts
-
Upload
khangminh22 -
Category
Documents
-
view
2 -
download
0
Transcript of Tafel Slope Analyses for Homogeneous Catalytic Reactions
catalysts
Article
Tafel Slope Analyses for Homogeneous Catalytic Reactions
Qiushi Yin, Zihao Xu , Tianquan Lian, Djamaladdin G. Musaev, Craig L. Hill and Yurii V. Geletii *
�����������������
Citation: Yin, Q.; Xu, Z.; Lian, T.;
Musaev, D.G.; Hill, C.L.; Geletii, Y.V.
Tafel Slope Analyses for
Homogeneous Catalytic Reactions.
Catalysts 2021, 11, 87. https://
doi.org/10.3390/catal11010087
Received: 25 December 2020
Accepted: 8 January 2021
Published: 11 January 2021
Publisher’s Note: MDPI stays neu-
tral with regard to jurisdictional clai-
ms in published maps and institutio-
nal affiliations.
Copyright: © 2021 by the authors. Li-
censee MDPI, Basel, Switzerland.
This article is an open access article
distributed under the terms and con-
ditions of the Creative Commons At-
tribution (CC BY) license (https://
creativecommons.org/licenses/by/
4.0/).
Department of Chemistry, Emory University, Atlanta, GA 30322, USA; [email protected] (Q.Y.);[email protected] (Z.X.); [email protected] (T.L.); [email protected] (D.G.M.); [email protected] (C.L.H.)* Correspondence: [email protected]
Abstract: Tafel analysis of electrocatalysts is essential in their characterization. This paper analyzesthe application of Tafel-like analysis to the four-electron nonelectrochemical oxidation of water bythe stoichiometric homogeneous 1-electron oxidant [Ru(bpy)3]3+ to dioxygen catalyzed by homoge-neous catalysts, [Ru4O4(OH)2(H2O)4(γ-SiW10O36)2]10− (Ru4POM) and [Co4(H2O)2(PW9O34)2]10–
(Co4POM). These complexes have slow electron exchange rates with electrodes due to the Frumkineffect, which precludes the use of known electrochemical methods to obtain Tafel plots at ionicstrengths lower than 0.5 M. The application of an electron transfer catalyst, [Ru(bpy)3]3+/2+, in-creases the rates between the Ru4POM and electrode, but a traditional Tafel analysis of such acomplex system is precluded due to a lack of appropriate theoretical models for 4-electron pro-cesses. Here, we develop a theoretical framework and experimental procedures for a Tafel-likeanalysis of Ru4POM and Co4POM, using a stoichiometric molecular oxidant [Ru(bpy)3]3+. Thedependence of turnover frequency (TOF) as a function of electrochemical solution potential createdby the [Ru(bpy)3]3+/[Ru(bpy)3]2+ redox couple (an analog of the Tafel plot) was obtained fromkinetics data and interpreted based on the suggested reaction mechanism.
Keywords: Tafel; polyoxometalate; water oxidation; stopped-flow; kinetics; catalyst comparison
1. Introduction
Tafel slope analysis has become increasingly popular in this era of solar fuels researchand photoelectrochemistry [1–6]. This study addresses the possibility of constructing Tafelplots for homogeneous catalytic multielectron redox processes and the usefulness of thisapproach. The model homogeneous reaction we have chosen for this study is the oxidationof water in Equation (1).
2 H2O−4 e− → O2 + 4 H+ (1)
2 H+ + 2 e− → H2 (2)
2 H2O→ O2 + 2H2 (3)
Equation (1) is very unfavorable thermodynamically and requires an external sourceof energy such as electricity or light (e.g., solar). The overall reaction of water splitting,Equation (3), includes two half-reactions, water oxidation and reduction, Equations (1) and(2), respectively, which proceed in spatially separated sites:
The reverse reaction in Equation (3) takes place in fuel cells to directly convert chemicalenergy into electricity.
In electrochemistry, the potential applied between the cathode and anode and thecurrent is measured. Commonly, the empirically formulated Tafel relation in Equation (4)is used to compare the electrocatalytic activities:
η = a + b log(i) (4)
where η = E − E0 is the difference between the electrode and standard potentials, i is thecurrent density, and b is the Tafel slope.
Catalysts 2021, 11, 87. https://doi.org/10.3390/catal11010087 https://www.mdpi.com/journal/catalysts
Catalysts 2021, 11, 87 2 of 11
The utility of Tafel slopes from a microkinetic analysis of aqueous electrocatalysis forenergy conversion has been reported [1,2]. However, numerous simplifications and as-sumptions in the derivation of Equation (4) leads to an incomplete description of the actualsurface kinetics and makes the applicability of Tafel analysis questionable [2,3,7,8]. In manycases, homogeneous systems are simpler and easier experimentally for understandingthe reaction mechanism. Therefore, we developed a protocol to construct Tafel-like plotsfor homogeneous reactions and studied the usefulness of such plots to better understandthe reaction mechanism. In addition, while extensive mechanistic analyses of molecularredox systems have been conducted previously, many aspects still need to be preciselyaddressed [9]. Generally speaking, the Tafel-like plot is one among multiple approachesthat link the kinetic and thermodynamic properties of such a catalytic system.
Both half reactions, Equations (1) and (2), are complex multielectron processes cat-alyzed by transition metal complexes. Each one is routinely studied individually [6,10–12].Stable homogeneous molecular catalysts are ideally suited for studies of the reaction mecha-nism and the relationship between reaction kinetics and thermodynamics. Indeed, previousstudies on redox and chemical catalysts in different catalytic systems have already pro-vided theoretical tools for mechanistic analyses [9]. More recently, Costentin and Savéantthoroughly analyzed the applicability of the Tafel equation to the homogeneous molecularcatalysis of electrochemical CO2 and O2 reduction [13]. In this work, we describe a protocolfor deriving a Tafel-like plot based on theoretical and experimental grounds to relate thereaction rate with the solution electrochemical potential for homogeneous water oxida-tion by [Ru(bpy)3]3+, catalyzed by the stable molecular tetraruthenium polyoxometalate[Ru4O4(OH)2(H2O)4(γ-SiW10O36)2]10−, Ru4POM. This POM was the first fully inorganic(carbon-free), thus oxidatively robust, water oxidation catalyst (WOC), which is also hy-drolytically stable over a wide pH range (pH 1–9) [14,15]. Detailed electrochemical studiesof this complex showed that the rates of electron exchange between an electrode and thecomplex is sluggish under typical catalytic turnover conditions [14,16]. As a result, neitherthe Tafel plot nor the exchange current density, i0, can be measured experimentally. At thesame time, the catalyst shows excellent activity in homogeneous aqueous solutions whenstoichiometric oxidants such as Ce(IV) or [Ru(bpy)3]3+ are used. The question was posedas to whether data collected in homogeneous multielectron processes can be used to obtaina Tafel-like plot. This study addresses that question and aims to focus on the adaptation ofan analog of traditional Tafel plots to the four-electron water oxidation process specific tohomogeneous species.
2. Results and Discussion2.1. Theoretical Considerations
Here, we assume that water oxidation in homogeneous conditions proceeds throughfour fast Nernstian reversible electron transfer steps followed by the irreversible O2 forma-tion step, Equations (5–8), where C0 is the resting oxidation state of the catalyst, C, andC1–C4 are the one- to four-electron oxidized forms of the catalyst.
C0 − e
Catalysts 2021, 11, x FOR PEER REVIEW 2 of 11
where η = E − E0 is the difference between the electrode and standard potentials, i is the current density, and b is the Tafel slope.
The utility of Tafel slopes from a microkinetic analysis of aqueous electrocatalysis for energy conversion has been reported [1,2]. However, numerous simplifications and as-sumptions in the derivation of Equation (4) leads to an incomplete description of the ac-tual surface kinetics and makes the applicability of Tafel analysis questionable [2,3,7,8]. In many cases, homogeneous systems are simpler and easier experimentally for understand-ing the reaction mechanism. Therefore, we developed a protocol to construct Tafel-like plots for homogeneous reactions and studied the usefulness of such plots to better under-stand the reaction mechanism. In addition, while extensive mechanistic analyses of mo-lecular redox systems have been conducted previously, many aspects still need to be pre-cisely addressed [9]. Generally speaking, the Tafel-like plot is one among multiple ap-proaches that link the kinetic and thermodynamic properties of such a catalytic system.
Both half reactions, Equations (1) and (2), are complex multielectron processes cata-lyzed by transition metal complexes. Each one is routinely studied individually [6,10–12]. Stable homogeneous molecular catalysts are ideally suited for studies of the reaction mechanism and the relationship between reaction kinetics and thermodynamics. Indeed, previous studies on redox and chemical catalysts in different catalytic systems have al-ready provided theoretical tools for mechanistic analyses [9]. More recently, Costentin and Savéant thoroughly analyzed the applicability of the Tafel equation to the homoge-neous molecular catalysis of electrochemical CO2 and O2 reduction [13]. In this work, we describe a protocol for deriving a Tafel-like plot based on theoretical and experimental grounds to relate the reaction rate with the solution electrochemical potential for homo-geneous water oxidation by [Ru(bpy)3]3+, catalyzed by the stable molecular tetraruthe-nium polyoxometalate [Ru4O4(OH)2(H2O)4(γ-SiW10O36)2]10−, Ru4POM. This POM was the first fully inorganic (carbon-free), thus oxidatively robust, water oxidation catalyst (WOC), which is also hydrolytically stable over a wide pH range (pH 1–9) [14,15]. Detailed electrochemical studies of this complex showed that the rates of electron exchange be-tween an electrode and the complex is sluggish under typical catalytic turnover conditions [14,16]. As a result, neither the Tafel plot nor the exchange current density, i0, can be meas-ured experimentally. At the same time, the catalyst shows excellent activity in homogene-ous aqueous solutions when stoichiometric oxidants such as Ce(IV) or [Ru(bpy)3]3+ are used. The question was posed as to whether data collected in homogeneous multielectron processes can be used to obtain a Tafel-like plot. This study addresses that question and aims to focus on the adaptation of an analog of traditional Tafel plots to the four-electron water oxidation process specific to homogeneous species.
2. Results and Discussion 2.1. Theoretical Considerations
Here, we assume that water oxidation in homogeneous conditions proceeds through four fast Nernstian reversible electron transfer steps followed by the irreversible O2 for-mation step, Equations (5–8), where C0 is the resting oxidation state of the catalyst, C, and C1–C4 are the one- to four-electron oxidized forms of the catalyst.
C0 − e ⇄ C1 Eo1 (5)
C1 − e ⇄ C2 Eo2 (6)
C2 − e ⇄ C3 Eo3 (7)
C3 − e ⇄ C4 Eo4 (8)
C4 + 2 H2O ⟶ C0 + O2 + 4 H+ ko (9)
If the equilibria are fast, then an applied and electrochemical solution potential, E, is linked via the Nernst equation, Equation (10):
C1 Eo1 (5)
C1 − e
Catalysts 2021, 11, x FOR PEER REVIEW 2 of 11
where η = E − E0 is the difference between the electrode and standard potentials, i is the current density, and b is the Tafel slope.
The utility of Tafel slopes from a microkinetic analysis of aqueous electrocatalysis for energy conversion has been reported [1,2]. However, numerous simplifications and as-sumptions in the derivation of Equation (4) leads to an incomplete description of the ac-tual surface kinetics and makes the applicability of Tafel analysis questionable [2,3,7,8]. In many cases, homogeneous systems are simpler and easier experimentally for understand-ing the reaction mechanism. Therefore, we developed a protocol to construct Tafel-like plots for homogeneous reactions and studied the usefulness of such plots to better under-stand the reaction mechanism. In addition, while extensive mechanistic analyses of mo-lecular redox systems have been conducted previously, many aspects still need to be pre-cisely addressed [9]. Generally speaking, the Tafel-like plot is one among multiple ap-proaches that link the kinetic and thermodynamic properties of such a catalytic system.
Both half reactions, Equations (1) and (2), are complex multielectron processes cata-lyzed by transition metal complexes. Each one is routinely studied individually [6,10–12]. Stable homogeneous molecular catalysts are ideally suited for studies of the reaction mechanism and the relationship between reaction kinetics and thermodynamics. Indeed, previous studies on redox and chemical catalysts in different catalytic systems have al-ready provided theoretical tools for mechanistic analyses [9]. More recently, Costentin and Savéant thoroughly analyzed the applicability of the Tafel equation to the homoge-neous molecular catalysis of electrochemical CO2 and O2 reduction [13]. In this work, we describe a protocol for deriving a Tafel-like plot based on theoretical and experimental grounds to relate the reaction rate with the solution electrochemical potential for homo-geneous water oxidation by [Ru(bpy)3]3+, catalyzed by the stable molecular tetraruthe-nium polyoxometalate [Ru4O4(OH)2(H2O)4(γ-SiW10O36)2]10−, Ru4POM. This POM was the first fully inorganic (carbon-free), thus oxidatively robust, water oxidation catalyst (WOC), which is also hydrolytically stable over a wide pH range (pH 1–9) [14,15]. Detailed electrochemical studies of this complex showed that the rates of electron exchange be-tween an electrode and the complex is sluggish under typical catalytic turnover conditions [14,16]. As a result, neither the Tafel plot nor the exchange current density, i0, can be meas-ured experimentally. At the same time, the catalyst shows excellent activity in homogene-ous aqueous solutions when stoichiometric oxidants such as Ce(IV) or [Ru(bpy)3]3+ are used. The question was posed as to whether data collected in homogeneous multielectron processes can be used to obtain a Tafel-like plot. This study addresses that question and aims to focus on the adaptation of an analog of traditional Tafel plots to the four-electron water oxidation process specific to homogeneous species.
2. Results and Discussion 2.1. Theoretical Considerations
Here, we assume that water oxidation in homogeneous conditions proceeds through four fast Nernstian reversible electron transfer steps followed by the irreversible O2 for-mation step, Equations (5–8), where C0 is the resting oxidation state of the catalyst, C, and C1–C4 are the one- to four-electron oxidized forms of the catalyst.
C0 − e ⇄ C1 Eo1 (5)
C1 − e ⇄ C2 Eo2 (6)
C2 − e ⇄ C3 Eo3 (7)
C3 − e ⇄ C4 Eo4 (8)
C4 + 2 H2O ⟶ C0 + O2 + 4 H+ ko (9)
If the equilibria are fast, then an applied and electrochemical solution potential, E, is linked via the Nernst equation, Equation (10):
C2 Eo2 (6)
C2 − e
Catalysts 2021, 11, x FOR PEER REVIEW 2 of 11
where η = E − E0 is the difference between the electrode and standard potentials, i is the current density, and b is the Tafel slope.
The utility of Tafel slopes from a microkinetic analysis of aqueous electrocatalysis for energy conversion has been reported [1,2]. However, numerous simplifications and as-sumptions in the derivation of Equation (4) leads to an incomplete description of the ac-tual surface kinetics and makes the applicability of Tafel analysis questionable [2,3,7,8]. In many cases, homogeneous systems are simpler and easier experimentally for understand-ing the reaction mechanism. Therefore, we developed a protocol to construct Tafel-like plots for homogeneous reactions and studied the usefulness of such plots to better under-stand the reaction mechanism. In addition, while extensive mechanistic analyses of mo-lecular redox systems have been conducted previously, many aspects still need to be pre-cisely addressed [9]. Generally speaking, the Tafel-like plot is one among multiple ap-proaches that link the kinetic and thermodynamic properties of such a catalytic system.
Both half reactions, Equations (1) and (2), are complex multielectron processes cata-lyzed by transition metal complexes. Each one is routinely studied individually [6,10–12]. Stable homogeneous molecular catalysts are ideally suited for studies of the reaction mechanism and the relationship between reaction kinetics and thermodynamics. Indeed, previous studies on redox and chemical catalysts in different catalytic systems have al-ready provided theoretical tools for mechanistic analyses [9]. More recently, Costentin and Savéant thoroughly analyzed the applicability of the Tafel equation to the homoge-neous molecular catalysis of electrochemical CO2 and O2 reduction [13]. In this work, we describe a protocol for deriving a Tafel-like plot based on theoretical and experimental grounds to relate the reaction rate with the solution electrochemical potential for homo-geneous water oxidation by [Ru(bpy)3]3+, catalyzed by the stable molecular tetraruthe-nium polyoxometalate [Ru4O4(OH)2(H2O)4(γ-SiW10O36)2]10−, Ru4POM. This POM was the first fully inorganic (carbon-free), thus oxidatively robust, water oxidation catalyst (WOC), which is also hydrolytically stable over a wide pH range (pH 1–9) [14,15]. Detailed electrochemical studies of this complex showed that the rates of electron exchange be-tween an electrode and the complex is sluggish under typical catalytic turnover conditions [14,16]. As a result, neither the Tafel plot nor the exchange current density, i0, can be meas-ured experimentally. At the same time, the catalyst shows excellent activity in homogene-ous aqueous solutions when stoichiometric oxidants such as Ce(IV) or [Ru(bpy)3]3+ are used. The question was posed as to whether data collected in homogeneous multielectron processes can be used to obtain a Tafel-like plot. This study addresses that question and aims to focus on the adaptation of an analog of traditional Tafel plots to the four-electron water oxidation process specific to homogeneous species.
2. Results and Discussion 2.1. Theoretical Considerations
Here, we assume that water oxidation in homogeneous conditions proceeds through four fast Nernstian reversible electron transfer steps followed by the irreversible O2 for-mation step, Equations (5–8), where C0 is the resting oxidation state of the catalyst, C, and C1–C4 are the one- to four-electron oxidized forms of the catalyst.
C0 − e ⇄ C1 Eo1 (5)
C1 − e ⇄ C2 Eo2 (6)
C2 − e ⇄ C3 Eo3 (7)
C3 − e ⇄ C4 Eo4 (8)
C4 + 2 H2O ⟶ C0 + O2 + 4 H+ ko (9)
If the equilibria are fast, then an applied and electrochemical solution potential, E, is linked via the Nernst equation, Equation (10):
C3 Eo3 (7)
C3 − e
Catalysts 2021, 11, x FOR PEER REVIEW 2 of 11
where η = E − E0 is the difference between the electrode and standard potentials, i is the current density, and b is the Tafel slope.
The utility of Tafel slopes from a microkinetic analysis of aqueous electrocatalysis for energy conversion has been reported [1,2]. However, numerous simplifications and as-sumptions in the derivation of Equation (4) leads to an incomplete description of the ac-tual surface kinetics and makes the applicability of Tafel analysis questionable [2,3,7,8]. In many cases, homogeneous systems are simpler and easier experimentally for understand-ing the reaction mechanism. Therefore, we developed a protocol to construct Tafel-like plots for homogeneous reactions and studied the usefulness of such plots to better under-stand the reaction mechanism. In addition, while extensive mechanistic analyses of mo-lecular redox systems have been conducted previously, many aspects still need to be pre-cisely addressed [9]. Generally speaking, the Tafel-like plot is one among multiple ap-proaches that link the kinetic and thermodynamic properties of such a catalytic system.
Both half reactions, Equations (1) and (2), are complex multielectron processes cata-lyzed by transition metal complexes. Each one is routinely studied individually [6,10–12]. Stable homogeneous molecular catalysts are ideally suited for studies of the reaction mechanism and the relationship between reaction kinetics and thermodynamics. Indeed, previous studies on redox and chemical catalysts in different catalytic systems have al-ready provided theoretical tools for mechanistic analyses [9]. More recently, Costentin and Savéant thoroughly analyzed the applicability of the Tafel equation to the homoge-neous molecular catalysis of electrochemical CO2 and O2 reduction [13]. In this work, we describe a protocol for deriving a Tafel-like plot based on theoretical and experimental grounds to relate the reaction rate with the solution electrochemical potential for homo-geneous water oxidation by [Ru(bpy)3]3+, catalyzed by the stable molecular tetraruthe-nium polyoxometalate [Ru4O4(OH)2(H2O)4(γ-SiW10O36)2]10−, Ru4POM. This POM was the first fully inorganic (carbon-free), thus oxidatively robust, water oxidation catalyst (WOC), which is also hydrolytically stable over a wide pH range (pH 1–9) [14,15]. Detailed electrochemical studies of this complex showed that the rates of electron exchange be-tween an electrode and the complex is sluggish under typical catalytic turnover conditions [14,16]. As a result, neither the Tafel plot nor the exchange current density, i0, can be meas-ured experimentally. At the same time, the catalyst shows excellent activity in homogene-ous aqueous solutions when stoichiometric oxidants such as Ce(IV) or [Ru(bpy)3]3+ are used. The question was posed as to whether data collected in homogeneous multielectron processes can be used to obtain a Tafel-like plot. This study addresses that question and aims to focus on the adaptation of an analog of traditional Tafel plots to the four-electron water oxidation process specific to homogeneous species.
2. Results and Discussion 2.1. Theoretical Considerations
Here, we assume that water oxidation in homogeneous conditions proceeds through four fast Nernstian reversible electron transfer steps followed by the irreversible O2 for-mation step, Equations (5–8), where C0 is the resting oxidation state of the catalyst, C, and C1–C4 are the one- to four-electron oxidized forms of the catalyst.
C0 − e ⇄ C1 Eo1 (5)
C1 − e ⇄ C2 Eo2 (6)
C2 − e ⇄ C3 Eo3 (7)
C3 − e ⇄ C4 Eo4 (8)
C4 + 2 H2O ⟶ C0 + O2 + 4 H+ ko (9)
If the equilibria are fast, then an applied and electrochemical solution potential, E, is linked via the Nernst equation, Equation (10):
C4 Eo4 (8)
C4 + 2 H2O→ C0 + O2 + 4 H+ ko (9)
If the equilibria are fast, then an applied and electrochemical solution potential, E, islinked via the Nernst equation, Equation (10):
E − Eo1 = (RT/F) × ln([C1]/[C0]), E − Eo
2 = (RT/F) × ln([C2]/[C1]), E − Eo3 = (RT/F) × ln([C3]/[C2]),
E − Eo4 = (RT/F) × ln([C4]/[C3]),
(10)
Catalysts 2021, 11, 87 3 of 11
where R is the universal gas constant, T is the temperature, and F is the Faraday constant.The concentration of the catalyst in oxidation state i = 0 − 4 is described by a distributionfunction, Equation (11):
αi = [Ci]/[Ct] × [exp(F(iE − ∑i0 Eo
i )/RT)]/[1 + exp[F(E − ∑10 Eo
j )/RT] + exp[F(2E − ∑20 Eo
j )RT]+ exp[F(3E − ∑3
0 Eoj )/RT] + exp[(4E − ∑4
0 Eoj )/RT],
(11)
where [Ct] = total concentration of the catalyst.If a stoichiometric oxidant is used as a sacrificial electron acceptor, the Nernst law
gives the applied potential equal to the solution potential. Here, we consider the casewhen [Ru(bpy)3]3+, Ru3, is an oxidant (Ru2 represents [Ru(bpy)3]2+). The electrochemicalsolution potential, E, created by this oxidant is:
E = E′0 + 0.059 × log10 ([Ru3]/[Ru2]) = E′0 + 0.059 × log10 ([Ru3]/([Ru3]o −[Ru2]+[Ru2]o)),
(12)
where E′0 = 1.26 V (SHE) is the standard reduction potential of the Ru3/Ru2 couple, and[Ru3]o and [Ru2]o are the initial concentrations of Ru3 and Ru2, respectively.
If the rate limiting step is Equation (9), then the reaction rate (current) is:
−d[Ru3]/dt = 4ko[C4] = TOFapp × [Ct] (13)
and the apparent turnover frequency (TOFapp) with respect to Ru3 consumption is:
TOFapp = 4α4 ko (14)
Here, ko is the rate constant for the oxidation of water. The value of the distribution factor,α4 is time-dependent and can be determined from Equations (10) and (11), and TOFapp is akinetic parameter. The full equation linking TOFapp and apparent potential is complex, butcan be simplified if ko is known and [Ru2]o = 0, Equation (15):
log10(TOFapp) ≈ log10(4ko) + E′0 + 0.059 × log10 ([Ru3]/([Ru3]o − [Ru3])) − 4E (15)
At high applied potentials, [C4] ≈ [Ct] and TOFapp reaches a plateau with the value 4ko.This value is the maximum turnover frequency (TOF) achievable by a given catalyst. Thisis an intrinsic property of a catalyst and its associated turnover activity. However, TOF0of a certain catalytic system can be achieved at different potentials, ETOF. As a result, thecatalytic activity of two systems cannot be compared by a single number such as TOF0.Two parameters, TOF0 and ETOF, are required to describe the catalytic activity. The slope ofthe Tafel-like plot at moderate potentials is a complex dependence of the catalyst reductionpotentials and the Ru3 concentration. In our homogeneous catalytic system, Ru3 is usedas a stoichiometric electron acceptor. Ru3 can also be generated in situ in a photoinducedreaction of Ru2 with persulfate, S2O8
2−, or electrochemically.
2.2. Homogeneous Electrochemical Reactions in the Presense of an Electron Transfer Catalyst
As the electron transfer from Ru4POM to the electrode is slow, we attempted toaccelerate the overall reaction with the addition of an electron transfer catalyst.
The stability of Ru3 is well documented to increase at lower pH. Therefore, the cyclicvoltammetry (CV) was recorded at a slightly lower pH of 7.2. The CV of Ru3/Ru2 hasan almost ideal shape with an anodic-cathodic peak separation of 69 mV and a ratio ofanodic and cathodic current close to 1; E1/2 = 1.26 V (versus SHE) in 80 mM sodiumphosphate buffer at pH 7.2. The addition of 15 µM of Ru4POM to 1.0 mM Ru2 resultsin a slight increase in anodic current (Figure 1), indicating that the reaction betweenRu3 and Ru4POM takes place. At higher concentration, Ru4POM forms an insolubleadduct with Ru2, which does not allow CV measurements over a broad range of catalystconcentrations. A foot of the wave analysis cannot be applied, as no catalytic current is
Catalysts 2021, 11, 87 4 of 11
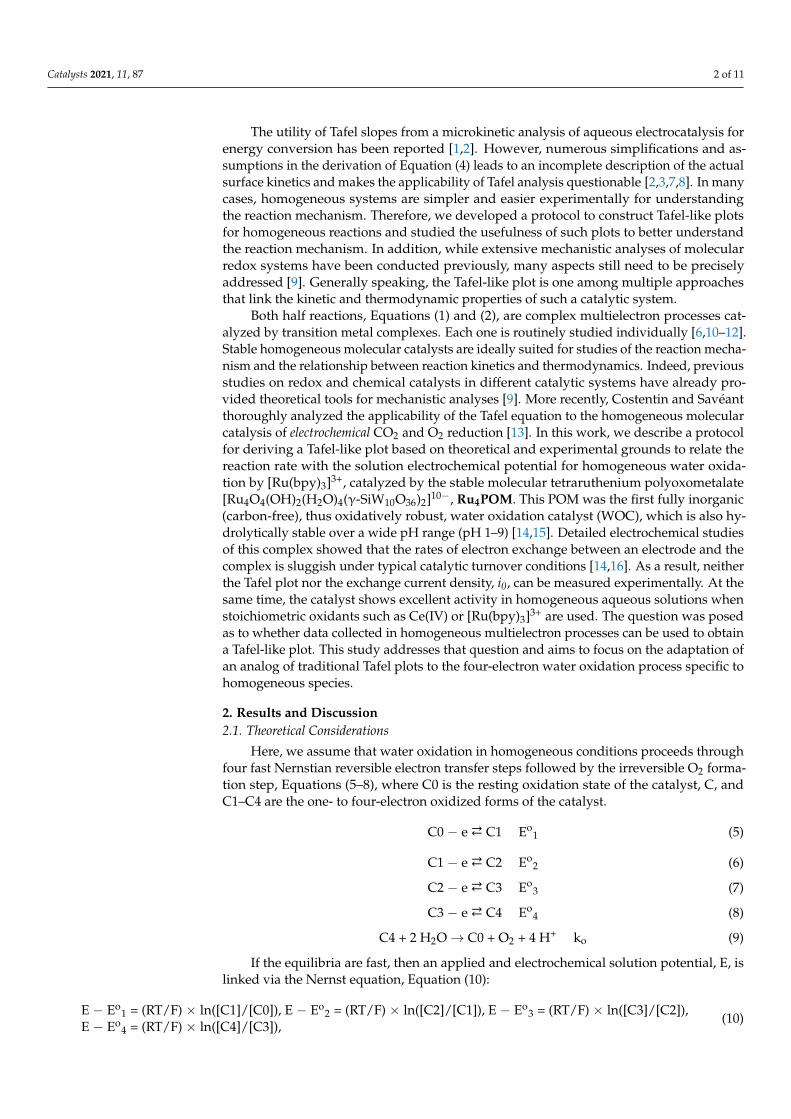
seen in this system [17]. The CV simulation with the SIM4YOU software package usingthe heterogeneous electron transfer reaction rate constant 0.065 cm s−1 (measured in 0.1 MH2SO4) [18] for Ru3 and a glassy carbon electrode (surface area is 0.0668 cm2) is in goodagreement with the experiment under the assumption of irreversible oxidation of Ru3at the electrode at a potential of 1840 mV vs. SHE (Figure 1). The simulation results inthe presence of Ru4POM is also in reasonable agreement with the experiment when thereaction mechanism and rate constants described below are applied. Clearly, simple cyclicvoltammograms do not provide much information on Ru4POM redox potentials.
Catalysts 2021, 11, x FOR PEER REVIEW 4 of 11
system [17]. The CV simulation with the SIM4YOU software package using the heteroge-neous electron transfer reaction rate constant 0.065 cm s−1 (measured in 0.1 M H2SO4) [18] for Ru3 and a glassy carbon electrode (surface area is 0.0668 cm2) is in good agreement with the experiment under the assumption of irreversible oxidation of Ru3 at the electrode at a potential of 1840 mV vs. SHE (Figure 1). The simulation results in the presence of Ru4POM is also in reasonable agreement with the experiment when the reaction mecha-nism and rate constants described below are applied. Clearly, simple cyclic voltammo-grams do not provide much information on Ru4POM redox potentials.
Figure 1. Cyclic voltammograms of 1.0 mM [Ru(bpy)3]Cl2 in 80 mM sodium phosphate at pH 7.2 (red) and in the presence of 15 μM Ru4POM (blue); the simulated curves are dotted lines. Scan rate, 100 mV/s; potential versus SHE.
2.3. Linear Sweep Voltammetry Linear sweep voltammetry (LSV) at very low scan rate with vigorous stirring of the
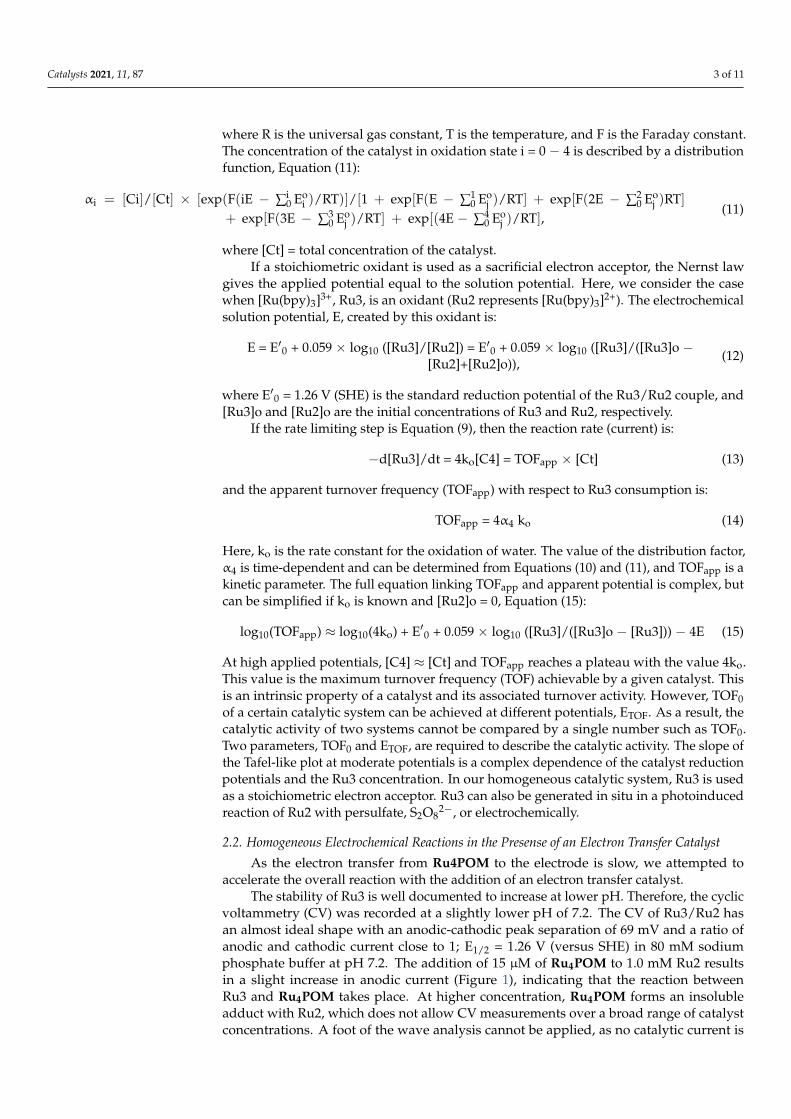
solution is commonly used to obtain the dependence of the potential as a function of the logarithm of the current (Tafel equation). The experimental LSV curves are shown in Figure 2a. We then plotted the applied potential (in the range 900–1200 mV) as a function of the current normalized per concentration of added [Ru4POM] (an analog of TOF) in Figure 2b.
(a) (b)
Figure 2. (a) Linear sweep voltammograms with stirring at a scan rate 3.0 mV/s of 1.0 mM [Ru(bpy)3]Cl2 in 80 mM sodium phosphate at pH 7.2. [Ru4POM]: 0 (black), 5 (red), 10 (blue), and 15 μM (green and orange); (b) Tafel plot in the range of potentials between 900 and 1200 mV.
The “Tafel slope” in the range of potentials between 900 and 1200 mV is ~120 mV/dec-ade (Figure 2) for three different Ru4POM concentrations. Based on the formal interpre-tation of the Tafel equation, this slope is consistent with α = 0.5 and a one-electron process.
Figure 1. Cyclic voltammograms of 1.0 mM [Ru(bpy)3]Cl2 in 80 mM sodium phosphate at pH 7.2(red) and in the presence of 15 µM Ru4POM (blue); the simulated curves are dotted lines. Scan rate,100 mV/s; potential versus SHE.
2.3. Linear Sweep Voltammetry
Linear sweep voltammetry (LSV) at very low scan rate with vigorous stirring of thesolution is commonly used to obtain the dependence of the potential as a function ofthe logarithm of the current (Tafel equation). The experimental LSV curves are shown inFigure 2a. We then plotted the applied potential (in the range 900–1200 mV) as a functionof the current normalized per concentration of added [Ru4POM] (an analog of TOF) inFigure 2b.
Catalysts 2021, 11, x FOR PEER REVIEW 4 of 11
system [17]. The CV simulation with the SIM4YOU software package using the heteroge-neous electron transfer reaction rate constant 0.065 cm s−1 (measured in 0.1 M H2SO4) [18] for Ru3 and a glassy carbon electrode (surface area is 0.0668 cm2) is in good agreement with the experiment under the assumption of irreversible oxidation of Ru3 at the electrode at a potential of 1840 mV vs. SHE (Figure 1). The simulation results in the presence of Ru4POM is also in reasonable agreement with the experiment when the reaction mecha-nism and rate constants described below are applied. Clearly, simple cyclic voltammo-grams do not provide much information on Ru4POM redox potentials.
Figure 1. Cyclic voltammograms of 1.0 mM [Ru(bpy)3]Cl2 in 80 mM sodium phosphate at pH 7.2 (red) and in the presence of 15 μM Ru4POM (blue); the simulated curves are dotted lines. Scan rate, 100 mV/s; potential versus SHE.
2.3. Linear Sweep Voltammetry Linear sweep voltammetry (LSV) at very low scan rate with vigorous stirring of the
solution is commonly used to obtain the dependence of the potential as a function of the logarithm of the current (Tafel equation). The experimental LSV curves are shown in Figure 2a. We then plotted the applied potential (in the range 900–1200 mV) as a function of the current normalized per concentration of added [Ru4POM] (an analog of TOF) in Figure 2b.
(a) (b)
Figure 2. (a) Linear sweep voltammograms with stirring at a scan rate 3.0 mV/s of 1.0 mM [Ru(bpy)3]Cl2 in 80 mM sodium phosphate at pH 7.2. [Ru4POM]: 0 (black), 5 (red), 10 (blue), and 15 μM (green and orange); (b) Tafel plot in the range of potentials between 900 and 1200 mV.
The “Tafel slope” in the range of potentials between 900 and 1200 mV is ~120 mV/dec-ade (Figure 2) for three different Ru4POM concentrations. Based on the formal interpre-tation of the Tafel equation, this slope is consistent with α = 0.5 and a one-electron process.
Figure 2. (a) Linear sweep voltammograms with stirring at a scan rate 3.0 mV/s of 1.0 mM[Ru(bpy)3]Cl2 in 80 mM sodium phosphate at pH 7.2. [Ru4POM]: 0 (black), 5 (red), 10 (blue),and 15 µM (green and orange); (b) Tafel plot in the range of potentials between 900 and 1200 mV.
The “Tafel slope” in the range of potentials between 900 and 1200 mV is ~120 mV/decade(Figure 2) for three different Ru4POM concentrations. Based on the formal interpretation ofthe Tafel equation, this slope is consistent with α = 0.5 and a one-electron process. However,
Catalysts 2021, 11, 87 5 of 11
as the theory of such measurements is not yet developed for a homogeneous WOC system,the meaning of this slope value is unclear.
2.4. Tafel Plot from Kinetic Curves in Homogeneous Systems
The kinetics of water oxidation by Ru3 can be followed either by measuring oxygenformation or by the consumption/formation of Ru3/Ru2. The consumption of Ru3 can befollowed by a decrease in absorbance at 670–680 nm (ε = 420 M−1cm−1) [14]. The reactionis fast and requires a stopped-flow instrument to collect high-quality kinetics data. Theexperimental details were described in our previous publications [14,19]. Both Ru2 andRu4POM slightly absorb light at 680 nm, which must and can be taken into account forquantitative analysis of raw experimental data. Here for simplicity, a kinetic curve of [Ru3]consumption versus time is the decrease in absorbance at 680 nm. At a given time t, thereaction rate can be approximated as d[Ru3]/dt ≈ ([Ru3](t − ∆t) − [Ru3]t + ∆t))/2∆t andTOFap = (d[Ru3]/dt)/[Ct] can be quantified ([Ct] is the total concentration of Ru4POM). Wemake the reasonable assumption, based on our earlier studies, that the reaction mechanismis Equations (5)–(9). If reversible reactions are in equilibrium and [Ct] << [Ru3], then theelectrochemical solution potential at time t can be calculated from the Nernst equationE = E′0 + 0.059 × log10(([Ru3]t/([Ru3]0 − [Ru3]t)), where E′0 = 1.26 V is the standard re-duction potential of the [Ru3]/[Ru2] couple, and [Ru3]0 is the initial concentration of Ru3.As Ru3/Ru2 and Ru4POM have large and opposite charges, their reduction potentials andthe rates of their intermolecular reactions are ionic-strength-dependent. In order to keeppH constant, the use of buffered solutions is required. However, even low concentrations ofsodium phosphate buffer (e.g., 25 mM) create a high ionic strength (µ ~ 75 mM). Therefore,in this work, we use the experimentally determined value of the reduction potential forthe Ru2/Ru3 couple as the reference point in all calculations (e.g., 1.06 V versus 3.0 MNaCl Ag/AgCl reference electrode). We define TOF as (d[Ru3]/dt)/[Ct]. This procedureconverts a single kinetic curve to the dependence of TOF on applied potentials.
The self-decomposition of Ru3 is relatively slow at pH 7.0–8.0, and the O2 yieldapproaches 80% of the theoretical value at [Ru4POM] > 5 µM. Therefore, the kineticsof [Ru(bpy)3]3+ consumption can be considered as the kinetics of water oxidation. Thebeginning of kinetic curves (up to 15% conversion) has the highest Ru3/Ru2 ratio, whichquickly changes with time and makes the rate measurements problematic.
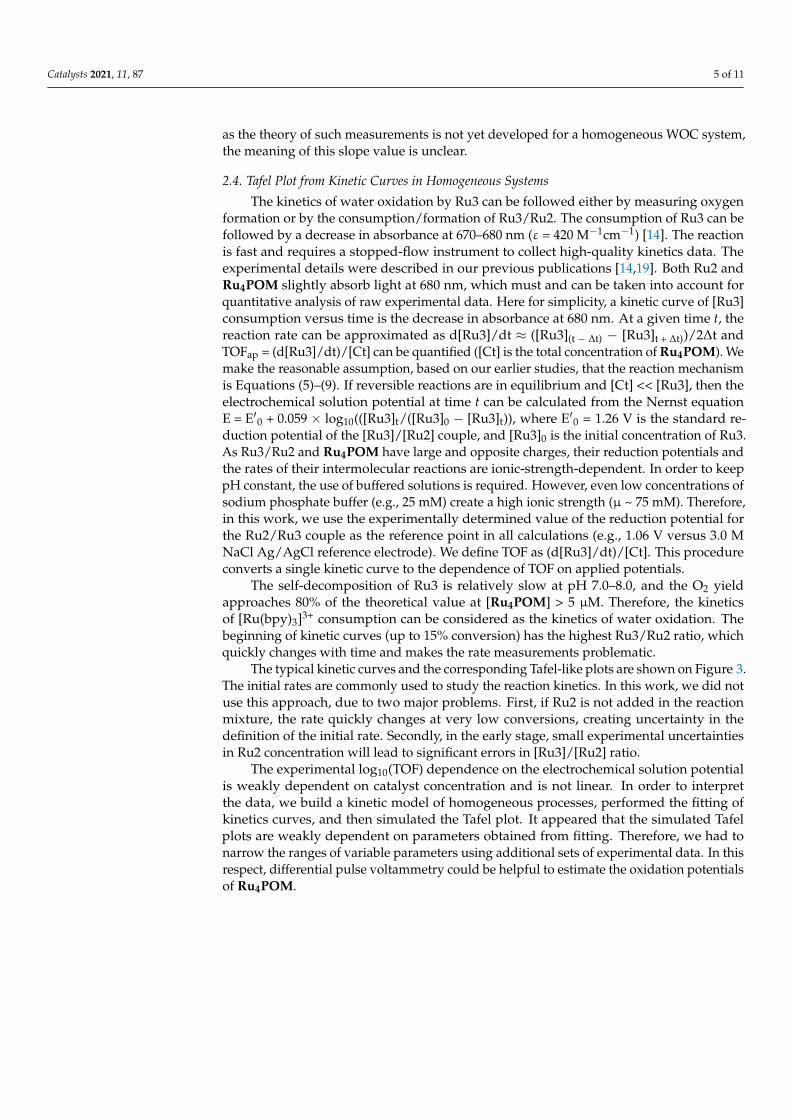
The typical kinetic curves and the corresponding Tafel-like plots are shown on Figure 3.The initial rates are commonly used to study the reaction kinetics. In this work, we did notuse this approach, due to two major problems. First, if Ru2 is not added in the reactionmixture, the rate quickly changes at very low conversions, creating uncertainty in thedefinition of the initial rate. Secondly, in the early stage, small experimental uncertaintiesin Ru2 concentration will lead to significant errors in [Ru3]/[Ru2] ratio.
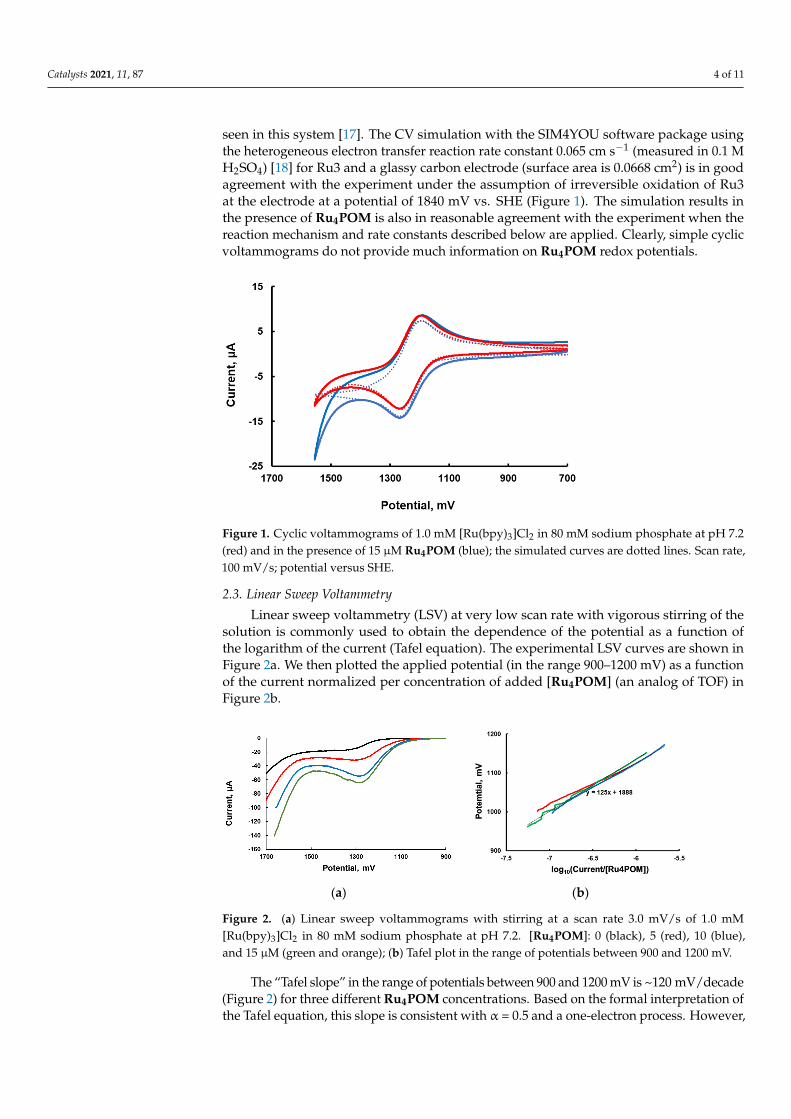
The experimental log10(TOF) dependence on the electrochemical solution potentialis weakly dependent on catalyst concentration and is not linear. In order to interpretthe data, we build a kinetic model of homogeneous processes, performed the fitting ofkinetics curves, and then simulated the Tafel plot. It appeared that the simulated Tafelplots are weakly dependent on parameters obtained from fitting. Therefore, we had tonarrow the ranges of variable parameters using additional sets of experimental data. In thisrespect, differential pulse voltammetry could be helpful to estimate the oxidation potentialsof Ru4POM.
Catalysts 2021, 11, 87 6 of 11
Catalysts 2021, 11, x FOR PEER REVIEW 5 of 11
However, as the theory of such measurements is not yet developed for a homogeneousWOC system, the meaning of this slope value is unclear.
2.4. Tafel Plot from Kinetic Curves in Homogeneous Systems The kinetics of water oxidation by Ru3 can be followed either by measuring oxygen
formation or by the consumption/formation of Ru3/Ru2. The consumption of Ru3 can be followed by a decrease in absorbance at 670–680 nm (ε = 420 M−1cm−1) [14]. The reaction is fast and requires a stopped-flow instrument to collect high-quality kinetics data. The ex-perimental details were described in our previous publications [14,19]. Both Ru2 and Ru4POM slightly absorb light at 680 nm, which must and can be taken into account for quantitative analysis of raw experimental data. Here for simplicity, a kinetic curve of [Ru3] consumption versus time is the decrease in absorbance at 680 nm. At a given time t, the reaction rate can be approximated as d[Ru3]/dt ≈ ([Ru3](t − Δt) − [Ru3]t + Δt))/2Δt and TOFap
= (d[Ru3]/dt)/[Ct] can be quantified ([Ct] is the total concentration of Ru4POM). We make the reasonable assumption, based on our earlier studies, that the reaction mechanism is Equations (5)–(9). If reversible reactions are in equilibrium and [Ct] << [Ru3], then theelectrochemical solution potential at time t can be calculated from the Nernst equation E = E’0 + 0.059×log10(([Ru3]t/([Ru3]0 − [Ru3]t)), where E’0 = 1.26 V is the standard reduction potential of the [Ru3]/[Ru2] couple, and [Ru3]0 is the initial concentration of Ru3. AsRu3/Ru2 and Ru4POM have large and opposite charges, their reduction potentials and the rates of their intermolecular reactions are ionic-strength-dependent. In order to keep pH constant, the use of buffered solutions is required. However, even low concentrations of sodium phosphate buffer (e.g., 25 mM) create a high ionic strength (μ ~ 75 mM). There-fore, in this work, we use the experimentally determined value of the reduction potential for the Ru2/Ru3 couple as the reference point in all calculations (e.g., 1.06 V versus 3.0 M NaCl Ag/AgCl reference electrode). We define TOF as (d[Ru3]/dt)/[Ct]. This procedure converts a single kinetic curve to the dependence of TOF on applied potentials.
The self-decomposition of Ru3 is relatively slow at pH 7.0–8.0, and the O2 yield ap-proaches 80% of the theoretical value at [Ru4POM] > 5 μM. Therefore, the kinetics of [Ru(bpy)3]3+ consumption can be considered as the kinetics of water oxidation. The begin-ning of kinetic curves (up to 15% conversion) has the highest Ru3/Ru2 ratio, which quickly changes with time and makes the rate measurements problematic.
The typical kinetic curves and the corresponding Tafel-like plots are shown on Figure 3. The initial rates are commonly used to study the reaction kinetics. In this work, we did not use this approach, due to two major problems. First, if Ru2 is not added in the reaction mixture, the rate quickly changes at very low conversions, creating uncertainty in the def-inition of the initial rate. Secondly, in the early stage, small experimental uncertainties in Ru2 concentration will lead to significant errors in [Ru3]/[Ru2] ratio.
(a) (b)
Figure 3. (a) The kinetics of [Ru(bpy)3]3+ consumption measured at 670 nm. Sodium borate buffer (25 mM) at pH 8.0, 0.85 mM [Ru(bpy)3]3+, Ru4POM—0 (orange), 2.5 (blue), 5.0 (red), and 10 μM (green). The fitting using Copasi software to the mechanism in Equations (15)–(21) is in solid lines[20]; (b) turnover frequency (TOF) and potential are calculated as described in the text. The brown
Figure 3. (a) The kinetics of [Ru(bpy)3]3+ consumption measured at 670 nm. Sodium borate buffer (25 mM) at pH 8.0,0.85 mM [Ru(bpy)3]3+, Ru4POM—0 (orange), 2.5 (blue), 5.0 (red), and 10 µM (green). The fitting using Copasi software tothe mechanism in Equations (15)–(21) is in solid lines [20]; (b) turnover frequency (TOF) and potential are calculated asdescribed in the text. The brown line is calculated using Equation (15). The black line is generated by Copasi software withthe same parameters as in (a).
2.5. Differential Pulse Voltammetry
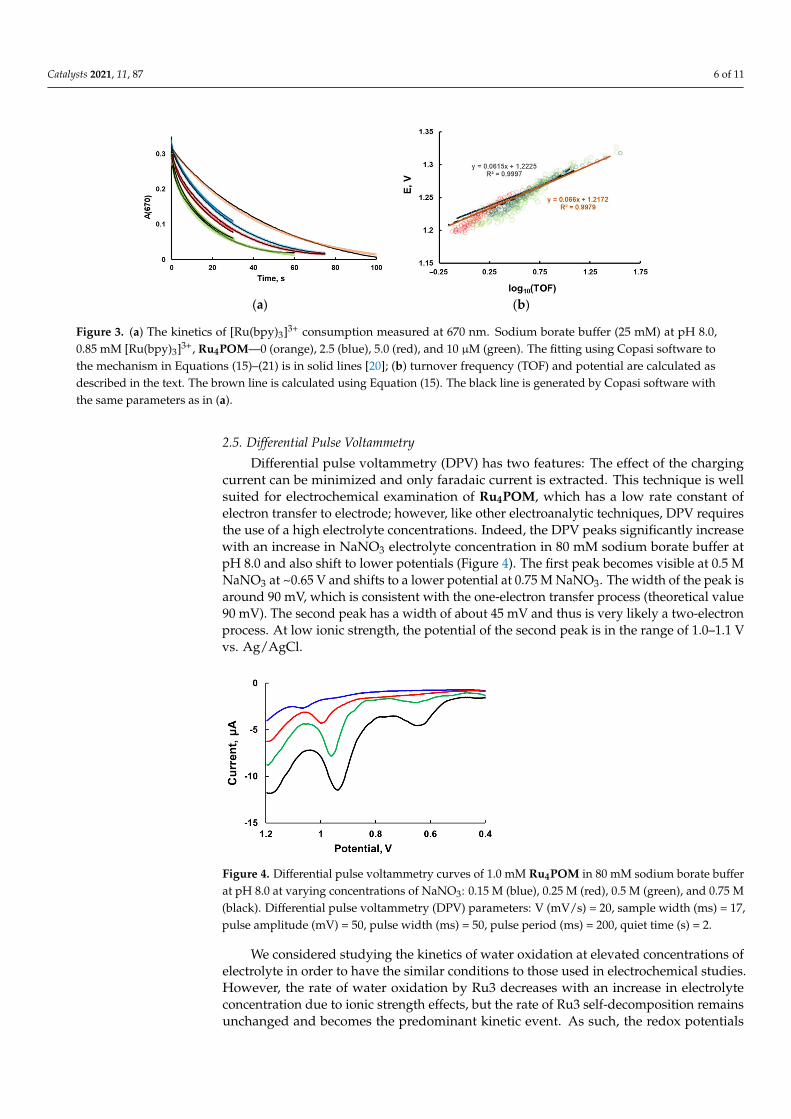
Differential pulse voltammetry (DPV) has two features: The effect of the chargingcurrent can be minimized and only faradaic current is extracted. This technique is wellsuited for electrochemical examination of Ru4POM, which has a low rate constant ofelectron transfer to electrode; however, like other electroanalytic techniques, DPV requiresthe use of a high electrolyte concentrations. Indeed, the DPV peaks significantly increasewith an increase in NaNO3 electrolyte concentration in 80 mM sodium borate buffer atpH 8.0 and also shift to lower potentials (Figure 4). The first peak becomes visible at 0.5 MNaNO3 at ~0.65 V and shifts to a lower potential at 0.75 M NaNO3. The width of the peak isaround 90 mV, which is consistent with the one-electron transfer process (theoretical value90 mV). The second peak has a width of about 45 mV and thus is very likely a two-electronprocess. At low ionic strength, the potential of the second peak is in the range of 1.0–1.1 Vvs. Ag/AgCl.
Catalysts 2021, 11, x FOR PEER REVIEW 6 of 11
line is calculated using Equation (15). The black line is generated by Copasi software with the same parameters as in (a).
The experimental log10(TOF) dependence on the electrochemical solution potential is weakly dependent on catalyst concentration and is not linear. In order to interpret the data, we build a kinetic model of homogeneous processes, performed the fitting of kinetics curves, and then simulated the Tafel plot. It appeared that the simulated Tafel plots are weakly dependent on parameters obtained from fitting. Therefore, we had to narrow the ranges of variable parameters using additional sets of experimental data. In this respect, differential pulse voltammetry could be helpful to estimate the oxidation potentials of Ru4POM.
2.5. Differential Pulse Voltammetry Differential pulse voltammetry (DPV) has two features: The effect of the charging
current can be minimized and only faradaic current is extracted. This technique is well suited for electrochemical examination of Ru4POM, which has a low rate constant of elec-tron transfer to electrode; however, like other electroanalytic techniques, DPV requires the use of a high electrolyte concentrations. Indeed, the DPV peaks significantly increase with an increase in NaNO3 electrolyte concentration in 80 mM sodium borate buffer at pH 8.0 and also shift to lower potentials (Figure 4). The first peak becomes visible at 0.5 M NaNO3 at ~0.65 V and shifts to a lower potential at 0.75 M NaNO3. The width of the peak is around 90 mV, which is consistent with the one-electron transfer process (theoretical value 90 mV). The second peak has a width of about 45 mV and thus is very likely a two-electron process. At low ionic strength, the potential of the second peak is in the range of 1.0–1.1 V vs. Ag/AgCl.
We considered studying the kinetics of water oxidation at elevated concentrations of electrolyte in order to have the similar conditions to those used in electrochemical studies. However, the rate of water oxidation by Ru3 decreases with an increase in electrolyte con-centration due to ionic strength effects, but the rate of Ru3 self-decomposition remains unchanged and becomes the predominant kinetic event. As such, the redox potentials measured by DPV could be extrapolated to low ionic strength to estimate the possible range of Ru4POM potentials.
Figure 4. Differential pulse voltammetry curves of 1.0 mM Ru4POM in 80 mM sodium borate buffer at pH 8.0 at varying concentrations of NaNO3: 0.15 M (blue), 0.25 M (red), 0.5 M (green), and 0.75 M (black). Differential pulse voltammetry (DPV) parameters: V (mV/s) = 20, sample width (ms) = 17, pulse amplitude (mV) = 50, pulse width (ms) = 50, pulse period (ms) = 200, quiet time (s) = 2.
2.6. Kinetic Model of Homogeneous Water Oxidation by [Ru(bpy)3]3+ Catalyzed by Ru4POM Having information on the range of redox potentials of Ru4POM and making mini-
mal assumptions, the mechanism in Equations (16)–(22) is proposed:
Figure 4. Differential pulse voltammetry curves of 1.0 mM Ru4POM in 80 mM sodium borate bufferat pH 8.0 at varying concentrations of NaNO3: 0.15 M (blue), 0.25 M (red), 0.5 M (green), and 0.75 M(black). Differential pulse voltammetry (DPV) parameters: V (mV/s) = 20, sample width (ms) = 17,pulse amplitude (mV) = 50, pulse width (ms) = 50, pulse period (ms) = 200, quiet time (s) = 2.
We considered studying the kinetics of water oxidation at elevated concentrations ofelectrolyte in order to have the similar conditions to those used in electrochemical studies.However, the rate of water oxidation by Ru3 decreases with an increase in electrolyteconcentration due to ionic strength effects, but the rate of Ru3 self-decomposition remainsunchanged and becomes the predominant kinetic event. As such, the redox potentials
Catalysts 2021, 11, 87 7 of 11
measured by DPV could be extrapolated to low ionic strength to estimate the possiblerange of Ru4POM potentials.
2.6. Kinetic Model of Homogeneous Water Oxidation by [Ru(bpy)3]3+ Catalyzed by Ru4POM
Having information on the range of redox potentials of Ru4POM and making minimalassumptions, the mechanism in Equations (16)–(22) is proposed:
C0 + Ru3
Catalysts 2021, 11, x FOR PEER REVIEW 2 of 11
where η = E − E0 is the difference between the electrode and standard potentials, i is the current density, and b is the Tafel slope.
The utility of Tafel slopes from a microkinetic analysis of aqueous electrocatalysis for energy conversion has been reported [1,2]. However, numerous simplifications and as-sumptions in the derivation of Equation (4) leads to an incomplete description of the ac-tual surface kinetics and makes the applicability of Tafel analysis questionable [2,3,7,8]. In many cases, homogeneous systems are simpler and easier experimentally for understand-ing the reaction mechanism. Therefore, we developed a protocol to construct Tafel-like plots for homogeneous reactions and studied the usefulness of such plots to better under-stand the reaction mechanism. In addition, while extensive mechanistic analyses of mo-lecular redox systems have been conducted previously, many aspects still need to be pre-cisely addressed [9]. Generally speaking, the Tafel-like plot is one among multiple ap-proaches that link the kinetic and thermodynamic properties of such a catalytic system.
Both half reactions, Equations (1) and (2), are complex multielectron processes cata-lyzed by transition metal complexes. Each one is routinely studied individually [6,10–12]. Stable homogeneous molecular catalysts are ideally suited for studies of the reaction mechanism and the relationship between reaction kinetics and thermodynamics. Indeed, previous studies on redox and chemical catalysts in different catalytic systems have al-ready provided theoretical tools for mechanistic analyses [9]. More recently, Costentin and Savéant thoroughly analyzed the applicability of the Tafel equation to the homoge-neous molecular catalysis of electrochemical CO2 and O2 reduction [13]. In this work, we describe a protocol for deriving a Tafel-like plot based on theoretical and experimental grounds to relate the reaction rate with the solution electrochemical potential for homo-geneous water oxidation by [Ru(bpy)3]3+, catalyzed by the stable molecular tetraruthe-nium polyoxometalate [Ru4O4(OH)2(H2O)4(γ-SiW10O36)2]10−, Ru4POM. This POM was the first fully inorganic (carbon-free), thus oxidatively robust, water oxidation catalyst (WOC), which is also hydrolytically stable over a wide pH range (pH 1–9) [14,15]. Detailed electrochemical studies of this complex showed that the rates of electron exchange be-tween an electrode and the complex is sluggish under typical catalytic turnover conditions [14,16]. As a result, neither the Tafel plot nor the exchange current density, i0, can be meas-ured experimentally. At the same time, the catalyst shows excellent activity in homogene-ous aqueous solutions when stoichiometric oxidants such as Ce(IV) or [Ru(bpy)3]3+ are used. The question was posed as to whether data collected in homogeneous multielectron processes can be used to obtain a Tafel-like plot. This study addresses that question and aims to focus on the adaptation of an analog of traditional Tafel plots to the four-electron water oxidation process specific to homogeneous species.
2. Results and Discussion 2.1. Theoretical Considerations
Here, we assume that water oxidation in homogeneous conditions proceeds through four fast Nernstian reversible electron transfer steps followed by the irreversible O2 for-mation step, Equations (5–8), where C0 is the resting oxidation state of the catalyst, C, and C1–C4 are the one- to four-electron oxidized forms of the catalyst.
C0 − e ⇄ C1 Eo1 (5)
C1 − e ⇄ C2 Eo2 (6)
C2 − e ⇄ C3 Eo3 (7)
C3 − e ⇄ C4 Eo4 (8)
C4 + 2 H2O ⟶ C0 + O2 + 4 H+ ko (9)
If the equilibria are fast, then an applied and electrochemical solution potential, E, is linked via the Nernst equation, Equation (10):
C1 + Ru2 k1 = 1 × 10¹⁰; k−1 = 10 M−1s−1; K1 = 1 × 10⁹; ∆E1 = −0.61V (16)
C1 + Ru3
Catalysts 2021, 11, x FOR PEER REVIEW 2 of 11
where η = E − E0 is the difference between the electrode and standard potentials, i is the current density, and b is the Tafel slope.
The utility of Tafel slopes from a microkinetic analysis of aqueous electrocatalysis for energy conversion has been reported [1,2]. However, numerous simplifications and as-sumptions in the derivation of Equation (4) leads to an incomplete description of the ac-tual surface kinetics and makes the applicability of Tafel analysis questionable [2,3,7,8]. In many cases, homogeneous systems are simpler and easier experimentally for understand-ing the reaction mechanism. Therefore, we developed a protocol to construct Tafel-like plots for homogeneous reactions and studied the usefulness of such plots to better under-stand the reaction mechanism. In addition, while extensive mechanistic analyses of mo-lecular redox systems have been conducted previously, many aspects still need to be pre-cisely addressed [9]. Generally speaking, the Tafel-like plot is one among multiple ap-proaches that link the kinetic and thermodynamic properties of such a catalytic system.
Both half reactions, Equations (1) and (2), are complex multielectron processes cata-lyzed by transition metal complexes. Each one is routinely studied individually [6,10–12]. Stable homogeneous molecular catalysts are ideally suited for studies of the reaction mechanism and the relationship between reaction kinetics and thermodynamics. Indeed, previous studies on redox and chemical catalysts in different catalytic systems have al-ready provided theoretical tools for mechanistic analyses [9]. More recently, Costentin and Savéant thoroughly analyzed the applicability of the Tafel equation to the homoge-neous molecular catalysis of electrochemical CO2 and O2 reduction [13]. In this work, we describe a protocol for deriving a Tafel-like plot based on theoretical and experimental grounds to relate the reaction rate with the solution electrochemical potential for homo-geneous water oxidation by [Ru(bpy)3]3+, catalyzed by the stable molecular tetraruthe-nium polyoxometalate [Ru4O4(OH)2(H2O)4(γ-SiW10O36)2]10−, Ru4POM. This POM was the first fully inorganic (carbon-free), thus oxidatively robust, water oxidation catalyst (WOC), which is also hydrolytically stable over a wide pH range (pH 1–9) [14,15]. Detailed electrochemical studies of this complex showed that the rates of electron exchange be-tween an electrode and the complex is sluggish under typical catalytic turnover conditions [14,16]. As a result, neither the Tafel plot nor the exchange current density, i0, can be meas-ured experimentally. At the same time, the catalyst shows excellent activity in homogene-ous aqueous solutions when stoichiometric oxidants such as Ce(IV) or [Ru(bpy)3]3+ are used. The question was posed as to whether data collected in homogeneous multielectron processes can be used to obtain a Tafel-like plot. This study addresses that question and aims to focus on the adaptation of an analog of traditional Tafel plots to the four-electron water oxidation process specific to homogeneous species.
2. Results and Discussion 2.1. Theoretical Considerations
Here, we assume that water oxidation in homogeneous conditions proceeds through four fast Nernstian reversible electron transfer steps followed by the irreversible O2 for-mation step, Equations (5–8), where C0 is the resting oxidation state of the catalyst, C, and C1–C4 are the one- to four-electron oxidized forms of the catalyst.
C0 − e ⇄ C1 Eo1 (5)
C1 − e ⇄ C2 Eo2 (6)
C2 − e ⇄ C3 Eo3 (7)
C3 − e ⇄ C4 Eo4 (8)
C4 + 2 H2O ⟶ C0 + O2 + 4 H+ ko (9)
If the equilibria are fast, then an applied and electrochemical solution potential, E, is linked via the Nernst equation, Equation (10):
C2 + Ru2 k2 = 1 × 10¹⁰; k−2 = (4.6 ± 8) × 105 M−1s−1; K2 = 2.2 × 10⁴; ∆E2 = −0.26 V (17)
C2 + Ru3
Catalysts 2021, 11, x FOR PEER REVIEW 2 of 11
where η = E − E0 is the difference between the electrode and standard potentials, i is the current density, and b is the Tafel slope.
The utility of Tafel slopes from a microkinetic analysis of aqueous electrocatalysis for energy conversion has been reported [1,2]. However, numerous simplifications and as-sumptions in the derivation of Equation (4) leads to an incomplete description of the ac-tual surface kinetics and makes the applicability of Tafel analysis questionable [2,3,7,8]. In many cases, homogeneous systems are simpler and easier experimentally for understand-ing the reaction mechanism. Therefore, we developed a protocol to construct Tafel-like plots for homogeneous reactions and studied the usefulness of such plots to better under-stand the reaction mechanism. In addition, while extensive mechanistic analyses of mo-lecular redox systems have been conducted previously, many aspects still need to be pre-cisely addressed [9]. Generally speaking, the Tafel-like plot is one among multiple ap-proaches that link the kinetic and thermodynamic properties of such a catalytic system.
Both half reactions, Equations (1) and (2), are complex multielectron processes cata-lyzed by transition metal complexes. Each one is routinely studied individually [6,10–12]. Stable homogeneous molecular catalysts are ideally suited for studies of the reaction mechanism and the relationship between reaction kinetics and thermodynamics. Indeed, previous studies on redox and chemical catalysts in different catalytic systems have al-ready provided theoretical tools for mechanistic analyses [9]. More recently, Costentin and Savéant thoroughly analyzed the applicability of the Tafel equation to the homoge-neous molecular catalysis of electrochemical CO2 and O2 reduction [13]. In this work, we describe a protocol for deriving a Tafel-like plot based on theoretical and experimental grounds to relate the reaction rate with the solution electrochemical potential for homo-geneous water oxidation by [Ru(bpy)3]3+, catalyzed by the stable molecular tetraruthe-nium polyoxometalate [Ru4O4(OH)2(H2O)4(γ-SiW10O36)2]10−, Ru4POM. This POM was the first fully inorganic (carbon-free), thus oxidatively robust, water oxidation catalyst (WOC), which is also hydrolytically stable over a wide pH range (pH 1–9) [14,15]. Detailed electrochemical studies of this complex showed that the rates of electron exchange be-tween an electrode and the complex is sluggish under typical catalytic turnover conditions [14,16]. As a result, neither the Tafel plot nor the exchange current density, i0, can be meas-ured experimentally. At the same time, the catalyst shows excellent activity in homogene-ous aqueous solutions when stoichiometric oxidants such as Ce(IV) or [Ru(bpy)3]3+ are used. The question was posed as to whether data collected in homogeneous multielectron processes can be used to obtain a Tafel-like plot. This study addresses that question and aims to focus on the adaptation of an analog of traditional Tafel plots to the four-electron water oxidation process specific to homogeneous species.
2. Results and Discussion 2.1. Theoretical Considerations
Here, we assume that water oxidation in homogeneous conditions proceeds through four fast Nernstian reversible electron transfer steps followed by the irreversible O2 for-mation step, Equations (5–8), where C0 is the resting oxidation state of the catalyst, C, and C1–C4 are the one- to four-electron oxidized forms of the catalyst.
C0 − e ⇄ C1 Eo1 (5)
C1 − e ⇄ C2 Eo2 (6)
C2 − e ⇄ C3 Eo3 (7)
C3 − e ⇄ C4 Eo4 (8)
C4 + 2 H2O ⟶ C0 + O2 + 4 H+ ko (9)
If the equilibria are fast, then an applied and electrochemical solution potential, E, is linked via the Nernst equation, Equation (10):
C3 + Ru2 k3 = 1 × 10¹⁰; k−3 = (5.4 ± 9) × 105 M−1s−1; K3 = 1.8 × 10⁴; ∆E3 = −0.26 V (18)
C3 + Ru3
Catalysts 2021, 11, x FOR PEER REVIEW 2 of 11
where η = E − E0 is the difference between the electrode and standard potentials, i is the current density, and b is the Tafel slope.
The utility of Tafel slopes from a microkinetic analysis of aqueous electrocatalysis for energy conversion has been reported [1,2]. However, numerous simplifications and as-sumptions in the derivation of Equation (4) leads to an incomplete description of the ac-tual surface kinetics and makes the applicability of Tafel analysis questionable [2,3,7,8]. In many cases, homogeneous systems are simpler and easier experimentally for understand-ing the reaction mechanism. Therefore, we developed a protocol to construct Tafel-like plots for homogeneous reactions and studied the usefulness of such plots to better under-stand the reaction mechanism. In addition, while extensive mechanistic analyses of mo-lecular redox systems have been conducted previously, many aspects still need to be pre-cisely addressed [9]. Generally speaking, the Tafel-like plot is one among multiple ap-proaches that link the kinetic and thermodynamic properties of such a catalytic system.
Both half reactions, Equations (1) and (2), are complex multielectron processes cata-lyzed by transition metal complexes. Each one is routinely studied individually [6,10–12]. Stable homogeneous molecular catalysts are ideally suited for studies of the reaction mechanism and the relationship between reaction kinetics and thermodynamics. Indeed, previous studies on redox and chemical catalysts in different catalytic systems have al-ready provided theoretical tools for mechanistic analyses [9]. More recently, Costentin and Savéant thoroughly analyzed the applicability of the Tafel equation to the homoge-neous molecular catalysis of electrochemical CO2 and O2 reduction [13]. In this work, we describe a protocol for deriving a Tafel-like plot based on theoretical and experimental grounds to relate the reaction rate with the solution electrochemical potential for homo-geneous water oxidation by [Ru(bpy)3]3+, catalyzed by the stable molecular tetraruthe-nium polyoxometalate [Ru4O4(OH)2(H2O)4(γ-SiW10O36)2]10−, Ru4POM. This POM was the first fully inorganic (carbon-free), thus oxidatively robust, water oxidation catalyst (WOC), which is also hydrolytically stable over a wide pH range (pH 1–9) [14,15]. Detailed electrochemical studies of this complex showed that the rates of electron exchange be-tween an electrode and the complex is sluggish under typical catalytic turnover conditions [14,16]. As a result, neither the Tafel plot nor the exchange current density, i0, can be meas-ured experimentally. At the same time, the catalyst shows excellent activity in homogene-ous aqueous solutions when stoichiometric oxidants such as Ce(IV) or [Ru(bpy)3]3+ are used. The question was posed as to whether data collected in homogeneous multielectron processes can be used to obtain a Tafel-like plot. This study addresses that question and aims to focus on the adaptation of an analog of traditional Tafel plots to the four-electron water oxidation process specific to homogeneous species.
2. Results and Discussion 2.1. Theoretical Considerations
Here, we assume that water oxidation in homogeneous conditions proceeds through four fast Nernstian reversible electron transfer steps followed by the irreversible O2 for-mation step, Equations (5–8), where C0 is the resting oxidation state of the catalyst, C, and C1–C4 are the one- to four-electron oxidized forms of the catalyst.
C0 − e ⇄ C1 Eo1 (5)
C1 − e ⇄ C2 Eo2 (6)
C2 − e ⇄ C3 Eo3 (7)
C3 − e ⇄ C4 Eo4 (8)
C4 + 2 H2O ⟶ C0 + O2 + 4 H+ ko (9)
If the equilibria are fast, then an applied and electrochemical solution potential, E, is linked via the Nernst equation, Equation (10):
C4 + Ru2 k4 = (1.5±0.8) ×107; k−4 = (8.0 ± 4) × 108 M−1s−1; K4 = 0.2; ∆E4 = 0.10 V (19)
C4→ C0 + O2 k0 = 18 ± 2 s−1 (20)
Ru3→ Rux kd = 0.0023 ± 0.0005 s−1 (21)
10 Ru3 + Rux → 10 Ru2 + Pr kdd > 1 × 10⁵ M−1s−1 (22)
The latter two reactions are added to describe the rate and stoichiometry of the Ru3self-decomposition reaction in the absence of a catalyst. The values were determinedfrom the fitting of five kinetic curves and assuming the rate law for Equation (21) asd[Ru3]/dt = −kdd[Ru3][Rux]. It appeared that the overall reaction rate and O2 yield areindependent of kdd, if kdd > 1× 10⁵ M−1 s−1. We assumed that the very thermodynamicallyfavorable reactions between two reactants with opposite charges proceed with the diffusion-controlled rate constants 1 × 10¹⁰ M−1s−1. The optical density at 670 nm was calculated asA(670) = 420 × [Ru3] + 20 × [Ru2]). The results of the fitting are strongly dependent ondioxygen yield over the reaction time. Therefore, we used an additional set of experimentaldata. The dioxygen yield at 20 ± 2 s was measured to be 41, 60, and 85 µM in the presenceof 2.5, 5.0, and 10 µM Ru4POM, respectively. The calculated values of O2 were the sameas the experimental ones within a 5% range. For each concentration of Ru4POM, twokinetic curves with different reaction times were used. The results of the fitting are givenin Figure 3 and the values of the parameters are given in Equations (16)–(22). The values ofthe variable parameters are highlighted in italics. The standard deviations are generatedby the fitting software. As expected, the values of rate constants extracted by fitting have alarge error range due to the low number of experimental curves used in fitting. The increasein the numbers of curves requires much longer computing time and results in only a slightdecrease in accuracy of the extracted parameters. As the focus of this work is not the studyof the explicit reaction mechanism, we did not fit a large set of experimental curves.
It is important to note that the Tafel-like plot cannot be used to confirm a specifickinetic model. However, it can provide additional information about the activity of acatalytic system.
2.7. Comparison of Different Homogeneous Catalytic Systems Using Tafel-Like Plots
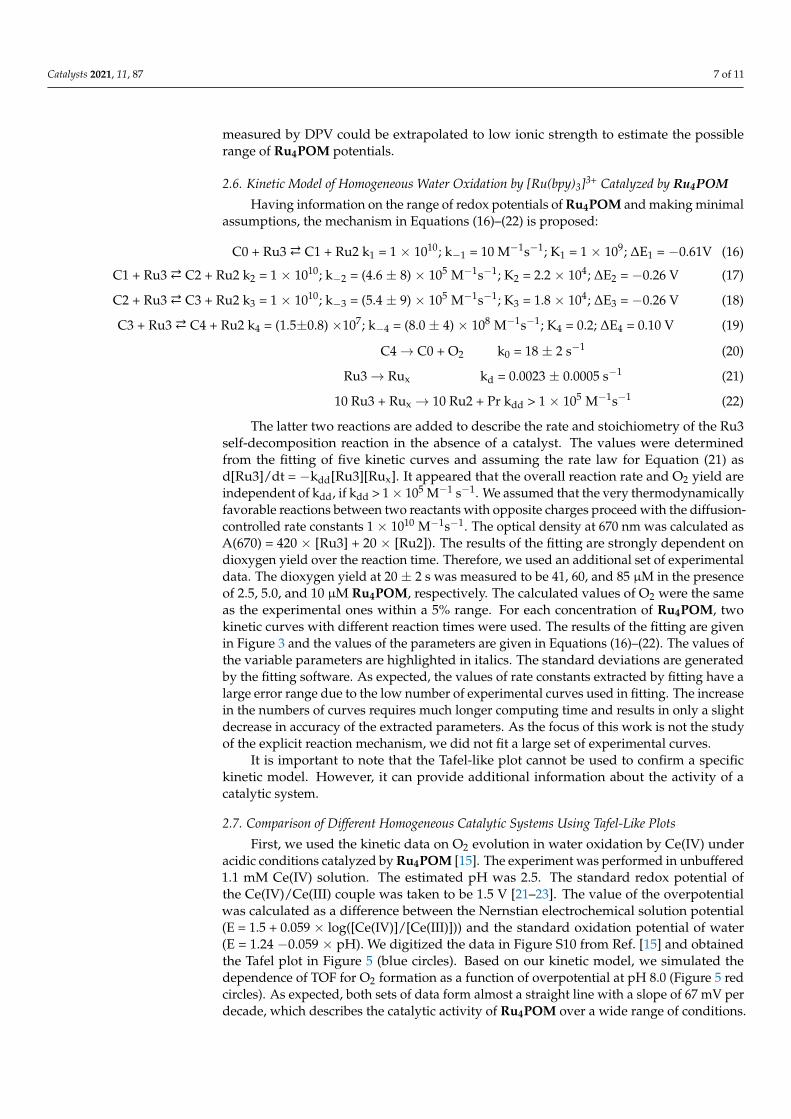
First, we used the kinetic data on O2 evolution in water oxidation by Ce(IV) underacidic conditions catalyzed by Ru4POM [15]. The experiment was performed in unbuffered1.1 mM Ce(IV) solution. The estimated pH was 2.5. The standard redox potential ofthe Ce(IV)/Ce(III) couple was taken to be 1.5 V [21–23]. The value of the overpotentialwas calculated as a difference between the Nernstian electrochemical solution potential(E = 1.5 + 0.059 × log([Ce(IV)]/[Ce(III)])) and the standard oxidation potential of water(E = 1.24 −0.059 × pH). We digitized the data in Figure S10 from Ref. [15] and obtainedthe Tafel plot in Figure 5 (blue circles). Based on our kinetic model, we simulated thedependence of TOF for O2 formation as a function of overpotential at pH 8.0 (Figure 5 redcircles). As expected, both sets of data form almost a straight line with a slope of 67 mV perdecade, which describes the catalytic activity of Ru4POM over a wide range of conditions.
Catalysts 2021, 11, 87 8 of 11Catalysts 2021, 11, x FOR PEER REVIEW 8 of 11
Figure 5. Tafel-like plots for water oxidation catalyzed by soluble Ru4POM and Co4POM (com-pletely homogeneous catalysts) derived using the described methodology compared to heterogen-ized POM Tafel plots measured via electrochemistry. Conditions for Co4POM system: 80 mM so-dium borate buffer at pH 8.0, 0.34 mM Ru3, 2.5 (light blue), 5 (green), 10 (yellow) μM Co4POM, 24 oC.
Finally, we collected stopped-flow data for another well-established homogeneous WOC, [Co4(H2O)2(PW9O34)2]10– (Co4POM) [24], in 80 mM sodium borate buffer at pH 8.0 under conditions similar to those for Ru4POM. The data were processed in the same way as described above, where the TOF for O2 formation is equal to 1/4 of the TOF for Ru3 consumption, and plotted in Figure 6. The Co4POM is more active than Ru4POM at over-potentials lower than 0.44 V, while it is lower at overpotentials higher than 0.44 V. The differences in Tafel slopes indicate that the rate-determining steps and/or the correspond-ing WOC reaction mechanism are different in these two systems.
In order to understand how the reaction parameters in Equations (15)–(21) affect the Tafel slope, we simulated the Tafel slope using Copasi and then observed the effects of changing each of the parameters within a range of 104–106 from the fitted values of Ru4POM. We have found that if the equilibrium of the reaction in Equation (19) is shifted to the left side (corresponding to the condition that the first oxidation potential is very high), then the Tafel slope becomes 30 mV/decade. This leads us to believe that the first oxidation potential of Co4POM is higher and the step depicted in Equation (19) becomes rate-determining instead.
Here, it is worth mentioning that experimental slopes in Figure 3 are slightly higher than the theoretical 30 and 60 mV/decade. The TOF was also calculated based on the rate of Ru3 consumption, which includes the Ru3 self-decomposition side reaction that we deemed negligible for our analysis.
2.8. Tafel Slope for Heterogeneous Co4POM Complex One of the reasons for performing a Tafel-like analysis on the homogeneous catalysts
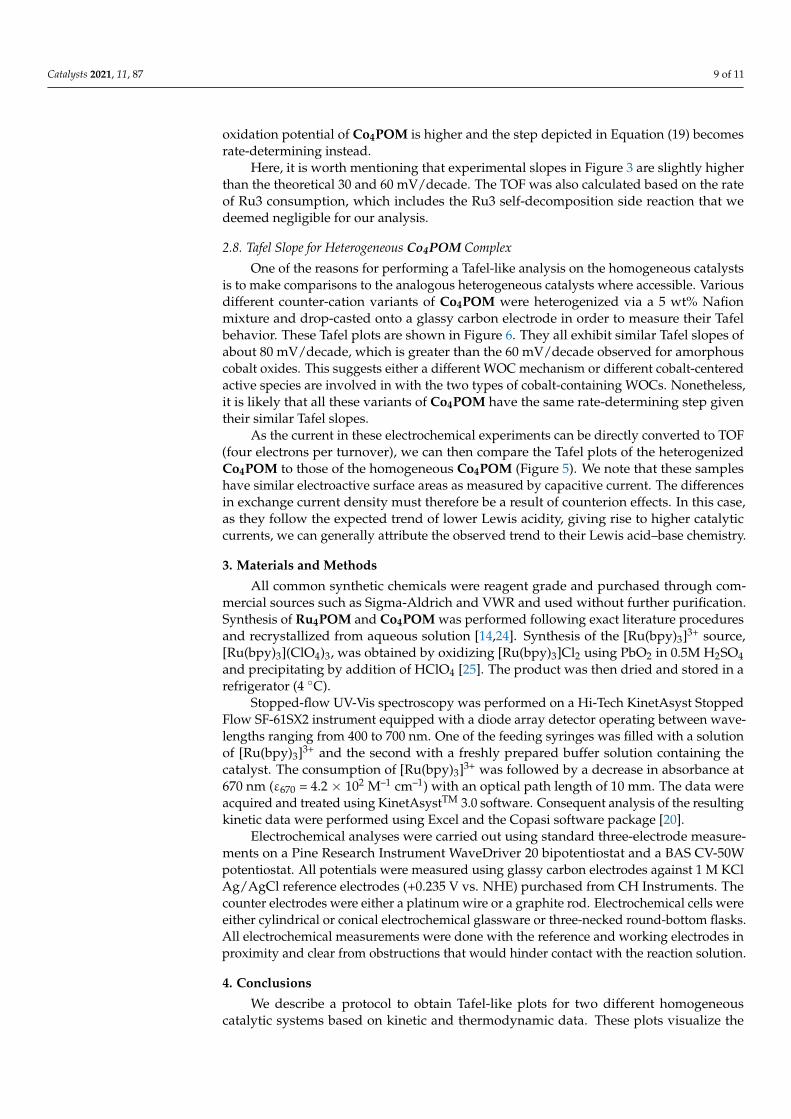
is to make comparisons to the analogous heterogeneous catalysts where accessible. Vari-ous different counter-cation variants of Co4POM were heterogenized via a 5 wt% Nafion mixture and drop-casted onto a glassy carbon electrode in order to measure their Tafel behavior. These Tafel plots are shown in Figure 6. They all exhibit similar Tafel slopes of about 80 mV/decade, which is greater than the 60 mV/decade observed for amorphous cobalt oxides. This suggests either a different WOC mechanism or different cobalt-cen-tered active species are involved in with the two types of cobalt-containing WOCs. None-theless, it is likely that all these variants of Co4POM have the same rate-determining step given their similar Tafel slopes.
Figure 5. Tafel-like plots for water oxidation catalyzed by soluble Ru4POM and Co4POM (com-pletely homogeneous catalysts) derived using the described methodology compared to heterogenizedPOM Tafel plots measured via electrochemistry. Conditions for Co4POM system: 80 mM sodiumborate buffer at pH 8.0, 0.34 mM Ru3, 2.5 (light blue), 5 (green), 10 (yellow) µM Co4POM, 24 oC.
Finally, we collected stopped-flow data for another well-established homogeneousWOC, [Co4(H2O)2(PW9O34)2]10– (Co4POM) [24], in 80 mM sodium borate buffer at pH8.0 under conditions similar to those for Ru4POM. The data were processed in the sameway as described above, where the TOF for O2 formation is equal to 1/4 of the TOF forRu3 consumption, and plotted in Figure 6. The Co4POM is more active than Ru4POM atoverpotentials lower than 0.44 V, while it is lower at overpotentials higher than 0.44 V. Thedifferences in Tafel slopes indicate that the rate-determining steps and/or the correspond-ing WOC reaction mechanism are different in these two systems.
Catalysts 2021, 11, x FOR PEER REVIEW 9 of 11
As the current in these electrochemical experiments can be directly converted to TOF (four electrons per turnover), we can then compare the Tafel plots of the heterogenized Co4POM to those of the homogeneous Co4POM (Figure 5). We note that these samples have similar electroactive surface areas as measured by capacitive current. The differences in exchange current density must therefore be a result of counterion effects. In this case, as they follow the expected trend of lower Lewis acidity, giving rise to higher catalytic currents, we can generally attribute the observed trend to their Lewis acid–base chemistry.
Figure 6. Tafel plot of heterogenized Co4POM on glassy carbon electrodes with different counteri-ons. Conditions: 1 mV/s iR compensated chronoamperometry in 0.1 M pH 8 sodium borate buffer and 0.1 M KNO3 electrolyte solution. Reference electrode, Ag/AgCl (1.0 M KCl); counter electrode, graphite.
3. Materials and Methods All common synthetic chemicals were reagent grade and purchased through commer-
cial sources such as Sigma-Aldrich and VWR and used without further purification. Syn-thesis of Ru4POM and Co4POM was performed following exact literature procedures and recrystallized from aqueous solution [14,24]. Synthesis of the [Ru(bpy)3]3+ source, [Ru(bpy)3](ClO4)3, was obtained by oxidizing [Ru(bpy)3]Cl2 using PbO2 in 0.5M H2SO4 and precipitating by addition of HClO4 [25]. The product was then dried and stored in a refrig-erator (4 °C).
Stopped-flow UV-Vis spectroscopy was performed on a Hi-Tech KinetAsyst Stopped Flow SF-61SX2 instrument equipped with a diode array detector operating between wave-lengths ranging from 400 to 700 nm. One of the feeding syringes was filled with a solution of [Ru(bpy)3]3+ and the second with a freshly prepared buffer solution containing the cata-lyst. The consumption of [Ru(bpy)3]3+ was followed by a decrease in absorbance at 670 nm (ε670 = 4.2 × 10² M–1 cm–1) with an optical path length of 10 mm. The data were acquired and treated using KinetAsystTM 3.0 software. Consequent analysis of the resulting kinetic data were performed using Excel and the Copasi software package [20].
Electrochemical analyses were carried out using standard three-electrode measure-ments on a Pine Research Instrument WaveDriver 20 bipotentiostat and a BAS CV-50W potentiostat. All potentials were measured using glassy carbon electrodes against 1 M KCl Ag/AgCl reference electrodes (+0.235 V vs. NHE) purchased from CH Instruments. The counter electrodes were either a platinum wire or a graphite rod. Electrochemical cells were either cylindrical or conical electrochemical glassware or three-necked round-bottom flasks. All electrochemical measurements were done with the reference and working electrodes in proximity and clear from obstructions that would hinder contact with the reaction solution.
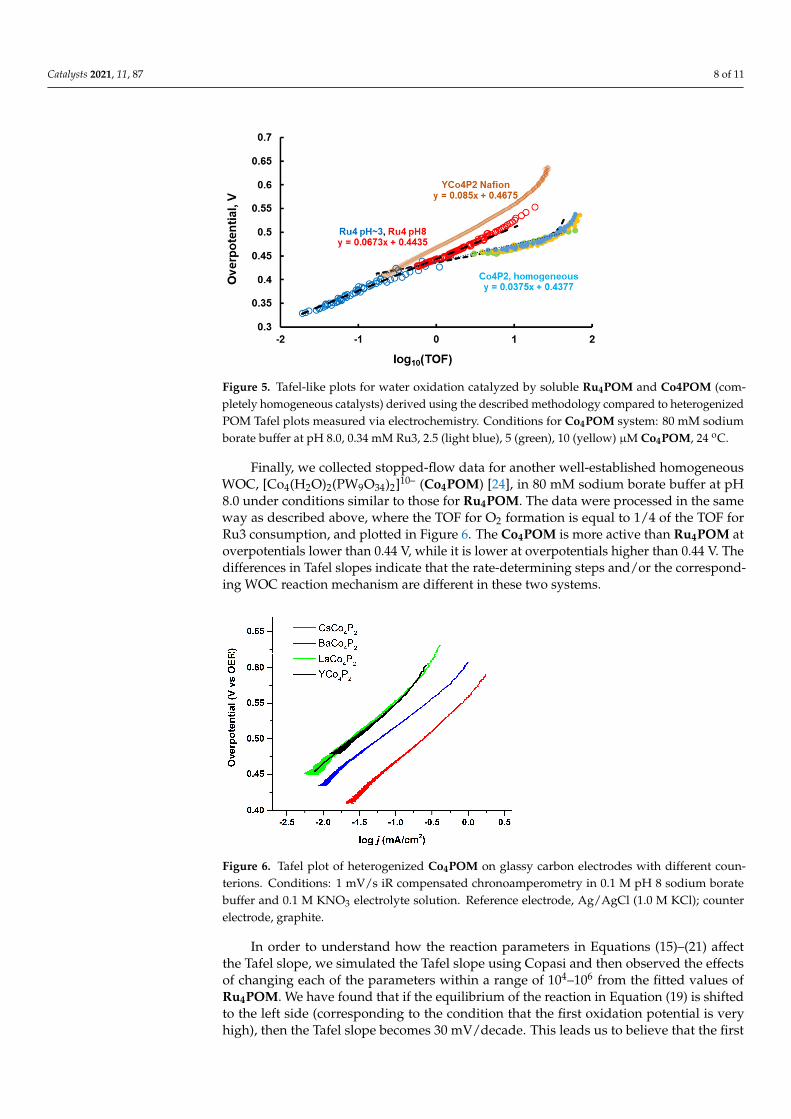
Figure 6. Tafel plot of heterogenized Co4POM on glassy carbon electrodes with different coun-terions. Conditions: 1 mV/s iR compensated chronoamperometry in 0.1 M pH 8 sodium boratebuffer and 0.1 M KNO3 electrolyte solution. Reference electrode, Ag/AgCl (1.0 M KCl); counterelectrode, graphite.
In order to understand how the reaction parameters in Equations (15)–(21) affectthe Tafel slope, we simulated the Tafel slope using Copasi and then observed the effectsof changing each of the parameters within a range of 104–106 from the fitted values ofRu4POM. We have found that if the equilibrium of the reaction in Equation (19) is shiftedto the left side (corresponding to the condition that the first oxidation potential is veryhigh), then the Tafel slope becomes 30 mV/decade. This leads us to believe that the first
Catalysts 2021, 11, 87 9 of 11
oxidation potential of Co4POM is higher and the step depicted in Equation (19) becomesrate-determining instead.
Here, it is worth mentioning that experimental slopes in Figure 3 are slightly higherthan the theoretical 30 and 60 mV/decade. The TOF was also calculated based on the rateof Ru3 consumption, which includes the Ru3 self-decomposition side reaction that wedeemed negligible for our analysis.
2.8. Tafel Slope for Heterogeneous Co4POM Complex
One of the reasons for performing a Tafel-like analysis on the homogeneous catalystsis to make comparisons to the analogous heterogeneous catalysts where accessible. Variousdifferent counter-cation variants of Co4POM were heterogenized via a 5 wt% Nafionmixture and drop-casted onto a glassy carbon electrode in order to measure their Tafelbehavior. These Tafel plots are shown in Figure 6. They all exhibit similar Tafel slopes ofabout 80 mV/decade, which is greater than the 60 mV/decade observed for amorphouscobalt oxides. This suggests either a different WOC mechanism or different cobalt-centeredactive species are involved in with the two types of cobalt-containing WOCs. Nonetheless,it is likely that all these variants of Co4POM have the same rate-determining step giventheir similar Tafel slopes.
As the current in these electrochemical experiments can be directly converted to TOF(four electrons per turnover), we can then compare the Tafel plots of the heterogenizedCo4POM to those of the homogeneous Co4POM (Figure 5). We note that these sampleshave similar electroactive surface areas as measured by capacitive current. The differencesin exchange current density must therefore be a result of counterion effects. In this case,as they follow the expected trend of lower Lewis acidity, giving rise to higher catalyticcurrents, we can generally attribute the observed trend to their Lewis acid–base chemistry.
3. Materials and Methods
All common synthetic chemicals were reagent grade and purchased through com-mercial sources such as Sigma-Aldrich and VWR and used without further purification.Synthesis of Ru4POM and Co4POM was performed following exact literature proceduresand recrystallized from aqueous solution [14,24]. Synthesis of the [Ru(bpy)3]3+ source,[Ru(bpy)3](ClO4)3, was obtained by oxidizing [Ru(bpy)3]Cl2 using PbO2 in 0.5M H2SO4and precipitating by addition of HClO4 [25]. The product was then dried and stored in arefrigerator (4 ◦C).
Stopped-flow UV-Vis spectroscopy was performed on a Hi-Tech KinetAsyst StoppedFlow SF-61SX2 instrument equipped with a diode array detector operating between wave-lengths ranging from 400 to 700 nm. One of the feeding syringes was filled with a solutionof [Ru(bpy)3]3+ and the second with a freshly prepared buffer solution containing thecatalyst. The consumption of [Ru(bpy)3]3+ was followed by a decrease in absorbance at670 nm (ε670 = 4.2 × 10² M–1 cm–1) with an optical path length of 10 mm. The data wereacquired and treated using KinetAsystTM 3.0 software. Consequent analysis of the resultingkinetic data were performed using Excel and the Copasi software package [20].
Electrochemical analyses were carried out using standard three-electrode measure-ments on a Pine Research Instrument WaveDriver 20 bipotentiostat and a BAS CV-50Wpotentiostat. All potentials were measured using glassy carbon electrodes against 1 M KClAg/AgCl reference electrodes (+0.235 V vs. NHE) purchased from CH Instruments. Thecounter electrodes were either a platinum wire or a graphite rod. Electrochemical cells wereeither cylindrical or conical electrochemical glassware or three-necked round-bottom flasks.All electrochemical measurements were done with the reference and working electrodes inproximity and clear from obstructions that would hinder contact with the reaction solution.
4. Conclusions
We describe a protocol to obtain Tafel-like plots for two different homogeneouscatalytic systems based on kinetic and thermodynamic data. These plots visualize the

Catalysts 2021, 11, 87 10 of 11
activity of different catalysts under different solution overpotential conditions and allowfor the ready comparison of their activity with each other, as well as with heterogeneouscatalysts whose Tafel plots can be obtained using a traditional electrochemical setup. Theresulting Tafel slopes indicate that the reaction mechanisms in water oxidation catalyzedby Ru4POM and Co4POM are likely different with distinct rate-determining steps.
This establishes a template with which molecularly discrete homogeneous WOCs canbe directly compared to each other, regardless of the oxidant used, and addresses one ofthe biggest issues in WOC development: that of how to compare the catalytic reactivityof homogeneous and heterogeneous systems. In the future, we hope to expand upon thiswork and show further utilization of these protocols to elucidate the reaction mechanismsof other WOC systems.
Author Contributions: Conceptualization, Q.Y. and Y.V.G.; methodology, Y.V.G.; formal analysis,Q.Y. and Y.V.G.; investigation, Q.Y., Z.X. and Y.V.G.; writing—original draft preparation, Q.Y. andY.V.G.; writing—review and editing, T.L., D.G.M. and C.L.H.; visualization, Q.Y. and Y.V.G.; fundingacquisition, T.L., D.G.M. and C.L.H. All authors have read and agreed to the published version ofthe manuscript.
Funding: This research was funded by the U.S. Department of Energy, Office of Science, Office ofBasic Energy Sciences, Solar Photochemistry Program, Award Number DE-FG02-07ER15906.
Data Availability Statement: Data is contained within the article.
Conflicts of Interest: The authors declare no conflict of interest. The funders had no role in the designof the study; in the collection, analyses, or interpretation of data; in the writing of the manuscript, orin the decision to publish the results.
References1. Bard, A.J.; Faulkner, L.R. Electrochemical Methods: Fundamentals and Applications, 2nd ed.; John Wiley & Sons: Hoboken, NJ, USA, 2000.2. Shinagawa, T.; Garcia-Esparza, A.T.; Takanabe, K. Insight on Tafel slopes from a microkinetic analysis of aqueous electrocatalysis
for energy conversion. Sci. Rep. 2015, 5, 13801. [CrossRef] [PubMed]3. Hu, J.-M.; Zhang, J.-Q.; Cao, C.-N. Oxygen evolution reaction on IrO2-based DSA® type electrodes: Kinetics analysis of Tafel
lines and EIS. Int. J. Hydrogen Energy 2004, 29, 791–797. [CrossRef]4. Anantharaj, S.; Ede, S.R.; Karthick, K.; Sam Sankar, S.; Sangeetha, K.; Karthik, P.E.; Kundu, S. Precision and correctness in the
evaluation of electrocatalytic water splitting: Revisiting activity parameters with a critical assessment. Energy Environ. Sci. 2018,11, 744–771. [CrossRef]
5. de Chialvo, M.R.G.; Chialvo, A.C. Hydrogen evolution reaction: Analysis of the Volmer-Heyrovsky-Tafel mechanism with ageneralized adsorption model. J. Electroanal. Chem. 1994, 372, 209–223. [CrossRef]
6. Walter, M.G.; Warren, E.L.; McKone, J.R.; Boettcher, S.W.; Mi, Q.; Santori, E.A.; Lewis, N.S. Solar Water Splitting Cells. Chem. Rev.2010, 110, 6446–6473. [CrossRef] [PubMed]
7. Li, D.; Lin, C.; Batchelor-McAuley, C.; Chen, L.; Compton, R.G. Tafel analysis in practice. J. Electroanal. Chem. 2018, 826, 117–124.[CrossRef]
8. Marshall, A.T.; Vaisson-Béthune, L. Avoid the quasi-equilibrium assumption when evaluating the electrocatalytic oxygenevolution reaction mechanism by Tafel slope analysis. Electrochem. Commun. 2015, 61, 23–26. [CrossRef]
9. Savéant, J.-M. Molecular Catalysis of Electrochemical Reactions. Mechanistic Aspects. Chem. Rev. 2008, 108, 2348–2378. [CrossRef]10. Lauinger, S.M.; Yin, Q.; Geletii, Y.V.; Hill, C.L. Chapter Five—Polyoxometalate Multielectron Catalysts in Solar Fuel Production.
In Advances in Inorganic Chemistry; van Eldik, R., Cronin, L., Eds.; Academic Press: Cambridge, MA, USA, 2017; Volume 69,pp. 117–154.
11. Sumliner, J.M.; Lv, H.; Fielden, J.; Geletii, Y.V.; Hill, C.L. Polyoxometalate Multi-Electron-Transfer Catalytic Systems for WaterSplitting. Eur. J. Inorg. Chem. 2014, 2014, 635–644. [CrossRef]
12. Roger, I.; Shipman, M.A.; Symes, M.D. Earth-abundant catalysts for electrochemical and photoelectrochemical water splitting.Nat. Rev. Chem. 2017, 1, 0003. [CrossRef]
13. Costentin, C.; Savéant, J.-M. Homogeneous Molecular Catalysis of Electrochemical Reactions: Catalyst Benchmarking andOptimization Strategies. J. Am. Chem. Soc. 2017, 139, 8245–8250. [CrossRef] [PubMed]
14. Geletii, Y.V.; Besson, C.; Hou, Y.; Yin, Q.; Musaev, D.G.; Quiñonero, D.; Cao, R.; Hardcastle, K.I.; Proust, A.; Kögerler, P.; et al.Structural, Physicochemical, and Reactivity Properties of an All-Inorganic, Highly Active Tetraruthenium Homogeneous Catalystfor Water Oxidation. J. Am. Chem. Soc. 2009, 131, 17360–17370. [CrossRef] [PubMed]

Catalysts 2021, 11, 87 11 of 11
15. Sartorel, A.; Carraro, M.; Scorrano, G.; Zorzi, R.D.; Geremia, S.; McDaniel, N.D.; Bernhard, S.; Bonchio, M. PolyoxometalateEmbedding of a Tetraruthenium(IV)-oxo-core by Template-Directed Metalation of [γ-SiW10O36]8−: A Totally Inorganic Oxygen-Evolving Catalyst. J. Am. Chem. Soc. 2008, 130, 5006–5007. [CrossRef] [PubMed]
16. Lee, C.-Y.; Guo, S.-X.; Murphy, A.F.; McCormac, T.; Zhang, J.; Bond, A.M.; Zhu, G.; Hill, C.L.; Geletii, Y.V. Detailed ElectrochemicalStudies of the Tetraruthenium Polyoxometalate Water Oxidation Catalyst in Acidic Media: Identification of an Extended OxidationSeries using Fourier Transformed Alternating Current Voltammetry. Inorg. Chem. 2012, 51, 11521–11532. [CrossRef] [PubMed]
17. Costentin, C.; Drouet, S.; Robert, M.; Savéant, J.-M. Turnover Numbers, Turnover Frequencies, and Overpotential in MolecularCatalysis of Electrochemical Reactions. Cyclic Voltammetry and Preparative-Scale Electrolysis. J. Am. Chem. Soc. 2012, 134,11235–11242. [CrossRef] [PubMed]
18. Martin, C.R.; Rubinstein, I.; Bard, A.J. The heterogeneous rate constant for the Ru(bpy)33+/2+ couple at a glassy carbon electrodein aqueous solution. J. Electroanal. Chem. Interfacial Electrochem. 1983, 151, 267–271. [CrossRef]
19. Vickers, J.W.; Sumliner, J.M.; Lv, H.; Morris, M.; Geletii, Y.V.; Hill, C.L. Collecting meaningful early-time kinetic data inhomogeneous catalytic water oxidation with a sacrificial oxidant. Phys. Chem. Chem. Phys. 2014, 16, 11942–11949. [CrossRef]
20. Hoops, S.; Sahle, S.; Gauges, R.; Lee, C.; Pahle, J.; Simus, N.; Singhal, M.; Xu, L.; Mendes, P.; Kummer, U. COPASI—A COmplexPAthway SImulator. Bioinformatics 2006, 22, 3067–3074. [CrossRef]
21. Bilal, B.A.; Müller, E. Thermodynamic Study of Ce4+ /Ce3+ Redox Reaction in Aqueous Solutions at Elevated Temperatures:1. Reduction Potential and Hydrolysis Equilibria of Ce4+ in HCIO4 Solutions. Z. Nat. A 1992, 47, 974–984. [CrossRef]
22. Bouchaud, B.; Balmain, J.; Bonnet, G.; Pedraza, F. pH-distribution of cerium species in aqueous systems. J. Rare Earths 2012, 30,559–562. [CrossRef]
23. Hayes, S.A.; Yu, P.; O’Keefe, T.J.; O’Keefe, M.J.; Stoffer, J.O. The Phase Stability of Cerium Species in Aqueous Systems.J. Electrochem. Soc. 2002, 149, C623. [CrossRef]
24. Yin, Q.; Tan, J.M.; Besson, C.; Geletii, Y.V.; Musaev, D.G.; Kuznetsov, A.E.; Luo, Z.; Hardcastle, K.I.; Hill, C.L. A Fast SolubleCarbon-Free Molecular Water Oxidation Catalyst Based on Abundant Metals. Science 2010, 328, 342–345. [CrossRef] [PubMed]
25. Shafirovich, V.Y.; Khannanov, N.K.; Strelets, V.V. Chemical and Light-Induced Catalytic Water Oxidation. New J. Chem. 1980, 4,81–84.