Suppression of ghost distances in multiple-spin double ...
13
5854 Phys. Chem. Chem. Phys., 2013, 15, 5854--5866 This journal is c the Owner Societies 2013 Cite this: Phys. Chem. Chem. Phys., 2013, 15, 5854 Suppression of ghost distances in multiple-spin double electron–electron resonance† Tona von Hagens, a Yevhen Polyhach, a Muhammad Sajid,z b Adelheid Godt b and Gunnar Jeschke* a Distance measurements by pulse electron paramagnetic resonance techniques are increasingly applied to multiple-spin systems. In the double electron–electron resonance experiment, more than two dipolar coupled spins manifest in an increased total modulation depth and in sum and difference dipolar frequency contributions that give rise to additional peaks appearing in the distance distribution, which do not correspond to the real interspin distances of the system and are hence referred to as ghost contributions. These ghost contributions may be so prominent that they might be mistaken for real distance peaks or that real distance peaks shift their position or disappear. We present a simple approximate procedure to suppress ghost distances to a great extent by manipulating the experimentally obtained form factor during data analysis by a simple power scaling with a scaling exponent z N = 1/(1N), with N being the number of coupled spins in the system. This approach requires neither further experimental effort nor exact knowledge about labelling and inversion efficiency. This should enable routine application to biological systems. The approach is validated on simulated test cases for up to five spins and applied to synthetic model samples. The suppression of ghost distances with the presented approach works best for symmetric geometries and rigid molecules which, at the same time, are the cases where ghost contributions are most disturbing. The distance distributions obtained by power scaling are consistent with distributions that were obtained with previously obtained alternative approaches and agree, in some cases, strikingly well with the expectations for the true interspin distance distributions. 1 Introduction Distance measurements by pulse electron paramagnetic resonance techniques are widely applied for structure-determination studies of biomacromolecules. 1–4 The conversion to the distance domain of background-corrected time-domain data of the double electron– electron resonance (DEER) experiment, also named PELDOR, assumes well separated and homogeneously distributed spin pairs. However, DEER is increasingly applied to systems containing more than two spin labels, 5,6 as for instance singly-labelled homooligomeric proteins. 7–9 More than two dipolar coupled spins manifest in an increased total modulation depth 1–3 and in higher-order sum and difference dipolar frequency contributions which in turn cause additional peaks in the distance distribution. 10 These additional distance peaks do not correspond to the real interspin distances of the system and are hence referred to as ghost contributions. They may become so pronounced that they are mistaken as real peaks or lead to shifts or relative suppression of these real peaks. This can severely compromise the analysis of the distance distribution. Ghost contributions are most prominent and disturbing in highly symmetric and relatively rigid systems, whereas they can frequently, but not always, be negligible in unsymmetric multiple-spin systems. Therefore, it is crucial to separate the pair signal from higher- order ghost contributions in order to identify ghost and real interspin distance peaks. A procedure for separating pair and three-spin contributions has been proposed. 10 However, the experimental effort and requirements on the signal-to-noise ratio for this procedure are prohibitive for routine application to biological systems. We were systematically studying the influence of more than two spins on simulated DEER data in time and distance a ESR Group, Laboratory of Physical Chemistry, Wolfgang-Pauli-Strasse 10, 8093 Zurich, Switzerland. E-mail: [email protected]; Fax: +41 44 633 14 48; Tel: +41 44 632 57 02 b Universita ¨t Bielefeld, Fakulta¨t fu ¨r Chemie, OC II, Universita ¨tsstr. 25, 33615 Bielefeld, Germany † Electronic supplementary information (ESI) available. See DOI: 10.1039/ c3cp44462g ‡ Present address: Arbeitsgruppe von Prof. G. Erker, Corrensstr. 40, 48149 Mu ¨nster, Germany. Received 11th December 2012, Accepted 18th February 2013 DOI: 10.1039/c3cp44462g www.rsc.org/pccp PCCP PAPER Open Access Article. Published on 22 February 2013. Downloaded on 1/28/2022 7:43:35 AM. This article is licensed under a Creative Commons Attribution 3.0 Unported Licence. View Article Online View Journal | View Issue
-
Upload
khangminh22 -
Category
Documents
-
view
0 -
download
0
Transcript of Suppression of ghost distances in multiple-spin double ...
5854 Phys. Chem. Chem. Phys., 2013, 15, 5854--5866 This journal is c the Owner Societies 2013
Cite this: Phys. Chem.Chem.Phys.,2013,15, 5854
Suppression of ghost distances in multiple-spin doubleelectron–electron resonance†
Tona von Hagens,a Yevhen Polyhach,a Muhammad Sajid,zb Adelheid Godtb andGunnar Jeschke*a
Distance measurements by pulse electron paramagnetic resonance techniques are increasingly applied to
multiple-spin systems. In the double electron–electron resonance experiment, more than two dipolar
coupled spins manifest in an increased total modulation depth and in sum and difference dipolar frequency
contributions that give rise to additional peaks appearing in the distance distribution, which do not
correspond to the real interspin distances of the system and are hence referred to as ghost contributions.
These ghost contributions may be so prominent that they might be mistaken for real distance peaks or that
real distance peaks shift their position or disappear. We present a simple approximate procedure to
suppress ghost distances to a great extent by manipulating the experimentally obtained form factor during
data analysis by a simple power scaling with a scaling exponent zN = 1/(1�N), with N being the number of
coupled spins in the system. This approach requires neither further experimental effort nor exact
knowledge about labelling and inversion efficiency. This should enable routine application to biological
systems. The approach is validated on simulated test cases for up to five spins and applied to synthetic
model samples. The suppression of ghost distances with the presented approach works best for symmetric
geometries and rigid molecules which, at the same time, are the cases where ghost contributions are most
disturbing. The distance distributions obtained by power scaling are consistent with distributions that were
obtained with previously obtained alternative approaches and agree, in some cases, strikingly well with the
expectations for the true interspin distance distributions.
1 Introduction
Distance measurements by pulse electron paramagnetic resonancetechniques are widely applied for structure-determination studiesof biomacromolecules.1–4 The conversion to the distance domain ofbackground-corrected time-domain data of the double electron–electron resonance (DEER) experiment, also named PELDOR,assumes well separated and homogeneously distributed spin pairs.However, DEER is increasingly applied to systems containingmore than two spin labels,5,6 as for instance singly-labelledhomooligomeric proteins.7–9 More than two dipolar coupledspins manifest in an increased total modulation depth1–3 and
in higher-order sum and difference dipolar frequency contributionswhich in turn cause additional peaks in the distance distribution.10
These additional distance peaks do not correspond to the realinterspin distances of the system and are hence referred to as ghostcontributions. They may become so pronounced that they aremistaken as real peaks or lead to shifts or relative suppressionof these real peaks. This can severely compromise the analysisof the distance distribution.
Ghost contributions are most prominent and disturbingin highly symmetric and relatively rigid systems, whereas theycan frequently, but not always, be negligible in unsymmetricmultiple-spin systems.
Therefore, it is crucial to separate the pair signal from higher-order ghost contributions in order to identify ghost and realinterspin distance peaks. A procedure for separating pair andthree-spin contributions has been proposed.10 However, theexperimental effort and requirements on the signal-to-noise ratiofor this procedure are prohibitive for routine application tobiological systems.
We were systematically studying the influence of more thantwo spins on simulated DEER data in time and distance
a ESR Group, Laboratory of Physical Chemistry, Wolfgang-Pauli-Strasse 10,
8093 Zurich, Switzerland. E-mail: [email protected];
Fax: +41 44 633 14 48; Tel: +41 44 632 57 02b Universitat Bielefeld, Fakultat fur Chemie, OC II, Universitatsstr. 25,
33615 Bielefeld, Germany
† Electronic supplementary information (ESI) available. See DOI: 10.1039/c3cp44462g‡ Present address: Arbeitsgruppe von Prof. G. Erker, Corrensstr. 40, 48149Munster, Germany.
Received 11th December 2012,Accepted 18th February 2013
DOI: 10.1039/c3cp44462g
www.rsc.org/pccp
PCCP
PAPER
Ope
n A
cces
s A
rtic
le. P
ublis
hed
on 2
2 Fe
brua
ry 2
013.
Dow
nloa
ded
on 1
/28/
2022
7:4
3:35
AM
. T
his
artic
le is
lice
nsed
und
er a
Cre
ativ
e C
omm
ons
Attr
ibut
ion
3.0
Unp
orte
d L
icen
ce.
View Article OnlineView Journal | View Issue
This journal is c the Owner Societies 2013 Phys. Chem. Chem. Phys., 2013, 15, 5854--5866 5855
domains and developed a further, computer-time demandingapproach based on self-consistent iterative approximation ofthe true interspin distances starting from the primary experi-mental data containing also ghost contributions. During thiswork, we realized that the solution might be a lot more simplerthan we initially thought.
We accidentally found that superposition of the logarithm ofthe form factor of a three-spin system with the logarithm of theform factor of the pair contribution by linear scaling leads toalmost perfect agreement. Such linear scaling of the logarithm ofthe form factor for comparison of two data sets was implementedin earlier versions of the Deer Analysis software11 and has nowbeen replaced by linear scaling of the original form factor. Afurther study of this effect revealed that the optimum scalingfactor depends only on the number N of coupled spins, but not onmodulation depth and labelling efficiency. The form factor, whichis the primary DEER data divided by the background function,can be corrected simply by taking it to the power of zN = 1/(N� 1).
In this work we show that this simple power scaling approachleads to a very strong suppression of ghost contributions.
This work is structured as follows. In the theory section, wedepict the expressions for the DEER signal for an N spin systemin general and state them explicitly for up to five spins. Weshow the origin of ghost frequency contributions and theirinfluence on the distance distributions of symmetric multiple-spin systems. We introduce the general idea of power scalingand depict why it is reasonable to choose a scaling exponentzN = 1/(N � 1). For a triradical system, we derive more explicitlyhow power scaling with zN accomplishes to suppress ghostfrequencies. The applicability range, especially concerninginversion efficiency, and the result of the power scalingapproach on an equilateral triradical, a planar tetraradicaland a planar pentaradical system is examined in detail. Wefurthermore demonstrate that power scaling does not signifi-cantly distort the distance distribution when erroneouslyapplied to a two-spin system. It is investigated in detail whetherthe optimum scaling exponent zopt, giving best agreementbetween the pair contribution and the ghost frequency contain-ing expressions, coincides with zN for a wide range of relativewidths of the interspin distance distribution for up to five-spinsystems. Our analysis based on simulated data is checkedagainst noise and experimental imperfections with triradicalmodel systems with equilateral and scalene geometry.
2 Theory2.1 DEER signal of N coupled spins
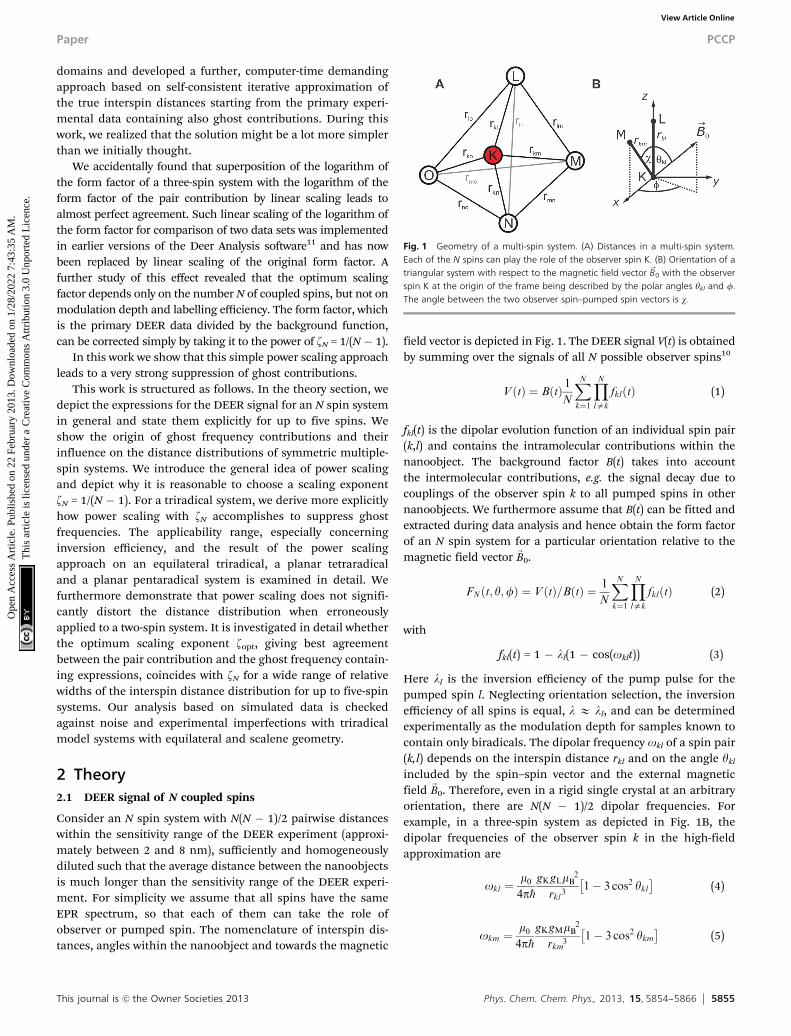
Consider an N spin system with N(N � 1)/2 pairwise distanceswithin the sensitivity range of the DEER experiment (approxi-mately between 2 and 8 nm), sufficiently and homogeneouslydiluted such that the average distance between the nanoobjectsis much longer than the sensitivity range of the DEER experi-ment. For simplicity we assume that all spins have the sameEPR spectrum, so that each of them can take the role ofobserver or pumped spin. The nomenclature of interspin dis-tances, angles within the nanoobject and towards the magnetic
field vector is depicted in Fig. 1. The DEER signal V(t) is obtainedby summing over the signals of all N possible observer spins10
VðtÞ ¼ BðtÞ 1N
XNk¼1
YNlak
fklðtÞ (1)
fkl(t) is the dipolar evolution function of an individual spin pair(k,l) and contains the intramolecular contributions within thenanoobject. The background factor B(t) takes into accountthe intermolecular contributions, e.g. the signal decay due tocouplings of the observer spin k to all pumped spins in othernanoobjects. We furthermore assume that B(t) can be fitted andextracted during data analysis and hence obtain the form factorof an N spin system for a particular orientation relative to themagnetic field vector
-
B0.
FNðt; y;fÞ ¼ VðtÞ=BðtÞ ¼ 1
N
XNk¼1
YNlak
fklðtÞ (2)
with
fkl(t) = 1 � ll(1 � cos(oklt)) (3)
Here ll is the inversion efficiency of the pump pulse for thepumped spin l. Neglecting orientation selection, the inversionefficiency of all spins is equal, l E ll, and can be determinedexperimentally as the modulation depth for samples known tocontain only biradicals. The dipolar frequency okl of a spin pair(k,l) depends on the interspin distance rkl and on the angle ykl
included by the spin–spin vector and the external magneticfield
-
B0. Therefore, even in a rigid single crystal at an arbitraryorientation, there are N(N � 1)/2 dipolar frequencies. Forexample, in a three-spin system as depicted in Fig. 1B, thedipolar frequencies of the observer spin k in the high-fieldapproximation are
okl ¼m04p�h
gKgLmB2
rkl31� 3 cos2 ykl� �
(4)
okm ¼m04p�h
gKgMmB2
rkm31� 3 cos2 ykm� �
(5)
Fig. 1 Geometry of a multi-spin system. (A) Distances in a multi-spin system.Each of the N spins can play the role of the observer spin K. (B) Orientation of atriangular system with respect to the magnetic field vector B
-
0 with the observerspin K at the origin of the frame being described by the polar angles ykl and f.The angle between the two observer spin–pumped spin vectors is w.
Paper PCCP
Ope
n A
cces
s A
rtic
le. P
ublis
hed
on 2
2 Fe
brua
ry 2
013.
Dow
nloa
ded
on 1
/28/
2022
7:4
3:35
AM
. T
his
artic
le is
lice
nsed
und
er a
Cre
ativ
e C
omm
ons
Attr
ibut
ion
3.0
Unp
orte
d L
icen
ce.
View Article Online
5856 Phys. Chem. Chem. Phys., 2013, 15, 5854--5866 This journal is c the Owner Societies 2013
where m0 is the vacuum permeability, mB the Bohrmagneton and gK, gL and gM are the g values of the threespins and
cos ykm = sin w sin ykl cosf + cos w cos ykl (6)
The third frequency olm is encountered when the observerspin is l or m. Note that the sign of okl and okm was givenwrongly in ref. 10. Experimental data are independent ofabsolute sign of the dipolar frequencies, since the cosinefunction is even. However, in the presence of additionalexchange coupling, the sign matters.12
In general, the N(N � 1)/2 dipolar frequencies depend on asmany distances and angles as are required to define thecoordinates of the N spins up to translation and rotation. Thetotal number of Cartesian coordinates is 3N and the number oftranslational and rotational degrees of freedom, to whichinternal distance measurements are insensitive, is 6 for non-linear systems. Hence, the total form factor depends on 3N � 6geometric parameters. For the three-spin and four-spin case,the three or six distances, respectively, fully determine thegeometry, while for larger systems the number of distancesexceeds the number of free parameters.
For an ensemble of uniformly distributed nanoobjects withrandom orientation with respect to the magnetic field, asobserved in microcrystalline powders or glassy frozen solu-tions, the form factor is obtained by powder averaging
FNðtÞ ¼1
2p
Z 2p
0
Z p=2
0
FNðt; y;fÞ sinðyÞdydf (7)
2.2 Contributions of the form factors by the number ofcoupled spins
Taking all previous considerations into account, the generalizedform factor can be written as
FNðtÞ ¼ ð1� lÞN�1 þ lð1� lÞN�2 1N
1
1!
XNk¼1
XNlak
cosokltþ l2
� ð1� lÞN�3 1N
1
2!
XNk¼1
XNlak
XNmak;l
cosoklt cosokmt
þ l3ð1� lÞN�4 1N
1
3!
�XNk¼1
XNlak
XNmak;l
XNnak;l;m
cosoklt cosokmt cosoknt
þ l4ð1� lÞN�5 1N
1
4!
�XNk¼1
XNlak
XNmak;l
XNnak;l;m
XNoak;l;m;n
cosoklt cosokmt
� cosoknt cosokotþ . . .
(8)
This sum representation contains the constant, unmodulatedcontribution that defines the modulation depth DN =1� (1� l)N�1
and frequency-modulated terms that are grouped by the numberof coupled spins involved. For clarity, we rewrite the form factorin a more compact way.
FN(t) = (1 � l)N�1 + l(1 � l)N�2PN(t) + l2(1 � l)N�3TN(t)
+ l3(1 � l)N�4QN(t) + l4(1 � l)N�5VN(t) + . . . (9)
where PN(t) is the pair frequency contribution
PNðtÞ ¼1
N
1
1!
XNk¼1
XNlak
cosoklt (10)
TN(t) the three-spin frequency contribution
TNðtÞ ¼1
N
1
2!
XNk¼1
XNlak
XNmak;l
cosoklt cosokmt (11)
QN(t) the four-spin frequency contribution
QNðtÞ ¼1
N
1
3!
XNk¼1
XNlak
XNmak;l
XNnak;l;m
cosoklt cosokmt cosoknt
(12)
and VN(t) the five-spin frequency contribution
VNðtÞ ¼1
N
1
4!
XNk¼1
XNlak
XNmak;l
XNnak;l;m
XNnak;l;m;o
cosoklt cosokmtð
� cosoknt cosokotÞ (13)
Prefactors and contributions due to more than five spins followthe same scheme. The sum in eqn (9) is truncated after N terms.Accordingly, the form factor of a two-spin system contains onlypair frequency contributions
F2(t) = 1 � l + lP2(t) (14)
The three-spin system form factor is
F3(t) = 1 � 2l + l2 + l(1 � l)P3(t) + l2T3(t) (15)
the four-spin system form factor is
F4(t) = 1 � 3l + 3l2 � l3 + l(1 � l)2P4(t) + l2(1 � l)T4(t) + l3Q4(t)(16)
and the five-spin system form factor is
F5(t) = 1 � 4l + 6l2 � 4l3 + l4 + l(1 � l)3P5(t) + l2(1 � l)2T5(t)
+ l3(1 � l)Q5(t) + l4V5(t) (17)
Standard DEER experiments performed at the X-band(E9.3–9.4 GHz) on nitroxide spin labels have inversionefficiencies of 0.2 t l t 0.6 with l E 0.57 being standard inour laboratory for completely labelled systems on application ofa 12 ns pump pulse at the maximum of the nitroxide spectrum.At the Q-band (E34 GHz), typical inversion efficiencies that canbe reached are usually slightly lower, with lE 0.4 being a usualupper limit in the absence of orientation selection and usingbroadband excitation with all pulses set to 12 ns.13 Orientationselection may have strong effects on the numerical l value.Under such conditions, the pair frequency contribution is less
PCCP Paper
Ope
n A
cces
s A
rtic
le. P
ublis
hed
on 2
2 Fe
brua
ry 2
013.
Dow
nloa
ded
on 1
/28/
2022
7:4
3:35
AM
. T
his
artic
le is
lice
nsed
und
er a
Cre
ativ
e C
omm
ons
Attr
ibut
ion
3.0
Unp
orte
d L
icen
ce.
View Article Online
This journal is c the Owner Societies 2013 Phys. Chem. Chem. Phys., 2013, 15, 5854--5866 5857
and less predominant compared to the higher-order contribu-tions the higher the number of coupled spins. Although aninversion efficiency of l = 1 can be achieved in simulated data,this value cannot be reached at current state with usual spectro-meters for systems consisting of only nitroxide radicals. Study-ing the influence of inversion efficiencies l > 0.6 is thus at thispoint mostly of didactical and theoretical interest. Note how-ever that this may change for other label types and with multi-frequency excitation14 or arbitrary waveform generator basedspectrometers.15,16
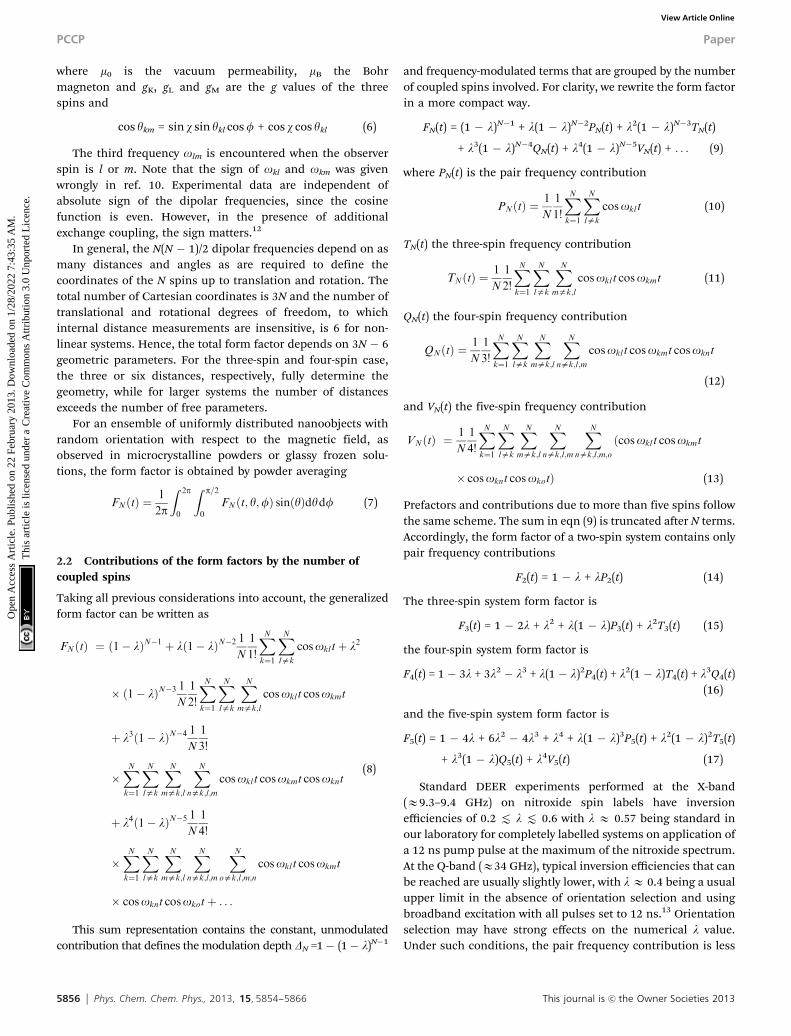
The influence of the number of coupled spins for the sameinterspin distance and inversion efficiency l is shown onsimulated data in Fig. 2. In this simulation and all the followingones we assume a Rice distribution of distances correspondingto a Gaussian spatial distribution of the individual para-magnetic centers.17 The simulated dipolar evolution time is8 ms and the simulated dwell time is 8 ns in this and allfollowing simulations. The biradical curve (green) containingonly pair contributions is virtually indistinguishable from theinput distribution (grey). The most prominent ghost artefact isa distinct peak at lower distances, already very pronounced inthe triradical (red) and almost as dominant as the real interspindistance peak in the tetraradical case (violet).
The form factor at time t = 0 is normalized to unity.The multiplicities of higher-order frequency contributions followPascal’s triangle with a value of 1 at t = 0 for the highest-frequencycontribution. In a three-spin system P3(0) = 2 and T3(0) = 1, in afour-spin system Q4(0) = 1, T4(0) = 3 and P4(0) = 3, in a five-spinsystem V5(0) = 1, Q5(0) = 4, T5(0) = 6 and P5(0) = 4 and so on forhigher spin systems. Note that in a previous publication,10 thenormalization coefficients of the frequency modulated terms(eqn (10)–(13)) missed the factorial in the denominator.
Previous work on spin counting showed that the inversionefficiency l is well reproducible on a given spectrometer and agiven probehead.18,19 This inversion efficiency l can be variedexperimentally by variation of the pump pulse power. In thecase of incomplete labelling, when l is replaced by fl, with afraction f o 1 of labelled spins, all expressions given in thiswork still hold.
In the case of known labelling efficiency f, the modulationdepth
DN = 1 � (1 � l)N�1 (18)
is thus well suited to determine the number of spins in thesystem.18,19 Note however that this is susceptible to differencesin l between model substances and the sample under investi-gation. Furthermore, not all frequencies are equally excited bythe pump and observer pulses, which also affects the numericalvalue of DN. In particular, signals at high sum combinationfrequencies may be suppressed if these frequencies exceed theexcitation bandwidth of the pump pulse or observer refocusingpulses, similar to the effects that cause the lower distance limitof the DEER technique.20,21 The difference combination peakcould be at a frequency that is not well-defined in the timewhen a DEER signal can be recorded. Therefore, signals at verylow difference combination frequencies may also be eliminatedby background correction. The ideal total modulation depths ofa two-, three-, four- and five-spin system are D2 = l, D3 = 2l � l2,D4 = 3l � 3l2 + l3 and D5 = 4l � 6l2 + 4l3 � l4. Even though thetotal modulation depth DN may slightly deviate from these idealvalues in an experimental setup, the best way to estimate theinversion efficiency l of a multiple-spin system is to simplyinvert eqn (18), taking furthermore into account a possiblereduction of labeling efficiency f.
Elimination of the constant contribution and renormaliza-tion of the maximum value to unity gives the dipolar evolutionfunction FN,0(t) that contains only dipolar frequency contribu-tions
FN;0ðtÞ ¼FNðtÞ � ð1� lÞN�1
1� ð1� lÞN�1(19)
The dipolar evolution functions are used to compare differencesbetween spin systems in the time domain and are the inputdata for the Tikhonov regularization that provides the distancedistributions. Due to the differences in DN, the form factorsFN(t) do not converge to the same value at long times t wheneither N, f or l are different, whereas the dipolar evolutionfunctions FN,0(t) converge to zero and are thus suitable to detectdifferences in primary data.
2.3 Ghost distances originating from the form factor
When more than two spins are present, the signal (eqn (8))contains products of cosines leading to combination frequencycontributions because
cos okltð Þ cos okmtð Þ ¼ 1
2cos okl þ okmð Þtþ cos okl � okmð Þt½ �
(20)
By repetitive application of eqn (20) it can be shown that in aproduct of N � 1 cosine functions, cosines of all possible sumsand differences of the N � 1 dipolar frequencies occur.
Conversion from the time to the distance domain duringdata analysis assigns distances to every frequency in the formfactor, thus also to the combination frequencies. We therefore
Fig. 2 Simulated form factors (A) and distance distributions obtained by Tikhonovregularization (B) of a two-spin (green), three-spin (red) and four-spin (violet)system. All systems feature a single mean distance (equilateral triangle andregular tetrahedron). Interspin distances are Rice distributed around 3 nm witha standard deviation of 0.1 nm, inversion efficiency is l = 0.57. Most ghostdistances are slightly shorter and appear as clear and distinct peaks. The trueinterspin distance peak in this and all following figures is marked with an asterisk.
Paper PCCP
Ope
n A
cces
s A
rtic
le. P
ublis
hed
on 2
2 Fe
brua
ry 2
013.
Dow
nloa
ded
on 1
/28/
2022
7:4
3:35
AM
. T
his
artic
le is
lice
nsed
und
er a
Cre
ativ
e C
omm
ons
Attr
ibut
ion
3.0
Unp
orte
d L
icen
ce.
View Article Online
5858 Phys. Chem. Chem. Phys., 2013, 15, 5854--5866 This journal is c the Owner Societies 2013
refer to them as ghost distances as they appear in the distancedistribution, even though they do not correspond to realinterspin distances. In general, sum contributions of twodipolar frequencies always introduce a peak at a distance thatis shorter than both distances. Difference combinationshowever introduce a peak at a distance that is longer thanthe shorter of the two distances when the difference frequencyis positive or a peak at a distance that is shorter than the longerdistance when the difference frequency is negative, because theinformation content of a negative frequency is its absolutevalue. Combinations of more than two frequencies may appearanywhere in the distance distribution.
Knowing their position would be beneficial, but this is notstraightforward. By defining a ghost frequency oghost based oneqn (20), a ghost distance rghost can be assigned analogous to areal interspin distance (eqn (4)), assuming gL E gM.
oghost ¼ okl � okm ¼m04p�h
gKgLmB2
rghost3(21)
By solving eqn (21) for the ghost distance, we obtain for a singleorientation of the system in the magnetic field
rghost ¼rkl
3rkm3
rkm3 1� 3 cos2 yklj j � rkl3 1� 3 cos2 ykmj j
� �13
(22)
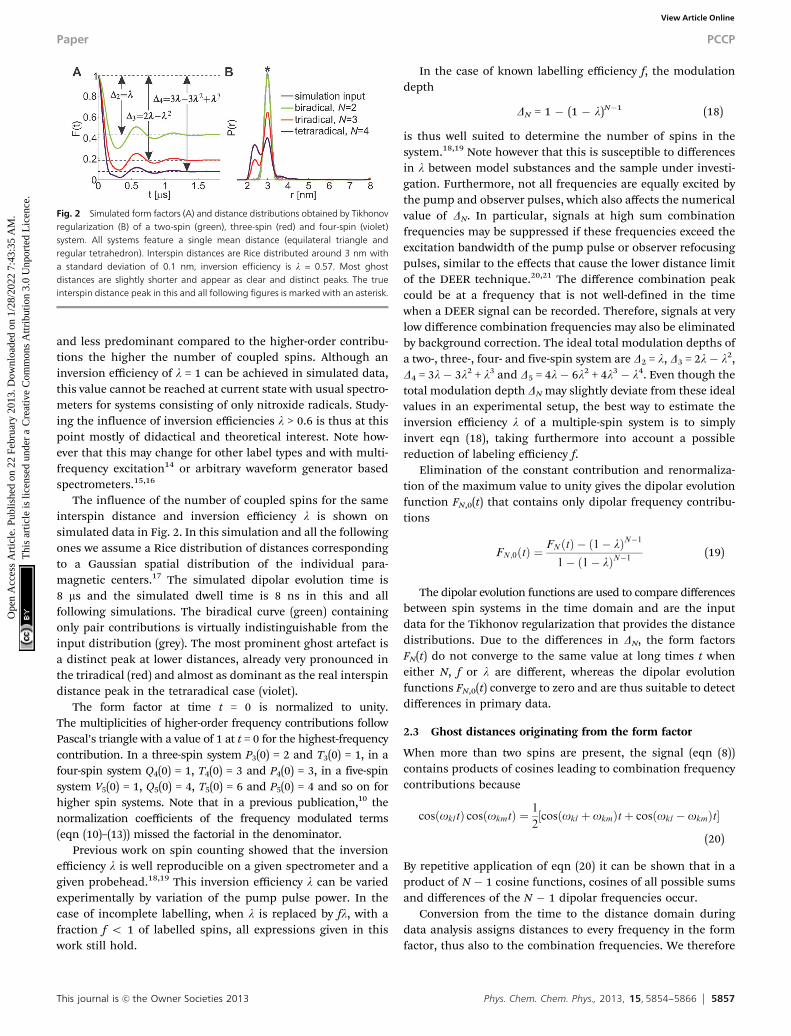
However, no closed expressions can be obtained after pow-der averaging. If the structure is known, which is usually onlythe case for symmetric homooligomers, the ghost distances canbe predicted numerically. Note also that ghost distances arebroadly distributed even in the case of a completely rigid spinsystem (Fig. 3).
2.4 Approaches to extract true interspin distances
Using a series of DEER traces at variable attenuation of thepump pulse power, it is possible to extract the true interspindistance distribution.10 The form factor evaluated in eqn (15)can be rewritten gathering terms according to the order of linstead of gathering terms according to the number of spinsinvolved.
F3(t) = (1 � l)2 + lP3(t) + l2(T3(t) � P3(t)) (23)
The series of DEER traces is a two-dimensional data set given atdiscrete times ti = 0, Dt,. . .tmax and inversion efficiencies lj =lmin,. . .lmax. At each point in time ti, one can evaluate apolynomial fit of lj and extract the pair contribution
F3(ti) = (1 � lj)2 + a1,ti
lj + a2,tilj
2 (24)
with a1,ti= P3(ti) and a2,ti
= T3(ti) � P3(ti). We found that thisfitting procedure requires an extremely good signal-to-noiseratio at all values of lj and is only then a way to extractalso higher-order contributions. The obtained fit of the paircontribution is usually not much better than the one obtainedby simply measuring for the same time at artificially lowered l.Such measurements at low inversion efficiency suppress ghostpeaks, because the relative amount of higher-order contributionsdecreases drastically with decreasing l. This, however, reducessignal-to-noise tremendously or increases measurement timecorrespondingly.
It is furthermore possible to extract the three-spin contributionmodeled with a Monte Carlo simulation of the uncorrecteddistance distribution until a self-consistent solution is obtained.Briefly, assuming that the distances are uncorrelated and thenumber of spins N is known, all multi-spin form factors can beestimated from the distance distribution and can then besubtracted from the complete form factor to obtain an estimateof the pair contribution. Tikhonov regularization of thisestimate provides an improved distance distribution. Thisprocedure is repeated until the distance distribution is self-consistent. Although this algorithm leads to improved distancedistributions in some cases, we found that it is easily unbalanced byerrors in the estimate of the total inversion efficiency lf. Further-more, the assumption of uncorrelated pair distances is poor exceptfor equilateral three-spin systems and rare four-spin systemswith tetrahedral symmetry. Moreover, the algorithm may notalways converge – especially when the spin system does nothave such a symmetric geometry. For geometries lacking suchhigh symmetry, we observed at times convergence to the wrongdistance distribution, especially when the first guess was poor.
2.5 Power scaling to suppress ghost distances
We accidentally observed that
z ln[F3(t)] E ln[F2(t)] (25)
where z was obtained by minimizing the root mean squaredeviation (rmsd) between the left-hand and the right-hand sideof eqn (25). As this rmsd is dominated by the deviation betweenthe constant contributions 1 � D3 = (1 � l)2 and 1 � D2 = 1 � l,
Fig. 3 Simulation of input interspin and ghost distances (A) and distancedistributions obtained from Tikhonov regularization of original and power scaledform factors (B) in equilateral triradicals with Rice distributed interspin distancesof 3.0 nm (black), 4.5 nm (red), 6.0 nm (blue) and 7.5 nm (green) and a standarddeviation of 0.1 nm. (A) Simulated input distance distribution (solid lines) andghost distances (dashed lines) according to eqn (22). (B) Distance distributionsobtained after Tikhonov regularization (regularization parameter a = 10) fromsimulation with l = 0.57 of triradical form factors (dashed lines) and scaledtriradical form factors (solid lines). The distance distributions obtained from thepair contribution (grey) are hidden underneath the power scaled triradicaldistance distributions. Slightly different distance distributions are obtained fromthe form factor after Tikhonov regularization than by adding the modulationdepth scaled pair and ghost distance distribution. The areas of the simulateddistance distributions are normalized to unity.
PCCP Paper
Ope
n A
cces
s A
rtic
le. P
ublis
hed
on 2
2 Fe
brua
ry 2
013.
Dow
nloa
ded
on 1
/28/
2022
7:4
3:35
AM
. T
his
artic
le is
lice
nsed
und
er a
Cre
ativ
e C
omm
ons
Attr
ibut
ion
3.0
Unp
orte
d L
icen
ce.
View Article Online
This journal is c the Owner Societies 2013 Phys. Chem. Chem. Phys., 2013, 15, 5854--5866 5859
we have z E 1/2 for a triradical. For cases with higher N, theanalogous procedure results in z E zN = 1/(N � 1), according toeqn (18). The power-scaled form factor is denoted FN
z(t) =[FN(t)]z in the following. For a single orientation and for allobserver spins being equivalent, such power scaling providesexactly the pair form factor, as can be inferred from eqn (2). Inthe absence of orientation correlation between the spins in thesystem, powder averaging could be performed before taking theproduct in eqn (2). In that case power scaling would stillprovide the correct pair form factor for equivalent observerspins, e.g. homooligomers. Since orientation correlation is notnegligible, power scaling provides only an approximate correc-tion. The approximation is expected to become worse if theobserver spins are not all symmetry equivalent.
The effect of power scaling on an equilateral triradicalsystem for a range of interspin distances at a single inversionefficiency l = 0.57 is shown in Fig. 3B. The true interspindistance information is indeed recovered.
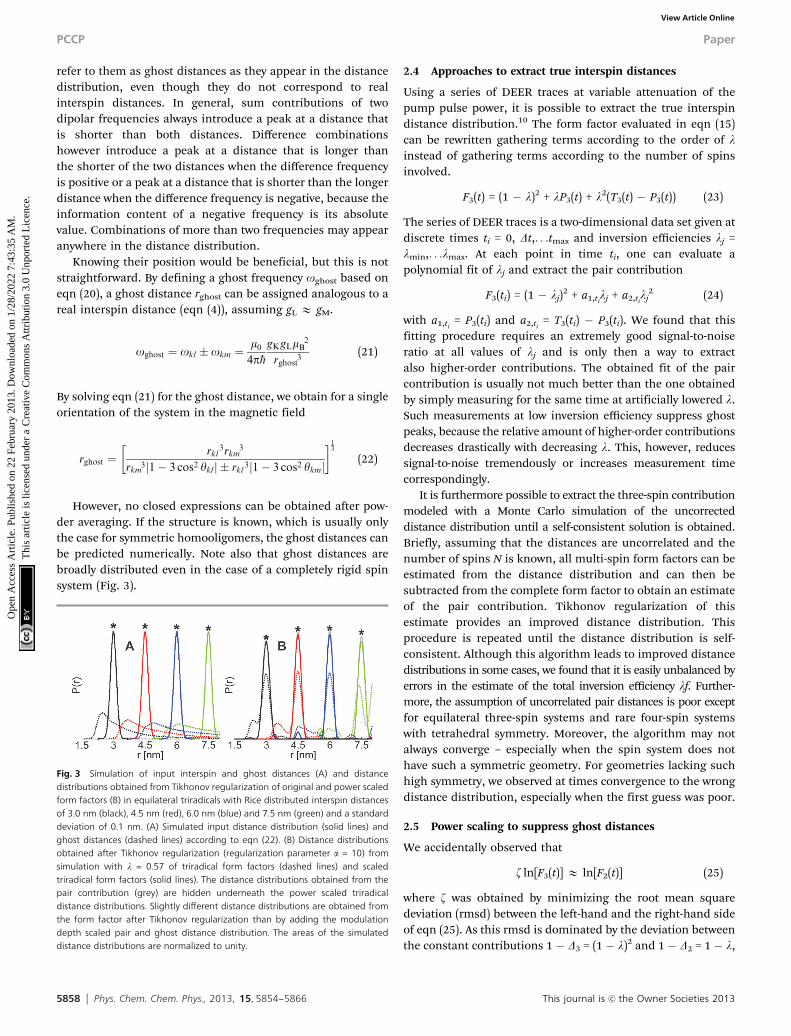
We have furthermore tested the power scaling approach onsimulated data for a three-spin system with C3 symmetry, afour-spin system with C4 symmetry and a five-spin system withC5 symmetry for a broad range of inversion efficiencies l (Fig. 4).
The unscaled dipolar evolution functions as well as thedistance distributions show dwindling agreement with thecorresponding pair contribution data at the higher l. In anutshell, for moderate inversion efficiencies l t 0.6, as theyare usual in nitroxide–nitroxide DEER measurements, scalingwith an exponent zN indeed suppresses ghost peaks efficientlyup to N = 4. For N = 5, some intentional reduction of inversionefficiency to l = 0.4 is required. For the triradical (Fig. 4A–D),the data scaled with zN = 1/2 show a good agreement with thepair contribution except for the high l-values of 0.8 and 1.0.For the tetraradical (Fig. 4E–H), the data scaled with zN = 1/3show a good agreement with the pair contribution except forhigh values of l > 0.6. The relative intensity is however notexactly the one of the pair contributions. For the pentaradical(Fig. 4I–L), at the larger l the ghost distance peaks have becomeso prominent that the real distance peak at 4.85 nm seems likea rather insignificant artefact. In fact, already at l = 0.6 close toour experimental X-band inversion efficiency of l = 0.57, the lowdistance ghost peak near 2.4 nm is significantly stronger thanthe real distance peak at 4.85 nm. Even at l = 0.2, the influenceof ghost distances is still visible. Power scaling with zN = 1/4improves the distance distribution, but only for values ofl r 0.4 the agreement is good.
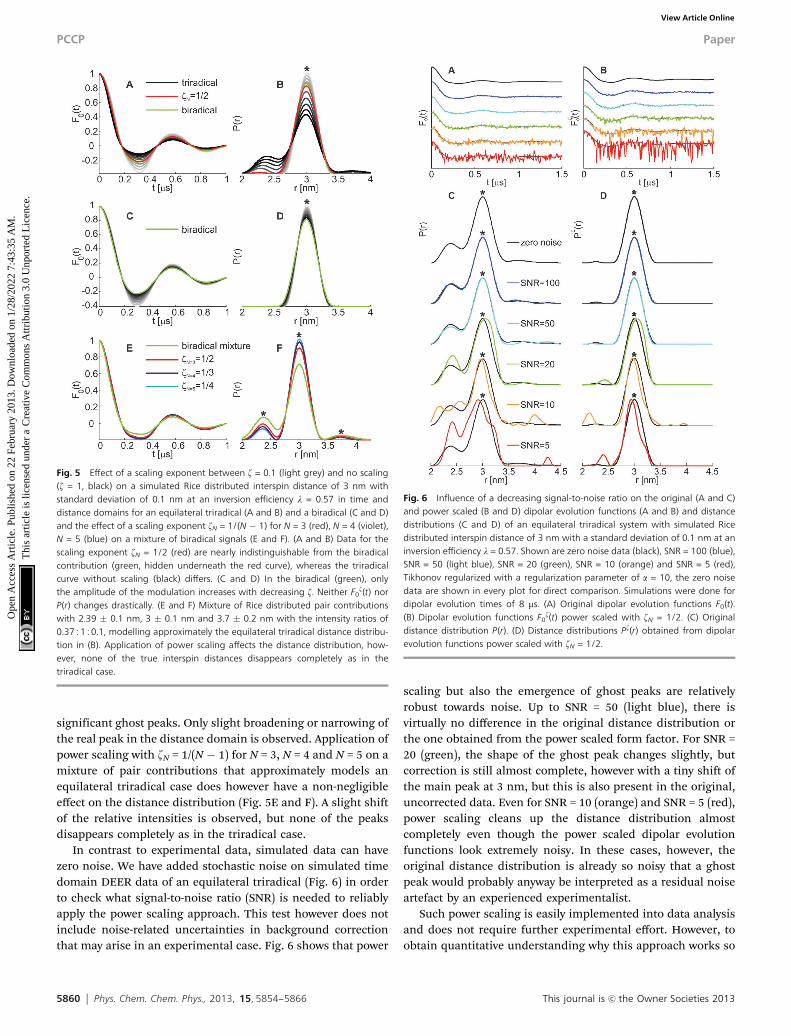
For the triradical case, we have also checked whether zN isthe optimum scaling exponent for ghost peak suppressionassuming l = 0.57 as we have it under optimized experimentalconditions (Fig. 5A and B). Indeed the ghost peak is not fullysuppressed for higher values of z, whereas lower values causeslight artificial narrowing of the real distance peak.
We have also tested how erroneous power scaling with z =zN=3 = 1/2 affects the pair form factor (N = 2, proper scalingfactor zN=2 = 1, see Fig. 5C) and the corresponding distancedistribution (Fig. 5D). Such scaling leads to changes in thedecay of the dipolar oscillation, but does not introduce prominent
Fig. 4 Comparison between original and power scaled dipolar evolution functions(A, C, E, G, I, K) and distance distributions after Tikhonov regularization withregularization parameter a = 10 (B, D, F, H, J, L) of a simulated equilateral triradical(A–D), a square geometry tetraradical (E–H) and a planar pentagon pentaradical (I–L)versus the corresponding pair contributions with Rice distributed interspin distanceof 3 nm � 0.1 nm for inversion efficiencies l = [0.2, 0.4, 0.6, 0.8, 1.0]. (A) Three-spindipolar evolution functions and pair contribution. (B) Distance distributions of theoriginal three-spin dipolar evolution functions F0(t). (C) Scaled three-spin dipolarevolution functions and the pair contribution. (D) Distance distributions of the scaledthree-spin dipolar evolution functions F0
z(t). (E) Four-spin dipolar evolution functionsand pair contribution. (F) Distance distributions of the original four-spin dipolarevolution functions F0(t). (G) Scaled four-spin dipolar evolution functions and the paircontribution. (H) Distance distributions of the scaled four-spin dipolar evolutionfunctions F0
z(t). (I) Five-spin dipolar evolution functions and pair contribution. (J)Distance distributions of the original five-spin dipolar evolution functions F0(t). (K)Scaled five-spin dipolar evolution functions and the pair contribution. (L) Distancedistributions of the scaled five-spin dipolar evolution functions F0
z(t).
Paper PCCP
Ope
n A
cces
s A
rtic
le. P
ublis
hed
on 2
2 Fe
brua
ry 2
013.
Dow
nloa
ded
on 1
/28/
2022
7:4
3:35
AM
. T
his
artic
le is
lice
nsed
und
er a
Cre
ativ
e C
omm
ons
Attr
ibut
ion
3.0
Unp
orte
d L
icen
ce.
View Article Online
5860 Phys. Chem. Chem. Phys., 2013, 15, 5854--5866 This journal is c the Owner Societies 2013
significant ghost peaks. Only slight broadening or narrowing ofthe real peak in the distance domain is observed. Application ofpower scaling with zN = 1/(N � 1) for N = 3, N = 4 and N = 5 on amixture of pair contributions that approximately models anequilateral triradical case does however have a non-negligibleeffect on the distance distribution (Fig. 5E and F). A slight shiftof the relative intensities is observed, but none of the peaksdisappears completely as in the triradical case.
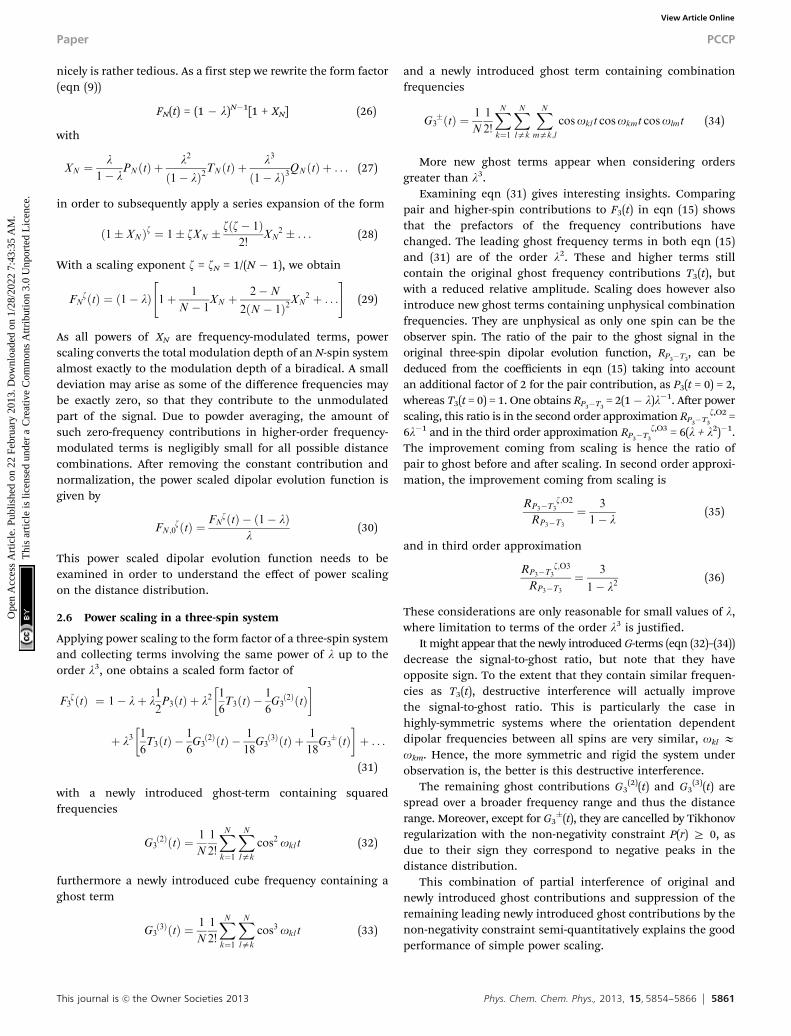
In contrast to experimental data, simulated data can havezero noise. We have added stochastic noise on simulated timedomain DEER data of an equilateral triradical (Fig. 6) in orderto check what signal-to-noise ratio (SNR) is needed to reliablyapply the power scaling approach. This test however does notinclude noise-related uncertainties in background correctionthat may arise in an experimental case. Fig. 6 shows that power
scaling but also the emergence of ghost peaks are relativelyrobust towards noise. Up to SNR = 50 (light blue), there isvirtually no difference in the original distance distribution orthe one obtained from the power scaled form factor. For SNR =20 (green), the shape of the ghost peak changes slightly, butcorrection is still almost complete, however with a tiny shift ofthe main peak at 3 nm, but this is also present in the original,uncorrected data. Even for SNR = 10 (orange) and SNR = 5 (red),power scaling cleans up the distance distribution almostcompletely even though the power scaled dipolar evolutionfunctions look extremely noisy. In these cases, however, theoriginal distance distribution is already so noisy that a ghostpeak would probably anyway be interpreted as a residual noiseartefact by an experienced experimentalist.
Such power scaling is easily implemented into data analysisand does not require further experimental effort. However, toobtain quantitative understanding why this approach works so
Fig. 5 Effect of a scaling exponent between z = 0.1 (light grey) and no scaling(z = 1, black) on a simulated Rice distributed interspin distance of 3 nm withstandard deviation of 0.1 nm at an inversion efficiency l = 0.57 in time anddistance domains for an equilateral triradical (A and B) and a biradical (C and D)and the effect of a scaling exponent zN = 1/(N � 1) for N = 3 (red), N = 4 (violet),N = 5 (blue) on a mixture of biradical signals (E and F). (A and B) Data for thescaling exponent zN = 1/2 (red) are nearly indistinguishable from the biradicalcontribution (green, hidden underneath the red curve), whereas the triradicalcurve without scaling (black) differs. (C and D) In the biradical (green), onlythe amplitude of the modulation increases with decreasing z. Neither F0
z(t) norP(r) changes drastically. (E and F) Mixture of Rice distributed pair contributionswith 2.39 � 0.1 nm, 3 � 0.1 nm and 3.7 � 0.2 nm with the intensity ratios of0.37 : 1 : 0.1, modelling approximately the equilateral triradical distance distribu-tion in (B). Application of power scaling affects the distance distribution, how-ever, none of the true interspin distances disappears completely as in thetriradical case.
Fig. 6 Influence of a decreasing signal-to-noise ratio on the original (A and C)and power scaled (B and D) dipolar evolution functions (A and B) and distancedistributions (C and D) of an equilateral triradical system with simulated Ricedistributed interspin distance of 3 nm with a standard deviation of 0.1 nm at aninversion efficiency l = 0.57. Shown are zero noise data (black), SNR = 100 (blue),SNR = 50 (light blue), SNR = 20 (green), SNR = 10 (orange) and SNR = 5 (red),Tikhonov regularized with a regularization parameter of a = 10, the zero noisedata are shown in every plot for direct comparison. Simulations were done fordipolar evolution times of 8 ms. (A) Original dipolar evolution functions F0(t).(B) Dipolar evolution functions F0
z(t) power scaled with zN = 1/2. (C) Originaldistance distribution P(r). (D) Distance distributions Pz(r) obtained from dipolarevolution functions power scaled with zN = 1/2.
PCCP Paper
Ope
n A
cces
s A
rtic
le. P
ublis
hed
on 2
2 Fe
brua
ry 2
013.
Dow
nloa
ded
on 1
/28/
2022
7:4
3:35
AM
. T
his
artic
le is
lice
nsed
und
er a
Cre
ativ
e C
omm
ons
Attr
ibut
ion
3.0
Unp
orte
d L
icen
ce.
View Article Online
This journal is c the Owner Societies 2013 Phys. Chem. Chem. Phys., 2013, 15, 5854--5866 5861
nicely is rather tedious. As a first step we rewrite the form factor(eqn (9))
FN(t) = (1 � l)N�1[1 + XN] (26)
with
XN ¼l
1� lPNðtÞ þ
l2
ð1� lÞ2TNðtÞ þ
l3
ð1� lÞ3QNðtÞ þ . . . (27)
in order to subsequently apply a series expansion of the form
ð1� XNÞz ¼ 1� zXN �zðz� 1Þ
2!XN
2 � . . . (28)
With a scaling exponent z = zN = 1/(N � 1), we obtain
FNzðtÞ ¼ ð1� lÞ 1þ 1
N � 1XN þ
2�N
2ðN � 1Þ2XN
2 þ . . .
" #(29)
As all powers of XN are frequency-modulated terms, powerscaling converts the total modulation depth of an N-spin systemalmost exactly to the modulation depth of a biradical. A smalldeviation may arise as some of the difference frequencies maybe exactly zero, so that they contribute to the unmodulatedpart of the signal. Due to powder averaging, the amount ofsuch zero-frequency contributions in higher-order frequency-modulated terms is negligibly small for all possible distancecombinations. After removing the constant contribution andnormalization, the power scaled dipolar evolution function isgiven by
FN;0zðtÞ ¼ FN
zðtÞ � ð1� lÞl
(30)
This power scaled dipolar evolution function needs to beexamined in order to understand the effect of power scalingon the distance distribution.
2.6 Power scaling in a three-spin system
Applying power scaling to the form factor of a three-spin systemand collecting terms involving the same power of l up to theorder l3, one obtains a scaled form factor of
F3zðtÞ ¼ 1� lþ l
1
2P3ðtÞ þ l2
1
6T3ðtÞ �
1
6G3ð2ÞðtÞ
� �
þ l31
6T3ðtÞ �
1
6G3ð2ÞðtÞ � 1
18G3ð3ÞðtÞ þ 1
18G3�ðtÞ
� �þ . . .
(31)
with a newly introduced ghost-term containing squaredfrequencies
G3ð2ÞðtÞ ¼ 1
N
1
2!
XNk¼1
XNlak
cos2 oklt (32)
furthermore a newly introduced cube frequency containing aghost term
G3ð3ÞðtÞ ¼ 1
N
1
2!
XNk¼1
XNlak
cos3 oklt (33)
and a newly introduced ghost term containing combinationfrequencies
G3�ðtÞ ¼ 1
N
1
2!
XNk¼1
XNlak
XNmak;l
cosoklt cosokmt cosolmt (34)
More new ghost terms appear when considering ordersgreater than l3.
Examining eqn (31) gives interesting insights. Comparingpair and higher-spin contributions to F3(t) in eqn (15) showsthat the prefactors of the frequency contributions havechanged. The leading ghost frequency terms in both eqn (15)and (31) are of the order l2. These and higher terms stillcontain the original ghost frequency contributions T3(t), butwith a reduced relative amplitude. Scaling does however alsointroduce new ghost terms containing unphysical combinationfrequencies. They are unphysical as only one spin can be theobserver spin. The ratio of the pair to the ghost signal in theoriginal three-spin dipolar evolution function, RP3�T3
, can bededuced from the coefficients in eqn (15) taking into accountan additional factor of 2 for the pair contribution, as P3(t = 0) = 2,whereas T3(t = 0) = 1. One obtains RP3�T3
= 2(1� l)l�1. After powerscaling, this ratio is in the second order approximation RP3�T3
z,O2 =6l�1 and in the third order approximation RP3�T3
z,O3 = 6(l + l2)�1.The improvement coming from scaling is hence the ratio ofpair to ghost before and after scaling. In second order approxi-mation, the improvement coming from scaling is
RP3�T3z;O2
RP3�T3
¼ 3
1� l(35)
and in third order approximation
RP3�T3z;O3
RP3�T3
¼ 3
1� l2(36)
These considerations are only reasonable for small values of l,where limitation to terms of the order l3 is justified.
It might appear that the newly introduced G-terms (eqn (32)–(34))decrease the signal-to-ghost ratio, but note that they haveopposite sign. To the extent that they contain similar frequen-cies as T3(t), destructive interference will actually improvethe signal-to-ghost ratio. This is particularly the case inhighly-symmetric systems where the orientation dependentdipolar frequencies between all spins are very similar, okl Eokm. Hence, the more symmetric and rigid the system underobservation is, the better is this destructive interference.
The remaining ghost contributions G3(2)(t) and G3
(3)(t) arespread over a broader frequency range and thus the distancerange. Moreover, except for G3
�(t), they are cancelled by Tikhonovregularization with the non-negativity constraint P(r) Z 0, asdue to their sign they correspond to negative peaks in thedistance distribution.
This combination of partial interference of original andnewly introduced ghost contributions and suppression of theremaining leading newly introduced ghost contributions by thenon-negativity constraint semi-quantitatively explains the goodperformance of simple power scaling.
Paper PCCP
Ope
n A
cces
s A
rtic
le. P
ublis
hed
on 2
2 Fe
brua
ry 2
013.
Dow
nloa
ded
on 1
/28/
2022
7:4
3:35
AM
. T
his
artic
le is
lice
nsed
und
er a
Cre
ativ
e C
omm
ons
Attr
ibut
ion
3.0
Unp
orte
d L
icen
ce.
View Article Online
5862 Phys. Chem. Chem. Phys., 2013, 15, 5854--5866 This journal is c the Owner Societies 2013
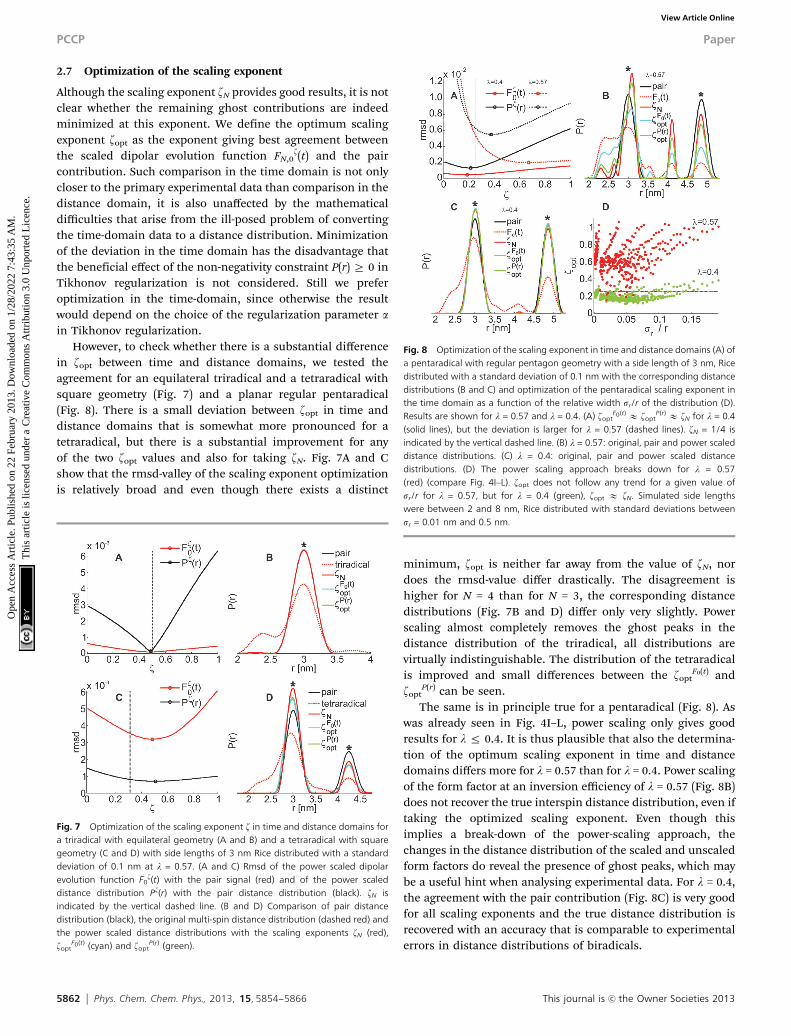
2.7 Optimization of the scaling exponent
Although the scaling exponent zN provides good results, it is notclear whether the remaining ghost contributions are indeedminimized at this exponent. We define the optimum scalingexponent zopt as the exponent giving best agreement betweenthe scaled dipolar evolution function FN,0
z(t) and the paircontribution. Such comparison in the time domain is not onlycloser to the primary experimental data than comparison in thedistance domain, it is also unaffected by the mathematicaldifficulties that arise from the ill-posed problem of convertingthe time-domain data to a distance distribution. Minimizationof the deviation in the time domain has the disadvantage thatthe beneficial effect of the non-negativity constraint P(r) Z 0 inTikhonov regularization is not considered. Still we preferoptimization in the time-domain, since otherwise the resultwould depend on the choice of the regularization parameter ain Tikhonov regularization.
However, to check whether there is a substantial differencein zopt between time and distance domains, we tested theagreement for an equilateral triradical and a tetraradical withsquare geometry (Fig. 7) and a planar regular pentaradical(Fig. 8). There is a small deviation between zopt in time anddistance domains that is somewhat more pronounced for atetraradical, but there is a substantial improvement for anyof the two zopt values and also for taking zN. Fig. 7A and Cshow that the rmsd-valley of the scaling exponent optimizationis relatively broad and even though there exists a distinct
minimum, zopt is neither far away from the value of zN, nordoes the rmsd-value differ drastically. The disagreement ishigher for N = 4 than for N = 3, the corresponding distancedistributions (Fig. 7B and D) differ only very slightly. Powerscaling almost completely removes the ghost peaks in thedistance distribution of the triradical, all distributions arevirtually indistinguishable. The distribution of the tetraradicalis improved and small differences between the zopt
F0(t) andzopt
P(r) can be seen.The same is in principle true for a pentaradical (Fig. 8). As
was already seen in Fig. 4I–L, power scaling only gives goodresults for l r 0.4. It is thus plausible that also the determina-tion of the optimum scaling exponent in time and distancedomains differs more for l = 0.57 than for l = 0.4. Power scalingof the form factor at an inversion efficiency of l = 0.57 (Fig. 8B)does not recover the true interspin distance distribution, even iftaking the optimized scaling exponent. Even though thisimplies a break-down of the power-scaling approach, thechanges in the distance distribution of the scaled and unscaledform factors do reveal the presence of ghost peaks, which maybe a useful hint when analysing experimental data. For l = 0.4,the agreement with the pair contribution (Fig. 8C) is very goodfor all scaling exponents and the true distance distribution isrecovered with an accuracy that is comparable to experimentalerrors in distance distributions of biradicals.
Fig. 7 Optimization of the scaling exponent z in time and distance domains fora triradical with equilateral geometry (A and B) and a tetraradical with squaregeometry (C and D) with side lengths of 3 nm Rice distributed with a standarddeviation of 0.1 nm at l = 0.57. (A and C) Rmsd of the power scaled dipolarevolution function F0
z(t) with the pair signal (red) and of the power scaleddistance distribution Pz(r) with the pair distance distribution (black). zN isindicated by the vertical dashed line. (B and D) Comparison of pair distancedistribution (black), the original multi-spin distance distribution (dashed red) andthe power scaled distance distributions with the scaling exponents zN (red),zopt
F0(t) (cyan) and zoptP(r) (green).
Fig. 8 Optimization of the scaling exponent in time and distance domains (A) ofa pentaradical with regular pentagon geometry with a side length of 3 nm, Ricedistributed with a standard deviation of 0.1 nm with the corresponding distancedistributions (B and C) and optimization of the pentaradical scaling exponent inthe time domain as a function of the relative width sr/r of the distribution (D).Results are shown for l = 0.57 and l = 0.4. (A) zopt
F0(t) E zoptP(r) E zN for l = 0.4
(solid lines), but the deviation is larger for l = 0.57 (dashed lines). zN = 1/4 isindicated by the vertical dashed line. (B) l = 0.57: original, pair and power scaleddistance distributions. (C) l = 0.4: original, pair and power scaled distancedistributions. (D) The power scaling approach breaks down for l = 0.57(red) (compare Fig. 4I–L). zopt does not follow any trend for a given value ofsr/r for l = 0.57, but for l = 0.4 (green), zopt E zN. Simulated side lengthswere between 2 and 8 nm, Rice distributed with standard deviations betweensr = 0.01 nm and 0.5 nm.
PCCP Paper
Ope
n A
cces
s A
rtic
le. P
ublis
hed
on 2
2 Fe
brua
ry 2
013.
Dow
nloa
ded
on 1
/28/
2022
7:4
3:35
AM
. T
his
artic
le is
lice
nsed
und
er a
Cre
ativ
e C
omm
ons
Attr
ibut
ion
3.0
Unp
orte
d L
icen
ce.
View Article Online
This journal is c the Owner Societies 2013 Phys. Chem. Chem. Phys., 2013, 15, 5854--5866 5863
For tri- and tetraradicals (Fig. 9), zopt as a function of sr/r is adistinctive curve. For relatively rigid equilateral triradical cases(sr/r t 0.07) we find zopt E zN. For the monodistanced regulartetrahedron tetraradical zopt E zN for a broad range of sr/r. Forthe square tetraradical however, zopt differs from zN for mostvalues of sr/r. When interspin distances become more flexible,zopt approaches 1, being equivalent to less correction. This agreeswith the observation that for a wider distance distribution, theghost peaks are not that distinct and may be more hiddenunderneath the anyway relatively broad interspin distance peak.This is plausible as ghost contributions are even more broadlydistributed than the initial dipolar frequencies.
Note however that less scaling does not mean that ghostcontributions are absent. It only means that the suppression ofmultiple-spin pollutions through scaling is not as successfulanymore.
We have also examined the dependency of zopt for differentvalues of l (data not shown). In the region where power scalinggives reasonable results, e.g. where zopt as a function of sr/rfollows a clear-cut trend, zopt for a given value of sr/r is nearlyindependent of l.
2.8 Power scaling on triradical model systems
The tests with simulated data discussed above have the advan-tage that the true distance distribution is precisely known. Tocheck for stability of the approach against noise and experi-mental imperfections, we performed experiments on triradicalmodel systems22,23 at X-band frequency. The outcome of suchexperiments is not expected to depend on EPR frequency ifinversion efficiency is the same and as long as orientationselection can be avoided. In general, inversion efficiency ltends to decrease with increasing EPR frequency which makesthe problem of ghost contributions less serious and ghostsuppression more efficient.
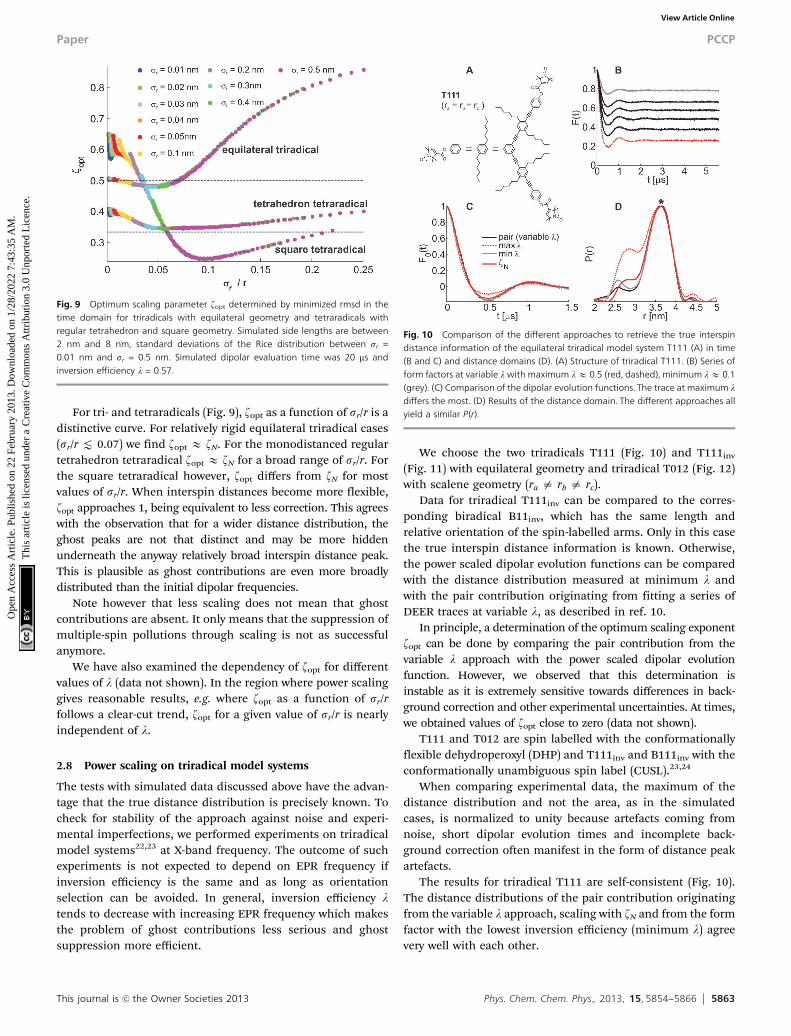
We choose the two triradicals T111 (Fig. 10) and T111inv
(Fig. 11) with equilateral geometry and triradical T012 (Fig. 12)with scalene geometry (ra a rb a rc).
Data for triradical T111inv can be compared to the corres-ponding biradical B11inv, which has the same length andrelative orientation of the spin-labelled arms. Only in this casethe true interspin distance information is known. Otherwise,the power scaled dipolar evolution functions can be comparedwith the distance distribution measured at minimum l andwith the pair contribution originating from fitting a series ofDEER traces at variable l, as described in ref. 10.
In principle, a determination of the optimum scaling exponentzopt can be done by comparing the pair contribution from thevariable l approach with the power scaled dipolar evolutionfunction. However, we observed that this determination isinstable as it is extremely sensitive towards differences in back-ground correction and other experimental uncertainties. At times,we obtained values of zopt close to zero (data not shown).
T111 and T012 are spin labelled with the conformationallyflexible dehydroperoxyl (DHP) and T111inv and B111inv with theconformationally unambiguous spin label (CUSL).23,24
When comparing experimental data, the maximum of thedistance distribution and not the area, as in the simulatedcases, is normalized to unity because artefacts coming fromnoise, short dipolar evolution times and incomplete back-ground correction often manifest in the form of distance peakartefacts.
The results for triradical T111 are self-consistent (Fig. 10).The distance distributions of the pair contribution originatingfrom the variable l approach, scaling with zN and from the formfactor with the lowest inversion efficiency (minimum l) agreevery well with each other.
Fig. 10 Comparison of the different approaches to retrieve the true interspindistance information of the equilateral triradical model system T111 (A) in time(B and C) and distance domains (D). (A) Structure of triradical T111. (B) Series ofform factors at variable l with maximum lE 0.5 (red, dashed), minimum lE 0.1(grey). (C) Comparison of the dipolar evolution functions. The trace at maximum ldiffers the most. (D) Results of the distance domain. The different approaches allyield a similar P(r).
Fig. 9 Optimum scaling parameter zopt determined by minimized rmsd in thetime domain for triradicals with equilateral geometry and tetraradicals withregular tetrahedron and square geometry. Simulated side lengths are between2 nm and 8 nm, standard deviations of the Rice distribution between sr =0.01 nm and sr = 0.5 nm. Simulated dipolar evaluation time was 20 ms andinversion efficiency l = 0.57.
Paper PCCP
Ope
n A
cces
s A
rtic
le. P
ublis
hed
on 2
2 Fe
brua
ry 2
013.
Dow
nloa
ded
on 1
/28/
2022
7:4
3:35
AM
. T
his
artic
le is
lice
nsed
und
er a
Cre
ativ
e C
omm
ons
Attr
ibut
ion
3.0
Unp
orte
d L
icen
ce.
View Article Online
5864 Phys. Chem. Chem. Phys., 2013, 15, 5854--5866 This journal is c the Owner Societies 2013
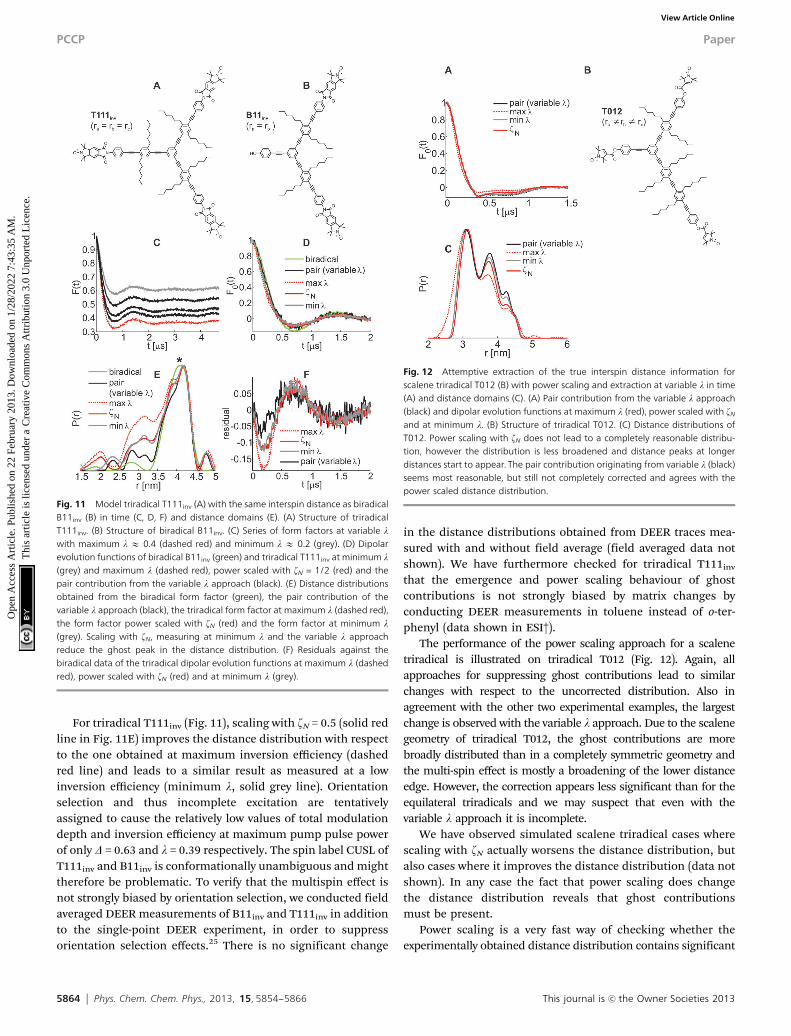
For triradical T111inv (Fig. 11), scaling with zN = 0.5 (solid redline in Fig. 11E) improves the distance distribution with respectto the one obtained at maximum inversion efficiency (dashedred line) and leads to a similar result as measured at a lowinversion efficiency (minimum l, solid grey line). Orientationselection and thus incomplete excitation are tentativelyassigned to cause the relatively low values of total modulationdepth and inversion efficiency at maximum pump pulse powerof only D = 0.63 and l = 0.39 respectively. The spin label CUSL ofT111inv and B11inv is conformationally unambiguous and mighttherefore be problematic. To verify that the multispin effect isnot strongly biased by orientation selection, we conducted fieldaveraged DEER measurements of B11inv and T111inv in additionto the single-point DEER experiment, in order to suppressorientation selection effects.25 There is no significant change
in the distance distributions obtained from DEER traces mea-sured with and without field average (field averaged data notshown). We have furthermore checked for triradical T111inv
that the emergence and power scaling behaviour of ghostcontributions is not strongly biased by matrix changes byconducting DEER measurements in toluene instead of o-ter-phenyl (data shown in ESI†).
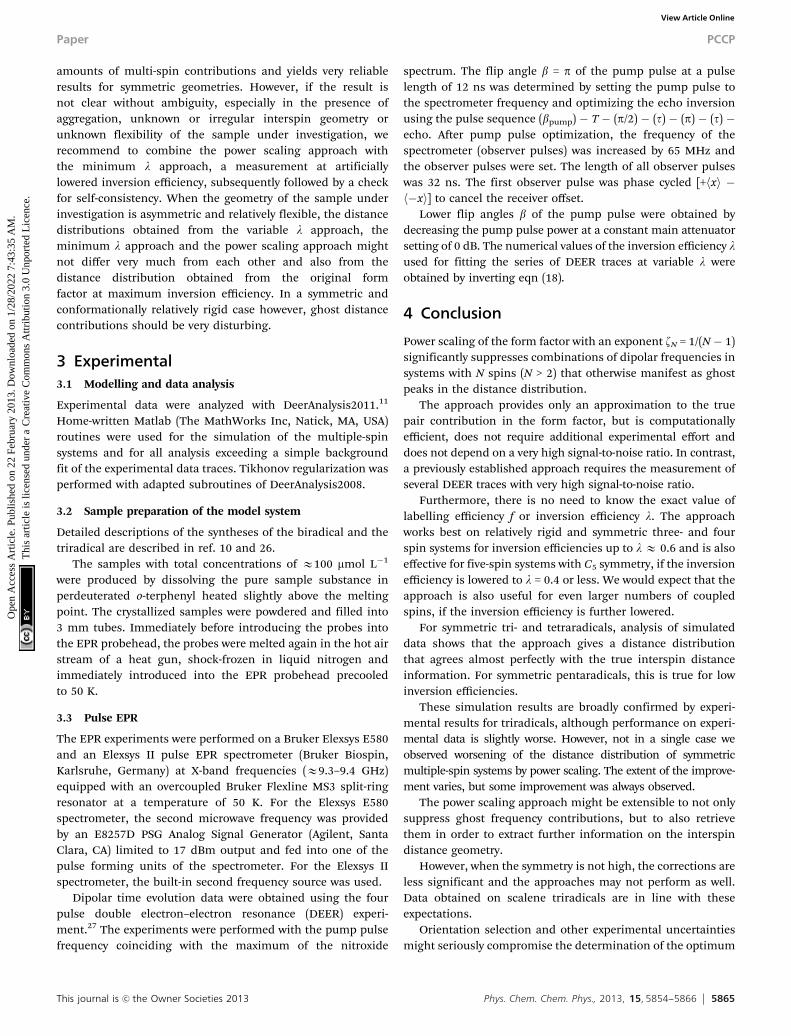
The performance of the power scaling approach for a scalenetriradical is illustrated on triradical T012 (Fig. 12). Again, allapproaches for suppressing ghost contributions lead to similarchanges with respect to the uncorrected distribution. Also inagreement with the other two experimental examples, the largestchange is observed with the variable l approach. Due to the scalenegeometry of triradical T012, the ghost contributions are morebroadly distributed than in a completely symmetric geometry andthe multi-spin effect is mostly a broadening of the lower distanceedge. However, the correction appears less significant than for theequilateral triradicals and we may suspect that even with thevariable l approach it is incomplete.
We have observed simulated scalene triradical cases wherescaling with zN actually worsens the distance distribution, butalso cases where it improves the distance distribution (data notshown). In any case the fact that power scaling does changethe distance distribution reveals that ghost contributionsmust be present.
Power scaling is a very fast way of checking whether theexperimentally obtained distance distribution contains significant
Fig. 12 Attemptive extraction of the true interspin distance information forscalene triradical T012 (B) with power scaling and extraction at variable l in time(A) and distance domains (C). (A) Pair contribution from the variable l approach(black) and dipolar evolution functions at maximum l (red), power scaled with zN
and at minimum l. (B) Structure of triradical T012. (C) Distance distributions ofT012. Power scaling with zN does not lead to a completely reasonable distribu-tion, however the distribution is less broadened and distance peaks at longerdistances start to appear. The pair contribution originating from variable l (black)seems most reasonable, but still not completely corrected and agrees with thepower scaled distance distribution.
Fig. 11 Model triradical T111inv (A) with the same interspin distance as biradicalB11inv (B) in time (C, D, F) and distance domains (E). (A) Structure of triradicalT111inv. (B) Structure of biradical B11inv. (C) Series of form factors at variable lwith maximum l E 0.4 (dashed red) and minimum l E 0.2 (grey). (D) Dipolarevolution functions of biradical B11inv (green) and triradical T111inv at minimum l(grey) and maximum l (dashed red), power scaled with zN = 1/2 (red) and thepair contribution from the variable l approach (black). (E) Distance distributionsobtained from the biradical form factor (green), the pair contribution of thevariable l approach (black), the triradical form factor at maximum l (dashed red),the form factor power scaled with zN (red) and the form factor at minimum l(grey). Scaling with zN, measuring at minimum l and the variable l approachreduce the ghost peak in the distance distribution. (F) Residuals against thebiradical data of the triradical dipolar evolution functions at maximum l (dashedred), power scaled with zN (red) and at minimum l (grey).
PCCP Paper
Ope
n A
cces
s A
rtic
le. P
ublis
hed
on 2
2 Fe
brua
ry 2
013.
Dow
nloa
ded
on 1
/28/
2022
7:4
3:35
AM
. T
his
artic
le is
lice
nsed
und
er a
Cre
ativ
e C
omm
ons
Attr
ibut
ion
3.0
Unp
orte
d L
icen
ce.
View Article Online
This journal is c the Owner Societies 2013 Phys. Chem. Chem. Phys., 2013, 15, 5854--5866 5865
amounts of multi-spin contributions and yields very reliableresults for symmetric geometries. However, if the result isnot clear without ambiguity, especially in the presence ofaggregation, unknown or irregular interspin geometry orunknown flexibility of the sample under investigation, werecommend to combine the power scaling approach withthe minimum l approach, a measurement at artificiallylowered inversion efficiency, subsequently followed by a checkfor self-consistency. When the geometry of the sample underinvestigation is asymmetric and relatively flexible, the distancedistributions obtained from the variable l approach, theminimum l approach and the power scaling approach mightnot differ very much from each other and also from thedistance distribution obtained from the original formfactor at maximum inversion efficiency. In a symmetric andconformationally relatively rigid case however, ghost distancecontributions should be very disturbing.
3 Experimental3.1 Modelling and data analysis
Experimental data were analyzed with DeerAnalysis2011.11
Home-written Matlab (The MathWorks Inc, Natick, MA, USA)routines were used for the simulation of the multiple-spinsystems and for all analysis exceeding a simple backgroundfit of the experimental data traces. Tikhonov regularization wasperformed with adapted subroutines of DeerAnalysis2008.
3.2 Sample preparation of the model system
Detailed descriptions of the syntheses of the biradical and thetriradical are described in ref. 10 and 26.
The samples with total concentrations of E100 mmol L�1
were produced by dissolving the pure sample substance inperdeuterated o-terphenyl heated slightly above the meltingpoint. The crystallized samples were powdered and filled into3 mm tubes. Immediately before introducing the probes intothe EPR probehead, the probes were melted again in the hot airstream of a heat gun, shock-frozen in liquid nitrogen andimmediately introduced into the EPR probehead precooledto 50 K.
3.3 Pulse EPR
The EPR experiments were performed on a Bruker Elexsys E580and an Elexsys II pulse EPR spectrometer (Bruker Biospin,Karlsruhe, Germany) at X-band frequencies (E9.3–9.4 GHz)equipped with an overcoupled Bruker Flexline MS3 split-ringresonator at a temperature of 50 K. For the Elexsys E580spectrometer, the second microwave frequency was providedby an E8257D PSG Analog Signal Generator (Agilent, SantaClara, CA) limited to 17 dBm output and fed into one of thepulse forming units of the spectrometer. For the Elexsys IIspectrometer, the built-in second frequency source was used.
Dipolar time evolution data were obtained using the fourpulse double electron–electron resonance (DEER) experi-ment.27 The experiments were performed with the pump pulsefrequency coinciding with the maximum of the nitroxide
spectrum. The flip angle b = p of the pump pulse at a pulselength of 12 ns was determined by setting the pump pulse tothe spectrometer frequency and optimizing the echo inversionusing the pulse sequence (bpump) � T � (p/2) � (t) � (p) � (t) �echo. After pump pulse optimization, the frequency of thespectrometer (observer pulses) was increased by 65 MHz andthe observer pulses were set. The length of all observer pulseswas 32 ns. The first observer pulse was phase cycled [+hxi �h�xi] to cancel the receiver offset.
Lower flip angles b of the pump pulse were obtained bydecreasing the pump pulse power at a constant main attenuatorsetting of 0 dB. The numerical values of the inversion efficiency lused for fitting the series of DEER traces at variable l wereobtained by inverting eqn (18).
4 Conclusion
Power scaling of the form factor with an exponent zN = 1/(N� 1)significantly suppresses combinations of dipolar frequencies insystems with N spins (N > 2) that otherwise manifest as ghostpeaks in the distance distribution.
The approach provides only an approximation to the truepair contribution in the form factor, but is computationallyefficient, does not require additional experimental effort anddoes not depend on a very high signal-to-noise ratio. In contrast,a previously established approach requires the measurement ofseveral DEER traces with very high signal-to-noise ratio.
Furthermore, there is no need to know the exact value oflabelling efficiency f or inversion efficiency l. The approachworks best on relatively rigid and symmetric three- and fourspin systems for inversion efficiencies up to l E 0.6 and is alsoeffective for five-spin systems with C5 symmetry, if the inversionefficiency is lowered to l = 0.4 or less. We would expect that theapproach is also useful for even larger numbers of coupledspins, if the inversion efficiency is further lowered.
For symmetric tri- and tetraradicals, analysis of simulateddata shows that the approach gives a distance distributionthat agrees almost perfectly with the true interspin distanceinformation. For symmetric pentaradicals, this is true for lowinversion efficiencies.
These simulation results are broadly confirmed by experi-mental results for triradicals, although performance on experi-mental data is slightly worse. However, not in a single case weobserved worsening of the distance distribution of symmetricmultiple-spin systems by power scaling. The extent of the improve-ment varies, but some improvement was always observed.
The power scaling approach might be extensible to not onlysuppress ghost frequency contributions, but to also retrievethem in order to extract further information on the interspindistance geometry.
However, when the symmetry is not high, the corrections areless significant and the approaches may not perform as well.Data obtained on scalene triradicals are in line with theseexpectations.
Orientation selection and other experimental uncertaintiesmight seriously compromise the determination of the optimum
Paper PCCP
Ope
n A
cces
s A
rtic
le. P
ublis
hed
on 2
2 Fe
brua
ry 2
013.
Dow
nloa
ded
on 1
/28/
2022
7:4
3:35
AM
. T
his
artic
le is
lice
nsed
und
er a
Cre
ativ
e C
omm
ons
Attr
ibut
ion
3.0
Unp
orte
d L
icen
ce.
View Article Online
5866 Phys. Chem. Chem. Phys., 2013, 15, 5854--5866 This journal is c the Owner Societies 2013
scaling exponent, but do not seriously compromise the perfor-mance of the power scaling approach.
But even for these and for cases where complete suppression ofhigher-order contributions cannot be achieved, power scaling mayhelp to identify the presence of ghost contributions. If the applica-tion on a trace with reasonable signal-to-noise data significantlychanges the distance distribution, this means that couplings tomore than two spins are existing within one nanoobject and thatthe distance distribution has to be interpreted with care, possiblyafter remeasuring with lower inversion efficiency.
The approach described in this work is available in theprogram DeerAnalysis2013, which can be downloaded atwww.epr.ethz.ch/software/index.
Acknowledgements
We thank Rene Tschaggelar for technical support and Dr MaximYulikov for valuable comments. Financial support from SNF(20PA21E-131216) is gratefully acknowledged.
References
1 O. Schiemann and T. F. Prisner, Q. Rev. Biophys., 2007, 40,1–53.
2 Y. D. Tsvetkov, A. D. Milov and A. G. Maryasov, Russ. Chem.Rev., 2008, 77, 515–550.
3 G. Jeschke, Annu. Rev. Phys. Chem., 2012, 63, 419–446.4 J. A. Merten, K. M. Schultz and C. S. Klug, Protein Sci., 2012,
21, 211–218.5 M. J. Junk, H. W. Spiess and D. Hinderberger, J. Magn.
Reson., 2011, 210, 210–217.6 P. Braun, B. Nagele, V. Wittmann and M. Drescher, Angew.
Chem., Int. Ed., 2011, 50, 8428–8431.7 C. Dockter, A. Mueller, C. Dietz, A. Volkov, Y. Polyhach,
G. Jeschke and H. Paulsen, J. Biol. Chem., 2012, 287, 2915–2925.8 B. Endeward, J. A. Butterwick, R. MacKinnon and
T. F. Prisner, J. Am. Chem. Soc., 2009, 131, 15246–15250.9 O. Dalmas, H. C. Hyde, R. E. Hulse and E. Perozo, J. Am.
Chem. Soc., 2012, 134, 16360–16369.10 G. Jeschke, M. Sajid, M. Schulte and A. Godt, Phys. Chem.
Chem. Phys., 2009, 11, 6580–6591.
11 G. Jeschke, V. Chechik, P. Ionita, A. Godt, H. Zimmermann,J. Banham, C. R. Timmel, D. Hilger and H. Jung, Appl. Magn.Reson., 2006, 30, 473–498.
12 G. Jeschke and Y. Polyhach, Phys. Chem. Chem. Phys., 2007,9, 1895–1910.
13 Y. Polyhach, E. Bordignon, R. Tschaggelar, S. Gandra,A. Godt and G. Jeschke, Phys. Chem. Chem. Phys., 2012, 14,10762–10773.
14 Y. Asada, R. Mutoh, M. Ishiura and H. Mino, J. Magn. Reson.,2011, 213, 200–205.
15 P. E. Spindler, Y. Zhang, B. Endeward, N. Gershernzon,T. E. Skinner, S. J. Glaser and T. F. Prisner, J. Magn. Reson.,2012, 218, 49–58.
16 A. Doll, S. Pribitzer, R. Tschaggelar and G. Jeschke, J. Magn.Reson, 2013, 230, 27–39.
17 S. Domingo-Kohler, M. Spitzbarth, K. Diederichs, T. Exnerand M. Drescher, J. Magn. Reson., 2011, 208, 167–170.
18 B. E. Bode, D. Margraf, J. Plackmeyer, G. Durner,T. F. Prisner and O. Schiemann, J. Am. Chem. Soc., 2007,129, 6736–6745.
19 D. Hilger, H. Jung, E. Padan, C. Wegener, K.-P. Vogel,H.-J. Steinhoff and G. Jeschke, Biophys. J., 2005, 89,1328–1338.
20 A. Maryasov and Y. Tsvetkov, Appl. Magn. Reson., 2000, 18,583–605.
21 A. Milov, B. Naumov and Y. Tsvetkov, Appl. Magn. Reson.,2004, 26, 587–599.
22 G. Jeschke, M. Sajid, M. Schulte, N. Ramezanian, A. Volkov,H. Zimmermann and A. Godt, J. Am. Chem. Soc., 2010, 132,10107–10117.
23 M. Sajid, G. Jeschke, M. Wiebcke and A. Godt, Chem.–Eur. J.,2009, 15, 12960–12962.
24 G. Jeschke, M. Sajid, M. Schulte, N. Ramezanian, A. Volkov,H. Zimmermann and A. Godt, J. Am. Chem. Soc., 2010, 132,10107–10117.
25 B. E. Bode, J. Plackmeyer, T. F. Prisner and O. Schiemann,J. Phys. Chem. A, 2008, 112, 5064–5073.
26 A. Godt, C. Franzen, S. Veit, V. Enkelmann, M. Pannier andG. Jeschke, J. Org. Chem., 2000, 65, 7575–7582.
27 M. Pannier, S. Veit, A. Godt, G. Jeschke and H. W. Spiess,J. Magn. Reson., 2000, 142, 331–340.
PCCP Paper
Ope
n A
cces
s A
rtic
le. P
ublis
hed
on 2
2 Fe
brua
ry 2
013.
Dow
nloa
ded
on 1
/28/
2022
7:4
3:35
AM
. T
his
artic
le is
lice
nsed
und
er a
Cre
ativ
e C
omm
ons
Attr
ibut
ion
3.0
Unp
orte
d L
icen
ce.
View Article Online