Collisional and Dynamical History of Ida
13
ICARUS 120, 106–118 (1996) ARTICLE NO. 40 Collisional and Dynamical History of Ida RICHARD GREENBERG,WILLIAM F. BOTTKE,MICHAEL NOLAN, 1 PAUL GEISSLER,JEAN-MARC PETIT, 2 AND DANIEL D. DURDA Lunar and Planetary Laboratory, University of Arizona, Tucson, Arizona 85721 E-mail: [email protected] ERIK ASPHAUG NASA Ames Research Center, Moffett Field, California 94035 AND JAMES HEAD Brown University, Providence, Rhode Island 02912 Received April 3, 1995; revised July 24, 1995 surprisingly steep size distribution, and global jolting by large impacts modifies the cratering record by frequently The history of Ida is constrained by its membership in the Koronis family, its satellite Dactyl, the record of impacts left on erasing smaller craters over the entire surface. Ida differs its surface, and other dynamical, morphological, and spectral from Gaspra in a number of fundamental ways, both in its properties. Models of crater production and comparably effec- observable physical properties and in its setting among tive erasure processes, combined with the current size– impacting populations of smaller bodies. The challenge to frequency distribution of craters, suggest that the age of the interpreters is to develop a scenario for the history of surface is either about 50 myr or .1 byr. The younger age may Ida that accounts for its differences from Gaspra, while be inconsistent with the degraded appearance of many craters, invoking a consistent physical model. while the older age conflicts with the collisional life expectancy The following differences provide critical constraints in of Dactyl. Consideration of Dactyl’s evolution may resolve this developing such a scenario: issue as well as shed light on the formation of Dactyl, the density of Ida, and possible source regions for Ida and Dactyl (a) Ida is much larger than Gaspra (about 56 km long), within the Koronis parent body. 1996 Academic Press, Inc. and even more elongated and irregular in shape (Belton et al. 1994). Impactors of a given size are likely to produce different sized craters on Ida than on Gaspra, and to have I. INTRODUCTION different ancillary effects such as jolting other portions of the surface (Greenberg et al. 1994). The irregular shape Like the asteroid 951 Gaspra, the asteroid 243 Ida, more suggests for Ida (and maybe even for Gaspra) a global recently imaged by the Galileo spacecraft (Belton et al. structure of large solid blocks underlying rubble and 1994), formed and evolved under the overwhelming influ- regolith. ence of collisional processes. Interpretation of the earlier (b) Ida is a member of a dynamical family, the promi- images of Gaspra, based on theoretical models of the re- nent Koronis family, while Gaspra is not. Family member- sults of impacts on such an irregular small body (18 km ship places constraints on Ida’s formation and lifetime: in length), revealed new results regarding the collisional According to an estimate of the time for collisions to erode environment around Gaspra, and the nature of the re- and diffuse the Koronis family so that it would be indistin- sponse of Gaspra to impacts (Greenberg et al. 1994). For guishable from the background population, the family must example, the impacting population was found to have a be less than about 1.5 byr old (Durda 1993). A similar result (,2 byr) has been obtained by Marzari et al. (1995). 1 Current address for M. C. Nolan: Arecibo Observatory, PO Box 995, Observed rotation rates suggest an age limit of ,4 byr Arecibo, PR 00613. (Binzel 1988, although that result is referenced as ,1 byr 2 Permanent address for J.-M. Petit: Observatoire de Nice, B.P. 139, F-06003 Nice, France. by Belton et al. 1994), so Durda’s estimate of ,1.5 byr 106 0019-1035/96 $18.00 Copyright 1996 by Academic Press, Inc. All rights of reproduction in any form reserved.
-
Upload
independent -
Category
Documents
-
view
0 -
download
0
Transcript of Collisional and Dynamical History of Ida

ICARUS 120, 106–118 (1996)ARTICLE NO. 40
Collisional and Dynamical History of Ida
RICHARD GREENBERG, WILLIAM F. BOTTKE, MICHAEL NOLAN,1 PAUL GEISSLER, JEAN-MARC PETIT,2
AND DANIEL D. DURDA
Lunar and Planetary Laboratory, University of Arizona, Tucson, Arizona 85721E-mail: [email protected]
ERIK ASPHAUG
NASA Ames Research Center, Moffett Field, California 94035
AND
JAMES HEAD
Brown University, Providence, Rhode Island 02912
Received April 3, 1995; revised July 24, 1995
surprisingly steep size distribution, and global jolting bylarge impacts modifies the cratering record by frequentlyThe history of Ida is constrained by its membership in the
Koronis family, its satellite Dactyl, the record of impacts left on erasing smaller craters over the entire surface. Ida differsits surface, and other dynamical, morphological, and spectral from Gaspra in a number of fundamental ways, both in itsproperties. Models of crater production and comparably effec- observable physical properties and in its setting amongtive erasure processes, combined with the current size– impacting populations of smaller bodies. The challenge tofrequency distribution of craters, suggest that the age of the interpreters is to develop a scenario for the history ofsurface is either about 50 myr or .1 byr. The younger age may Ida that accounts for its differences from Gaspra, whilebe inconsistent with the degraded appearance of many craters,
invoking a consistent physical model.while the older age conflicts with the collisional life expectancyThe following differences provide critical constraints inof Dactyl. Consideration of Dactyl’s evolution may resolve this
developing such a scenario:issue as well as shed light on the formation of Dactyl, thedensity of Ida, and possible source regions for Ida and Dactyl (a) Ida is much larger than Gaspra (about 56 km long),within the Koronis parent body. 1996 Academic Press, Inc. and even more elongated and irregular in shape (Belton
et al. 1994). Impactors of a given size are likely to producedifferent sized craters on Ida than on Gaspra, and to haveI. INTRODUCTIONdifferent ancillary effects such as jolting other portions ofthe surface (Greenberg et al. 1994). The irregular shapeLike the asteroid 951 Gaspra, the asteroid 243 Ida, moresuggests for Ida (and maybe even for Gaspra) a globalrecently imaged by the Galileo spacecraft (Belton et al.structure of large solid blocks underlying rubble and1994), formed and evolved under the overwhelming influ-regolith.ence of collisional processes. Interpretation of the earlier
(b) Ida is a member of a dynamical family, the promi-images of Gaspra, based on theoretical models of the re-nent Koronis family, while Gaspra is not. Family member-sults of impacts on such an irregular small body (18 kmship places constraints on Ida’s formation and lifetime:in length), revealed new results regarding the collisionalAccording to an estimate of the time for collisions to erodeenvironment around Gaspra, and the nature of the re-and diffuse the Koronis family so that it would be indistin-sponse of Gaspra to impacts (Greenberg et al. 1994). Forguishable from the background population, the family mustexample, the impacting population was found to have abe less than about 1.5 byr old (Durda 1993). A similarresult (,2 byr) has been obtained by Marzari et al. (1995).
1 Current address for M. C. Nolan: Arecibo Observatory, PO Box 995,Observed rotation rates suggest an age limit of ,4 byrArecibo, PR 00613.(Binzel 1988, although that result is referenced as ,1 byr2 Permanent address for J.-M. Petit: Observatoire de Nice, B.P. 139,
F-06003 Nice, France. by Belton et al. 1994), so Durda’s estimate of ,1.5 byr
1060019-1035/96 $18.00Copyright 1996 by Academic Press, Inc.All rights of reproduction in any form reserved.

COLLISIONAL AND DYNAMICAL HISTORY OF IDA 107
stands as the strongest constraint independent of the Ida rotation yields a complex dynamical environment that canhave significant effects on the transport and distributionimages. The family probably does not contribute signifi-
cantly to the total population impacting Ida (Bottke et of impact-derived ejecta (Geissler et al. 1996). These dy-namical effects can affect the observed spatial distributional. 1994), unless the family has a grossly disproportionate
number of members too small to see (Zappala and Cel- of boulders over the surface of Ida (Geissler et al. 1994a,b)and the range of stable orbits of Ida’s moon (Petit et al.lino 1994).
(c) Ida has a satellite, Dactyl, whose existence places 1994), as well as the transport of ejecta between Dactyland Ida (Geissler et al. 1994c).specific constraints on the collisional history of Ida. A
process, such as an impact event, by which Dactyl was In this paper we develop a scenario for the impact historyof Ida that fits the above observational constraints. Ourliberated from Ida and placed into orbit is implausible.
More likely, Dactyl is a primordial companion, bound to scenario invokes the same impacting-population size distri-bution as was implied by the Gaspra analysis by GreenbergIda since the disruption of their common source, the Kor-
onis parent body (Durda 1994). An object of Dactyl’s size et al. (1994). We model the same impact processes of craterformation and of crater removal as in the Gaspra model,is unlikely to survive impact disruption for more than 108
yr, which is at odds with some estimates of the age of with scaling appropriate to the size of Ida based on hy-drocode simulations of impacts. We show that the craterIda (p1 byr according to Belton et al. 1994) based on a
preliminary interpretation of the crater statistics. Due to statistics admit two contradictory age ranges for Ida, whichmay be resolved by other considerations, including thethe shape and rotation of Ida, the observed orbit of Dactyl
is unstable on time-scales ,1 yr unless the mass density origin and nature of Dactyl. We examine the dynamicalconstraints on Dactyl (Petit et al. 1994) that imply a lowof Ida is well below 3 g/cm3 (Petit et al. 1994, Belton et
al. 1995). mass density of Ida. Finally, we consider the implicationsof all these dynamical and compositional constraints, in-(d) Ida is located closer to the center of the main belt,
so approximately 40% more asteroids cross its orbit than cluding the observed colors of Ida and Dactyl, for theoriginal formation from the Koronis parent body.cross Gaspra’s. The impact frequency is probably propor-
tionately higher, assuming that the observable larger aster-oids provide a measure of the relative numbers of small II. CRATER STATISTICSimpactors (Bottke et al. 1994).
(e) Because Ida’s orbital eccentricity and inclination are The cumulative size–frequency distribution for cratersis shown in Fig. 1. The solid curves show crater counts forunusually small relative to most main-belt asteroids, impact
velocities are generally low on Ida. The average value is Gaspra and Ida reported by Belton et al. (1992 and 1994,respectively), with dashed lines to the left showing extrapo-3.55 km/sec, compared with 5.0 km/sec for Gaspra (Bottke
et al. 1994). lations down to about 100 m, where values are approxi-mately equal. The extension up to 4 km diameter for Gas-(f) The size distribution of craters is markedly different
on Ida compared with Gaspra. The area density of all pra is based on the interpretation of large concavities ascraters by Greenberg et al. (1994).craters with diameter larger than 200 m is similar on both
bodies, but there are five times as many craters (per unit For Ida, we add counts up to p15 km diameter, as shownin Fig. 1. Some of these very large craters were identified byarea) larger than 1 km on Ida as on Gaspra (Belton et
al. 1994). Belton et al. (1994), but were not included in the statisticspresented there. A key to the ten features we identify as(g) Large concavities on Ida, with dimensions compara-
ble to those of the asteroid (several nearly 10 km in diame- large craters is shown in Fig. 2. An additional large concav-ity (#11 in Fig. 2) does have a strikingly circular appearanceter or larger), have the appearance of impact craters, albeit
with somewhat unusual morphologies (Asphaug et al. in some image frames, but is more likely a feature of thelarge-scale structural shape of Ida in that region and is not1996). Proportionately large concavities on Gaspra appear
very different from familiar craters, but may well be craters included in our counts. As shown in Fig. 1, in contrast toGaspra, multi-km craters on Ida follow the same powernonetheless (Greenberg et al. 1994). For craters larger than
3 km, we count a similar number per unit area on Ida to law as smaller craters.The size distribution for Ida from 100 m to 4 km (Fig.the estimate for Gaspra by Greenberg et al. (1994). On
Ida the largest craters (4–10 km diameter) follow approxi- 1) is strikingly similar to the theoretical distribution ob-tained by Greenberg et al. (1994) for Gaspra (their Fig. 13mately the same power-law size distribution as smaller
craters, while on Gaspra the largest ones (1–4 km) are curve labeled ‘‘cookie-cutter’’). In fact, the Ida data fit thattheoretical Gaspra curve better than the Gaspra data do.overabundant relative to an extrapolated power law.
(h) Ida is one of the fastest rotators among known aster- In order to reconcile the theoretical Gaspra distributionwith the steeper and more curved Gaspra observationaloids (Lagerkvist et al. 1989), with a period of only 4.63 hr.
Combined with Ida’s elongated and irregular shape, this data, Greenberg et al. (1994) invoked a crater-erasing im-
108 GREENBERG ET AL.
an age of 1 byr. However, impact processes have alreadybeen shown by Greenberg et al. (1994) in the case of Gasprato erase previously existing craters (even larger than 1 km),as well as produce new ones, so that Gaspra is likely tobe p1 byr old. Similar consideration of the surface effectsof collisions is required for interpretation of the impactrecord on Ida.
III. CRATER PRODUCTION
A. Production Law
Impact crater sizes have generally been related to thesizes of impactors by using scaling laws (e.g., Housen andHolsapple 1990), which extrapolate experimental resultsvia dimensional analysis up to relevant planetary scales.Belton et al. (1992, 1994) continue to apply that theoreticalapproach. Crater sizes can also be modeled using recentlydeveloped hydrodynamic numerical simulations of the ef-fects of impacts (Melosh et al. 1992, Asphaug 1993). These‘‘hydrocode’’ models give results significantly differentfrom the scaling laws, especially for large-crater formationon small target bodies. For example, Asphaug and Melosh(1993) showed how a crater as large as Stickney could formon Mars’ moon Phobos, an event that seemed impossibleaccording to scaling laws. For Gaspra, hydrocode resultsshowed how a such a small body could survive extremelyenergetic impacts which leave craters comparable to thesize of the asteroid itself, contrary to expectations from
FIG. 1. Crater size–frequency distributions based on the numbers scaling laws (Greenberg et al. 1994).of craters counted on Gaspra and Ida as a function of size from theApplying the same hydrocode to a larger target (Nolansources shown. Cumulative number is the number of craters larger than
et al. 1993, Nolan 1994) yields the crater production rela-a given diameter. For Ida, multi-km craters follow the same power lawas smaller craters. For Gaspra, the distribution curves up for multi-km tionship that we adopt in modeling the history of Ida. Thiscraters. Extrapolation to smaller sizes (dashed lines to left) shows conver- relationship indicates the size of a crater produced by angence near 100 m. impactor of a given size, striking the target at 3.55 km/
sec, which is the mean value for the impacting populationaccording to Bottke et al. (1994). In constructing the craterproduction relationship we assume a spherical target withpact by a 400 m projectile 50 myr ago, an event expected
to occur roughly every 500 myr. An initial hypothesis to a volume equal to that of the asteroid.The hydrocode crater sizes for various size impactorsexplain the Ida data might be that they represent the results
predicted by the theoretical size distribution without the are indicated by triangles in Fig. 3. These results actuallyshow the sizes of the cavities of extreme structural damage,slightly ad hoc recent big impact. However, as we show
below, that simple explanation does not work, because so they represent upper limits to the crater size. In mostcases the velocity field for the material shows that nearlyall the processes that determine the expected crater size
distribution (production, ‘‘jolt erasure,’’ ‘‘cookie-cutter’’ all of it is excavated from the crater. However, for the mostenergetic impacts modeled by the hydrocode (impactorsremoval, and ‘‘sand-blasting’’) scale differently on Ida than
on Gaspra due to the different size of the target. larger than about 50 m in diameter), gravity limits theamount of material than can leave the crater (Nolan 1994),Those important surface modification processes also ren-
der problematic another interpretation of crater statistics. such that final crater size is most accurately constained bygravity-scaling laws. Dashed lines in Fig. 3 show the craterBelton et al. (1992, 1994) assumed that craters larger than
1 km represent an essentially unmodified production popu- size based on gravity-scaling relationships (from Melosh1989) for Ida (and for comparison, for Gaspra). Thereforelation on both Gaspra and Ida. For Gaspra, that model
led to an age estimate of 200 myr. For Ida, with five times we adopt the crater production law shown by the solidline, following the hydrocode results up to impactors ofas many craters larger than 1 km (Fig. 1), they estimated

COLLISIONAL AND DYNAMICAL HISTORY OF IDA 109
FIG. 2. Key to the 10 largest craters on Ida included in Fig. 1. The depression labeled #11 is not included as an impact crater. Approximatediameters are:
#1 (Mammoth) p9.6 km#2 (Lascaux) p9.9 km#3 (Undara) p9.8 km#4 (no name) p7.8 km#5 (Sterkfontein) p5.3 km#6 (Postumia) p6.3 km#7 (Wien Regio) p15 km#8 (Castellana) p5 km#9 (Orgnac) p13 km#10 (Azzurra) p7.6 km

110 GREENBERG ET AL.
with the scaling law of Housen et al. (1991). Similar simula-tions with an ellipsoidal target of Ida’s dimensions showthat it could survive a collision with a projectile larger than3 km diameter at this velocity, but only if the impact sitewere near an end of the long axis. Such an event is relativelyimprobable, so in constructing our scenario for Ida weconsider the 2 km projectile to represent the largest surviv-able hit.
B. Impacting Population
The production law defined by Fig. 3 can be applied toan assumed incoming population of projectiles to obtaina crater production function. We assume that the projectilepopulation is the same as that which best fit the Gaspracrater record in the scenario of Greenberg et al. (1994); i.e.,the size distribution follows that of the Palomar–LiedenSurvey down to asteroid diameter 100 m, and then steepensso that its incremental exponent is 24 for smaller bodies,
dn 5 2.7 3 1012D22.95 dD for D . 100 m
dn 5 3.4 3 1014D24 dD for 6 m , D , 100 m,FIG. 3. Crater size produced by a given size impactor hitting Ida at3.55 km/sec. Triangles show results from hydrocode simulations, withexcavation of damaged material limited by the ‘‘gravity scaling’’ line. We where dn is the number of main-belt asteroids betweenadopt the relationship shown by the solid line. For impactors smaller
diameter (in meters) D and D 1 dD. The functions meetthan 6 m diameter, the curve follows a slope of 1, consistent with strength-and are equal at D 5 100 m. We cut the distribution atscaling. For impactors larger than 2 km, the asteroid is destroyed by
catastrophic fragmentation; for impactors from 1 km to 2 km global 6 m because there are no cratering data for smaller sizes,damage is too extensive to leave a crater at the impact site. and we know the distribution must be less steep for very
small bodies to avoid infinite total mass.If that population bombards Ida for 3 byr according to
the intrinsic collision probabilities found by Bottke et al.50 m diameter and the gravity-scaling limit where ittakes over. (1994), the statistics of total numbers of craters produced
are as shown by the solid curve in Fig. 4. For comparison,Strength scaling, which would be expected to apply forsmaller craters, predicts a slope of 1 for the crater produc- the actual crater counts are shown to the same scale as in
Fig. 1. The difference of two orders of magnitude indicatestion relationship. Such a slope (shown by the dotted linein Fig. 3) fits the hydrocode results well for impactors that important processes have erased many of the craters
that have been created, and/or the surface is much youngersmaller than about 6 m diameter. For impactors larger thanthat size, the hydrocode results show a transition from than 3 byr.
We can estimate the frequency of disruptive impacts bystrength-controlled crater scaling with increasingly ener-getic impacts. This transition had not been successfully extrapolating the production curve in Fig. 4 to the right
and comparing it with the upper end of the crater produc-predicted by conventional scaling arguments, but is similarto that discovered for Gaspra (Greenberg et al. 1994). tion law (Fig. 3), yielding one or two impacts by projectiles
larger than 2 km over the 2900 km2 surface during 3 byr.The largest impactor that could plausibly leave a concav-ity recognizable as an impact site is 1 km in diameter, Thus 3 byr seems a reasonable upper limit to the age of
Ida in its current incarnation.because the resulting crater is already comparable in sizeto Ida. Thus impacts by projectiles with diameters .1 km We emphasize that our model assumes that the im-
pacting population is the same one that gave the best fitdo not create craters, but they do erase most preexistingcraters by extreme jolting (a process discussed in Section for Gaspra, and that it has not changed during the lifetime
of the surface. It is possible that, for a period of timeIV). The line in Fig. 3 is extended up to the size of impactor(2 km) above which catastrophic disruption would occur, immediately after the disruption of the Koronis parent
body, the population of impactors on Ida was quite differ-i.e., most fragments of the target would be ejected at veloci-ties sufficient for escape. This limit is obtained by hy- ent from what it has been since then. Credible modeling
of that possibility would be a great challenge, given thedrocode simulations of impact into spheres of diameter30 km (Nolan et al. 1993), Nolan 1994); it is also consistent current state of understanding of processes of large-body

COLLISIONAL AND DYNAMICAL HISTORY OF IDA 111
a 100 m body (Greenberg and Nolan 1989, Durda 1993).Preliminary study of this possibility suggests that even ifthe impacting population had been near equilibrium before50 myr ago, our conclusions (Sections IV and V) aboutthe age of the surface based on the current crater statisticswould remain unchanged.
IV. CRATER ERASURE PROCESSES
A. Jolting the Surface
Greenberg et al. (1994) introduced global jolting of anasteroid’s surface as a critical process governing the ob-served crater size distribution. As shown by Nolan’s hy-drocode simulations of impacts, an impact great enoughto create a crater of a few km diameter, or greater, causesmaterial over the entire surface to jump up and fall back,largely destroying topography of a scale that increases withthe impact energy, as shown in Fig. 5. For example, onIda, an impact that creates a 10 km diameter crater willsimultaneously destroy all craters smaller than 100 m. Fig-ure 5 also shows the similar relationship for Gaspra forcomparison. (The Gaspra curve has been improved slightlyby refinements in the hydrocode analysis since Greenberget al. 1994, but it has not changed enough to significantlyaffect that work.) On Gaspra, formation of a given sizecrater results in destruction of much more topography thanon Ida, due to the smaller size of the target.
FIG. 4. Theoretical crater size distribution for craters produced over3 byr, and for the number expected to remain on the surface after thevarious removal processes are taken into account. The curves includesuccessively more processes going down the page (e.g., the line labeled‘‘1Sandblasting’’ includes Production 1 Jolt 1 Sandblasting). Thestraight solid line represents the size distribution observed on Ida (fromFig. 1). The lowest dashed line (near the solid line) includes all productionand erasure processes considered here; it represents the steady-stateequilibrium distribution at 3 byr, i.e., with no major impacts either overdueor having occurred recently.
(Koronis parent) disruption. However, if the surfaceproves to be old enough so that crater production anderasure are in equilibrium (which holds for an age .1 byras shown in Section IV), any record of anomalous earlybombardment would have been erased by subsequent satu-ration cratering.
It is also plausible that the steep size–frequency distribu-tion that we have assumed for the impacting populationsmaller than 100 m is relatively recent. This distribution is
FIG. 5. An impact that creates a crater of a size shown on the ordinatenot consistent with the expected equilibrium for a collision-also removes by seismic shaking (‘‘jolts’’) all craters on the asteroidally evolved population (Dohnanyi 1969), so it might repre-smaller than indicated on the abscissa. Projectiles larger than 1 km in
sent the product of a recent large disruption event. In fact diameter (which create 30 km craters) may not actually create recogniz-this part of the population would be expected to come to able craters, but no craters are large enough to be safe from erasure by
jolt from such giant impacts.equilibrium in about 50 myr, i.e., equal to the lifetime of
112 GREENBERG ET AL.
The hydrocode models produce surface jolting even ifthe surface is solid rock, because the shock wave generatedby the impact fragments surface material. Even during thisprocess, in an irregularly shaped asteroid, it is plausible thatlarge interior blocks might remain unfractured because theshock would not advance uniformly through the interior,and because internal reflections of seismic waves wouldsuperpose in an irregular pattern.
The effect of periodic erasure of smaller craters, super-imposed over on-going production is shown in Fig. 4 by theline labeled ‘‘jolt.’’ This curve would predict the observedcrater statistics after 3 byr, if there were no other craterremoval processes in effect.
B. Sandblasting
While jolt is a process by which large-crater formationerases smaller craters, the cumulative effect of smaller cra-ters can erase larger ones as well, a process analogousto industrial sandblasting. Sullivan et al. (1996) describe
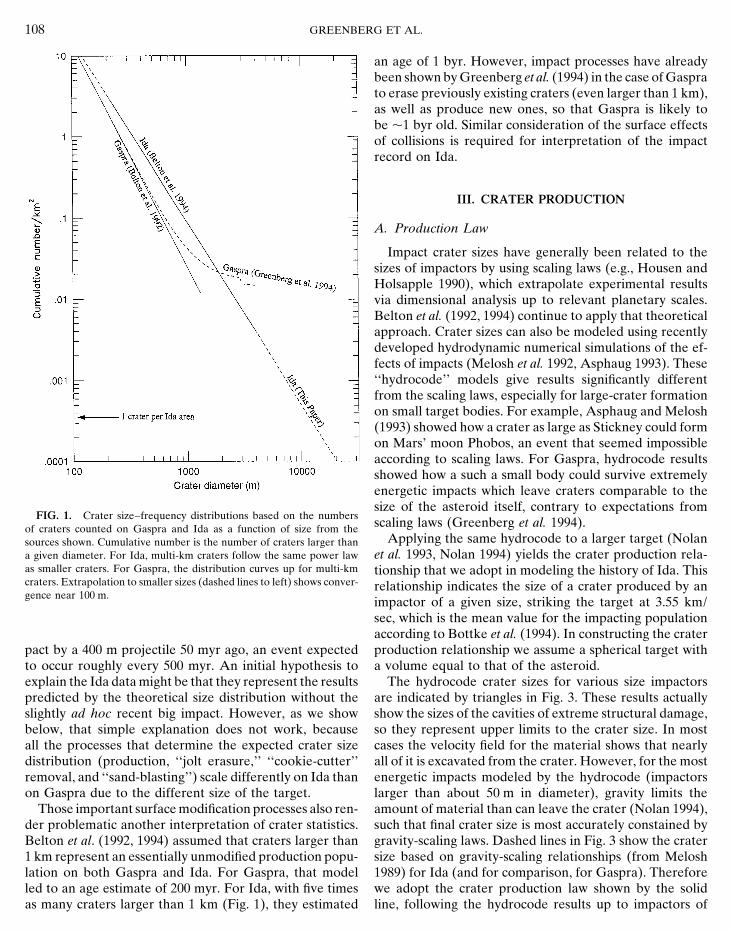
FIG. 6. In the model presented here, a large crater (diameter . 30evidence for this process in the morphology of erodedkm) destroys all topography (including preexisting craters) out to twicecraters on Ida. In order to model this effect, we assumethe crater’s radius (C 5 2), while craters smaller than 5 km only destroythat an existing crater is eliminated if the surface is thenfeatures within their own radius (C 5 1).
saturated three times over by craters with diameters be-tween 10% and 100% of its own. In other words, the lifetime
the small end of the observed size range. However, theof a crater is limited by the time it takes for the total areaslope of the distribution is too shallow, so there is an excessof craters produced in that size range to reach three timesof multi-km craters in this simple model.the target area. This algorithm is based on a model in
A more complete cookie-cutter algorithm takes into ac-which craters smaller than 10% of the size of the targetcount that local jolt and crater ejecta can erase a regioncrater are assumed to only soften its appearance, whilesomewhat beyong the rim of a new crater. Sullivan et al.impacts in the included range can destroy morphological(1996) describe evidence for seismic shaking of local re-structure enough to make it unrecognizable.gions around large impact craters, based on regolith matu-This sandblasting was a negligible process in the case ofrity inferred from surface color. Hydrocode simulationsGaspra, where jolting erases craters on such a short time(Nolan 1994) suggest a general increase in the obliterationscale that sandblasting effects never accrue. In fact we havefactor for multi-km craters, although they do not defineapplied the same algorithm described here to the case ofa precise relationship. We adopt the obliteration factorsGaspra, and it has no significant effect.shown in Fig. 6 (e.g., a crater larger than 10 km destroysIf we include sandblasting as well as jolting, the craterall smaller craters out to 1.2 radii from its center), which aresize distribution is moved down to the curve labeled ‘‘sand-somewhat arbitrary, but are consistent with the hydrocodeblasting’’ in Fig. 4, now much closer to the actual observedexperiments and with qualitative geological interpretation.craters on Ida.Inclusion of this more realistic algorithm for the cookie-cutter gives the lowest theoretical curve in Fig. 4 (‘‘cookie-C. The Cookie-Cutter Effectcutter with local jolt’’), which agrees quite well with obser-
Formation of a crater eliminates all smaller craters at vations of Ida.its impact site. This process cuts circular holes in the surface Based on this result alone, the cratering record seemsdistribution of craters, like a cookie cutter removing dough. consistent with an age of 3 byr for the surface of Ida, notWe first consider an assumption that any smaller crater is necessarily as short as the 1 byr value estimated by Beltondestroyed (rendered uncountable) if its center is within et al. (1994). The difference is due to our approach ofone radius of the center of the newly formed crater, i.e., modeling the impact processes (crater forming and erasing)the obliteration factor (defined by Greenberg et al. 1994) on an Ida-sized body, rather than relying on comparisonsis C 5 1. The effect on the distribution is shown by the with impact records on othe cratered planets. However,curve labeled ‘‘cookie cutter’’ in Fig. 4. This combination constraints other than the cratering record to rule out olderof production modified by jolting, sandblasting, and the ages. As discussed in Section I, the tightest such constraint
remains Durda’s (1994) estimate of ,p1.5 byr.cookie-cutter gives numbers of craters similar to those at

COLLISIONAL AND DYNAMICAL HISTORY OF IDA 113
of craters decrease with time between 1 byr and 3 byr is thaterasure (or, equivalently, extreme degradation) of theselarger craters can only be done by the most energetic possi-ble impacts, which generally do not occur until after 1 byr.
In comparison with the actual Ida crater counts, theexpected crater statistics for any age between 1 byr and3 byr fit well for craters from 200 m to 4 km. For largercraters, the 3 byr theoretical curve matches the observa-tions closely. The 1 byr curve is off by a factor of 2, butgiven uncertainties in statistics for multi-km craters, thisfit is acceptable. Therefore, our crater formation and de-struction scenario is consistent with Durda’s independentconstraint on the Koronis family’s age.
We next compare crater statistics expected at variousages of Ida (Fig. 8), continuing our discussion in order ofdecreasing age. At 500 myr the trend that was seen incomparing 1 byr with 3 byr continues with an even greaterdivergence from observed numbers of large craters (by afactor of 3) extending even further (down to craters of
FIG. 7. Similar to Fig. 4, except that size distributions for an assumedage of 1 byr are compared with those for 3 byr.
V. A MORE YOUTHFUL IDA
In order to explore whether younger ages for Ida’s sur-face might be consistent with the impact record, we com-puted theoretical crater size distributions based on thesame production and erasure processes as discussed above(including the local jolt effect of Fig. 6), but assuming ages.Figure 7 shows the crater distribution expected 1 byr afterstarting with an initial tabula rasa. By definition, the pro-duction curve is a factor of 3 lower than the 3 byr case.However, Fig. 7 shows that the various erasure processesreduce the numbers to nearly the same as in the 3 byrcase, again closely matching the observed counts. In otherwords, after 1 byr the surface is essentially saturated withcraters over the range from 200 m to 4 km; over that cratersize range further production is in equilibrium with erasure,so that the counts do not change between 1 and 3 byr.
However, for craters above 4 km in diameter, the theo-FIG. 8. Expected crater size distributions for a range of ages of Ida’sretical curve for a 1 byr age diverges from that for the
surface. At 50 myr, the theoretical curve fits the observed distribution.3 byr age. At larger crater sizes, there are more craters at For an older surface (up to nearly 1 byr), the expected numbers of craters1 byr than at 3 byr, despite the fact that there have only are higher. But after 1 byr, removal processes reduce the numbers to a
steady state near the observed distribution.been one third as many produced. The reason that numbers

114 GREENBERG ET AL.
p3 km), for the same reason as a 1 byr, but more so. At population has achieved a steady state, which would beconsistent with Belton et al.’s interpretation.an age of 250 myr, the mismatch extends from the largest
If the 50 myr age is to be defended at all, a case wouldcraters down to 1 km. However, at 250 myr the discrepancyneed to be made showing that the steep size distributionis never by more than a factor of 2, because of the veryof impactors could extend down to sub-meter scale andsmall crater production at this young age. In fact, at anaccount for the observed crater degradation in that shortage of only 50 myr (Fig. 8), the production curve for cratersamount of time. Another line of evidence that supportslarger than 1 km is down to the level of the actual observedthe 50 myr age comes from the existence of the satellitecounts, so the theoretical crater statistics match observa-Dactyl (see Sec. Ic). The most plausible origin for Dactyltions at all sizes.is a part of the same event that produced Ida, and it isIt may seem paradoxical that as age increases fromunlikely that Dactyl can survive catastrophic impact longer250 myr to 1 byr the number of intermediate-sized cratersthan 100 myr. In Section VI we discuss the implicationsdecreases back to the level at 50 myr. However, this resultof Dactyl for the history of the Ida/Dactyl system.is reasonable because the increasing numbers of larger
impacts tend to destroy craters in the 1–10 km size rangeuntil equilibrium is reached after about 1 byr. The size VI. IMPLICATIONS OF DACTYLdistributions computed here assume that no infrequentimpacts have occurred at anomalous times, e.g., that no A. Lifetime of Dactyllarge impacts are either overdue or have happened more
The lifetime of Dactyl can be read from Fig. 7 in therecently than their average frequency. Thus the curve forfollowing way. Impacts that create craters of about 1 km50 myr is based on an assumption that no anomalous largediameter on Ida would marginally destroy Dactyl (diame-impacts with mean frequencies of greater than 50 myr haveter 1.5 km). Fig. 7 shows that p2 such events occur in 1 byroccurred. The curves for .1 byr represent average condi-on a target area of 1 km2. Dactyl’s area is about 8 km2,tions in the steady state, not necessarily the actual condi-part of which at any time is protected from impact by thetion at any given time. For example, an anomalously recentcollisional shadow of Ida. Therefore, a disrupting impactlarge impact might temporarily lower the numbers ofis expected in p108 yr. If one assumes that Dactyl formedsmaller bodies or if large impacts are coming due, theas a satellite at the same time as the formation of Ida, thenumbers of small craters might temporarily increase aboveKoronis parent must have broken up only about 100 myrthe equilibrium. In such disequilibrium states, the size dis-ago. Durda’s (1993) calculation of the age of the Koronistribution would generally not be straight on these plots.family does allow such a young age if the parent body wasIn fact such a condition, due to an anomalous recent im-near the small end of possible sizes (diameter . 110 km,
pact, was required to explain the Gaspra crater-size statis-according to Zappala et al. 1984). The surface of Ida must
tics (Greenberg et al. 1994). Although even after 1 byr Ida be of the same age, consistent with our value of 50 myrmight often differ from the solution shown, the observed (Section V), not .1 byr.size-distribution can only match the model distribution at An age of Ida .1 byr seems to require that Dactylages .1 byr or near 50 myr. formed long after Ida. That hypothesis is difficult to sup-
Therefore it appears our model can match observed port because, as discussed in Section VII, formation alongcrater statistics for a surface age .1 byr (when crater num- with Ida seems to be the most plausible model; persuasivebers are in a steady state) or about 50 myr (when crater models of origin by capture or by ejection from Ida haveproduction still dominates). We can eliminate ages not yet been constructed. Nevertheless, there may be ways.1.5 byr based on Durda’s analysis. Next we consider po- to reconcile the most likely cratering history (Ida’s surfacetential ways to discriminate between an age of 50 myr on age .1 byr) with the most plausible satellite formationone hand and .1 byr on the other. mechanism (accompanying Ida’s formation). Perhaps a sat-
One approach is to consider morphology and general ellite did form along with Ida, but was disrupted (perhapsappearance of the craters on Ida. Belton et al. (1994) find several times), after which a large fragment, or a reaccumu-that about 60% of craters larger than 1 km appear ‘‘de- lation of fragments, formed the current satellite. A signifi-graded’’ (80% for craters .2 km). Belton et al. suggest that cant portion of the debris from the disruption would havethe substantial portion of degraded craters implies that the had to have been ejected at less than 2 m/sec to avoidsystem has reached saturation of craters, i.e., a steady state capture by Ida or escape. Further study of disruption pro-between production and removal. If that interpretation is cesses may shed light on the plausibility of this hypothesis.correct, it would rule out the age near 50 myr, for which Another possibility is that Dactyl has been gradually, butour models shows crater statistics to be dominated by pro- significantly, eroded as crater ejecta escaped the satelliteduction (Fig. 8). At 50 myr, removal processes have not during the past 100 myr, so that during most of that time
it was large enough to resist disruption by the largest im-had time to play a big role, but after 1 byr the crater

COLLISIONAL AND DYNAMICAL HISTORY OF IDA 115
lived even if their pericenter distances q ; a(1 2 e) areas small as 50 km. We have also discovered classes of com-mensurable retrograde orbits with even lower values of q.Stable prograde orbits are possible only in a more limitedrange. Prograde orbits with pericenter q , 70 km generallyescape from or collide with Ida within a few days. Thisnumerical study of orbital stability was described by Petitet al. (1994). (Applications of the same software to thedynamics of impact ejecta near Ida are discussed by Geis-sler et al. (1994a,b,c, 1996)).
The boundary for stable prograde orbits is shown onFig. 9 for comparison with the candidate orbits obtained byByrnes and D’Amario (1994). Our numerical experimentsincluded tests of the specific range of elliptical orbits pro-
FIG. 9. A wide range of Keplerian orbits fit the arc of motion ob- posed by Byrnes and D’Amario. In that set of orbits theserved during the Galileo encounter, each corresponding to a given as- general rule is confirmed: All orbits with q , 70 km im-sumed mass for Ida. The squares show the pericenter distance q as a
pacted Ida or escaped in only a few hours. The orbits withfunction of Ida’s mass (Byrnes and D’Amario 1994). Orbits with q , 70larger values of q are found to be stable for at least 107
km would be unstable, so the mass of Ida is less than about 4.8 3 1019
gm, which corresponds to a density of Ida ,3 gm/cm3 for a volume of sec, which corresponds to hundreds of orbital periods.16,000 km2. Because each candidate orbit corresponds to a particular
assumed mass for Ida, our limit on q provides an upperlimit on Ida’s mass of 4.8 3 1019 g. Combined with estimatesof Ida’s volume (Thomas et al. 1996), this result implies apactor to have hit it. In that case Dactyl may be muchmaximum density of about 3 g/cm3, and probably signifi-older than its current 100 myr life expectancy. This sce-cantly less (Belton et al. 1995). Interestingly, Farinella etnario, along with other considerations of the fate of ejectaal. (1981) had much earlier predicted that such a bodyfrom Dactyl, is explored in more detail by Geissler et al.might have density in this range.(1996).
If Ida were of ordinary chondritic composition (densityabout 3.6 g/cm3), it would need to have a porosity .20%B. Orbitto account for its low bulk density. Belton et al. (1995) also
Dactyl’s orbit also places important constraints on the consider a composition with high nickel–iron content (likenature and history of the Ida system. Galileo images of iron or stony-iron meteorities). Presumably, as for meteor-Dactyl over the duration of the encounter have permitted
ites, such a composition would result if Ida’s parent bodya fit to possible orbits (Byrnes and D’Amario 1994, Belton
had been differentiated and Ida inherited a disproportion-et al. 1995). Acceptable orbits lie close to a one-dimen-ate share of the densest component. In that case, to meetsional line in orbital a, e, i space: The semi-major axis athe bulk density constraint would require very high poros-might have any value greater than 40 km, but each a valueity, so Belton et al. (1995) favor a stony composition withhas a corresponding value of the orbital eccentricity. Alla chondritic amount of metal. We consider additional pos-candidate orbits have inclination i well constrained (be-sibilities. On one hand, although compositions similar tocause the Galileo camera was near the orbital plane) neariron or stony iron are ruled out by the above argument, it108 relative to prograde equatorial motion. (By progradeis still possible to have substantial enhancement of the ironwe mean in the same direction as Ida’s rotation; note how-component above chondritic quantities without requiringever that Ida’s rotation is retrograde relative to the eclip-implausible porosity. On the other hand, if the Ida/Koronistic.) Each candidate orbit also corresponds to a particularparent (diameter .110 km) had in fact been differentiated,assumed mass for Ida, as shown in Fig. 9.a sample of Ida’s size is more likely to represent mantleWe have examined the stability of a wide range of hypo-material than the relatively small volume of iron in a core.thetical orbits for objects orbiting Ida, by numerically in-In that case the material density would be near 3 g/cm3,tegrating the motion. Ida has been modeled as a triaxialpredominantly olivine, even with no porosity. If the sampleellipsoid, as a pair of contacting spheres with a masslessincluded crustal material (p2.7 g/cm3), its density wouldcylinder filling the space between them, and with a geome-be even less. Therefore, we conclude that a plausible modeltry similar to that reported by Thomas et al. (1996) for thefor Ida’s composition has no metallic component or consid-real Ida. Results are similar for all those cases; the specificerably less than the chondritic value. This model is dis-cases summarized here are based on the triaxial-ellipsoid
model. In general, retrograd orbits are stable and long- cussed further in Section VII.

116 GREENBERG ET AL.
VII. ORIGIN OF IDA AND DACTYL blue; specifically, in these regions the spectrum from blueto red is relatively flat and the minimum near 1 em is
As a member of the Koronis family, Ida is widely as- slightly deeper. At longer wavelengths these ‘‘blue’’ re-sumed to have formed from the disruption of the Koronis gions are indistinguishable from the rest of Ida. Such blueparent body. Durda (1994, 1996) has explored the dynamics regions have often been interpreted as representing ‘‘lessof formation of gravitationally bound fragments. He mod- mature’’ regolith in various planetary contexts, includingels a distribution of fragments with a power-law size distri- the discussion of Ida’s geology by Sullivan et al. (1996).bution moving outward from the disrupted body. A variety Geissler et al. (1996) show how emplacement of such lessof assumptions about the initial spatial and velocity distri- mature regolith may be mapped back dynamically to abution were tested, all within the range of conventionally specific source, the crater Azzurra.assumed models of catastrophic disruption. In order to be Dactyl looks different spectrally from both the red andconservative, Durda avoided models in which local initial blue regions of Ida. The satellite is similar to the predomi-conditions would favor clustering of material. Neverthe- nant (less blue) regions of Ida over visible wavelengths,less, in any disruption event p1% of the fragments of any but has a much deeper 1 em band. The Dactyl spectrumgiven size are members of bound pairs of bodies. Much then parallels Ida’s up to about 5 em, except for a slightless frequently, groups of three or more fragments are dip relative to Ida at about 2.3 em (Carlson et al. 1994,gravitationally bound. Granahan et al. 1994).
For about 50–70% of the bound pairs, the components While it may be possible to construct a model of Dactylcollide with one another, usually at speeds less than a few in which the satellite has the same composition as Ida,10’s of m/sec. In that case, the components would suffer with surface grain size tuned to give the observed spectralsome damage at the contact point and either come to rest structure, such a model would seem rather contrived. Inas a contact conglomerate structure, or bounce apart only contrast, the spectral features that distinguish Dactyl fromto join together upon subsequent impact. In other cases, Ida correspond in position to well-known compositionalthe components remain in mutual orbit like Ida and Dactyl. indicators, offering a more natural explanation. The nature
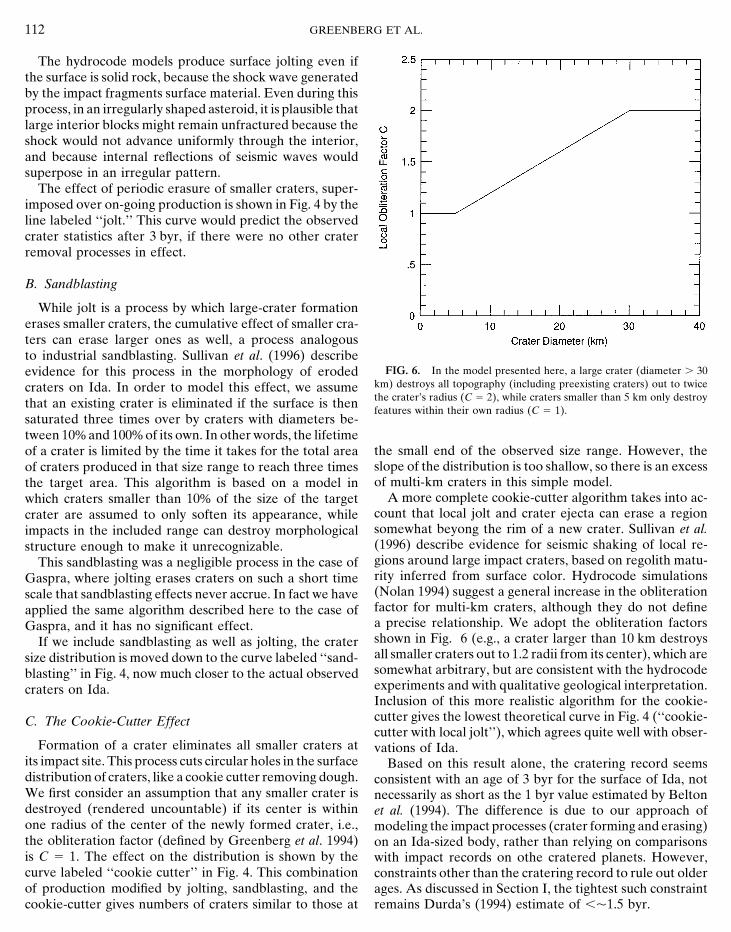
These results frequently produce objects with basic char- of the 1 em band for Dactyl can be interpreted as enrich-acteristics similar to Ida. The general shape of Ida suggests ment in either olivine or pyroxene relative to Ida. The dipan underlying structure dominated by two or three large at 2.3 em corresponds to another pyroxene band, sug-structural components, which may represent gravitation- gesting enrichment in that mineral specifically (Carlson etally bound fragments that have reaccumulated. Dactyl is al. 1994). Independent of whether the differences in spectralikely to be a fragment that remained bound but was between Ida and Dactyl are predominantly due to olivinenot reaccreted. or pyroxene, the implied difference in composition indi-
In the cases explored by Durda, components of most cates that there was some degree of differentiation in thebound pairs or groups originated along a roughly radial Koronis parent body.set of source positions within their parent body. Fragments Consider a differentiated parent body with diameterthat originate at different angular positions within the par- p150 km, and with metallic nickel-iron concentrated toent body (i.e., different latitudes or longitudes) diverge too some degree toward the center, and low density materialsquickly to remain gravitationally bound to one another. (pyroxene) near the structure (Fig. 10). If we were to carve
Further information on the source locations within the out an Ida-sized fragment (or fragments) at random, theKoronis parent body comes from the composition of Ida chance that it would include much metal is small. Surelyand Dactyl inferred from spectral information and the den- it would be improbable to sample just enough core tosity constraint (Section VI). Data from Galileo are prelimi- obtain a chondritic complement of metal. Most likely thenary due to complex issues of calibration and interpretation sample would be depleted in metal, and consistent withof sampling in wavelength. They do indicate a spectrum for the low density we infer from Dactyl’s orbit (Section VI).Ida that is consistent with chondritic (i.e., undifferentiated) Ida is most likely a sample of the parent body’s olivinecomposition, but we will discuss an alternative interpre- mantle (p90% of the volume of a differented chondrite),tation. with enough pyroxene (either undifferentiated from the
The imaging camera shows that for most of Ida’s surface, mantle or sampled as part of the crust) to appear ‘‘chon-there is a gradual rise in reflectivity from the violet to 1 dritic.’’em, with a local minimum near 1 em, which for rocky If Dactyl was created according to Durda’s model, itmaterials usually represents an absorption band due to must have formed either deeper in the parent than the Idapyroxene. The general increasing trend continues up to 5 material (more pure olivine from the deep mantle) or closeem according to preliminary results from Galileo’s Near- to the surface (sampling pyroxene). Either of these compo-Infrared Mapping Spectrometer (Carlson et al. 1994, Gra- sitions would be consistent with the spectral differences
between Dactyl and Ida, although if the 2.3 em feature innahan et al. 1994). Some parts of Ida’s surface appear more
COLLISIONAL AND DYNAMICAL HISTORY OF IDA 117
explanations of a variety of important observations andprocesses as described by Geissler et al. (1996). These stud-ies show how ejecta trajectories may have governed thedistribution of material over the surface, including globalerosion, transport of material between Ida and Dactyl(Geissler et al. 1994c), and emplacement of the large boul-ders (Geissler et al. 1994a,b) and the variously coloredunits or regolith discovered in Galieleo images.
Combining models of the physical processes of craterformation and removal by impacts with actual crater statis-tics on Ida suggests that Ida’s surface is either p50 myrold or .1 byr old. The existence of Dactyl, which probablyformed with Ida and which currently has a life expectancyof only 100 myr, seems to argue in favor of the youngerage. However, Dactyl may be the most recent incarnationof an earlier satellite that has eroded, or disrupted andreaccreted, to its current size. In that case Dactyl’s exis-tence could be consistent with an age .1 byr. The degradedcondition of many craters also qualitatively argues for anolder age (Belton et al. 1994), unless the population ofinpactors is dominated by small particles. All these con-
FIG. 10. Dynamical constraints on binary formation during parent- straints are consistent with the upper limit of about 1.5 byrbody disruption, plus compositional information inferred from spectral on Ida’s age (Durda 1993), based on the collisional historydata place constraints on the source of Ida and Dactyl in the Koronis
of the Koronis family.parent. The significant compositional difference between Dactyl and IdaAny reconstruction of the source of Ida and Dactyl mustimplies that the parent was at least somewhat differentiated. Here for
illustration we show a completely differentiated parent body, but similar synthesize dynamical and physical constraints with compo-implications could be drawn if the parent were only partially differenti- sitional information. Such a synthesis based on currentated. These models are not intended to be definitive, but rather to illus- understanding suggests that Ida’s parent body was substan-trate the importance of synthesizing physical, dynamical, and composi-
tially (but not necessarily completely) differentiated, suchtional information. (A) Ida is most likely to sample predominantly thethat Ida is depleted in iron, and that Dactyl sampled aolivine mantle, but must include the crust to account for its pyroxene
component. Dactyl (which contains either more olivine or more pyroxene compositionally different region in the parent body. Con-than Ida) probably came from a site radially aligned with Ida, either tinuing interdisciplinary approaches are needed to test thisdeeper in the mantle (olivine) or at the surface (pyroxene). (B) If Ida is model further.a contact binary, its components were originally radially aligned, withone sampling the pyroxene, and with Dactyl either deeper in the olivine
ACKNOWLEDGMENTSmantle or at the pyroxene surface. (C) It is also possible that an olivineDactyl comes from a site between major components blocks of Ida.
This work was made possible by Professor Greenberg’s participationon the Imaging Team of the NASA/JPL Galileo mission. We are gratefulto the members of the Imaging Team, led by Dr. M. Belton, for commentsand critiques on this specific work, and for providing a stimulating intellec-Dactyl’s spectrum proves to be real, it would argue stronglytual setting for the analysis of Galileo data. We thank all members offor Dactyl’s origin near the surface of the parent planet.the Galileo project for their contributions to obtaining the magnificentIt may also be possible to construct models based on partialimagery returned by the spacecraft. Careful reviews of the manuscript
or local differentiation. by Paolo Paolicchi and Eileen Ryan led to considerable improvements.Data processing for the work reported here was managed by Joe Plass-mann. Undergraduate assistant Terry Hurford helped with the analysisVIII. CONCLUSIONSof orbital stability for Dactyl. Much of the analysis reported here wassupported by a grant from NASA’s Planetary Geology and Geophys-Collisional and dynamical processes are central to nearlyics program.all of the observable properties of the Ida/Dactyl system.
Dactyl’s orbit places a meaningful constraint on Ida’s den-REFERENCESsity. Combined with spectral information about the colors
of Ida and Dactyl, and dynamical models of satellite forma- ASPHAUG, E., AND H. J. MELOSH 1993. The Stickney impact on Phobos:tion, the density helps us develop preliminary models of A dynamical model. Icarus 101, 144–164.the source of these bodies in the Koronis parent body. ASPHAUG, E. (1993). Dynamic Fragmentation in the Solar System. Ph.D.
Thesis, Univ. of Arizona.Investigation of orbital motion in the gravitational fieldof this odd-shaped, rapidly rotating body also provides ASPHAUG, E., J. M. MOORE, D. MORRISON, W. BENZ, M. C. NOLAN, AND
118 GREENBERG ET AL.
R. J. SULLIVAN 1996. Mechanical and geological effects of impact crater- D. DURDA 1994c. Erosion and regolith redistribution on Ida and itsmoon. Bull. Am. Astron. Soc. 26, 1157.ing on Ida. Icarus 120, 158–184.
GEISSLER, P., J.-M. PETIT, D. DURDA, R. GREENBERG, W. F. BOTTKE,BELTON, M. J. S., J. VEVERKA, P. THOMAS, P. HELFENSTEIN, D. SIMONELLI,M. C. NOLAN AND J. MOORE 1996. Erosion and ejecta reaccretion onC. CHAPMAN, M. E. DAVIES, R. GREELEY, J. HEAD, S. MURCHIE, K.243 Ida and its moon. Icarus 120, 140–157.KLAASEN, T. V. JOHNSON, A. MCEWEN, D. MORRISON, G. NEUKUM,
F. FANALE, C. ANGER, M. CARR, AND C. PILCHER 1992. Galileo encoun- GRANAHAN, J. C., F. P. FANALE, R. W. CARLSON, L. W. CAMP, K. P.ter with 951 Gaspra: First pictures of an asteroid. Science 257, 1647– KLAASEN, M. BELTON, C. R. CHAPMAN, A. S. MCEWEN, and the Galileo1652. NIMS and SSI instrument teams 1994. A Galileo multi-instrument
spectral view of 243 Ida and 1993 (243) 1. Bull. Am. Astron. Soc.BELTON, M. J. S., C. R. CHAPMAN, J. VEVERKA, K. P. KLAASEN, A.26, 1156.HARCH, R. GREELEY, R. GREENBERG, J. W. HEAD III, A. MCEWEN,
D. MORRISON, P. C. THOMAS, M. E. DAVIES, M. H. CARR, G. NEUKUM, GREENBERG, R., M. C. NOLAN, W. F. BOTTKE, AND R. KOLVOORD 1994.F. P. FANALE, D. R. DAVIS, C. ANGER, P. J. GIERASCH, A. P. INGERSOLL, Collisional history of Gaspra. Icarus 107, 84–97.AND C. B. PILCHER 1994. First images of asteroid 243 Ida. Science GREENBERG, R., AND M. C. NOLAN 1989. Delivery of asteroids and mete-265, 1543–1547. orites to the inner solar system. In Asteroids II, pp. 778–804. Univ.
Arizona Press.BELTON, M. J. S., C. R. CHAPMAN, P. C. THOMAS, M. E. DAVIES, R.GREENBERG, K. KLAASEN, D. BYRNES, L. D’AMARIO, S. SYNNOTT, HOUSEN, K. R., AND K. A. HOLSAPPLE 1990. On the fragmentation ofT. V. JOHNSON, A. MCEWEN, W. J. MERLINE, D. R. DAVIS, J.-M. PETIT, asteroids and planetary satellites. Icarus 84, 226–253.A. STORRS, J. VEVERKA, AND B. ZELLNER 1995. Bulk density of asteroid HOUSEN, K. R., R. M. SCHMIDT, AND K. A. HOLSAPPLE 1991. Laboratory243 Ida from the orbit of its satellite Dactyl. Nature 374, 785–788. simulation of large-scale fragmentation events. Icarus 94, 180–190.
BINZEL, R. P. 1988. Collisional evolution in the Eos and Koronis LAGERKVIST, C. I., A. HARRIS, AND V. ZAPPALA 1989. Asteroid lightcurveasteroid families. Icarus 73, 303–313. parameters. In Asteroids II (R. P. Binzel, T. Gehrels and M. S. Mat-
BOTTKE, W. F., M. C. NOLAN, R. GREENBERG, AND R. KOLVOORD 1994. thews, Eds.) Univ. Arizona Press, Tucson, pp. 1162–1179.Velocity distributions among colliding asteroids. Icarus 107, 255–268. MARZARI, F., D. DAVIS, AND V. VANZANI 1995. Collisional evolution of
asteroid families. Icarus 113, 168–187.BYRNES, D., AND L. D’AMARIO 1994. Report to Galileo ImagingTeam, unpublished. MELOSH, H. J. 1989. Impact Cratering: A Geologic Process. Oxford Univ.
Press, New York.CARLSON, R. W., P. R. WEISSMAN, M. SEGURA, L. W. KAMP, W. D.SMYTHE, T. V. JOHNSON, D. L. MATSON, F. E. LEADER, R. MEHLMAN, MELOSH H. J., E. V. RYAN, AND E. ASPHAUG 1992. Dynamic fragmenta-F. P. FANALE, J. C. GRANAHAN, H. H. KEIFFER, L. A. SODERBLOM, tion in impacts: Hydrocode simulation of laboratory impacts. J. Geo-AND T. B. MCCORD 1994. Infrared spectroscopy of asteroid 243 Ida phys. Res. 97, 14,735–14,759.and discovery spectra of satellite 1993 (243) 1. Bull. Am. Astron. Soc. NOLAN, M. C., E. ASPHAUG, AND R. GREENBERG 1993. Numerical hy-26, 1156. drocode modeling of impacts into a body the size of 243 Ida. Bull. Am.
Astron. Soc. 25, 1140.DURDA, D. D. 1993. The Collisional Evolution of the Asteroid Belt andIts Contribution to the Zodiacal Cloud. Ph.D. Thesis, Univ. of Florida. NOLAN, M. C. 1994. Delivery of Meteorites from the Asteroid Belt. Ph.D.
Dissertation, Univ. of Arizona.DURDA, D. D. 1994. Numerical models of the origin of asteroidal moonsPETIT, J.-M., R. GREENBERG, AND P. GEISSLER 1994. Orbits around aduring Hirayama family formation. Bull. Am. Astron. Soc. 26, 1158.
small, highly elongated asteroid: Constraints on Ida’s moon. Bull. Am.DURDA, D. D. 1996. The formation of asteroidal satellites in catastrophicAstron. Soc. 26, 1157–1158.collisions. Icarus 120, 212–219.
SULLIVAN, R., R. GREELEY, R. PAPPALARDO, E. ASPHAUG, J. M. MOORE,DOHNANYI, J. 1969. Collisional model of asteroids and their debris. J.D. MORRISON, M. J. S. BELTON, M. CARR, C. R. CHAPMAN, P. GEISSLER,Geophys. Res. 74, 2531–2554.R. GREENBERG, J. GRANAHAN, J. W. HEAD III, R. KIRK, A. MCEWEN,
FARINELLA, P., P. PAOLICCHI, E. F. Tedesco, AND V. ZAPPALA 1981. P. LEE, P. C. THOMAS, AND J. VEVERKA 1996. Geology of 243 Ida.Triaxial equilibrium ellipsoids among the asteroids? Icarus 46, Icarus 120, 119–139.114–123.
THOMAS, P. C., M. J. S. BELTON, B. CARCICH, C. R. CHAPMAN, M. E.GEISSLER, P., J.-M. PETIT, AND R. GREENBERG 1994a. Ejecta reaccretion DAVIES, R. SULLIVAN, AND J. VEVERKA 1996. The shape of Ida. Icarus
on rapidly rotating asteroids: Implications for 243 Ida and 433 Eros. 120, 20–32.Proc. Astron. Soc. Pacific, in press. ZAPPALA, V., AND A. CELLINO 1994. Main-belt asteroids: Present and
GEISSLER, P., J.-M. PETIT, AND R. GREENBERG 1994b. Ida: Distribution future inventory. Proc. Astron. Soc. Pacific, in press.and origin of surface blocks. Lunar Planet. Sci. Conf. 25, 411–412. ZAPPALA, V., P. FARINELLA, Z. KNEZEVIC, AND P. PAOLICCHI 1984.
GEISSLER, P., J.-M. PETIT, R. GREENBERG, W. BOTTKE, M. NOLAN, AND Collisional origin of asteroid families. Icarus 59, 261–285.