Search for Supernova Neutrino-Bursts with the Amanda Detector
20
arXiv:astro-ph/0105460 v1 25 May 2001 Search for Supernova Neutrino-Bursts with the Amanda Detector J. Ahrens i , X. Bai a , G. Barouch k , S.W. Barwick h , R.C. Bay g , T. Becka i , K.-H. Becker b , D. Bertrand c , A. Biron d , J. Booth h , O. Botner , A. Bouchta d , M.M. Boyce k , S. Carius e , A. Chen k , D. Chirkin g,b , J. Conrad , J. Cooley k , C.G.S. Costa c , D.F. Cowen j , E. Dalberg m , T. DeYoung k , P. Desiati d , J.-P. Dewulf c , P. Doksus k ,J.Edsj¨o m ,P.Ekstr¨om m , T. Feser i , M. Gaug d , A. Goldschmidt f , A. Hallgren , F. Halzen k , K. Hanson j , R. Hardtke k , M. Hellwig i , H. Heukenkamp d , G.C. Hill k , P.O. Hulth m , S. Hundertmark h , J. Jacobsen f , A. Karle k , J. Kim h , B. Koci k ,L.K¨opke i , M. Kowalski d , J.I. Lamoureux f , H. Leich d , M. Leuthold d , P. Lindahl e , I. Liubarsky k , P. Loaiza , D.M. Lowder g , J. Madsen k , P. Marciniewski , H.S. Matis f , T.C. Miller a , Y. Minaeva m , P. Mioˇ cinovi´ c g , P.C. Mock h , R. Morse k ,T.Neunh¨offer i , P. Niessen d , D.R. Nygren f , H. Ogelman k , C. P´ erez de los Heros , R. Porrata h , P.B. Price g , K. Rawlins k , C. Reed h , W. Rhode b , S. Richter d , J. Rodr´ ıguez Martino m , P. Romenesko k , D. Ross h , H.-G. Sander i , T. Schmidt d , D. Schneider k , R. Schwarz k , A. Silvestri b,d , M. Solarz g , G.M. Spiczak a , C. Spiering d , N. Starinsky k , D. Steele k , P. Steffen d , R.G. Stokstad f , O. Streicher d , P. Sudhoff d , I. Taboada j , L. Thollander m , T. Thon d , S. Tilav k , M. Vander Donckt c , C. Walck m , C. Weinheimer i , C.H. Wiebusch d , R. Wischnewski d , H. Wissing d , K. Woschnagg g , W. Wu h , G. Yodh h , S. Young h a Bartol Research Institute, University of Delaware, Newark, DE 19716, USA b Fachbereich 8 Physik, BUGH Wuppertal, D-42097 Wuppertal, Germany c Brussels Free University, Science Faculty CP230, Boulevard du Triomphe, B-1050 Brussels, Belgium d DESY-Zeuthen, D-15735 Zeuthen, Germany e Dept. of Technology, Kalmar University, S-39182 Kalmar, Sweden Preprint submitted to Astroparticle Physics 16 July 2002
-
Upload
independent -
Category
Documents
-
view
0 -
download
0
Transcript of Search for Supernova Neutrino-Bursts with the Amanda Detector
arX
iv:a
stro
-ph/
0105
460
v1
25 M
ay 2
001
Search for Supernova Neutrino-Burstswith the
Amanda Detector
J. Ahrens i, X. Bai a, G. Barouch k, S.W. Barwick h, R.C. Bay g,
T. Becka i, K.-H. Becker b, D. Bertrand c, A. Biron d, J. Booth h,O. Botner `, A. Bouchta d, M.M. Boyce k, S. Carius e, A. Chen k,
D. Chirkin g,b, J. Conrad `, J. Cooley k, C.G.S. Costa c,D.F. Cowen j, E. Dalberg m, T. DeYoung k, P. Desiati d,
J.-P. Dewulf c, P. Doksus k, J. Edsjo m, P. Ekstrom m, T. Feser i,M. Gaug d, A. Goldschmidt f, A. Hallgren `, F. Halzen k,
K. Hanson j, R. Hardtke k, M. Hellwig i, H. Heukenkamp d,G.C. Hill k, P.O. Hulth m, S. Hundertmark h, J. Jacobsen f,A. Karle k, J. Kim h, B. Koci k, L. Kopke i, M. Kowalski d,
J.I. Lamoureux f, H. Leich d, M. Leuthold d, P. Lindahl e,I. Liubarsky k, P. Loaiza `, D.M. Lowder g, J. Madsen k,
P. Marciniewski `, H.S. Matis f, T.C. Miller a, Y. Minaeva m,P. Miocinovic g, P.C. Mock h, R. Morse k, T. Neunhoffer i,
P. Niessen d, D.R. Nygren f, H. Ogelman k, C. Perez de los Heros `,R. Porrata h, P.B. Price g, K. Rawlins k, C. Reed h, W. Rhode b,S. Richter d, J. Rodrıguez Martino m, P. Romenesko k, D. Ross h,
H.-G. Sander i, T. Schmidt d, D. Schneider k, R. Schwarz k,A. Silvestri b,d, M. Solarz g, G.M. Spiczak a, C. Spiering d,
N. Starinsky k, D. Steele k, P. Steffen d, R.G. Stokstad f,O. Streicher d, P. Sudhoff d, I. Taboada j, L. Thollander m,
T. Thon d, S. Tilav k, M. Vander Donckt c, C. Walck m,C. Weinheimer i, C.H. Wiebusch d, R. Wischnewski d,
H. Wissing d, K. Woschnagg g, W. Wu h, G. Yodh h, S. Young h
aBartol Research Institute, University of Delaware, Newark, DE 19716, USA
bFachbereich 8 Physik, BUGH Wuppertal, D-42097 Wuppertal, GermanycBrussels Free University, Science Faculty CP230, Boulevard du Triomphe, B-1050
Brussels, BelgiumdDESY-Zeuthen, D-15735 Zeuthen, Germany
eDept. of Technology, Kalmar University, S-39182 Kalmar, Sweden
Preprint submitted to Astroparticle Physics 16 July 2002
fLawrence Berkeley National Laboratory, Berkeley, CA 94720, USAgDept. of Physics, University of California, Berkeley, CA 94720, USA
hDept. of Physics and Astronomy, University of California, Irvine, CA 92697, USA
iInstitute of Physics, University of Mainz, Staudinger Weg 7, D-55099 Mainz,Germany
jDept. of Physics and Astronomy, University of Pennsylvania, Philadelphia, PA19104, USA
kDept. of Physics, University of Wisconsin, Madison, WI 53706, USA`Dept. of Radiation Sciences, Uppsala University, S-75121 Uppsala, Sweden
mFysikum, Stockholm University, S-11385 Stockholm, Sweden
Abstract
The core collapse of a massive star in the Milky Way will produce a neutrino burst,intense enough to be detected by existing underground detectors. The AMANDAneutrino telescope located deep in the South Pole ice can detect MeV neutrinos bya collective rate increase in all photo-multipliers on top of dark noise. The mainsource of light comes from positrons produced in the CC-reaction of anti-electronneutrinos on free protons νe + p → e+ + n. This paper describes the first supernovasearch performed on the full sets of data taken during 1997 and 1998 (215 days oflive time) with 302 of the detector’s optical modules. No candidate events resultedfrom this search. The performance of the detector is calculated, yielding a 70%coverage of the Galaxy with one background fake per year with 90% efficiency forthe detector configuration under study. An upper limit at the 90% c.l. on the rate ofstellar collapses in the Milky Way is derived, yielding 4.3 events per year. A triggeralgorithm is presented and its performance estimated. Possible improvements of thedetector hardware are reviewed.
1 Introduction
Astronomical observations havecustomarily been carried out by de-tecting photons, from radio-waves togamma rays, with each new range ofenergy uncovered leading to fresh dis-coveries. Over the years, the electro-magnetic spectrum has been wellcovered, leaving no new frequency-gaps to explore.
Neutrino astronomy is still inits infancy, but it is a field which
has been growing over the past fewdecades. Besides providing a newprobe to investigate the universe, theneutrino is also fundamentally differ-ent from the photon in that it inter-acts only weakly and can thus still beobserved after passing through largeamounts of matter. This is a mixedblessing, however, since the detectionof neutrinos on Earth is made moredifficult by the very same reason andrequires correspondingly large de-tector volumes. Furthermore, neutri-
2
nos remain undeflected by magneticfields.
Until now, the only extra-terrestrialsources of neutrinos that have beenobserved are the Sun and the super-nova SN1987A. In both cases, theenergies seen were at or below a fewtens of MeV. The νe -burst emittedin the 1987 supernova event was de-tected simultaneously by the IMB [1]and Kamiokande II [2,3] water detec-tors, a few hours ahead of its opticalcounterpart. Due to the distant lo-cation of the supernova in the LargeMagellanic Cloud (∼52 kpc fromus), only 20 neutrinos were collectedin total. This was still enough toconfirm that most of the energy wasreleased in the form of neutrinos andalso to validate the essential predic-tions of models describing the mech-anism of gravitational collapse su-pernovae. SN1987A proved also thatrelevant particle physics informationcan be extracted from astrophysicalevents. The data was used to set anupper limit on the mass of the νe, itslifetime, its magnetic moment andthe number of leptonic flavours.
However, although the rough fea-tures in terms of energies, durationand flux were supported by the ob-servations, they said next to noth-ing about the details of the burstdevelopment. For this, hundreds ifnot thousands of neutrinos wouldbe needed. Furthermore, both ex-periments were insensitive to flavorsother than νe, which are expectedto carry away most of the supernovaenergy. The detection of a type IIsupernova in the Milky Way wouldprovide us with a unique opportu-nity to study the details of the grav-itational collapse of a star. Several
low-energy neutrino detectors existalready (LVD, Super-Kamiokande,SNO [4] and Baksan [5]) which willbe able to shed light on the core col-lapse of a massive star, should suchan event occur during their lifetime.
Amanda (Antarctic Muon andNeutrino Detector Array [6]) isone of several high energy neutrinotelescopes. Another existing detec-tor is NT200 in lake Baikal [7],whereas others are under develop-ment (ANTARES [8], NESTOR [9]and NEMO [10]). Amanda consistsof optical modules (OMs) buried1500-2000 m deep in the Antarcticice sheet. Each OM is made up ofa photo-multiplier tube (PMT) en-closed in a pressure-resistant glassvessel and connected to the surfaceelectronics by an electrical cable sup-plying power and transmitting thePMT signals.
Amanda is designed for the ob-servation of TeV neutrino-sources,utilizing the large volume of trans-parent glacier ice available at theSouth Pole as a Cherenkov medium.In spite of the much lower neutrinoenergies of O(10 MeV) involved ina burst, it has been shown [11] thata detector of this type could alsobe used successfully to monitor ourGalaxy for supernova events (the de-scription of a method for neutrinotelescopes using ocean water canbe found in [12]). Since the cross-section for inverse β decay reactionon protons νe + p → n + e+ in theice exceeds the cross-sections for theother neutrino flavors and targets,νe events are dominating 1 . Dur-
1 Note that the scattering of νe on 16Ois negligible at the expected energies.
3
ing the estimated ∼ 10 sec durationof a neutrino-burst, the Cherenkovlight produced by the positron trackswill increase the counting rate ofall the PMTs in the detector abovetheir average value. This effect, whenconsidered as a collective behavior,could be seen clearly even if the in-crease in each PMT would not bestatistically significant. An obser-vation made over a time window ofseveral sec could therefore provide adetection of a supernova, before itsoptical counterpart is observed. Thestable and low background noise inAmanda (absence of 40K and of bi-oluminescence in the ice) is a clearasset for this method.
In this paper, the 302 OMs of theAmanda B10 stage completed in1997 are used for the analysis. Inthe next section, we summarize thetheoretical expectations for the neu-trino burst which is emitted whena massive star undergoes gravita-tional core collapse. An account isthen given of the detector hardware,as well as of the data collected withit. The analysis method is explainednext and the results obtained fromits application to experimental dataare presented. A study of the detec-tor performance follows. Next, theprinciple of an online trigger algo-rithm is described. We end with adiscussion of possible improvementsof the detector. Early searches for su-pernova neutrino-burst signals withthe Amanda detector have beenpresented in [13–15].
2 Theoretical preliminaries
When the core of a massive star(M ≥ 8M�) runs out of nuclear fuel,it collapses and ejects the outer man-tle in a SN explosion of type II/Ib/Ic[16]. Only ∼ 1% of the energy is re-leased in kinetic and optical form,whereas the remaining 99% of thegravitational binding energy change,about 3 × 1053 ergs, is carried awayby neutrinos [17].
During the process, the inner corereaches nuclear densities, bringingthe collapse to an abrupt stop, anda shock-wave is formed. The frontof this shock is driven outward,through the in-falling material, pass-ing through the neutrinosphere (thelocation where the material changesfrom opaque to transparent to neu-trinos) on its way, until a point whereit stalls .
During the first 10 msec, a νe burstfrom the neutronization processe− + p → n + νe releases ∼ 1052
ergs. Although neutrinos interactonly weakly, the densities built upduring the collapse are so high thatthey cannot stream out. Instead,they are trapped and diffuse out overa time scale of several sec. Whenthey finally reach the neutrinospherethey can escape, with a thermalspectrum which is approximatelyFermi-Dirac [17]. The trapped neu-trinos are produced in pairs through
the reaction e− + e+ Z→ ν + ν forall lepton flavors. In addition, theνeνe pairs are also produced via
p(n) + e−(+) W→ n(p)+(−)νe . They are
produced with distinctive energies,because the neutrino-spheres for eachtype are located at depths with dif-
4
ferent temperatures. The νµ and ντ
and their anti-particles have a meanenergy of 〈E〉 ≈ 25 MeV. The νe havea mean energy 〈E〉 ≈ 16 MeV andthe corresponding value for νe neu-trinos is 〈E〉 ≈ 11 MeV [18]. In total,the radiated energy is expected tobe equally distributed over each fla-vor of neutrinos and anti-neutrinos[19]. The luminosity-profile can bedescribed by a quick rise over a fewmsec and more and then falling overa time of O(several sec), roughlylike an exponential with a time con-stant τ = 3 sec [20]. During the latephase the neutrino luminosity possi-bly follows a power law with index∼ 1 ± 0.5 [17]. The detailed form ofthe neutrino luminosity used belowis less important than the generalshape features and their characteris-tic durations [20].
0
0.02
0.04
0.06
0.08
0.1
0 5 10 15 20 25 30
r[kpc]
f(r)
0
0.2
0.4
0.6
0.8
1
0 10 20 30
r[kpc]
F(r
)
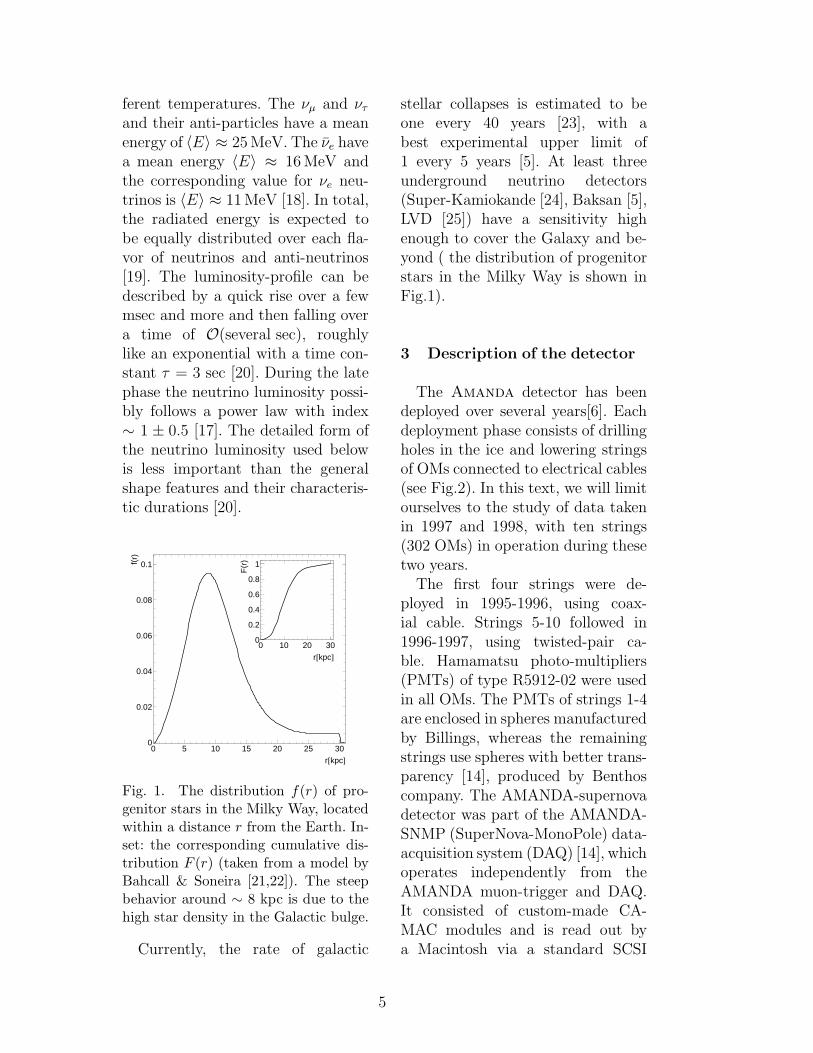
Fig. 1. The distribution f(r) of pro-genitor stars in the Milky Way, locatedwithin a distance r from the Earth. In-set: the corresponding cumulative dis-tribution F (r) (taken from a model byBahcall & Soneira [21,22]). The steepbehavior around ∼ 8 kpc is due to thehigh star density in the Galactic bulge.
Currently, the rate of galactic
stellar collapses is estimated to beone every 40 years [23], with abest experimental upper limit of1 every 5 years [5]. At least threeunderground neutrino detectors(Super-Kamiokande [24], Baksan [5],LVD [25]) have a sensitivity highenough to cover the Galaxy and be-yond ( the distribution of progenitorstars in the Milky Way is shown inFig.1).
3 Description of the detector
The Amanda detector has beendeployed over several years[6]. Eachdeployment phase consists of drillingholes in the ice and lowering stringsof OMs connected to electrical cables(see Fig.2). In this text, we will limitourselves to the study of data takenin 1997 and 1998, with ten strings(302 OMs) in operation during thesetwo years.
The first four strings were de-ployed in 1995-1996, using coax-ial cable. Strings 5-10 followed in1996-1997, using twisted-pair ca-ble. Hamamatsu photo-multipliers(PMTs) of type R5912-02 were usedin all OMs. The PMTs of strings 1-4are enclosed in spheres manufacturedby Billings, whereas the remainingstrings use spheres with better trans-parency [14], produced by Benthoscompany. The AMANDA-supernovadetector was part of the AMANDA-SNMP (SuperNova-MonoPole) data-acquisition system (DAQ) [14], whichoperates independently from theAMANDA muon-trigger and DAQ.It consisted of custom-made CA-MAC modules and is read out bya Macintosh via a standard SCSI
5
interface.The idea is to continuously mea-
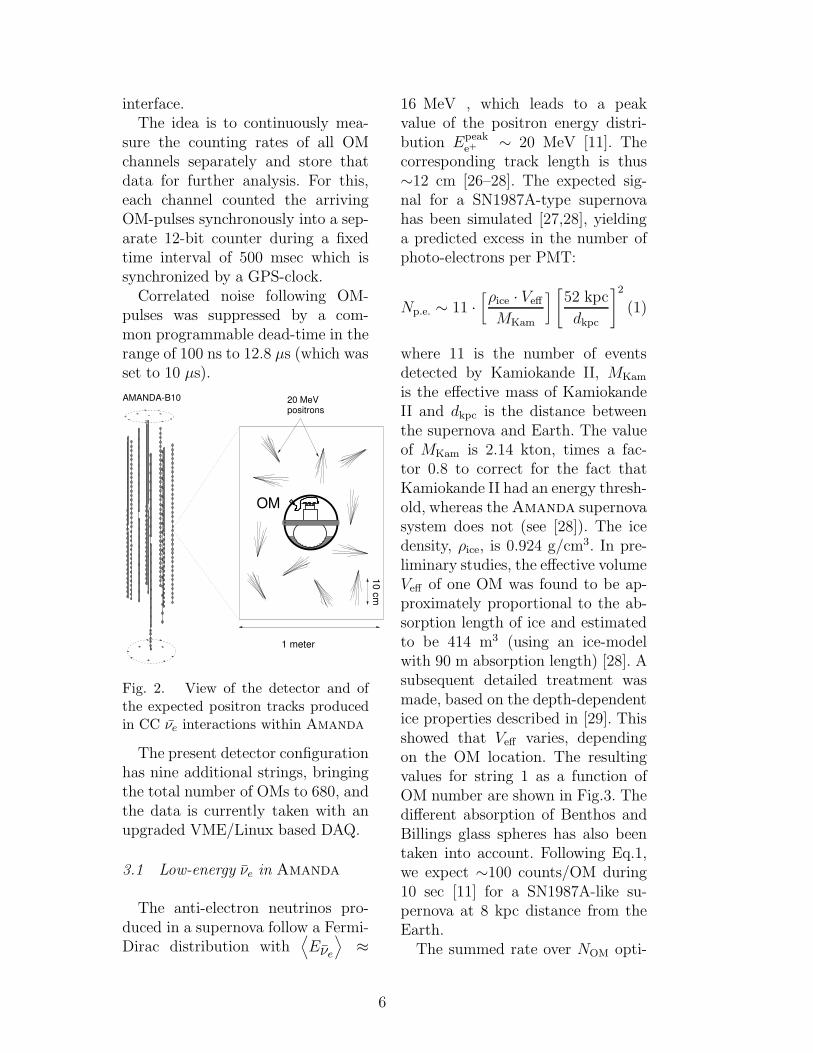
sure the counting rates of all OMchannels separately and store thatdata for further analysis. For this,each channel counted the arrivingOM-pulses synchronously into a sep-arate 12-bit counter during a fixedtime interval of 500 msec which issynchronized by a GPS-clock.
Correlated noise following OM-pulses was suppressed by a com-mon programmable dead-time in therange of 100 ns to 12.8 µs (which wasset to 10 µs).
AMANDA-B10
1 meter
OM
20 MeVpositrons
10 c
m
Fig. 2. View of the detector and ofthe expected positron tracks producedin CC νe interactions within Amanda
The present detector configurationhas nine additional strings, bringingthe total number of OMs to 680, andthe data is currently taken with anupgraded VME/Linux based DAQ.
3.1 Low-energy νe in Amanda
The anti-electron neutrinos pro-duced in a supernova follow a Fermi-Dirac distribution with
⟨
Eνe
⟩
≈
16 MeV , which leads to a peakvalue of the positron energy distri-bution Epeak
e+ ∼ 20 MeV [11]. Thecorresponding track length is thus∼12 cm [26–28]. The expected sig-nal for a SN1987A-type supernovahas been simulated [27,28], yieldinga predicted excess in the number ofphoto-electrons per PMT:
Np.e. ∼ 11 ·[
ρice · Veff
MKam
]
[
52 kpc
dkpc
]2
(1)
where 11 is the number of eventsdetected by Kamiokande II, MKam
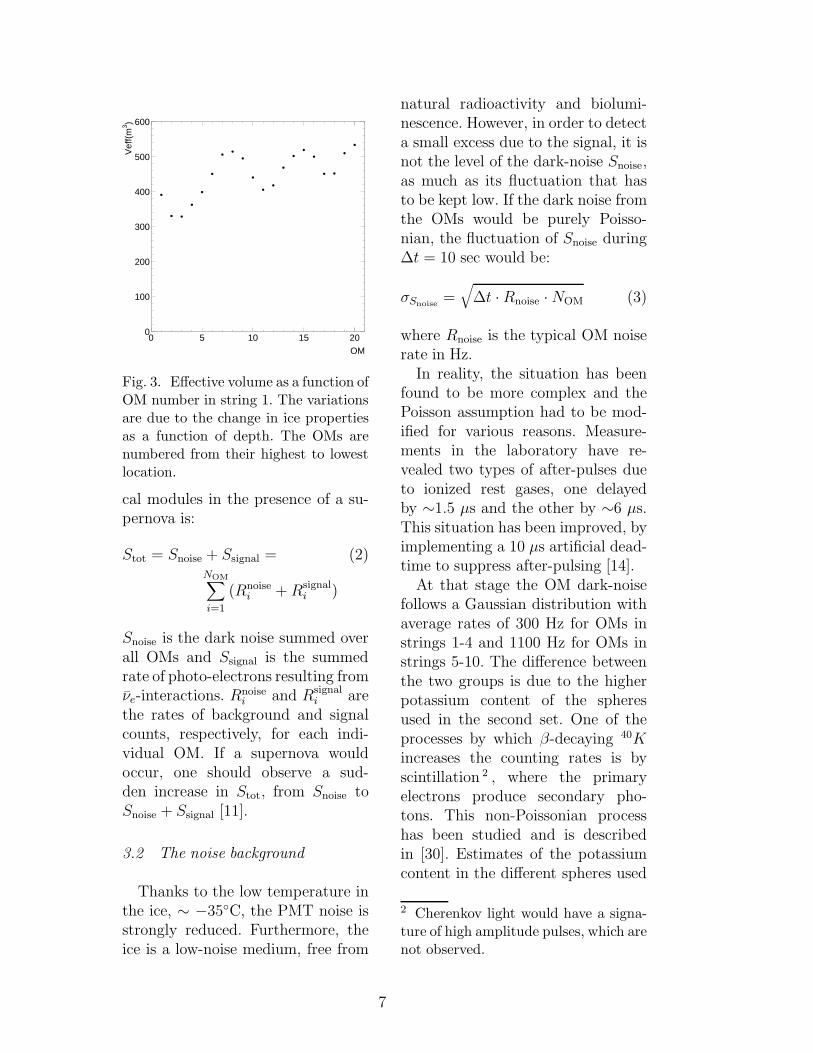
is the effective mass of KamiokandeII and dkpc is the distance betweenthe supernova and Earth. The valueof MKam is 2.14 kton, times a fac-tor 0.8 to correct for the fact thatKamiokande II had an energy thresh-old, whereas the Amanda supernovasystem does not (see [28]). The icedensity, ρice, is 0.924 g/cm3. In pre-liminary studies, the effective volumeVeff of one OM was found to be ap-proximately proportional to the ab-sorption length of ice and estimatedto be 414 m3 (using an ice-modelwith 90 m absorption length) [28]. Asubsequent detailed treatment wasmade, based on the depth-dependentice properties described in [29]. Thisshowed that Veff varies, dependingon the OM location. The resultingvalues for string 1 as a function ofOM number are shown in Fig.3. Thedifferent absorption of Benthos andBillings glass spheres has also beentaken into account. Following Eq.1,we expect ∼100 counts/OM during10 sec [11] for a SN1987A-like su-pernova at 8 kpc distance from theEarth.
The summed rate over NOM opti-
6
OM
Vef
f(m
3 )
0
100
200
300
400
500
600
0 5 10 15 20
Fig. 3. Effective volume as a function ofOM number in string 1. The variationsare due to the change in ice propertiesas a function of depth. The OMs arenumbered from their highest to lowestlocation.
cal modules in the presence of a su-pernova is:
Stot = Snoise + Ssignal = (2)NOM∑
i=1
(Rnoisei + Rsignal
i )
Snoise is the dark noise summed overall OMs and Ssignal is the summedrate of photo-electrons resulting fromνe-interactions. Rnoise
i and Rsignali are
the rates of background and signalcounts, respectively, for each indi-vidual OM. If a supernova wouldoccur, one should observe a sud-den increase in Stot, from Snoise toSnoise + Ssignal [11].
3.2 The noise background
Thanks to the low temperature inthe ice, ∼ −35◦C, the PMT noise isstrongly reduced. Furthermore, theice is a low-noise medium, free from
natural radioactivity and biolumi-nescence. However, in order to detecta small excess due to the signal, it isnot the level of the dark-noise Snoise,as much as its fluctuation that hasto be kept low. If the dark noise fromthe OMs would be purely Poisso-nian, the fluctuation of Snoise during∆t = 10 sec would be:
σSnoise=
√
∆t · Rnoise · NOM (3)
where Rnoise is the typical OM noiserate in Hz.
In reality, the situation has beenfound to be more complex and thePoisson assumption had to be mod-ified for various reasons. Measure-ments in the laboratory have re-vealed two types of after-pulses dueto ionized rest gases, one delayedby ∼1.5 µs and the other by ∼6 µs.This situation has been improved, byimplementing a 10 µs artificial dead-time to suppress after-pulsing [14].
At that stage the OM dark-noisefollows a Gaussian distribution withaverage rates of 300 Hz for OMs instrings 1-4 and 1100 Hz for OMs instrings 5-10. The difference betweenthe two groups is due to the higherpotassium content of the spheresused in the second set. One of theprocesses by which β-decaying 40Kincreases the counting rates is byscintillation 2 , where the primaryelectrons produce secondary pho-tons. This non-Poissonian processhas been studied and is describedin [30]. Estimates of the potassiumcontent in the different spheres used
2 Cherenkov light would have a signa-ture of high amplitude pulses, which arenot observed.
7
were made in the laboratory, yield-ing 2% for Benthos and ∼ 0.1% forBillings spheres. The potassium con-tent of the PMT glass is only 0.013%;moreover, the PMT envelope is muchthinner than the glass vessel.
1.5
1.75
2
2.25
2.5
2.75
3
3.25
3.5
3.75
4
0 2000 4000 6000 8000 10000 12000 14000
#counts in 10 s
F
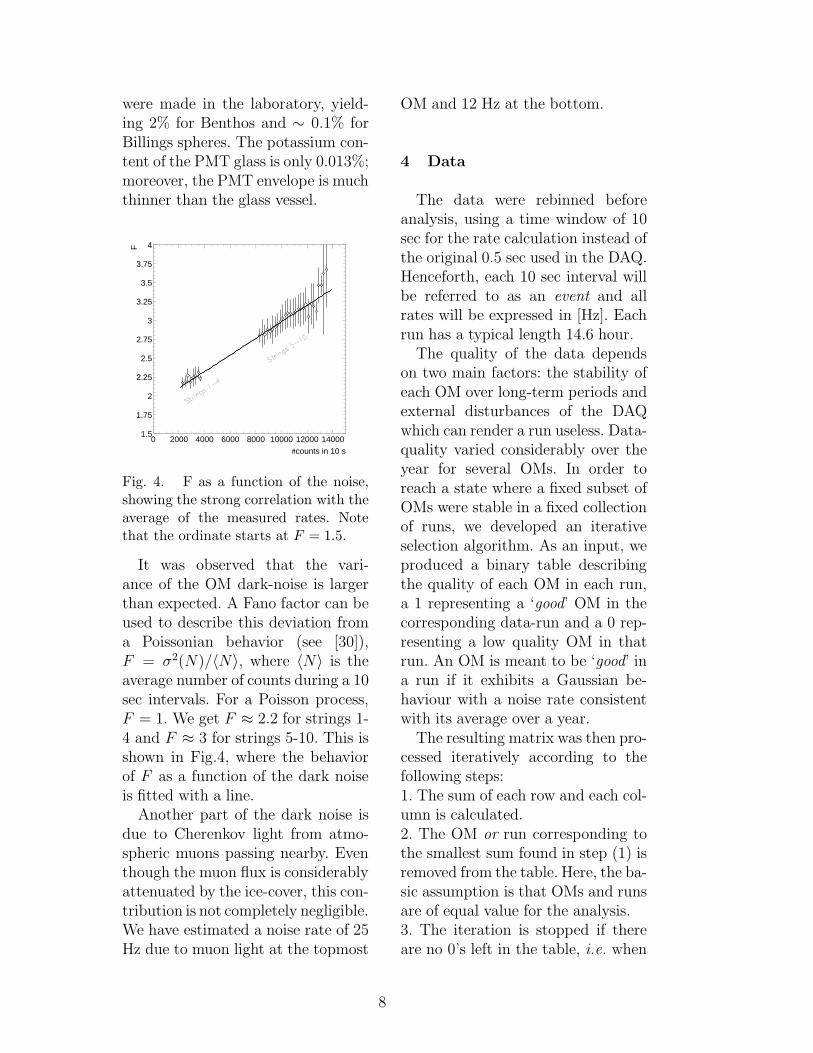
Fig. 4. F as a function of the noise,showing the strong correlation with theaverage of the measured rates. Notethat the ordinate starts at F = 1.5.
It was observed that the vari-ance of the OM dark-noise is largerthan expected. A Fano factor can beused to describe this deviation froma Poissonian behavior (see [30]),F = σ2(N)/〈N〉, where 〈N〉 is theaverage number of counts during a 10sec intervals. For a Poisson process,F = 1. We get F ≈ 2.2 for strings 1-4 and F ≈ 3 for strings 5-10. This isshown in Fig.4, where the behaviorof F as a function of the dark noiseis fitted with a line.
Another part of the dark noise isdue to Cherenkov light from atmo-spheric muons passing nearby. Eventhough the muon flux is considerablyattenuated by the ice-cover, this con-tribution is not completely negligible.We have estimated a noise rate of 25Hz due to muon light at the topmost
OM and 12 Hz at the bottom.
4 Data
The data were rebinned beforeanalysis, using a time window of 10sec for the rate calculation instead ofthe original 0.5 sec used in the DAQ.Henceforth, each 10 sec interval willbe referred to as an event and allrates will be expressed in [Hz]. Eachrun has a typical length 14.6 hour.
The quality of the data dependson two main factors: the stability ofeach OM over long-term periods andexternal disturbances of the DAQwhich can render a run useless. Data-quality varied considerably over theyear for several OMs. In order toreach a state where a fixed subset ofOMs were stable in a fixed collectionof runs, we developed an iterativeselection algorithm. As an input, weproduced a binary table describingthe quality of each OM in each run,a 1 representing a ‘good’ OM in thecorresponding data-run and a 0 rep-resenting a low quality OM in thatrun. An OM is meant to be ‘good’ ina run if it exhibits a Gaussian be-haviour with a noise rate consistentwith its average over a year.
The resulting matrix was then pro-cessed iteratively according to thefollowing steps:1. The sum of each row and each col-umn is calculated.2. The OM or run corresponding tothe smallest sum found in step (1) isremoved from the table. Here, the ba-sic assumption is that OMs and runsare of equal value for the analysis.3. The iteration is stopped if thereare no 0’s left in the table, i.e. when
8
201
201.5
202
202.5
203
203.5
204
204.5
205
0 2 4 6 8 10 12 14
time [hours]
Sto
t [kH
z]
1
10
10 2
200 202 204 206 Stot [kHz]
Num
ber
of e
ntrie
s
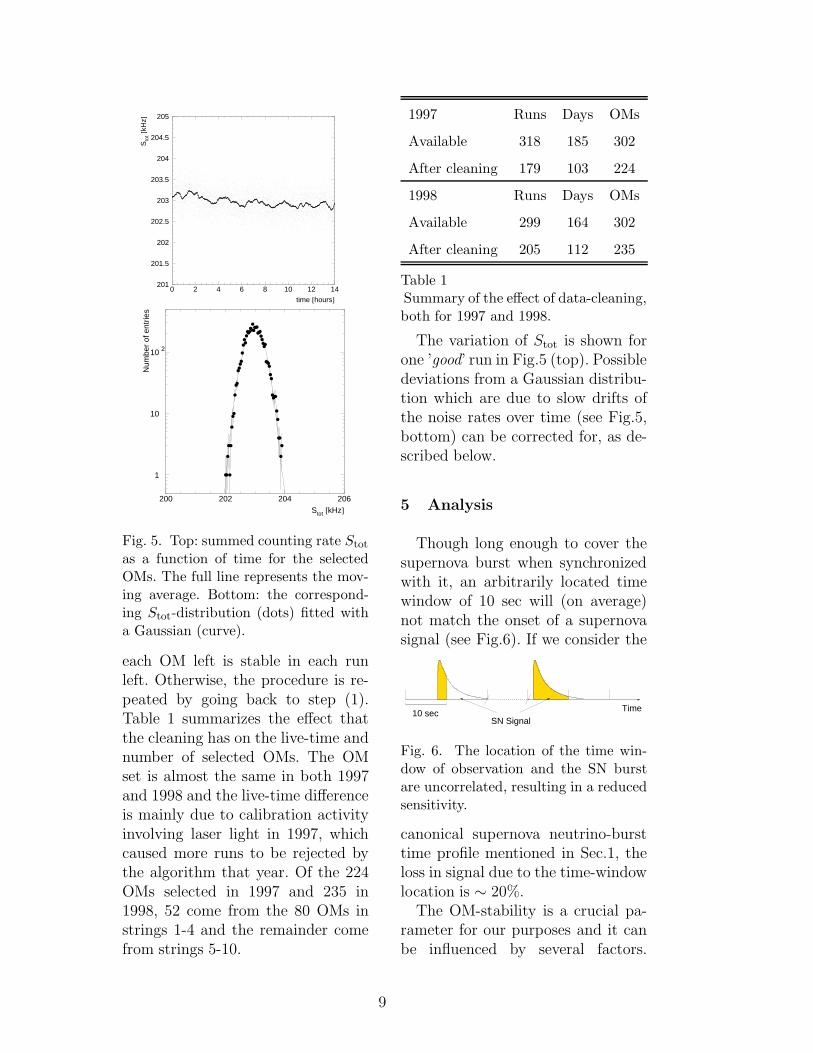
Fig. 5. Top: summed counting rate Stot
as a function of time for the selectedOMs. The full line represents the mov-ing average. Bottom: the correspond-ing Stot-distribution (dots) fitted witha Gaussian (curve).
each OM left is stable in each runleft. Otherwise, the procedure is re-peated by going back to step (1).Table 1 summarizes the effect thatthe cleaning has on the live-time andnumber of selected OMs. The OMset is almost the same in both 1997and 1998 and the live-time differenceis mainly due to calibration activityinvolving laser light in 1997, whichcaused more runs to be rejected bythe algorithm that year. Of the 224OMs selected in 1997 and 235 in1998, 52 come from the 80 OMs instrings 1-4 and the remainder comefrom strings 5-10.
1997 Runs Days OMs
Available 318 185 302
After cleaning 179 103 224
1998 Runs Days OMs
Available 299 164 302
After cleaning 205 112 235
Table 1Summary of the effect of data-cleaning,both for 1997 and 1998.
The variation of Stot is shown forone ’good’ run in Fig.5 (top). Possibledeviations from a Gaussian distribu-tion which are due to slow drifts ofthe noise rates over time (see Fig.5,bottom) can be corrected for, as de-scribed below.
5 Analysis
Though long enough to cover thesupernova burst when synchronizedwith it, an arbitrarily located timewindow of 10 sec will (on average)not match the onset of a supernovasignal (see Fig.6). If we consider the
Time10 secSN Signal
Fig. 6. The location of the time win-dow of observation and the SN burstare uncorrelated, resulting in a reducedsensitivity.
canonical supernova neutrino-bursttime profile mentioned in Sec.1, theloss in signal due to the time-windowlocation is ∼ 20%.
The OM-stability is a crucial pa-rameter for our purposes and it canbe influenced by several factors.
9
Some of them, such as high-voltagevariations, are of known origin andtheir effect can be both understoodand estimated. Long-time trendsare also present. E.g., due to PMTaging, the dark noise decreases by∼ 2% per year. These variations arebeyond our control and can only bemonitored. Other disturbances aremore irregular, such as human inter-ventions on the front end electronics,or periods of severe weather condi-tions at the South Pole which havebeen observed to interfere with thedata-taking.
In order to remove monotonictrends and periodical fluctuations ona scale of several hours and longer,we subtract a moving average (MA)from the Stot values. The residualdeviation RES, defined by the dif-ference between Stot and MA foreach event (i), should then yield atime series stationary on scales ofthe order of an hour and longer[31]:
RES(Stot(i)) =
Stot(i) − MA(Stot(i)) (4)
with the average taken over a timewindow of length (nwindow + 1) bins:
MA(Stot(i)) =1
(nwindow + 1)×
nwindow/2∑
j=−nwindow/2
Stot(i + j) (5)
The MA-subtraction acts like a high-pass filter and was checked not toaffect our SN-burst signal detectionability.
For this off-line analysis, thesum is taken symmetrically over(nwindow + 1) time-bins around thestudied event and will therefore be
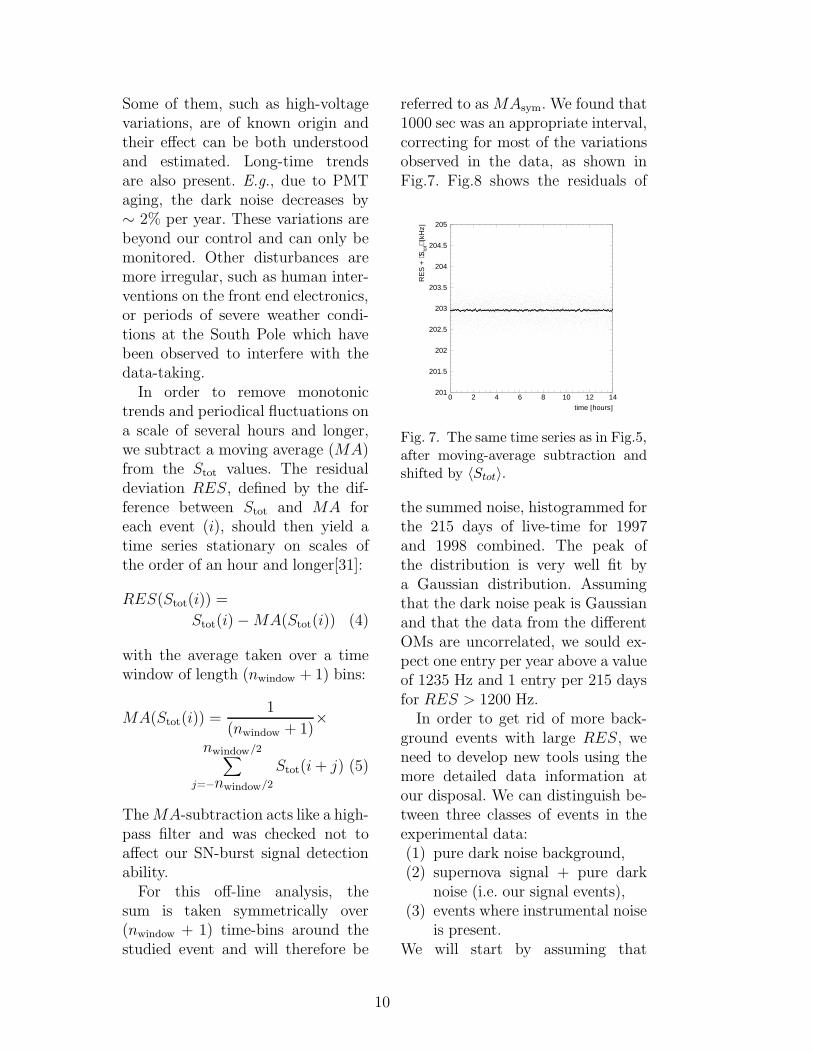
referred to as MAsym. We found that1000 sec was an appropriate interval,correcting for most of the variationsobserved in the data, as shown inFig.7. Fig.8 shows the residuals of
201
201.5
202
202.5
203
203.5
204
204.5
205
0 2 4 6 8 10 12 14
time [hours]
RE
S +
⟨Sto
t⟩ [k
Hz]
Fig. 7. The same time series as in Fig.5,after moving-average subtraction andshifted by 〈Stot〉.
the summed noise, histogrammed forthe 215 days of live-time for 1997and 1998 combined. The peak ofthe distribution is very well fit bya Gaussian distribution. Assumingthat the dark noise peak is Gaussianand that the data from the differentOMs are uncorrelated, we sould ex-pect one entry per year above a valueof 1235 Hz and 1 entry per 215 daysfor RES > 1200 Hz.
In order to get rid of more back-ground events with large RES, weneed to develop new tools using themore detailed data information atour disposal. We can distinguish be-tween three classes of events in theexperimental data:(1) pure dark noise background,(2) supernova signal + pure dark
noise (i.e. our signal events),(3) events where instrumental noise
is present.We will start by assuming that
10
1
10
10 2
10 3
10 4
0 5 10 15
RES [kHz]
Num
ber
of 1
0 se
c in
terv
als
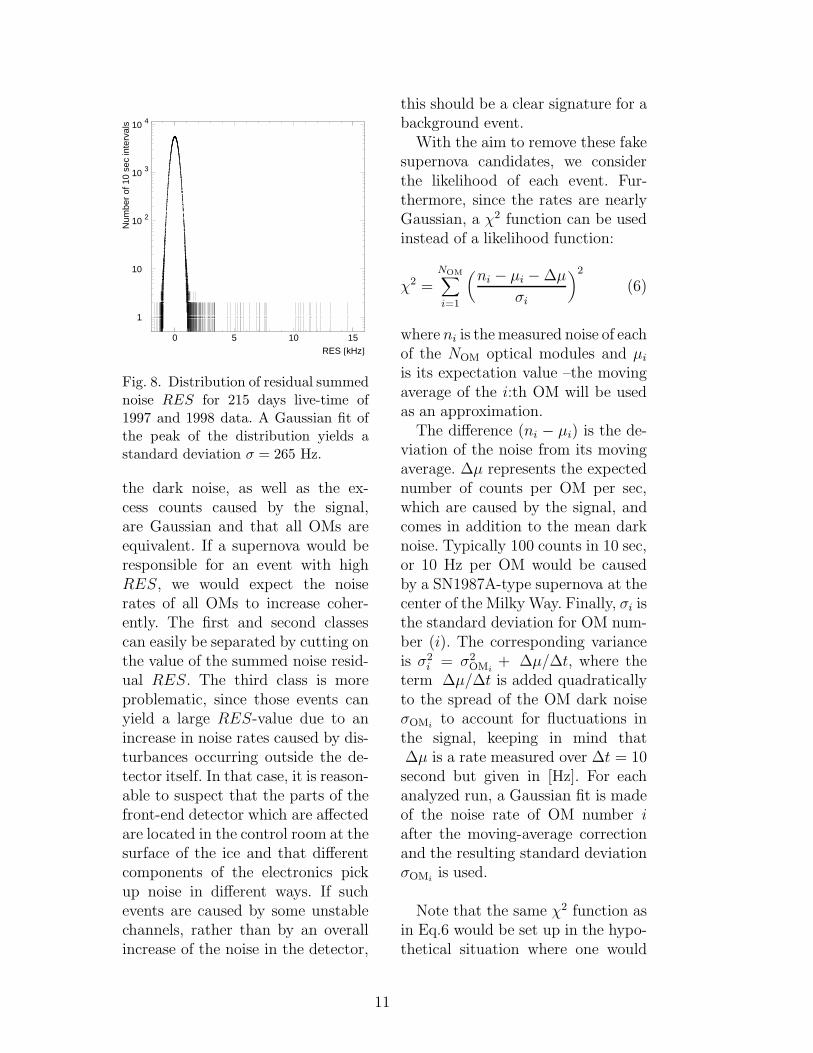
Fig. 8. Distribution of residual summednoise RES for 215 days live-time of1997 and 1998 data. A Gaussian fit ofthe peak of the distribution yields astandard deviation σ = 265 Hz.
the dark noise, as well as the ex-cess counts caused by the signal,are Gaussian and that all OMs areequivalent. If a supernova would beresponsible for an event with highRES, we would expect the noiserates of all OMs to increase coher-ently. The first and second classescan easily be separated by cutting onthe value of the summed noise resid-ual RES. The third class is moreproblematic, since those events canyield a large RES-value due to anincrease in noise rates caused by dis-turbances occurring outside the de-tector itself. In that case, it is reason-able to suspect that the parts of thefront-end detector which are affectedare located in the control room at thesurface of the ice and that differentcomponents of the electronics pickup noise in different ways. If suchevents are caused by some unstablechannels, rather than by an overallincrease of the noise in the detector,
this should be a clear signature for abackground event.
With the aim to remove these fakesupernova candidates, we considerthe likelihood of each event. Fur-thermore, since the rates are nearlyGaussian, a χ2 function can be usedinstead of a likelihood function:
χ2 =NOM∑
i=1
(
ni − µi − ∆µ
σi
)2
(6)
where ni is the measured noise of eachof the NOM optical modules and µi
is its expectation value –the movingaverage of the i:th OM will be usedas an approximation.
The difference (ni − µi) is the de-viation of the noise from its movingaverage. ∆µ represents the expectednumber of counts per OM per sec,which are caused by the signal, andcomes in addition to the mean darknoise. Typically 100 counts in 10 sec,or 10 Hz per OM would be causedby a SN1987A-type supernova at thecenter of the Milky Way. Finally, σi isthe standard deviation for OM num-ber (i). The corresponding varianceis σ2
i = σ2OMi
+ ∆µ/∆t, where theterm ∆µ/∆t is added quadraticallyto the spread of the OM dark noiseσOMi
to account for fluctuations inthe signal, keeping in mind that∆µ is a rate measured over ∆t = 10second but given in [Hz]. For eachanalyzed run, a Gaussian fit is madeof the noise rate of OM number iafter the moving-average correctionand the resulting standard deviationσOMi
is used.
Note that the same χ2 function asin Eq.6 would be set up in the hypo-thetical situation where one would
11
measure a standard supernova-signalNOM times using only one OM. Inthe case of classes (1) and (2) ofevents with homogeneous noise, theχ2-value will be small. By contrast,that value is expected to be large forany ∆µ if the noise recorded by theOMs is not uniform throughout thedetector. By cutting on χ2, one canthus expect to reject events of class(3) above.Near the background, i.e. when∆µ/∆t << σ2
OMi, we can solve for
∆µ, by minimizing Eq. 6 w.r.t. ∆µ:
∆µ =1
∑NOM
i=1 1/σ2i
×
NOM∑
i=1
1
σi
(
ni − µi
σi
)
(7)
so that we get an actual measure-ment of the supernova-induced rateexcess per OM, ∆µ, predicted inEq. 1. With the assumption thatall OMs are equivalent, the variableRES is the product NOM ×∆µ. Thestandard deviation of ∆µ is:
σnoise∆µ
=
√
√
√
√
1∑NOM
i=1 1/σ2i
(8)
This expression for σnoise∆µ
yields thestandard deviation of the back-ground distribution, i.e. when ∆µ =0 (see Fig.10). The characteristics ofthe individual OMs are taken intoaccount in the computation of ∆µwith the different values of σi.
We can also introduce a module-dependent sensitivity in Eq.6 totreat properly the variation of theabsorption-length of the ice as a func-tion of depth [29], modifying Eqs.6and 8:
χ2 =NOM∑
i=1
(
ni − µi − εi · ∆µ
σi
)2
(9)
σnoise∆µ
=
√
√
√
√
1∑NOM
i=1 (εi/σi)2(10)
Here εi is the relative sensitivity ofOM i, calculated as V i
eff/V 0eff where
V 0eff = 414 m3 is the reference volume
mentioned is section 3.1.
10-1
1
10
10 2
10 3
10 4
10 5
1 10 102
∆µ [Hz]
Num
ber
of 1
0 se
c in
terv
als
No SN SN 2 kpcSN 4 kpcSN 8 kpc
3.5 σ
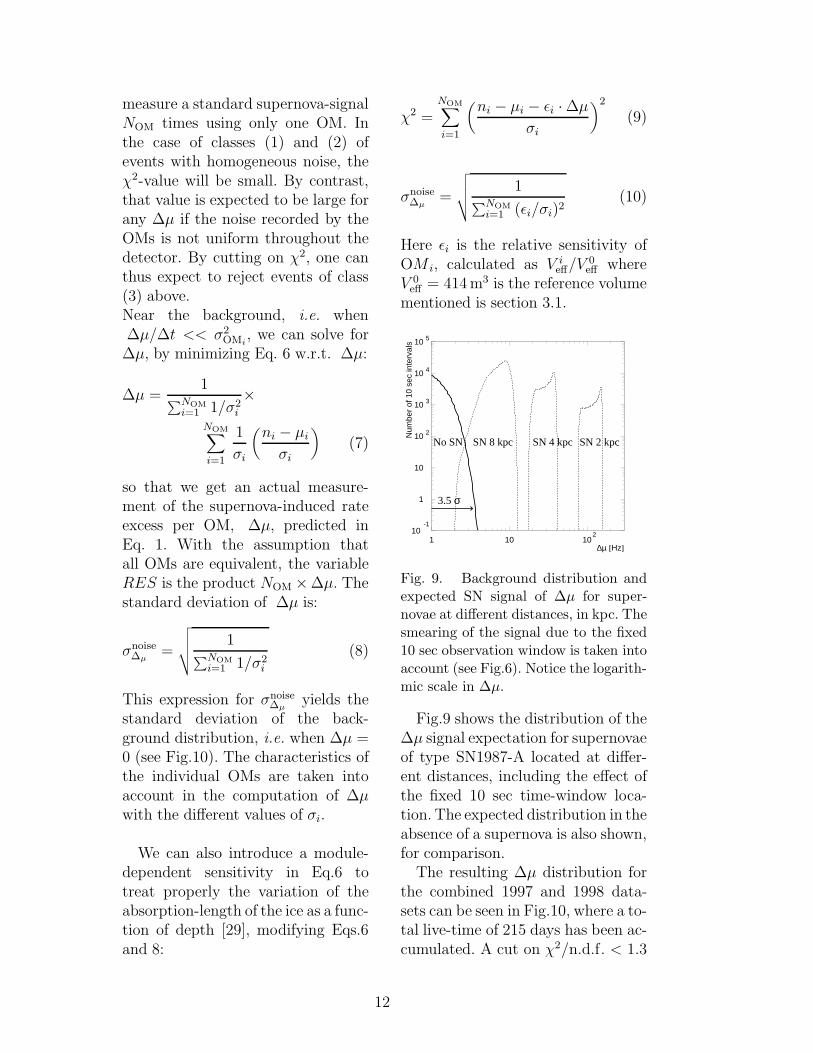
Fig. 9. Background distribution andexpected SN signal of ∆µ for super-novae at different distances, in kpc. Thesmearing of the signal due to the fixed10 sec observation window is taken intoaccount (see Fig.6). Notice the logarith-mic scale in ∆µ.
Fig.9 shows the distribution of the∆µ signal expectation for supernovaeof type SN1987-A located at differ-ent distances, including the effect ofthe fixed 10 sec time-window loca-tion. The expected distribution in theabsence of a supernova is also shown,for comparison.
The resulting ∆µ distribution forthe combined 1997 and 1998 data-sets can be seen in Fig.10, where a to-tal live-time of 215 days has been ac-cumulated. A cut on χ2/n.d.f. < 1.3
12
has been applied (leaving 99.9% ofevents), removing fake events whichcould still be seen in Fig.8. With-out the χ2/n.d.f. cut, but cuttingon ∆µ > 4.0 Hz, we have 1.7 back-ground events per week. The spreadof the background σnoise
∆µ = 0.8 Hz isthe same for both years. This reflectsthe fact that the eleven additionalOMs used in the 1998 set have highnoise levels, and their spreads con-tribute little to reducing the totalspread in Eq.10.
1
10
10 2
10 3
10 4
-10 -5 0 5 10 15 20 ∆µ [Hz]
Num
ber
of 1
0 se
c in
terv
als
90% of SNaeat 9.8 kpc
8 σ
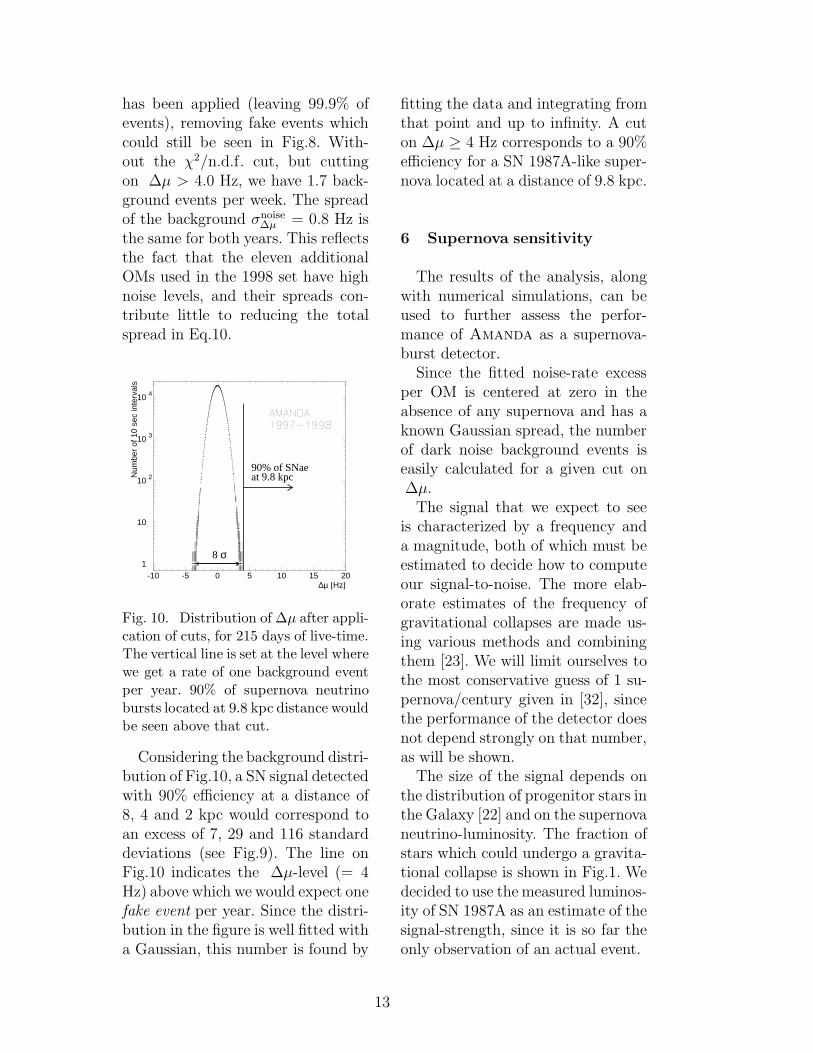
Fig. 10. Distribution of ∆µ after appli-cation of cuts, for 215 days of live-time.The vertical line is set at the level wherewe get a rate of one background eventper year. 90% of supernova neutrinobursts located at 9.8 kpc distance wouldbe seen above that cut.
Considering the background distri-bution of Fig.10, a SN signal detectedwith 90% efficiency at a distance of8, 4 and 2 kpc would correspond toan excess of 7, 29 and 116 standarddeviations (see Fig.9). The line onFig.10 indicates the ∆µ-level (= 4Hz) above which we would expect onefake event per year. Since the distri-bution in the figure is well fitted witha Gaussian, this number is found by
fitting the data and integrating fromthat point and up to infinity. A cuton ∆µ ≥ 4 Hz corresponds to a 90%efficiency for a SN 1987A-like super-nova located at a distance of 9.8 kpc.
6 Supernova sensitivity
The results of the analysis, alongwith numerical simulations, can beused to further assess the perfor-mance of Amanda as a supernova-burst detector.
Since the fitted noise-rate excessper OM is centered at zero in theabsence of any supernova and has aknown Gaussian spread, the numberof dark noise background events iseasily calculated for a given cut on∆µ.
The signal that we expect to seeis characterized by a frequency anda magnitude, both of which must beestimated to decide how to computeour signal-to-noise. The more elab-orate estimates of the frequency ofgravitational collapses are made us-ing various methods and combiningthem [23]. We will limit ourselves tothe most conservative guess of 1 su-pernova/century given in [32], sincethe performance of the detector doesnot depend strongly on that number,as will be shown.
The size of the signal depends onthe distribution of progenitor stars inthe Galaxy [22] and on the supernovaneutrino-luminosity. The fraction ofstars which could undergo a gravita-tional collapse is shown in Fig.1. Wedecided to use the measured luminos-ity of SN 1987A as an estimate of thesignal-strength, since it is so far theonly observation of an actual event.
13
1
10
10 2
10 3
10 4
10-1
1 10 102
∆µ [Hz]
Num
ber
of 1
0 se
c in
terv
als
∆µ [Hz]
Num
ber
of 1
0 se
c in
terv
als
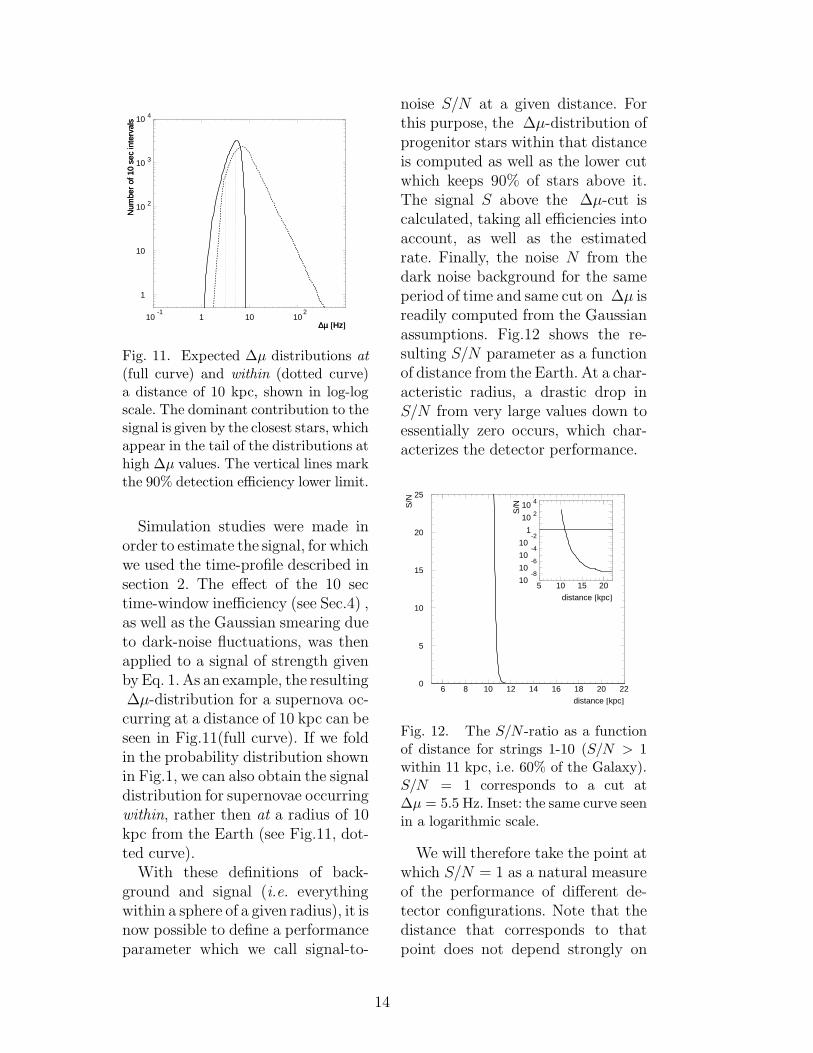
Fig. 11. Expected ∆µ distributions at(full curve) and within (dotted curve)a distance of 10 kpc, shown in log-logscale. The dominant contribution to thesignal is given by the closest stars, whichappear in the tail of the distributions athigh ∆µ values. The vertical lines markthe 90% detection efficiency lower limit.
Simulation studies were made inorder to estimate the signal, for whichwe used the time-profile described insection 2. The effect of the 10 sectime-window inefficiency (see Sec.4) ,as well as the Gaussian smearing dueto dark-noise fluctuations, was thenapplied to a signal of strength givenby Eq. 1. As an example, the resulting∆µ-distribution for a supernova oc-curring at a distance of 10 kpc can beseen in Fig.11(full curve). If we foldin the probability distribution shownin Fig.1, we can also obtain the signaldistribution for supernovae occurringwithin, rather then at a radius of 10kpc from the Earth (see Fig.11, dot-ted curve).
With these definitions of back-ground and signal (i.e. everythingwithin a sphere of a given radius), it isnow possible to define a performanceparameter which we call signal-to-
noise S/N at a given distance. Forthis purpose, the ∆µ-distribution ofprogenitor stars within that distanceis computed as well as the lower cutwhich keeps 90% of stars above it.The signal S above the ∆µ-cut iscalculated, taking all efficiencies intoaccount, as well as the estimatedrate. Finally, the noise N from thedark noise background for the sameperiod of time and same cut on ∆µ isreadily computed from the Gaussianassumptions. Fig.12 shows the re-sulting S/N parameter as a functionof distance from the Earth. At a char-acteristic radius, a drastic drop inS/N from very large values down toessentially zero occurs, which char-acterizes the detector performance.
0
5
10
15
20
25
6 8 10 12 14 16 18 20 22
distance [kpc]
S/N
10-8
10-6
10-4
10-2
1
10 210 4
5 10 15 20
distance [kpc]
S/N
Fig. 12. The S/N -ratio as a functionof distance for strings 1-10 (S/N > 1within 11 kpc, i.e. 60% of the Galaxy).S/N = 1 corresponds to a cut at∆µ = 5.5 Hz. Inset: the same curve seenin a logarithmic scale.
We will therefore take the point atwhich S/N = 1 as a natural measureof the performance of different de-tector configurations. Note that thedistance that corresponds to thatpoint does not depend strongly on
14
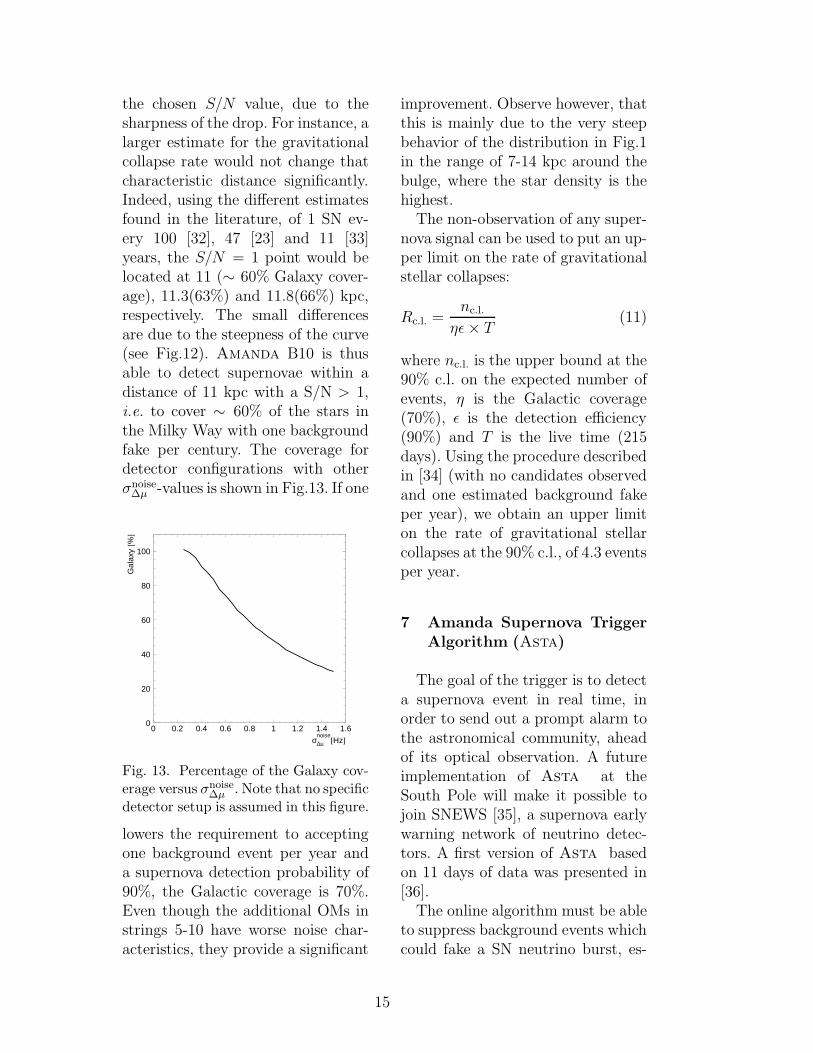
the chosen S/N value, due to thesharpness of the drop. For instance, alarger estimate for the gravitationalcollapse rate would not change thatcharacteristic distance significantly.Indeed, using the different estimatesfound in the literature, of 1 SN ev-ery 100 [32], 47 [23] and 11 [33]years, the S/N = 1 point would belocated at 11 (∼ 60% Galaxy cover-age), 11.3(63%) and 11.8(66%) kpc,respectively. The small differencesare due to the steepness of the curve(see Fig.12). Amanda B10 is thusable to detect supernovae within adistance of 11 kpc with a S/N > 1,i.e. to cover ∼ 60% of the stars inthe Milky Way with one backgroundfake per century. The coverage fordetector configurations with otherσnoise
∆µ -values is shown in Fig.13. If one
0
20
40
60
80
100
0 0.2 0.4 0.6 0.8 1 1.2 1.4 1.6
σnoise
∆µ [Hz]
Gal
axy
[%]
Fig. 13. Percentage of the Galaxy cov-erage versus σnoise
∆µ . Note that no specificdetector setup is assumed in this figure.
lowers the requirement to acceptingone background event per year anda supernova detection probability of90%, the Galactic coverage is 70%.Even though the additional OMs instrings 5-10 have worse noise char-acteristics, they provide a significant
improvement. Observe however, thatthis is mainly due to the very steepbehavior of the distribution in Fig.1in the range of 7-14 kpc around thebulge, where the star density is thehighest.
The non-observation of any super-nova signal can be used to put an up-per limit on the rate of gravitationalstellar collapses:
Rc.l. =nc.l.
ηε × T(11)
where nc.l. is the upper bound at the90% c.l. on the expected number ofevents, η is the Galactic coverage(70%), ε is the detection efficiency(90%) and T is the live time (215days). Using the procedure describedin [34] (with no candidates observedand one estimated background fakeper year), we obtain an upper limiton the rate of gravitational stellarcollapses at the 90% c.l., of 4.3 eventsper year.
7 Amanda Supernova TriggerAlgorithm (Asta)
The goal of the trigger is to detecta supernova event in real time, inorder to send out a prompt alarm tothe astronomical community, aheadof its optical observation. A futureimplementation of Asta at theSouth Pole will make it possible tojoin SNEWS [35], a supernova earlywarning network of neutrino detec-tors. A first version of Asta basedon 11 days of data was presented in[36].
The online algorithm must be ableto suppress background events whichcould fake a SN neutrino burst, es-
15
pecially those due to non-Gaussianvariations of the noise rates. We mustuse a moving average which uses ex-clusively events occurring to the left,i.e. before the considered time-bin.We will refer to it as MAleft, as op-posed to MAsym, with the differencethat the sum in Eq.5 is now takenfrom (i − nwindow) to i. In order toaccommodate for faster variations ofthe data, we define an additional vari-able, the derivative of MAleft for eachevent (i):
DER(i) = (12)
[MAleft(i) − MAleft(i − 1)]/∆t
where ∆t = 100 sec. It has beentested with numerical simulationsthat during normal data-taking con-ditions, the occurrence of a SN signalshould not increase DER(i) signifi-cantly.
Using the same OM selection asin the offline-analysis was found tobe unsuitable for Asta, rejecting alarge percentage of the events afterapplying a cut on χ2/n.d.f. < 1.3.Instead, we removed 117 known un-stable OMs and then applied thecleaning algorithm described in sec-tion 4 on the 1998 data sample. Thisresulted in a set of 170 OMs thatwere then used to test the cuts onboth the 1997 and 1998 data. Fasttime variations of the data (Stot)are not always corrected fully bymoving-average subtraction. Takingthis into account we decided to it-erate, i.e. apply the moving-averagecorrection a second time, on RES:
RESiter(RES(i)) =
RES(i) − MAleft(RES(i)) (13)
A new ∆µ can be calculated, as
1
10
10 2
10 3
10 4
10 5
0 1 2 3 4 5 6 7 8 9 ∆µ [Hz]
Num
ber
of 1
0 se
c in
terv
als
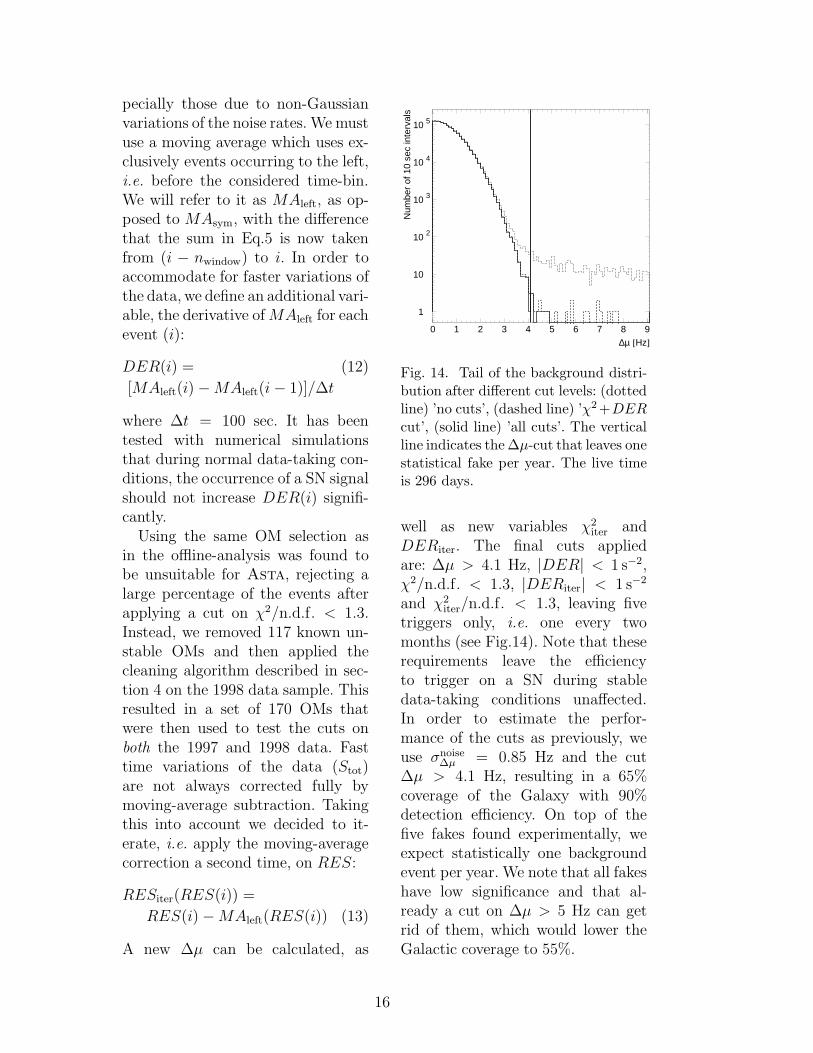
Fig. 14. Tail of the background distri-bution after different cut levels: (dottedline) ’no cuts’, (dashed line) ’χ2 +DERcut’, (solid line) ’all cuts’. The verticalline indicates the ∆µ-cut that leaves onestatistical fake per year. The live timeis 296 days.
well as new variables χ2iter and
DERiter. The final cuts appliedare: ∆µ > 4.1 Hz, |DER| < 1 s−2,χ2/n.d.f. < 1.3, |DERiter| < 1 s−2
and χ2iter/n.d.f. < 1.3, leaving five
triggers only, i.e. one every twomonths (see Fig.14). Note that theserequirements leave the efficiencyto trigger on a SN during stabledata-taking conditions unaffected.In order to estimate the perfor-mance of the cuts as previously, weuse σnoise
∆µ = 0.85 Hz and the cut∆µ > 4.1 Hz, resulting in a 65%coverage of the Galaxy with 90%detection efficiency. On top of thefive fakes found experimentally, weexpect statistically one backgroundevent per year. We note that all fakeshave low significance and that al-ready a cut on ∆µ > 5 Hz can getrid of them, which would lower theGalactic coverage to 55%.
16
8 Discussion
The good overall performance ofthe detector is mainly due to thelow noise of the OMs in strings 1-4.However, even if all OMs would beof the same type as those, 800 ofthem would still be required to cover100% of the Milky Way. From Eq.10and Fig.13, it is clear that σnoise
∆µ isa crucial parameter for the detectorperformance and must be kept assmall as possible.
Assuming a uniform detector withonly one type of OMs, Eq.10 be-comes:
σnoise∆µ
=σOM
ε√
NOM
(14)
One sees from Eq.14 that increasingNOM is a less efficient way of reduc-ing σnoise
∆µ than increasing the collec-tion efficiency ε or reducing σOM, thespread in the dark-noise rate of eachOM. Several technical improvementsto the OMs can be considered, whichaffect σOM, ε and σnoise
∆µ :• coating the OMs with wavelength-
shifters would increase the photon-collection efficiency without affect-ing the noise rates.
• using PMTs with a larger cathodearea would increase the efficiency,even though the noise level wouldgo up.
• reducing the potassium levels inthe pressure glass would reducethe dark noise spread.
• Fig.3 shows that there are ice-depths with larger transparencywhich are most suitable for SN de-tection. In fact, the transparencyis expected to be extremely goodat shallower depths [37,38]. How-ever, the muon flux is larger closer
to the ice surface, producing morebackground Cherenkov light.All these improvements have been
investigated and we estimate thatthey can reduce the value of σnoise
∆µ by20 − 40% each.
Detailed investigations on after-pulsing in the range up to 1 msecare currently being pursued in orderto optimize the choice of artificialdead-time. The effects of raising thePMT thresholds remain to be inves-tigated. Finally, it may be noted thata sliding time-window, fitted to thesupernova time-profile, rather thanapplied at arbitrary times, would in-crease the galactic coverage of thedetector studied in this paper by anestimated 11%. One could even op-timize the size of the window to fitthe peaked part of the profile so thatthe ratio ε/σOM is maximized. Anadditional 10% could be gained inthis way, even though it is clear thatsuch optimization is partly model-dependent (for the model used here,a 4 sec time window would be opti-mal).
An uncertainty in the strength ofthe signal is the νe temperature. Inthis paper, we use the same assump-tion as in [11] (Tνe
= 4 MeV), butthere is no precise prediction for thisvalue and it may be lower (see e.g.
[39]). Furthermore, corrections to in-verse beta-decay cross-sections dueto recoil and weak magnetism [40]would lower the resulting positronenergy somewhat. On the otherhand, this can be compensated insome measure by the performanceof the present detector (680 OMs),which is expected to be higher thanthe configuration studied in this pa-per. With the planned transition to a
17
detector of kilometer-cubed size, us-ing thousands of OMs, full coverageof the Galaxy will be attained.
One of the greatest assets ofAmanda with its low backgroundrate is that it has the potential tosee a supernova independently fromother detectors. In the event of adiscovery, the time profile and inten-sity of the burst could be studied.These aspects will be investigatedin the future. Should an event occurin our Galaxy, the information thatcould presently be provided to therest of the supernova community, isan estimate of ∆µ and a time stampassociated with the event.
9 Conclusions
Amanda primarily aims at detect-ing high-energy neutrinos. However,by monitoring bursts of low-energyneutrinos, it is operating as a gravi-tational collapse detector as well. Inthe course of this analysis, a methodhas been developed and applied tofilter the data and remove unstableperiods and OMs. from disturbances.Furthermore, the χ2-based analysismethod used here takes into accountthe varying statistical propertiesof different OMs. The sets of datataken in 1997 and 1998, correspond-ing to 215 days of live-time aftercleaning, have been fully searchedfor supernova bursts occurring inour galaxy. No significant candidateswere found. A conservative model ofthe supernovae-distribution in spaceand time has been used to assess theperformance of the detector, result-ing in an estimated coverage of thegalaxy of 70% with 90% efficiency,
with one expected background fakeper year. This performance is satis-fying, the more so since the primarydesign of Amanda is for high-energyneutrino detection. A real-time su-pernova detection algorithm, hasbeen developed and tested on the 296days of live time available. The al-gorithm turned out to be sufficientlyrobust and resulted in five fakes withthe set of cuts chosen. We find that800 OMs of the same type as thoseused in the first four strings of thearray would suffice to cover the en-tire galaxy. It is also shown that thisnumber can be reduced significantly,either by reducing the spread of thedark noise, or by improving the col-lection sensitivity of the OMs.
Acknowledgments
We are grateful to J. Beacom fordiscussions concerning the predictedsignal and for very helpful commentson the manuscript.
This research was supported bythe U.S. NSF office of Polar Pro-grams and Physics Division, the U. ofWisconsin Alumni Research Founda-tion, the U.S. DoE, the Swedish Nat-ural Science Research Council, theSwedish Polar Research Secretariat,the Knut and Alice Wallenberg Foun-dation, Sweden, the German Min-istry for Education and Research, theUS National Energy Research Scien-tific Computing Center (supportedby the U.S. DoE), U.C.-Irvine AE-NEAS Supercomputer Facility, andDeutsche Forschungsgemeinschaft(DFG). D.F.C. acknowledges thesupport of the NSF CAREER pro-gram. P. Desiati was supported by
18
the Koerber Foundation (Germany).C.P.H. received support from theEU 4th framework of Training andMobility of Researchers. St. H. issupported by the DFG (Germany).P. Loaiza was supported by a grantfrom the Swedish STINT program.
References
[1] R. M. Bionta et al., Phys. Rev. Lett.58 (1987) 1494–1496.
[2] K. Hirata, et al., Phys. Rev. Lett.58 (1987) 1490–1493.
[3] K. Hirata, et al., Phys. Rev. D 38
(1988) 448–458.
[4] K. Scholberg, in: 19th InternationalConference onNeutrino Physics and Astrophysics,2000, hep-ex/0008044.
[5] E. Alexeyev, et al., Nucl. Phys. BSuppl. 35 (1994) 270–272.
[6] E. Andres, et al., Astropart. Phys.13 (2000) 1–20.
[7] V. A. Balkanov, et al., Phys. Atom.Nucl. 63 (2000) 951.
[8] C. Carloganu, Nucl. Phys. Proc.Suppl. 85 (2000) 146–152.
[9] S. Bottai, et al., Nucl. Phys. Proc.Suppl. 85 (2000) 153–156.
[10] T. Montaruli, et al., Proceedings ofthe 26th International Cosmic RayConference (ICRC 99), Salt LakeCity, UT HE.6.3.06.
[11] F. Halzen, J. E. Jacobsen, E. Zas,Phys. Rev. D 49 (1994) 1758–1761.
[12] C. Pryor, C. Roos, M. Webster,Astrophys. J. 329 (1988) 335–338.
[13] R. Wischnewski,et al., in: Proceedings of the24th International Cosmic RayConference, Rome, Vol. 1, Italy,1995, pp. 658–661.
[14] A.Biron, et al., Proposal submittedto the Physics Research Committee,DESY, PRC 97/05 (1997).
[15] R. Wischnewski et al., Proceedingsof the 26th International CosmicRay Conference (ICRC 99), SaltLake City, UT HE.4.2.07.
[16] R. C. Kennicutt, Astrophys. J. 277(1984) 361.
[17] A. Burrows, D. Klein, R. Gandhi,Phys. Rev. D 45 (1992) 3361–3385.
[18] G. Raffelt, Stars as laboratories forfundamental physics, TheUniversity of Chicago Press, 1996.
[19] J. F. Beacom, P. Vogel, Phys. Rev.D 58 (1998) 053010.
[20] J. F. Beacom, P. Vogel, Phys. Rev.D 60 (1999) 033007.
[21] J. N. Bahcall, R. M. Soneira,Astrophys. J. 44 (1980) 73.
[22] J. N. Bahcall, T. Piran, Astrophys.J. 267 (1983) L77.
[23] G. A. Tammann, W. Loffler,A. Schroder, Astrophys. J. Suppl.92 (1994) 487–493.
[24] Y. Fukuda, in First InternationalWorkshop on the Supernova EarlyAlert Network, Boston University,unpublished, 1998.
[25] TheLVD Collaboration, in: Proceedingsof the 26th International CosmicRay Conference (ICRC 99), SaltLake City, UT, 1999, HE.4.2.08.
19
[26] F. Halzen, T. Stanev, E. Zas, Phys.Rev. D 45 (1992) 362–376.
[27] F. Halzen, J. E. Jacobsen, E. Zas,Phys. Rev. D 53 (1996) 7359.
[28] J. E. Jacobsen, Ph.D. thesis,University of Wisconsin, Madison(1996).
[29] K. Woschnagg et al., Proceedings ofthe 26th International Cosmic RayConference (ICRC 99), Salt LakeCity, UT HE.4.1.15.
[30] B. E. A. Saleh, J. T. Tavolacci,M. C. Teich, IEEE J. Quant.Electron. QE-17 (1981) 2341–2350.
[31] P. J. Brockwell, R. A. Davis,Introduction to Time Series andForecasting, Springer Verlag, 1996.
[32] A. Suzuki, Supernova Neutrinos,in Physics and Astrophysics ofNeutrinos, Springer Verlag, 1994.
[33] J. N. Bahcall,Neutrino Astrophysics, CambridgeUniversity Press, 1989.
[34] G. Feldman, R. Cousins, Phys. Rev.D 57 (1998) 3873–3889.
[35] K. Scholberg, in: Proceedings ofthe 3rd Amaldi Conference onGravitational Waves, 1999, astro-ph/9911359.
[36] A. Silvestri, Diploma thesis: DESY-THESIS-2000-028, Zeuthen, ISSN1435-8085 (2000).
[37] P.Askebjer, et al., Science 267
(1995) 1147.
[38] S.Tilav, et al., in: Proceedings ofthe 24th International Cosmic RayConference, Rome, Vol. 1, 1995, p.1011.
[39] B. Jegerlehner, F. Neubig,G. Raffelt, Phys. Rev. D 54 (1996)1194–1203.
[40] P. Vogel, J. Beacom, Phys. Rev. D60 (1999) 053003.
20


![Optical Light Curve of the Type I[CLC]a[/CLC] Supernova 1998[CLC]bu[/CLC] in M96 and the Supernova Calibration of the Hubble Constant](https://static.fdokumen.com/doc/165x107/632035b7069357aa45061842/optical-light-curve-of-the-type-iclcaclc-supernova-1998clcbuclc-in-m96.jpg)