
X-ray illumination of the ejecta of supernova 1987A
39
arXiv:1106.2300v1 [astro-ph.SR] 12 Jun 2011 X-ray illumination of the ejecta of Supernova 1987A J. Larsson 1 , C. Fransson 1 , G. ¨ Ostlin 1 , P. Gr¨ oningsson 1 , A. Jerkstrand 1 , C. Kozma 1 , J. Sollerman 1 , P. Challis 2 , R. P. Kirshner 2 , R. A. Chevalier 3 , K. Heng 4 , R. McCray 5 , N. B. Suntzeff 6 , P. Bouchet 7 , A. Crotts 8 , J. Danziger 9 , E. Dwek 10 , K. France 11 , P. M. Garnavich 12 , S. S. Lawrence 13 , B. Leibundgut 14 , P. Lundqvist, 1 N. Panagia 15,16,17 , C. S. J. Pun 18 , N. Smith 19 , G. Sonneborn 10 , L. Wang 20 , J. C. Wheeler 21 1 Department of Astronomy, The Oskar Klein Centre, Stockholm University, 106 91 Stockholm, Sweden. 2 Harvard-Smithsonian Center for Astrophysics, 60 Garden Street, MS-19, Cambridge, MA 02138, USA. 3 Department of Astronomy, University of Virginia, Charlottesville, VA 22903, USA 4 Eidgen¨ ossische Technische Hochschule Z¨ urich, Institute for Astronomy, Wolfgang-Pauli-Strasse 27, CH-8093, Z¨ urich, Switzerland. 5 JILA, University of Colorado, Boulder, CO 803090-0440, USA. 6 George P. and Cynthia Woods Mitchell Institute for Fundamental Physics and Astronomy, Texas A&M University, Department of Physics and Astronomy, College Station, TX 77843, USA. 7 DSM/IRFU/Service d ´ Astrophysique Commissariat ´ al ´ Energie Atomique et aux ´ Energies Alterna- tives, Saclay, Orme des Merisiers, FR 91191 Gif-sur-Yvette, France. 8 Department of Astronomy, Mail Code 5240, Columbia University, 550 West 120th Street, New York, NY 10027, USA. 1
Transcript of X-ray illumination of the ejecta of supernova 1987A

arX
iv1
106
2300
v1 [
astr
o-ph
SR
] 12
Jun
201
1
X-ray illumination of the ejecta of Supernova 1987A
J Larsson1 C Fransson1 G Ostlin1 P Groningsson1 A Jerkstrand1 C Kozma1 J Sollerman1
P Challis2 R P Kirshner2 R A Chevalier3 K Heng4 R McCray5 N B Suntzeff6 P Bouchet7
A Crotts8 J Danziger9 E Dwek10 K France11 P M Garnavich12 S S Lawrence13
B Leibundgut14 P Lundqvist1 N Panagia151617 C S J Pun18 N Smith19 G Sonneborn10
L Wang20 J C Wheeler21
1Department of Astronomy The Oskar Klein Centre StockholmUniversity 106 91 Stockholm
Sweden
2Harvard-Smithsonian Center for Astrophysics 60 Garden Street MS-19 Cambridge MA 02138
USA
3Department of Astronomy University of Virginia Charlottesville VA 22903 USA
4Eidgenossische Technische Hochschule Zurich Institute for Astronomy Wolfgang-Pauli-Strasse
27 CH-8093 Zurich Switzerland
5JILA University of Colorado Boulder CO 803090-0440 USA
6George P and Cynthia Woods Mitchell Institute for Fundamental Physics and Astronomy Texas
AampM University Department of Physics and Astronomy College Station TX 77843 USA
7DSMIRFUService dAstrophysique Commissariat a lEnergie Atomique et auxEnergies Alterna-
tives Saclay Orme des Merisiers FR 91191 Gif-sur-Yvette France
8Department of Astronomy Mail Code 5240 Columbia University 550 West 120th Street New
York NY 10027 USA
1
9Osservatorio Astronomico di Trieste Via Tiepolo 11 Trieste 34131 Italy
10NASA Goddard Space Flight Center Code 665 Greenbelt MD 20771 USA
11Center for Astrophysics and Space Astronomy University ofColorado Boulder CO 80309
USA
12225 Nieuwland Science University of Notre Dame Notre Dame IN 46556-5670 USA
13Department of Physics and Astronomy Hofstra University Hempstead NY 11549 USA
14ESO Karl-Schwarzschild-Strasse 2 85748 Garching Germany
15Space Telescope Science Institute 3700 San Martin Drive Baltimore MD 21218 USA
16INAF-CT Osservatorio Astrosico di Catania Via S Soa 78 I-95123 Catania Italy
17Supernova Limited OYV 131 Northsound Road Virgin Gorda British Virgin Islands
18Department of Physics University of Hong Kong Pok Fu Lam Road Hong Kong China
19Steward Observatory University of Arizona 933 North Cherry Avenue Tucson AZ 85721
USA
20Department of Physics and Astronomy Texas AampM UniversityCollege Station TX 77843-
4242 USA
21Department of Astronomy University of Texas Austin TX 78712-0259 USA
When a massive star explodes as a supernova substantial amounts of radioactive elementsmdash
primarily 56Ni 57Ni and 44Timdashare produced1 After the initial flash of light from shock heat-
ing the fading light emitted by the supernova is due to the decay of these elements2 However
after decades the energy for a supernova remnant comes fromthe shock interaction between
the ejecta and the surrounding medium3 The transition to this phase has hitherto not been
2
observed supernovae occur too infrequently in the Milky Way to provide a young example
and extragalactic supernovae are generally too faint and too small Here we report obser-
vations that show this transition in the supernova SN 1987A in the Large Magellanic Cloud
From 1994 to 2001 the ejecta faded owing to radioactive decayof 44Ti as predicted Then the
flux started to increase more than doubling by the end of 2009 We show that this increase is
the result of heat deposited by X-rays produced as the ejectainteracts with the surrounding
material In time the X-rays will penetrate farther into th e ejecta enabling us to analyse the
structure and chemistry of the vanished star
Due to the proximity of SN 1987A (located only160 000 light years away) we can study
the evolution of the supernova (SN) in great detail The central ejecta are surrounded by a ring
of circumstellar material (Fig 1) that was shed from the star 20 000 years before the explosion in
19874 Since the explosion the ejecta have been expanding and now the outer parts of the ejecta
are colliding with the ring causing it to brighten at all wavelengths5ndash8 The dense central part
of the ejecta contains most of the mass from the disrupted star and acts as a calorimeter for the
energy input to the SN We have determined the energy input bytracking the energy output with
the Hubble Space Telescope (HST)
Because the ejecta are roughly elliptical in projection on the sky we use an elliptical aperture
to measure the brightness To monitor a constant mass of expanding material we allowed the
measuring aperture to expand linearly with time The axes ofthe aperture were therefore three
times larger in 2009 than in 1994 (Fig 1) Using this aperture we determined the R-and and B-
3
band light curves of the ejecta as shown in Fig 2 (see Supplementary Table 1 and Supplementary
Information section 1 for further details of the observations and light curves) Our measurements
show that the flux from the ejecta decays during the firstsim 5 000 days after the explosion as
expected from radioactive input but then starts to increase reaching a level that is 2-3 times higher
around day8 000 (end of 2009) A new energy source must be present in additionto radioactive
decay Below we consider a model for the declining phase andthen discuss the new energy source
that is responsible for the observed increase in flux
The energy input to the declining phase of the light curve after sim 1 500 days is expected
to come from positrons produced in the decay of44Ti2 9 10 To test this we use a model2 with
abundances taken from the 14E1 explosion model11 and a44Ti mass of14 times 10minus4 M⊙12 (Sup-
plementary Information section 3) The model is shown in Fig 3 together with the observed
broadband luminosities The good agreement with the observations up to day5 000 confirms that
the 44Ti positrons provide the energy input up to this point However after day5 000 the model
clearly fails to describe the light curve radioactive decay cannot explain the increase in flux that
we observe
One possible origin for the flux increase is the reverse shockthat results from the interaction
between the ejecta and the H II region inside the ring13ndash16 The reverse shock produces strong Lyα
and Hα emission which increased by a factor ofsim 17 between 2004 and 201016 Although most
of this emission originates close to the ring there is also acomponent of projected high-velocity
Hα-emission that can be traced to the central parts of the ejecta16 and which would therefore
4
contribute to the flux we measure To determine the contribution of the reverse shock to our light
curves we have examined HST STIS spectra from 2004 and 2010 (Supplementary Information
section 2 and Supplementary Fig 5) The reverse shock can beisolated in the spectra because of
its boxy line profile allowing us to place a limit on its contribution atsimlt 20 Furthermore this
changes only marginally between 2004 and 2010 as the expanding measuring aperture remains
well inside the area where most of the shock emission is seenImportantly an increase in flux
is also seen in the [Ca II] doublet lines at rest wavelengths 7292A and 7324A between 2000 ndash
2010 (determined from UVES observations at the ESOVLT Fig 2) These lines have speeds of
simlt 5 000 km sminus1 implying that they originate in the inner ejecta (the projected ejecta speed near
the edge of the ring issimgt 7 000 km sminus1 at the present time) We conclude that the increase in flux
occurs primarily in the inner ejecta and cannot be explainedby emission from the shock region
We believe that the strong X-ray flux produced in the ring collision is the dominant source
of energy input to the ejecta The X-ray flux from the ring increased by a factorsim 3 in the 05 ndash
10 keV band between day6 000 and day8 0006 similar to what we find for the optical emission
from the ejecta To investigate this we calculated the fraction of X-rays absorbed by the ejecta from
a point source located at the ring using the partially mixed14E1 explosion model17 As shown in
Supplementary Fig 6 most of the observed X-ray flux is absorbed in the core region of the ejecta
(corresponding to speeds less than5 000 km sminus1) where most of the heavy elements reside At
an energy ofsim 035 keV which corresponds to the temperature of the dominant component in the
X-ray spectrum18 the fraction of flux absorbed by the ejecta attyr years can be approximated by
16times 10minus3t167yr (the increase with time is mainly due to the increasing solidangle of the expanding
5
ejecta assumed to be spherical as seen from the ring) Thisgives a present-day absorbed X-
ray luminosity ofsim 50 times 1035erg sminus1 In this calculation we have neglected the weaker hard
component that contributes to the X-ray spectrum18 We note that this does not significantly affect
the estimate of the absorbed flux although the hard X-rays may be important due to their larger
penetrating power
To model the ejecta light curve produced by input from the X-rays we scaled the observed
X-ray flux6 by the fraction absorbed at 035 keV multiplied the resulting flux with a constant
(corresponding to the conversion efficiency from X-rays to optical) and added this to the radioactive
energy input Fig 3 shows the scaled X-ray flux together withthe observed light curves This
model follows the general trend of the observed fluxes in bothbands although we note that a more
accurate model would need to take into account the detailed shape of the X-ray spectrum and the
reprocessing of the X-rays into optical emission The required conversion efficiency from X-rays
to optical emission in our model is50 in the R-band and31 in the B-band
The conversion of X-rays to opticalIR emission is similar to that of the44Ti positrons Both
involve degradation of non-thermal electrons to heating ionization and excitation For a typical
ionization fraction of10minus3 minus 10minus2 the expected efficiency of conversion from X-rays to Hα (the
dominant line in the R-band) issim 5 (Supplementary Information section 3) This conversion
factor is consistent with the scaling factor we used to modelthe light curve Similar arguments
apply to the B-band Furthermore the density in the core is high enough for the time-scale of
recombination to be shorter than the expansion time-scaleensuring a balance between the energy
6
input and output
Other possible explanations for the increase in flux includeinput from a central pulsar19 a
transition from optically thick to optically thin dust and positron leakage from the Fe-rich regions
We find that input from a pulsar is unlikely for several reasons In particular it would be a strange
coincidence for the emission from the pulsar to mimic the increasing X-ray flux from the ring
interaction Also we expect the energy input from a pulsar to be concentrated toward the low-
velocity material at the centre of the ejecta but observations of the Hα and [Ca II] lines show
that the increase occurs for speeds up tosim 5 000 km sminus1 We also note that constraints on a
point source at the centre of SN 1987A have already been obtained using HST data taken near the
minimum of the ejecta light curve20 A change in the properties of the dust or a transition in the
positron deposition process are also unable to quantitatively explain the observed increase in flux
(Supplementary Information section 4)
We conclude that SN 1987A has made a transition from a radioactively dominated phase
to a phase dominated by the X-ray input from the ring collision This conclusion has interesting
implications for the observed morphology In particular most of the X-rays are likely to be ab-
sorbed at the boundary of the ejecta core where the density increases rapidly This may lead to the
light from the ejecta being emitted in a ring that is concentrated to the plane of the circumstellar
ring The rsquoholersquo in the ejecta (Fig 1) which has become morepronounced sincesim 2001 may in
fact be a result of this rather than reflecting the true density distribution or dust obscuration The
asymmetric morphology seen at speeds ofsimlt 3 000 km sminus1 in the near-IR [Si I] and [Fe II] lines21
7
is however likely to be intrinsic to the metal core By studying future changes in the morphology
of the ejecta we will be able to understand the origin of thisasymmetry
In the future the density of the ejecta will decrease and the fraction of X-rays absorbed will
grow (Supplementary Fig 7) As a result the ionization willincrease and a smaller fraction of
the X-ray flux will produce line excitation A larger fraction will go into heating leading to an
increase in the mid-IR flux and a flattening of the optical light curves In time the X-rays will also
penetrate deeper layers of the ejecta thereby allowing us to probe the chemical structure of the
innermost ejecta This will be a novel form of X-ray tomography
8
References
[1] Woosley S E Heger A amp Weaver T A The evolution andexplosion of massive stars
Reviews of Modern Physics 74 1015ndash1071 (2002)
[2] Fransson C amp Kozma C Radioactivities and nucleosynthesis in SN 1987ANew Astronomy
Review 46 487ndash492 (2002)
[3] McKee C F inYoung Supernova Remnants (eds S S Holt amp U Hwang) vol 565 ofAmeri-
can Institute of Physics Conference Series 17ndash28 (2001)
[4] Morris T amp Podsiadlowski P The Triple-Ring Nebula Around SN 1987A Fingerprint of a
Binary MergerScience 315 1103ndash1105 (2007)
[5] Groningsson Pet al Time evolution of the line emission from the inner circumstellar ring
of SN 1987A and its hot spotsAstron Astrophys 492 481ndash491 (2008)
[6] Racusin J Let al X-ray Evolution of SNR 1987A The Radial ExpansionAstrophys J
703 1752ndash1759 (2009)
[7] Zanardo Get al Multifrequency Radio Measurements of Supernova 1987A Over22 Years
Astrophys J 710 1515ndash1529 (2010)
[8] Dwek E et al Five Years of Mid-infrared Evolution of the Remnant of SN 1987A The
Encounter Between the Blast Wave and the Dusty Equatorial Ring Astrophys J 722 425ndash
434 (2010)
9
[9] Timmes F X Woosley S E Hartmann D H amp Hoffman R D The Production of44Ti
and60Co in SupernovaeAstrophys J 464 332ndash341 (1996)
[10] Diehl R amp Timmes F X Gamma-Ray Line Emission from Radioactive Isotopes in Stars
and GalaxiesPASP 110 637ndash659 (1998)
[11] Shigeyama T amp Nomoto K Theoretical light curve of SN1987A and mixing of hydrogen
and nickel in the ejectaAstrophys J 360 242ndash256 (1990)
[12] Jerkstrand A Fransson C amp Kozma C The44Ti-powered spectrum of SN 1987AAs-
tron Astrophys (in press) preprint at〈httparxivorgabs11033653〉 (2011)
[13] Michael Eet al Hubble Space Telescope Observations of High-Velocity Lyα and Hα Emis-
sion from Supernova Remnant 1987A The Structure and Development of the Reverse Shock
Astrophys J 593 809ndash830 (2003)
[14] Smith Net al The Reverse Shock of SNR 1987A at 18 Years after OutburstAstrophys J
635 L41ndashL44 (2005)
[15] Heng Ket al Evolution of the Reverse Shock Emission from SNR 1987AAstrophys J
644 959ndash970 (2006)
[16] France Ket al Observing Supernova 1987A with the Refurbished Hubble Space Telescope
Science 329 1624ndash1627 (2010)
10
[17] Blinnikov S Lundqvist P Bartunov O Nomoto Kamp Iwamoto K Radiation Hydrody-
namics of SN 1987A I Global Analysis of the Light Curve for the First 4 MonthsAstro-
phys J 532 1132ndash1149 (2000)
[18] Zhekov S A Park S McCray R Racusin J L amp Burrows D N Evolution of the
Chandra CCD spectra of SNR 1987A probing the reflected-shock picture Mon Not R As-
tron Soc 721 518ndash529 (2010)
[19] Woosley S E Hartmann D amp Pinto P A Hard emissionat late times from SN 1987A
Astrophys J 346 395ndash404 (1989)
[20] Graves G J Met al Limits from the Hubble Space Telescope on a Point Source in SN
1987A Astrophys J 629 944ndash959 (2005)
[21] Kjaeligr K Leibundgut B Fransson C Jerkstrand Aamp Spyromilio J The 3-D structure of
SN 1987Arsquos inner ejectaAstron Astrophys 517 A51ndashA60 (2010)
[22] Chugai N N Chevalier R A Kirshner R P amp Challis P M Hubble Space Telescope
Spectrum of SN 1987A at an Age of 8 Years Radioactive Luminescence of Cool GasAs-
trophys J 483 925ndash940 (1997)
[23] Lucy L B Danziger I J Gouiffes C amp Bouchet P Dust Condensation in the Ejecta of
Supernova 1987A - Part Two In S E Woosley (ed)Supernovae 82ndash94 (1991)
[24] Wooden D Het al Airborne spectrophotometry of SN 1987A from 17 to 126 microns
- Time history of the dust continuum and line emissionAstrophys J Supp 88 477ndash507
(1993)
11
Supplementary Information
Supplementary information accompanies this paper
Acknowledgments
This work was supported by the Swedish Research Council and the Swedish National Space Board
Support for the HST observing program was provided by NASA through a grant from the Space
Telescope Science Institute which is operated by the Association of Universities for Research in
Astronomy Inc
Author contribution
JL carried out the data reduction and analysis together with GO PG B L JS and PC CF
performed the theoretical modelling together with AJ andCK JL and CF wrote the paper
RPK is PI for the HSTSAINTS collaboration All authors discussed the results and commented
on the manuscript
12
Author information
Reprints and permissions information is available at wwwnaturecomreprints The authors declare
no competing financial interests Readers are welcome to comment on the online version of this
article at wwwnaturecomnature Correspondence and requests for materials should be directed
to JL (josefinlarssonastrosuse) or CF (claesastrosuse)
13
Figures
a b c
Figure 1 A selection of HST R-band images The observing dates are 1994-09-24 (a) 2000-11-
13 (b) and 2009-04-29 (c) which correspond to 2770 5012 and 8101 days after the explosion
respectively The scale bar inc represents 1primeprime The circumstellar ring is inclined at an angle of45
with respect to the line of sight and is approximately 13 light years across The red (inner) ellipse
shows the expanding aperture used for the light curve in Fig2 By using an initial semi-major
axis of 011primeprime for the observation in 1994 we always follow the bright central part of the ejecta
without being significantly affected by emission from the circumstellar ring The white (outer)
ellipse shows the fixed aperture used for one of the light curves in Supplementary Fig 2 The
R-band emission from the ejecta is dominated by Hα emission with a small contribution from [Ca
I-II] lines whereas the B-band (Supplementary Fig 1) is dominated by H I and Fe I-II lines12 22
Only the densest central parts of the ejecta are visible dueto the low surface brightness of the
outer parts In reality the ejecta extend to the ring as is evident from the strong interaction with
the ring
14
3000 4000 5000 6000 7000 80000
1
2
3
4
5
6
7
Time after explosion (days)
Flu
x (1
0-14 e
rg c
m-2
s-1
)
Figure 2 Light curves of the ejecta in different wavebandsData points from WFPC2 ACS and
WFC3 are shown as dots triangles and stars respectively Red and blue symbols correspond to
the R- and B-bands A correction factor has been applied to the ACS and WFC3 fluxes in order to
account for the differences between these instruments and WFPC2 To quantify the contamination
from the brightening circumstellar ring we created detailed models of the ring for a number of dif-
ferent epochs (Supplementary Information section 1 and Supplementary Figs 3 and 4) The open
symbols show the ejecta fluxes after the contribution from the ring has been removed Although
the contamination from the ring increases with time it neverexceedssim 20 of the flux from the
ejecta The statistical errors on the HST fluxes are smaller than the data points and systematic
errors are discussed in the Supplementary Information section 1 The black squares show the
flux of the [Ca II]λλ72915 73239 lines from VLTUVES (error bars sd) These lines are free
from contamination from the circumstellar ring and the reverse shock We note the decreasing flux
during the firstsim 5 000 days and the increase thereafter indicating an extra source of energy A
further indication that the energy source has changed is that the colour determined from the flux
ratio between the B-and R-bands changes from a level ofsim 08 up to day5 000 to a value close
tosim 06 on day8 00015
4000 6000 80000
1
2
3
4
5
6
7
Ban
d lu
min
osity
(10
34 e
rg s
-1)
R
a
4000 6000 80000
1
2
3
4
5
6
7
B
b
Time after explosion (days)
Figure 3 Evolution of the luminosity from the ejecta in the R- and B-bands The dashed black
lines show a model with only radioactive input mainly from44Ti The 44Ti mass used for the
model is14times 10minus4 M⊙12 as determined from a detailed model that takes into accountthe effects
of scattering and fluorescence of the UV flux as well as a correction for internal dust (here taken
to have a 50 covering factor of the core inside 2000 km sminus1)23 24 The lower dot-dashed lines
show the light curves with no44Ti illustrating the necessity to include this isotope Thered dashed
lines show a model based on a constant fraction of the observed X-ray flux6 corrected for the
fraction of flux absorbed by the ejecta (Supplementary Fig 7) The blue solid line shows the sum
of both models The R- and B-bands contain 5 and 3 of the total bolometric flux respectively
and we expect these fractions to remain roughly constant with time This is because the relative
amount of energy resulting in heating ionization and excitation will remain nearly constant as long
as the ionization by the X-rays issimlt 10minus2 It is clear from this figure that there is a transition at
sim 5 000 days from a radioactivity dominated phase to a phase dominated by the X-ray input from
the collision with the ring
16
arX
iv1
106
2300
v1 [
astr
o-ph
SR
] 12
Jun
201
1
Supplementary information
1 Photometry
Our analysis includes all HST imaging observations performed between 1994 and 2009 in the the
red (WFPC2F675W ACSF625W and WFC3F675W) and blue (WFPC2F439W ACSF435W
and WFC3F438W) broad-band filters (the two groups of filterswill be referred to as the R- and
B-bands from here on) The images were drizzled to combine dithered exposures and to remove
cosmic rays Details of the observations are given in Supplementary Table 1 and a selection of
images are shown in Supplementary Fig 1 The images show theexpansion of the asymmetric
ejecta and the brightening hot spots in the circumstellar ring
We measured the brightness of the ejecta as a function of timeusing the IRAFSTSDAS
task ELLIPSE using different elliptical and circular apertures described below The measure-
ments give mean flux densities which we convert into total fluxes by multiplying with the rect-
angular bandwidth of the different filters When convertingto total fluxes we also correct for
the fact that there are some differences between the filters used for the three instruments To
determine the corrections we used the HST FOS spectrum from 199722 (this covers the entire
spectral range probed by all the filters) and used the SYNPHOTpackage to calculate flux den-
sities in the different filters After converting to total fluxes we obtain the following flux ra-
tios (ACSF625W) (WFPC2F675W)= 108 (WFC3F625W) (WFPC2F675W)= 116
1
(ACSF435W) (WFPC2F439W)= 127 and (WFC3F438W) (WFPC2F439W)= 106 In
all the light curves that we show we have corrected the ACS andWFC3 fluxes in accordance with
this A small offset still remains (see eg Fig 2) which may be due to charge transfer efficiency
losses in WFPC2 (see discussion below) Changes in the spectral energy distribution (SED) would
also have some effect on the conversion factors although wenote that observations2225 suggest
that the SED does not vary significantly with time
For each of the observations we also determined the sky brightness using the IRAFFITSKY
routine Specifically we determined the centroid sky valuein five empty regions located around
SN 1987A and then used the average of these measurements to subtract the sky background from
the light curve The background is typically only a few per cent of the intrinsic ejecta brightness
We also considered the possibility of contamination from the two bright stars that are located to
the north-east and south-west of SN 1987A These stars have strong diffraction spikes from the
secondary-mirror spiders which may pass through the ejecta depending on the HST roll angle We
inspected all the images and found that there is only one observation (2006-04-15) where there
is a strong spike passing through our apertures We estimated the contribution from this spike
by measuring the brightness of the other spikes from the samestar and corrected the light curves
accordingly Another source of contamination is one of the narrow outer rings of SN 1987A which
is partly projected on top of the ejecta However the smalldecreasing flux26 of this component is
negligible compared to the emission from the ejecta
The shape of the ejecta is roughly elliptical so as a first stepwe used an elliptical aperture
2
to measure the evolution of the flux The shape of the ellipse was determined by fitting elliptical
isophotes to the ejecta region in the observation from 2000-11-13 This epoch was chosen because
it is long enough after the explosion that the ejecta shape isclearly discernible while still early
enough for the edge of the inner ejecta to be clearly separated from the circumstellar ring The fits
were performed using the IRAFSTSDAS task ELLIPSE Settingthe semi-major axis (sma) to02primeprime
(the size used for the light curve in Fig 2 for this epoch) we find a position angle of174 plusmn 01
and an eccentricity of0684plusmn0002 This can be compared with previous measurements with HST
(PA= 14 plusmn 5)27 and VLTSINFONI (PA= 15 plusmn 09 e = 083 from the1644 microm Si IFe II
feature)21 The agreement with the position angle is clearly good and given that the SINFONI
measurements probe the SiFe core and the R-band is dominated by the H-rich gas the agreement
with the eccentricity is also reasonable As described in the main paper the light curves presented
in Fig 2 were derived using this elliptical aperture The size of the aperture was expanded as a
function of time in order to always follow the same ejecta material
In order to make sure that the transition from a decaying to a rising flux seen in Fig 2 is
not connected to the use of this particular aperture we alsoperformed the measurements using
apertures with other shapes and sizes trying both apertures that have a fixed size and apertures
that expand with the ejecta Supplementary Fig 2 shows the R- and B-band light curves for the
same expanding elliptical aperture as in Fig 2 an expanding circular aperture (with radius equal
to the sma of the elliptical aperture) as well as a large fixedaperture The fixed aperture encloses
most of the ejecta but still avoids direct contamination by the ring (the aperture is shown in Fig 1)
The light curves extracted from the expanding elliptical and circular apertures show very similar
3
behaviour demonstrating that the exact shape of the aperture is not important The light curve from
the large fixed aperture also shows the same behaviour during the firstsim 7000 days but levels off
at late times This is at least partly due to ejecta material expanding out of the fixed aperture The
large aperture is also likely to be significantly affected bycontamination from the circumstellar
ring making it hard to draw firm conclusions regarding the ejecta using this aperture
Contamination from the ring (due to flux from the brighteningring spilling into the ejecta
region) is likely to affect all our light curves at some level In order to quantify this effect we
used the HST point-spread-function modelling tool Tiny Tim28 and created models for the ring
for a number of different epochs in both bands We set up the models to match the observed
distribution of hot spots as closely as possible and to have the same total flux in the ring area as the
observations The modelling is illustrated in Supplementary Fig 3 which shows the real data and
the model for the F675W image from 2009-04-29 and in Supplementary Fig 4 which compares
the radial profiles of the data and the model The corrected light curves derived using these models
are shown as open symbols in Fig 2 and Supplementary Fig 2 The contribution from the ring
increases with time and is larger in the R-band but it does not have a major effect on the light
curves from the expanding apertures For the large fixed aperture the contamination is much more
severe reaching about 50 of the total flux at late times in the R-band
The modelling of the ring is naturally associated with some uncertainties In order to quantify
these uncertainties we performed two different tests First we investigated the effect of varying the
number of points sources used to model the ring Specifically we created models using between
4
8 and 90 point sources distributed along the ring while always keeping the total flux in the ring
area constant The different ring models resulted in fluxes in the ejecta apertures that agreed to
within 15 This demonstrates that the specific model for thering is not very important as long
as the same total flux is distributed in an ellipse around the ejecta The main reason for this is of
course that we are interested in the total flux that leaks intothe ejecta region and not its detailed
distribution
Another test of the models is to compare the flux in the synthetic and real images in regions
located just outside the circumstellar ring We used clean regions (uncontaminated by stars and
other sources of emission) that allow us to measure the flux inthe wings of the point sources
in the ring For the observation from 2009-04-29 we find that the agreement is excellent (the
discrepancy is less than 10) which gives us confidence thatthe models provide a good estimate
of the emission from the ring For earlier epochs it is harderto evaluate the models in this way
since the clean regions outside the ring are completely dominated by the sky background rather
than ring emission For this reason we cannot determine whether our models are equally accurate
at early times We note however that the flux from the ring isnegligible at these times
An additional source of uncertainty is the loss of Charge Transfer Efficiency (CTE) This
effect is known to increase with time and is especially important for faint objects on low back-
grounds located far from the detector readout29 To investigate the importance of CTE losses we
performed aperture photometry on about 10 stars of varying brightness located around SN 1987A
We found that the effect is negligible in the ACS but clearly noticeable in WFPC2 where stars lose
5
at mostsim 10 of their flux between 1994 and 2009 This also agrees with estimates obtained for
the supernova ejecta using the WFPC2 CTE correction formula29 In terms of the light curve in
Fig 2 we note that asim 10 increase in the WFPC2 data points at late times would improvethe
agreement between the ACS and WFPC2
2 Spectroscopy
As a complement to the photometry we investigate HST STIS spectra taken with the G750L grating
in 2004 and 2010 These spectra overlap with the wavelength region covered by the R-filters and
give us an opportunity to study the different spectral components that may contribute to the increase
in flux In both observations a slit with a width of 02primeprime was placed in the north-south direction
centred on the ejecta1630 In 2004 there were also two observations taken with the narrow slit
placed on either side of the central slit To allow for a comparison with the photometry we extracted
spectra in regions that match the size of the expanding elliptical aperture as closely as possible
This means using the central slit only and an extraction height of plusmn024primeprime in 2004 andplusmn031primeprime in
2010
Supplementary Fig 5 shows the Hα profiles from 2004 and 2010 The line profiles are
clearly asymmetric with a strong blue wing extending down tosim minus5 000 km sminus1 and a red wing
that only reaches velocities of aboutsim 2 500 km sminus1 The constant width of the ejecta line profile
shows that the expanding aperture that we used follows the same material over a 6-year span of
6
time From the two-dimensional spectra1630 it is clear that the blue wing mainly comes from the
northern part of the ejecta The lack of a correspondingly strong red wing may be due to dust
absorption in the far side of the ejecta Supplementary Fig5 also shows that the increase in flux
between 2004 and 2010 is mainly due to an increase in the blue wing of the ejecta profile
The Hα emission also contains a small contribution from the reverse shock This component
is clearly visible on the red side of the line as the boxy part of the profile betweensim 3 000 minus
9 000 km sminus1 On the blue side of the line the reverse shock appears at velocities higher than
sim minus9 000 km sminus1 where it is blended with the broad [O I]λλ 6300 6364 lines from the ejecta at
minus12 022 km sminus1 andminus9 096 km sminus1 To estimate the flux from the reverse shock we focus on the
boxy part of the profile on the red side since this is not blended with any other strong lines The
contribution from this component compared to the total flux in the R-band issim 9 minus 10 in both
2004 and 2010 It is clear from inspection of the spectra thatthe reverse shock is not as strong on
the blue side and a very conservative upper limit on the total contribution from the reverse shock is
thereforesim 20 We especially note that there is no significant increase between 2004 and 2010
In Supplementary Fig 5 we also show the spectrum obtained bycombining the three slit
positions from the 2004 observations renormalized to the continuum of the other spectra The
combined spectrum is very similar to that from the central slit albeit with a slightly stronger line
core and red wing The contribution from the reverse shock onthe red side issim 11 ie only
marginally larger than the values given above
The STIS observation from 2010 also allows us to investigatethe emission from the south-
7
ernmost part of the ejecta which is seen outside both the expanding and the fixed aperture at late
times (Fig 1) STIS spectra extracted in this region show a significant contribution from the re-
verse shock but also an asymmetric line profile from the ejecta with a strong blue wing extending
down tosim minus2 000 km sminus1 The fact that we see blueshifted emission from the southernpart of
the ejecta shows that there must be some ejecta material located well above the plane of the ring
The [Ca II] observations in Fig 2 were performed between 2000 and 2009 with the Very
Large Telescope (VLT) at ESO using the UVES instrument Theprimary purpose of these obser-
vations was to follow the evolution of the narrow lines from the ring collision To maximise the
spectral resolution and to minimise contamination from nearby stars a comparatively narrow slit
08 primeprime wide was chosen The seeing was in most cases 06 ndash 08primeprime which is just enough to spatially
resolve the ring into a northern and a southern part The slitwas centred on the position of the
supernova and had a position angle of 30 in all the observations The observations were reduced
with the standard pipeline and the errors on the absolute fluxes were estimated to be less than 20 ndash
30 (ref 5)
3 Modelling of the light curve
At first the energy radiated by a SN comes from the shock wave arriving at the surface of the
exploding star This phase lasted lasted only a few hours in SN 1987A and was followed by a
period of a few weeks where the light curve was powered by the diffusive release of the internal
8
energy produced by the shock wave17 Subsequently the energy for emission was supplied by
the decay of radioactive isotopes created in the explosionDuring the firstsim 1 000 days the
radioactive input was dominated by56Ni decaying into56Co and56Fe From the first two years
of the bolometric light curve the mass of56Ni could be determined to0069 M⊙31 After sim 1 000
days57Ni took over and a mass of3times10minus3 M⊙ was found32ndash34 Finally aftersim 1 600 days the next
most abundant isotope44Ti has been predicted to dominate the energy input to the ejecta While
the bolometric light curve could be accurately determined up tosim 1 000 days the dominance of
the mid-IR which is difficult to determine from observations requires accurate modelling of the
optical bands at later times In addition the hydrogen-rich parts of the ejecta are subject to a freeze-
out34 where recombination and cooling become slow compared to the radioactive decay time-
scales and the expansion time-scales It is therefore necessary to use a time-dependent approach
for the modelling
The modelling of the radioactively powered part of the lightcurves in Fig 3 is based on a
time-dependent spectral code35 36 The code includes calculations of the non-thermal excitation
and ionization by the gamma-rays and positrons from the radioactive decay of56Ni 57Ni and44Ti
as well as a full non-local thermodynamic equilibrium treatment of the most important elements
and lines The present version also includes updated atomicdata in particular more accurate
collision rates for Fe II and other ions The radiative transfer uses the Sobolev approximation
which treats the line escape in individual lines accurately However the non-local scattering from
line to line is not included (except for the Ca II H and K lineswhich feed the [Ca II]λλ72915
73239 lines by fluorescence) This especially affects the UV and blue parts of the spectrum and
9
leads to an underestimate of the flux in the B-band12
An important test is that this model accurately reproduces the Hα evolution up to day 3600
(ref 2) A comparison with the spectrum at 78 years22 shows agreement to within 50 for the
R-band but the model underestimates the flux in the B-band bya factor of 25 To model the shape
of the light curves we therefore renormalize the B-band fluxes by a factor 25 and the R-band by
a factor 15 The total energy input from radioactivity can be estimated tosim 12 times 1036erg sminus1
at 20 years12 In addition to this there is a substantial contribution from delayed recombination
(freeze-out) This comes primarily from the low-density hydrogen envelope and is seen mainly as
Balmer emission The decrease of this component is substantially faster than the44Ti decay and is
responsible for the fast decline seen beforesim 4 000 days (Fig 3)
When translating the broad-band fluxes to luminosities we assume a distance of 50 kpc and a
reddening of EBminusV = 016 mag37 For the comparison with the observations we use the light curve
from the expanding elliptical aperture multiplied by a constant factor for the R- and B-bands The
reason for using this rather than the fixed aperture in Fig 1 is that the latter shows a misleading
flattening at epochs later thansim 7 000 days because of the expansion of part of the ejecta outside
the aperture The constant factors were determined as an average of the ratio of the flux in the fixed
aperture to that of the expanding aperture for epochs earlier than7 000 days The constants are 26
for the R-band and 25 for the B-band There is of course some uncertainty in the correction from
the expanding aperture to the total emitted flux which also affects the44Ti mass
To determine the X-ray input to the ejecta we calculated the photoelectric absorption along
10
different rays in the ejecta from a point source located at the radius of the circumstellar ring For
the abundance and density distributions we used the partially mixed 14E1 explosion model17 This
model is spherically symmetric (although mixed) Unfortunately no 2-D or 3-D simulations exist
with appropriate nucleosynthesis The spherical approximation should however be sufficient for
the qualitative nature of the model Most of the envelope is transparent to X-rays with energies
above about 02 keV as seen in Supplementary Fig 6 which shows the ejecta expansion velocity
for optical depthτ = 1 as a function of photon energy The high metallicity core dominates the
opacity by K- and L-shell absorption by oxygen and other elements and is opaque at all but the
very highest energies
The energy deposition is an angular average of the absorbed intensity over all directions
of the core and envelope shown in Supplementary Fig 7 for four different photon energies
The different deposition curves can be well approximated byC(E) times 10minus3t167yr whereC(E) =
(45 16 07)times 10minus3 for E = 01 035 and 1 keV respectively The general time dependence can
be explained as a balance between the increase of the solid angle of the core as seen from the ring
prop t2 and the increasing transparency of the ejecta as the density decreases
The X-ray luminosity used in this paper is that directly observed by Chandra6 This is likely
to be an underestimate for several reasons The quoted X-rayluminosities only refer to the ob-
served fluxsimgt 05 keV For a shock with a temperature of 035 keV most of the luminosity is
below this energy especially if the shock is radiative as is likely for shocks with velocities be-
low sim 400 km sminus1 (ref 3) In addition the line profiles of the optical emission show that there
11
are shocks of lower velocities most likely tangential shocks38 which radiate mainly below the
observable X-ray band and add to the ionizing flux The typical shock velocity from the optical
lines issim 200 km sminus1 (ref 5) which corresponds to a temperature ofsim 50 eV Because the opacity
increases asEminus3 (WhereE is the photon energy) the absorption efficiency of the ejecta of this low
energy radiation is nearly 100 The absorbed X-rays are therefore more than enough to explain
the observed increase in the optical bands A more accurate estimate of the spectral distribution
would require a detailed numerical calculation of the X-rayabsorption and thermalization which
is beyond the scope of this paper We also remark that both theoptical emission from the ring5 and
the mid-IR8 are strongly correlated with the X-rays
The conversion from X-rays to optical emission takes place first by photoelectric absorption
creating fast non-thermal electrons with energies up to keV These are thermalized by excitation
ionization and heating of the free thermal electrons For hydrogen at the relevant degree of ioniza-
tion 35minus 40 of the secondary electron energy goes into ionization followed by recombination
whilesim 8 goes into direct excitation ofn gt 2 (refs 39 40) At100minus200 K sim 9 of the ioniza-
tion energy andsim 16 of the excitation energy emerges as Hα (ref 41) In total this corresponds
to sim 5 of the X-ray energy Other elements add to this The relativeimportance of excitation
ionization and heating will remain roughly constant as longas the ionization issimlt 10minus2 and we
therefore do not expect conversion efficiency for the two bands to change over time However
once the ionization surpasses this value the fraction going into heating increases at the expense of
the other channels This will increase the far-IR fine structure lines compared to the optical lines
until the temperature is high enough for thermal effects to increase the opticalUV emission35 36
12
4 Effects of dust and positron leakage in the ejecta
There is strong evidence for dust in the ejecta from early observations232442 as well as from
observations discussed in this supplement In principle atransition from optically thick to optically
thin dust could account for an increase in the flux This is however unlikely for several reasons
First it would be a strange coincidence that this would occur at the same time as the X-ray flux
becomes important Secondly compared to the flux from our model with constant covering fraction
(ie optically thick dust clumps) which is given by the dashed line in Fig 3 the increase has to be
a factor ofsim 8 in the R-band andsim 5 in the B-band The estimated covering factor of the dust at
early times wassim 05 (refs 23 24) implying a maximum increase in the flux by a factor of sim 2
Moreover we expect the increase to occur first in the R-band and later in the B-band based on the
higher extinction in the latter band The imaging also indicates dust obscuration in the central part
of the SN up to the latest epochs (Supplementary Fig 1) although this may also be an artefact of
the external X-ray illumination as discussed in the main paper
Finally positron leakage from the Fe-rich material containing the44Ti may enhance the emis-
sion from the O- and H-rich zones in the core12 This depends sensitively on the strength of a
magnetic field in the ejecta which is uncertain The main effect of positron leakage is that the hy-
drogen and intermediate element lines would increase at theexpense of the Fe I-II lines At most
this may enhance the emission in the observed bands by a factor of sim 2 compared to the complete
trapping case As discussed above this is far from sufficient to explain the observed increase in
the R- and B-bands
13
5 Supplementary Figures
Supplementary Figure 1 Selection of HST images of SN 1987AThe images show the evolution
of the ejecta and the circumstellar ring as a function of time The top row shows the R-band and the
bottom row shows the B-band The observing dates are 1994-09-24 (a ande) 1999-04-21 (b and
f) 2003-11-28 (c andg) and 2009-04-09 (d andh) which correspond to 2770 4440 6122 and
8101 days after the explosion respectively Note the expansion of the ejecta and the brightening
hot spots in the circumstellar ring
14
3000 4000 5000 6000 7000 8000
Time after explosion (days)
0
2
4
6
8
10
12
14
Flux(10
14ergcm
2s
1)
a
3000 4000 5000 6000 7000 8000
Time after explosion (days)
0
2
4
6
8
10
Flux(10
14ergcm
2s
1)
b
Supplementary Figure 2 Comparison of ejecta light curves for different apertures Panela shows
the R-band and panelb shows the B-band (note the different scales on the y-axes) Data points from
WFPC2 ACS and WFC3 are shown as dots triangles and stars respectively A correction factor
has been applied to the ACS and WFC3 fluxes in order to account for the differences between these
instruments and WFPC2 The red and blue data points correspond to the same expanding elliptical
aperture as in Fig 2 shown here for reference Green data points are for a fixed aperture that
encloses as much of the ejecta as possible (sma= 050primeprime see also Fig 1) while black data points
are for an expanding circular aperture with radius equal to the semi-major axis of the expanding
elliptical aperture Open symbols indicate approximate flux levels after accounting for emission
from the circumstellar ring The light curve from the fixed aperture clearly levels off at late times
This is at least partly due to ejecta material expanding out of the aperture but other effects may
also contribute
15
a b
Supplementary Figure 3 Example of the modelling of the ring a The HSTWFPC2 F675W
image from 2009-04-29 This is the same image as in Supplementary Fig 1d but the image levels
have been adjusted to show the structure of the ring more clearly As a result the ejecta appear very
faint b The model for the hot spots in the ring for the same epoch
16
00 02 04 06 08 10
Semimajor axis (arc seconds)
15
10
05
00
05
10
15
20
Log
(cou
nts
inellip
tica
lannulus)
Supplementary Figure 4 Comparison of the radial brightness profiles of the real data and the
model The profiles were produced for the 2009-04-29 WFPC2F675W observation (Supplemen-
tary Fig 3) with the real data shown in black and the model inred Specifically the lines show the
counts inside elliptical annuli aligned with the circumstellar ring as a function of the sma of the
annulus The model clearly agrees well with the real data in the ring area (between about 06ndash10primeprime)
and should therefore give us a good estimate of the amount of flux from the ring that leaks into the
ejecta region
17
20 15 10 5 0 5 10 15 20
Velocity (103 km s1 )
00
05
10
15
20
25
30
Flux(10
16ergcm
2s
1
A
1)
Supplementary Figure 5 STIS Hα profiles of the ejecta The red and black lines are for a 02primeprime slit
placed in the north-south direction and centred on the ejecta in 2004 and 2010 respectively The
dashed blue line is the combined spectrum from three 02primeprime slits placed next to each other in 2004
renormalized to match the continuum level of the other spectra The spectral extraction regions
were chosen to correspond as closely as possible to the size of the expanding elliptical aperture
used for the flux measurements in Fig 2 The boxy part of the line profile between3 000 and
9 000 km sminus1 is due to the reverse shock There is also a contribution fromthe reverse shock on
the blue side but this is harder to disentangle because of blending with the [O I]λλ 6300 6364
lines atminus12 022 km sminus1 andminus9 096 km sminus1
18
10 15 20 25 30 35 40
Log (energy) (eV)
0
2
4
6
8
10
12
14
Veloc
ityat
=1(103 km
s
1)
10 yrs
20 yrs
30 yrs
Supplementary Figure 6 Ejecta velocity corresponding to optical depthτ = 1 The optical depth
is measured from the ring as a function of energy at 10 20 and 30 years after the explosion The
maximum velocity for each of these curves is given by the ejecta velocity in the plane of the ring
which is 21 times 104(t10 yrs)minus1 km sminus1 Note the relatively small change in velocity with time
of τ(E) = 1 for energiessimgt 02 keV The FWHM of the line profiles are therefore expected to
decrease relatively slowly with time as long as most of the shock energy is emitted above this
energy Note also that at 30 years the full ejecta will be transparent atsimgt 6 keV
19
5 10 15 20 25 30
Time since explosion (years)
00
02
04
06
08
10
Fractionab
sorbed
01 keV
035 keV
10 keV
20 keV
Supplementary Figure 7 Fraction of the X-ray flux absorbed by the supernova ejecta as a function
of time The different lines correspond to different photonenergies as indicated in the figure The
main reason for the evolution is the increasing solid angle of the core as seen from the ring (prop t2)
damped by the increasing transparency at higher energy
20
6 Supplementary Table
Date Instrument Filter Exposure time Instrument Filter Exposure time(s) (s)
1994-09-24 WFPC2 F675W 600 WFPC2 F439W 8001995-03-05 WFPC2 F675W 600 WFPC2 F439W 8001996-02-06 WFPC2 F675W 600 WFPC2 F439W 9501997-07-10 WFPC2 F675W 600 WFPC2 F439W 8001998-02-06 WFPC2 F675W 400 WFPC2 F439W 5001999-01-07 WFPC2 F675W 1220 WFPC2 F439W 10391999-04-21 WFPC2 F675W 400 WFPC2 F439W 8002000-02-02 WFPC2 F675W 400 WFPC2 F439W 4602000-06-16 WFPC2 F675W 400 WFPC2 F439W 8002000-11-13 WFPC2 F675W 2400 WFPC2 F439W 12002001-03-23 WFPC2 F675W 500 WFPC2 F439W 10002001-12-07 WFPC2 F675W 800 WFPC2 F439W 16002003-01-05 ACS F625W 800 ACS F435W 12002003-08-12 ACS F625W 480 ACS F435W 8002003-11-28 ACS F625W 800 ACS F435W 16002004-12-15 ACS F435W 16002005-04-02 ACS F435W 12002005-09-26 ACS F625W 120002005-09-28 ACS F625W 7202006-04-15 ACS F625W 1200 ACS F435W 12002006-04-29 ACS F625W 7202006-12-06 ACS F625W 1200 ACS F435W 18002007-05-12 WFPC2 F675W 2700 WFPC2 F439W 30002008-02-19 WFPC2 F675W 1600 WFPC2 F439W 24002009-04-29 WFPC2 F675W 1600 WFPC2 F439W 20002009-12-12 WFC3 F625W 3000 WFC3 F438W 800
Supplementary Table 1HST observations used for the analysis
21
References
[25] Wang Let al Hubble Space Telescope Spectroscopic Observations of the Ejecta of SN
1987A at 2000 DaysAstrophys J 466 998ndash1010 (1996)
[26] Tziamtzis A Lundqvist P Groningsson P amp Nasoudi-Shoar S The outer rings of SN
1987A Astron Astrophys 527 A35ndashA48 (2011)
[27] Wang Let al The Axisymmetric Ejecta of Supernova 1987AAstrophys J 579 671ndash677
(2002)
[28] Tiny Tim HST PSF Modeling httpwwwstscieduhstobservatoryfocusTinyTim (2011)
[29] Dolphin A E A Revised Characterization of the WFPC2 CTE Loss PASP 121 655ndash667
(2009)
[30] Heng K amp McCray R Balmer-dominated Shocks Revisited Astrophys J 654 923ndash937
(2007)
[31] Bouchet Pet al The Bolometric Lightcurve of Supernova 1987A - Part Two - Results from
Visible and Infrared SpectrophotometryAstron Astrophys 245 490ndash498 (1991)
[32] Kurfess J Det al Oriented Scintillation Spectrometer Experiment observations of Co-57
in SN 1987AAstrophys J 399 L137ndashL140 (1992)
[33] Varani G F Meikle W P S Spyromilio J amp Allen D A Direct Observation of Radioac-
tive Cobalt Decay in Supernova 1987AMon Not R Astron Soc 245 570ndash576 (1990)
22
[34] Fransson C amp Kozma C The freeze-out phase of SN 1987A- Implications for the light
curveAstrophys J 408 L25ndashL28 (1993)
[35] Kozma C amp Fransson C Late Spectral Evolution of SN 1987A I Temperature and Ioniza-
tion Astrophys J 496 946ndash966 (1998)
[36] Kozma C amp Fransson C Late Spectral Evolution of SN 1987A II Line EmissionAstro-
phys J 497 431ndash457 (1998)
[37] Fitzpatrick E L amp Walborn N R Observations of Sk-69 deg 203 and the interstellar
extinction towards SN 1987AAstron J 99 1483ndash1487 (1990)
[38] Pun C S Jet al Modeling the Hubble Space Telescope Ultraviolet and Optical Spectrum
of Spot 1 on the Circumstellar Ring of SN 1987AAstrophys J 572 906ndash931 (2002)
[39] Xu Y amp McCray R Energy degradation of fast electronsin hydrogen gasAstrophys J
375 190ndash201 (1991)
[40] Kozma C amp Fransson C Gamma-ray deposition and nonthermal excitation in supernovae
Astrophys J 390 602ndash621 (1992)
[41] Martin P G Hydrogenic radiative recombination at low temperature and densityAstro-
phys J Supp 66 125ndash138 (1988)
[42] Moseley S H Dwek E Glaccum W Graham J R amp Loewenstein R F Far-infrared
observations of thermal dust emission from supernova 1987A Nature 340 697ndash699 (1989)
23

References
[1] Woosley S E Heger A amp Weaver T A The evolution andexplosion of massive stars
Reviews of Modern Physics 74 1015ndash1071 (2002)
[2] Fransson C amp Kozma C Radioactivities and nucleosynthesis in SN 1987ANew Astronomy
Review 46 487ndash492 (2002)
[3] McKee C F inYoung Supernova Remnants (eds S S Holt amp U Hwang) vol 565 ofAmeri-
can Institute of Physics Conference Series 17ndash28 (2001)
[4] Morris T amp Podsiadlowski P The Triple-Ring Nebula Around SN 1987A Fingerprint of a
Binary MergerScience 315 1103ndash1105 (2007)
[5] Groningsson Pet al Time evolution of the line emission from the inner circumstellar ring
of SN 1987A and its hot spotsAstron Astrophys 492 481ndash491 (2008)
[6] Racusin J Let al X-ray Evolution of SNR 1987A The Radial ExpansionAstrophys J
703 1752ndash1759 (2009)
[7] Zanardo Get al Multifrequency Radio Measurements of Supernova 1987A Over22 Years
Astrophys J 710 1515ndash1529 (2010)
[8] Dwek E et al Five Years of Mid-infrared Evolution of the Remnant of SN 1987A The
Encounter Between the Blast Wave and the Dusty Equatorial Ring Astrophys J 722 425ndash
434 (2010)
9
[9] Timmes F X Woosley S E Hartmann D H amp Hoffman R D The Production of44Ti
and60Co in SupernovaeAstrophys J 464 332ndash341 (1996)
[10] Diehl R amp Timmes F X Gamma-Ray Line Emission from Radioactive Isotopes in Stars
and GalaxiesPASP 110 637ndash659 (1998)
[11] Shigeyama T amp Nomoto K Theoretical light curve of SN1987A and mixing of hydrogen
and nickel in the ejectaAstrophys J 360 242ndash256 (1990)
[12] Jerkstrand A Fransson C amp Kozma C The44Ti-powered spectrum of SN 1987AAs-
tron Astrophys (in press) preprint at〈httparxivorgabs11033653〉 (2011)
[13] Michael Eet al Hubble Space Telescope Observations of High-Velocity Lyα and Hα Emis-
sion from Supernova Remnant 1987A The Structure and Development of the Reverse Shock
Astrophys J 593 809ndash830 (2003)
[14] Smith Net al The Reverse Shock of SNR 1987A at 18 Years after OutburstAstrophys J
635 L41ndashL44 (2005)
[15] Heng Ket al Evolution of the Reverse Shock Emission from SNR 1987AAstrophys J
644 959ndash970 (2006)
[16] France Ket al Observing Supernova 1987A with the Refurbished Hubble Space Telescope
Science 329 1624ndash1627 (2010)
10
[17] Blinnikov S Lundqvist P Bartunov O Nomoto Kamp Iwamoto K Radiation Hydrody-
namics of SN 1987A I Global Analysis of the Light Curve for the First 4 MonthsAstro-
phys J 532 1132ndash1149 (2000)
[18] Zhekov S A Park S McCray R Racusin J L amp Burrows D N Evolution of the
Chandra CCD spectra of SNR 1987A probing the reflected-shock picture Mon Not R As-
tron Soc 721 518ndash529 (2010)
[19] Woosley S E Hartmann D amp Pinto P A Hard emissionat late times from SN 1987A
Astrophys J 346 395ndash404 (1989)
[20] Graves G J Met al Limits from the Hubble Space Telescope on a Point Source in SN
1987A Astrophys J 629 944ndash959 (2005)
[21] Kjaeligr K Leibundgut B Fransson C Jerkstrand Aamp Spyromilio J The 3-D structure of
SN 1987Arsquos inner ejectaAstron Astrophys 517 A51ndashA60 (2010)
[22] Chugai N N Chevalier R A Kirshner R P amp Challis P M Hubble Space Telescope
Spectrum of SN 1987A at an Age of 8 Years Radioactive Luminescence of Cool GasAs-
trophys J 483 925ndash940 (1997)
[23] Lucy L B Danziger I J Gouiffes C amp Bouchet P Dust Condensation in the Ejecta of
Supernova 1987A - Part Two In S E Woosley (ed)Supernovae 82ndash94 (1991)
[24] Wooden D Het al Airborne spectrophotometry of SN 1987A from 17 to 126 microns
- Time history of the dust continuum and line emissionAstrophys J Supp 88 477ndash507
(1993)
11
Supplementary Information
Supplementary information accompanies this paper
Acknowledgments
This work was supported by the Swedish Research Council and the Swedish National Space Board
Support for the HST observing program was provided by NASA through a grant from the Space
Telescope Science Institute which is operated by the Association of Universities for Research in
Astronomy Inc
Author contribution
JL carried out the data reduction and analysis together with GO PG B L JS and PC CF
performed the theoretical modelling together with AJ andCK JL and CF wrote the paper
RPK is PI for the HSTSAINTS collaboration All authors discussed the results and commented
on the manuscript
12
Author information
Reprints and permissions information is available at wwwnaturecomreprints The authors declare
no competing financial interests Readers are welcome to comment on the online version of this
article at wwwnaturecomnature Correspondence and requests for materials should be directed
to JL (josefinlarssonastrosuse) or CF (claesastrosuse)
13
Figures
a b c
Figure 1 A selection of HST R-band images The observing dates are 1994-09-24 (a) 2000-11-
13 (b) and 2009-04-29 (c) which correspond to 2770 5012 and 8101 days after the explosion
respectively The scale bar inc represents 1primeprime The circumstellar ring is inclined at an angle of45
with respect to the line of sight and is approximately 13 light years across The red (inner) ellipse
shows the expanding aperture used for the light curve in Fig2 By using an initial semi-major
axis of 011primeprime for the observation in 1994 we always follow the bright central part of the ejecta
without being significantly affected by emission from the circumstellar ring The white (outer)
ellipse shows the fixed aperture used for one of the light curves in Supplementary Fig 2 The
R-band emission from the ejecta is dominated by Hα emission with a small contribution from [Ca
I-II] lines whereas the B-band (Supplementary Fig 1) is dominated by H I and Fe I-II lines12 22
Only the densest central parts of the ejecta are visible dueto the low surface brightness of the
outer parts In reality the ejecta extend to the ring as is evident from the strong interaction with
the ring
14
3000 4000 5000 6000 7000 80000
1
2
3
4
5
6
7
Time after explosion (days)
Flu
x (1
0-14 e
rg c
m-2
s-1
)
Figure 2 Light curves of the ejecta in different wavebandsData points from WFPC2 ACS and
WFC3 are shown as dots triangles and stars respectively Red and blue symbols correspond to
the R- and B-bands A correction factor has been applied to the ACS and WFC3 fluxes in order to
account for the differences between these instruments and WFPC2 To quantify the contamination
from the brightening circumstellar ring we created detailed models of the ring for a number of dif-
ferent epochs (Supplementary Information section 1 and Supplementary Figs 3 and 4) The open
symbols show the ejecta fluxes after the contribution from the ring has been removed Although
the contamination from the ring increases with time it neverexceedssim 20 of the flux from the
ejecta The statistical errors on the HST fluxes are smaller than the data points and systematic
errors are discussed in the Supplementary Information section 1 The black squares show the
flux of the [Ca II]λλ72915 73239 lines from VLTUVES (error bars sd) These lines are free
from contamination from the circumstellar ring and the reverse shock We note the decreasing flux
during the firstsim 5 000 days and the increase thereafter indicating an extra source of energy A
further indication that the energy source has changed is that the colour determined from the flux
ratio between the B-and R-bands changes from a level ofsim 08 up to day5 000 to a value close
tosim 06 on day8 00015
4000 6000 80000
1
2
3
4
5
6
7
Ban
d lu
min
osity
(10
34 e
rg s
-1)
R
a
4000 6000 80000
1
2
3
4
5
6
7
B
b
Time after explosion (days)
Figure 3 Evolution of the luminosity from the ejecta in the R- and B-bands The dashed black
lines show a model with only radioactive input mainly from44Ti The 44Ti mass used for the
model is14times 10minus4 M⊙12 as determined from a detailed model that takes into accountthe effects
of scattering and fluorescence of the UV flux as well as a correction for internal dust (here taken
to have a 50 covering factor of the core inside 2000 km sminus1)23 24 The lower dot-dashed lines
show the light curves with no44Ti illustrating the necessity to include this isotope Thered dashed
lines show a model based on a constant fraction of the observed X-ray flux6 corrected for the
fraction of flux absorbed by the ejecta (Supplementary Fig 7) The blue solid line shows the sum
of both models The R- and B-bands contain 5 and 3 of the total bolometric flux respectively
and we expect these fractions to remain roughly constant with time This is because the relative
amount of energy resulting in heating ionization and excitation will remain nearly constant as long
as the ionization by the X-rays issimlt 10minus2 It is clear from this figure that there is a transition at
sim 5 000 days from a radioactivity dominated phase to a phase dominated by the X-ray input from
the collision with the ring
16
arX
iv1
106
2300
v1 [
astr
o-ph
SR
] 12
Jun
201
1
Supplementary information
1 Photometry
Our analysis includes all HST imaging observations performed between 1994 and 2009 in the the
red (WFPC2F675W ACSF625W and WFC3F675W) and blue (WFPC2F439W ACSF435W
and WFC3F438W) broad-band filters (the two groups of filterswill be referred to as the R- and
B-bands from here on) The images were drizzled to combine dithered exposures and to remove
cosmic rays Details of the observations are given in Supplementary Table 1 and a selection of
images are shown in Supplementary Fig 1 The images show theexpansion of the asymmetric
ejecta and the brightening hot spots in the circumstellar ring
We measured the brightness of the ejecta as a function of timeusing the IRAFSTSDAS
task ELLIPSE using different elliptical and circular apertures described below The measure-
ments give mean flux densities which we convert into total fluxes by multiplying with the rect-
angular bandwidth of the different filters When convertingto total fluxes we also correct for
the fact that there are some differences between the filters used for the three instruments To
determine the corrections we used the HST FOS spectrum from 199722 (this covers the entire
spectral range probed by all the filters) and used the SYNPHOTpackage to calculate flux den-
sities in the different filters After converting to total fluxes we obtain the following flux ra-
tios (ACSF625W) (WFPC2F675W)= 108 (WFC3F625W) (WFPC2F675W)= 116
1
(ACSF435W) (WFPC2F439W)= 127 and (WFC3F438W) (WFPC2F439W)= 106 In
all the light curves that we show we have corrected the ACS andWFC3 fluxes in accordance with
this A small offset still remains (see eg Fig 2) which may be due to charge transfer efficiency
losses in WFPC2 (see discussion below) Changes in the spectral energy distribution (SED) would
also have some effect on the conversion factors although wenote that observations2225 suggest
that the SED does not vary significantly with time
For each of the observations we also determined the sky brightness using the IRAFFITSKY
routine Specifically we determined the centroid sky valuein five empty regions located around
SN 1987A and then used the average of these measurements to subtract the sky background from
the light curve The background is typically only a few per cent of the intrinsic ejecta brightness
We also considered the possibility of contamination from the two bright stars that are located to
the north-east and south-west of SN 1987A These stars have strong diffraction spikes from the
secondary-mirror spiders which may pass through the ejecta depending on the HST roll angle We
inspected all the images and found that there is only one observation (2006-04-15) where there
is a strong spike passing through our apertures We estimated the contribution from this spike
by measuring the brightness of the other spikes from the samestar and corrected the light curves
accordingly Another source of contamination is one of the narrow outer rings of SN 1987A which
is partly projected on top of the ejecta However the smalldecreasing flux26 of this component is
negligible compared to the emission from the ejecta
The shape of the ejecta is roughly elliptical so as a first stepwe used an elliptical aperture
2
to measure the evolution of the flux The shape of the ellipse was determined by fitting elliptical
isophotes to the ejecta region in the observation from 2000-11-13 This epoch was chosen because
it is long enough after the explosion that the ejecta shape isclearly discernible while still early
enough for the edge of the inner ejecta to be clearly separated from the circumstellar ring The fits
were performed using the IRAFSTSDAS task ELLIPSE Settingthe semi-major axis (sma) to02primeprime
(the size used for the light curve in Fig 2 for this epoch) we find a position angle of174 plusmn 01
and an eccentricity of0684plusmn0002 This can be compared with previous measurements with HST
(PA= 14 plusmn 5)27 and VLTSINFONI (PA= 15 plusmn 09 e = 083 from the1644 microm Si IFe II
feature)21 The agreement with the position angle is clearly good and given that the SINFONI
measurements probe the SiFe core and the R-band is dominated by the H-rich gas the agreement
with the eccentricity is also reasonable As described in the main paper the light curves presented
in Fig 2 were derived using this elliptical aperture The size of the aperture was expanded as a
function of time in order to always follow the same ejecta material
In order to make sure that the transition from a decaying to a rising flux seen in Fig 2 is
not connected to the use of this particular aperture we alsoperformed the measurements using
apertures with other shapes and sizes trying both apertures that have a fixed size and apertures
that expand with the ejecta Supplementary Fig 2 shows the R- and B-band light curves for the
same expanding elliptical aperture as in Fig 2 an expanding circular aperture (with radius equal
to the sma of the elliptical aperture) as well as a large fixedaperture The fixed aperture encloses
most of the ejecta but still avoids direct contamination by the ring (the aperture is shown in Fig 1)
The light curves extracted from the expanding elliptical and circular apertures show very similar
3
behaviour demonstrating that the exact shape of the aperture is not important The light curve from
the large fixed aperture also shows the same behaviour during the firstsim 7000 days but levels off
at late times This is at least partly due to ejecta material expanding out of the fixed aperture The
large aperture is also likely to be significantly affected bycontamination from the circumstellar
ring making it hard to draw firm conclusions regarding the ejecta using this aperture
Contamination from the ring (due to flux from the brighteningring spilling into the ejecta
region) is likely to affect all our light curves at some level In order to quantify this effect we
used the HST point-spread-function modelling tool Tiny Tim28 and created models for the ring
for a number of different epochs in both bands We set up the models to match the observed
distribution of hot spots as closely as possible and to have the same total flux in the ring area as the
observations The modelling is illustrated in Supplementary Fig 3 which shows the real data and
the model for the F675W image from 2009-04-29 and in Supplementary Fig 4 which compares
the radial profiles of the data and the model The corrected light curves derived using these models
are shown as open symbols in Fig 2 and Supplementary Fig 2 The contribution from the ring
increases with time and is larger in the R-band but it does not have a major effect on the light
curves from the expanding apertures For the large fixed aperture the contamination is much more
severe reaching about 50 of the total flux at late times in the R-band
The modelling of the ring is naturally associated with some uncertainties In order to quantify
these uncertainties we performed two different tests First we investigated the effect of varying the
number of points sources used to model the ring Specifically we created models using between
4
8 and 90 point sources distributed along the ring while always keeping the total flux in the ring
area constant The different ring models resulted in fluxes in the ejecta apertures that agreed to
within 15 This demonstrates that the specific model for thering is not very important as long
as the same total flux is distributed in an ellipse around the ejecta The main reason for this is of
course that we are interested in the total flux that leaks intothe ejecta region and not its detailed
distribution
Another test of the models is to compare the flux in the synthetic and real images in regions
located just outside the circumstellar ring We used clean regions (uncontaminated by stars and
other sources of emission) that allow us to measure the flux inthe wings of the point sources
in the ring For the observation from 2009-04-29 we find that the agreement is excellent (the
discrepancy is less than 10) which gives us confidence thatthe models provide a good estimate
of the emission from the ring For earlier epochs it is harderto evaluate the models in this way
since the clean regions outside the ring are completely dominated by the sky background rather
than ring emission For this reason we cannot determine whether our models are equally accurate
at early times We note however that the flux from the ring isnegligible at these times
An additional source of uncertainty is the loss of Charge Transfer Efficiency (CTE) This
effect is known to increase with time and is especially important for faint objects on low back-
grounds located far from the detector readout29 To investigate the importance of CTE losses we
performed aperture photometry on about 10 stars of varying brightness located around SN 1987A
We found that the effect is negligible in the ACS but clearly noticeable in WFPC2 where stars lose
5
at mostsim 10 of their flux between 1994 and 2009 This also agrees with estimates obtained for
the supernova ejecta using the WFPC2 CTE correction formula29 In terms of the light curve in
Fig 2 we note that asim 10 increase in the WFPC2 data points at late times would improvethe
agreement between the ACS and WFPC2
2 Spectroscopy
As a complement to the photometry we investigate HST STIS spectra taken with the G750L grating
in 2004 and 2010 These spectra overlap with the wavelength region covered by the R-filters and
give us an opportunity to study the different spectral components that may contribute to the increase
in flux In both observations a slit with a width of 02primeprime was placed in the north-south direction
centred on the ejecta1630 In 2004 there were also two observations taken with the narrow slit
placed on either side of the central slit To allow for a comparison with the photometry we extracted
spectra in regions that match the size of the expanding elliptical aperture as closely as possible
This means using the central slit only and an extraction height of plusmn024primeprime in 2004 andplusmn031primeprime in
2010
Supplementary Fig 5 shows the Hα profiles from 2004 and 2010 The line profiles are
clearly asymmetric with a strong blue wing extending down tosim minus5 000 km sminus1 and a red wing
that only reaches velocities of aboutsim 2 500 km sminus1 The constant width of the ejecta line profile
shows that the expanding aperture that we used follows the same material over a 6-year span of
6
time From the two-dimensional spectra1630 it is clear that the blue wing mainly comes from the
northern part of the ejecta The lack of a correspondingly strong red wing may be due to dust
absorption in the far side of the ejecta Supplementary Fig5 also shows that the increase in flux
between 2004 and 2010 is mainly due to an increase in the blue wing of the ejecta profile
The Hα emission also contains a small contribution from the reverse shock This component
is clearly visible on the red side of the line as the boxy part of the profile betweensim 3 000 minus
9 000 km sminus1 On the blue side of the line the reverse shock appears at velocities higher than
sim minus9 000 km sminus1 where it is blended with the broad [O I]λλ 6300 6364 lines from the ejecta at
minus12 022 km sminus1 andminus9 096 km sminus1 To estimate the flux from the reverse shock we focus on the
boxy part of the profile on the red side since this is not blended with any other strong lines The
contribution from this component compared to the total flux in the R-band issim 9 minus 10 in both
2004 and 2010 It is clear from inspection of the spectra thatthe reverse shock is not as strong on
the blue side and a very conservative upper limit on the total contribution from the reverse shock is
thereforesim 20 We especially note that there is no significant increase between 2004 and 2010
In Supplementary Fig 5 we also show the spectrum obtained bycombining the three slit
positions from the 2004 observations renormalized to the continuum of the other spectra The
combined spectrum is very similar to that from the central slit albeit with a slightly stronger line
core and red wing The contribution from the reverse shock onthe red side issim 11 ie only
marginally larger than the values given above
The STIS observation from 2010 also allows us to investigatethe emission from the south-
7
ernmost part of the ejecta which is seen outside both the expanding and the fixed aperture at late
times (Fig 1) STIS spectra extracted in this region show a significant contribution from the re-
verse shock but also an asymmetric line profile from the ejecta with a strong blue wing extending
down tosim minus2 000 km sminus1 The fact that we see blueshifted emission from the southernpart of
the ejecta shows that there must be some ejecta material located well above the plane of the ring
The [Ca II] observations in Fig 2 were performed between 2000 and 2009 with the Very
Large Telescope (VLT) at ESO using the UVES instrument Theprimary purpose of these obser-
vations was to follow the evolution of the narrow lines from the ring collision To maximise the
spectral resolution and to minimise contamination from nearby stars a comparatively narrow slit
08 primeprime wide was chosen The seeing was in most cases 06 ndash 08primeprime which is just enough to spatially
resolve the ring into a northern and a southern part The slitwas centred on the position of the
supernova and had a position angle of 30 in all the observations The observations were reduced
with the standard pipeline and the errors on the absolute fluxes were estimated to be less than 20 ndash
30 (ref 5)
3 Modelling of the light curve
At first the energy radiated by a SN comes from the shock wave arriving at the surface of the
exploding star This phase lasted lasted only a few hours in SN 1987A and was followed by a
period of a few weeks where the light curve was powered by the diffusive release of the internal
8
energy produced by the shock wave17 Subsequently the energy for emission was supplied by
the decay of radioactive isotopes created in the explosionDuring the firstsim 1 000 days the
radioactive input was dominated by56Ni decaying into56Co and56Fe From the first two years
of the bolometric light curve the mass of56Ni could be determined to0069 M⊙31 After sim 1 000
days57Ni took over and a mass of3times10minus3 M⊙ was found32ndash34 Finally aftersim 1 600 days the next
most abundant isotope44Ti has been predicted to dominate the energy input to the ejecta While
the bolometric light curve could be accurately determined up tosim 1 000 days the dominance of
the mid-IR which is difficult to determine from observations requires accurate modelling of the
optical bands at later times In addition the hydrogen-rich parts of the ejecta are subject to a freeze-
out34 where recombination and cooling become slow compared to the radioactive decay time-
scales and the expansion time-scales It is therefore necessary to use a time-dependent approach
for the modelling
The modelling of the radioactively powered part of the lightcurves in Fig 3 is based on a
time-dependent spectral code35 36 The code includes calculations of the non-thermal excitation
and ionization by the gamma-rays and positrons from the radioactive decay of56Ni 57Ni and44Ti
as well as a full non-local thermodynamic equilibrium treatment of the most important elements
and lines The present version also includes updated atomicdata in particular more accurate
collision rates for Fe II and other ions The radiative transfer uses the Sobolev approximation
which treats the line escape in individual lines accurately However the non-local scattering from
line to line is not included (except for the Ca II H and K lineswhich feed the [Ca II]λλ72915
73239 lines by fluorescence) This especially affects the UV and blue parts of the spectrum and
9
leads to an underestimate of the flux in the B-band12
An important test is that this model accurately reproduces the Hα evolution up to day 3600
(ref 2) A comparison with the spectrum at 78 years22 shows agreement to within 50 for the
R-band but the model underestimates the flux in the B-band bya factor of 25 To model the shape
of the light curves we therefore renormalize the B-band fluxes by a factor 25 and the R-band by
a factor 15 The total energy input from radioactivity can be estimated tosim 12 times 1036erg sminus1
at 20 years12 In addition to this there is a substantial contribution from delayed recombination
(freeze-out) This comes primarily from the low-density hydrogen envelope and is seen mainly as
Balmer emission The decrease of this component is substantially faster than the44Ti decay and is
responsible for the fast decline seen beforesim 4 000 days (Fig 3)
When translating the broad-band fluxes to luminosities we assume a distance of 50 kpc and a
reddening of EBminusV = 016 mag37 For the comparison with the observations we use the light curve
from the expanding elliptical aperture multiplied by a constant factor for the R- and B-bands The
reason for using this rather than the fixed aperture in Fig 1 is that the latter shows a misleading
flattening at epochs later thansim 7 000 days because of the expansion of part of the ejecta outside
the aperture The constant factors were determined as an average of the ratio of the flux in the fixed
aperture to that of the expanding aperture for epochs earlier than7 000 days The constants are 26
for the R-band and 25 for the B-band There is of course some uncertainty in the correction from
the expanding aperture to the total emitted flux which also affects the44Ti mass
To determine the X-ray input to the ejecta we calculated the photoelectric absorption along
10
different rays in the ejecta from a point source located at the radius of the circumstellar ring For
the abundance and density distributions we used the partially mixed 14E1 explosion model17 This
model is spherically symmetric (although mixed) Unfortunately no 2-D or 3-D simulations exist
with appropriate nucleosynthesis The spherical approximation should however be sufficient for
the qualitative nature of the model Most of the envelope is transparent to X-rays with energies
above about 02 keV as seen in Supplementary Fig 6 which shows the ejecta expansion velocity
for optical depthτ = 1 as a function of photon energy The high metallicity core dominates the
opacity by K- and L-shell absorption by oxygen and other elements and is opaque at all but the
very highest energies
The energy deposition is an angular average of the absorbed intensity over all directions
of the core and envelope shown in Supplementary Fig 7 for four different photon energies
The different deposition curves can be well approximated byC(E) times 10minus3t167yr whereC(E) =
(45 16 07)times 10minus3 for E = 01 035 and 1 keV respectively The general time dependence can
be explained as a balance between the increase of the solid angle of the core as seen from the ring
prop t2 and the increasing transparency of the ejecta as the density decreases
The X-ray luminosity used in this paper is that directly observed by Chandra6 This is likely
to be an underestimate for several reasons The quoted X-rayluminosities only refer to the ob-
served fluxsimgt 05 keV For a shock with a temperature of 035 keV most of the luminosity is
below this energy especially if the shock is radiative as is likely for shocks with velocities be-
low sim 400 km sminus1 (ref 3) In addition the line profiles of the optical emission show that there
11
are shocks of lower velocities most likely tangential shocks38 which radiate mainly below the
observable X-ray band and add to the ionizing flux The typical shock velocity from the optical
lines issim 200 km sminus1 (ref 5) which corresponds to a temperature ofsim 50 eV Because the opacity
increases asEminus3 (WhereE is the photon energy) the absorption efficiency of the ejecta of this low
energy radiation is nearly 100 The absorbed X-rays are therefore more than enough to explain
the observed increase in the optical bands A more accurate estimate of the spectral distribution
would require a detailed numerical calculation of the X-rayabsorption and thermalization which
is beyond the scope of this paper We also remark that both theoptical emission from the ring5 and
the mid-IR8 are strongly correlated with the X-rays
The conversion from X-rays to optical emission takes place first by photoelectric absorption
creating fast non-thermal electrons with energies up to keV These are thermalized by excitation
ionization and heating of the free thermal electrons For hydrogen at the relevant degree of ioniza-
tion 35minus 40 of the secondary electron energy goes into ionization followed by recombination
whilesim 8 goes into direct excitation ofn gt 2 (refs 39 40) At100minus200 K sim 9 of the ioniza-
tion energy andsim 16 of the excitation energy emerges as Hα (ref 41) In total this corresponds
to sim 5 of the X-ray energy Other elements add to this The relativeimportance of excitation
ionization and heating will remain roughly constant as longas the ionization issimlt 10minus2 and we
therefore do not expect conversion efficiency for the two bands to change over time However
once the ionization surpasses this value the fraction going into heating increases at the expense of
the other channels This will increase the far-IR fine structure lines compared to the optical lines
until the temperature is high enough for thermal effects to increase the opticalUV emission35 36
12
4 Effects of dust and positron leakage in the ejecta
There is strong evidence for dust in the ejecta from early observations232442 as well as from
observations discussed in this supplement In principle atransition from optically thick to optically
thin dust could account for an increase in the flux This is however unlikely for several reasons
First it would be a strange coincidence that this would occur at the same time as the X-ray flux
becomes important Secondly compared to the flux from our model with constant covering fraction
(ie optically thick dust clumps) which is given by the dashed line in Fig 3 the increase has to be
a factor ofsim 8 in the R-band andsim 5 in the B-band The estimated covering factor of the dust at
early times wassim 05 (refs 23 24) implying a maximum increase in the flux by a factor of sim 2
Moreover we expect the increase to occur first in the R-band and later in the B-band based on the
higher extinction in the latter band The imaging also indicates dust obscuration in the central part
of the SN up to the latest epochs (Supplementary Fig 1) although this may also be an artefact of
the external X-ray illumination as discussed in the main paper
Finally positron leakage from the Fe-rich material containing the44Ti may enhance the emis-
sion from the O- and H-rich zones in the core12 This depends sensitively on the strength of a
magnetic field in the ejecta which is uncertain The main effect of positron leakage is that the hy-
drogen and intermediate element lines would increase at theexpense of the Fe I-II lines At most
this may enhance the emission in the observed bands by a factor of sim 2 compared to the complete
trapping case As discussed above this is far from sufficient to explain the observed increase in
the R- and B-bands
13
5 Supplementary Figures
Supplementary Figure 1 Selection of HST images of SN 1987AThe images show the evolution
of the ejecta and the circumstellar ring as a function of time The top row shows the R-band and the
bottom row shows the B-band The observing dates are 1994-09-24 (a ande) 1999-04-21 (b and
f) 2003-11-28 (c andg) and 2009-04-09 (d andh) which correspond to 2770 4440 6122 and
8101 days after the explosion respectively Note the expansion of the ejecta and the brightening
hot spots in the circumstellar ring
14
3000 4000 5000 6000 7000 8000
Time after explosion (days)
0
2
4
6
8
10
12
14
Flux(10
14ergcm
2s
1)
a
3000 4000 5000 6000 7000 8000
Time after explosion (days)
0
2
4
6
8
10
Flux(10
14ergcm
2s
1)
b
Supplementary Figure 2 Comparison of ejecta light curves for different apertures Panela shows
the R-band and panelb shows the B-band (note the different scales on the y-axes) Data points from
WFPC2 ACS and WFC3 are shown as dots triangles and stars respectively A correction factor
has been applied to the ACS and WFC3 fluxes in order to account for the differences between these
instruments and WFPC2 The red and blue data points correspond to the same expanding elliptical
aperture as in Fig 2 shown here for reference Green data points are for a fixed aperture that
encloses as much of the ejecta as possible (sma= 050primeprime see also Fig 1) while black data points
are for an expanding circular aperture with radius equal to the semi-major axis of the expanding
elliptical aperture Open symbols indicate approximate flux levels after accounting for emission
from the circumstellar ring The light curve from the fixed aperture clearly levels off at late times
This is at least partly due to ejecta material expanding out of the aperture but other effects may
also contribute
15
a b
Supplementary Figure 3 Example of the modelling of the ring a The HSTWFPC2 F675W
image from 2009-04-29 This is the same image as in Supplementary Fig 1d but the image levels
have been adjusted to show the structure of the ring more clearly As a result the ejecta appear very
faint b The model for the hot spots in the ring for the same epoch
16
00 02 04 06 08 10
Semimajor axis (arc seconds)
15
10
05
00
05
10
15
20
Log
(cou
nts
inellip
tica
lannulus)
Supplementary Figure 4 Comparison of the radial brightness profiles of the real data and the
model The profiles were produced for the 2009-04-29 WFPC2F675W observation (Supplemen-
tary Fig 3) with the real data shown in black and the model inred Specifically the lines show the
counts inside elliptical annuli aligned with the circumstellar ring as a function of the sma of the
annulus The model clearly agrees well with the real data in the ring area (between about 06ndash10primeprime)
and should therefore give us a good estimate of the amount of flux from the ring that leaks into the
ejecta region
17
20 15 10 5 0 5 10 15 20
Velocity (103 km s1 )
00
05
10
15
20
25
30
Flux(10
16ergcm
2s
1
A
1)
Supplementary Figure 5 STIS Hα profiles of the ejecta The red and black lines are for a 02primeprime slit
placed in the north-south direction and centred on the ejecta in 2004 and 2010 respectively The
dashed blue line is the combined spectrum from three 02primeprime slits placed next to each other in 2004
renormalized to match the continuum level of the other spectra The spectral extraction regions
were chosen to correspond as closely as possible to the size of the expanding elliptical aperture
used for the flux measurements in Fig 2 The boxy part of the line profile between3 000 and
9 000 km sminus1 is due to the reverse shock There is also a contribution fromthe reverse shock on
the blue side but this is harder to disentangle because of blending with the [O I]λλ 6300 6364
lines atminus12 022 km sminus1 andminus9 096 km sminus1
18
10 15 20 25 30 35 40
Log (energy) (eV)
0
2
4
6
8
10
12
14
Veloc
ityat
=1(103 km
s
1)
10 yrs
20 yrs
30 yrs
Supplementary Figure 6 Ejecta velocity corresponding to optical depthτ = 1 The optical depth
is measured from the ring as a function of energy at 10 20 and 30 years after the explosion The
maximum velocity for each of these curves is given by the ejecta velocity in the plane of the ring
which is 21 times 104(t10 yrs)minus1 km sminus1 Note the relatively small change in velocity with time
of τ(E) = 1 for energiessimgt 02 keV The FWHM of the line profiles are therefore expected to
decrease relatively slowly with time as long as most of the shock energy is emitted above this
energy Note also that at 30 years the full ejecta will be transparent atsimgt 6 keV
19
5 10 15 20 25 30
Time since explosion (years)
00
02
04
06
08
10
Fractionab
sorbed
01 keV
035 keV
10 keV
20 keV
Supplementary Figure 7 Fraction of the X-ray flux absorbed by the supernova ejecta as a function
of time The different lines correspond to different photonenergies as indicated in the figure The
main reason for the evolution is the increasing solid angle of the core as seen from the ring (prop t2)
damped by the increasing transparency at higher energy
20
6 Supplementary Table
Date Instrument Filter Exposure time Instrument Filter Exposure time(s) (s)
1994-09-24 WFPC2 F675W 600 WFPC2 F439W 8001995-03-05 WFPC2 F675W 600 WFPC2 F439W 8001996-02-06 WFPC2 F675W 600 WFPC2 F439W 9501997-07-10 WFPC2 F675W 600 WFPC2 F439W 8001998-02-06 WFPC2 F675W 400 WFPC2 F439W 5001999-01-07 WFPC2 F675W 1220 WFPC2 F439W 10391999-04-21 WFPC2 F675W 400 WFPC2 F439W 8002000-02-02 WFPC2 F675W 400 WFPC2 F439W 4602000-06-16 WFPC2 F675W 400 WFPC2 F439W 8002000-11-13 WFPC2 F675W 2400 WFPC2 F439W 12002001-03-23 WFPC2 F675W 500 WFPC2 F439W 10002001-12-07 WFPC2 F675W 800 WFPC2 F439W 16002003-01-05 ACS F625W 800 ACS F435W 12002003-08-12 ACS F625W 480 ACS F435W 8002003-11-28 ACS F625W 800 ACS F435W 16002004-12-15 ACS F435W 16002005-04-02 ACS F435W 12002005-09-26 ACS F625W 120002005-09-28 ACS F625W 7202006-04-15 ACS F625W 1200 ACS F435W 12002006-04-29 ACS F625W 7202006-12-06 ACS F625W 1200 ACS F435W 18002007-05-12 WFPC2 F675W 2700 WFPC2 F439W 30002008-02-19 WFPC2 F675W 1600 WFPC2 F439W 24002009-04-29 WFPC2 F675W 1600 WFPC2 F439W 20002009-12-12 WFC3 F625W 3000 WFC3 F438W 800
Supplementary Table 1HST observations used for the analysis
21
References
[25] Wang Let al Hubble Space Telescope Spectroscopic Observations of the Ejecta of SN
1987A at 2000 DaysAstrophys J 466 998ndash1010 (1996)
[26] Tziamtzis A Lundqvist P Groningsson P amp Nasoudi-Shoar S The outer rings of SN
1987A Astron Astrophys 527 A35ndashA48 (2011)
[27] Wang Let al The Axisymmetric Ejecta of Supernova 1987AAstrophys J 579 671ndash677
(2002)
[28] Tiny Tim HST PSF Modeling httpwwwstscieduhstobservatoryfocusTinyTim (2011)
[29] Dolphin A E A Revised Characterization of the WFPC2 CTE Loss PASP 121 655ndash667
(2009)
[30] Heng K amp McCray R Balmer-dominated Shocks Revisited Astrophys J 654 923ndash937
(2007)
[31] Bouchet Pet al The Bolometric Lightcurve of Supernova 1987A - Part Two - Results from
Visible and Infrared SpectrophotometryAstron Astrophys 245 490ndash498 (1991)
[32] Kurfess J Det al Oriented Scintillation Spectrometer Experiment observations of Co-57
in SN 1987AAstrophys J 399 L137ndashL140 (1992)
[33] Varani G F Meikle W P S Spyromilio J amp Allen D A Direct Observation of Radioac-
tive Cobalt Decay in Supernova 1987AMon Not R Astron Soc 245 570ndash576 (1990)
22
[34] Fransson C amp Kozma C The freeze-out phase of SN 1987A- Implications for the light
curveAstrophys J 408 L25ndashL28 (1993)
[35] Kozma C amp Fransson C Late Spectral Evolution of SN 1987A I Temperature and Ioniza-
tion Astrophys J 496 946ndash966 (1998)
[36] Kozma C amp Fransson C Late Spectral Evolution of SN 1987A II Line EmissionAstro-
phys J 497 431ndash457 (1998)
[37] Fitzpatrick E L amp Walborn N R Observations of Sk-69 deg 203 and the interstellar
extinction towards SN 1987AAstron J 99 1483ndash1487 (1990)
[38] Pun C S Jet al Modeling the Hubble Space Telescope Ultraviolet and Optical Spectrum
of Spot 1 on the Circumstellar Ring of SN 1987AAstrophys J 572 906ndash931 (2002)
[39] Xu Y amp McCray R Energy degradation of fast electronsin hydrogen gasAstrophys J
375 190ndash201 (1991)
[40] Kozma C amp Fransson C Gamma-ray deposition and nonthermal excitation in supernovae
Astrophys J 390 602ndash621 (1992)
[41] Martin P G Hydrogenic radiative recombination at low temperature and densityAstro-
phys J Supp 66 125ndash138 (1988)
[42] Moseley S H Dwek E Glaccum W Graham J R amp Loewenstein R F Far-infrared
observations of thermal dust emission from supernova 1987A Nature 340 697ndash699 (1989)
23
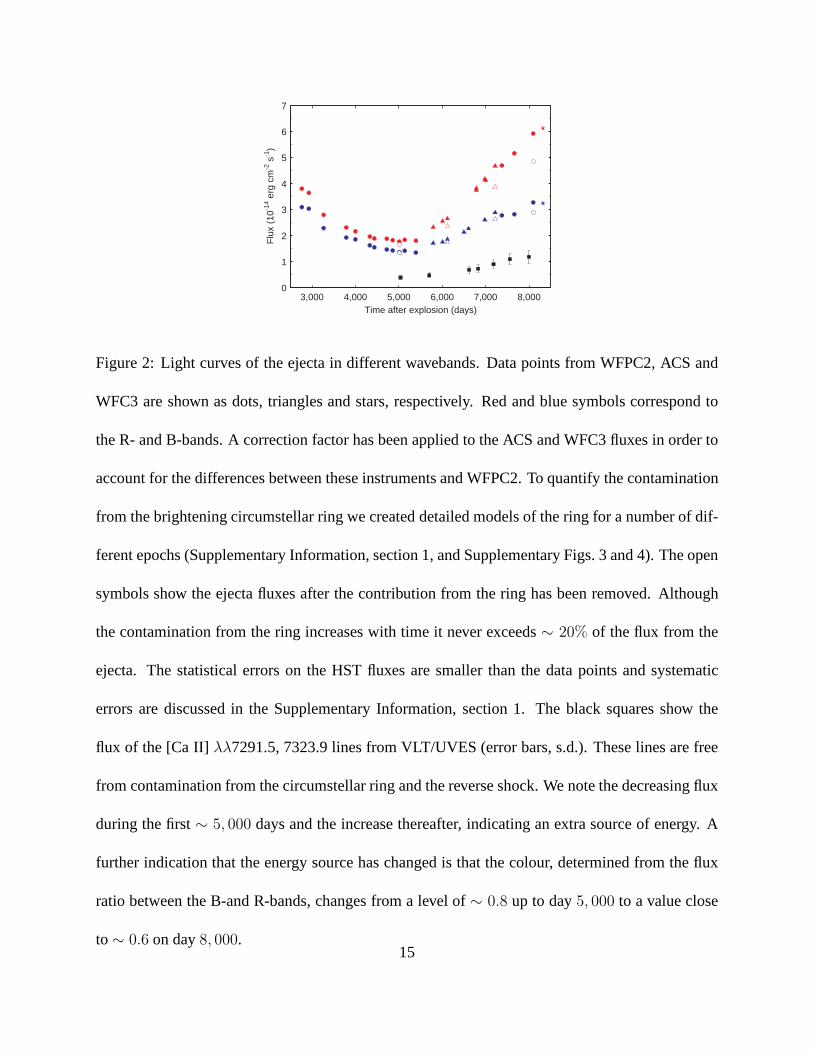

4000 6000 80000
1
2
3
4
5
6
7
Ban
d lu
min
osity
(10
34 e
rg s
-1)
R
a
4000 6000 80000
1
2
3
4
5
6
7
B
b
Time after explosion (days)
Figure 3 Evolution of the luminosity from the ejecta in the R- and B-bands The dashed black
lines show a model with only radioactive input mainly from44Ti The 44Ti mass used for the
model is14times 10minus4 M⊙12 as determined from a detailed model that takes into accountthe effects
of scattering and fluorescence of the UV flux as well as a correction for internal dust (here taken
to have a 50 covering factor of the core inside 2000 km sminus1)23 24 The lower dot-dashed lines
show the light curves with no44Ti illustrating the necessity to include this isotope Thered dashed
lines show a model based on a constant fraction of the observed X-ray flux6 corrected for the
fraction of flux absorbed by the ejecta (Supplementary Fig 7) The blue solid line shows the sum
of both models The R- and B-bands contain 5 and 3 of the total bolometric flux respectively
and we expect these fractions to remain roughly constant with time This is because the relative
amount of energy resulting in heating ionization and excitation will remain nearly constant as long
as the ionization by the X-rays issimlt 10minus2 It is clear from this figure that there is a transition at
sim 5 000 days from a radioactivity dominated phase to a phase dominated by the X-ray input from
the collision with the ring
16
arX
iv1
106
2300
v1 [
astr
o-ph
SR
] 12
Jun
201
1
Supplementary information
1 Photometry
Our analysis includes all HST imaging observations performed between 1994 and 2009 in the the
red (WFPC2F675W ACSF625W and WFC3F675W) and blue (WFPC2F439W ACSF435W
and WFC3F438W) broad-band filters (the two groups of filterswill be referred to as the R- and
B-bands from here on) The images were drizzled to combine dithered exposures and to remove
cosmic rays Details of the observations are given in Supplementary Table 1 and a selection of
images are shown in Supplementary Fig 1 The images show theexpansion of the asymmetric
ejecta and the brightening hot spots in the circumstellar ring
We measured the brightness of the ejecta as a function of timeusing the IRAFSTSDAS
task ELLIPSE using different elliptical and circular apertures described below The measure-
ments give mean flux densities which we convert into total fluxes by multiplying with the rect-
angular bandwidth of the different filters When convertingto total fluxes we also correct for
the fact that there are some differences between the filters used for the three instruments To
determine the corrections we used the HST FOS spectrum from 199722 (this covers the entire
spectral range probed by all the filters) and used the SYNPHOTpackage to calculate flux den-
sities in the different filters After converting to total fluxes we obtain the following flux ra-
tios (ACSF625W) (WFPC2F675W)= 108 (WFC3F625W) (WFPC2F675W)= 116
1
(ACSF435W) (WFPC2F439W)= 127 and (WFC3F438W) (WFPC2F439W)= 106 In
all the light curves that we show we have corrected the ACS andWFC3 fluxes in accordance with
this A small offset still remains (see eg Fig 2) which may be due to charge transfer efficiency
losses in WFPC2 (see discussion below) Changes in the spectral energy distribution (SED) would
also have some effect on the conversion factors although wenote that observations2225 suggest
that the SED does not vary significantly with time
For each of the observations we also determined the sky brightness using the IRAFFITSKY
routine Specifically we determined the centroid sky valuein five empty regions located around
SN 1987A and then used the average of these measurements to subtract the sky background from
the light curve The background is typically only a few per cent of the intrinsic ejecta brightness
We also considered the possibility of contamination from the two bright stars that are located to
the north-east and south-west of SN 1987A These stars have strong diffraction spikes from the
secondary-mirror spiders which may pass through the ejecta depending on the HST roll angle We
inspected all the images and found that there is only one observation (2006-04-15) where there
is a strong spike passing through our apertures We estimated the contribution from this spike
by measuring the brightness of the other spikes from the samestar and corrected the light curves
accordingly Another source of contamination is one of the narrow outer rings of SN 1987A which
is partly projected on top of the ejecta However the smalldecreasing flux26 of this component is
negligible compared to the emission from the ejecta
The shape of the ejecta is roughly elliptical so as a first stepwe used an elliptical aperture
2
to measure the evolution of the flux The shape of the ellipse was determined by fitting elliptical
isophotes to the ejecta region in the observation from 2000-11-13 This epoch was chosen because
it is long enough after the explosion that the ejecta shape isclearly discernible while still early
enough for the edge of the inner ejecta to be clearly separated from the circumstellar ring The fits
were performed using the IRAFSTSDAS task ELLIPSE Settingthe semi-major axis (sma) to02primeprime
(the size used for the light curve in Fig 2 for this epoch) we find a position angle of174 plusmn 01
and an eccentricity of0684plusmn0002 This can be compared with previous measurements with HST
(PA= 14 plusmn 5)27 and VLTSINFONI (PA= 15 plusmn 09 e = 083 from the1644 microm Si IFe II
feature)21 The agreement with the position angle is clearly good and given that the SINFONI
measurements probe the SiFe core and the R-band is dominated by the H-rich gas the agreement
with the eccentricity is also reasonable As described in the main paper the light curves presented
in Fig 2 were derived using this elliptical aperture The size of the aperture was expanded as a
function of time in order to always follow the same ejecta material
In order to make sure that the transition from a decaying to a rising flux seen in Fig 2 is
not connected to the use of this particular aperture we alsoperformed the measurements using
apertures with other shapes and sizes trying both apertures that have a fixed size and apertures
that expand with the ejecta Supplementary Fig 2 shows the R- and B-band light curves for the
same expanding elliptical aperture as in Fig 2 an expanding circular aperture (with radius equal
to the sma of the elliptical aperture) as well as a large fixedaperture The fixed aperture encloses
most of the ejecta but still avoids direct contamination by the ring (the aperture is shown in Fig 1)
The light curves extracted from the expanding elliptical and circular apertures show very similar
3
behaviour demonstrating that the exact shape of the aperture is not important The light curve from
the large fixed aperture also shows the same behaviour during the firstsim 7000 days but levels off
at late times This is at least partly due to ejecta material expanding out of the fixed aperture The
large aperture is also likely to be significantly affected bycontamination from the circumstellar
ring making it hard to draw firm conclusions regarding the ejecta using this aperture
Contamination from the ring (due to flux from the brighteningring spilling into the ejecta
region) is likely to affect all our light curves at some level In order to quantify this effect we
used the HST point-spread-function modelling tool Tiny Tim28 and created models for the ring
for a number of different epochs in both bands We set up the models to match the observed
distribution of hot spots as closely as possible and to have the same total flux in the ring area as the
observations The modelling is illustrated in Supplementary Fig 3 which shows the real data and
the model for the F675W image from 2009-04-29 and in Supplementary Fig 4 which compares
the radial profiles of the data and the model The corrected light curves derived using these models
are shown as open symbols in Fig 2 and Supplementary Fig 2 The contribution from the ring
increases with time and is larger in the R-band but it does not have a major effect on the light
curves from the expanding apertures For the large fixed aperture the contamination is much more
severe reaching about 50 of the total flux at late times in the R-band
The modelling of the ring is naturally associated with some uncertainties In order to quantify
these uncertainties we performed two different tests First we investigated the effect of varying the
number of points sources used to model the ring Specifically we created models using between
4
8 and 90 point sources distributed along the ring while always keeping the total flux in the ring
area constant The different ring models resulted in fluxes in the ejecta apertures that agreed to
within 15 This demonstrates that the specific model for thering is not very important as long
as the same total flux is distributed in an ellipse around the ejecta The main reason for this is of
course that we are interested in the total flux that leaks intothe ejecta region and not its detailed
distribution
Another test of the models is to compare the flux in the synthetic and real images in regions
located just outside the circumstellar ring We used clean regions (uncontaminated by stars and
other sources of emission) that allow us to measure the flux inthe wings of the point sources
in the ring For the observation from 2009-04-29 we find that the agreement is excellent (the
discrepancy is less than 10) which gives us confidence thatthe models provide a good estimate
of the emission from the ring For earlier epochs it is harderto evaluate the models in this way
since the clean regions outside the ring are completely dominated by the sky background rather
than ring emission For this reason we cannot determine whether our models are equally accurate
at early times We note however that the flux from the ring isnegligible at these times
An additional source of uncertainty is the loss of Charge Transfer Efficiency (CTE) This
effect is known to increase with time and is especially important for faint objects on low back-
grounds located far from the detector readout29 To investigate the importance of CTE losses we
performed aperture photometry on about 10 stars of varying brightness located around SN 1987A
We found that the effect is negligible in the ACS but clearly noticeable in WFPC2 where stars lose
5
at mostsim 10 of their flux between 1994 and 2009 This also agrees with estimates obtained for
the supernova ejecta using the WFPC2 CTE correction formula29 In terms of the light curve in
Fig 2 we note that asim 10 increase in the WFPC2 data points at late times would improvethe
agreement between the ACS and WFPC2
2 Spectroscopy
As a complement to the photometry we investigate HST STIS spectra taken with the G750L grating
in 2004 and 2010 These spectra overlap with the wavelength region covered by the R-filters and
give us an opportunity to study the different spectral components that may contribute to the increase
in flux In both observations a slit with a width of 02primeprime was placed in the north-south direction
centred on the ejecta1630 In 2004 there were also two observations taken with the narrow slit
placed on either side of the central slit To allow for a comparison with the photometry we extracted
spectra in regions that match the size of the expanding elliptical aperture as closely as possible
This means using the central slit only and an extraction height of plusmn024primeprime in 2004 andplusmn031primeprime in
2010
Supplementary Fig 5 shows the Hα profiles from 2004 and 2010 The line profiles are
clearly asymmetric with a strong blue wing extending down tosim minus5 000 km sminus1 and a red wing
that only reaches velocities of aboutsim 2 500 km sminus1 The constant width of the ejecta line profile
shows that the expanding aperture that we used follows the same material over a 6-year span of
6
time From the two-dimensional spectra1630 it is clear that the blue wing mainly comes from the
northern part of the ejecta The lack of a correspondingly strong red wing may be due to dust
absorption in the far side of the ejecta Supplementary Fig5 also shows that the increase in flux
between 2004 and 2010 is mainly due to an increase in the blue wing of the ejecta profile
The Hα emission also contains a small contribution from the reverse shock This component
is clearly visible on the red side of the line as the boxy part of the profile betweensim 3 000 minus
9 000 km sminus1 On the blue side of the line the reverse shock appears at velocities higher than
sim minus9 000 km sminus1 where it is blended with the broad [O I]λλ 6300 6364 lines from the ejecta at
minus12 022 km sminus1 andminus9 096 km sminus1 To estimate the flux from the reverse shock we focus on the
boxy part of the profile on the red side since this is not blended with any other strong lines The
contribution from this component compared to the total flux in the R-band issim 9 minus 10 in both
2004 and 2010 It is clear from inspection of the spectra thatthe reverse shock is not as strong on
the blue side and a very conservative upper limit on the total contribution from the reverse shock is
thereforesim 20 We especially note that there is no significant increase between 2004 and 2010
In Supplementary Fig 5 we also show the spectrum obtained bycombining the three slit
positions from the 2004 observations renormalized to the continuum of the other spectra The
combined spectrum is very similar to that from the central slit albeit with a slightly stronger line
core and red wing The contribution from the reverse shock onthe red side issim 11 ie only
marginally larger than the values given above
The STIS observation from 2010 also allows us to investigatethe emission from the south-
7
ernmost part of the ejecta which is seen outside both the expanding and the fixed aperture at late
times (Fig 1) STIS spectra extracted in this region show a significant contribution from the re-
verse shock but also an asymmetric line profile from the ejecta with a strong blue wing extending
down tosim minus2 000 km sminus1 The fact that we see blueshifted emission from the southernpart of
the ejecta shows that there must be some ejecta material located well above the plane of the ring
The [Ca II] observations in Fig 2 were performed between 2000 and 2009 with the Very
Large Telescope (VLT) at ESO using the UVES instrument Theprimary purpose of these obser-
vations was to follow the evolution of the narrow lines from the ring collision To maximise the
spectral resolution and to minimise contamination from nearby stars a comparatively narrow slit
08 primeprime wide was chosen The seeing was in most cases 06 ndash 08primeprime which is just enough to spatially
resolve the ring into a northern and a southern part The slitwas centred on the position of the
supernova and had a position angle of 30 in all the observations The observations were reduced
with the standard pipeline and the errors on the absolute fluxes were estimated to be less than 20 ndash
30 (ref 5)
3 Modelling of the light curve
At first the energy radiated by a SN comes from the shock wave arriving at the surface of the
exploding star This phase lasted lasted only a few hours in SN 1987A and was followed by a
period of a few weeks where the light curve was powered by the diffusive release of the internal
8
energy produced by the shock wave17 Subsequently the energy for emission was supplied by
the decay of radioactive isotopes created in the explosionDuring the firstsim 1 000 days the
radioactive input was dominated by56Ni decaying into56Co and56Fe From the first two years
of the bolometric light curve the mass of56Ni could be determined to0069 M⊙31 After sim 1 000
days57Ni took over and a mass of3times10minus3 M⊙ was found32ndash34 Finally aftersim 1 600 days the next
most abundant isotope44Ti has been predicted to dominate the energy input to the ejecta While
the bolometric light curve could be accurately determined up tosim 1 000 days the dominance of
the mid-IR which is difficult to determine from observations requires accurate modelling of the
optical bands at later times In addition the hydrogen-rich parts of the ejecta are subject to a freeze-
out34 where recombination and cooling become slow compared to the radioactive decay time-
scales and the expansion time-scales It is therefore necessary to use a time-dependent approach
for the modelling
The modelling of the radioactively powered part of the lightcurves in Fig 3 is based on a
time-dependent spectral code35 36 The code includes calculations of the non-thermal excitation
and ionization by the gamma-rays and positrons from the radioactive decay of56Ni 57Ni and44Ti
as well as a full non-local thermodynamic equilibrium treatment of the most important elements
and lines The present version also includes updated atomicdata in particular more accurate
collision rates for Fe II and other ions The radiative transfer uses the Sobolev approximation
which treats the line escape in individual lines accurately However the non-local scattering from
line to line is not included (except for the Ca II H and K lineswhich feed the [Ca II]λλ72915
73239 lines by fluorescence) This especially affects the UV and blue parts of the spectrum and
9
leads to an underestimate of the flux in the B-band12
An important test is that this model accurately reproduces the Hα evolution up to day 3600
(ref 2) A comparison with the spectrum at 78 years22 shows agreement to within 50 for the
R-band but the model underestimates the flux in the B-band bya factor of 25 To model the shape
of the light curves we therefore renormalize the B-band fluxes by a factor 25 and the R-band by
a factor 15 The total energy input from radioactivity can be estimated tosim 12 times 1036erg sminus1
at 20 years12 In addition to this there is a substantial contribution from delayed recombination
(freeze-out) This comes primarily from the low-density hydrogen envelope and is seen mainly as
Balmer emission The decrease of this component is substantially faster than the44Ti decay and is
responsible for the fast decline seen beforesim 4 000 days (Fig 3)
When translating the broad-band fluxes to luminosities we assume a distance of 50 kpc and a
reddening of EBminusV = 016 mag37 For the comparison with the observations we use the light curve
from the expanding elliptical aperture multiplied by a constant factor for the R- and B-bands The
reason for using this rather than the fixed aperture in Fig 1 is that the latter shows a misleading
flattening at epochs later thansim 7 000 days because of the expansion of part of the ejecta outside
the aperture The constant factors were determined as an average of the ratio of the flux in the fixed
aperture to that of the expanding aperture for epochs earlier than7 000 days The constants are 26
for the R-band and 25 for the B-band There is of course some uncertainty in the correction from
the expanding aperture to the total emitted flux which also affects the44Ti mass
To determine the X-ray input to the ejecta we calculated the photoelectric absorption along
10
different rays in the ejecta from a point source located at the radius of the circumstellar ring For
the abundance and density distributions we used the partially mixed 14E1 explosion model17 This
model is spherically symmetric (although mixed) Unfortunately no 2-D or 3-D simulations exist
with appropriate nucleosynthesis The spherical approximation should however be sufficient for
the qualitative nature of the model Most of the envelope is transparent to X-rays with energies
above about 02 keV as seen in Supplementary Fig 6 which shows the ejecta expansion velocity
for optical depthτ = 1 as a function of photon energy The high metallicity core dominates the
opacity by K- and L-shell absorption by oxygen and other elements and is opaque at all but the
very highest energies
The energy deposition is an angular average of the absorbed intensity over all directions
of the core and envelope shown in Supplementary Fig 7 for four different photon energies
The different deposition curves can be well approximated byC(E) times 10minus3t167yr whereC(E) =
(45 16 07)times 10minus3 for E = 01 035 and 1 keV respectively The general time dependence can
be explained as a balance between the increase of the solid angle of the core as seen from the ring
prop t2 and the increasing transparency of the ejecta as the density decreases
The X-ray luminosity used in this paper is that directly observed by Chandra6 This is likely
to be an underestimate for several reasons The quoted X-rayluminosities only refer to the ob-
served fluxsimgt 05 keV For a shock with a temperature of 035 keV most of the luminosity is
below this energy especially if the shock is radiative as is likely for shocks with velocities be-
low sim 400 km sminus1 (ref 3) In addition the line profiles of the optical emission show that there
11
are shocks of lower velocities most likely tangential shocks38 which radiate mainly below the
observable X-ray band and add to the ionizing flux The typical shock velocity from the optical
lines issim 200 km sminus1 (ref 5) which corresponds to a temperature ofsim 50 eV Because the opacity
increases asEminus3 (WhereE is the photon energy) the absorption efficiency of the ejecta of this low
energy radiation is nearly 100 The absorbed X-rays are therefore more than enough to explain
the observed increase in the optical bands A more accurate estimate of the spectral distribution
would require a detailed numerical calculation of the X-rayabsorption and thermalization which
is beyond the scope of this paper We also remark that both theoptical emission from the ring5 and
the mid-IR8 are strongly correlated with the X-rays
The conversion from X-rays to optical emission takes place first by photoelectric absorption
creating fast non-thermal electrons with energies up to keV These are thermalized by excitation
ionization and heating of the free thermal electrons For hydrogen at the relevant degree of ioniza-
tion 35minus 40 of the secondary electron energy goes into ionization followed by recombination
whilesim 8 goes into direct excitation ofn gt 2 (refs 39 40) At100minus200 K sim 9 of the ioniza-
tion energy andsim 16 of the excitation energy emerges as Hα (ref 41) In total this corresponds
to sim 5 of the X-ray energy Other elements add to this The relativeimportance of excitation
ionization and heating will remain roughly constant as longas the ionization issimlt 10minus2 and we
therefore do not expect conversion efficiency for the two bands to change over time However
once the ionization surpasses this value the fraction going into heating increases at the expense of
the other channels This will increase the far-IR fine structure lines compared to the optical lines
until the temperature is high enough for thermal effects to increase the opticalUV emission35 36
12
4 Effects of dust and positron leakage in the ejecta
There is strong evidence for dust in the ejecta from early observations232442 as well as from
observations discussed in this supplement In principle atransition from optically thick to optically
thin dust could account for an increase in the flux This is however unlikely for several reasons
First it would be a strange coincidence that this would occur at the same time as the X-ray flux
becomes important Secondly compared to the flux from our model with constant covering fraction
(ie optically thick dust clumps) which is given by the dashed line in Fig 3 the increase has to be
a factor ofsim 8 in the R-band andsim 5 in the B-band The estimated covering factor of the dust at
early times wassim 05 (refs 23 24) implying a maximum increase in the flux by a factor of sim 2
Moreover we expect the increase to occur first in the R-band and later in the B-band based on the
higher extinction in the latter band The imaging also indicates dust obscuration in the central part
of the SN up to the latest epochs (Supplementary Fig 1) although this may also be an artefact of
the external X-ray illumination as discussed in the main paper
Finally positron leakage from the Fe-rich material containing the44Ti may enhance the emis-
sion from the O- and H-rich zones in the core12 This depends sensitively on the strength of a
magnetic field in the ejecta which is uncertain The main effect of positron leakage is that the hy-
drogen and intermediate element lines would increase at theexpense of the Fe I-II lines At most
this may enhance the emission in the observed bands by a factor of sim 2 compared to the complete
trapping case As discussed above this is far from sufficient to explain the observed increase in
the R- and B-bands
13
5 Supplementary Figures
Supplementary Figure 1 Selection of HST images of SN 1987AThe images show the evolution
of the ejecta and the circumstellar ring as a function of time The top row shows the R-band and the
bottom row shows the B-band The observing dates are 1994-09-24 (a ande) 1999-04-21 (b and
f) 2003-11-28 (c andg) and 2009-04-09 (d andh) which correspond to 2770 4440 6122 and
8101 days after the explosion respectively Note the expansion of the ejecta and the brightening
hot spots in the circumstellar ring
14
3000 4000 5000 6000 7000 8000
Time after explosion (days)
0
2
4
6
8
10
12
14
Flux(10
14ergcm
2s
1)
a
3000 4000 5000 6000 7000 8000
Time after explosion (days)
0
2
4
6
8
10
Flux(10
14ergcm
2s
1)
b
Supplementary Figure 2 Comparison of ejecta light curves for different apertures Panela shows
the R-band and panelb shows the B-band (note the different scales on the y-axes) Data points from
WFPC2 ACS and WFC3 are shown as dots triangles and stars respectively A correction factor
has been applied to the ACS and WFC3 fluxes in order to account for the differences between these
instruments and WFPC2 The red and blue data points correspond to the same expanding elliptical
aperture as in Fig 2 shown here for reference Green data points are for a fixed aperture that
encloses as much of the ejecta as possible (sma= 050primeprime see also Fig 1) while black data points
are for an expanding circular aperture with radius equal to the semi-major axis of the expanding
elliptical aperture Open symbols indicate approximate flux levels after accounting for emission
from the circumstellar ring The light curve from the fixed aperture clearly levels off at late times
This is at least partly due to ejecta material expanding out of the aperture but other effects may
also contribute
15
a b
Supplementary Figure 3 Example of the modelling of the ring a The HSTWFPC2 F675W
image from 2009-04-29 This is the same image as in Supplementary Fig 1d but the image levels
have been adjusted to show the structure of the ring more clearly As a result the ejecta appear very
faint b The model for the hot spots in the ring for the same epoch
16
00 02 04 06 08 10
Semimajor axis (arc seconds)
15
10
05
00
05
10
15
20
Log
(cou
nts
inellip
tica
lannulus)
Supplementary Figure 4 Comparison of the radial brightness profiles of the real data and the
model The profiles were produced for the 2009-04-29 WFPC2F675W observation (Supplemen-
tary Fig 3) with the real data shown in black and the model inred Specifically the lines show the
counts inside elliptical annuli aligned with the circumstellar ring as a function of the sma of the
annulus The model clearly agrees well with the real data in the ring area (between about 06ndash10primeprime)
and should therefore give us a good estimate of the amount of flux from the ring that leaks into the
ejecta region
17
20 15 10 5 0 5 10 15 20
Velocity (103 km s1 )
00
05
10
15
20
25
30
Flux(10
16ergcm
2s
1
A
1)
Supplementary Figure 5 STIS Hα profiles of the ejecta The red and black lines are for a 02primeprime slit
placed in the north-south direction and centred on the ejecta in 2004 and 2010 respectively The
dashed blue line is the combined spectrum from three 02primeprime slits placed next to each other in 2004
renormalized to match the continuum level of the other spectra The spectral extraction regions
were chosen to correspond as closely as possible to the size of the expanding elliptical aperture
used for the flux measurements in Fig 2 The boxy part of the line profile between3 000 and
9 000 km sminus1 is due to the reverse shock There is also a contribution fromthe reverse shock on
the blue side but this is harder to disentangle because of blending with the [O I]λλ 6300 6364
lines atminus12 022 km sminus1 andminus9 096 km sminus1
18
10 15 20 25 30 35 40
Log (energy) (eV)
0
2
4
6
8
10
12
14
Veloc
ityat
=1(103 km
s
1)
10 yrs
20 yrs
30 yrs
Supplementary Figure 6 Ejecta velocity corresponding to optical depthτ = 1 The optical depth
is measured from the ring as a function of energy at 10 20 and 30 years after the explosion The
maximum velocity for each of these curves is given by the ejecta velocity in the plane of the ring
which is 21 times 104(t10 yrs)minus1 km sminus1 Note the relatively small change in velocity with time
of τ(E) = 1 for energiessimgt 02 keV The FWHM of the line profiles are therefore expected to
decrease relatively slowly with time as long as most of the shock energy is emitted above this
energy Note also that at 30 years the full ejecta will be transparent atsimgt 6 keV
19
5 10 15 20 25 30
Time since explosion (years)
00
02
04
06
08
10
Fractionab
sorbed
01 keV
035 keV
10 keV
20 keV
Supplementary Figure 7 Fraction of the X-ray flux absorbed by the supernova ejecta as a function
of time The different lines correspond to different photonenergies as indicated in the figure The
main reason for the evolution is the increasing solid angle of the core as seen from the ring (prop t2)
damped by the increasing transparency at higher energy
20
6 Supplementary Table
Date Instrument Filter Exposure time Instrument Filter Exposure time(s) (s)
1994-09-24 WFPC2 F675W 600 WFPC2 F439W 8001995-03-05 WFPC2 F675W 600 WFPC2 F439W 8001996-02-06 WFPC2 F675W 600 WFPC2 F439W 9501997-07-10 WFPC2 F675W 600 WFPC2 F439W 8001998-02-06 WFPC2 F675W 400 WFPC2 F439W 5001999-01-07 WFPC2 F675W 1220 WFPC2 F439W 10391999-04-21 WFPC2 F675W 400 WFPC2 F439W 8002000-02-02 WFPC2 F675W 400 WFPC2 F439W 4602000-06-16 WFPC2 F675W 400 WFPC2 F439W 8002000-11-13 WFPC2 F675W 2400 WFPC2 F439W 12002001-03-23 WFPC2 F675W 500 WFPC2 F439W 10002001-12-07 WFPC2 F675W 800 WFPC2 F439W 16002003-01-05 ACS F625W 800 ACS F435W 12002003-08-12 ACS F625W 480 ACS F435W 8002003-11-28 ACS F625W 800 ACS F435W 16002004-12-15 ACS F435W 16002005-04-02 ACS F435W 12002005-09-26 ACS F625W 120002005-09-28 ACS F625W 7202006-04-15 ACS F625W 1200 ACS F435W 12002006-04-29 ACS F625W 7202006-12-06 ACS F625W 1200 ACS F435W 18002007-05-12 WFPC2 F675W 2700 WFPC2 F439W 30002008-02-19 WFPC2 F675W 1600 WFPC2 F439W 24002009-04-29 WFPC2 F675W 1600 WFPC2 F439W 20002009-12-12 WFC3 F625W 3000 WFC3 F438W 800
Supplementary Table 1HST observations used for the analysis
21
References
[25] Wang Let al Hubble Space Telescope Spectroscopic Observations of the Ejecta of SN
1987A at 2000 DaysAstrophys J 466 998ndash1010 (1996)
[26] Tziamtzis A Lundqvist P Groningsson P amp Nasoudi-Shoar S The outer rings of SN
1987A Astron Astrophys 527 A35ndashA48 (2011)
[27] Wang Let al The Axisymmetric Ejecta of Supernova 1987AAstrophys J 579 671ndash677
(2002)
[28] Tiny Tim HST PSF Modeling httpwwwstscieduhstobservatoryfocusTinyTim (2011)
[29] Dolphin A E A Revised Characterization of the WFPC2 CTE Loss PASP 121 655ndash667
(2009)
[30] Heng K amp McCray R Balmer-dominated Shocks Revisited Astrophys J 654 923ndash937
(2007)
[31] Bouchet Pet al The Bolometric Lightcurve of Supernova 1987A - Part Two - Results from
Visible and Infrared SpectrophotometryAstron Astrophys 245 490ndash498 (1991)
[32] Kurfess J Det al Oriented Scintillation Spectrometer Experiment observations of Co-57
in SN 1987AAstrophys J 399 L137ndashL140 (1992)
[33] Varani G F Meikle W P S Spyromilio J amp Allen D A Direct Observation of Radioac-
tive Cobalt Decay in Supernova 1987AMon Not R Astron Soc 245 570ndash576 (1990)
22
[34] Fransson C amp Kozma C The freeze-out phase of SN 1987A- Implications for the light
curveAstrophys J 408 L25ndashL28 (1993)
[35] Kozma C amp Fransson C Late Spectral Evolution of SN 1987A I Temperature and Ioniza-
tion Astrophys J 496 946ndash966 (1998)
[36] Kozma C amp Fransson C Late Spectral Evolution of SN 1987A II Line EmissionAstro-
phys J 497 431ndash457 (1998)
[37] Fitzpatrick E L amp Walborn N R Observations of Sk-69 deg 203 and the interstellar
extinction towards SN 1987AAstron J 99 1483ndash1487 (1990)
[38] Pun C S Jet al Modeling the Hubble Space Telescope Ultraviolet and Optical Spectrum
of Spot 1 on the Circumstellar Ring of SN 1987AAstrophys J 572 906ndash931 (2002)
[39] Xu Y amp McCray R Energy degradation of fast electronsin hydrogen gasAstrophys J
375 190ndash201 (1991)
[40] Kozma C amp Fransson C Gamma-ray deposition and nonthermal excitation in supernovae
Astrophys J 390 602ndash621 (1992)
[41] Martin P G Hydrogenic radiative recombination at low temperature and densityAstro-
phys J Supp 66 125ndash138 (1988)
[42] Moseley S H Dwek E Glaccum W Graham J R amp Loewenstein R F Far-infrared
observations of thermal dust emission from supernova 1987A Nature 340 697ndash699 (1989)
23

3000 4000 5000 6000 7000 8000
Time after explosion (days)
0
2
4
6
8
10
12
14
Flux(10
14ergcm
2s
1)
a
3000 4000 5000 6000 7000 8000
Time after explosion (days)
0
2
4
6
8
10
Flux(10
14ergcm
2s
1)
b
Supplementary Figure 2 Comparison of ejecta light curves for different apertures Panela shows
the R-band and panelb shows the B-band (note the different scales on the y-axes) Data points from
WFPC2 ACS and WFC3 are shown as dots triangles and stars respectively A correction factor
has been applied to the ACS and WFC3 fluxes in order to account for the differences between these
instruments and WFPC2 The red and blue data points correspond to the same expanding elliptical
aperture as in Fig 2 shown here for reference Green data points are for a fixed aperture that
encloses as much of the ejecta as possible (sma= 050primeprime see also Fig 1) while black data points
are for an expanding circular aperture with radius equal to the semi-major axis of the expanding
elliptical aperture Open symbols indicate approximate flux levels after accounting for emission
from the circumstellar ring The light curve from the fixed aperture clearly levels off at late times
This is at least partly due to ejecta material expanding out of the aperture but other effects may
also contribute
15
a b
Supplementary Figure 3 Example of the modelling of the ring a The HSTWFPC2 F675W
image from 2009-04-29 This is the same image as in Supplementary Fig 1d but the image levels
have been adjusted to show the structure of the ring more clearly As a result the ejecta appear very
faint b The model for the hot spots in the ring for the same epoch
16
00 02 04 06 08 10
Semimajor axis (arc seconds)
15
10
05
00
05
10
15
20
Log
(cou
nts
inellip
tica
lannulus)
Supplementary Figure 4 Comparison of the radial brightness profiles of the real data and the
model The profiles were produced for the 2009-04-29 WFPC2F675W observation (Supplemen-
tary Fig 3) with the real data shown in black and the model inred Specifically the lines show the
counts inside elliptical annuli aligned with the circumstellar ring as a function of the sma of the
annulus The model clearly agrees well with the real data in the ring area (between about 06ndash10primeprime)
and should therefore give us a good estimate of the amount of flux from the ring that leaks into the
ejecta region
17
20 15 10 5 0 5 10 15 20
Velocity (103 km s1 )
00
05
10
15
20
25
30
Flux(10
16ergcm
2s
1
A
1)
Supplementary Figure 5 STIS Hα profiles of the ejecta The red and black lines are for a 02primeprime slit
placed in the north-south direction and centred on the ejecta in 2004 and 2010 respectively The
dashed blue line is the combined spectrum from three 02primeprime slits placed next to each other in 2004
renormalized to match the continuum level of the other spectra The spectral extraction regions
were chosen to correspond as closely as possible to the size of the expanding elliptical aperture
used for the flux measurements in Fig 2 The boxy part of the line profile between3 000 and
9 000 km sminus1 is due to the reverse shock There is also a contribution fromthe reverse shock on
the blue side but this is harder to disentangle because of blending with the [O I]λλ 6300 6364
lines atminus12 022 km sminus1 andminus9 096 km sminus1
18
10 15 20 25 30 35 40
Log (energy) (eV)
0
2
4
6
8
10
12
14
Veloc
ityat
=1(103 km
s
1)
10 yrs
20 yrs
30 yrs
Supplementary Figure 6 Ejecta velocity corresponding to optical depthτ = 1 The optical depth
is measured from the ring as a function of energy at 10 20 and 30 years after the explosion The
maximum velocity for each of these curves is given by the ejecta velocity in the plane of the ring
which is 21 times 104(t10 yrs)minus1 km sminus1 Note the relatively small change in velocity with time
of τ(E) = 1 for energiessimgt 02 keV The FWHM of the line profiles are therefore expected to
decrease relatively slowly with time as long as most of the shock energy is emitted above this
energy Note also that at 30 years the full ejecta will be transparent atsimgt 6 keV
19
5 10 15 20 25 30
Time since explosion (years)
00
02
04
06
08
10
Fractionab
sorbed
01 keV
035 keV
10 keV
20 keV
Supplementary Figure 7 Fraction of the X-ray flux absorbed by the supernova ejecta as a function
of time The different lines correspond to different photonenergies as indicated in the figure The
main reason for the evolution is the increasing solid angle of the core as seen from the ring (prop t2)
damped by the increasing transparency at higher energy
20
6 Supplementary Table
Date Instrument Filter Exposure time Instrument Filter Exposure time(s) (s)
1994-09-24 WFPC2 F675W 600 WFPC2 F439W 8001995-03-05 WFPC2 F675W 600 WFPC2 F439W 8001996-02-06 WFPC2 F675W 600 WFPC2 F439W 9501997-07-10 WFPC2 F675W 600 WFPC2 F439W 8001998-02-06 WFPC2 F675W 400 WFPC2 F439W 5001999-01-07 WFPC2 F675W 1220 WFPC2 F439W 10391999-04-21 WFPC2 F675W 400 WFPC2 F439W 8002000-02-02 WFPC2 F675W 400 WFPC2 F439W 4602000-06-16 WFPC2 F675W 400 WFPC2 F439W 8002000-11-13 WFPC2 F675W 2400 WFPC2 F439W 12002001-03-23 WFPC2 F675W 500 WFPC2 F439W 10002001-12-07 WFPC2 F675W 800 WFPC2 F439W 16002003-01-05 ACS F625W 800 ACS F435W 12002003-08-12 ACS F625W 480 ACS F435W 8002003-11-28 ACS F625W 800 ACS F435W 16002004-12-15 ACS F435W 16002005-04-02 ACS F435W 12002005-09-26 ACS F625W 120002005-09-28 ACS F625W 7202006-04-15 ACS F625W 1200 ACS F435W 12002006-04-29 ACS F625W 7202006-12-06 ACS F625W 1200 ACS F435W 18002007-05-12 WFPC2 F675W 2700 WFPC2 F439W 30002008-02-19 WFPC2 F675W 1600 WFPC2 F439W 24002009-04-29 WFPC2 F675W 1600 WFPC2 F439W 20002009-12-12 WFC3 F625W 3000 WFC3 F438W 800
Supplementary Table 1HST observations used for the analysis
21
References
[25] Wang Let al Hubble Space Telescope Spectroscopic Observations of the Ejecta of SN
1987A at 2000 DaysAstrophys J 466 998ndash1010 (1996)
[26] Tziamtzis A Lundqvist P Groningsson P amp Nasoudi-Shoar S The outer rings of SN
1987A Astron Astrophys 527 A35ndashA48 (2011)
[27] Wang Let al The Axisymmetric Ejecta of Supernova 1987AAstrophys J 579 671ndash677
(2002)
[28] Tiny Tim HST PSF Modeling httpwwwstscieduhstobservatoryfocusTinyTim (2011)
[29] Dolphin A E A Revised Characterization of the WFPC2 CTE Loss PASP 121 655ndash667
(2009)
[30] Heng K amp McCray R Balmer-dominated Shocks Revisited Astrophys J 654 923ndash937
(2007)
[31] Bouchet Pet al The Bolometric Lightcurve of Supernova 1987A - Part Two - Results from
Visible and Infrared SpectrophotometryAstron Astrophys 245 490ndash498 (1991)
[32] Kurfess J Det al Oriented Scintillation Spectrometer Experiment observations of Co-57
in SN 1987AAstrophys J 399 L137ndashL140 (1992)
[33] Varani G F Meikle W P S Spyromilio J amp Allen D A Direct Observation of Radioac-
tive Cobalt Decay in Supernova 1987AMon Not R Astron Soc 245 570ndash576 (1990)
22
[34] Fransson C amp Kozma C The freeze-out phase of SN 1987A- Implications for the light
curveAstrophys J 408 L25ndashL28 (1993)
[35] Kozma C amp Fransson C Late Spectral Evolution of SN 1987A I Temperature and Ioniza-
tion Astrophys J 496 946ndash966 (1998)
[36] Kozma C amp Fransson C Late Spectral Evolution of SN 1987A II Line EmissionAstro-
phys J 497 431ndash457 (1998)
[37] Fitzpatrick E L amp Walborn N R Observations of Sk-69 deg 203 and the interstellar
extinction towards SN 1987AAstron J 99 1483ndash1487 (1990)
[38] Pun C S Jet al Modeling the Hubble Space Telescope Ultraviolet and Optical Spectrum
of Spot 1 on the Circumstellar Ring of SN 1987AAstrophys J 572 906ndash931 (2002)
[39] Xu Y amp McCray R Energy degradation of fast electronsin hydrogen gasAstrophys J
375 190ndash201 (1991)
[40] Kozma C amp Fransson C Gamma-ray deposition and nonthermal excitation in supernovae
Astrophys J 390 602ndash621 (1992)
[41] Martin P G Hydrogenic radiative recombination at low temperature and densityAstro-
phys J Supp 66 125ndash138 (1988)
[42] Moseley S H Dwek E Glaccum W Graham J R amp Loewenstein R F Far-infrared
observations of thermal dust emission from supernova 1987A Nature 340 697ndash699 (1989)
23