Illumination-size relationships of 109 coexisting tropical forest trees
14
Journal of Ecology 2006 94, 494–507 © 2006 The Authors Journal compilation © 2006 British Ecological Society Blackwell Publishing Ltd Illumination–size relationships of 109 coexisting tropical forest tree species DOUGLAS SHEIL*, AGUS SALIM*†, JÉRÔME CHAVE‡, JEROME VANCLAY§ and WILLIAM D. HAWTHORNE¶ *Center for International Forestry Research, PO Box 6596 JKPWB, Jakarta 10065, Indonesia, †National Centre for Epidemiology and Population Health, Australian National University, Mills Road, Acton ACT 0200, Australia, ‡Laboratoire Evolution et Diversité Biologique, UMR CNRS 5174, 118, route de Narbone, F-31062 Toulouse, France, §School of Environmental Science and Management, Southern Cross University, PO Box 157, Lismore NSW 2480, Australia, and ¶Department of Plant Sciences, University of Oxford, South Parks Road, Oxford OX1 3RB, UK Summary 1 Competition for light is a central issue in ecological questions concerning forest tree differentiation and diversity. Here, using 213 106 individual stem records derived from a national survey in Ghana, West Africa, we examine the relationship between relative crown exposure, ontogeny and phylogeny for 109 canopy species. 2 We use a generalized linear model (GLM) framework to allow interspecific compar- isons of crown exposure that control for stem-size. For each species, a multinomial response model is used to describe the probabilities of the relative canopy illumination classes as a function of stem diameter. 3 In general, and for all larger stems, canopy-exposure increases with diameter. Five species have size-related exposure patterns that reveal local minima above 5 cm d.b.h., but only one, Panda oleosa, shows a local maximum at a low diameter. 4 The pattern of species exposures at 10 cm diameter is consistent with two overlapping groups, of which the smaller (21 species, including most pioneers) is generally better exposed. 5 Relative illumination rankings amongst species are significantly maintained over a wide range of stem sizes. Species that are well exposed at small diameters are therefore also more likely to be well exposed at larger diameters, although two species in the most exposed 25% of species at 10 cm d.b.h. drop to the lowest illumination quartile at 40 cm d.b.h., and three demonstrate the opposite (low-to-high) pattern. 6 Species capable of achieving the largest diameters are generally recorded less fre- quently in shade than are smaller species, even when compared as saplings, suggesting that species achieving large mature sizes are generally shade intolerant when small. Controlling for phylogeny reveals that this relationship holds across independent lineages. 7 We also find evidence that the range of strategies encountered is influenced by disturbance regimes. 8 We interpret our results as indicating a continuum of strategies that reflect an evolu- tionary trade-off between a species’ mature size and its general shade-tolerance, in com- bination with differentiation based on disturbance based opportunities. Species that appear similar can therefore remain ecologically distinct over their lifetimes. Key-words: Allometry, canopy-position, competitive-exclusion, exposure, guilds, ontogeny, phylogenetic-regression, trade-off, rain forest, shade-tolerance. Journal of Ecology (2006) 94, 494–507 doi: 10.1111/j.1365-2745.2006.01111.x Introduction Many studies have highlighted the importance of interspecific differences in light requirement for understanding species coexistence in tropical rain forest trees (Clark & Clark 1992; Ashton 1998; Dalling et al . 1998; Brown et al . 1999; Sterck et al . 2001; Turner 2001), and schemes for grouping species are often based on illumination requirements alone (Swaine & Whitmore 1988; Hawthorne 1995). Ecological theory Correspondence: Douglas Sheil (e-mail [email protected]).
-
Upload
independent -
Category
Documents
-
view
1 -
download
0
Transcript of Illumination-size relationships of 109 coexisting tropical forest trees

Journal of Ecology
2006
94
, 494–507
© 2006 The AuthorsJournal compilation© 2006 British Ecological Society
Blackwell Publishing Ltd
Illumination–size relationships of 109 coexisting tropical forest tree species
DOUGLAS SHEIL*, AGUS SALIM*†, JÉRÔME CHAVE‡, JEROME VANCLAY§ and WILLIAM D. HAWTHORNE¶
*
Center for International Forestry Research, PO Box 6596 JKPWB, Jakarta 10065, Indonesia,
†
National Centre for Epidemiology and Population Health, Australian National University, Mills Road, Acton ACT 0200, Australia,
‡
Laboratoire Evolution et Diversité Biologique, UMR CNRS 5174, 118, route de Narbone, F-31062 Toulouse, France,
§
School of Environmental Science and Management, Southern Cross University, PO Box 157, Lismore NSW 2480, Australia, and
¶
Department of Plant Sciences, University of Oxford, South Parks Road, Oxford OX1 3RB, UK
Summary
1
Competition for light is a central issue in ecological questions concerning forest treedifferentiation and diversity. Here, using 213 106 individual stem records derived froma national survey in Ghana, West Africa, we examine the relationship between relativecrown exposure, ontogeny and phylogeny for 109 canopy species.
2
We use a generalized linear model (GLM) framework to allow interspecific compar-isons of crown exposure that control for stem-size. For each species, a multinomialresponse model is used to describe the probabilities of the relative canopy illuminationclasses as a function of stem diameter.
3
In general, and for all larger stems, canopy-exposure increases with diameter. Fivespecies have size-related exposure patterns that reveal local minima above 5 cm d.b.h.,but only one,
Panda oleosa
, shows a local maximum at a low diameter.
4
The pattern of species exposures at 10 cm diameter is consistent with two overlappinggroups, of which the smaller (21 species, including most pioneers) is generally better exposed.
5
Relative illumination rankings amongst species are significantly maintained over awide range of stem sizes. Species that are well exposed at small diameters are thereforealso more likely to be well exposed at larger diameters, although two species in the mostexposed 25% of species at 10 cm d.b.h. drop to the lowest illumination quartile at40 cm d.b.h., and three demonstrate the opposite (low-to-high) pattern.
6
Species capable of achieving the largest diameters are generally recorded less fre-quently in shade than are smaller species, even when compared as saplings, suggestingthat species achieving large mature sizes are generally shade intolerant when small.Controlling for phylogeny reveals that this relationship holds across independent lineages.
7
We also find evidence that the range of strategies encountered is influenced bydisturbance regimes.
8
We interpret our results as indicating a continuum of strategies that reflect an evolu-tionary trade-off between a species’ mature size and its general shade-tolerance, in com-bination with differentiation based on disturbance based opportunities. Species thatappear similar can therefore remain ecologically distinct over their lifetimes.
Key-words
: Allometry, canopy-position, competitive-exclusion, exposure, guilds, ontogeny,phylogenetic-regression, trade-off, rain forest, shade-tolerance.
Journal of Ecology
(2006)
94
, 494–507doi: 10.1111/j.1365-2745.2006.01111.x
Introduction
Many studies have highlighted the importance ofinterspecific differences in light requirement for
understanding species coexistence in tropical rainforest trees (Clark & Clark 1992; Ashton 1998; Dalling
et al
. 1998; Brown
et al
. 1999; Sterck
et al
. 2001; Turner2001), and schemes for grouping species are oftenbased on illumination requirements alone (Swaine &Whitmore 1988; Hawthorne 1995). Ecological theory
Correspondence: Douglas Sheil (e-mail [email protected]).

495
Illumination–size relationships in forest trees
© 2006 The AuthorsJournal compilation © 2006 British Ecological Society,
Journal of Ecology
94
, 494–507
has also emphasized the role of variation in the lightrequirements of coexisting tree species (Latham 1992;Kohyama 1993; Loehle 2000; Turner 2001; Chave
et al
.2002). Community-scale field studies are, however,scarce: differences in shade tolerance are hard to assessbecause of spatial and temporal heterogeneity, andbecause of the large sample sizes and complex statisticalprocedures required.
Much of the difficulty in grasping interspecific dif-ferences in shade-tolerance lies in the ontogenic shiftsthat occur between tree establishment and maturity.Since larger trees tend to be better exposed, failure toaccount for plant size confuses any analysis of shadetolerance. We must also account for the spatial andtemporal heterogeneity which affects tree establish-ment, growth and survival (Clark & Clark 1992; Grubb1977; Hawthorne 1995; Parker 1995; Montgomery &Chazdon 2002).
Ability to grow and shade-out competitors varieswith conditions. Partitioning of the light environmentamong species can promote coexistence (Latham1992), but such partitioning remains contentious andfield evaluations remain scarce (e.g. Montgomery &Chazdon 2002). Studies generally consider seedlingsalone even though the logic also applies to larger trees(Sack & Grubb 2001).
Understanding how shade-tolerance may be linkedwith other aspects of plant biology may provide insightinto species variation. Considering how variation inadult size might relate to juvenile shade-tolerance, wefind arguments for null, positive, negative or mixedrelationships. The null model – community wide equi-valence of species with respect to shade-tolerancethroughout ontogeny – follows Hubbell (2001). Evidencefor these neutral models usually focuses on their abilityto simulate community patterns, such as relative speciesabundance distributions (Chave
et al
. 2002). However,one study of tree exposure at La Selva in Costa Ricahas concluded, in accord with neutral theory, thatspecies were generally equivalent (Lieberman
et al
.1995).
A positive relationship
−
increasing juvenile shade-tolerance with greater adult size
−
is plausible if spe-cies differentiation is primarily determined by specificsuccessional patterns. In one of Horn’s models ofsuccession (Horn 1971), crown layering and canopyplacement are the focus, but tree species replace eachother in a sequence in which each subsequent species isboth more shade tolerant and taller at maturity, andthus able to exclude the previous occupants. This hasintuitive appeal as forest succession often presents aseries of species of increasing mature stature (Sheil2003; Falster & Westoby 2005). When diameter, ratherthan height, is used as a measure of size, similar pat-terns could result from tree architectural models inwhich stem-slenderness increases with shade-tolerance(Sterck
et al
. 2001).A negative relationship
−
decreasing juvenile shade-tolerance with greater adult-size
−
is consistent with
Givnish’s evaluation of tree height and resource allo-cation during plant growth (Givnish 1988). He arguesthat the largest trees must maximize energy capture inhigh light levels, and this will reduce juvenile shade-tolerance by comparison with small stature species.The argument begins by noting, first, that to best persistin low light, plants must maximize photon captureand minimize carbon expended. Low photosyntheticcapacity is beneficial because it is less costly, but thisleaves the plant poorly equipped to utilize high illumi-nation. In contrast, plants of high-light environmentsbenefit from high photosynthetic capacity. Second, rel-ative metabolic costs increase with tree size, and thisultimately limits maximum dimensions. Only specieswith adequate resources to allocate can continue togrow and reach the largest sizes. To overcome this limitthe very largest species must be very well suited to effec-tive energy capture in the high-light environments theyencounter at large sizes. Third, photosynthetic effi-ciency is constrained through ontogeny, i.e. a speciescannot derive maximum energy from both high light asan adult and from low light while a juvenile.
Based on these points, Givnish (1988) argues thatspecies that can become very large adult trees will beless shade-tolerant than smaller species, even as juve-niles. So, there is a predicted trade-off: although tallerspecies capture a disproportionate share of availablelight, they are less able to persist in low light thanshorter species. We find evidence for this from Thomas& Bazzaz (1999) who examined some Malaysianspecies (the selection stratified by genera) and foundthat species capable of achieving the greater heightshad lower photosynthetic efficiencies as seedlings inlow light, while Poorter
et al
. (2003, 2005) found a sig-nificant positive correlation between asymptotic treeheight and juvenile exposure in Liberian rain foresttrees.
Various authors support the view that there might bemultiple axes of size-dependent life-history differenti-ation (Loehle 2000; Turner 2001). Though a combinationof positive (successional) and negative (old-growth)correlations of attainable-size to shade-tolerance havebeen indicated for one selected combination of Australianforest trees (Falster & Westoby 2005), such variationhas not yet been objectively described for species richforest communities.
When evaluating adaptive explanations for relation-ships between character combinations, species cannotbe treated as independent because results might reflecttheir shared ancestral states (Grafen 1989). Such phylo-genetic dependence needs to be considered in the patternswe uncover.
In this study, we examine the relationship betweenshade-tolerance, ontogeny and phylogeny amongstcommon Ghanaian canopy trees by using a large data-set and a range of analyses. We consider how crownexposure varies in relation to stem diameter, and howthis varies amongst species: are there discerniblegroupings? We ask if the cross-species rankings of

496
D. Sheil
et al.
© 2006 The AuthorsJournal compilation © 2006 British Ecological Society,
Journal of Ecology
94
, 494–507
crown exposures are maintained across sizes; how attain-able tree-size relates to exposure patterns observedat smaller sizes; and whether these patterns reflectphylogeny.
Methods
Data derive from the Ghana National Forest Inven-tory Project (as discussed in Hawthorne 1995 andHawthorne
et al
. 2001), a 0.25% systematic sample of127 high-forest reserves in Ghana. Forest reserves havebeen established since the 1920s and have been sub-jected to various interventions (see Hawthorne &Abu-Juam 1995). Annual rainfall ranges from 1000 mmto 2250 mm. Forest zones are divided into wet, moist anddry based on rainfall and seasonality (Hawthorne 1995).
One-hectare plots were located at 3077 locations. Allliving trees
≥
30 cm diameter were measured. Stems
≥
5 cm and
≥
10 cm diameter were recorded in 0.05 haand 0.1 ha subplots, respectively (Hawthorne 1995).Stem diameters (d.b.h.) were recorded, at 1.3 m heightor above any buttresses or deformations. Buttressingand fluting were not a serious concern for stems below40 cm d.b.h. Overall, 367 251 trees were recorded, and298 318 were identified to species. Species included inour analysis (criteria outlined below) are listed withtheir families, authorities and attributes in AppendixS1 (see Supplementary material). Nomenclature followsHawthorne (1995).
Crowns of unbroken stems, free of major lianas, wereclassified by trained survey teams as: 4 = fully emer-gent (no other vegetation in an inverted vertical cone of45
°
), 3 = fully exposed from above (other than as 4),2 = partly exposed to direct light, or 1 = fully over-shadowed (Hawthorne 1995; similar to Dawkins 1956,1958, but Dawkins’ classes 2 and 3 are equivalent toclass 2 here). Light conditions overlap between suchclasses but investigations of crown scores and local esti-mates of irradiation made with hemispherical photo-graphy show a strong correlation (Brown
et al
. 2000). Suchclasses are simple to implement and can be objectivelyreplicated (Clark & Clark 1992; Jennings
et al
. 1999).Ghanaian forests have been disturbed by various
processes both natural and man-made. We do notclaim that the forests are unaffected by these distur-bances: the average understorey stem may achieveslightly higher canopy illumination than would haveoccurred under more pristine conditions and the rela-tive abundance of more heliophile (light demanding)species are certainly increased. We do however, assumethat the crown-exposure summary for each individualspecies is primarily a manifestation of its relative bio-logy and not an artefact of local disturbance histories.We are confident in asserting this due to (i) the broadarea sampled (avoiding biases from specific histories),(ii) the fact that areas with low tree cover provide fewtrees to the analysis, and (iii) the consistency of general
results with exploratory evaluations, which excludedata from more disturbed sites.
Multinomial models are a form of standard general-ized linear model (GLM) (Hosmer & Lemeshow 1989;McCullagh & Nelder 1989) developed for categoricaldata. These models allow us to estimate ordinal re-sponse data (here, exposure classes) while controllingfor an explanatory variable (here, stem diameter).
R
version1.7.1 (www.r-project.org) was used to estimate all modelsin this paper. Model based summaries reduce noiseand potential bias from uneven or skewed observationdensities on the explanatory variable.
The standard multinomial approach is as follows.Let f
i
(
d
) be a function of tree diameter
d
, and
p
i
be theprobability for a tree to be in the exposure class
i
(
i
= 1to 4) that is defined by the relationship.
p
i
= exp(f
i
)/(1 + exp(f
1
) + exp(f
2
) + exp(f
3
)), where
i
= 1 to 3
As the four probabilities add to one, the fourth class isexpressed as
p
4
= 1
−
p
1
−
p
2
−
p
3
(NB results are inde-pendent of the exposure class designated as analyticallyredundant). The function f
i
defines the relationshipbetween d.b.h and the proportion of crowns in class
i
.The modelled mean crown exposure
E
, is calculated asa function of
d
,
E
=
p
1
+ 2
p
2
+ 3
p
3
+ 4
p
4
.
E
d
is ourshorthand for specific calculated
E
values at the givenvalue of
d
(d.b.h. in cm).Our analyses include the correlation of stem exposure
estimates across size-classes. We therefore developedindependent models for smaller and larger stem sizes(above and below 30 cm diameter). This divisionensures that correlations determined across sizes arebased on independent estimates and are not influencedby non-independent parameter errors generated in modelfitting.
We used the Akaike Information Criterion (AIC,Akaike 1974) to select the best-fit models. We com-pared models: the ‘best’ model has the lowest AICvalue, and if two models differ by three AIC units ormore the difference is significant at
P
= 0.05 (Burnham& Anderson 1998). We fitted models of exposure classwith linear, logarithmic, quadratic and cubic termsfor d.b.h. The most parsimonious model (lowest AIC),for 96 out of 109 species, was f
i
=
a
i
+
b
i
ln(
d
) +
c
i
d
.None of the 13 remaining species showed convincingdeviation from this basic form, and it was applied to allthe species to ease computation and comparison. Next,we investigated if there were discernible species-specificeffects within the crown exposure–diameter relationships.To explore this we fitted two models:
Model 1 (M1): f
i
=
a
i
+
b
i
ln(
d
) +
c
i
d
Model 2 (M2): f
ij
=
a
ij
+
b
ij
ln(
d
) +
c
ij
d
,
j
= 1, 2, … 109

497
Illumination–size relationships in forest trees
© 2006 The AuthorsJournal compilation © 2006 British Ecological Society,
Journal of Ecology
94
, 494–507
Where ln(
d
) is the natural logarithm of stem diameter
d
,
a, b
and
c
are fitted parameters,
i
is (as before) theexposure class label and
j
is the species label.
We focused on large canopy species – species thatcompete directly for canopy space – so our analysisincludes only species with at least one stem diameterrecord exceeding 80 cm and two exceeding 70 cm(though arbitrary, this avoids single erroneous read-ings dictating membership). We have examined ourresults with various population and data definitionsthat are not all reported below, but the consistencyof these various approaches adds confidence to ourresults.
In model fitting, we excluded all stems over 80 cmdiameter to reduce differential leverage from unequalstem densities at larger sizes. We also excluded stems ofd.b.h. 20–29 cm as data for some species were toosparse. (For both cases, including the complete datagave results consistent with the more conservativeresults we quote below).
For our principal analyses, species with less than 200observations were excluded. In addition, we omittedfour species whose parameter estimates failed to con-verge in the model fitting (
Albizia ferruginea
,
Entandro-phragma candollei
,
Pseudospondias microcarpa
and
Talbotiella gentii
) as no optimal model could be deter-mined. These final analyses included 109 species, rang-ing from 210 records for
Chrysophyllum pruniforme
to11 296 for
Strombosia glaucescens
. We assessed modelfit using the most commonly used pseudo R
2
procedurefollowing Cox & Snell (1989). We provide these per-species results and the best fit model parameter valuesin Appendix S2.
We note that practitioners in fields who deal moreregularly with multinomial data models suggest that400 independent observations is a ‘rule of thumb’ formodels to behave reliably (e.g. Louviere
et al
. 1999). Weexamined various more conservative selection criteriasuch as rejecting species with fewer observations than400 and 800 (analyses of 90 and 66 species, respec-tively), but the results were consistent with those for thelarger analyses quoted below.
The most suitable measure of species size depends onthe nature of the underlying hypotheses. In our study,we are examining proposals (albeit indirectly) relatedto the metabolic demands experienced by trees thatinfluence their ability to achieve large size. The idealmeasure is ‘maximum size’, but sample based measuressuch as the ‘biggest stem’ show unacceptable sample-size dependence and are unduly influenced by singleerroneous readings. We therefore used the 95th per-centile (p95) diameter for all stems
≥
30 cm diameter asa surrogate for maximum size (
max-d
) of each species.This measure is statistically robust given our largesample sizes, and avoids additional modelling assump-tions. Exploratory evaluations showed that this
measure is robust to inclusion or exclusion of disturbedareas.
Hawthorne (1995, 1996) determined guilds, judgedpragmatically on perceived shade-tolerance, includingexposure patterns of regeneration (stems < 5 cm d.b.h.)and observations of larger trees (> 20 cm d.b.h.) for allthe species examined here. Pioneers are species that areconsistently well exposed, notably so as saplings, whileshade-bearer species are consistently found mainly inshade. Non-pioneer light demanders (NPLDs) tend tobe shaded at small diameters and illuminated whenlarge, while cryptic pioneers show the opposite pattern.As shade tolerance is likely to be related to general wet-ness of forest type, we concur with Hawthorne (1993,1995) in separating into special guilds those speciesgenerally found in open woodland (savanna species)and in wet areas (swamp species) even though theysometimes occur within closed forest.
E
The distribution of
E
values amongst species is eva-luated as unimodal (single peaked), bimodal (twopeaked) or multimodal (three or more peaked) byfitting the best fit models involving one, two or moreNormal distributions. (We know from the Central LimitTheorem that, if samples are drawn from one multi-nomial distribution, the mean values will follow oneNormal distribution, and, similarly, multiple Normaldistributions will result from samples derived frommultiple multinomial distributions). To estimateparameter distributions (i.e. mean and variance) ofeach of the components of the Normal mixture, we usea standard maximum likelihood method (Mardia
et al
.1979; McLachlan & Krishnan 1997). Again, our bestmodel is determined by the lowest AIC value.
Given multiple overlapping groups, species member-ship is based on probabilities. Specifically, from Bayesconditional probability formula, the probability ofa species with mean score
m
belonging to group A isproportional to (proportion of group A in generalpopulation) × (probability that the species has meanscore of m, given it belongs to group A), i.e, P(A | m) =P(A)·P(m | A)/constant. In practice, we identify theboundary value(s) of m, for which group membershipof A is more probable than membership of any othergroup and species within this range are consideredmembers.
As E derives from an ordinal-scale, tests of associ-ation are performed with rank correlation methods(Kendall & Gibbons 1990; Zar 1996).
To weigh the evidence of specific size–exposurebehaviours, such as local minima or maxima, an indic-ative probability statistic is calculated as one minus theproportion of 1000 bootstrapped models that exhibitsuch behaviour (Efron & Tibshirani 1994). The

498D. Sheil et al.
© 2006 The AuthorsJournal compilation © 2006 British Ecological Society, Journal of Ecology94, 494–507
bootstrap sample is constructed as follows: at eachobserved d.b.h. (per cm), we sample (with replacement)the crown exposure score. The sample size at eachd.b.h. is the number of observed stems at that d.b.h.This process is repeated for every observed d.b.h. Thecollated sample is then used to estimate the model and,using the model parameter estimates, E is computedacross d.b.h. and the existence/nonexistence of localminima/maxima is recorded. Usually P-values assessthe likelihood of rejecting a ‘true’ null hypothesis, buthere it is assumed false and we estimate the ability [power]to detect this. As with conventional probabilities, theevidence is considered strong if the value is less than0.05, i.e. if 95% or more of bootstrapped models exhibitthe behaviour. For simplicity, we refer to these measuresas ‘bootstrap P-values’.
To verify some of our model results, we also used abootstrap approach to estimate mean crown exposuresdirectly from the data (independently from our models)using all 61 species that had more than 50 individuals inboth 10–15 cm and 40–45 cm diameter size classes.For each size class and each species, we calculated theexact probability pi that one of the n > 50 individualschosen at random had a crown exposure i. Next, we cal-culated Q(E ), the species-specific distribution of themean crown exposure for each diameter class, given nrandomly chosen exposures ek, that is Thismultinomial distribution was estimated numericallyusing a bootstrapping technique. To compare thespecies exposure rankings between diameter classeswe calculated a Spearman’s correlation index 100 timesusing mean crown exposures independently drawnfrom the distribution Q(E) and used the mean indexto estimate significance (Zar 1996). Thus, we testedwhether the species ranking of light exposure in the10–15 cm class was maintained at 40–45 cm. We alsoanalysed each forest type separately.
Adaptive explanations for correlations amongstspecies characteristics must account for the potentialinfluence of common ancestry (Grafen 1989). We testedfor phylogenetic independence using a regressionapproach in which each distinct phylogenetic branch-point provides a single independent contrast againstwhich an adaptive hypothesis can be assessed (‘phylo8.glm’,Grafen 1989). The phylogenetic evaluations were basedon a molecular-cladistic study of genera, families andorders (revision R20030804, Webb & Donoghue 2003).
We used this regression approach to predict size(max-d ) from our modelled E estimates for selected re-ference diameters. As with all regression models, errorsassociated with the explanatory variable E are notreflected in the estimates of fit, however, for all keyresults, we tried swapping dependent and explanatoryvariables and found that these yield similar levels of signi-ficance. Log transformations of the data had negligibleinfluence on the quoted results.
Results
For the 5–19 cm diameter range, the AIC of the allstems in the one relationship model, M1, is a signi-ficantly poorer fit than the per species model, M2(AIC = 101237.3 vs. 55249.8, P << 0.001). M2 is alsobetter than M1 for the 30–80 cm interval (243934.5 vs.284369.3, P << 0.001). This result confirms significantvariation amongst species and justifies modelling themindividually (see Appendix S2 for full model details).Examples of observed and modelled mean crown ex-posures for two species are shown in Fig. 1. In fact, upto 60 cm d.b.h., the fit is remarkably good for all speciesdespite the noise and over-dispersion evident in the data.
-
We obtained various species-specific size-exposurerelationships. Most stems are predominantly in thelowest two exposure classes, even up to stem sizes of40 cm d.b.h., and reveal a monotonic increase in like-lihood of being recorded in better-illumination as theirdiameter increases. We observed local minima for sixspecies. Bootstrapped model estimates (see Methods)found these were significant only in Nauclea diderrichii(minimum exposure occurs at approx. 11 cm d.b.h.,P = 0.044), and Holoptelea grandis (approx. at 9 cmd.b.h., P = 0.008). We know that these species regeneratein large-gaps or tend to be more abundant in secondaryforests (Hawthorne 1996). Figure 2(a) shows that sap-lings of these species appear more common in moreopen sites than are slightly larger stems. Light-demandingspecies such as Triplochiton scleroxylon and Terminaliasuperba are more exposed than shade-tolerant speciessuch as Nesogordonia papaverifera and Dacryodesklaineana, especially at low d.b.h. (Fig. 2c).
Panda oleosa is the only species with a local maximumat lower d.b.h. (Fig. 2c, at approximately d.b.h. = 15 cm,but note that exposure climbs with increasing diameter> 30 cm d.b.h., Fig. 2d). The bootstrap P-value for theexistence of this local maximum (approach similar tothat used above to investigate minima see Methods) is0.017. The fitted model for Lophira alata implies a localmaximum at d.b.h. = 77 cm (below max-d for thisspecies, which is 97 cm) but the bootstrap P-value isnot significant (P = 0.356). Carapa procera yields asimilarly non-significant pattern (P = 0.501). Model-fits for all 109 species are shown in Fig. 3.
The mean E10 and E40 values, i.e. estimated mean expos-ures at d.b.h. 10 cm and 40 cm, respectively, differ by 1.05units: as individual species within these two diameterclasses range over 0.89 and 1.3 units, respectively, thetwo value sets overlap. Some species are typically aswell exposed at 10 cm d.b.h. as others are at 40 cm.
1 1/ .n ekn
kΣ =

499Illumination–size relationships in forest trees
© 2006 The AuthorsJournal compilation © 2006 British Ecological Society, Journal of Ecology94, 494–507
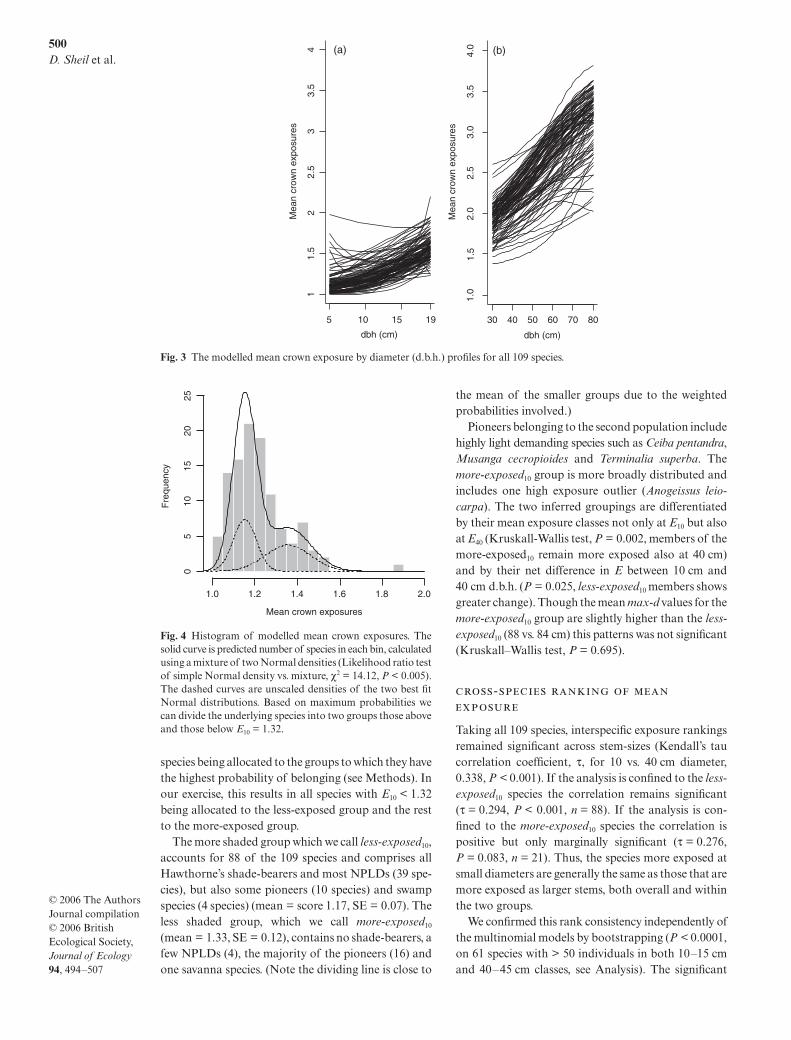
The ‘model-mean crown-exposure’ (Ed) distributionfor the 109 species appears both peaked and broadlydistributed. At 10 cm d.b.h. (Fig. 4), this distribution isbetter described as a mixture of two normal distributions
than one (likelihood ratio test, P < 0.005) implying asignificantly bimodal distribution. Adding furtherNormal distributions decreases fit. Accepting thisbimodal model as a basis for dividing species results in
Fig. 1 Observed (circles, mean value of observation in cm interval) and modelled (line) mean crown exposures for two examplespecies: Strombosia glaucescens, a species with few large diameter observations (Cox–Snell R2 = 0.882) and Hannoa klaineana, a wellrepresented species (Cox–Snell R2 = 0.811). Models were not fitted from 20 to 29 cm d.b.h. as data were too sparse for several species.
Fig. 2 Modelled exposure–diameter relationship for nine species. Left panels show the relationship at small diameter (5–20 cm),while right panels show it at large diameter (30–80 cm).
500D. Sheil et al.
© 2006 The AuthorsJournal compilation © 2006 British Ecological Society, Journal of Ecology94, 494–507
species being allocated to the groups to which they havethe highest probability of belonging (see Methods). Inour exercise, this results in all species with E10 < 1.32being allocated to the less-exposed group and the restto the more-exposed group.
The more shaded group which we call less-exposed10,accounts for 88 of the 109 species and comprises allHawthorne’s shade-bearers and most NPLDs (39 spe-cies), but also some pioneers (10 species) and swampspecies (4 species) (mean = score 1.17, SE = 0.07). Theless shaded group, which we call more-exposed10
(mean = 1.33, SE = 0.12), contains no shade-bearers, afew NPLDs (4), the majority of the pioneers (16) andone savanna species. (Note the dividing line is close to
the mean of the smaller groups due to the weightedprobabilities involved.)
Pioneers belonging to the second population includehighly light demanding species such as Ceiba pentandra,Musanga cecropioides and Terminalia superba. Themore-exposed10 group is more broadly distributed andincludes one high exposure outlier (Anogeissus leio-carpa). The two inferred groupings are differentiatedby their mean exposure classes not only at E10 but alsoat E40 (Kruskall-Wallis test, P = 0.002, members of themore-exposed10 remain more exposed also at 40 cm)and by their net difference in E between 10 cm and40 cm d.b.h. (P = 0.025, less-exposed10 members showsgreater change). Though the mean max-d values for themore-exposed10 group are slightly higher than the less-exposed10 (88 vs. 84 cm) this patterns was not significant(Kruskall–Wallis test, P = 0.695).
-
Taking all 109 species, interspecific exposure rankingsremained significant across stem-sizes (Kendall’s taucorrelation coefficient, τ, for 10 vs. 40 cm diameter,0.338, P < 0.001). If the analysis is confined to the less-exposed10 species the correlation remains significant(τ = 0.294, P < 0.001, n = 88). If the analysis is con-fined to the more-exposed10 species the correlation ispositive but only marginally significant (τ = 0.276,P = 0.083, n = 21). Thus, the species more exposed atsmall diameters are generally the same as those that aremore exposed as larger stems, both overall and withinthe two groups.
We confirmed this rank consistency independently ofthe multinomial models by bootstrapping (P < 0.0001,on 61 species with > 50 individuals in both 10–15 cmand 40–45 cm classes, see Analysis). The significant
Fig. 3 The modelled mean crown exposure by diameter (d.b.h.) profiles for all 109 species.
Fig. 4 Histogram of modelled mean crown exposures. Thesolid curve is predicted number of species in each bin, calculatedusing a mixture of two Normal densities (Likelihood ratio testof simple Normal density vs. mixture, χ2 = 14.12, P < 0.005).The dashed curves are unscaled densities of the two best fitNormal distributions. Based on maximum probabilities wecan divide the underlying species into two groups those aboveand those below E10 = 1.32.

501Illumination–size relationships in forest trees
© 2006 The AuthorsJournal compilation © 2006 British Ecological Society, Journal of Ecology94, 494–507
result persisted when data from all potentially prob-lematic plots (disturbed, swampy, rocky) were excluded(136 743 identified trees, comprising 31 species wereincluded, P < 0.005). Bootstrapping by forest typereduced sample sizes and indicated significant resultsfor the moist and the wet types (species with above 20individuals in both 10–15 cm and 40–45 cm classes,moist: 42 species, P < 0.005; wet: 27 species, P < 0.1,while dry forest plots provided too few observations toallow meaningful analysis).
We divided species by their exposure quartile at 10and 40 cm d.b.h.; this division is intended only as adescriptive and heuristic approach (NB an alternativeapproach comparing species against a ‘mean tree’model was considered but rejected as the prevalenceof heliophile species in our sample makes the widerrelevance of this per-stem reference uncertain). Fortyout of 109 species had mean crown exposures at40 cm d.b.h. in the same quartile (25% exposure group)as their 10 cm d.b.h. values (i.e. they tend to maintaintheir relative exposure status; Fig. 5). However, threespecies, Rhodognaphalon brevicuspe, Irvingia gabonensisand Klainedoxa gabonensis, exhibited a contrastingtrend, starting in the lowest exposure quartile and end-ing up in the highest (Fig. 5, top right). Bootstrappingsuggests that this trend is significant for R. brevicuspe(P = 0.019) (i.e. 98.1% of bootstrapped curves showthis pattern) but not for I. gabonensis or K. gabonensis
(P = 0.348 and P = 0.122, respectively). Two species,Margaritaria discoidea and Tetrapleura tetrapterashowed the opposite trend: starting in the highest andending in the lowest exposure quartiles (Fig. 5, bottomleft; bootstrap estimates P = 0.088 and P = 0.106,respectively).
The 16 transition categories (Fig. 5) had clear rela-tionships with Hawthorne’s three principle guild cate-gories (see Fig. 6). Pioneers predominate in the upperexposure quartile at both 10 and 40 cm d.b.h. (mostclearly at 40), while shade-bearers show the oppositepattern, and NPLDs are intermediate between the two.These observations demonstrate a strong link betweenfield experience (the basis of the guilds) and the modelresults.
Modelled crown exposures were positively correlatedwith the 95th percentile diameter (max-d for maximumdiameter, which ranges from 46 cm for Carapa procerato 176 cm for Ceiba pentandra, with a per-species meanof 85 cm) of each species even at small sizes (Fig. 7, at10 cm d.b.h., τ = 0.156, P = 0.017, n = 109, while usingPearson’s coefficient = 0.222 suggests that this relationaccounts for over 20% of variance in exposure). Thispattern held within the less-exposed10 group (at 40 cmτ = 0.336, P < 0.001, at 10 cm, τ = 0.212, P = 0.004
Fig. 5 Modelled mean crown exposure, E, vs. stem diameter for species groupings based on transitions between quartiles ofmodelled mean crown exposures at 10 and 40 cm d.b.h. (E10 and E40). The horizontal axis is d.b.h. (cm) and the vertical axis is E,modelled mean crown exposure. For each group, the coordinate at the centre top is the quartile at 10 and 40 cm d.b.h., respectively(1 being the lowest and 4 the highest). The number in the bottom right corner is the number of species in the group. The regionbetween two lines is 20–29 cm d.b.h. All species (n = 82) in the graphs along the diagonal of the left upper corner and right lowercorner follow the general vertical light trajectory in the forest canopy. The three graphs in the lower left corner (10 species) switchfrom high to low E, the three graphs in the upper right corner (nine species) switch from low to high E.

502D. Sheil et al.
© 2006 The AuthorsJournal compilation © 2006 British Ecological Society, Journal of Ecology94, 494–507
n = 88). For the more-exposed10 group, the correlationsthough positive were significant only at large size(τ = 0.024, P = 0.880 at 10 cm and τ = 0.320, P = 0.043at 40 cm, n = 21).
As might be expected, the species that showed thebiggest changes in mean exposure with size (between 10and 40 cm d.b.h.) were also those that reached the larg-est sizes (τ = 0.291, P < 0.001, n = 109).
Regression that partitions variation by phylogen-etically independent contrasts (see Methods), using 166branch points shows that the max-d vs. E relation-ship is positive and significant across the phylogeny(i.e. at d.b.h. = 10 cm, P = 0.026, and d.b.h. = 40 cm,P = 0.0001). This relationship varied slightly amongst
the major clades (Asterids, Rosids, Magnoliids, indescending order of slope), but this trend was notsignificant (P = 0.27). We concluded that the size-exposure relation has evolved repeatedly and independ-ently in distinct taxonomic lineages reflecting an adaptiveprocess.
Species are unevenly distributed across the climaticgradient and as our results may be influenced by theselarge-scale patterns, we conducted some exploratoryevaluations. We found that trees are fractionally moreexposed in the dry zone than in the wet zone, but thesedifferences were not significant (e.g. for all sufficientlyrepresented species between 10 and 15 cm d in the dryzone (27 species, 1751 trees) and in the combined moistand wet zones (60 species, 6534 trees), the absolute dif-ference in illumination is 0.12, while the standard devi-ation of the difference was 0.14, t-value = 0.857, P = 0.391).
We found also that the biggest trees per-plot fromdrier forest achieved slightly greater size on averagethan those in wetter forest (we estimated the 95th per-centile [p95] for diameter in each plot, using all trees≥ 30 d.b.h. regardless of species from plots with ≥ 25such trees; the mean per-plot p95 values for wet, moistand dry are 51.29 ± 0.31, 52.54 ± 0.23, and 54.06 ±0.28, with n = 193, 741 and 380 plots, all contrastssignificant, P < 0.05). However, the species-specificdifferences appear complex. Eight of the 20 widely dis-tributed species had significant differences in crownexposure between the dry and wetter forests (i.e. abso-lute difference in exposure between the two zones islarger than the sum of the standard deviation in the twozones). Five of these were more exposed in the dry zone(e.g. Ricinodendron heudelotii ) and three in the wetterforest (e.g. Piptadeniastrum africanum).
Discussion
The data shows that individual subcanopy sized treesof any species occur in a wide range of illumination
Fig. 6 The distribution of the species by the main Hawthorne guild and by the quartiles in which their exposures are modelled at10 and 40 cm d.b.h. (E10 and E40).
Fig. 7 Modelled exposure, E, at 10 cm (E10, open circles) and40 cm d.b.h. (E40, closed circles) for 109 species vs. Max-d(p95 d.b.h. of the per-species sample tree population withstems over 30 cm d.b.h.).

503Illumination–size relationships in forest trees
© 2006 The AuthorsJournal compilation © 2006 British Ecological Society, Journal of Ecology94, 494–507
conditions. The strength of our modelling lies in theability to summarize broad population level patternsfrom these data.
Our multinomial models express relative crown-exposure class probabilities as a function of stem diameterfor 109 canopy species. Combining these probabilitiesinto per-species crown-illumination indices (for anominal diameter, d), Ed, we were able to examineinterspecific variation in crown exposure. Can we relatethis to competition? Our understanding of plant com-petition is limited by our knowledge of the processescontrolling individual growth (Berntson & Wayne2000). However, we know that competing plants dimin-ish each others’ light interception not through subtlephysiological processes, but rather by placing their leavesand canopy above each other (Schwinning & Weiner 1998).As E assesses crown placement directly it is a plausibleindex of relative competition in the stand context.
As species are not evenly distributed, environmentalgradients may influence our results. In wet areas, dryforest species often thrive primarily on crests or rockyoutcrops, where the vegetation is more open (see Hall &Swaine 1981; Hawthorne 1996) but this does not nec-essarily lead to a predictable outcome as those samedry forest species also occur exposed in dry forest.Interestingly, some species like Khaya ivorensis, usuallyfully exposed from the sapling-stage onwards in wetterareas, are more reclusive in dry areas, persisting inmuch smaller gaps (Hawthorne 1996). Our exploratoryevaluations do not identify dominant patterns acrossrainfall zones: this deserves additional study.
-
Various model results were verified by bootstrapping,showing they are not artefacts of our modellingapproach. Concerns over other types of artefacts arereduced through comparisons with independent re-sults from other studies − our results are consistentwith what we know of the species under consideration.For example, the patterns seen in Fig. 6 show that theHawthorne guilds have a clear, if imperfect, associationwith the quartile-to-quartile exposure transition groups.General agreement is also apparent with variousspecific studies, for example those studies showingthat seedlings of Ceiba pentandra, Mansonia altissima,Ricinodendron heudelotii and Sterculia rhinopetala(species consistently well exposed at small sizes in ourmodels) cannot persist in typical forest shade (2% irra-diance) (Swaine et al. 1997; Agyeman et al. 1999).
Comparing our results with Poorter et al.’s (2003)study of Liberian forest tree species is especially help-ful. Our studies include 11 species in common and ourapproaches are complementary: we have many morerecords, while they included measurements of stemheight and crown dimensions, and consider only old-growth forest. A cross-tabulation of the main species-specific estimates reported in both studies finds them tobe in general agreement. The Liberian measurements
of maximum height (95% percentile) are highly rankcorrelated with our Max-d (P = 0.012, n = 11) and ourE40 (P = 0.006). E40 is also significantly rank correlatedwith the Liberian measure of light demand (percentageof trees in high light between 10 and 20 cm d.b.h.,P = 0.005), tree height15 (tree specific regressions for atree of d.b.h. 15 cm, P = 0.036) and marginally relatedto the inverse of crown depth15 (P = 0.05; all othercorrelations are non-significant but are signed in amanner consistent with Poorter et al.’s own analyses).These cross-checks bolster confidence in our resultsand imply wider geographical validity.
One explanation for different species illuminationprofiles is differing height-diameter relationships(e.g. King 1996; Thomas 1996a; Bongers & Sterck 1998;Hawthorne et al. 2001). Hawthorne et al. (2001) andPoorter et al. (2003) have found that taller West Afri-can tree species are generally more slender and that thispattern is sometimes already apparent in juvenile trees(10 cm d.b.h). However, in our study the range of per-species mean E10 values spans nearly one full exposureclass (from 1 to nearly 1.9), equivalent in magnitude tothe mean per-species differences found between stemsof 10 and 40 cm d.b.h. (1.2–2.1). Indeed, the E10 valuesof some species are higher than the E40 values of others.Even allowing for sample noise these exposure dif-ferences are unlikely to arise from interspecific heightvariation alone. Though clearly important, height isat best a partial answer for the variation in E valuesobserved at small diameters.
The distribution of E10 values (Fig. 4) is consistentwith two overlapping groups of species with 88 speciesin the less-exposed10 groups and 21 in the more broadlydistributed more-exposed10 group. This result can bereconciled with the conflicting expectations of botha simple ‘pioneer’–‘non-pioneer’ division (Swaine &Whitmore 1988) and a more general continuum (e.g.Agyeman et al. 1999; Montgomery & Chazdon 2002).It may indeed reflect both a division in terms of gap-dependent vs. non-gap dependent germination (asSwaine & Whitmore 1988), and a spectrum of toler-ances within each group.
Germination under different light conditions hasbeen assessed by Kyereh et al. (1999) for fresh seedsfrom 14 of our species. Only two (Musanga cecropioidesand Nauclea diderrichii) showed a clear photoblasticresponse (a difference between light and dark): bothare placed in our more-exposed10 grouping. Naucleadiderrichii was also the only species tested that revealeda response to simulated low red : far-red ratio at 5%irradiance (germination was reduced by nearly 60%).Six further species (Ceiba pentandra, Entandrophragmautile, Mansonia altissima, Ricinodendron heudelotii,Terminalia ivorensis and Terminalia superba) are in ourmore-exposed10 group and five (Guarea cedrata, Khayaivorensis, Lovoa trichilioides, Pterygota macrocarpa and

504D. Sheil et al.
© 2006 The AuthorsJournal compilation © 2006 British Ecological Society, Journal of Ecology94, 494–507
Sterculia rhinopetala) are in our less-exposed10 group.While the difference in the ultimate proportion of ger-minated seeds was not affected, the mean number ofdays to germinate was influenced by illumination level infive of the six species in our more-exposed10 group (allbut Terminalia ivorensis) but in only one (Khaya ivorensis)of the less-exposed10 group. This pattern is close tosignificant (Fishers exact test, P = 0.08). In any case,factors such as temperature and humidity may alsocontribute, alone or in combination, to gap-dependentgermination.
Our models show a range of specific patterns. Localminima seen for Nauclea diderrichii and Holopteleagrandis are consistent with the fact that these speciesregenerate in large-gaps and tend to be more abundantin secondary forests which close up several years afterinitial tree establishment (Hawthorne 1996). Clark& Clark (1992) and Sterck et al. (1999), working inCosta-Rica and Borneo, respectively, have observedthat tree species that establish in larger gaps often havelower exposure at larger sizes because they are over-grown by the rest of the gap vegetation. Similarly, ourresults for Lophira alata and Carapa procera (specieswhich commonly mature in re-growth) suggest an expos-ure maximum may be reached at intermediate size.
Panda oleosa is the only species with a local exposuremaximum at lower d.b.h. (Fig. 2c). We cannot identifyan artefact in this result: P. oleosa is well recorded with1347 observations, is distinctive and readily identified.The architecture of this elephant-dispersed speciesinvolves a highly programmed plagiotropic branchingform with branches as quasi-compound leaves likePhyllanthus, Cook’s Model (Hallé et al. 1978). This Epattern suggests that, following establishment and rapidinitial growth, P. oleosa pauses, no-longer keepingpace with the surrounding regrowth. This may indicateeither a strategy where the species reaches a size whereinvestment in reproduction reduces growth or a specificbenefit of gaining adequate size quickly (perhaps to resistlarger terrestrial herbivores).
Three species, Rhodognaphalon brevicuspe, Irvingiagabonensis and Klainedoxa gabonensis, are in the lowestexposure quartile at 10 cm d.b.h. and in the highest at40 cm d.b.h. This trend is significant for R. brevicuspe. Twospecies, Margaritaria discoidea and Tetrapleura tetrapterareveal the opposite trend: starting in the highest andending in the lowest exposure quartiles. These two spe-cies also had local minima. Moving from high to lowillumination with development is what Hawthorne (1996)called ‘cryptic pioneers’. Such species readily persist asshade tolerant adults, despite their juvenile exposure.
Sizes achieved by the larger dominant species doincrease as a relatively predictable successional patternin some African forests (cf. Sheil 2003 for Uganda), andthere is evidence in other parts of the world that shortercolonizing species pre-empt sites following disturbance
(Falster & Westoby 2005; but see Davies et al. 1998).Even though our results show evidence of gap depend-ence, they do not support a hypothesis that tree size andshade-tolerance are positively related through succes-sional sorting. Why is this? It may be that such arelationship exists for only a subset of our speciesand, if so, the pattern is lost amongst the rest. Theabundance of ‘large-pioneers’ in the West African rainforests (Turner 2001) is one factor. In addition, the factthat smaller understorey species typically establishthroughout succession, and that disturbance regimesare variable in time and space provide additionalcomplications. Established trees can benefit from theimproved illumination resulting from a local tree-fallevent or similar without this involving a successionalcomponent of composition change. While the relev-ance of successional sorting for non-pioneer speciesremains debated (Sheil & Burslem 2003), the impor-tance of variation in responses to different disturbanceregimes (and disturbance events) by trees of differentsizes and types is increasingly highlighted (Kohyama1993; Loehle 2000; Turner 2001). The range and varietyof size-exposure relationships in Ghanaian forest treesappears to reflect both size-related gradients anddisturbance.
-
Our results show that, amongst 109 common forest treespecies, relative illumination rankings are significantly(but imperfectly) maintained over a wide range of stemsizes. The positive rank correlation between max-d andexposure at small diameters is especially striking. Thisimplies that juveniles of larger species are typicallymore exposed (less shade-tolerant) than those of typicalsmall-tree species of similar diameter. These patternsare robust to a broad range of analytical choices. Eventhough many species may be very similar (as seen inthe tight grouping of species within Fig. 3) our detec-tion of structure in the variation shows that coexistingtree species are not equivalent through ontogeny. Ofcourse, with many coexisting species, the mean differ-ences between the most similar species are small − butit would be a mistake to assume that such variation isirrelevant. Species need not be especially different toremain ecologically distinct over their lifetimes.
Plant characteristics associated with shade-toleranceare not evenly distributed amongst higher taxa (Bazzaz1990). Nonetheless, our phylogenetic analyses indicatea significant pattern of correlation between attainable sizeand juvenile shade-tolerance independent of phylogeny,suggesting a common adaptive process.
Canopy trees have evolved the ability to reach largesize because this is favoured by competition for light,but size is ultimately limited when the marginal advant-ages of even larger sizes are outweighed by the addedcosts (Iwasa et al. 1984). As tree size increases, respira-tion and maintenance requires an increasingly largeproportion of the plant’s energy. At very large sizes,

505Illumination–size relationships in forest trees
© 2006 The AuthorsJournal compilation © 2006 British Ecological Society, Journal of Ecology94, 494–507
only the most photosynthetically efficient trees haveenough spare carbon to allocate to additional growthas well as to maintenance (Givnish 1988) and repro-duction (Coley & Barone 1996). Our results show thatin Ghana the tallest species do indeed appear less likelyto persist in shade as juveniles than are smaller species.So does this represent a trade-off ?
Outside of early successional environments, tallerplant species in various habitats are typically found tobe better suited to efficient energy capture at high lightand smaller species at lower light (Field & Mooney1986; Hirose & Werger 1987; Thomas & Bazzaz 1999;Anten & Hirose 2003) and various arguments andstudies imply that these adaptations are somewhatconstrained through ontogeny (see Givnish 1988, 2002).Given these generalities, some trade-off − or at least anupper boundary presented by a trade-off − seemsinevitable (Givnish 1988, 1995; Westoby et al. 2002).This then poses the alternate question: why, if it reflectsa real biological limit, is it not more visible? Even in ourGhanaian data the relationship ( juveniles of largerspecies being less shade-tolerant) is not especiallystrong. Why for example, do Aiba & Kohyama (1997)not detect a negative relationship between speciesmaximum size and juvenile crown exposure among 14non-pioneer species coexisting in their study in Japan?
One factor accounting for variation in community-wide size trade-off patterns is likely to be ontogenicplasticity. In our phylogenetic analyses, we noted therange of slopes (size vs. juvenile exposure) amongstmajor plant groups. We also noted that two of onlythree species which start in the lowest illumination E10
quartile and end in the highest E40 quartile are in theIrvingiaceae, suggesting distinctive ontogenic plasticityin this family. Taxonomic factors appear influential.
A more general explanation for differences amongstcommunities lies in the costs and benefits of adult treesize under real conditions. We already noted that spe-cies will evolve to be bigger only while the advantagesof additional size are not outweighed by their costs.Tree size has various costs in addition to energeticdemands (Smith & Huston 1989; Westoby et al. 2002).Such costs will vary with location. For example, tallerplants suffer greater desiccation load, while under-storey plants stay cooler and can keep respiring for longerin drier conditions (Schwinning & Weiner 1998). Inrain forests struck by extreme droughts, large-stemsmay suffer higher relative mortality than small stems(e.g. van Nieuwstadt & Sheil 2005). Indeed variousdisturbance processes show size-selective effects: forexample wind storms generally impact forests whiletaking a greater toll of larger than smaller stems (e.g.Ostertag et al. 2005). More generally, as the likelihoodof dying before reaching reproductive age increases,long-term (large-sized) strategies are less favoured(Makela 1985; Thomas 1996b; Kohyama et al. 2003).Various theoretical studies also show that tree size canevolve as determined not only by direct competitionamongst stems but also by other more intermittent
threats and opportunities (e.g. Kohyama 1993; Benton& Grant 1999; Iwasa 2000). Drawing these ideastogether we predict that the apparency of a species max-imum size vs. juvenile shade tolerance trade-off will varyacross tree communities according to the evolutionarycontext and the community history regarding how thecosts and benefits of tree size have played out. A trade-off is likely to be more apparent in communities wherefactors that interact with tree-size and tree persistence(such as drought, strong winds and disturbance regimesgenerally) have had little relative influence.
-
The range of E values across all stem sizes implies thatminor changes in illumination (small scale canopy dis-turbances or increasing canopy closure) will influencedifferent species to different extents. If different species aresufficiently favoured at different times and places, thiswill promote diversity (Latham 1992; Montgomery& Chazdon 2002). Such a process might be viewed aseach species being required to make a sequential seriesof constrained bets on the best illumination conditionsto be adapted for at any moment (where all betters havesome chance of winning) and where the overall spreadof bets are adopted according to their likelihoods andthe choice of other players. Local-scale outcomes arelargely stochastic, but the overall diversity of environ-ments and their spatial and temporal dimensionsprovide opportunities for which different species, andindividuals, are more or less suited. These opportun-ities, and the ecological and evolutionary interplayamong the strategies that benefit from them, appearcrucial to understanding the processes that govern treecommunity richness. Our study shows that aspects ofsuch variation can potentially be described fromsuitable large scale inventory data.
Conclusions
Crown exposure records can help differentiate shade-tolerance attributes of species. The realization that treespecies have different and dynamic shade-tolerancesand adaptations as they develop has considerable sig-nificance for our understanding of species life history,tree diversity and coexistence, as well as for forest man-agement. Employing data from a large forest inventory,we have inferred functional trade-offs and disturbancedependence from a static demographic study. Speciesthat can achieve the largest sizes typically have lowershade tolerance than juveniles of smaller taxa. Thisapparent trade-off appears consistent across phyla,though there are various interesting exceptions. Thesepatterns appear adaptive relating to tree size, ontogenyand disturbance. Identifying and describing such relation-ships will help achieve a more realistic, species-centredunderstanding of species variation, persistence andcommunity dynamics.

506D. Sheil et al.
© 2006 The AuthorsJournal compilation © 2006 British Ecological Society, Journal of Ecology94, 494–507
Acknowledgements
We thank David Burslem, Laura Snook, Robert Nasi,Erik Meijaard, Tony Cunningham, Jeremy Midgley,Lourens Poorter, Frans Bongers, Sean Thomas, DeborahClark, Frank Sterck, S. Aiba and anonymous refereesfor comments on earlier manuscripts. Alan Grafenkindly provided advice on the phylogenetic analysis.Data was generously made available by the GhanaianForest Department. See Hawthorne (1995) for fulleracknowledgements for the data set, a combination ofmany people’s efforts. Preparation of the paper wasmade easier by Indah Susilanasari and the CIFORlibrary staff.
References
Agyeman, V.K., Swaine, M.D. & Thompson, J. (1999)Responses of tropical forest tree seedlings to irradiance andthe derivation of a light response index. Journal of Ecology,87, 815–827.
Aiba, S. & Kohyama, T. (1997) Crown architecture and life-history traits of 14 tree species in a warm-temperate rainforest: significance of spatial heterogeneity. Journal of Ecology,85, 611–624.
Akaike, H. (1974) A new look at the statistical model identifica-tion. IEEE Transaction on Automatic Control, 19, 716–723.
Anten, N.P.R. & Hirose, T. (2003) Shoot structure, leaf physio-logy, and daily carbon gain of plant species in a tallgrassmeadow. Ecology, 84, 955–968.
Ashton, P.S. (1998) Niche specificity among tropical trees: Aquestion of scales. Dynamics of Tropical Communities (edsD.M. Newbery, H.H.T. Prins & N.D. Brown), pp. 491–514.Blackwell Science, Oxford, UK.
Bazzaz, F.A. (1990) Successional environments: plant–plantinteractions. Perspectives on Plant Competition (eds J.B.Grace & D. Tilman), pp. 239–263. Academic Press Inc, SanDiego, USA.
Benton, T.G. & Grant, A. (1999) Optimal reproductive effortin stochastic density-dependent environments. Evolution,53, 677–688.
Berntson, G.M. & Wayne, P.M. (2000) Characterising the sizedependence of resource acquisition within crowded plantpopulations. Ecology, 81, 1072–1085.
Bongers, F. & Sterck, F.J. (1998) Architecture and develop-ment of rainforest trees: responses to light variation.Dynamics of Tropical Communities (eds D.M. Newbery,H.H.T. Prins & N. Brown), pp. 125–162. Blackwell Science,Oxford, UK.
Brown, N., Jennings, S., Wheeler, P. & Nabe-Nielsen, J. (2000)An improved method for the rapid assessment of forestunderstorey light environments. Journal of Applied Ecol-ogy, 37, 1044–1053.
Brown, N., Press, M. & Bebber, D. (1999) Growth and sur-vivorship of dipterocarp seedlings: differences in shadepersistence create a special case of dispersal limitation.Philosophical Transactions of the Royal Society London,Series B, 354, 1847–1855.
Burnham, K.P. & Anderson, D.R. (1998) Model Selection andInference. Springer, New York.
Chave, J., Muller-Landau, H.C. & Levin, S. (2002) Compar-ing classical community models: theoretical consequencesfor patterns of diversity. American Naturalist, 159, 1–23.
Clark, D.A. & Clark, D.B. (1992) Life history diversity oftropical trees. Ecological Monograph, 62, 315–344.
Coley, P.D. & Barone, J.A. (1996) Herbivory and plantdefences in tropical forests. Annual Review of Ecology andSystematics, 27, 305–335.
Cox, D.R. & Snell, E.J. (1989) Analysis of Binary Data, 2ndedn. Chapman & Hall, London.
Dalling, J.W., Hubbell, S.P. & Silvera, K. (1998) Seed dispersal,seedling establishment and gap partitioning among tropicalpioneer trees. Journal of Tropical Ecology, 86, 674–689.
Davies, S.J., Palmiotto, P.A., Ashton, P.S., Lee, S.A. &Lafrankie, J.V. (1998) Comparative ecology of 11 sympatricspecies of Macaranga. Borneo: tree distribution in relationto horizontal and vertical resource heterogeneity. Journalof Ecology, 86, 662–673.
Dawkins, H.C. (1956) Crown Classification of Natural ForestTrees. Uganda Forest Department Technical Note, No. 17/56.
Dawkins, H.C. (1958) The Management of Natural TropicalHigh-Forest with Reference to Uganda. Paper No. 34,Commonwealth Forestry Institute, Oxford, UK.
Efron, B. & Tibshirani, R. (1994) An Introduction to the Boot-strap. CRC press, London, UK.
Falster, D.S. & Westoby, M. (2005) Alternative heightstrategies among 45 dicot rain forest species from tropicalQueensland, Australia. Journal of Ecology, 93, 521–535.
Field, C. & Mooney, H.A. (1986) The photosynthesis–nitrogen relationship in wild plants. On the Economy of PlantForm and Function (ed. T. Givnish), pp. 25–55. CambridgeUniversity Press, London, UK.
Givnish, T.J. (1988) Adaptation to sun and shade: a whole-plant perspective. Australian Journal of Plant Physiology,15, 63–92.
Givnish, T.J. (1995) Plant stems: biomechanical adaptationfor energy capture and influence on species distributions.Plant Stems: Physiology and Functional Morphology (ed.B.L. Gartner), pp. 3–49. Chapman & Hall, New York, USA.
Givnish, T.J. (2002) Ecological constraints on the evolution ofplasticity in plants. Evolutionary Ecology, 16, 213–242.
Grafen, A. (1989) The phylogenetic regression. PhilosophicalTransactions of the Royal Society of London, 205, 581–598and http://users.ox.ac.uk/∼grafen/phylo/index.html.
Grubb, P.J. (1977) The maintenance of species richness inplant communities. The importance of the regenerationniche. Biology Reviews, 52, 107–145.
Hall, J.B. & Swaine, M.D. (1981) Distribution and Ecology ofPlants in Tropical Rain Forest. Junk Publishers, The Hague,Netherlands.
Hallé, F., Oldeman, R.A.A. & Tomlinson, P.B. (1978) TropicalTrees and Forests – An Architectural Analysis. Springer,Berlin, Germany.
Hawthorne, W.D. (1993) Forest Regeneration After Logging inBia South GPR, Ghana. ODA Forestry Series 3, NaturalResources Institute, Chatham, UK.
Hawthorne, W.D. (1995) Ecological Profiles of GhanaianForest Trees. Tropical Forestry Paper, 29. Oxford ForestryInstitute, Oxford, UK.
Hawthorne, W.D. (1996) Holes and the sums of parts inGhanaian Forest: regeneration, scale and sustainable use.Proceedings of the Royal Society, Edinburgh, 104b, 75–176.
Hawthorne, W.D. & Abu-Juam, M. (1995) Forest Protectionin Ghana. IUCN, Gland, Switzerland.
Hawthorne, W.D., Agyeman, V.K., Abu Juam, M. & Foli, E.G.(2001) Taking stock: an annotated bibliography of loggingdamage and recovery in tropical forests, and the results of newresearch in Ghana. Unpublished Except Via WWW, OxfordForestry Institute, Oxford, UK.
Hirose, T. & Werger, M.J.A. (1987) Maximizing daily carbonphotosynthesis with respect to the leaf nitrogen allocationpattern in the canopy. Oecologia, 72, 520–526.
Horn, H.S. (1971) The Adaptive Geometry of Trees. PrincetonUniversity Press, New Jersey, USA.
Hosmer, D.W. & Lemeshow, S. (1989) Applied LogisticRegression. Wiley, Chichester, UK.
Hubbell, S.P. (2001) The Unified Neutral Theory of Biodiver-sity and Biogeography. Monographs in Population Biology32. Princeton University Press, Princeton, USA.

507Illumination–size relationships in forest trees
© 2006 The AuthorsJournal compilation © 2006 British Ecological Society, Journal of Ecology94, 494–507
Iwasa, Y. (2000) Dynamic optimization of plant growth.Evolutionary Ecology Research, 2, 437–455.
Iwasa, Y., Cohen, D. & Leon, J.A. (1984) Tree height andcrown shape, as results of competitive games. Journal ofTheoretical Biology, 112, 279–297.
Jennings, S.B., Brown, N.D. & Sheil, D. (1999) Assessingforest canopies and understorey illumination: canopy closure,canopy cover and other measures. Forestry, 72, 59–73.
Kendall, M. & Gibbons, J.D. (1990) Rank Correlation Methods,5th edn. Edward Arnold, London, UK.
King, D.A. (1996) Allometry and life history of tropical trees.Journal of Tropical Ecology, 12, 25–44.
Kohyama, T. (1993) Size-structured tree populations in gapdynamic forest – the forest architecture hypothesis for thestable coexistence of species. Journal of Tropical Ecology,81, 131–143.
Kohyama, T., Suzuki, E., Partomihardjo, T., Yamada, T. &Kubo, T. (2003) Tree species differentiation in growth,recruitment and allometry in relation to maximum heightin a Bornean mixed dipterocarp forest. Journal of Ecology,91, 797–806.
Kyereh, B., Swaine, M.D. & Thompson, J. (1999) Effect oflight on the germination of forest trees in Ghana. Journal ofEcology, 87, 772–783.
Latham, R.E. (1992) Co-occurring tree species change rank inseedling performance with resources varied experimentally.Ecology, 73, 2129–2144.
Lieberman, M., Lieberman, D., Peralta, R. & Hartshorn, G.S.(1995) Canopy closure and the distribution of tropicalforest tree species at La Selva, Costa Rica. Journal of TropicalEcology, 11, 161–178.
Loehle, C. (2000) Strategy space and the disturbance spectrum:a life history model for tree species coexistence. AmericanNaturalist, 156, 14–33.
Louviere, J.P., Meyer, R.J., Bunch, D.S., Carson, R., Dellaert,B., Hanemann, W.M., Hensher, D. & Irwin, J. (1999)Combing sources of preference data for modelling complexdecision processes. Marketing Letters, 10, 205–207.
Makela, A. (1985) Differential games in evolutionary theory:height growth strategies of trees. Theoretical PopulationBiology, 27, 239–267.
Mardia, K.V., Kent, J.T. & Bibby, J.M. (1979) MultivariateAnalysis. Academic Press, Duluth, London, UK.
McCullagh, P. & Nelder, J.A. (1989) Generalized Linear Models,2nd edn. Chapman & Hall, London, UK.
McLachlan, G. & Krishnan, T. (1997) EM Algorithm andExtensions. Wiley, New York, USA.
Montgomery, R.A. & Chazdon, R.L. (2002) Light gradientpartitioning by tropical tree seedlings in the absence ofcanopy gaps. Oecologia, 131, 165–174.
van Nieuwstadt, M.G.L. & Sheil, D. (2005) Drought, fire andtree survival in a Borneo rain forest, East Kalimantan,Indonesia. Journal of Ecology, 93, 191–201.
Ostertag, R., Silver, W.L. & Lugo, A.E. (2005) Factorsaffecting mortality and resistance to damage followinghurricanes in a rehabilitated subtropical moist forest.Biotropica, 37, 16–24.
Parker, G.G. (1995) Structure and microclimate of forestcanopies. Forest Canopies (eds M.D. Lowman & N.M.Nadkri), pp. 73–106. Academic Press Inc., San Diego,California, USA.
Poorter, L., Bongers, F., Sterck, F.J. & Wöll, H. (2003) Archi-tecture of 53 rain forest tree species differing in adult statureand shade tolerance. Ecology, 84, 60–608.
Poorter, L., Bongers, F., Sterck, F.J. & Wöll, H. (2005)Beyond the regeneration phase: differentiation of height-light trajectories among tropical tree species. Journal ofEcology, 93, 256–267.
Sack, L. & Grubb, P.J. (2001) Why do species of woody seed-lings change rank in relative growth rate between low andhigh irradiance? Functional Ecology, 15, 145–154.
Schwinning, S. & Weiner, J. (1998) Mechanisms determiningthe degree of size asymmetry in competition among plants.Oecologia, 113, 447–455.
Sheil, D. (2003) Observations of long-term change in anAfrican rain forest. Long-Term Changes in Tropical TreeDiversity as a Result of Natural and Man Made Disturbances:Studies from the Guiana Shield, Africa, Borneo and Mela-nesia (ed. H. ter Steege), pp. 37–59. Series 22. Tropenbos,Wageningen, the Netherlands.
Sheil, D. & Burslem, D.F.R.P. (2003) Disturbing hypothesesin tropical forests. Trends in Ecology and Evolution, 18, 18–26.
Smith, T.M. & Huston, M.A. (1989) A theory of the spatialand temporal dynamics of plant communities. Vegetatio,83, 49–69.
Sterck, F.J., Bongers, F. & Newbery, D.M. (2001) Tree archi-tecture in a Borneo lowland rain forest: intraspecific andinterspecific differences. Plant Ecology, 153, 279–292.
Sterck, F.J., Clark, D.B., Clark, D.A. & Bongers, F. (1999)Light fluctuations, crown traits, and response delays for treesaplings in a Costa Rican lowland rain forest. Journal ofTropical Ecology, 1999 (15), 83–95.
Swaine, M.D., Agyeman, V.K., Kyereh, B., Orgle, T.K.,Thompson, J.T. & Veenendaal, E.M. (1997) Ecology ofForest Trees in Ghana. ODA Forestry Series no. 7. Universityof Aberdeen, Aberdeen, UK.
Swaine, M.D. & Whitmore, T.C. (1988) On the definition ofecological species groups in tropical rain forests. Vegetatio,75, 81–86.
Thomas, S.C. (1996a) Asymptotic height as a predictor ofgrowth and allometric characteristics in Malaysian rainforest trees. American Journal of Botany, 83, 556–566.
Thomas, S.C. (1996b) Reproductive allometry in Malaysianrain forest trees: biomechanics versus optimal allocation.Evolutionary Ecology, 10, 517–530.
Thomas, S.C. & Bazzaz, F.A. (1999) Asymptotic height as apredictor of photosynthetic characteristics in Malaysianrain forest trees. Ecology, 80, 1607–1622.
Turner, I.M. (2001) The Ecology of Trees in the Tropical RainForest. Cambridge Tropical Biology Series. CambridgeUniversity Press, Cambridge, UK.
Webb, C. & Donoghue, M. (2003) Phylomatic: A Database forApplied Phylogenetics (Revision R20030804). http://www.phylodiversity.net/phylomatic/.
Westoby, M., Falster, D.S., Moles, A.T., Vesk, P.A. & Wright, I.J.(2002) Plant ecological strategies: some leading dimensionsof variation between species. Annual Review of Ecology andSystematics, 33, 125–159.
Zar, J.H. (1996) Biostatistical Analysis, 3rd edn. Prentice HallInternational Editions, Upper Saddle River, NJ, USA.
Received 31 May 2005 revision accepted 24 November 2005 Handling Editor: David Burslem
Supplementary material
The following material is available online atwww.blackwell-synergy.com
Appendix S1 Species list, number of observations andsummary data.
Appendix S2 Model fit as measured by Cox–Snell R2
(Cox & Snell 1989) and final best fit per species modelparameters (i.e. for Model 2: fij = aij + bij ln(d.b.h.) +cijd.b.h., where j is the species label, see Methods) forsmall (5–20 cm d.b.h.) and large (30–80 cm d.b.h.) stems.


![Ação Games #109 [11.96] [Web] - Retro CDN](https://static.fdokumen.com/doc/165x107/631a5a9b1e5d335f8d0b89f3/acao-games-109-1196-web-retro-cdn.jpg)

