SPITZER SPECTROSCOPY OF THE GALACTIC SUPERNOVA REMNANT G292.0+1.8: STRUCTURE AND COMPOSITION OF THE...
17
arXiv:0902.2804v1 [astro-ph.GA] 16 Feb 2009 Accepted by ApJ February 16, 2009 Preprint typeset using L A T E X style emulateapj v. 08/13/06 Spitzer SPECTROSCOPY OF THE GALACTIC SUPERNOVA REMNANT G292.0+1.8: STRUCTURE AND COMPOSITION OF THE OXYGEN-RICH EJECTA Parviz Ghavamian 1 , John C. Raymond 2 , William P. Blair 3 , Knox S. Long 1 , Achim Tappe 2 , Sangwook Park 4 and P. Frank Winkler 5 Accepted by ApJ February 16, 2009 ABSTRACT We present mid-infrared (5-40 μm) spectra of shocked ejecta in the Galactic oxygen-rich supernova remnant G292.0+1.8 , acquired with the IRS spectrograph on board the Spitzer Space Telescope. The observations targeted two positions within the brightest oxygen-rich feature in G292.0+1.8. Emission lines of [Ne II] λ12.8, [Ne III] λλ15.5,36.0, [Ne V] λ24.3 and [O IV] λ25.9 μm are detected from the shocked ejecta. In marked contrast to what is observed in Cassiopeia A, no discernible mid-IR emission from heavier species such as Mg, Si, S, Ar or Fe is detected in G292.0+1.8. We also detect a broad emission bump between 15 and 28 μm in spectra of the radiatively shocked O-rich ejecta in G292.0+1.8 . We suggest that this feature arises from either shock-heated Mg 2 SiO 4 (forsterite) dust in the radiatively shocked O-rich ejecta, or collisional excitation of PAHs in the blast wave of the SNR. If the former interpretation is correct, this would be the first mid-IR detection of ejecta dust in G292.0+1.8. A featureless dust continuum is also detected from non-radiative shocks in the circumstellar medium around G292.0+1.8 . The mid-IR continuum from these structures, which lack mid-IR line emission, is seen in Chandra images as bright X-ray filaments, is well described by a two- component silicate dust model. The temperature of the hot dust component (M d ∼ 2×10 −3 M ⊙ ) is ∼115 K, while that of the cold component (roughly constrained to be 3M ⊙ ) is ∼35 K. We attribute the hot component to collisionally heated dust in the circumstellar shocks in G292.0+1.8 , and attribute the cold component to dust heated by the hard FUV radiation from the circumstellar shocks. Using average O/Ne and O/Si mass ratios measured for a sample of ejecta knots in the X-rays, our models yield line strengths consistent with mass ratios M O /M Ne ≈ 3, M O /M Si 61 and M O /M S ≈ 50. These ratios (especially the large O/Ne mass ratio) are difficult to reproduce with standard nucleosynthesis models of well-mixed supernova ejecta. This reinforces the conclusions of existing X-ray studies that the reverse shock in G292.0+1.8 is currently propagating into the hydrostatic nucleosynthetic layers of the progenitor star, and has not yet penetrated the layers dominated by explosive nucleosynthetic products. Subject headings: ISM: individual (G292.0+1.8), ISM: kinematics and dynamics, shock waves, plas- mas, ISM: cosmic rays, supernova remnants 1. INTRODUCTION The Galactic supernova remnant (SNR) G292.0+1.8 is one of seven known SNRs whose optical spectrum is dominated by emission from metal-rich ejecta produced during a core collapse SN. The optical emission arises in dense knots of ejecta where the shocks have become radiative. The prominent [O I], [O II] and [O III] emis- sion lines observed in the spectra of these SNRs have earned them the title ’oxygen-rich supernova remnants’ (OSNRs). Aside from G292.0+1.8 , the other known OS- NRs include Cassiopeia A (Minkowski 1957, Chevalier & Kirshner 1978, 1979, Fesen et al. 2001) and Puppis A (Winkler & Kirshner 1985) in the Milky Way, N132D 1 Space Telescope Science Institute, 3700 San Martin Drive, Bal- timore, MD, 21218; [email protected]; [email protected] 2 Harvard-Smithsonian Center for Astrophysics, 60 Garden Street, Cambridge, MA 02138; [email protected]; at- [email protected] 3 Department of Physics and Astronomy, Johns Hopkins University, 3400 N. Charles Street, Baltimore, MD, 21218; [email protected] 4 Department of Astronomy and Astrophysics, Pennsylvania State University, 525 Davey Laboratory, University Park, PA, 16802; [email protected] 5 Department of Physics, Middlebury College, McCardell Bicen- tennial Hall 526, Middlebury, VT, 05753; [email protected] (Lasker 1978, 1980; Morse, Winkler & Kirshner 1995; Morse et al. 1996; Blair et al. 2000) and 0540-69.3 (Kirshner et al. 1989; Serafimovich et al. 2005) in the LMC, 1 E0102.2-7219 in the SMC (Dopita, Tuohy & Mathewson 1981, Blair et al. 2000) and the lumi- nous, spatially unresolved OSNR in the irregular galaxy NGC 4449 (Kirshner & Blair 1980; Milisavljevic & Fesen 2008). More recently with the availability of high quality X- ray spectra of SNRs from Chandra and XMM, core- collapse SNRs have been identified purely from their line emission in X-ray spectra. The X-ray emission arises from faster shocks in lower density material, where the shocks remain in the non-radiative phase. These objects include purely non-radiative remnants such as B0049-73.6 in the SMC (Hendrick, Reynolds & Borkowski 2005) and E0103-72.6 in the SMC (Park et al. 2003). The lack of optically-emitting ejecta knots in these objects indicates either that dense ejecta knots do not exist in these objects or that this material is not currently being encountered by the reverse shock. Based on our current understanding, the core-collapse supernovae that produce OSNRs (i.e., those exhibiting oxygen line emission in the optical) should leave be- hind rotating neutron stars (pulsars), but G292.0+1.8
-
Upload
independent -
Category
Documents
-
view
1 -
download
0
Transcript of SPITZER SPECTROSCOPY OF THE GALACTIC SUPERNOVA REMNANT G292.0+1.8: STRUCTURE AND COMPOSITION OF THE...
arX
iv:0
902.
2804
v1 [
astr
o-ph
.GA
] 1
6 Fe
b 20
09Accepted by ApJ February 16, 2009Preprint typeset using LATEX style emulateapj v. 08/13/06
Spitzer SPECTROSCOPY OF THE GALACTIC SUPERNOVA REMNANT G292.0+1.8: STRUCTURE ANDCOMPOSITION OF THE OXYGEN-RICH EJECTA
Parviz Ghavamian1, John C. Raymond 2, William P. Blair3, Knox S. Long1, Achim Tappe2, Sangwook Park4 andP. Frank Winkler5
Accepted by ApJ February 16, 2009
ABSTRACT
We present mid-infrared (5−40 µm) spectra of shocked ejecta in the Galactic oxygen-rich supernovaremnant G292.0+1.8 , acquired with the IRS spectrograph on board the Spitzer Space Telescope. Theobservations targeted two positions within the brightest oxygen-rich feature in G292.0+1.8 . Emissionlines of [Ne II] λ12.8, [Ne III] λλ15.5,36.0, [Ne V] λ24.3 and [O IV] λ25.9 µm are detected fromthe shocked ejecta. In marked contrast to what is observed in Cassiopeia A, no discernible mid-IRemission from heavier species such as Mg, Si, S, Ar or Fe is detected in G292.0+1.8 . We also detecta broad emission bump between 15 and 28 µm in spectra of the radiatively shocked O-rich ejectain G292.0+1.8 . We suggest that this feature arises from either shock-heated Mg2SiO4 (forsterite)dust in the radiatively shocked O-rich ejecta, or collisional excitation of PAHs in the blast wave ofthe SNR. If the former interpretation is correct, this would be the first mid-IR detection of ejectadust in G292.0+1.8 . A featureless dust continuum is also detected from non-radiative shocks in thecircumstellar medium around G292.0+1.8 . The mid-IR continuum from these structures, which lackmid-IR line emission, is seen in Chandra images as bright X-ray filaments, is well described by a two-component silicate dust model. The temperature of the hot dust component (Md ∼ 2×10⁻³ M⊙) is∼115 K, while that of the cold component (roughly constrained to be . 3 M⊙) is ∼35 K. We attributethe hot component to collisionally heated dust in the circumstellar shocks in G292.0+1.8 , and attributethe cold component to dust heated by the hard FUV radiation from the circumstellar shocks. Usingaverage O/Ne and O/Si mass ratios measured for a sample of ejecta knots in the X-rays, our modelsyield line strengths consistent with mass ratios MO/MNe ≈ 3, MO/MSi & 61 and MO/MS ≈ 50. Theseratios (especially the large O/Ne mass ratio) are difficult to reproduce with standard nucleosynthesismodels of well-mixed supernova ejecta. This reinforces the conclusions of existing X-ray studies thatthe reverse shock in G292.0+1.8 is currently propagating into the hydrostatic nucleosynthetic layersof the progenitor star, and has not yet penetrated the layers dominated by explosive nucleosyntheticproducts.
Subject headings: ISM: individual (G292.0+1.8), ISM: kinematics and dynamics, shock waves, plas-mas, ISM: cosmic rays, supernova remnants
1. INTRODUCTION
The Galactic supernova remnant (SNR) G292.0+1.8is one of seven known SNRs whose optical spectrum isdominated by emission from metal-rich ejecta producedduring a core collapse SN. The optical emission arisesin dense knots of ejecta where the shocks have becomeradiative. The prominent [O I], [O II] and [O III] emis-sion lines observed in the spectra of these SNRs haveearned them the title ’oxygen-rich supernova remnants’(OSNRs). Aside from G292.0+1.8 , the other known OS-NRs include Cassiopeia A (Minkowski 1957, Chevalier &Kirshner 1978, 1979, Fesen et al. 2001) and PuppisA (Winkler & Kirshner 1985) in the Milky Way, N132D
1 Space Telescope Science Institute, 3700 San Martin Drive, Bal-timore, MD, 21218; [email protected]; [email protected]
2 Harvard-Smithsonian Center for Astrophysics, 60 GardenStreet, Cambridge, MA 02138; [email protected]; [email protected]
3 Department of Physics and Astronomy, Johns HopkinsUniversity, 3400 N. Charles Street, Baltimore, MD, 21218;[email protected]
4 Department of Astronomy and Astrophysics, PennsylvaniaState University, 525 Davey Laboratory, University Park, PA,16802; [email protected]
5 Department of Physics, Middlebury College, McCardell Bicen-tennial Hall 526, Middlebury, VT, 05753; [email protected]
(Lasker 1978, 1980; Morse, Winkler & Kirshner 1995;Morse et al. 1996; Blair et al. 2000) and 0540−69.3(Kirshner et al. 1989; Serafimovich et al. 2005) inthe LMC, 1 E0102.2−7219 in the SMC (Dopita, Tuohy& Mathewson 1981, Blair et al. 2000) and the lumi-nous, spatially unresolved OSNR in the irregular galaxyNGC 4449 (Kirshner & Blair 1980; Milisavljevic & Fesen2008).
More recently with the availability of high quality X-ray spectra of SNRs from Chandra and XMM, core-collapse SNRs have been identified purely from theirline emission in X-ray spectra. The X-ray emissionarises from faster shocks in lower density material,where the shocks remain in the non-radiative phase.These objects include purely non-radiative remnantssuch as B0049−73.6 in the SMC (Hendrick, Reynolds& Borkowski 2005) and E0103−72.6 in the SMC (Parket al. 2003). The lack of optically-emitting ejecta knotsin these objects indicates either that dense ejecta knotsdo not exist in these objects or that this material is notcurrently being encountered by the reverse shock.
Based on our current understanding, the core-collapsesupernovae that produce OSNRs (i.e., those exhibitingoxygen line emission in the optical) should leave be-hind rotating neutron stars (pulsars), but G292.0+1.8
2
is the only Galactic remnant from this class found toharbor both an active pulsar (Camilo et al. 2002,Hughes et al. 2003) and an associated pulsar wind neb-ula (PWN) (Hughes et al. 2001). Recent analyses ofChandra data of G292.0+1.8 (Park et al. 2002, 2004;Gonzalez & Safi-Harb 2003) have shown that a prominentX-ray filament stretching across the center of the OSNRseen in earlier Einstein observations (Tuohy, Burton &Clark 1982) is of normal composition. This suggests thatG292.0+1.8 is interacting with circumstellar material.Due to the fact that is nearby, spatially resolved andexhibits all the expected features of a core-collapse SN(O-rich optical and X-ray emission, active pulsar/PWNand apparent circumstellar interaction) it is critical tocarry out as many detailed studies of G292.0+1.8 in asmany wavelength ranges as possible.
Recently the Infrared Spectrograph (IRS; Houck et al.2004) on the Spitzer Space Telescope (SST) has provideda major step forward in sensitivity and spectral resolu-tion in the spectroscopy of objects in the mid-IR. OS-NRs, which exhibit strong shock-excited line and con-tinuum emission, are particularly well suited for studywith the IRS. The optical spectra of these remnantsprovide critical kinematic information from the Dopplershifts of strong emission lines. However, in the case ofG292.0+1.8 and many of the other OSNRs, the opticalspectra are dominated by few ions, making abundancemeasurements difficult. In addition, most Galactic SNRsincluding G292.0+1.8 are located in the plane of theGalaxy where significant extinction prevents the detec-tion of the UV lines expected from these objects. Theseproblems are circumvented in the mid-IR, where emissionlines from nearly all of the main burning products of corecollapse SNe, including O, Ne, Mg, Si, S, Ar and Fe, areexpected in the 5-40 µm bandpass of IRS. In addition, thepresence of multiple ionization stages from some speciessuch as Ne, S, Ar and Fe in this band and insensitivity ofIR fine structure lines to temperature help simplify thespectral analysis compared to optical and X-ray studies.
The IRS also provides a sensitive tool for probingthe properties of dust in both the ISM and supernovaejecta. Dust grains overrun by supernova shocks areprogressively heated and destroyed downstream from theflow (Tielens et al. 1994), producing continuum emis-sion that often peaks in the mid-infrared (Draine 1981,Dwek, Foster & Vancura 1996). Dust continuum is ob-served from fast (& 1000 km s−1 ) non-radiative shocksdriven into the ISM and CSM of young SNRs (as in Ke-pler’s SNR, see Blair et al. 2007), and from radia-tive shocks (vS ∼150-500 kms−1 ) in dense (n ∼ 1000-104 cm−3) ISM/CSM and metal-rich ejecta, e.g., Cas A(Ennis et al. 2005; Rho et al. 2008; Smith et al.2008); E0102−72.3 (Sandstrom et al. 2008) and N132D(Tappe, Reach & Rho 2006).
With the above diagnostic capabilities of Spitzer inmind, we undertook a Spitzer project to study the com-position and physical state of the ejecta in G292.0+1.8 .The goals of these observations were to (1) measure therelative abundances of nucleosynthetic products withinthe shocked ejecta, and if possible, to compare the re-sults with theoretical models of massive stellar evolutionto refine mass estimates of the progenitor star; and (2) toinvestigate the emission from heated dust in G292.0+1.8 .Throughout our discussion, IR wavelengths are shown in
µm units, and optical wavelengths are given in A. Belowwe describe the observational program undertaken andour analysis.
2. OBSERVATIONS
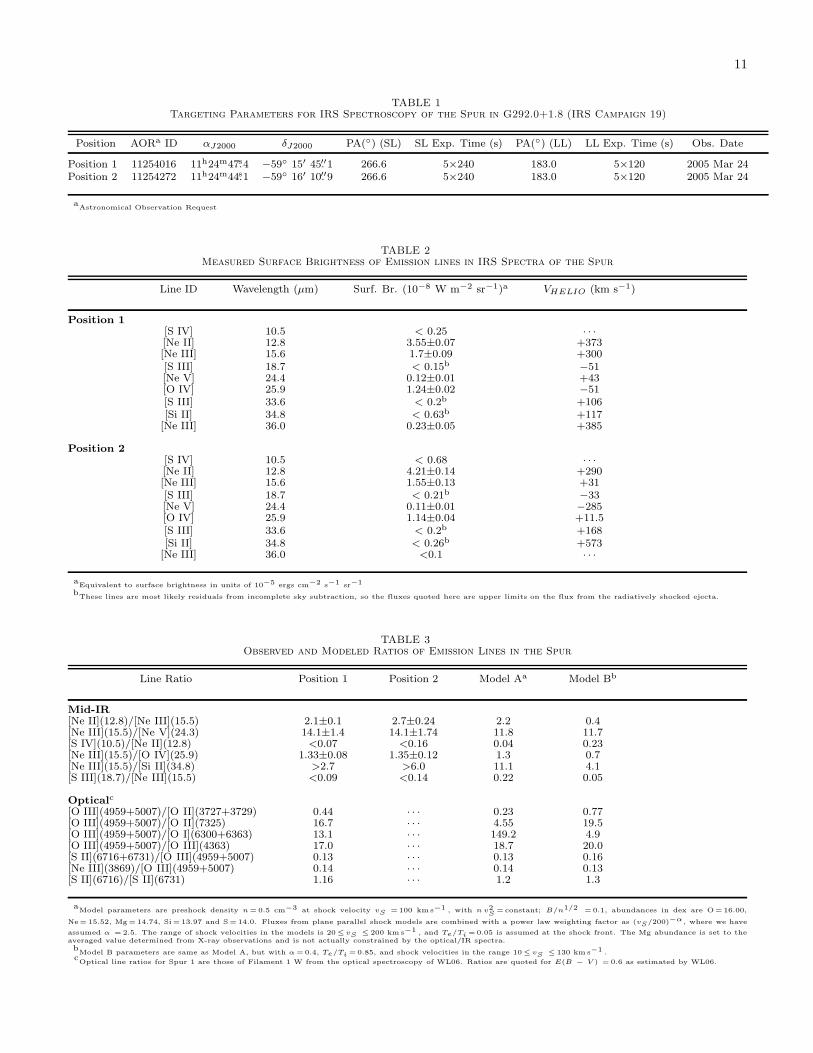
We observed G292.0+1.8 in a set of observations withthe low resolution IRS module in early 2004 (Table 1).The observations were performed in IRS Staring modeas part of the Cycle 1 Guest Investigator program (PID3598; P. Ghavamian, PI). Details of the instrument con-figuration are listed in Table 1. We observed two re-gions in G292.0+1.8 , located in the upper and lower por-tions of the dominant oxygen-rich feature in G292.0+1.8known as the ’Spur’ (Goss et al. 1979; Ghavamian,Hughes & Williams 2005; Winkler & Long 2006; here-after WL06) (see Fig. 1). The spectroscopic observa-tions of the Spur included data from all four modules,namely Short-Low (SL) 2nd order (5.2-8.7 µm), SL 1storder (7.4-14.5 µm), Long-Low (LL) 2nd order (14.0-21.3µm) and LL 1st order (19.5-38.0 µm). The spectroscopicresolution of the low resolution module lies in the range64≤ R ≤ 128 in the wavelength range 5.2≤ λ ≤ 38.0µm. The spatial pixel scale of the SL modules is 1.′′8pixel−1, while that of the LL modules is 5.′′1 pixel−1.
The positions of the slits for the observation dates aremarked on the continuum-subtracted [O III] image ofG292.0+1.8 (WL06) in Fig. 1. We list observationaldetails such as the celestial coordinates of each pointing,position angles of the slits and number of observing cyclesin Table 1. The staring observation through each IRSmodule consisted of two dithered pointings wherein thetargeted feature is placed 1/3 of the distance along thelength of the slit, then moved to a position 2/3 of the wayalong the length of the slit. The resulting spectra overlapin a region approximately 38′′ in length for the SL slits,and 112′′ in length for the LL slits. In the final combineddata, the object spectra are extracted from this overlapregion, where the signal-to-noise is highest.
We analyzed the G292.0+1.8 IRS spectra using theversion S13.2.0 products of the IRS calibration pipeline.Before extracting the spectra we cleaned the coadded thetwo-dimensional spectra from each nod into a single highsignal-to-noise spectrum. For each set of pointings wefirst removed rogue pixels from the bcd images using theIRSCLEAN v1.7 algorithm6. Next we shifted the secondset of nods by the length of each nod (11 pixels) to bringthem into alignment with the first set, then combinedall of the aligned data together into a single high signal-to-noise spectrum for each targeted position. There aretwo sets of combined spectra for Spur positions 1 and 2(effective integration time of 1200 s for SL1/SL2 and 2400s for LL1/LL2). We produced a combined uncertaintyimage for each data set by taking the root sum square ofthe individual bcd uncertainty images, then dividing thefinal uncertainty image by the square root of the totalnumber of frames. The combined bad pixel masks wereproduced by adding the individual bad pixel masks foreach bcd. After creating the final combined images weextracted one-dimensional spectra using SPICE7 v1.4.1.
Due to the extended nature of the targeted emissionin G292.0+1.8 , the extraction and flux calibration ofspectra required additional processing. The spectral ex-traction performed by the pipeline is optimized for pointsources, with the extraction aperture expanding in the
3
spatial dimension at longer wavelengths to account forwidening of the instrumental PSF. The SNR emission inG292.0+1.8 , however, is spatially extended. If the emis-sion is assumed to be uniform (admittedly a crude as-sumption for G292.0+1.8 ), then the emission gains fromoutside the extraction aperture compensate for lossesat longer wavelengths, and the tapered extraction per-formed by the SPICE pipeline must be undone. Thisis accomplished by measuring the aperture loss correc-tion function and the slit loss correction function for thespectrum and, multiplying these functions by the objectspectrum. The correction factors have been calculated asa function of wavelength for each IRS module by Tappe,Reach & Rho (2006) from simulations of the SpitzerPSF. These simulations indicate that the correction fac-tors vary between 0.6 and 0.8 over the full wavelengthrange covered by the two modules. The final correctionincludes division of the correction factors by the angulararea covered by the extraction aperture. Multiplicationof this final correction by a spectrum extracted in SPICE(units of Jy) gives a spectrum in units of Jy sr−1.
To obtain spectra of features in G292.0+1.8 we uti-lized the default extraction window used by SPICE forpoint source extraction to obtain spectra in units of Jy.We then multiplied these spectra by the extended sourcecorrection function described above to obtain spectra insurface brightness units (here W m−2 s−1 µm−1). Af-ter extraction in SPICE we loaded the resulting spectrainto the SMART8 application (Higdon et al. 2004) foranalysis and post-processing.
3. ANALYSIS
3.1. DETECTED FEATURES
We performed spectral extractions from the upper andlower portions of the Spur as shown in Figure 2, corre-sponding to positions 1 and 2 listed in Table 1. Of thedata taken in the four low resolution modules, all but theSL2 module (5.2-7.7 µm) exhibit emission from eitherthe SNR, its surrounding H II region, or both. The com-bined, cleaned two-dimensional spectra are shown in Fig-ures 3 and 4 without background subtraction. In thesetwo-dimensional spectra, we detect atomic line emissionfrom the following transitions: [Ne II] λ12.8, [Ne III]λ15.6, [S III] λ18.7, [O IV] λ25.9, [S III] λ33.6 and [Si II]λ34.8. Less obvious in the two-dimensional spectra is[Ne V] λ24.3, which is detected at the 15σ and 23σ levelsin the sky-subtracted, one-dimensional spectra of Spur1and Spur2 (respectively). A faint, diffuse emission fea-ture is detected at 11.3 µm, consistent with a knownpolycyclic aromatic hydrocarbon (PAH) feature at thatwavelength (Allamandola, Tielens, & Barker 1989). Acontinuum, rising toward longer wavelengths, is detectednear the center of the LL1 and LL2 slits, consistent withdust emission from localized clumps of material.
Because our lines of sight pass well inside the pro-jected edge of the SNR, the features detected in theIRS spectra of G292.0+1.8 arise from a combinationof line/continuum emission from photoionized gas, ra-diative shocks in ejecta, and non-radiative shocks inthe lower density circumstellar medium/ISM around theSNR. Although the gas phase component of the firsttwo features can be traced at optical wavelengths viatheir forbidden line emission, the gas in the latter fea-ture is very hot (106-108 K) and ionized, and is only de-
tectable at X-ray wavelengths. On the other hand, theheated dust component in photoionized regions, radiativeshocks, and non-radiative shocks can produce continuumemission in the mid-infrared band (Tielens & Hollenbach1985; Vancura et al. 1994). Therefore, a careful com-parison of the spatial information in the IRS spectra tothe X-ray and optical images is critical for the identifica-tion and interpretation of mid-infrared features detectedin Figures 3 and 4. As we show below, the dust contin-uum observed from structures in the IRS slit can all beattributed to the belt-like structure of circumstellar ma-terial observed in the Einstein (Tuohy, Burton & Clark1982) and Chandra (Park et al. 2002, 2004, 2007) X-rayimagery of the OSNR.
There is significant structure evident along the slit inthe lines of [Ne II] λ12.8, [Ne III] λ15.6 and [O IV] λ25.9,and the emission from these lines rises sharply at the po-sition of the ejecta in each of the spectra. These proper-ties indicate strong emission from the Spur (ejecta) in Oand Ne. On the other hand, the [S III] and [Si II] emis-sion is relatively uniform and appears to fill the length ofthe slit, suggesting an association with the photoionizedH II region surrounding G292.0+1.8 (this can be seenas the region of enhanced diffuse emission near the Spurin Figure 1). The emission at λ25.9 may in principle bedue to either of [O IV] or [Fe II]. These two spectral linescannot be resolved from one another at the spectral res-olution of the LL module, but given the high ionizationpotential of O2+ (54.9) eV it is likely that the faint emis-sion seen near 25.9 µm is the [Fe II] λ25.99, while thebright emission detected from the ejecta is [O IV] λ25.9µm. (As we show in the spectral fits described in thenext section, the centroid of the feature near λ25.9 µmis consistent with this line identification.)
In addition to the above emission, there are also dis-crete, diffuse features detected along the full length ofthe LL2 slit between 15 and 20 µm in all the unsub-tracted spectra. The features blend together to form aplateau of emission. Discrete PAH features are detectedat 16.4, 17.4 and 17.8 µm (consistent with photoionizedemission from the overlying H II region) as well as a H2
(0-0) S(1) emission feature at 17.03 µm. The detection ofH2 in particular argues for a contribution to the mid-IRbackground from gas along the line of sight unrelated toG292.0+1.8 .
3.2. SKY VARIABILITY AND SUBTRACTION
One of the main challenges in the interpretation of ourSpitzer spectra of G292.0+1.8 is the characterizationand subtraction of the sky emission from our spectra ofthe O-rich shocks. Since our observations did not includea separate sky exposure, our best option was to measurethe sky emission from the off-object spectral order dur-ing each observation. For example, in LL1 observationstargeting the Spur we extracted sky spectra from theLL2 channel, and vice versa for the LL2 observations.We followed a similar procedure for the SL spectra. Wefound that the Spur position 2 data provided the clean-est regions of sky emission, with the least amount ofcontamination from dust continuum from circumstellarmaterial. We extracted sky spectra from the Spur po-sition 2 data, using the default point source extractionaperture from SPICE as marked in Figure 2. We thenmultiplied the spectra by the extended source correction
4
factors described above to obtain the sky spectrum insurface brightness units.
The most obvious complication in our sky estimationis that each order samples a different section of sky emis-sion (as shown in Figure 2). In the optical, X-ray andnow IRS data of G292.0+1.8 it is clear that the interioremission varies significantly from location to location.For example, it is evident from the [O III] image in Fig-ure 1 that the diffuse photoionized emission surroundingG292.0+1.8 is distributed in a non-uniform manner: aswath of diffuse [O III] emission extending 2′ from theSpur exhibits significantly higher surface brightness thanthe emission immediately to the north where the fast-moving knots (FMKs) are observed (Ghavamian, Hughes& Williams 2005; WL06). More specifically, the [O III]surface brightness at the position where LL2 sky emis-sion is sampled (Figure 2) is ∼70% lower than the dif-fuse [O III] emission immediately surrounding the Spur,while the [O III] sky emission sampled in the LL1 spec-trum is ∼20% fainter than the diffuse emission aroundthe Spur. These differences likely correspond to eithervariations in the density of the photoionized mediumaround G292.0+1.8 , or an enhancement in the flux ofUV radiation near the O-rich ejecta on the eastern sideof the SNR, or some combination of both.
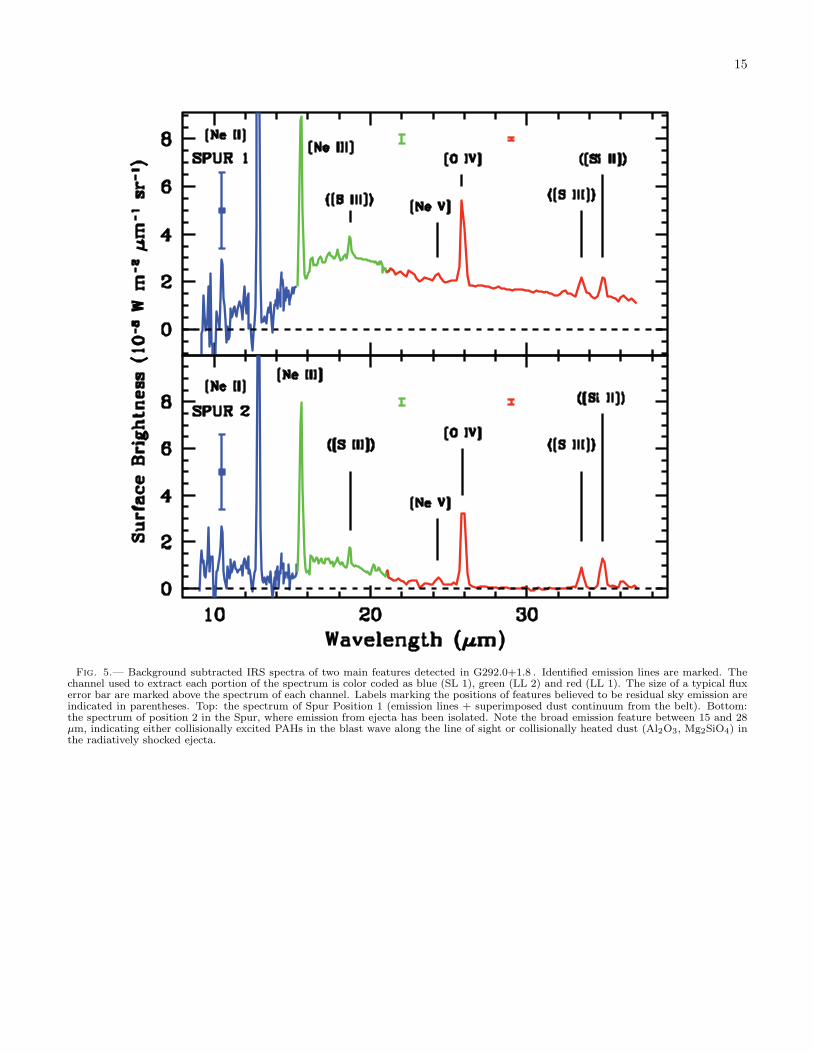
Given the comparative faintness of the diffuse [O III]emission in the sky slits relative to the emission imme-diately surrounding the Spur, we can expect the mid-IRsky lines to also be intrinsically fainter than those closeto the Spur. This results in under-subtraction of the lineemission from the mid-IR spectra of the Spur, an effectwhich is clearly seen in the extracted spectra from bothpositions in the Spur (Figure 5). Specifically, the faint[S III] λλ18.7,33.6 and [Si II] λ34.8 line emission in thespectra are likely residuals from incomplete sky subtrac-tion.
To extract the spectrum of Spur Position 1 we firstobtained a spectrum from the center of the slit, where astrip of enhanced line and continuum emission is seen inthe two-dimensional LL1 and LL2 spectra (see Figure 3).We then subtracted the IRS sky spectrum obtained fromthe SL1, LL2 and LL1 apertures marked in Figure 2 toobtain the final spectrum. The line and continuum emis-sion in the Position 1 spectrum appear to arise from thesame source (Figure 3), suggesting at first that we mayhave detected dust emission from radiative shocks in theSpur. However, upon overlaying the IRS slit positionsonto the [O III] and Chandra images of G292.0+1.8 itbecomes clear that the situation is more complex. Theextracted region coincides with both the circumstellarbelt (seen in the Chandra image in Figure 2) and the ra-diative O-rich shocks in the Spur. It is unclear which ofthese structures generates the observed continuum. Atmid-IR wavelengths the non-radiative shocks in the cir-cumstellar belt are likely to produce strong continuumemission from shocked circumstellar/ISM dust. On theother hand, O-rich ejecta in the Spur are expected toproduce strong line emission in the mid-IR. However, dothey also contribute dust continuum emission? With thegiven geometric projection of the Spur onto the circum-stellar belt it is difficult to answer this question.
The answer to the above question may be found byinspection of the two-dimensional spectrum of Position2 (Figure 4). There, the radiatively shocked ejecta in
the Spur (as detected in the LL1/LL2 observations) canbe isolated spatially from the circumstellar X-ray belt,allowing us to better isolate emission from the two com-ponents. From Figure 4 it is clear that at the top of theIRS slit the radiative O-rich shocks of the Spur (distin-guished by strong [O IV] λ25.9 and [Ne III] λ15.6 emis-sion) are seen in projection on the circumstellar belt.Toward the bottom of the slit the two components sepa-rate spatially from one another, revealing that the Spuris dominated in the mid-IR by line emission. There isno clear dust continuum detected from the Spur. Ex-tracting a spectrum from the continuum-free portion ofthe Spur in Figure 4 and subtracting the same sky spec-trum used for obtaining the spectrum of Position 1, weobtained the spectrum for Position 2 shown in the lowerpanel of Figure 5. Save for the emission bump between15 and 28 µm, the sky-subtracted spectrum of Position2 shows no obvious underlying continuum. The residual15-28 µm bump indicates excess emission from this fea-ture at the location of the Spur (we defer discussion ofthis feature to Section 5). In Table 2, we present mea-surements of the emission line surface brightnesses andvelocities as measured from the sky-subtracted data de-scribed above. These line strengths will form the basisof our comparison to shock models described in Section4.
3.3. CIRCUMSTELLAR DUST CONTINUUM
Having separated the emission from the shocked ra-diative ejecta (line-dominated) and the shocked non-radiative circumstellar belt (continuum-dominated), wenow describe the properties of each component. We fo-cus on the continuum from the belt observed in Position1 (Figures 4 and 5). After masking the emission lines inthe Position 1 spectrum we fit the underlying continuumwith a modified blackbody using the SMART applica-tion. We fit two different dust types to the spectrum,one consisting of 0.1 µm silicate grains and one consist-ing of the RV =3.1 grain mix suggested by Weingartner& Draine (2001) for the Milky Way ISM. We obtainedequally good matches from both dust models, althoughthis is most likely due to the substantial flux uncertaintyin the data shortward of 22 A (i.e., SL1 and LL2 data),as well as relative uncertainties in the flux calibrationbetween channels. The fit to the spectrum is primarilydriven by the LL1 channel data, where the flux errors aresmallest. Therefore, aside from excluding a pure graphitecomposition for the dust grains, we cannot place strongconstraints on the relative concentrations of graphite andsilicate grains in the circumstellar belt from our IRS spec-trum of the belt.
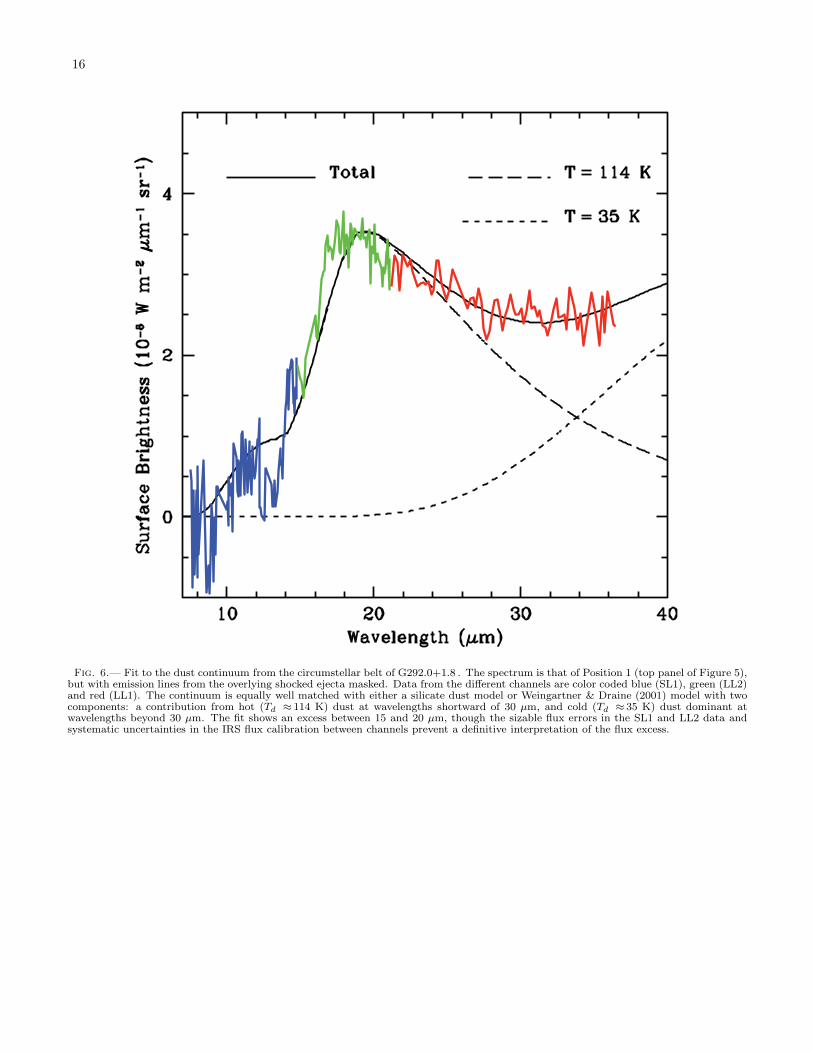
For the overall fit, we found it necessary to use twoblackbody components to fit the spectrum, as shown inFigure 6: (1) a hot component (Td(hot) = 114±5 K forboth assumed compositions) to match the peak in thespectrum near 20 µm, and (2) a cold component to matchthe excess IR continuum longward of 20 µm (Figure 6),with Td(cold)=38±6 K for a pure 0.1 µm silicate distri-bution or Td(cold)=34±8 K for a Weingartner & Draine(2001) distribution. While the error bars on the coldcomponent from SMART are fairly small, the fact thatonly the tail of this component lies in the observed rangemeans that there is significant uncertainty in the char-acteristics of this component. However, clearly the pres-
5
ence of a cold component is indicated in our continuumfit shown in Figure 6.
From our dust model fits to the spectrum, we obtaina hot dust mass of (1.7±0.6)×10−3 M⊙ and a cold dustmass of 3.1±1.4 M⊙ for both a Weingartner & Draine(2001) and 0.1 µm silicate dust composition. The largedust mass obtained for the cold component is very sensi-tive to the temperature of this component, which is itselfvery uncertain. MIPS 70 µm imagery just obtained inour Cycle 4 Spitzer program will better elucidate thecharacteristics of this component.
The temperature of the hot component and its closespatial correlation with the belt seen in the Chandraimages strongly suggests that the continuum emissionshortward of 20 µm arises from circumstellar dust over-run by the blast wave of G292.0+1.8 . The need for twograin temperatures indicates that there are either twodifferent types of grains present within the shocked cir-cumstellar belt, or that the same species of grains existat two distinct temperatures. Assuming the latter, alongwith the fact that the temperature of the cold componentlikely exceeds the temperature of 15-20 K expected fromdust grains in an average interstellar radiation field (Li& Draine 2001), then the two dust components can beattributed to two processes: collisional heating of grainsbehind the non-radiative shocks in the belt (hot compo-nent) and the heating of preshock grains by FUV radia-tion from the radiative precursor in the belt (cold compo-nent). The presence of faint [O III] λλ4959,5007 from thecircumstellar belt in G292.0+1.8 (Ghavamian, Hughes,& Williams 2005) suggests that the shocks are becomingradiative there. In that case, FUV radiation produced inthe partially formed cooling zone may be strong enoughto heat the preshock dust in the belt up to ∼30 K.
3.4. KINEMATIC PROPERTIES
An interesting feature in our Spitzer spectra is thevarying shape of the [Ne II] λ12.8 line along the spatiallength of the IRS slit. Tracing the shape of the [Ne II] linefrom the top of the SL slit down to its bottom, we canclearly distinguish an S-shaped variation in the shapeof the line profile. This pattern can be seen at bothobserved positions in the Spur (Figures 3 and 4). Thispattern is not seen in the [Ne II] sky emission, implyingthat we are resolving velocity structure (bulk Dopplermotions) in the shocked ejecta.
We searched for a velocity shift in the centroid of the[Ne II] emission between the two ends of the slit in SpurPosition. We utilized a point source aperture extractionbox to obtain two spectra, one from each end of the 38′′
overlap region between the two SL 1 nods (these corre-spond to the top and bottom ends of the two-dimensionalspectrum seen in Figure 3). After subtracting the skyemission from the two spectra, we fit the [Ne II] λ12.8line profiles. Although our fits to the line did not re-veal any additional broadening beyond the instrumen-tal resolution (3000 km s−1 at 12.8 µm, or R≈ 100),we did detect a variation in the velocity centroid of the[Ne II] λ12.8 line: at the top (eastern) end of the slitthe [Ne II] λ12.8 velocity is blueshifted to a heliocentricvelocity of −73±24 km s−1 , while at the bottom (west-ern) end of the slit the line is redshifted to a velocityof +290±13 km s−1 . This result indicates that a veloc-ity gradient of ∼365 kms−1 exists in the Ne-rich ejecta
of the Spur, consistent with results from [O III] λ5007Fabry-Perot studies of the O-rich ejecta (Ghavamian,Hughes, & Williams 2005).
4. SHOCK MODELS
The presence of high ionization lines such as [O IV]λ25.9 and [Ne V] λ24.3 in the IRS spectra (Figure 5) sug-gests that the mid-IR emission from the Spur arises eitherpartially or entirely from radiative shock excitation. Tomodel the spectra we utilized the Raymond & Cox (1985)numerical shock code to predict line emission from radia-tive shocks in the metal-rich ejecta of G292.0+1.8 . Theversion of the code that we used has been modified tohandle the enormous cooling rates found in metal-richplasmas. As noted in earlier studies of metal-rich shocks(Itoh 1981a, 1981b, 1986; Dopita, Binette & Tuohy 1984;Sutherland & Dopita 1995; Blair et al. 2000) the ra-diative cooling time behind a shock driven into super-nova ejecta is much shorter than the recombination timebehind a shock propagating into a normal abundancemedium. As a result, the electrons radiate away theirenergy rapidly within a thin (∼1013-1014 cm) layer be-hind the shock, reducing the temperatures to ∼100 Kbefore the plasma can fully recombine. Overall theseproperties mean that the lack of ionization equilibriumfound even in radiative shocks in cosmic abundance gasis much more pronounced in metal-rich plasmas.
To model the line emission from G292.0+1.8 we cre-ated grids in shock parameter space, utilizing the sameversion of the Raymond-Cox shock code used by Blairet al. (2000) to model the optical and UV emissionfrom the O-rich ejecta in N132D and E0102−72.3. Thatversion of the code calculates the time steps behind theshock more carefully than the cosmic abundance ver-sion, providing more accurate predictions of the tem-perature, ionization state, and compression in metal-richshocks. The modified code also includes a calculationof the charge exchange reaction O++ + O0 → 2 O+, nec-essary for accurate estimation of the oxygen ionizationfractions.
4.1. INPUT PARAMETERS AND MODEL SETUP
We have combined both the fluxes of mid-IR emissionlines (Table 2) and optical line fluxes measured in theSpur by WL06 to provide the best constraints on thephysical conditions in the shocked ejecta. The opticalslit position of WL06 runs E-W along the top of theSpur, nearly perpendicular to the IRS slit location inSpur Position 1 (Figure 1) of our Spitzer observations.From East to West, the optical slit runs first throughlow density S-rich ejecta (labeled Filament 1E by WL06)and then higher density O-rich ejecta (labeled Filament1W by WL06). Filament 1W exhibits optical emissionlines of O, Ne and S and matches the location of SpurPosition 1. Thus, we focus our modeling efforts on theoptical and mid-IR spectra of Spur Position 1/Filament1W.
We constructed a grid of shock models assuming con-servation of ram pressure (n v2
S =const.) between the ra-diatively shocked ejecta and the hot non-radiative plasmabehind the reverse shock. To gauge the ram pressurewe examined the density-sensitive optical ratio of [S II]6716/6731 in the radiatively shocked ejecta. For Fila-ment 1W, WL06 found a [S II] 6716/6731 ratio of 1.16,
6
indicating that the bulk of the [S II] emission arises fromthe postshock region where ne ∼ 300 cm−3. On theother hand, they found that the temperature-sensitiveratio [O III] (4959+5007)/4363 is approximately 17 (in-dicating an average electron temperature ∼42,000 K andconfirming that the [O III] emission is primarily shockexcited). These two results limit the range of possi-ble preshock densities and radiative shock speeds in theSpur, suggesting that preshock densities ∼0.5-10 cm−3
and shock speeds ∼20-200 km s−1 would be appropri-ate.
The main goals of comparing our model predictionsto the Spitzer observations are to determine whetherthe X-ray derived abundances are allowed by the opti-cal/IR data and to determine whether additional abun-dance constraints can be imposed from our IRS spectra.Park et al. (2004) measured mass ratios for O, Ne, Mgand Si in four different ejecta knots. Save for one ejectafeature in the NW (labeled ’Region 5’ in their paper),the ejecta abundances in the other three ejecta knotsare roughly consistent with one another. We have av-eraged the mass ratios for these four knots (ratios fromTable 2 of Park et al. 2004) to obtain an estimate ofthe relative abundances in the radiative shocks in theSpur. From these ratios we estimated input abundances(by number) as a starting point for our models, obtain-ing O:Ne:Mg:Si = 16.0:15.52:14.74:13.97. Park et al.(2002, 2004) noted that they did not detect clear X-rayemission from elements heavier than Si in the ejecta ofG292.0+1.8 . Except for the S abundance, which can beconstrained from the optical spectra of WL06, the abun-dances of heavier elements in the ejecta of G292.0+1.8such as Ar, Ca and Fe, remain unknown. The absenceof Ar lines ([Ar II] λ6.99, [Ar III] λ8.99) and Fe lines(such as [Fe II] λ5.33, λ25.99 and [Fe III] λ17.9) in ourIRS spectra indicates a very low concentration of theseelements in the Spur. The optical spectra also show noemission from these metals. Similarly the abundance ofcarbon, a significant constituent of the ejecta, is unknownbecause the UV emission lines from C are inaccessibledue to the high extinction. In the absence of constraintson the abundances of C, Ar, Ca and Fe, we excludedthese elements from the shock models.
The dependence of the optical and mid-IR fluxes onshock speed and preshock density must be constrainedas well. We normalized the ram pressure constraintn v2
S =5000 cm−3 km2 s−2 by taking n =0.5 cm−3 atvS =100 km s−1 . The corresponding ram pressure isapproximately 1.5×10⁻⁹ dyn cm−2, comparable to thepressure of 5.9×10⁻⁹ dyn cm−2 estimated by Hugheset al. (2002) for an X-ray ejecta knot located just southof PSR J1124−5916 in G292.0+1.8 . With our rampressure condition we ran a grid of shock models with in-tervals vS = (20,30,40,50,60,80,100,120,130,160,180,200)km s−1 and corresponding densities n =(12.5,5.5,3.1,2.0,1.4,0.8,0.50.35,0.25,0.2,0.15,0.13) cm−3.
A number of other parameters must be set in themodels. We assumed photoionization equilibrium inthe preshock gas, i.e., we self-consistently calculated thepreshock ionization state of the ejecta by using the ra-diation output of the postshock gas. The degree ofelectron-ion temperature equilibration at the shock frontis another free parameter. For our models, we set
Te/Ti = 0.05. The models follow the rise in temperaturebehind the shock by Coulomb collisions and terminatethe downstream calculation when the gas had cooled to300 K.9 Finally, following Blair et al. (2000) we setthe value of the magnetic parameter B / n1/2 = 0.1 µGcm3/2.
Inspection of the model grid is instructive. For theadopted ejecta abundances and initial temperature equi-libration the slowest shocks (.40 km s−1 ) produce strong[Ne II] λ12.8 and [Si II] λ34.8 in the mid-IR, and [S II]λλ6716, 6731 emission in the optical. In these cases theFUV radiation leaking upstream from the postshock flowproduces little preshock ionization. Even after the gascrosses the shock the electron temperature is not highenough in these slow shocks to ionize the gas far be-yond the second ionization stage. This allows ions likeNe+, Si+ and S+ to survive throughout the shock. Athigher shock speeds, collisional ionization becomes moreefficient. The mid-IR line emission becomes less sensi-tive to the preshock ionization state of the gas. Emissionfrom higher ionization stages dominates, with lines suchas [Ne III] λλ15.5, 36.0 and [S IV] λ10.5 reaching theirpeak around vS = 80 km s−1 and [O IV] λ25.9 reachinga peak around 120 km s−1 . The fastest shocks (&150kms−1 ) are required to produce [Ne V] λ24.3 emission.
4.2. COMPARISON OF MODELING RESULTS TOOBSERVATIONS
Judging by the IRS spectra of the Spur (Figures 3, 4and 5; Table 2) a wide range in shock speeds is appar-ently needed to simultaneously make the [Ne II] λ12.8lines stronger than the [Ne III] λ15.5 lines (implyingvS .40 km s−1 ) and produce detectable [Ne V] λ24.3and [O IV] λ25.9 lines. Following the treatment of Van-cura et al. (1992) and Blair et al. (2000), we modelthe mid-IR line emission by summing fluxes from theshock model grid between 20 km s−1 and 200 km s−1
with a weighting term (vS / 200)−α. The power lawindex α is a free parameter which can be adjusted toprovide the best match with observed flux ratios. Al-though α does not have a rigorous physical definition, itmay be interpreted as a measure of the preshock densitydistribution within the ejecta. A steep value of α empha-sizes the slowest shocks and may reflect a small range ofdensity contrasts within a clump of ejecta. A shallowerindex, on the other hand, would allow greater flux contri-butions from the intermediate and fast shocks, possiblyreflecting a wider range of density contrasts within theshocked ejecta. Fitting the emission line ratios are thusfunctions of both the relative abundances and power lawindex. We estimated α by tracking relative fluxes fromdifferent ionization stages of the same element, here the[Ne II](12.8):[Ne III](15.5):[Ne V](24.3) and [O III](4959+ 5007)/[O III](4363) ratios, before then varying relativeabundances.
We combined the grid of models describedabove using various values of α. We found thatα =2.5 best matched the Spur Positions 1 and 2[Ne II](12.8):[Ne III](15.5):[Ne V](24.3) line ratios(Model A in Table 3). This index is considerablysteeper than that obtained by Blair et al. (2000)in modeling the radiatively shocked O-rich ejecta inN132D (α =0.4) and E0102−72.3 (α =0.5). However,
7
it is nearly identical to the index of 2.3 estimatedby Vancura et al. (1992) in their analysis of UVspectra from shocked interstellar clouds in the SNR N49.As discussed above, the steep index strongly weightsthe emission from the slowest shocks, as necessary toproduce [Ne II](12.8)/[Ne III](15.5) ratios exceedingunity.
The overall agreement between the α=2.5 model gridand the observed optical and mid-IR flux ratios for SpurPosition 1 is reasonable (Table 3). Given the similar-ity between the mid-IR line ratios of Positions 1 and2, the models essentially match the spectra from bothpositions. The X-ray estimate of the O:Ne:Mg:Si ra-tios from Park et al. (2004) were able to match boththe optical and mid-IR optical line ratios. Our modelsreproduce the optical line ratios of [S II] and [Ne III]relative to [O III] very well for Spur Position 1, andclosely match the ratios of the brightest lines in theSpitzer bandpass − [Ne II], [Ne III] and [O IV]. Themodeled [Ne II](12.8)/[Ne III](15.5) ratio for Spur Posi-tion 2 is ∼20% smaller than the observed value. Otherimportant ratios such as [Ne III](15.5)/[O IV](25.9) and[Ne III](15.5)/[Ne V](24.3) are more closely matchedby the models, though they are underpredicted as well(∼15%). We found that by slightly steepening the in-dex α from 2.5 to 2.7 (i.e., by increasing the contribu-tion from slower, denser shocks to the integrated mid-IRspectrum) we obtained [Ne II](12.8)/[Ne III](15.5)≈2.5,matching the observed value of 2.7±0.24 in Position 2,while making [Ne III](15.5)/[O IV](25.9)≈ 1.5, roughlyconsistent with the observed value of 1.35±0.12. Therewas minimal change in the other ratios. The steeper in-dex for Position 2 is consistent with an ejecta distributionthat is on average slightly denser and clumpier.
As can be seen in Table 3, there are also significantdiscrepancies between the observed and predicted opti-cal ratios of [O III]/[O II] and [O III]/[O I] for Position1. In Model A the former ratio is underpredicted by afactor of 2, while the latter is overpredicted by an orderof magnitude. As noted by Itoh (1981a, 1986) and Blairet al. (2000) the difficulty in matching the [O I] opti-cal fluxes is a well known shortcoming of existing modelsof radiative shocks in metal-rich ejecta. The difficultyis due to the fact that very little of the oxygen-rich gasbehind the shock has recombined to O I before the post-shock temperature drops below 1000 K. This problemmay be partially solved by extending the range of shockspeeds down to 10 kms−1 . This modification adds more[O I] emission, thereby reducing the [O III]/[O I] ratioas needed. However, it also significantly increases the[O II] emission, worsening the disagreement between theobserved and modeled [O III]/[O II] ratios. Therefore,adding slower shocks does not entirely solve the line ra-tio problem. Additional steps such as increasing the as-sumed ratio Te/Ti at the shock front can further alle-viate the problem (see Model B in Table 3). However,this creates disagreement with other line ratios such as[Ne II]/[Ne III] and [Ne III]/[O IV] in the mid-IR. Lastly,our models ignore the contribution of photoionized un-shocked ejecta clumps to the optical and mid-IR spectraof the O-rich knots. Without a detailed calculation (be-yond the scope of this paper) the contribution of suchclumps to the spectra of O-rich knots in G292.0+1.8 isuncertain. Taken together, all these difficulties illustrate
the sensitivity of the modeled spectra to the input shockparameters. They remind us that such parameters asthe mass ratios of heavy elements, ejecta densities andrange of shock speeds obtained from our models must beinterpreted with caution.
As a consistency check we compared the surface bright-ness of [O IV] λ25.9 predicted by Model A (Table 3)with the observationally determined value at Position 1of the Spur. Summing the fluxes from the plane par-allel models and using the power law weighting in ve-locity described above, we obtained a predicted [O IV]λ25.9 flux of I25.9([O IV])= 2.4×10⁻⁵ ergs cm−2 s−1
sr−1 , roughly twice the observed value (Table 2). Givenour admittedly ad hoc use of a power law velocity dis-tribution in calculating the total fluxes and the modeluncertainties described above, we consider this to be areasonable agreement between the modeled and observed[O IV] λ25.9 surface brightnesses.
We have also compared the surface brightness of [O III]λ5007 predicted by the models with the value observedin the optical by WL06. Using the surface brightness ofFilament 1W quoted by WL06 and applying an extinc-tion correction using the relations of Fitzpatrick (1999),we obtained a dereddened surface brightness I5007 =4.6×10⁻⁴ ergs cm−2 s−1 sr−1 . Assuming that this num-ber is representative of the Spur emission sampled atPosition 1 in our IRS spectra, we summed the emissionfrom our plane parallel shock models assuming the powerlaw velocity distribution and obtained a predicted surfacebrightness I5007 = 1.6×10⁻³ ergs cm−2 s−1 sr−1 . Thisresult is also larger than the observed value (by a factor∼3). Some of this difference may be ascribed to an over-estimate of the ejecta density by our model scaling, or itmay be attributed to the uncertainty in extinction cor-rection, which ranges from a factor of 6.7 to 17.9 over therange in E(B − V )= 0.6 to 0.9 (again assuming a Fitz-patrick (1999) extinction law). However, we consider theoverall agreement between the observed and predicted[O III] fluxes to be reasonable.
Although sulfur line emission has not been detectedfrom the ejecta of G292.0+1.8 at X-ray wavelengths(Park et al. 2002, 2004), we were able to estimate orplace limits on the abundance of this element from ourjoint mid-IR/optical spectral analysis. Starting from theaveraged relative abundances of O, Ne and Si obtainedfrom Park et al. (2004), we progressively increased the Sabundance in the models until we matched the observed[S II]/[O III] flux ratio in the optical. We obtained aS abundance of 14.0 dex, with higher values producingunacceptably high [S II]/[O III] ratios and resulting inenough collisional de-excitation of [S II] λ6716 to reducethe [S II] λ6716/λ6731 ratio below unity. However, oneremaining discrepancy is that our models predict a [S III]λ18.7 flux that exceeds the upper limit on emission fromthat line in both IRS spectra of the Spur (Model A inTable 3). The reason for the disagreement is unclear, butit could be ascribed to uncertainties in scaling betweenthe optical and Spitzer apertures and the uncertain cor-rection for strong photoionized [S III] along the IRS slit.
Turning to the abundances of magnesium and sili-con, we find that the abundance of the former is un-constrained by our observations, since the [Mg V] λ5.6line is predicted by our models to lie nearly an orderof magnitude below the detection threshold at all shock
8
speeds. Therefore, we left the Mg abundance at the av-erage X-ray value of 14.74. On the other hand, we wereable to constrain the relative silicon abundance in theSpur under the assumption that the [Si II] λ34.8 emis-sion in the IRS spectra is produced by radiative shocks(rather than being the result of incomplete backgroundsubtraction). We increased the abundance of Si in ourshock models (Model A) until we reached a Si abundanceof 14.4 dex, above which the [Ne III] λ15.5 / [Si II] λ34.8ratio dropped below the observed upper limit of 2.7 inSpur Position 1. Therefore, we estimate the upper limiton the Si abundance to be 14.4 in Position 1 of the Spur,corresponding to MO/MSi & 23.
5. DISCUSSION
5.1. DUST EMISSION
The mid-IR spectrum of the radiatively shocked O-richejecta in G292.0+1.8 (e.g., the lower panel in Figure 5)exhibits a faint, localized bump of emission between 15µm and 28 µm. This contrasts strongly with the situ-ation in Cas A, where recent Spitzer IRS observations(Rho et al. 2008) have revealed continuum emissionfrom the ejecta extending across the IRS bandpass. The19−23 µm continuum maps of Cas A obtained with IRSshow a strong correlation between the spatial distribu-tion of emitting dust and that of ejecta-line emissionfrom [Ar II] λ 6.99, [Ne II] λ12.8 and [O IV] λ25.9. Thisstrongly suggests that the dust observed in the mid-IRhas condensed within the dense ejecta in Cas A (Rhoet al. 2008). This clearly differs from the Spur inG292.0+1.8 , where, despite the presence of strong Neand O line emission, the only feature resembling a con-tinuum is the broad emission bump between 15 and 28µm. Summing the emission under the bump and exclud-ing emission lines, the surface brightness of the bump is≈ 7.4×10⁻⁸ W m−2 sr−1. If we adopt the this value as ameasure of the dust continuum in G292.0+1.8 , then weestimate a line to continuum ratio ∼1 in the mid-IR forthe O-rich shocks in the Spur.
The efficiency of dust formation in supernova ejectaand the variables that control it are currently not wellknown. One source of uncertainty is the condensationefficiency of grains in the SN ejecta. While theoreticalmodels based on classical nucleation theory predict that0.1-0.3 M⊙ of dust forms per SN (Kozasa, Hasegawa, &Nomoto 1991; Todini & Ferrara 2001), infrared observa-tions have turned up significantly lower dust mass esti-mates in the ejecta of observed SNe. For example, Sug-erman et al. (2006) estimated that ∼0.02 M⊙ of dusthad formed in the ejecta of SN 2003gd (although eventhis low number has been disputed; see Meikle et al.2007). The 0.02-0.05 M⊙ of dust inferred to exist in theradiatively shocked ejecta of Cas A lies closer to (butstill falls short of) the theoretically predicted value. Ifthe ejecta dust in Cas A and G292.0+1.8 are of com-parable temperature and composition, then the lack ofa broad-band dust continuum in the mid-IR spectra ofthe latter might reflect a lower condensation efficiency inthat OSNR.
The lack of strong dust continuum observed in the Spurof G292.0+1.8 may be similar to what was observed byTappe et al. (2006) in the O-rich ejecta of N132D inthe Large Magellanic Cloud. Their IRS spectrum, whichcovered only the LL channel between 14 µm and 40 µm,
exhibits strong [Ne III] λ15.5 and [O IV] λ 25.9 lines,similar to the ejecta in G292.0+1.8 . There is broad-band continuum emission present in the N132D spec-trum. However, given that Tappe et al. (2006) utilizedbackground regions lying outside the shell of N132D andthat the ejecta are located near the center of this OSNR,it is likely that the continuum emission detected in theejecta spectrum of N132D is actually overlying dust con-tinuum from shocked interstellar material along the lineof sight. If this is correct, then the line to continuumratio of the ejecta knot in N132D may be similar that ofthe Spur in G292.0+1.8 .
A further parallel may be drawn between N132D andG292.0+1.8 using the HST FOS observations of N132Dby Blair et al. (2000). The optical and UV spectrumof the ejecta feature labeled N132D-P3 by Blair et al.(2000) was found to have mass ratios of MO/MNe ≈ 4.5and MO/MSi ≈ 50. These are very similar to the val-ues we derived for the Spur. Blair et al. (2000) foundthat a low ram pressure, with n = 1 cm−3 at vS =100kms−1 was needed to reproduce the UV and optical lineratios in the ejecta spectrum of N132D-P3, along withshock speeds in the range of 30 km s−1 to 160 km s−1 .These are again very similar to the conditions we foundwere needed to reproduce the mid-IR and optical spec-tra of the Spur, though the velocity index α is only 0.4in N132D, considerably less steep than the value of 2.5found for the Spur. Altogether it appears likely thatN132D and G292.0+1.8 are currently in similar stagesof evolution, with the O-rich ejecta having expanded torelatively low density and the reverse shocks having pen-etrated mostly the outermost ejecta formed during thehydrostatic evolution of the progenitor.
5.2. THE ORIGIN OF THE 15-28 µm BUMP
In both spectra of the Spur (Figure 5) there is a broadfeature that peaks near 17 µm, then declines until it dis-appears near 28 µm. The feature resembles o the 15-20µm bump observed in the southeastern rim of N132D byTappe et al. (2006; see Figure 6 in that paper). Tappeet al. (2006) attributed the bump to in- and out-of-planebending modes of the PAH C-C-C molecule, and sug-gested that the PAH emission from the southeastern rimof N132D is generated by collisional excitation behindthe blast wave. The smallest PAHs are preferentially de-stroyed behind the shock, leaving the largest moleculesde-hydrogenated in the form of large (&104) clusters ofcarbon atoms. Since the smaller PAHs are responsiblefor the emission at 6.2, 7.7, 8.7 and 11.3 µm, the de-struction of these molecules leaves the observed strongenhancement in the 15-20 µm / 11.3 µm flux ratio (∼7)in N132D.
Recently Sandstrom et al. (2008) observed the OSNRE0102−72.3 with IRS and found a very similar emissionbump in the spectrum of the radiatively shocked O-richejecta of that remnant. The bump in their spectrumextends out close to 30 µm, much like the feature de-tected in G292.0+1.8 . The bump is prominent in thesame spectra of E0102−72.3 that show the same emissionlines from the radiatively shocked ejecta of E0102−72.3as we observe in G292.0+1.8 ([O IV], [Ne II], [Ne III] and[Ne V]). Instead of PAHs, Sandstrom et al. interpretedthe bump as mid-IR emission arising from hot (∼180 K)forsterite dust (Mg2SiO4) created within the SN ejecta.
9
Dust formation models (Nozawa et al. 2003) predictthat Al2O3 and Mg2SiO4 should form within 450 daysafter the SN explosion in region containing C-burningproducts of the O-Mg-Si layer in the outer portions of thestar. If this is correct explanation for the dust in the O-rich ejecta of G292.0+1.8 should reflect the compositionof the C-burning (hydrostatic) layers of the progenitorstar.
Which of these suggestions is more likely to apply tothe feature seen in G292.0+1.8? Observationally, theshape of the bump in G292.0+1.8 resembles that ofE0102−72.3 more than N132D. The bump in the Spur 2spectrum is considerably broader, extending well beyond20 µm. In contrast, the feature in the N132D spectrumis well confined between 15 and 20 µm. Furthermore, thesky-subtracted Spur 2 spectrum lacks the correspondingbending mode PAH features at 6.2, 7.7, 8.7 and 11.3 µm(the wavelength of the feature seen in the SL1 spectrumof Spur 2 is actually located at 10.5 µm (the wavelengthof [S IV]) but is a statistically insignificant (≈1.5σ detec-tion). If the Spur 2 bump is produced by dehydrogenatedPAHs, then the 15-20 µm / 11.3 µm ratio would haveto be significantly larger (&30) in G292.0+1.8 than inN132D. Such a large ratio may be be physically possi-ble (if nearly all of the smaller PAH molecules have beendestroyed behind the blast wave), but a more detailedtheoretical calculation is beyond the scope of this paper.
From a more theoretical perspective, PAH emissionis expected in situations where shocks encounter coldmolecular gas since this is where they form. PAHs area fairly plausible explanation in N132D, since the re-gion surrounding N132D contains such a molecular cloud(Tappe et al. 2006). Clearly there is no such molecularmaterial deep within G292.0+1.8 . Therefore, if the 15-28 µm feature observed in the Spur spectra (Figure 5)arises from the excitation of PAH molecules, it wouldhave to originate in the circumstellar medium aroundG292.0+1.8 , which would probably only be feasible if thelines and dust emission arose from physically distinct re-gions. Thus an ejecta dust origin for the 15-28 µm bumpin G292.0+1.8 is a much more appealing interpretation.However, it also must be reconciled with the absence of[Si II] λ34.8 in spectra of the Spur (Table 1). A forsteriteorigin would require that most of the Si in the ejecta bedepleted onto dust grains. In the case of E0102−72.3(where there is similar lack of [Si II]) this requirementwould be less stringent, due to the fact that E0102−72.3is nearly 10 times farther away than G292.0+1.8 andthe IRS observations of the former encompasses a sig-nificantly larger fraction of the O-rich ejecta there thanin the latter. This would increase the possibility thatthe mid-IR line emission and forsterite dust emission inE0102−72.3 arise from different locations, and may relaxthe requirement of Si dust depletion in that OSNR.
6. SUMMARY
We have presented the first mid-infrared spectra ofshocked O-rich ejecta in the Galactic SNR G292.0+1.8 .These observations were obtained with the IRS spectro-graph on Spitzer and targeted the prominent structureknown as ‘the Spur’ on the eastern side of G292.0+1.8 .The only emission lines detected with certainty from theejecta in the 5−40 µm range are those of oxygen ([O IV]λ25.9) and neon ([Ne II] λ12.8, [Ne III] λλ15.5, 36.0 and
[Ne V] λ24.3). While the IRS spectra of the Spur donot show the featureless continuum often associated withdust emission, it does show a broad emission bump lo-calized between 15 and 28 µm. This feature may beproduced by either emission from dehydrogenated PAHsheated in the forward shock of G292.0+1.8 , or it may beproduced by Al2O3 or Mg2SiO4 (forsterite) dust grains inthe radiatively shocked O-rich ejecta. It is similar to thebump seen recently in IRS spectra of radiatively shockedejecta in E0102−72.3 (Sandstrom et al. 2008).
Guided by a range of observed line ratios sensitive totemperature, density, and relative abundances, we wereable to constrain physical conditions in the Spur using agrid of radiative shock models. We calculated the spectrafor radiative shocks with a range of speeds and preshockdensities subject to constant ram pressure constraints.We then weighted the output fluxes with a power law inshock speed to account for the range of density contrastsand shock speeds within the Spur. We found that shockspeeds in the range 20−200 km s−1 , a power law in-dex of −2.5 (preferentially weighting the slowest shocks)and corresponding densities in the range 0.1−12.5 cm−3
were needed to produce the range of low and high ion-ization emission lines observed in the optical and mid-IR. Furthermore, we found that simply by using aver-age relative O:Ne:Si abundances obtained from Chandraspectroscopy of a handful of non-radiative ejecta knotsby Park et al. (2004) we were able to obtain goodoverall matches between our shock models and the ob-served mid-IR and optical line ratios. In the case of sul-fur, which has not been clearly detected in the X-rays,we were able to use the observed optical [S II] λλ6716,6731 emission and the lack of [S IV] λ10.5 emission inthe Spitzer data to estimate its abundance. Our re-sults are O:Ne:Si:S = (16:15.52:13.97:14.2), with an up-per limit of 14.3 on the silicon abundance. These cor-respond to MO/MNe ≈ 3, MO/MSi ≈ 61 (limit >23) andMO/MS ≈ 50. While these numbers are in broad agree-ment with those determined from X-ray observations,they were obtained from shock models which ignore thecontribution of photoionized, unshocked ejecta to the op-tical and mid-IR emission in G292.0+1.8 . More detailedand realistic models will be required to refine these esti-mates.
In addition to the radiative shocks in the O-rich ejecta,we have also detected mid-IR continuum emission fromthe circumstellar belt observed in Chandra X-ray im-ages of G292.0+1.8 (Park et al. 2002; 2004). X-rayanalyses of the belt have indicated that it has abun-dances consistent with cosmic composition and pointto excitation of circumstellar material in non-radiativeshocks. The mid-IR continuum from the belt peaksat 20 µm and can be fit with a two-temperature dustmodel, with Td(hot) ≈ 114 K and Td(cold) ≈ 35 K.The corresponding masses in the two components areMd(hot) ≈ 1.7×10⁻³ M⊙ and Md(cold) ∼ 3.1 M⊙, re-spectively, which we suggest are due to collisional heat-ing of grains behind non-radiative shocks in the belt (hotcomponent) and the heating of preshock grains by FUVradiation from the radiative precursor in the belt (coldcomponent). The continuum is equally well fit with ei-ther a pure 0.1 µm silicate or a Milky Way (Weingartner& Draine 2001) dust model.
This work is based on observations made with the

10
Spitzer Space Telescope, which is operated by the JetPropulsion Laboratory, California Institute of Technol-ogy under a contract with NASA. Support for the workof P. G. was supported by NASA through the SpitzerGuest Observer Program.
6 Developed by J. Ingalls and the Cornell IRS instrumentteam, and distributed by the Spitzer Science Center athttp://ssc.spitzer.caltech.edu/archanaly/contributed/
7 The Spitzer IRS Custom Extraction Softwareis distributed by the Spitzer Science Center athttp://ssc.spitzer.caltech.edu/postbcd/spice.html
8 SMART was developed by the IRS Team at Cornell Universityand is available through the Spitzer Science Center at Caltech.
9 Currently the Raymond-Cox shock code does not includemolecular cooling, which can, in principle, be important forT .1500 K. However, the postshock gas in O-rich shocks may coolrapidly enough to delay molecular formation until the gas reachesaround 300 K.
REFERENCES
Allamandola, L, J., Tielens, A. G. G. M., & Barker, J. R. 1989,ApJS, 71, 733
Bianchi, S., & Schneider, R. 2007, MNRAS, 378, 973Blair, W. P., et al. 2000, ApJ, 537, 667Blair, W. P., et al. 2007, ApJ, 662, 998Braun, R., Goss, W. M., Caswell, J. L., & Roger, R. S. 1986, A&A,
162, 259Camilo, F., et al. 2002, ApJ, 567, L71Chevalier, R. A., & Kirshner, R. P. 1978, ApJ, 219, 931———–, ApJ, 233, 154Chevalier, R. A. 2005, ApJ, 619, 839Dopita, M. A., Tuohy, I. R. & Mathewson, D. S., ApJ, 248, L105Dopita, M. A., Binette, L., & Tuohy, I. R. 1984, ApJ, 282, 142Dwek, E. 1987, ApJ, 322, 812Dwek, E., Foster, S. M. & Vancura, O. 1996, ApJ, 457, 244Ennis, J., et al. 2005, ApJ, 652, 376Fitzpatrick, E. L. 1999, PASP, 111, 63Gaensler, B. M., & Wallace, B. J. 2003, ApJ, 594, 326Ghavamian, P., Hughes, J. P., & Williams, T. B. 2005, ApJ, 635,
365Goss, W. M., Shaver, P. A., Zealey, W. J. Murdin, P., & Clark, D.
H. 1979, MNRAS, 188, 357Hendrick, S. P., Reynolds, S. P., & Borkowski, K. J. 2005, ApJ,
622 L117Higdon, S. J. U., et al. 2004, PASP, 116, 975Houck, J. R., et al. 2004, ApJS, 154, 18Itoh, H. 1981, PASJ, 33, 1—- 1981, PASJ, 33, 521—- 1986, PASJ, 38, 717Kirshner, R. P. & Blair, W. P. 1980, ApJ, 236, 135Kirshner, R. P., Morse, J. A., Winkler, P. F. & Blair, W. P. 1989,
ApJ, 342, 260Kozasa, T., Hasegawa, H., & Nomoto, K. 1991, a, 249, 474Lasker, B. M. 1978, ApJ, 223, 109———–, 1980, ApJ, 237, 765Li, A., & Draine, B. T. 2001, ApJ, 554, 778Meikle, W. P. S., et al. 2007, ApJ, 665, 608
Milisavljevic, D., & Fesen, R. 2008, ApJ, 677, 306Minkowski, R., 1957, IAU Symp. No. 4, Cambridge Univ. Press, p.
107Morse, J. A., Winkler, P. F. & Winkler, AJ, 109, 2104Morse, J. A., et al. AJ, 112, 509Murdin, P., & Clark, D. H. 1979, MNRAS 189, 501Nozawa, T., Kozasa, T., Umeda, H., Maeda, K. & Nomoto, K.
2003, ApJ, 598, 785Park, S., et al. 2002, ApJ, 564, L39Park, S., et al. 2003, ApJ, 598, L95Park, S., et al. 2004, ApJ 602, L33Park, S., et al. 2007, ApJ 670, L121Peeters, E., Mattioda, A. L, Hudgins, D. M., & Allamandola, L. J.
2004, ApJ, 617, L65Reach, W. T., et al. 2006, AJ, 131, 1479Reach, W. T., Rho, J., & Jarrett, T. H., ApJ, 618. 297Rho, J. H., et al. 2008, ApJ, 673, 271Sandstrom, K., Bolatto, A. D., Stanimirovic, S., van Loon, J., &
Smith, J. D. 2008, ApJ, submitted (astroph/0810.2803)Serafimovich, N. I., Lundqvist, P., Shibanov, Yu. A., & Sollerman
, J. 2005, AdSpR, 35, 1106Smith, J. D. T., et al. 2008, ApJ, submitted (astroph/0810.3014)Stanimirovic, S., et al. 2005, ApJ, 532, L103Sugerman, B. S., et al. 2006, Science, 313, 196Sutherland, R. S., & Dopita, M. A. 1995, ApJ, 439, 365Tappe, A., Rho, J., & Reach, W. T. 2006, ApJ, 653, 267Tielens, A. G. G. M., & Hollenbach, D. 1985, ApJ, 291, 722Todini, P., & Ferrara, A. 2001, MNRAS, 325, 726Tuohy, I. R., Burton, W. M. & Clark, D. H. 1982, ApJ, 260, L65Vancura, O., Raymond, J. C., Dwek, E., Blair, W. P., Long, K. S.
& Foster, S. 1994, ApJ, 431, 188Van Kerckhoven, C., et al. 2000, A&A, 357, 1013Weingartner, J. C., & Draine, B. T. 2001, ApJ, 548, 296Williams, B. J., et al. 2006, ApJ, 652, L33Winkler, P. F. & Kirshner, R. P. 1985, ApJ, 299, 981Winkler, P. F., & Long, K. S. 2006, AJ, 132, 360 [WL06]
11
TABLE 1Targeting Parameters for IRS Spectroscopy of the Spur in G292.0+1.8 (IRS Campaign 19)
Position AORa ID αJ2000 δJ2000 PA(◦) (SL) SL Exp. Time (s) PA(◦) (LL) LL Exp. Time (s) Obs. Date
Position 1 11254016 11h24m47.s4 −59◦ 15′ 45.′′1 266.6 5×240 183.0 5×120 2005 Mar 24Position 2 11254272 11h24m44.s1 −59◦ 16′ 10.′′9 266.6 5×240 183.0 5×120 2005 Mar 24
aAstronomical Observation Request
TABLE 2Measured Surface Brightness of Emission lines in IRS Spectra of the Spur
Line ID Wavelength (µm) Surf. Br. (10−8 W m−2 sr−1)a VHELIO (km s−1)
Position 1[S IV] 10.5 < 0.25 · · ·
[Ne II] 12.8 3.55±0.07 +373[Ne III] 15.6 1.7±0.09 +300[S III] 18.7 < 0.15b
−51[Ne V] 24.4 0.12±0.01 +43[O IV] 25.9 1.24±0.02 −51[S III] 33.6 < 0.2b +106[Si II] 34.8 < 0.63b +117
[Ne III] 36.0 0.23±0.05 +385
Position 2[S IV] 10.5 < 0.68 · · ·
[Ne II] 12.8 4.21±0.14 +290[Ne III] 15.6 1.55±0.13 +31[S III] 18.7 < 0.21b −33[Ne V] 24.4 0.11±0.01 −285[O IV] 25.9 1.14±0.04 +11.5[S III] 33.6 < 0.2b +168[Si II] 34.8 < 0.26b +573
[Ne III] 36.0 <0.1 · · ·
aEquivalent to surface brightness in units of 10−5 ergs cm−2 s−1 sr−1
bThese lines are most likely residuals from incomplete sky subtraction, so the fluxes quoted here are upper limits on the flux from the radiatively shocked ejecta.
TABLE 3Observed and Modeled Ratios of Emission Lines in the Spur
Line Ratio Position 1 Position 2 Model Aa Model Bb
Mid-IR[Ne II](12.8)/[Ne III](15.5) 2.1±0.1 2.7±0.24 2.2 0.4[Ne III](15.5)/[Ne V](24.3) 14.1±1.4 14.1±1.74 11.8 11.7[S IV](10.5)/[Ne II](12.8) <0.07 <0.16 0.04 0.23[Ne III](15.5)/[O IV](25.9) 1.33±0.08 1.35±0.12 1.3 0.7[Ne III](15.5)/[Si II](34.8) >2.7 >6.0 11.1 4.1[S III](18.7)/[Ne III](15.5) <0.09 <0.14 0.22 0.05
Opticalc
[O III](4959+5007)/[O II](3727+3729) 0.44 · · · 0.23 0.77[O III](4959+5007)/[O II](7325) 16.7 · · · 4.55 19.5[O III](4959+5007)/[O I](6300+6363) 13.1 · · · 149.2 4.9[O III](4959+5007)/[O III](4363) 17.0 · · · 18.7 20.0[S II](6716+6731)/[O III](4959+5007) 0.13 · · · 0.13 0.16[Ne III](3869)/[O III](4959+5007) 0.14 · · · 0.14 0.13[S II](6716)/[S II](6731) 1.16 · · · 1.2 1.3
aModel parameters are preshock density n =0.5 cm−3 at shock velocity vS =100 kms−1 , with n v2
S =constant; B/n1/2 = 0.1, abundances in dex are O=16.00,
Ne= 15.52, Mg=14.74, Si= 13.97 and S =14.0. Fluxes from plane parallel shock models are combined with a power law weighting factor as (vS/200)−α , where we have
assumed α = 2.5. The range of shock velocities in the models is 20≤ vS ≤ 200 km s−1 , and Te/Ti =0.05 is assumed at the shock front. The Mg abundance is set to theaveraged value determined from X-ray observations and is not actually constrained by the optical/IR spectra.bModel B parameters are same as Model A, but with α =0.4, Te/Ti =0.85, and shock velocities in the range 10≤ vS ≤ 130 km s−1 .
cOptical line ratios for Spur 1 are those of Filament 1 W from the optical spectroscopy of WL06. Ratios are quoted for E(B − V ) = 0.6 as estimated by WL06.
12
Fig. 1.— The continuum-subtracted [O III] image of G292.0+1.8 (Winkler & Long 2006) showing the positions of the Spitzer IRS lowresolution slits. The outermost X-ray contour (0.4-0.95 keV emission rom the 500 ks Chandra LP observation of G292.0+1.8 ; Park et al.2007) is shown marking the position of the blast wave. East is to the left and North is upward. The O-rich Spur is covered by two IRSpointings, numbered positions 1 and 2 from east to west (respectively). Each slit is outlined according to the following scheme: the firstnod is marked as a solid black (or white) line, with the second nod as a dashed black (or white) line. The overlap between the two nodswhere the signal-to-noise is maximized in the combined data are marked in color: large red and yellow slits are LL1 and LL2, while thesmall red and yellow slits are SL1 and SL2, respectively.
13
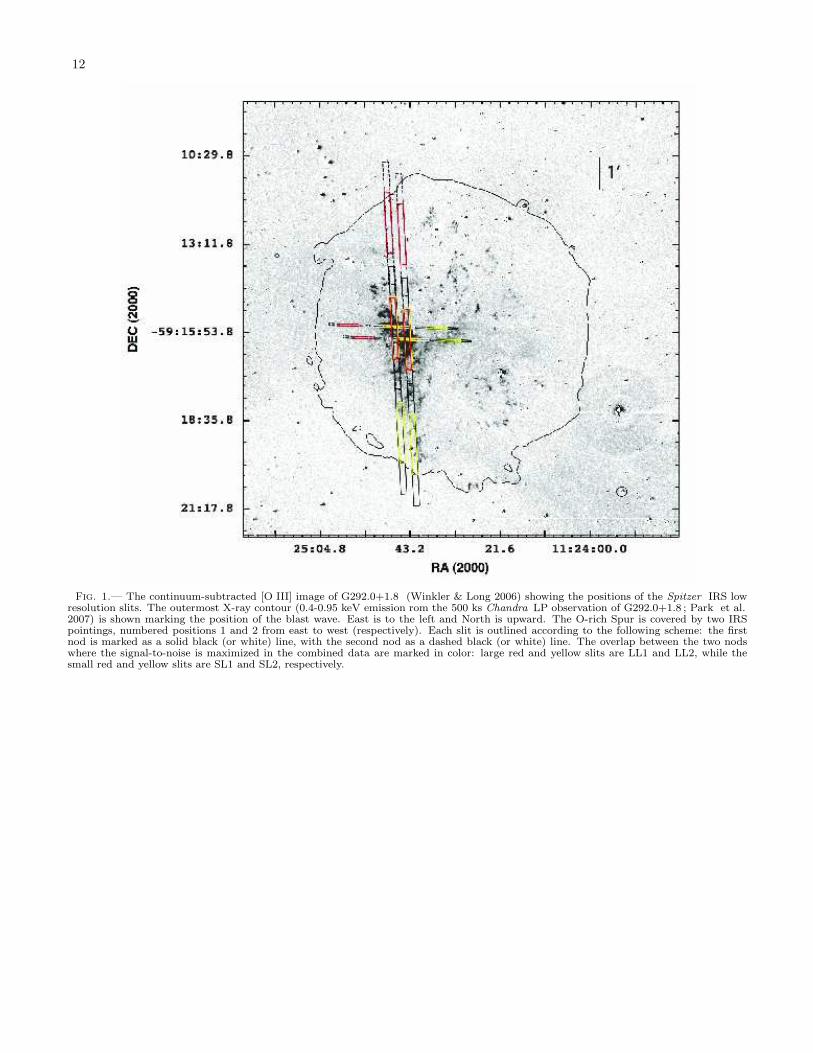
Fig. 2.— Same as Figure 1, but marked with the extraction boxes for the final spectra (these exclude SL2, which did not yield obviousemission from G292.0+1.8 ). Left panel: continuum-subtracted [O III] image from Winkler & Long (2006). Right panel: the ChandraLP image of G292.0+1.8 (0.3-8.0 keV) (Park et al. 2007). Field of view of each image is approximately 8.′5 across. The size of eachbox corresponds to the size of the spectral extraction window at the central wavelength of each IRS module, assuming the point sourceextraction aperture used by SPICE. Colors indicate 1st order (red) and 2nd order (yellow). The arrows on each box indicate the wavelengthdispersion axis. Dimensions are approximately 3.3 IRS pixels (= 6′′) along the spatial dimension and 3.′′6 along the dispersion direction (=the slit width) for SL1, and 4.5 pixels (= 23′′) along the spatial dimension and 10.′′5 along the dispersion direction (= the slit width) forLL 1.
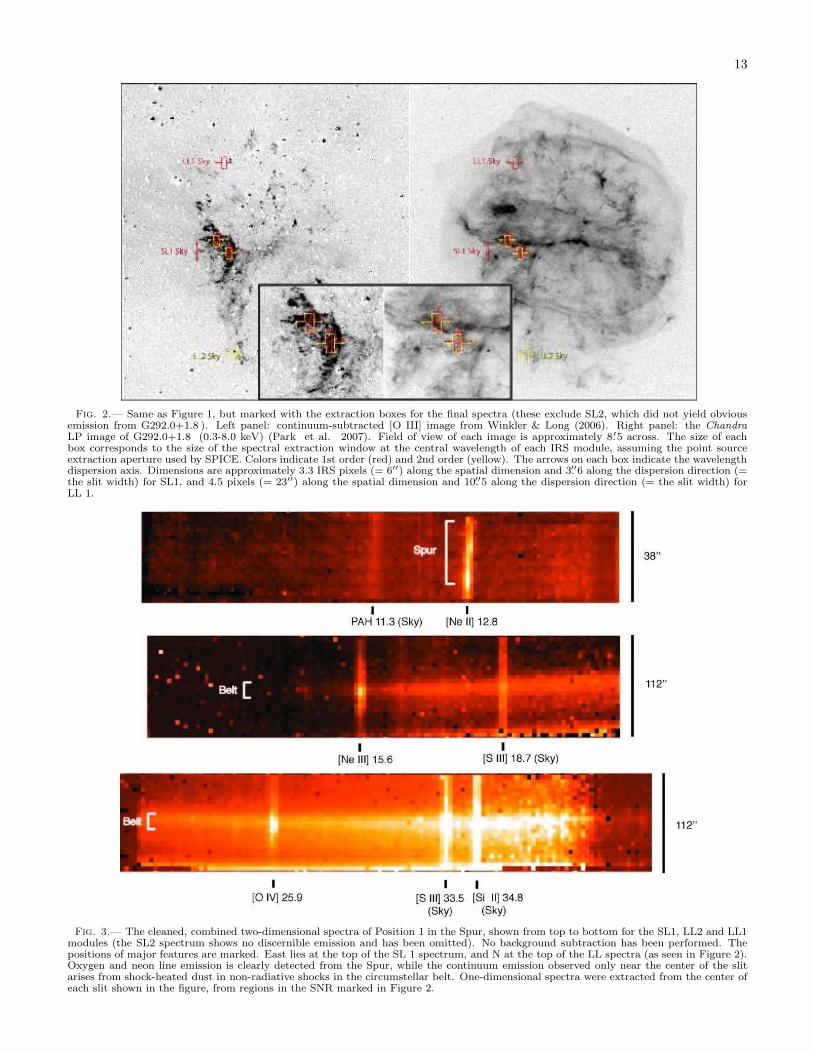
Fig. 3.— The cleaned, combined two-dimensional spectra of Position 1 in the Spur, shown from top to bottom for the SL1, LL2 and LL1modules (the SL2 spectrum shows no discernible emission and has been omitted). No background subtraction has been performed. Thepositions of major features are marked. East lies at the top of the SL 1 spectrum, and N at the top of the LL spectra (as seen in Figure 2).Oxygen and neon line emission is clearly detected from the Spur, while the continuum emission observed only near the center of the slitarises from shock-heated dust in non-radiative shocks in the circumstellar belt. One-dimensional spectra were extracted from the center ofeach slit shown in the figure, from regions in the SNR marked in Figure 2.
14
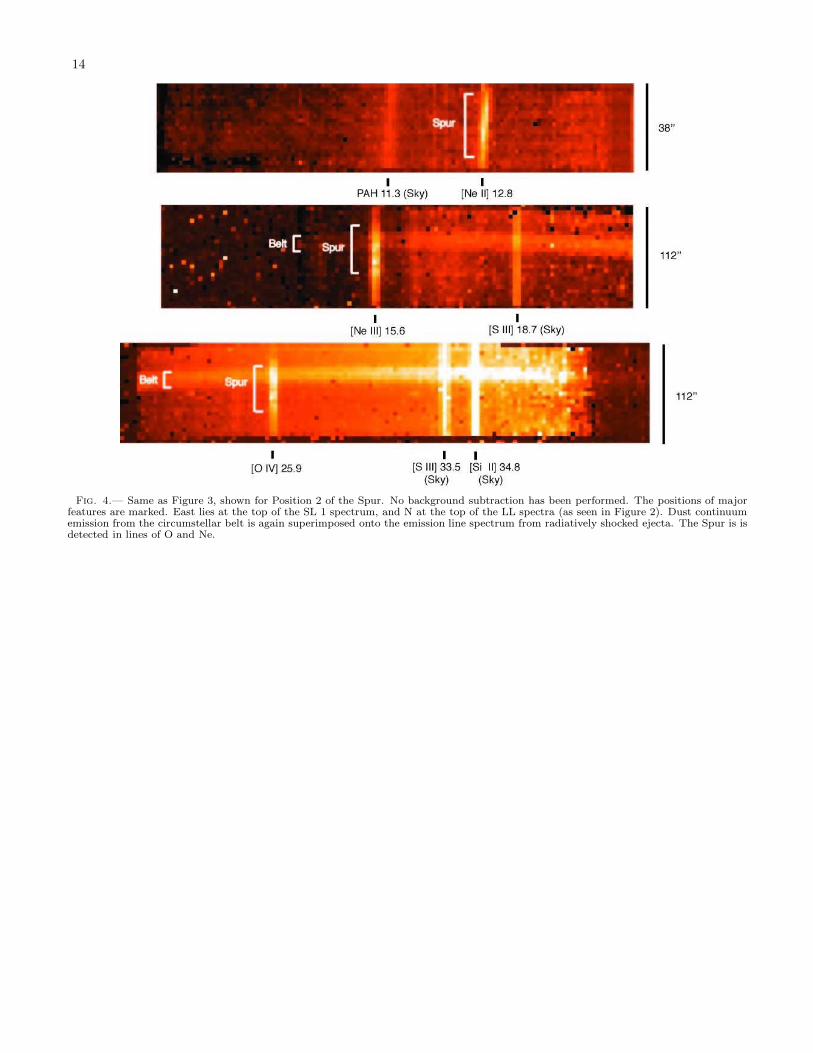
Fig. 4.— Same as Figure 3, shown for Position 2 of the Spur. No background subtraction has been performed. The positions of majorfeatures are marked. East lies at the top of the SL 1 spectrum, and N at the top of the LL spectra (as seen in Figure 2). Dust continuumemission from the circumstellar belt is again superimposed onto the emission line spectrum from radiatively shocked ejecta. The Spur is isdetected in lines of O and Ne.
15
Fig. 5.— Background subtracted IRS spectra of two main features detected in G292.0+1.8 . Identified emission lines are marked. Thechannel used to extract each portion of the spectrum is color coded as blue (SL 1), green (LL 2) and red (LL 1). The size of a typical fluxerror bar are marked above the spectrum of each channel. Labels marking the positions of features believed to be residual sky emission areindicated in parentheses. Top: the spectrum of Spur Position 1 (emission lines + superimposed dust continuum from the belt). Bottom:the spectrum of position 2 in the Spur, where emission from ejecta has been isolated. Note the broad emission feature between 15 and 28µm, indicating either collisionally excited PAHs in the blast wave along the line of sight or collisionally heated dust (Al2O3, Mg2SiO4) inthe radiatively shocked ejecta.
16
Fig. 6.— Fit to the dust continuum from the circumstellar belt of G292.0+1.8 . The spectrum is that of Position 1 (top panel of Figure 5),but with emission lines from the overlying shocked ejecta masked. Data from the different channels are color coded blue (SL1), green (LL2)and red (LL1). The continuum is equally well matched with either a silicate dust model or Weingartner & Draine (2001) model with twocomponents: a contribution from hot (Td ≈ 114 K) dust at wavelengths shortward of 30 µm, and cold (Td ≈ 35 K) dust dominant atwavelengths beyond 30 µm. The fit shows an excess between 15 and 20 µm, though the sizable flux errors in the SL1 and LL2 data andsystematic uncertainties in the IRS flux calibration between channels prevent a definitive interpretation of the flux excess.
This figure "f1.gif" is available in "gif" format from:
http://arXiv.org/ps/0902.2804v1