Fe K and ejecta emission in SNR G15.9+0.2 with XMM-Newton
12
HAL Id: hal-01554827 https://hal.archives-ouvertes.fr/hal-01554827 Submitted on 3 May 2021 HAL is a multi-disciplinary open access archive for the deposit and dissemination of sci- entific research documents, whether they are pub- lished or not. The documents may come from teaching and research institutions in France or abroad, or from public or private research centers. L’archive ouverte pluridisciplinaire HAL, est destinée au dépôt et à la diffusion de documents scientifiques de niveau recherche, publiés ou non, émanant des établissements d’enseignement et de recherche français ou étrangers, des laboratoires publics ou privés. Fe K and ejecta emission in SNR G15.9+0.2 with XMM-Newton Pierre Maggi, Fabio Acero To cite this version: Pierre Maggi, Fabio Acero. Fe K and ejecta emission in SNR G15.9+0.2 with XMM-Newton. As- tronomy and Astrophysics - A&A, EDP Sciences, 2017, 597, pp.A65. 10.1051/0004-6361/201629378. hal-01554827
-
Upload
khangminh22 -
Category
Documents
-
view
2 -
download
0
Transcript of Fe K and ejecta emission in SNR G15.9+0.2 with XMM-Newton

HAL Id: hal-01554827https://hal.archives-ouvertes.fr/hal-01554827
Submitted on 3 May 2021
HAL is a multi-disciplinary open accessarchive for the deposit and dissemination of sci-entific research documents, whether they are pub-lished or not. The documents may come fromteaching and research institutions in France orabroad, or from public or private research centers.
L’archive ouverte pluridisciplinaire HAL, estdestinée au dépôt et à la diffusion de documentsscientifiques de niveau recherche, publiés ou non,émanant des établissements d’enseignement et derecherche français ou étrangers, des laboratoirespublics ou privés.
Fe K and ejecta emission in SNR G15.9+0.2 withXMM-Newton
Pierre Maggi, Fabio Acero
To cite this version:Pierre Maggi, Fabio Acero. Fe K and ejecta emission in SNR G15.9+0.2 with XMM-Newton. As-tronomy and Astrophysics - A&A, EDP Sciences, 2017, 597, pp.A65. �10.1051/0004-6361/201629378�.�hal-01554827�

A&A 597, A65 (2017)DOI: 10.1051/0004-6361/201629378c© ESO 2017
Astronomy&Astrophysics
Fe K and ejecta emission in SNR G15.9+0.2 with XMM-NewtonPierre Maggi and Fabio Acero
Laboratoire AIM, IRFU/Service d’Astrophysique – CEA/DRF – CNRS – Université Paris Diderot, Bât. 709, CEA-Saclay,91191 Gif-sur-Yvette Cedex, Francee-mail: [email protected]
Received 22 July 2016 / Accepted 1 November 2016
ABSTRACT
Aims. We present a study of the Galactic supernova remnant SNR G15.9+0.2 with archival XMM-Newton observations.Methods. EPIC data are used to investigate the morphological and spectral properties of the remnant, searching in particular forsupernova ejecta and Fe K line emission. By comparing the SNR’s X-ray absorption column density with the atomic and moleculargas distribution along the line of sight, we attempt to constrain the distance to the SNR.Results. Prominent line features reveal the presence of ejecta. Abundance ratios of Mg, Si, S, Ar, and Ca strongly suggest that theprogenitor of SNR G15.9+0.2 was a massive star with a main sequence mass likely in the range 20–25 M�, strengthening the physicalassociation with a candidate central compact object detected with Chandra. Using EPIC’s collective power, Fe K line emission fromSNR G15.9+0.2 is detected for the first time. We measure the line properties and find evidence for spatial variations. We discuss howthe source fits within the sample of SNRs with detected Fe K emission and find that it is the core-collapse SNR with the lowest Fe Kcentroid energy. We also present some caveats regarding the use of Fe K line centroid energy as a typing tool for SNRs. Only a lowerlimit of 5 kpc is placed on the distance to SNR G15.9+0.2, constraining its age to tSNR & 2 kyr.
Key words. ISM: supernova remnants – X-rays: individuals: SNR G15.9+0.2 – X-rays: ISM
1. Introduction
SNR G15.9+0.2 was discovered as a supernova remnant (SNR)at radio wavelengths in Molonglo-Parkes observations byClark et al. (1973, 1975). Higher spatial resolution radio ob-servations with VLA revealed the elongated shell-like structureof the SNR with a bright enhancement on the eastern border(Dubner et al. 1996). The source is relatively bright in X-rays,as found in Chandra data by Reynolds et al. (2006b, hereafterR06). Its X-ray morphology favours a core-collapse (CC) originaccording to Lopez et al. (2009, 2011). The SNR was detected ininfrared with Spitzer/MIPS by Pinheiro Gonçalves et al. (2011),who measured a dust temperature and mass of 60 K and 8.1 ×10⁻² M�, respectively.
Although 300 SNRs are now known in the Milky Way,SNR G15.9+0.2 is an interesting target for an in-depth analy-sis for several reasons. First, it is likely young, ∼103 yr ac-cording to R06, as suggested by its small angular diameter andChandra X-ray analysis. This could add SNR G15.9+0.2 to thesmall sample (about 15) of SNRs confirmed to be .2000 yrold (using the compilation1 of Ferrand & Safi-Harb 2012) andthus reduces the discrepancy between the observed and ex-pected numbers of young SNRs. Second, a compact source,identified as CXOU J181852.0−150213, was discovered in thecentral region of the SNR (R06) with X-ray properties typi-cal of central compact objects (CCOs, e.g. Pavlov et al. 2004).Recently, deeper Chandra observations allowed Klochkov et al.(2016) to confirm that the central object is indeed a young cool-ing low-magnetized neutron star. This adds SNR G15.9+0.2 tothe short list of seven SNRs hosting a confirmed CCO and
1 http://www.physics.umanitoba.ca/snr/SNRcat/
as many hosting bona fide candidates (Lazendic et al. 2005;De Luca et al. 2006; de Luca 2008; Halpern & Gotthelf 2010;Combi et al. 2010; Sánchez-Ayaso et al. 2012). Third, its youngage and plasma conditions should produce detectable Fe K emis-sion. This feature is a blend of lines from various Fe ions, witha centroid energy at ∼6.4 keV for ionisation states lower thanFe17+, and then progressing to ∼6.7 keV for ion charges up to24. The ionic fraction of iron, and thus the centroid energy ofthe Fe K line, is chiefly governed by the ionisation timescale net,where ne is the electron density and t the time since the plasmawas shocked. After analysing all SNRs observed with Suzaku,Yamaguchi et al. (2014, hereafter Y14) detected Fe K emissionfrom 16 Galactic and seven LMC SNRs. They showed that theFe K centroid energy discriminates type Ia and CC SNRs, withthe former consistently in the lower end (∼6.4 keV) of the ion-isation range, and CC SNRs closer to 6.7 keV. They attributedthis to CC SNRs expanding into higher density environmentsproduced by the massive star prior to the explosion, while theambient medium around type Ia SNRs is hardly modified by theSN progenitors. If Fe K emission from SNR G15.9+0.2 were de-tected, we could obtain independent clues to the origin of theremnant.
SNR G15.9+0.2 was serendipitously observed inXMM-Newton pointings of a neighbouring target. Thanksto its superior collective power, there are several points whereresults from R06 can be elaborated upon and improved. Inparticular, the effective area of EPIC-pn is five times higherthan Chandra’s ACIS at 6.4 keV, making it a prime instrumentto search for faint Fe K emission yet undetected. The Chandraimage revealed an incomplete shell in X-rays, broken in thenorth-west quadrant, while radio emission is still found there.With XMM-Newton we can look for and characterise X-ray
Article published by EDP Sciences A65, page 1 of 11

A&A 597, A65 (2017)
Table 1. Details of the X-ray observations.
ObsID Date Total/filtered texpa Modeb
0406450201 2006 Apr. 6 43/33 SW0505240101 2008 Mar. 31 93/47 FF
Notes. (a) Performed duration (total) and useful (filtered) exposure timesin ks, after removal of high background intervals. (b) FF: full frame; SW:small window.
emission to much fainter limits. Furthermore, the SNR is brightand extended enough (∼5.5′ across) so that even with the modestangular resolution offered by XMM-Newton, we can measureabundances and plasma conditions in various regions around theremnant. The derived abundance ratios can constrain the type ofprogenitor and provide additional hints to the origin of the SNR.Finally, using X-ray spectral analysis and other tracers (namelyatomic and molecular gas), we can reassess the age of the SNRand the measurements of its distance.
This work is organised as follows: we first present the ob-servations and data reduction in Sect. 2. Next, we describe inSect. 3 the results of the morphological and spectral analyses. InSect. 4, we discuss the type of progenitor, age, and distance toSNR G15.9+0.2, as well as the evolution of Fe K lines in SNRsin general. We summarise our findings in Sect. 5.
2. X-ray observations and data reduction
SNR G15.9+0.2 was in the field of view (FoV) of twoXMM-Newton observations targeting PSR J1819−1458, thefirst X-ray counterpart to a rotating radio transients (RRATs,Reynolds et al. 2006a; McLaughlin et al. 2007; Miller et al.2013). The SNR is located at off-axis angles ranging from 8′to 12′. Only MOS data are available for the first observation,which was performed with EPIC in small window (SW) mode(the outer MOS CCDs are active even in SW mode). We dis-carded two additional observations that were very short (.5 ks).Details of the observations used in this paper are listed in Table 1.
We used the XMM SAS2 version 14.0.0 for the data reduc-tion. We applied a threshold of 8 and 2.5 cts ks−1 arcmin−2 onpn and MOS light curves in the 7–15 keV energy band to screenout periods of high background activity. This resulted in usefulexposure times of 47 ks and 33 ks.
We created two sets of images and exposure maps in variousenergy bands from the filtered event lists: A broad band set cov-ering 0.2 keV to 12 keV in five bands as given in Watson et al.(2009, their Table 3), and an SNR set described in Sect. 3.1. Sin-gle and double-pixel events (0 ≤ PATTERN ≤ 4) were extractedfrom the pn detector, while all valid events from the MOS detec-tors were selected (0 ≤ PATTERN ≤ 12). Masks were applied tofilter out bad pixels and columns. The SAS task edetectchainis applied simultaneously to the five images of the broad band setto identify X-ray (point) sources in each observations. The detec-tion lists were primarily used to exclude unrelated point sourcesfrom the spectrum extraction regions.
3. Results
3.1. Morphology
To study the morphology of SNR G15.9+0.2, we used three en-ergy bands tailored to its spectrum (R06). A soft band from 0.9
2 Science Analysis Software, http://xmm.esac.esa.int/sas/
10 05 18:19:00 55 50 45 18:40
-14:58:00
59
-15:00:00
01
02
03
04
05
06
RA (J2000)D
ec (
J2000)
Fig. 1. X-ray colour image of SNR G15.9+0.2, combining pn and MOSdata. The red, green, and blue components are soft, medium, and hardX-rays, as defined in Sect. 3.1. The position of the CCO is circled incyan. The blue arcs are straylight contamination (see Sect. 3.2).
to 2.1 keV which includes strong lines from magnesium andsilicon; a medium band from 2.1 to 3.25 keV which comprisessulphur and argon lines; and a hard band (3.25−7.2 keV) whichincludes the high-energy part of the continuum and possiblyemission from calcium and Fe K lines. Owing to high absorp-tion, there is little emission below 0.8 keV, while the instrumen-tal background dominates above 7.2 keV.
We used filter wheel closed (FWC) data3, obtained with thedetector shielded from astrophysical background, to subtract thedetector background. The contribution of detector backgroundin each observation was estimated from the count rate in the cor-ners of the images, since they are not exposed to the sky. Wethen subtracted appropriately scaled FWC data from the raw im-ages. The detector background-subtracted images from the twoobservations were merged together. They were then adaptivelysmoothed: the sizes of Gaussian kernels were chosen at each po-sition to reach a signal-to-noise ratio of five, with a minimum fullwidth at half maximum (FWHM) of 20′′. In each band, we co-added the smoothed images from pn and MOS, and divided theresulting image by the corresponding vignetted exposure map4.
The composite X-ray image of SNR G15.9+0.2 is shown inFig. 1. The annular stripes at high energy (in blue) are stray-light emission (see Sect. 3.2) unrelated to the SNR. The posi-tion of the CCO is marked. A faint point source is detected2′′ from CXOU J181852.0−150213, i.e. well within the typicalXMM-Newton statistical and systematical position uncertainties.The flux and hardness ratios are consistent with those measuredwith Chandra (R06) so we are confident that we are indeed de-tecting the CCO. However, there are not enough counts (.200)to improve on results from R06 or Klochkov et al. (2016), espe-cially with the lower angular resolution of XMM-Newton.
3 http://www.cosmos.esa.int/web/xmm-newton/filter-closed4 To produce a combined exposure map, we weighted the MOS expo-sure maps with a factor of 0.4 relative to pn, accounting for the lowereffective area.
A65, page 2 of 11

P. Maggi and F. Acero: Fe K and ejecta emission in SNR G15.9+0.2 with XMM-Newton
Faint NW
CXO1
CXO3
Interior
CCO
Shell E
CXO4
Shell SW
Fig. 2. Regions used in the spectral analysis defined on a 0.9−7.2 keVband image of SNR G15.9+0.2. Point sources in red were excluded. Wenote the changing straylight contamination in different regions.
SNR G15.9+0.2 exhibits a well-defined shell morphology.The eastern and south-western edges are particularly bright, andall the SNR emission above ∼3.5 keV is concentrated in theseregions. In contrast, the north-western quadrant of the shell ismuch fainter than the rest of the SNR, and only X-rays be-low 3 keV are detected in this region. The shell’s morphologyis a slightly elongated ellipse, with major and minor axes of6.2′ and 5.2′, respectively. That translates into a linear size of(9.0 pc × 7.6 pc) (D / 5 kpc). The major axis has a position an-gle 150◦ eastwards of north. The centre of the ellipse is at RA(J2000) = 18h18m53.8s, Dec = −15◦01m38s. The CCO is thusoffset 44′′ from the visual centre.
3.2. Spectral analysis
The definition of extraction regions for spectral analysis wasdriven by the observed morphology. A spatially integrated spec-tra was extracted from the ellipse described previously. To lookfor spectral variations, we separated the bright regions of theshell in two subregions, Shell E and Shell SW (for east andsouth-west, respectively). These are shown over an X-ray im-age in Fig. 2. A third region covers the fainter north-western partof the shell (faint NW). We also extracted a spectrum from theinterior of the SNR.
Point sources detected with Chandra5, including the CCO,were excised from our XMM-Newton spectral extraction regions.Most of the sources detected with XMM-Newton in the shellregion (by edetectchain) are emission knots, therefore trulyoriginating from the SNR and were kept in the analysis. Back-ground spectra were taken from a large region surrounding theSNR (not shown in Fig. 2). We excluded straylight stripes andpoint sources detected with XMM-Newton from the backgroundregions.
5 From the list given in the Chandra SNR catalogue, maintained byFred Seward : http://hea-www.cfa.harvard.edu/ChandraSNR/G015.9+00.2/
Owing to the telescope vignetting and off-axis position of theSNR, the effective area changes across the extent of the SNR; itdecreases with larger off-axis angles, and more so at higher en-ergies. Before extracting spectra, we corrected the filtered eventlists for vignetting with the SAS task evigweight. As for theimages, single and double-pixel events were included in pn spec-tra, and events with PATTERN = 0 to 12 were selected in MOSspectra. With the FTOOLS task grppha, we rebinned all spectrato have a minimum of 25 counts per bin in order to allow theuse of the χ2-statistic. Non-rebinned spectra were used with theC-statistic (Cash 1979) for the study of Fe K lines (Sect. 3.2.2)because of the limited photon statistics above 6 keV. These spec-tra were extracted from non-vignetting-weighted event lists toretain the Poissonian nature of the errors. XSPEC (Arnaud 1996)version 12.9.0e was used for the spectral analysis. All uncertain-ties listed in this paper are given at the 90% confidence level,unless otherwise stated.
For spectral analysis, we employed the method described inMaggi et al. (2016): We simultaneously fit the source and back-ground spectra with the instrumental and astrophysical contribu-tions to the background explicitly modelled. This is preferable tosimply subtracting a background spectrum taken from a nearbyregion because of the different instrumental responses and back-ground contributions from different regions and because of theresulting loss in the statistical quality of the source spectrum.
Spectra were extracted from FWC data at the same detec-tor positions as the source and background regions, in order tocapture the spatial variations of the instrumental background.Our model for the instrumental background takes into ac-count electronic noise and particle-induced background, as de-scribed in Sturm (2012) and Maggi et al. (2016). We first fitthis model to FWC data from all extraction regions. The best-fit models are used in subsequent fits (including astrophysicalsignal), allowing only a constant renormalisation factor. Thisavoids overloading the number of free parameters. Anothernon-X-ray background component is the soft proton contam-ination (SPC), which we modelled following the prescriptionof Kuntz & Snowden (2008). The SPC parameters were differ-ent for each instrument and observation (the soft proton flux ishighly time-variable). Indeed, we found a higher SPC in the 2006observation.
Next, we defined a model for the astrophysical X-ray back-ground (AXB). Initially, we used a single unabsorbed thermalplasma (apec in XSPEC) for local contributions (local hot bub-ble and/or solar wind charge-exchange emission) and an ab-sorbed two-temperature plasma (apec + apec) for the remote(Galactic) component. The cosmic X-ray background is added,with additional absorption, to the remote component as a powerlaw with a photon index Γ fixed to 1.41 (De Luca & Molendi2004). Initial trial fits to the background spectra showed that asecond remote Galactic component was not needed. This usuallyaccounts for the very hot (kT > 5 keV) plasma from the Galacticridge X-ray emission (GRXE), which is not detected in our data.In particular, we do not see the strong Fe K line at 6.7 keV asso-ciated with the GRXE (Koyama et al. 1986). We place a 3σ up-per limit of 2.8 × 10⁻⁸ ph cm−2 s−1 arcmin−2 on a Galactic ridgeFe K line. Below 1 keV, the initial model had strong residuals.A much better fit was achieved with the inclusion of a secondthermal component. The final model for the AXB is
S AXB = S 1apec+S 2
apec+phabs(N1H)
(S 3
apec + phabs(N2H)NCXBE−Γ
)(1)
A65, page 3 of 11

A&A 597, A65 (2017)
0.01
0.1
1
Counts
s−
1 k
eV−
1
1 100.5 2 5
−2
0
2
(dat
a−m
odel
)/er
ror
Energy (keV)
Fig. 3. Background spectrum of SNR G15.9+0.2. For the sake of clarity,only pn and MOS2 data from the 2008 observation are shown (black andred points, respectively). Data have been rebinned for display purposes.The various components are instrumental background (dotted grey), lo-cal background (solid green), remote background and CXB (solid blue)and SPC (dashed cyan). Fit residuals are displayed in the bottom panel.
where S iapec is the emission from an apec model at tem-
perature kT i with normalisation Normi. The latter is definedas (10−14/4πD2)
∫nenHdV , with D the distance to the source
and ne and nH the density of electrons and protons, all inthe cgs system of units. phabs is the photoelectric absorp-tion model we used in XSPEC, with cross-sections fromBalucinska-Church & McCammon (1992). Abundances wereset to those of Wilms et al. (2000).
The model of Eq. (1) reproduces fairly well the back-ground spectrum (see Fig. 3). The best-fit parameters are listedin Table 2. Our CXB surface brightness is an order of mag-nitude higher than derived at high Galactic latitudes fromvarious instruments (Kushino et al. 2002; Lumb et al. 2002;De Luca & Molendi 2004; Revnivtsev et al. 2005). This can beattributed partly to cosmic variance, and partly to contribu-tion by unresolved hard X-ray sources in the Galaxy whichare by design not in the aforementioned CXB studies. Wenote that Katsuda et al. (2015) fit the CXB on a backgroundspectrum around RX J1713.7-3946, located symmetrically fromSNR G15.9+0.2 with respect to the Galactic Centre. Their valueof (1.0−3.2)×10−5 ph keV−1 cm−2 s−1 arcmin−2 at 1 keV is fullyconsistent with ours (1.6 × 10⁻⁵).
Another potentially problematic source of background isstraylight. Photons from bright sources outside the FoV canbe singly reflected by the hyperboloid mirrors and reach thecamera. Sources 0.3◦ to 1.4◦ off-axis produce ring-like struc-tures in EPIC images6, such as seen in our images. Followingthe direction to the foci of the straylight rings from the aim-point of the observations, we can firmly identify the contami-nating source as GX 17+2, located 1.26◦ off-axis. GX 17+2 is alow-mass X-ray binary accreting at Eddington luminosity (e.g.Lin et al. 2012, and references therein). Excising straylight ringsfrom the background extraction regions is straightforward. How-ever, some single-reflection arcs also intersect (bright) regionsof the SNR. We therefore chose to include another componentto model the straylight emission possibly included in the spec-tra from the SNR regions. To analyse the straylight spectrum,
6 See http://www.star.le.ac.uk/~amr30/BG/mjf.pdf
Table 2. Best-fit parameters for the AXB model of Eq. (1).
Parameter Value
χ2 / d.o.f (χ2r ) = 3089.8/2712 (1.14)
Local backgroundkT 1 (keV) 0.19 ± 0.02Norm1 (cm−5) (1.95 ± 0.22) × 10−5
SB1 (erg cm−2 s−1 arcmin−2) 1.8 × 10⁻¹⁵
kT 2 (keV) 0.84 ± 0.04Norm2 (cm−5) (1.95 ± 0.22) × 10−5
SB2 (erg cm−2 s−1 arcmin−2) 2.3 × 10⁻¹⁵
Remote backgroundN1
H (1022 cm−2) 3.14 ± 0.10kT 3 (keV) 0.72 ± 0.03Norm3 (cm−5) (5.05+0.44
−0.56) × 10−3
SB3 (erg cm−2 s−1 arcmin−2) 2.4 × 10⁻¹⁴
Cosmic X-ray backgroundN2
H (1022 cm−2) 1.25+0.93−0.73
Γ 1.41 (fixed)NCXB (ph keV−1 cm−2 s−1 at 1 keV ) (2.84 ± 0.13) × 10−4
SBCXB (erg cm−2 s−1 arcmin−2) 6.5 × 10⁻¹⁴
Notes. For each component the surface brightness (SB) is given in theenergy band 0.3–8 keV.
we extracted counts from the ring-like structures in all the FoV,except over SNR G15.9+0.2. The spectrum of GX 17+2 can berepresented as a combination of black body, multicolour disk,and power-law emission, with variable relative contributions(Cackett et al. 2010; Lin et al. 2012) depending on the state ofGX 17+2, although a single component model is sufficient giventhe limited count statistics of the single reflections. We note inparticular that we do not see Fe K emission from GX 17+2(Cackett et al. 2012) in the straylight spectrum, which has almostno signal above 6 keV. We used an absorbed black body withNH = 3.1 × 1022 cm−2 and kT = 0.99 keV. The normalisation isfree for all exposures, as it depends on both the intrinsic variabil-ity of the source and on its exact location relative to the mirrors.Overall, the flux collected in all the arcs is 10−4−10−3 times theflux of GX 17+2, consistent with the straylight collecting area(<0.2% of the on-axis effective area). We included this compo-nent in the background model of spectra in the source regions.The spectral parameters were fixed. A constant factor was theonly free parameter allowed to vary between 0 (no contribution)and fstray, where fstray is a geometrical factor, the fraction of thestraylight arc overlapping the SNR region.
3.2.1. Spectral fits and spatial variations
In a first attempt, we fit single-temperature models to the spec-tra from each region, combining the background model and oneor more components for the SNR emission. All backgroundparameters are fixed to their best-fit values, except for nor-malisation factors for the AXB and the straylight models. Weassumed non-equilibrium ionisation (NEI) for the SNR emis-sion, using a plane-parallel shock model (vpshock in XSPEC,Borkowski et al. 2001), which features a linear distribution of
A65, page 4 of 11

P. Maggi and F. Acero: Fe K and ejecta emission in SNR G15.9+0.2 with XMM-Newton
0.01
0.1
1
Cou
nts s
−1 k
eV−1
−2
0
2
(dat
a−m
odel
)/err
or
Shell E Shell SW
0.01
0.1
5×10⁻³
0.02
0.05
0.2
Cou
nts s
−1 k
eV−1
521
−2
0
2
(dat
a−m
odel
)/err
or
Energy (keV)
interior
521Energy (keV)
faint NW
Fig. 4. X-ray spectra from various regions of SNR G15.9+0.2, with pn and MOS2 data from the 2008 observation in black and red, respectively.All background components are included in the dashed lines (model from Fig. 3, plus straylight contamination, see Sect. 3.2). The best-fit fiducialmodel for the SNR emission is in green, with corresponding residuals in the bottom panels. We note the changing vertical scale between rows.
ionisation ages (τ =∫ t
0 nedt). AtomDB 3.07 is used to calculatethe spectrum.
We started with the Shell E spectrum from the brightestregion. Initial fits with vpshock and solar abundances clearlyfailed, leaving strong residuals at line energies of main elements,in particular Si and S. With free Mg, Si, and S abundances,the fit improved by ∆χ2 = −797. Some residuals remained atE ∼ 3.2 keV and 3.9 keV, where Ar and Ca emission is ex-pected. With their abundances freed, the fit improved further by∆χ2 = −95 for a final χ2 / d.o.f = 2191.2/1967. The enhancedabundances are a tell-tale sign of the shock-heated ejecta ori-gin of the emission. In all these fits there are line-like residualsat 6.4−6.7 keV, which betrays unaccounted for Fe K emission.It cannot be improved by enhanced Fe abundance, because theplasma temperature, constrained by the bulk of the emission, istoo low to produce appreciable Fe K emission. Adding a Gaus-sian improved the fits, we analyse the Fe K emission in detail inSect. 3.2.2.
Because the 6.4 keV feature is very minor, we restrict in afirst time the analysis to the vpshock model with free Mg, Si,S, Ar, and Ca abundances as it gives a good fit to the globalemission that can be applied in all regions of the SNR. We refer
7 http://www.atomdb.org/index.php
to this model as the fiducial model. The best-fit parameters ineach region are listed in Table 3.
The temperature and ionisation age in the Shell E spectrumare 1.32 keV and 8.5×1010 cm s−3. The spectrum in the Shell SWregion is similar to its eastern counterpart, with a higher tem-perature (1.53 keV) but the same ionisation age within the un-certainties. The interior spectrum is virtually the same as thatin the Shell SW, albeit fainter, indicating that we are seeing (inprojection) similar shock conditions as in the south-west. Thespectrum in the faint NW region is the most different, the tem-perature is significantly lower (kT ≈ 0.7 keV) and the ionisationage is higher (τ ∼ 8× 1011 cm s−3), although poorly constrained.The eastern emission is the most absorbed with a column densityNH = 5× 1022 cm−2, while NH is lower in the interior and south-west. The NH in the interior (4.10+0.12
−0.26 × 1022 cm−2) is consistentwith the value fit by Klochkov et al. (2016) for the CCO using acarbon atmosphere model, the only one that yields a reasonabledistance (10+9
−5 kpc). The X-ray emission from the north-west ap-pears the least absorbed (NH . 4× 1022 cm−2). These absorptionfeatures are discussed in relation with atomic and molecular gasin Sect. 4.3.
The abundances are highly elevated (in excess of 1.5−2 timessolar) in every region except the faint NW, where some abun-dances are consistent with solar when taking into account the
A65, page 5 of 11

A&A 597, A65 (2017)
Table 3. Best-fit parameters for the fiducial model.
Region NH kT τ Norm χ2/d.o.f.
(1022 cm−2) (keV) (1010 s cm−3) (cm−5)
Shell E 5.03+0.21−0.25 1.32+0.08
−0.09 8.54+0.99−0.81 (1.32+0.20
−0.14) × 10−2 2191.2/1967 (1.11)
Shell SW 4.30+0.17−0.27 1.53+0.28
−0.09 7.69+1.18−1.25 (5.18+0.58
−1.17) × 10−3 1980.2/1726 (1.15)
Interior 4.10+0.12−0.26 1.46+0.28
−0.21 6.69+1.56−1.39 (3.15+0.83
−0.74) × 10−3 1678.3/1632 (1.03)
Faint NW 3.77+0.44−0.35 0.67 ± 0.20 96.8 (>34.7) (2.59+3.13
−1.05) × 10−3 959.4/896 (1.07)
Integrated 4.58 ± 0.11 1.44+0.08−0.06 7.85+0.79
−0.60 (2.34+0.16−0.19) × 10−2 3860.4/3418 (1.13)
Mg Si S Ar Ca
Shell E 1.79+0.32−0.25 2.57 (±0.18) 2.69 (±0.17) 3.44+0.51
−0.45 2.53+1.22−1.02
Shell SW 1.79+0.40−0.30 2.06+0.30
−0.17 2.11+0.29−0.20 2.73+0.80
−1.24 1.24 (<3.05)
Interior 1.83+0.44−0.33 2.06+0.32
−0.24 2.03+0.33−0.27 2.99+1.27
−1.10 6.68+4.39−3.62
Faint NW 1.33+0.60−0.44 1.66 (±0.40) 2.04+1.08
−0.57 4.26+6.71−2.62 3.49 (<20.2)
Integrated 1.74+0.20−0.18 2.20+0.13
−0.10 2.29+0.14−0.11 3.15+0.42
−0.37 2.49+0.98−0.91
Notes. The abundances are given relative to the solar values as listed in Wilms et al. (2000).
large uncertainties. We do not find a solar value for Si, as didR06 in Chandra data fit with the same model. The abundances ofAr and Ca are, however, poorly constrained in spectra with lowerstatistics, in particular in the interior and north-western regions.Within the uncertainties, there are no clear spatial variations ofthe abundance ratios of Mg or S relative to Si. We also appliedthe fiducial model to the integrated spectrum of SNR G15.9+0.2.The resulting best-fit parameters are listed in Table 3. They areconsistent with flux-averaging of the parameters obtained in thefour regions.
It appears from the fiducial model that a significant fraction,or the majority, of the emission originates from shock-heatedejecta. Therefore, we attempted a multicomponent model ap-proach (similar e.g. to that in Kosenko et al. 2010): a single kTNEI component (vpshock) is used for each element or groupof elements. This examines whether various elements are foundat different temperatures or ionisation ages. To model emissionfrom pure ejecta, we set the abundance of the corresponding el-ement(s) to 109 and all the others to 0. The model thus com-prises (i) a component for Mg; (ii) a component for Si, S, Ar,and Ca. They are grouped together as they are expected to beroughly co-spatial in the ejecta of a (core-collapse) supernova.The abundances of S, Ar, and Ca are free relative to Si; (iii) acomponent for iron, the innermost ejecta, which we detectedthrough Fe K emission; and (iv) an additional component withsolar abundance to account for the emission from shocked ambi-ent medium (hereafter solar component). All components sharea common NH.
This model was applied to the bright eastern and south-western spectra. Taking into account the seven additional freeparameters, the fits with the multicomponent model are equallyas good or slightly better than those with the fiducial model.Again, the NH is higher in the eastern region, confirmingthat this spatial variation is not strongly model dependent.The solar-abundances component dominates the continuum. Itis therefore unsurprising that a pure-ejecta model (without thesolar-abundances component) fails to describe the data satis-factorily. The temperature of the solar-abundances componentis (1.3−1.5) keV without spatial variation in τ, as with the
fiducial model. The Si-group component has a lower tempera-ture (0.9−1 keV) and higher τ (2 × 1011 cm s−3) than the solarand Mg components. Without the help of the absorbed iron L-shell lines below 1.2 keV, we cannot constrain well the kT − τcombination for Fe, an issue further complicated by the complexnature of the Fe K emission, as described in the next section.
3.2.2. Fe K emission
Here we present a separate treatment of the Fe K emission at6.4−6.7 keV for comparison with the results of Y14. The samebackground model as previously described is included. Data be-tween 0.6 keV and 4 keV are excluded, thus avoiding the promi-nent line emission from elements other than Fe. The low-energypart (from 0.3 to 0.6 keV) is used to fix the normalisation ofthe background model. The continuum emission is modelled byan absorbed Bremsstrahlung (NH fixed to 5 × 1022 cm−2), andthe Fe K emission by a Gaussian. There is only a significantdetection of the line in the Shell E and Shell SW regions, andparticularly in pn data. There is no clear signature in the MOSspectra owing to their lower effective area. Still, we present theresults of the joint pn/MOS analysis since it helps in constrainingthe continuum. No differences were found in the line propertieswhen using only pn data.
We start the analysis with the Shell E spectrum, which hasthe best signal. With a width fixed to zero8, the best-fit Gaus-sian has a centroid energy of 6405+52
−49 eV (Table 4). However,this model leaves residuals around the centroid energy, as shownin Fig. 5 (left). When the width (σ) of the line is freed, the fitimproves significantly (∆C = −12) for σ = 191+131
− 72 eV, with acentroid energy shifted to 6519+81
−79 eV (Fig. 5, middle). The datacan be fit equally well or slightly better (∆C = −5.3) by us-ing two zero-width Gaussians. In that case, one is at low energy(∼6.4 keV) and the second is close to 6.7 keV (Fig. 5, right).In the south-west region, only a narrow high-energy compo-nent is detected; there is no improvement when thawing the linewidth (Table 4). We note that in the population study of Y14, the
8 The only broadening is from the finite spectral resolution of ≈150 eV.
A65, page 6 of 11
P. Maggi and F. Acero: Fe K and ejecta emission in SNR G15.9+0.2 with XMM-Newton
10−3
0.01
0.1
Cou
nts s
−1 k
eV−1
4 5 6 7 8
−4
−2
0
2
4
(dat
a−m
odel
)/err
or
Energy (keV)4 5 6 7 8
−4
−2
0
2
4
Energy (keV)4 5 6 7 8
−4
−2
0
2
4
Energy (keV)
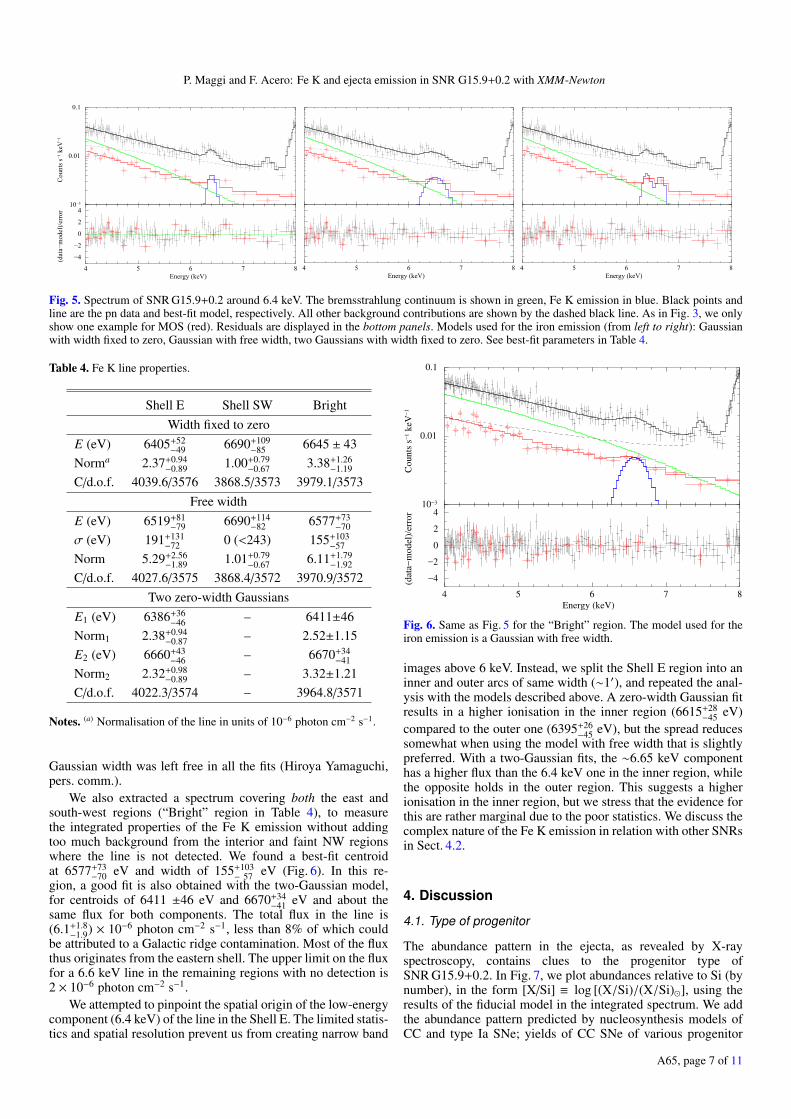
Fig. 5. Spectrum of SNR G15.9+0.2 around 6.4 keV. The bremsstrahlung continuum is shown in green, Fe K emission in blue. Black points andline are the pn data and best-fit model, respectively. All other background contributions are shown by the dashed black line. As in Fig. 3, we onlyshow one example for MOS (red). Residuals are displayed in the bottom panels. Models used for the iron emission (from left to right): Gaussianwith width fixed to zero, Gaussian with free width, two Gaussians with width fixed to zero. See best-fit parameters in Table 4.
Table 4. Fe K line properties.
Shell E Shell SW BrightWidth fixed to zero
E (eV) 6405+52−49 6690+109
−85 6645 ± 43Norma 2.37+0.94
−0.89 1.00+0.79−0.67 3.38+1.26
−1.19
C/d.o.f. 4039.6/3576 3868.5/3573 3979.1/3573Free width
E (eV) 6519+81−79 6690+114
−82 6577+73−70
σ (eV) 191+131−72 0 (<243) 155+103
−57
Norm 5.29+2.56−1.89 1.01+0.79
−0.67 6.11+1.79−1.92
C/d.o.f. 4027.6/3575 3868.4/3572 3970.9/3572Two zero-width Gaussians
E1 (eV) 6386+36−46 – 6411±46
Norm1 2.38+0.94−0.87 – 2.52±1.15
E2 (eV) 6660+43−46 – 6670+34
−41
Norm2 2.32+0.98−0.89 – 3.32±1.21
C/d.o.f. 4022.3/3574 – 3964.8/3571
Notes. (a) Normalisation of the line in units of 10−6 photon cm−2 s−1.
Gaussian width was left free in all the fits (Hiroya Yamaguchi,pers. comm.).
We also extracted a spectrum covering both the east andsouth-west regions (“Bright” region in Table 4), to measurethe integrated properties of the Fe K emission without addingtoo much background from the interior and faint NW regionswhere the line is not detected. We found a best-fit centroidat 6577+73
−70 eV and width of 155+103− 57 eV (Fig. 6). In this re-
gion, a good fit is also obtained with the two-Gaussian model,for centroids of 6411 ±46 eV and 6670+34
−41 eV and about thesame flux for both components. The total flux in the line is(6.1+1.8
−1.9) × 10−6 photon cm−2 s−1, less than 8% of which couldbe attributed to a Galactic ridge contamination. Most of the fluxthus originates from the eastern shell. The upper limit on the fluxfor a 6.6 keV line in the remaining regions with no detection is2 × 10−6 photon cm−2 s−1.
We attempted to pinpoint the spatial origin of the low-energycomponent (6.4 keV) of the line in the Shell E. The limited statis-tics and spatial resolution prevent us from creating narrow band
10−3
0.01
0.1
Co
un
ts s
−1 k
eV−
1
4 5 6 7 8
−4
−2
0
2
4
(dat
a−m
od
el)/
erro
r
Energy (keV)
Fig. 6. Same as Fig. 5 for the “Bright” region. The model used for theiron emission is a Gaussian with free width.
images above 6 keV. Instead, we split the Shell E region into aninner and outer arcs of same width (∼1′), and repeated the anal-ysis with the models described above. A zero-width Gaussian fitresults in a higher ionisation in the inner region (6615+28
−45 eV)compared to the outer one (6395+26
−45 eV), but the spread reducessomewhat when using the model with free width that is slightlypreferred. With a two-Gaussian fits, the ∼6.65 keV componenthas a higher flux than the 6.4 keV one in the inner region, whilethe opposite holds in the outer region. This suggests a higherionisation in the inner region, but we stress that the evidence forthis are rather marginal due to the poor statistics. We discuss thecomplex nature of the Fe K emission in relation with other SNRsin Sect. 4.2.
4. Discussion
4.1. Type of progenitor
The abundance pattern in the ejecta, as revealed by X-rayspectroscopy, contains clues to the progenitor type ofSNR G15.9+0.2. In Fig. 7, we plot abundances relative to Si (bynumber), in the form [X/Si] ≡ log [(X/Si)/(X/Si)�], using theresults of the fiducial model in the integrated spectrum. We addthe abundance pattern predicted by nucleosynthesis models ofCC and type Ia SNe; yields of CC SNe of various progenitor
A65, page 7 of 11

A&A 597, A65 (2017)
-1.5
-1
-0.5
0
0.5
12 14 16 18 20
Mg Si S Ar Ca
[X/S
i]
Atomic Number
DDTe15 Msun20 Msun25 Msun40 Msun
G15.9+0.2
Fig. 7. Best-fit abundance ratios, relative to Si, measured in the inte-grated spectrum of SNR G15.9+0.2 (black dots). Solid lines show theexpected yields of CC SNe with various main sequence mass progeni-tors. The red dashed line is the prediction of a type Ia explosion.
masses are taken from Nomoto et al. (2006)9. For type Ia SNe,we used abundances resulting from delayed-detonation andpulsed delayed-detonation models, called DDTe and PDDe inBadenes et al. (2003); only the former is shown in Fig. 7. Mg/Siratios were not given originally in Badenes et al. (2003), but aretaken from Rakowski et al. (2006).
What best sets apart type Ia and CC SNe yields is the abun-dance of magnesium relative to silicon. All type Ia models pro-duce very little Mg as it is mostly incinerated by the thermonu-clear burning front. In massive stars, Mg is mainly produced inexplosive C/Ne burning and hydrostatic (i.e. pre-SN) burning ofC and Ne10, so that the Mg yield varies strongly with the pro-genitor mass. The [Mg/Si] ratio in SNR G15.9+0.2 (−0.1 ± 0.4)is 40 times that obtained in the DDTe model and 600 timesthat of the PDDe model, while consistent with several CC mod-els of Nomoto et al. (2006), for instance a progenitor mass of18 M�, 25 M�, or 30 M�. One caveat is that the abundance ra-tios in Fig. 7 are those of the shocked ejecta, the only materialwe have access to with X-ray observations. If some amount ofMg is missing, the true Mg/Si ratio will be higher and even lesscompatible with a type Ia progenitor. Conversely, if Si is under-estimated, the Mg/Si will decrease. It is, however, very unlikelythat a sufficient quantity of unshocked Si is present to producea Mg/Si ratio of more than one order of magnitude below ourmeasured value. Therefore, the Mg/Si ratio provides a strong in-dication that the progenitor of SNR G15.9+0.2 was a massivestar, strengthening the physical association of the central sourceCXOU J181852.0−150213 with the SNR.
The ratios of S, Ar, and Ca to Si provide less information be-cause these elements are products of explosive oxygen and sili-con burning with little variation over the progenitor mass range.The variation is mainly due to the additional Si contributionsfrom hydrostatic burning (Thielemann et al. 1996). Ca/Si andAr/Si ratios are also affected by the metallicity of the progeni-tors. The pre-explosion neutron excess η, mostly contributed by
9 Yields Table 2013, available at http://star.herts.ac.uk/~chiaki/works/YIELD_CK13.DAT10 Large amounts of O and Ne are also produced at the same sites, buttheir X-ray emissions are absorbed and absent in SNR G15.9+0.2.
6400 6450 6500 6550 6600 6650 6700Energy (eV)
109
1010
1011
1012
1013
τ (cm−3 s)
kT=1.5 keVkT=5 keV
0
2
4
6
8
10
N
100
101
102
103
L K (104
0 ph s−
1)
Kepler
3C397
Tycho
RCW86
SN1006
G337.2-0.7
G344.7-0.1
G352.7-0.1
N103B
0509-67.5
0519-69.0
DEML71
SgrAEast
G0.61+0.01
W49B CasA
IC443
G292.0+1.8
G349.7+0.2
G350.1-0.3
N49
N63A
N132D
SNR1987A
G15.9+0.2
G1.9+0.3
Kes79 G272.2-3.2
Type Ia SNRCC uncertain
102
103
104
105
Age in yrs (n = 1 cm−3
)
Fig. 8. Top panel: centroid energy and luminosity of Fe K lines detectedin SNRs. The main sample and values obtained with Suzaku are takenfrom Yamaguchi et al. (2014), augmented with XMM-Newton resultsfor DEM L71 (Maggi et al. 2016) and SNR G15.9+0.2 (this work), andSuzaku observations of Kes 79 (Sato et al. 2016) and SNR G272.2−3.2(Kamitsukasa et al. 2016). For the latter, only an upper limit is shownsince the distance is poorly constrained (2 to 10 kpc, e.g. Harrus et al.2001). Objects in red and blue are type Ia and CC SNRs, respectively.Those in grey are uncertain. Middle panel: histogram showing the dis-tribution of Fe K centroid energy in SNRs using the same colour codeas above. Bottom panel: expected centroid energy of the Fe K line in avpshock model as function of τ, for kT = 1.5 keV (black) and 5 keV(grey). The best-fit τ and range of centroid energy of SNR G15.9+0.2are indicated. The right-hand y-axis translates the ionisation timescaleτ into an age, for a uniform ambient density of ne = 1 cm−3.
22Ne, increases linearly with the initial metallicity (Timmes et al.2003; Badenes et al. 2008). At increasing η, yields of heavyneutron-rich elements (e.g. Mn and Ni) increase, that of Caand Ar decline, while that of Si remains constant (De et al.2014; Miles et al. 2016). The high Ar/Si and Ca/Si observed inSNR G15.9+0.2 could partly be explained by a progenitor witha lower than solar metallicity11. However, we cannot constrainthe progenitor mass (or metallicity) very well because of thelarge uncertainties (particularly Ar/Si and Ca/Si). Formally, themodel with a progenitor mass of 25 M� provides a good matchfor magnesium and predicts the highest ratios of S, Ar, andCa toSi, so it is marginally favoured.
4.2. Evolution of Fe K lines in SNRs
In a study of the Fe K emission in SNRs with Suzaku, Y14showed that the centroid energy separates the two types of SNRs;
11 These arguments come from studies of thermonuclear SNe. How-ever, the effect of neutronisation on Ca yield should qualitatively be thesame in the incomplete Si-burning and explosive O-burning layers in aCC SN, where most of Ca is produced (Thielemann et al. 1996).
A65, page 8 of 11

P. Maggi and F. Acero: Fe K and ejecta emission in SNR G15.9+0.2 with XMM-Newton
V = 40 => 65 km/s
16.17 16.00 15.83
0.33
0.17
0.00
-0.17
Galactic Longitude
Galactic Latitude
0 20 40 60 80 100 120 140
VLSR (km/s)
0
5
10
15
20
Distance (k(
c)
−0.5
0.0
0.5
1.0
1.5
2.0
2.5
12CO Tb (K)
0 20 40 60 80 100 120 140
VLSR (km/))
−0.5
0.0
0.5
1.0
1.5
2.0
2.5
3.0
3.5
NH (1022 cm−2 )
12CO
HI
Total
Fig. 9. Left: 12CO spectrum at the position of the source (red) with corresponding kinematic distance (blue). Middle: H i, 12CO, and total columndensities towards SNR G15.9+0.2 as a function of VLSR. Right: 13CO intensity map in the velocity range 18 km s−1 < VLSR < 32 km s−1, in units ofK km s−1. X-ray contours are overlaid in white. The black stripe comes from bad columns which have been set to 0.
the Fe-rich ejecta in Type Ia remnants are significantly lessionised than in core-collapse SNRs. This can naturally be ex-plained if the ambient medium around CC SNRs is modified(namely made denser) by mass loss episodes from the progen-itors, while relatively unaffected around type Ia SNe, becausethe ionisation timescale is controlled by ne.
Since there is strong evidence, as shown above, thatSNR G15.9+0.2 originates in a core-collapse SN, a high cen-troid energy is expected for the Fe K line. Instead we foundan intermediate value of 6577+73
−70 eV when following the samemethod as Yamaguchi et al. (i.e. one free-width Gaussian on theintegrated SNR spectrum), making SNR G15.9+0.2 the CC SNRwith the lowest Fe K centroid among the sample of Y14 (Fig. 8,top panel). The moderate spatial resolution enabled by the ex-isting XMM-Newton data reveals that the Fe K emission is non-uniform: In the Shell E region, we detect both ∼6.4 keV and∼6.65 keV signals attributable to contributions from pooly andhighly ionised iron, which in the overall spectrum produce a lineat the observed centroid of 6.58 keV.
The detection of a 6.4 keV line from a CC SNR is remark-able. Such a line has been found in CC SNRs Kes 79 (Sato et al.2016) and HESS J1745−303 (Bamba et al. 2009), but it was pro-posed not to be of ionised plasma origin. In Kes 79, the 6.4 keVemission is attributed to K-shell ionisation of neutral iron by theinteraction of locally accelerated protons with a nearby molec-ular cloud, while Bamba et al. (2009) suggested that the line inHESS J1745−303 was from an X-ray reflection nebula reflect-ing X-rays from previous Galactic centre activity off a molecularcloud. Neither of these scenarios are likely for SNR G15.9+0.2:There are no striking spatial correlations of the 6.4 keV emissionwith molecular clouds as in Kes 79 (see Fig. 9), nor reported de-tection of OH maser to support an interaction with molecularclouds (Green et al. 1997). An X-ray reflection nebula origin, asin HESS J1745−303, is also not favoured given the lack of a suit-able nearby hard X-ray source, and the poor spatial correlationbetween the 6.4 keV emission and molecular material.
In SNR G15.9+0.2, an ionised plasma origin is favoured.The variations in ionisation between east and west regions, andinner/outer parts of Shell E (Sect. 3.2.2) points to a range ofnet due to variations in the ambient density encountered bythe shock, or to different times since the plasma was shocked.The material in the east could be part of a cavity that theshock encountered recently, akin to the case in the type Ia SNRRCW 86 (Broersen et al. 2014). Such density variations and/or
cavities are likely to be common, especially around young CCSNRs, but are hard to observe, except in the brightest and moreextended sources. As another instance, Safi-Harb et al. (2005)found different Fe K centroids in eastern and western regions of3C 397, attributed to density gradients.
Patnaude et al. (2015) have modelled CC SNe exploding inCSM modified by progenitors’ winds and followed their dynam-ics (i.e. shock radius) and spectral evolution of Fe K emission(centroid and luminosity). Although these models were able toreproduce the higher centroids (above 6550 eV) observed inCC SNRs, there were many outliers where either the correctshock radius and centroid were not reproduced by the models, orwhere the Fe K luminosity was severely underpredicted. PlacingSNR G15.9+0.2 in that context, the bulk Fe K properties (in par-ticular its low centroid) and size of about 4 (D / 5 kpc) pc (seeSect. 3.1) can be reproduced by their SN 1987A or SN 1993Jmodels (e.g. Fig. 2, Patnaude et al. 2015). The low Fe K lumi-nosity of SNR G15.9+0.2 (∼2× 1040 (D / 5 kpc) photon s−1) canbe reproduced by most of their models in the lower mass lossrate/higher wind velocity cases.
Regardless of type, the distribution of Fe K centroids inSNRs is peaked at the low- and high-energy ends (see Fig. 8,middle panel) with relatively few objects between 6.5 keVand 6.6 keV. This is due to the rapid transition between aroughly 6.4 keV centroid (no iron above the Fexvii state) anda 6.6−6.7 keV centroid (most iron above Fexx). To illustratethis, we simulated emission from a pure-iron ionising plasma(vpshock in XSPEC) at kT = 1.5 keV and 5 keV, with τ between108 s cm−3 and 5 × 10¹³ s cm−3. Fake spectra were produced us-ing the EPIC-pn response and analysed in the same fashion as inY14 and in this work. The curves of the expected centroids areshown in the bottom panel of Fig. 8. The Fe K transition occursbriefly, or more specifically over a small τ interval, between afew 1010 s cm−3 and a few 1011 s cm−3. For SNRs expandingin a constant ambient density of ne = 1 cm−3, this happens atan age of ∼1000−5000 yr. The oldest type Ia SNRs in the sam-ple of Y14 are from 4500 to 6000 yr old (SNR G337.2−0.7 andSNR G344.7−0.1). They are associated with relatively low den-sity (ne ∼ 0.3 to 0.8 cm−3, Rakowski et al. 2006; Giacani et al.2011) so that a low Fe ionisation is expected even at this age.
The possibility remains open for a type Ia SNR in a densermedium (&2 cm−3) to reach a high ionisation of iron withina few thousand years and populate the Fe K centroid regiondominated so far by CC SNRs. Without definitive evidence as
A65, page 9 of 11

A&A 597, A65 (2017)
to its type (Park et al. 2012), N49 might be such an object,since it is interacting with a relatively high density (at least 2–25 cm−3, Sankrit et al. 2004; Dopita et al. 2016). Symmetrically,it can not excluded that some CC SNRs are found at the lowionisation end. Part of SNR G15.9+0.2, for instance, still hasemission at 6.4 keV, while SNR G352.7−0.1 has an Fe K cen-troid at 6.44 keV and is also of uncertain type; some studiessuggest that it is the remnant a CC SNR (Giacani et al. 2009;Pannuti et al. 2014). Another caveat is that the current sampleof Fe K emitting objects inherently contains some age bias, theyoungest objects being preeminently of type Ia. There are sixtype Ia SNRs younger than ∼1000 yr, but only three CC SNRsbelow the 2000 yr mark. Together with the lower density ex-pected around type Ia SN progenitors, this bias contributes toseparate the Fe K centroids of both classes. We conclude that theFe K centroid-luminosity diagram provides valuable informationabout an SNR, but care should be taken when using it as a typingtool without any knowledge of the surrounding medium or indi-cation of age. This is particularly true for unresolved objects, e.g.young SNRs in external galaxies, or objects where the nature ofthe Fe K emission is unknown and might not be from an ionisedplasma, as is the case in Kes 79 and HESS J1745−303.
4.3. Constraining the age of and distance to SNR G15.9+0.2
To constrain the distance to the SNR, we compared the absorp-tion along the line of sight derived from the X-ray and fromH i and 12CO (1−0) observations. Figure 9 (left panel) showsthe velocity spectra at the SNR centre (RA = 18h18m53.8s,Dec = −15◦01m38s) integrated within a radius of 3′. The 12COobservations are from the CfA survey (Dame et al. 2001) and theH i data from the SGPS survey (Haverkorn et al. 2006). The cor-responding kinematic distances assuming the circular Galacticrotation model of Hou et al. (2009) with a distance to the Galac-tic center of 8 kpc are also shown. We note that the bulk ofthe material along the line of sight is at radial velocities rela-tive to the local standard of rest (LSR) of VLSR < 60 km s−1
which is equivalent to a lower limit on the distance of 5 kpc.The cumulative NH derived from H i and 12CO as a functionof VLSR is shown in Fig. 9 (middle panel) where all the ma-terial is assumed to be at the near distance allowed by theGalactic rotation curve, providing therefore a lower limit onthe distance. The CO-to-H2 mass conversion factor and the H ibrightness temperature to column density used is respectivelyof 1.8 × 1020 cm−2 K−1 km−1 s (Dame et al. 2001) and 1.82 ×1018 cm−2 K−1 km−1 s (Dickey & Lockman 1990).
Most of the absorption along the line of sight is due to thestructures at VLSR < 60 km s−1, representing an integrated NH =2.2×1022 cm−2. With an X-ray absorption value of 4.58±0.11×1022 cm−2 (see Table 3), we argue that the SNR is behind thesestructures and set a strict lower limit to its distance at 5 kpc. Thisis consistent with the results of a carbon atmosphere fit to theCCO emission (Klochkov et al. 2016) that yields a large distance(although highly uncertain) of 10+9
−5 kpc.However, the total NH integrated along the entire velocity
range derived from H i and 12CO amounts to ∼3.5 × 1022 cm−2,still significantly less than the X-ray value. This discrepancycould be due to an inadequate value of the CO-to-H2 mass con-version factor which can vary within the Galaxy (e.g. Remy et al.2015) or missing material not traced by HI or 12CO emission. Inparticular in dense molecular clouds, the core of the cloud is notwell traced by 12CO owing to saturation of the emission.
The 13CO (1−0) line emission provides a tracer to inves-tigate the core of the dense molecular clouds. In Fig. 9 (right
panel), we show the high-resolution 13CO intensity map12 fromthe GRS survey (Jackson et al. 2006). This map was obtained byintegrating velocities between 18 km s−1 < VLSR < 32 km s−1
corresponding to main peak of 13CO emission located at thesame velocity as the brightest 12CO peak shown in Fig. 9. Thismaterial is likely in the foreground of the SNR. Small clouds areseen at the position of the shell E and shell SW regions, explain-ing the spatial variations of NH found in Sect. 3.2.1.
To investigate the age of the SNR in more detail, we used theequations describing the evolution of the forward shock R pre-sented by Truelove & McKee (1999) and generalised to a steadystellar wind environment with ρ(r) ∝ r−2 by Laming & Hwang(2003) and Hwang & Laming (2012). We fixed the explosion en-ergy to E = 1051 ergs, n = 9, and s = 2, where n, and s are theejecta and ambient medium density profile (ρ(r) ∝ r−n,s). Theejecta mass was fixed to 14 M� (for an initial progenitor massof 25 M�) according to mass budget models of core-collapse su-pernovae by Sukhbold et al. (2016).
The ambient medium density is derived from the X-ray ther-mal emission of the faint NW, the least affected by ejecta andtherefore best representing shocked ISM. The normalisation ofthe fiducial model in that region (Table 3) is proportional to thevolume emission measure
∫nenHdV , which can be linked to the
pre-shock ambient hydrogen density nH,0 assuming a Sedov pro-file (e.g. Maggi et al. 2014, Eq. (1)). With the uncertainties onthe normalisation in the faint NW region, we measure a range ofnH,0 = (0.36−0.70) (D / 5 kpc)−1/2 cm−3.
Considering the lower limit on the distance of 5 kpc derivedabove, we obtain a lower limit on the age of 2 kyr. This repro-duces the observed angular distance (3.7′) between the CCO andthe tip of the faint NW region (Fig. 2). If the SNR is near theGalactic centre, at a distance of 8.5 kpc as assumed by R06, theage estimate is ∼(4.5−6) kyr. In the case where the shock hasevolved only a small fraction of its lifetime in the steep windprofile, and quickly after evolved in the uniform shocked windregion (assuming therefore s = 0), the corresponding ages aretSNR > 1.6 kyr and t ∼ (3.5−4) kyr for a distance of 5 and 8.5 kpc,respectively.
5. Summary
We have studied the Galactic SNR G15.9+0.2, observed se-rendipitously with XMM-Newton. The remnant exhibits a shellmorphology with the brightest regions in the east and south-west, and the faintest and softest to the north-west. Ele-mental abundances, particularly in the bright regions, aremarkedly supersolar, betraying a SN ejecta origin. Analysisof the ejecta abundance pattern establishes SNR G15.9+0.2 asa core-collapse SNR and suggests a progenitor mass of20–25 M�. This makes the physical association with theCCO CXOU J181852.0−150213 detected in its interior verylikely.
We report for the first time detection of Fe K emission fromSNR G15.9+0.2, using a careful treatment of all backgroundcomponents to ensure that this signal is genuinely from the SNR.We detect signal at both the low (6.4 keV) and high (6.67 keV)ionisation end of the line, with spatial variation across the SNR.Because SNR G15.9+0.2 is the core-collapse SNR with the low-est overall Fe K centroid energy, caution should be used whentyping SNRs based on this criterion alone.
Matching the X-ray NH to atomic and molecular gas struc-tures along the line of sight, we set a conservative limit of 5 kpc
12 0.4′ pixel size for the 13CO map vs. 7′ pixels for the 12CO map.
A65, page 10 of 11

P. Maggi and F. Acero: Fe K and ejecta emission in SNR G15.9+0.2 with XMM-Newton
for the distance towards the source. At such distances and for areasonable set of parameters affecting the remnant’s dynamics,we constrain its age to be likely more than 2000 yr.
Acknowledgements. The authors thank the anonymous referee for helping usto improve the discussion of our results. We thank Carles Badenes for helpfuldiscussions about SN nucleosynthesis. P. M. acknowledges support by the Cen-tre National d’Études Spatiales (CNES). This research has made use of Aladin,SIMBAD, and VizieR, operated at the CDS, Strasbourg, France.
ReferencesArnaud, K. A. 1996, in Astronomical Data Analysis Software and Systems V,
eds. G. H. Jacoby, & J. Barnes, ASP Conf. Ser., 101, 17Badenes, C., Bravo, E., Borkowski, K. J., & Domínguez, I. 2003, ApJ, 593, 358Badenes, C., Bravo, E., & Hughes, J. P. 2008, ApJ, 680, L33Balucinska-Church, M., & McCammon, D. 1992, ApJ, 400, 699Bamba, A., Yamazaki, R., Kohri, K., et al. 2009, ApJ, 691, 1854Borkowski, K. J., Lyerly, W. J., & Reynolds, S. P. 2001, ApJ, 548, 820Broersen, S., Chiotellis, A., Vink, J., & Bamba, A. 2014, MNRAS, 441, 3040Cackett, E. M., Miller, J. M., Ballantyne, D. R., et al. 2010, ApJ, 720, 205Cackett, E. M., Miller, J. M., Reis, R. C., Fabian, A. C., & Barret, D. 2012, ApJ,
755, 27Cash, W. 1979, ApJ, 228, 939Clark, D. H., Caswell, J. L., & Green, A. J. 1973, Nature, 246, 28Clark, D. H., Caswell, J. L., & Green, A. J. 1975, Aust. J. Phys. Astrophys.
Suppl., 37, 1Combi, J. A., Albacete Colombo, J. F., López-Santiago, J., et al. 2010, A&A,
522, A50Dame, T. M., Hartmann, D., & Thaddeus, P. 2001, ApJ, 547, 792De, S., Timmes, F. X., Brown, E. F., et al. 2014, ApJ, 787, 149de Luca, A. 2008, in 40 Years of Pulsars: Millisecond Pulsars, Magnetars and
More, eds. C. Bassa, Z. Wang, A. Cumming, & V. M. Kaspi, AIP Conf. Ser.,983, 311
De Luca, A., & Molendi, S. 2004, A&A, 419, 837De Luca, A., Caraveo, P. A., Mereghetti, S., Tiengo, A., & Bignami, G. F. 2006,
Science, 313, 814Dickey, J. M., & Lockman, F. J. 1990, ARA&A, 28, 215Dopita, M. A., Seitenzahl, I. R., Sutherland, R. S., et al. 2016, ApJ, 826, 150Dubner, G. M., Giacani, E. B., Goss, W. M., Moffett, D. A., & Holdaway, M.
1996, AJ, 111, 1304Ferrand, G., & Safi-Harb, S. 2012, Adv. Space Res., 49, 1313Giacani, E., Smith, M. J. S., Dubner, G., et al. 2009, A&A, 507, 841Giacani, E., Smith, M. J. S., Dubner, G., & Loiseau, N. 2011, A&A, 531, A138Green, A. J., Frail, D. A., Goss, W. M., & Otrupcek, R. 1997, AJ, 114, 2058Halpern, J. P., & Gotthelf, E. V. 2010, ApJ, 709, 436Harrus, I. M., Slane, P. O., Smith, R. K., & Hughes, J. P. 2001, ApJ, 552, 614Haverkorn, M., Gaensler, B. M., McClure-Griffiths, N. M., Dickey, J. M., &
Green, A. J. 2006, ApJS, 167, 230Hou, L. G., Han, J. L., & Shi, W. B. 2009, A&A, 499, 473Hwang, U., & Laming, J. M. 2012, ApJ, 746, 130
Jackson, J. M., Rathborne, J. M., Shah, R. Y., et al. 2006, ApJS, 163, 145Kamitsukasa, F., Koyama, K., Nakajima, H., et al. 2016, PASJ, 68, S7Katsuda, S., Acero, F., Tominaga, N., et al. 2015, ApJ, 814, 29Klochkov, D., Suleimanov, V., Sasaki, M., & Santangelo, A. 2016, A&A, 592,
L12Kosenko, D., Helder, E. A., & Vink, J. 2010, A&A, 519, A11Koyama, K., Makishima, K., Tanaka, Y., & Tsunemi, H. 1986, PASJ, 38, 121Kuntz, K. D., & Snowden, S. L. 2008, A&A, 478, 575Kushino, A., Ishisaki, Y., Morita, U., et al. 2002, PASJ, 54, 327Laming, J. M., & Hwang, U. 2003, ApJ, 597, 347Lazendic, J. S., Slane, P. O., Hughes, J. P., Chen, Y., & Dame, T. M. 2005, ApJ,
618, 733Lin, D., Remillard, R. A., Homan, J., & Barret, D. 2012, ApJ, 756, 34Lopez, L. A., Ramirez-Ruiz, E., Badenes, C., et al. 2009, ApJ, 706, L106Lopez, L. A., Ramirez-Ruiz, E., Huppenkothen, D., Badenes, C., & Pooley, D. A.
2011, ApJ, 732, 114Lumb, D. H., Warwick, R. S., Page, M., & De Luca, A. 2002, A&A, 389, 93Maggi, P., Haberl, F., Kavanagh, P. J., et al. 2014, A&A, 561, A76Maggi, P., Haberl, F., Kavanagh, P. J., et al. 2016, A&A, 585, A162McLaughlin, M. A., Rea, N., Gaensler, B. M., et al. 2007, ApJ, 670, 1307Miles, B. J., van Rossum, D. R., Townsley, D. M., et al. 2016, ApJ, 824, 59Miller, J. J., McLaughlin, M. A., Rea, N., et al. 2013, ApJ, 776, 104Nomoto, K., Tominaga, N., Umeda, H., Kobayashi, C., & Maeda, K. 2006, Nucl.
Phys. A, 777, 424Pannuti, T. G., Kargaltsev, O., Napier, J. P., & Brehm, D. 2014, ApJ, 782, 102Park, S., Hughes, J. P., Slane, P. O., et al. 2012, ApJ, 748, 117Patnaude, D. J., Lee, S.-H., Slane, P. O., et al. 2015, ApJ, 803, 101Pavlov, G. G., Sanwal, D., & Teter, M. A. 2004, in Young Neutron Stars and
Their Environments, eds. F. Camilo, & B. M. Gaensler, IAU Symp., 218, 239Pinheiro Gonçalves, D., Noriega-Crespo, A., Paladini, R., Martin, P. G., & Carey,
S. J. 2011, AJ, 142, 47Rakowski, C. E., Badenes, C., Gaensler, B. M., et al. 2006, ApJ, 646, 982Remy, Q., Grenier, I. A., Marshall, D. J., Casandjian, J. M., & Fermi LAT
Collaboration 2015, Mem. Soc. Astron. It., 86, 616Revnivtsev, M., Gilfanov, M., Jahoda, K., & Sunyaev, R. 2005, A&A, 444, 381Reynolds, S. P., Borkowski, K. J., Gaensler, B. M., et al. 2006a, ApJ, 639, L71Reynolds, S. P., Borkowski, K. J., Hwang, U., et al. 2006b, ApJ, 652, L45Safi-Harb, S., Dubner, G., Petre, R., Holt, S. S., & Durouchoux, P. 2005, ApJ,
618, 321Sánchez-Ayaso, E., Combi, J. A., Albacete Colombo, J. F., et al. 2012, Ap&SS,
337, 573Sankrit, R., Blair, W. P., & Raymond, J. C. 2004, AJ, 128, 1615Sato, T., Koyama, K., Lee, S.-H., & Takahashi, T. 2016, PASJ, 68, S8Sturm, R. K. N. 2012, Ph.D. Thesis, Fakultät für Physik, Technische Universität
München, GermanySukhbold, T., Ertl, T., Woosley, S. E., Brown, J. M., & Janka, H.-T. 2016, ApJ,
821, 38Thielemann, F.-K., Nomoto, K., & Hashimoto, M.-A. 1996, ApJ, 460, 408Timmes, F. X., Brown, E. F., & Truran, J. W. 2003, ApJ, 590, L83Truelove, J. K., & McKee, C. F. 1999, ApJS, 120, 299Watson, M. G., Schröder, A. C., Fyfe, D., et al. 2009, A&A, 493, 339Wilms, J., Allen, A., & McCray, R. 2000, ApJ, 542, 914Yamaguchi, H., Badenes, C., Petre, R., et al. 2014, ApJ, 785, L27
A65, page 11 of 11