The Hubble Space Telescope Wide Field Camera 3 Early Release Science Data: Panchromatic Faint Object...
51
Resubmitted to the Astrophysical Journal Supplement Series, December, 2010 Preprint typeset using L A T E X style emulateapj v. 03/07/07 THE HUBBLE SPACE TELESCOPE WIDE FIELD CAMERA 3 EARLY RELEASE SCIENCE DATA: PANCHROMATIC FAINT OBJECT COUNTS FOR 0.2–2 MICRONS WAVELENGTH * Rogier A. Windhorst 1 , Seth H. Cohen 1 , Nimish P. Hathi 2 , Patrick J. McCarthy 3 , Russell E. Ryan, Jr. 4 , Haojing Yan 5 , Ivan K. Baldry 6 , Simon P. Driver 7 , Jay A. Frogel 8 , David T. Hill 7 , Lee S. Kelvin 7 , Anton M. Koekemoer 9 , Matt Mechtley 1 , Robert W. O’Connell 10 , Aaron S. G. Robotham 7 , Michael J. Rutkowski 1 , Mark Seibert 3 , Amber N. Straughn 11 , Richard J. Tuffs 12 , Bruce Balick 13 , Howard E. Bond 9 , Howard Bushouse 9 , Daniela Calzetti 14 , R. Mark Crockett 15 , Michael J. Disney 16 , Michael A. Dopita 17 , Donald N. B. Hall 18 , Jon A. Holtzman 19 , Sugata Kaviraj 15 , Randy A. Kimble 11 , John W. MacKenty 9 , Max Mutchler 9 , Francesco Paresce 20 , Abihit Saha 21 , Joseph I. Silk 14 , John T. Trauger 22 , Alistair R. Walker 23 , Bradley C. Whitmore 9 , & Erick T. Young 24 Resubmitted to the Astrophysical Journal Supplement Series, December, 2010 ABSTRACT We describe the Hubble Space Telescope (HST) Wide Field Camera 3 (WFC3) Early Re- lease Science (ERS) observations in the Great Observatories Origins Deep Survey (GOODS) South field. The new WFC3 ERS data provide calibrated, drizzled mosaics in the UV filters F225W, F275W, and F336W, as well as in the near-IR filters F098M (Y s ), F125W (J), and F160W (H) with 1–2 HST orbits per filter. Together with the existing HST Advanced Camera for Surveys (ACS) GOODS-South mosaics in the BViz filters, these panchromatic 10-band ERS data cover 40–50 square arcmin at 0.2–1.7 μm in wavelength at 0 00 . 07–0 00 . 15 FWHM resolution and 0 00 . 090 Multidrizzled pixels to depths of AB’26.0–27.0 mag (5-σ) for point sources, and AB’25.5–26.5 mag for compact galaxies. In this paper, we describe: a) the scientific rationale, and the data taking plus reduction procedures of the panchromatic 10-band ERS mosaics; b) the procedure of generating object catalogs across the 10 different ERS filters, and the specific star-galaxy separation techniques used; and c) the reliability and completeness of the object catalogs from the WFC3 ERS mosaics. The excellent 0 00 . 07–0 00 . 15 FWHM resolution of HST/WFC3 and ACS makes star- galaxy separation straightforward over a factor of 10 in wavelength to AB’25–26 mag from the UV to the near-IR, respectively. Our main results are: 1) Proper motion of faint ERS stars is detected over 6-years at 3.06±0.66 m.a.s./year (4.6-σ), consistent with Galactic structure models; 2) Both the Galac- tic star counts and the galaxy counts show mild but significant trends of decreasing count slopes from the mid–UV to the near-IR over a factor of 10 in wavelength; 3) Combining the 10-band ERS counts with the panchromatic Galaxy and Mass Assembly (GAMA) sur- vey counts at the bright end (10 < ∼ AB < ∼ 20 mag) and the Hubble Ultra Deep Field (HUDF) counts in the BVizY s JH filters at the faint end (24 < ∼ AB < ∼ 30 mag) yields galaxy counts that are well measured over the entire flux range 10 < ∼ AB < ∼ 30 mag for 0.2–2 μm in wavelength; 4) Simple luminosity+density evolution models can fit the galaxy counts over this entire flux range. However, no single model can explain the counts over this entire flux range in all 10 filters simultaneously. More sophisticated models of galaxy assembly are needed to reproduce the overall constraints provided by the current panchromatic galaxy counts for 10 < ∼ AB < ∼ 30 mag over a factor of 10 in wavelength. Subject headings: galactic structure — galaxies: evolution — galaxies: counts — galaxies: luminosity function, mass function — infrared: galaxies — ultraviolet: galaxies * BASED ON OBSERVATIONS MADE WITH THE NASA/ESA HUBBLE SPACE TELESCOPE, WHICH IS OPERATED BY THE ASSOCIATION OF UNIVERSITIES FOR RESEARCH IN ASTRONOMY, INC., UNDER NASA CONTRACT NAS 5-26555. Electronic address: [email protected] 1 School of Earth and Space Exploration, Arizona State University, P.O. Box 871404, Tempe, AZ 85287-1404 2 Department of Physics & Astronomy, University of Cal- ifornia, Riverside, CA 92521 3 Observatories of the Carnegie Institution of Washington, Pasadena, CA 91101-1292 4 Department of Physics, University of California, One Shields Avenue, Davis, CA 95616 5 Center for Cosmology and AstroParticle Physics, The Ohio State University, Columbus, OH 43210 6 Astrophysics Research Institute, Liverpool John Moores University, Birkenhead CH41 1LD, United Kingdom arXiv:1005.2776v3 [astro-ph.CO] 28 Jan 2011
Transcript of The Hubble Space Telescope Wide Field Camera 3 Early Release Science Data: Panchromatic Faint Object...

Resubmitted to the Astrophysical Journal Supplement Series, December, 2010Preprint typeset using LATEX style emulateapj v. 03/07/07
THE HUBBLE SPACE TELESCOPE WIDE FIELD CAMERA 3 EARLY RELEASE SCIENCE DATA:PANCHROMATIC FAINT OBJECT COUNTS FOR 0.2–2 MICRONS WAVELENGTH ∗
Rogier A. Windhorst 1, Seth H. Cohen 1, Nimish P. Hathi 2, Patrick J. McCarthy 3, Russell E. Ryan,Jr. 4, Haojing Yan 5, Ivan K. Baldry 6, Simon P. Driver 7, Jay A. Frogel 8, David T. Hill 7, Lee S.
Kelvin 7, Anton M. Koekemoer 9, Matt Mechtley 1, Robert W. O’Connell 10, Aaron S. G.Robotham 7, Michael J. Rutkowski 1, Mark Seibert 3, Amber N. Straughn 11, Richard J. Tuffs 12,
Bruce Balick 13, Howard E. Bond 9, Howard Bushouse 9, Daniela Calzetti 14, R. Mark Crockett 15,Michael J. Disney 16, Michael A. Dopita 17, Donald N. B. Hall 18, Jon A. Holtzman 19, Sugata
Kaviraj 15, Randy A. Kimble 11, John W. MacKenty 9, Max Mutchler 9, Francesco Paresce20, AbihitSaha 21, Joseph I. Silk 14, John T. Trauger 22, Alistair R. Walker 23, Bradley C. Whitmore 9, & Erick
T. Young 24
Resubmitted to the Astrophysical Journal Supplement Series, December, 2010
ABSTRACT
We describe the Hubble Space Telescope (HST) Wide Field Camera 3 (WFC3) Early Re-lease Science (ERS) observations in the Great Observatories Origins Deep Survey (GOODS)South field. The new WFC3 ERS data provide calibrated, drizzled mosaics in the UV filtersF225W, F275W, and F336W, as well as in the near-IR filters F098M (Ys), F125W (J),and F160W (H) with 1–2 HST orbits per filter. Together with the existing HST AdvancedCamera for Surveys (ACS) GOODS-South mosaics in the BViz filters, these panchromatic10-band ERS data cover 40–50 square arcmin at 0.2–1.7 µm in wavelength at 0′′.07–0′′.15FWHM resolution and 0′′.090 Multidrizzled pixels to depths of AB'26.0–27.0 mag (5-σ) forpoint sources, and AB'25.5–26.5 mag for compact galaxies.
In this paper, we describe: a) the scientific rationale, and the data taking plus reductionprocedures of the panchromatic 10-band ERS mosaics; b) the procedure of generating objectcatalogs across the 10 different ERS filters, and the specific star-galaxy separation techniquesused; and c) the reliability and completeness of the object catalogs from the WFC3 ERSmosaics. The excellent 0′′.07–0′′.15 FWHM resolution of HST/WFC3 and ACS makes star-galaxy separation straightforward over a factor of 10 in wavelength to AB'25–26 mag fromthe UV to the near-IR, respectively.
Our main results are: 1) Proper motion of faint ERS stars is detected over 6-years at3.06±0.66 m.a.s./year (4.6-σ), consistent with Galactic structure models; 2) Both the Galac-tic star counts and the galaxy counts show mild but significant trends of decreasing countslopes from the mid–UV to the near-IR over a factor of 10 in wavelength; 3) Combiningthe 10-band ERS counts with the panchromatic Galaxy and Mass Assembly (GAMA) sur-vey counts at the bright end (10<
∼ AB<∼ 20 mag) and the Hubble Ultra Deep Field (HUDF)
counts in the BVizYsJH filters at the faint end (24<∼ AB<
∼ 30 mag) yields galaxy counts thatare well measured over the entire flux range 10<
∼ AB<∼ 30 mag for 0.2–2 µm in wavelength;
4) Simple luminosity+density evolution models can fit the galaxy counts over this entireflux range. However, no single model can explain the counts over this entire flux range inall 10 filters simultaneously. More sophisticated models of galaxy assembly are needed toreproduce the overall constraints provided by the current panchromatic galaxy counts for10<
∼ AB<∼ 30 mag over a factor of 10 in wavelength.
Subject headings: galactic structure — galaxies: evolution — galaxies: counts — galaxies:luminosity function, mass function — infrared: galaxies — ultraviolet:galaxies
∗BASED ON OBSERVATIONS MADE WITH THENASA/ESA HUBBLE SPACE TELESCOPE, WHICH ISOPERATED BY THE ASSOCIATION OF UNIVERSITIESFOR RESEARCH IN ASTRONOMY, INC., UNDER NASACONTRACT NAS 5-26555.Electronic address: [email protected]
1 School of Earth and Space Exploration, Arizona StateUniversity, P.O. Box 871404, Tempe, AZ 85287-1404
2 Department of Physics & Astronomy, University of Cal-
ifornia, Riverside, CA 925213 Observatories of the Carnegie Institution of Washington,
Pasadena, CA 91101-12924 Department of Physics, University of California, One
Shields Avenue, Davis, CA 956165 Center for Cosmology and AstroParticle Physics, The
Ohio State University, Columbus, OH 432106 Astrophysics Research Institute, Liverpool John Moores
University, Birkenhead CH41 1LD, United Kingdom
arX
iv:1
005.
2776
v3 [
astr
o-ph
.CO
] 2
8 Ja
n 20
11

2
1. INTRODUCTION
The study of the formation and evolution of galax-ies and large scale structure are amongst the mostactive interfaces between theory and observation inmodern astrophysics. Galaxies are believed to haveformed gradually over cosmic time from a combina-tion of gas infall and mergers (Hopkins et al. 2006),regulated by feedback from stellar winds, super-novae, and/or AGN (i.e., Scannapieco et al. 2005;di Matteo, Springel, & Hernquist 2005). The originof the Hubble sequence is not yet fully understood(e.g., Driver et al. 1998), but is likely related to thebalance between major mergers versus minor accre-tion events and steady infall (i.e., Conselice et al.2003; Hopkins et al. 2010; Peng et al. 2010). Thecritical epoch for the assembly of massive galaxiesappears to be the ∼4 Gyr span from redshift z'3to z'1, where also the cosmic star-formation historyseems to have peaked (Madau, Pozzetti, & Dickin-son 1998; Hopkins 2004; Hopkins & Beacom 2006).
At redshifts >∼ 2–3, deep Hubble Space Telescope
(HST) imaging surveys and ground-based spec-troscopy have revealed a paucity of massive galaxiesand few classical disks or spheroids (e.g., Law et al.2007, 2009). In contrast, large ground-based spec-troscopic surveys targeting redshifts z<
∼ 1 — cou-pled with HST imaging — have shown that by thisepoch massive galaxies are largely mature, and thatthe Hubble sequence has been mostly established(e.g., Abraham et al. 1996, 1999, 2007; Driver et al.1995, 1998; Glazebrook et al. 1995; Lilly et al. 1998).
7 School of Physics and Astronomy, University of St An-drews, Fife KY16 9SS, UK
8 Association of Universities for Research in Astronomy,Washington, DC 20005
9 Space Telescope Science Institute, Baltimore, MD 2121810 Department of Astronomy, University of Virginia, Char-
lottesville, VA 22904-432511 NASA–Goddard Space Flight Center, Greenbelt, MD
2077112 Max Planck Institute for Nuclear Physics (MPIK),
Saupfercheckweg 1, D-69117 Heidelberg, Germany13 Department of Astronomy, University of Washington,
Seattle, WA 98195-158014 Department of Astronomy, University of Massachusetts,
Amherst, MA 0100315 Department of Physics, University of Oxford, Oxford
OX1 3PU, United Kingdom16 School of Physics and Astronomy, Cardiff University,
Cardiff CF24 3AA, United Kingdom17 Research School of Astronomy & Astrophysics, The
Australian National University, Weston Creek, ACT 2611,Australia
18 Institute for Astronomy, University of Hawaii, Honolulu,HI 96822
19 Department of Astronomy, New Mexico State Univer-sity, Las Cruces, NM 88003
20 INAF–IASF Bologna, Via Gobetti 101, 40129 Bologna,Italy
21 National Optical Astronomy Observatories, Tucson, AZ85726-6732
22 NASA–Jet Propulsion Laboratory, Pasadena, CA 9110923 Cerro Tololo Inter-American Observatory, La Serena,
Chile24 NASA–Ames Research Center, Moffett Field, CA 94035
While substantial growth (∼50%) in the stellar massof all galaxy types — including spheroids — mayhave occurred during the last ∼7 Gyr, the processof major galaxy assembly was well underway by z'1(e.g., de Lucia et al. 2006; Dickinson et al. 2003).The interim period — from redshifts of z'3 to z'1— is the era in which much of the stellar mass ingalaxies is accumulated (e.g., Dickinson et al. 2003;Abraham et al. 2007), and when galaxies acquire thecharacteristic structural and dynamical propertiesthat define them today. The HST Wide Field Cam-era 3 (WFC3) was optimized to study this criticalperiod of galaxy assembly.
WFC3 was successfully installed into HST on May14, 2009, by the astronauts on-board Space ShuttleAtlantis during the Space Transportation Systemmission 125 (STS-125). This shuttle mission wasthe fifth Servicing Mission of HST, however, for his-torical reasons, it is referred to as SM4. Many of thecurrent co-authors were members of the WFC3 Sci-ence Oversight Committee (SOC) from July 1998through November 2009. Our main role as the SOCwas to define the WFC3 science requirements andgoals, monitor them during the pre-launch phasesof the project, and to oversee the design, implemen-tation, integration, and testing (both ground-basedand on-orbit) of the WFC3 instrument.
The WFC3 provides a unique opportunity to com-pare the galaxy populations in the local and dis-tant universe. With its wide spectral coverage (0.2–1.7 µm), very high spatial resolution (0′′.04 FWHMat 0.2µm to 0′′.16 FWHM at 1.6µm), fine pixelsampling (0′′.039/pixel in the UVIS channel and0′′.13/pixel in the IR channel), and high sensitivity(AB'26–27 mag in 2 orbits; 5-σ for point sources),many new interesting questions and outstandingproblems can be addressed with the WFC3 data.By sampling the vacuum UV with high sensitivityand the very high angular resolution afforded by thediffraction limited 2.4 m Hubble Space Telescope,WFC3 can observe star-forming regions in galaxiesover most of the Hubble time. The near-IR channelon WFC3 allows one to do restframe visible-bandphotometry of distant galaxies to low luminositiesand over areas large enough to provide representa-tive samples. Together, the panchromatic imagesproduced by WFC3 allow the user to decomposedistant galaxies into their constituent substructures,examine their internal stellar populations, and helpconstrain their dust content. In this Early ReleaseScience (ERS) program, the UVIS and IR channelsof WFC3 are used to provide a small, but repre-sentative sampling of the capabilities of WFC3 toexamine the formation and evolution of galaxies inthe critical galaxy assembly epoch of z'1–3, whenthe universe was only 6–2 Gyrs old, respectively.
Details of the HST WFC3 ERS program (PID#11359; PI R. O’Connell) can be found on this

3
URL25. The current ERS program was specificallyconceived to make maximum use of these WFC3capabilities, and to make an optimal comparisonbetween the intermediate and high redshift galaxysamples identified in the current ERS program andnearby galaxies imaged in other HST programs.These capabilities were important WFC3 sciencedrivers, while the instrument was designed and con-structed from 1998 to 2008.
In the year that the intermediate redshift WFC3ERS data has been available, a number of papershave appeared or submitted that use this panchro-matic data set. For instance, Ryan et al. (2010)discuss the evolution of passive galaxies using theWFC3 ERS observations, and make a detailed studyof their size evolution over cosmic time. Rutkowskiet al. (2011) present a panchromatic catalog of early-type galaxies at intermediate redshifts (z'0.3–1.5)from the WFC3 ERS data, and derive their rest-frame (FUV–V) and (NUV–V) colors as a func-tion of redshift. Cohen et al. (2011) present a ten-band photometric study of distant galaxies in theWFC3 ERS data, measure reliable photometric red-shifts, and derive their physical properties with cos-mic time. Hathi et al. (2010) discuss UV-dropoutgalaxies in the GOODS-South at redshifts z'1.5–3 from the WFC3 ERS data, and summarize theevolution of the faint-end luminosity function (LF)slope α and characteristic luminosity L∗ from z'8to z'0. Oesch et al. (2010b) similarly discuss theevolution of the ultraviolet luminosity function fromz∼0.75 to z∼ 2.5. Straughn et al. (2011) study faintemission-line galaxies from the WFC3 ERS IR grismobservations. Van Dokkum & Brammer (2010) dis-cuss WFC3 grism spectra and images of one growingcompact galaxy at z'1.9. Finkelstein et al. (2011)discuss spatially resolved imaging of Lyα emissionline objects at z'4.4 through parallel ACS F658Nnarrow-band images to the WFC3 ERS data, andtheir constraints as to how Lyman continuum pho-tons escape from such objects.
Labbe et al. (2010) discuss the star formationrates and stellar masses of z'7–8 galaxies fromIRAC observations of the WFC3/IR ERS and Hub-ble Ultra Deep Field (HUDF) fields. Robertson(2010) estimates how to best improve the LF con-straints from high redshift galaxy surveys usingWFC3 ERS data and from additional deep WFC3survey data yet to be obtained. Bouwens et al.(2010a) discuss potentially very blue UV-continuumslopes of low luminosity galaxies at z'7 from theWFC3 ERS IR data, and their possible implicationsfor very low metallicities in these objects. Bouwenset al. (2010b) also discuss z'8 galaxy candidatesseen in the ultradeep WFC3/IR observations of theHUDF. Yan et al. (2011) probe the bright-end ofthe galaxy LF at z>
∼ 7 using HST pure parallel ob-servations, and discuss these in context of the WFC
25 http://www.stsci.edu/cgi-bin/get-proposal-info
IR observations in the ERS and in the HUDF. Yanet al. (2010) discuss galaxy formation in the reion-ization epoch from the WFC3 observations of theHUDF, and suggest a LF at z'8–10 that differsfrom that found by Bouwens et al. (2010) and Oeschet al. (2010a). Wyithe et al. (2011) explain that partof this discrepancy may arise due to distortion of thevery high redshift galaxy number counts throughgravitational lensing by random foreground galax-ies at z'1–2. This boosts the number of z>
∼ 8–10objects that become observable in the WFC3 IRsamples, a non-negligible fraction of which thereforemust be sought close to foreground galaxies at z'1–2. These many examples show the great potential ofthe WFC3 ERS data presented in the current paper,and we refer the reader to these other papers for in-depth studies of the ERS data that are beyond thescope of the current paper. It suffices to say thatthe quality of and the scientific results from the ERSdata exceeded the expectations of the WFC3 SOC,even though we have been involved with the WFC3instrument from its conception in 1998.
In §2 of this paper, we present the WFC3 ERSsurvey strategy, the filters used and their achieveddepths. In §3, we present the observations in boththe WFC3 UVIS and IR channels, and the point-ings and their areal coverage. In §4, we present theWFC3 data reduction procedures, their reliabilityand completeness, and their current limitations. In§5, we present the object finding procedures andcatalog generation, and the star-galaxy separationprocedure used and its reliability in the 10 ERS fil-ters. In §6, we present the panchromatic ERS starcounts and discuss the faint ERS stellar proper mo-tion results. In §7, we present the panchromaticERS galaxy counts from 0.2–1.7 µm to AB'26-27mag, and compare these to the 10-band ground-based Galaxy and Mass Assembly (GAMA) surveycounts for 10<
∼ AB<∼ 20 mag at the bright end, and to
the HUDF counts in the BVizYsJH filters (definedin section 2.1) for 24<
∼ AB<∼ 30 mag at the faint end.
We also present the panchromatic ERS images forinteresting individual objects. In §8, we summarizeour main results and conclusions. Throughout thispaper, we use WMAP-year7 cosmology (Komatsuet al. 2010), or H0 =71 km s−1 Mpc−1 , Ωo=0.26,and Λ=0.74, and the ABν magnitude system (Oke1974).
2. WFC3 AND ITS CAPABILITIES
2.1. The ERS Filter Set
In the current ERS program, the unique panchro-
matic capabilities of WFC3 are used to survey thestructure and evolution of galaxies at the peak ofthe galaxy assembly epoch at z'1–3. Deep ul-traviolet and near-IR imaging, and slitless near-IRspectroscopy of existing deep multi-color GOODS-S/ACS fields are used to gauge star-formation andthe growth of stellar mass as a function of galaxy

4
morphology, structure and surrounding density inthis critical cosmic epoch at redshifts 1<
∼ z<∼ 3.
The total HST filter set provided by the WFC3ERS imaging of the Great Observatories OriginDeep Survey (GOODS) South field is shown in Fig.1a, and its properties are summarized in Tables1 and 2. WFC3 adds the F225W, F275W andF336W filters in the WFC3 UVIS channel, and theF098M, F125W and F160W filters (hereafter YsJH)in the WFC3 IR channel. Together with the ex-isting GOODS ACS F435W, F606W, F775W andF850LP images (Giavalisco et al. 2004), the newWFC3 UVIS and IR filters provide a total of 10HST filters that span the wavelength range λ'0.2–1.7 µm nearly contiguously. We refer to this entire10-band survey hereafter as the ‘’ERS”, to these 10filters as the “ERS filters”, and to the 7 reddestERS filters as the “BVizYsJH” filters throughout.Details of the GOODS survey can be found in Gi-avalisco et al. (2004) and references therein. Thetop panel of Fig. 1a compares the ERS filters tothe spectral energy distribution of two single burstmodel galaxies (middle and bottom panels of Fig.1a) with ages of 0.1 and 1 Gyr at redshifts of z=0,2, 4, 6, 8, respectively.
The ERS images in the WFC3 UVIS filtersF225W, F275W, and F336W are used to identifygalaxies at redshifts z>
∼ 1.5 from their UV continuumbreaks, which between the F225W and F275W fil-ters is sampled at redshifts as low as z'1.5–1.7 (seeFig. 1). These filters provide star-formation indica-tors tied directly to both local and z>
∼ 3 galaxy pop-ulations, which are the ones best observed throughtheir Lyman breaks from the ground at λ>
∼ 350 nm.The critical new data that the WFC3 UVIS chan-nel can provide are thus very high resolution, deepimages for 0.2<
∼λ<∼ 0.36 µm, as illustrated in Fig.
1a.The ERS images in the WFC3 near-IR filters
F098M, F125W and F160W are used to probe theBalmer and 4000 A breaks and stellar mass func-tion well below 109 M for mass-complete samplesin the critical redshift range of z'1–3. The uniquenew data that the WFC3 IR channel can provideare high resolution, very sensitive near-IR photom-etry over fields larger than those possible with HSTNICMOS, or over wide fields with adaptive opticsfrom the ground (e.g., Steinbring et al. 2004; Mel-bourne et al. 2005).
2.2. ERS Grisms
In addition to these broad-band ERS filters, weused the WFC3 near-IR grisms G102 and G141to obtain slitless spectroscopy of hundreds of faintgalaxies at a spectral resolution of R'210–130, re-spectively. The WFC3 near-IR grism data cantrace the primary indicators of star-formation —the Lyman-α and H-α emission-lines — in princi-ple over the redshift range for z'5–13 and z'0.2–1.7, respectively. WFC3 can also trace the Lyman
break and the rest-frame UV continuum slope, aswell as the Balmer and 4000 A-breaks over the red-shift range z'1–9 and z'0–2.5, respectively. TheERS grism program thus at least covers the peakof the cosmic star formation history at redshifts1<
∼ z<∼ 2, using some of the most important star-
formation and post-starburst indicators, while alsoproviding some metallicity-independent reddeningindicators. Both IR grism dispersers provide capa-bilities that cannot be reproduced from the ground:slitless spectroscopy of very faint objects (AB'25–26 mag) over a contiguous wide spectral range in thenear-IR, that is not affected by atmospheric night-sky lines. The ERS grism observations are 2 orbitsin depth each, covering a single WFC3 field, whichwas also covered in a previous ACS G800L grismsurvey (Straughn et al. 2009). An example of theERS G141 and G102 grism spectra is shown in thefigures of Appendix B.2. Further details of the ERSgrism data reduction and the analysis of the faintemission line galaxies are given in Appendix B.2 andby Straughn et al. (2011).
WFC3 UVIS G280 UV-prism observations werenot made as part of the 104 orbit intermediateredshift ERS program, because of its much lowerthroughput and the significant overlap of its manyspectral orders (Bond & Kim Quijano 2007; Wonget al. 2010). Currently, one Cycle 17 GO program(11594; PI J. O’Meara) is using the WFC3 G280prism to carry out a spectroscopic survey of Ly-man limit absorbers at redshifts 1.8<
∼ z<∼ 2.5. Read-
ers interested in the WFC3 G280 prism performanceshould follow the results from that program.
2.3. ERS UVIS Filter Red-Leaks and IR FilterBlue-Leaks
In the context of the WFC UVIS and IR chan-nel performance for intermediate to high redshiftearly- and late-type galaxies, it is useful to brieflysummarize here the possible effects of UVIS chan-nel filter red-leaks and IR channel filter blue-leakson the measured fluxes of these objects. UVIS red-leaks are defined as the fraction of flux longwardsof 400 nm of an SED of given effective temperatureTeff that makes it erroneously into the UV filter.The IR blue-leaks are defined as the fraction of fluxshort-wards of 830 nm of an SED of given effectivetemperature Teff that makes it erroneously into theIR filter or grism (for details, see Wong et al. 2010).
The WFC3 UVIS filters were designed with greatattention to minimize their red-leaks, which weremuch larger in the earlier generation WFPC2 UVfilters. Similarly, the WFC3 IR filters and grismswere designed to minimize the blue-leaks. For bothsets of WFC3 filters, lower out-of-band transmissionusually goes at the expense of lower in-band trans-mission, and vice versa. Hence, both the WFC3 andIR filters were designed and fabricated such thatthe in-band transmission was optimized as much aspossible, while keeping the out-of-band transmission

5
to acceptable or correctable levels for all SEDs ex-pected in the astrophysical relevant situations.
The resulting WFC3 UVIS red-leaks are accept-ably small (<
∼ 10%) for all zero-redshift SEDs withTeff >
∼ 5000 K for the F225W filter, Teff >∼ 4000
K for the F275W filter, and Teff >∼ 2000 K for
the F336W filter, respectively (Wong et al. 2010).For cooler (Teff <
∼ 2000–5000 K) zero-redshift SEDs,some red-leak correction thus has to be applied tothe observed F336W, F275, and F225W fluxes, re-spectively. However, for objects at substantial red-shifts (z>
∼ 0.75–1), the SED will shift out of theUVIS sensitivity regime quickly enough to signifi-cantly reduce the red-leak. Hence, the WFC3 UVISred-leaks in general only need to be corrected forthe reddest (Teff <
∼ 5000 K), lower-redshift (z<∼ 0.75)
SEDs observed in the bluest UVIS filters (F225W).Further details are given in Rutkowski et al. (2011).
The WFC3 IR blue-leaks are very small (<∼ 0.01%)
for all zero-redshift SEDs with Teff <∼ 10,000 K
for the F098M, F105W, F125W, and F160W fil-ters, and remains very small (<
∼ 0.1%) even for thebluest zero-redshift SEDs with Teff'30,000-50,000K (Wong et al. 2010). For higher redshift SEDs(z>
∼ 1) of any Teff , the redshift further reduces theIR blue-leak. Similarly, the G141 grism was madeon a glass substrate with no transmission below750nm, and is well blocked by its coatings short-ward of 1050 nm and long-ward of 1700 nm (Baggettet al. 2007). Hence, it also has acceptably an smallblue-leak. The same is true for the higher resolutionG102 grism.
2.4. WFC3 Detectors and Achieved ERSSensitivities
The WFC3 UV—blue optimized CCDs were cho-sen specifically to complement those of ACS. Theywere made by E2V in the UK, and are thinned,backside illuminated, CCD detectors with 2k×4k 15µm (0′′.0395) pixels, covering the wavelength range200–1000 nm with Quantum Efficiency QE>
∼ 50%throughout (Wong et al. 2010; Kimble et al. 2010).The total WFC3 UVIS field-of-view with these twoCCDs is 162”×162”.
The WFC3 near-IR detectors were TeledyneHgCdTe infrared detectors (MBE-grown and sub-strate removed) with Si CMOS Hawaii-1R mul-tiplexers and have 1k×1k 18 µm (0′′.130) pixels,covering the wavelength range 800–1730 nm withQE>
∼ 77% throughout (Wong et al. 2010; Kimbleet al. 2010). The total WFC3 IR field-of-view is123”×136”. Further specifications of the WFC3 de-tectors are listed where relevant below.
Table 1 summarizes the resulting WFC3 sensitiv-ities from our relatively short ERS exposures. Thetable lists the number of orbits per filter and the5-σ depths in AB magnitudes and Fν units. Anet exposure time of 2600–2700 seconds was avail-able in each HST orbit for on-source ERS observa-tions. In Fig. 1b, the equivalent depths are plotted
in physical terms, by comparing with spectral syn-thesis models of Bruzual & Charlot (2003) at thethree fiducial redshifts, following Ryan et al. (2007,2010). Simple stellar populations models with sin-gle bursts or exponentially declining star-formationrates with an e-folding time of 1 Gyr are plotted.Fig. 1b shows the predicted spectral energy distri-butions for models with ages ranging from 10 Myrto 3 Gyr, along with the 5-σ depths of the WFC3ERS program. The three panels represent redshiftsz=1.0, 1.5 and 2.0, and models with stellar masses ofM=109, 4×10⁹, and 1010 M , respectively. TheseSED tracks illustrate the intended SED and masssensitivity of the WFC3 ERS observations as a func-tion of cosmic epoch. Galaxies with ongoing star-formation, even with fairly large ages, are easily de-tected in the WFC3 UV observations. At z'2, amaximally old τ'1 model with a mass of ∼0.3 M∗
is detectable above the WFC3 detection thresholdin the F336W filter, while at z'1, the WFC3 ERScan detect young star forming galaxies with massesas low as a few×107 M , or about a M∼0.01 M∗
galaxy in that filter.Table 2 summarizes the HST instrument modes
and the ERS filters used, the filter central wave-length λ, its width, and the PSF-FWHM as a func-tion of wavelength, the AB magnitude zero-pointsfor all 10 filters for a count rate of 1.0e− /sec, aswell as the zodiacal sky-background measured ineach ERS filter. The GOODS sky-background val-ues in the F435W, F606W, F775W, and F850LPfilters (hereafter BViz) are from Hathi et al. (2008).
Fig. 2 shows that on average, the on-orbit WFC3UVIS sensitivity is 6–18% higher than the pre-dicted pre-launch sensitivity from the ground-basedthermal vacuum test (left panel), and the on-orbitWFC3 IR sensitivity is 9–18% higher (right panel).The red lines are best fits to the in-flight/pre-launchsensitivity ratio. For the UVIS data, this is just aparabolic fit, as the in-flight/pre-launch excess doesnot seem to follow the CCD sensitivity curve (Kali-rai et al. 2009a). For the IR data, a polynomial fitwas folded with the IR detector sensitivity curve,since the in-flight/pre-launch does somewhat resem-ble the IR detector sensitivity curve (Kalirai et al.2009b). The true cause of this beneficial, but sig-nificant discrepancy is unknown. It possibly resultsfrom uncertainties in the absolute calibration pro-cedure of the optical stimulus used in the thermalvacuum tests of WFC3 (Kimble et al. 2010), and/orperhaps from slow temporal changes in the HST Op-tical Telescope Assembly (OTA) itself (Kalirai et al.2009a, 2009b). The cause of this discrepancy is cur-rently being investigated, and lessons learned willbe applied to the upcoming ground-based calibra-tions of the James Webb Space Telescope thermalvacuum absolute throughput measurements.
3. THE ERS DATA COLLECTION STRATEGY

6
The GOODS-South field was chosen for the ERSpointings, because of the large body of existing andpublicly available data. Besides the deep, four-colorACS BViz imaging (Giavalisco et al. 2004; Dickin-son et al. 2004), there are low resolution (R∼100)ACS slitless G800L grism spectra covering the wave-length range ∼0.55–0.95 µm (cf. Pirzkal et al. 2004;Malhotra et al. 2005; Ferreras et al. 2009; Rhoadset al. 2009; Straughn et al. 2008, 2009). There isalso a wealth of ground- and space-based data, suchas deep U+R-band VLT/VIMOS imaging (Noninoet al. 2009), deep VLT/ISAAC JHKs-band imaging(Retzlaff et al. 2010), a very large number of VLTspectra (Vanzella et al. 2005, 2009; Popesso et al.2009; Balestra et al. 2010), deep Chandra X-ray im-ages (Giacconi et al. 2002; 2 Msec by Luo et al. 2010;4Msec by Luo et al. 2011), deep XMM X-ray obser-vations (4 Msec by Comastri et al. 2011), GALEXUV data (Burgarella et al. 2006), Spitzer photome-try with IRAC and MIPS (Papovich et al. 2006; Yanet al. 2004, 2005), Herschel FIR images at 70, 110,and 160 µm (Gruppioni et al. 2010; Lutz et al. 2011),and deep ATCA and VLA radio images (cf. Afonsoet al. 2006, Kellermann et al. 2008), respectively.
Given the constraint on the total amount of timeavailable in the allotted 104 HST orbits, the ERSprogram could survey one 4×2 WFC3 mosaic cov-ering 10′ ×5′ or roughly 50 arcmin2 to 5-σ depthsof mAB ' 26.0 mag in the three bluest wide-bandUVIS filters, and one 5×2 WFC3 mosaic covering10′ ×4′ or roughly 40 arcmin2 to 5-σ depths of mAB
' 27.0 mag in the three near-IR filters. This angu-lar coverage probes co-moving scales of roughly 5–10Mpc and provides a sample of 2000–7000 galaxies toAB'26–27 mag in the panchromatic ERS images.The IR images were dithered to maximally matchthe UVIS field-of-view.
Fig. 3 shows the ACS z’-band (F850LP) mo-saic of the entire GOODS-South field, and the out-line of the acquired WFC3 pointings, as well asthe locations of the ACS images taken in parallelto the WFC3 ERS pointings. The ACS parallelswere taken with the ACS/WFC filters F814W andF658N to search for high redshift Lyman-α emittersat z=4.415±0.03, of which several were known spec-troscopically in the GOODS-South field (Vanzellaet al. 2005; Finkelstein et al. 2011). The WFC3 ERSmosaic pointings cover the Northern ∼30% of theGOODS-South field (Fig. 3). The 8 ERS point-ings are contiguous with a tiling that can be easilyextended to the South in future WFC3 GO pro-grams (see, e.g., the Faber, Ferguson et al. MultiCycle Treasury HST programs 12060–12064).
The orbital F225W and F275W ERS observationswere designed to minimize possible Earth limb con-tamination. To guarantee the lowest possible UVsky-background in the WFC3 images, one 1200 secF275W and one 1200 sec F225W exposure was ob-tained in each orbit. All F225W exposures weretaken at the end of each orbit, in contrast with
the common practice of observing all exposures inthe same filter in rapid succession in subsequentorbits. All three 800 sec F336W exposures wereobtained during the same single orbit for a givenERS pointing. This manner of scheduling indeedminimized the on-orbit UV sky-background awayfrom the Earth’s limb (see Table 2), but it some-what complicated the sub-sequent MultiDrizzle pro-cedure (see §4.2), since no “same-orbit” cosmic rayrejection could be applied to the F225W and F275Wimages in order to find a first slate of bright objectsfor image alignment. Further details on the imagealignment are given in §4 and Appendix A.
In the WFC3 IR channel, 6 exposures of 800-900sec were taken in each of the F098M, F125W, andF160W filters, using 2 orbits for each filter, but stay-ing away from the Earth’s limb at the end of eachorbit in order to keep the near-IR sky-backgroundas low as possible (see Table 2). In total, 9 or 10Fowler samples in each IR channel integration pro-vided good CR-rejection, while the 6 dithered ex-posures providing the capability to properly drizzlethe IR images, and so more properly sample the IRPSF (see §4.3.3).
HST scheduling required that this ERS programbe split into several visits. Simple raster patternswere used to fill out the WFC3 IR mosaic, and toimprove sky-background plus residual dark-currentremoval. Only mild constraints were applied tothe original HST roll angle (ORIENT) to maximizeoverlap between the northern part of the GOODS-South field, and to allow HST scheduling in the per-mitted observing interval for the ERS (mid-Sept.–mid-Oct. 2009). The IR and UVIS images were con-strained to have the same ORIENT, to ensure thata uniform WFC3 mosaic could be produced at allwavelengths. The slight misalignment of the North-ern edge of the existing ACS GOODS-South mosaicsand the new WFC3 ERS mosaics in Fig. 3 was dueto the fact that the HST ORIENT constraints hadto be slightly changed in the late summer of 2009,since the ERS observations needed be postponed byseveral weeks due to a change in the HST schedul-ing constraints. Since finding good guide stars forall 19 ERS pointing was very hard, it was necessaryto only slightly change the mosaic ORIENT anglesat that point, but not the actual image pointing co-ordinates. The Early Release Science mosaics wouldhave otherwise become unschedulable.
The area of overlap between the individual WFCERS mosaic pointings is too small to identify tran-sient objects (e.g. SNe and variable AGN), sinceonly about 1–2% of all faint field objects show point-source variability (Cohen et al. 2006). However, itis useful in the subsequent analysis to verify the po-sitions of objects, and so verify the instrument ge-ometric distortion corrections (GDCs) used, as dis-cussed in §4 and Appendix A.
4. WFC3 UVIS AND IR DATA PROCESSING
7
The WFC3 ERS data processing was carried outwith the STScI pipeline calwf3. The WFC3 ERSdata set also provided tests of the STSDAS pipelineunder realistic conditions. This process was startedwell before the SM4 launch in the summer of 2008with pre-flight WFC3 thermal vacuum calibrationdata, and continued through the late summer andfall of 2009, when the first ERS data arrived. Theraw WFC3 data was made public immediately, andthe “On-The-Fly” (“OTF”) pipe-lined calibratedand Multi-Drizzled WFC3 mosaics will be madepublic via MAST at STScI when the final flight cal-ibrations — as detailed below — have been applied.The specific pipeline corrections that were appliedto the WFC3 ERS images are detailed here. Un-less otherwise noted below, the latest reference filesfrom the WFC3 Calibration web-page were used inall cases, and are available on this URL. 26
4.1. The Main WFC3 Pipeline Corrections
4.1.1. WFC3 UVIS
All raw WFC3 UVIS data were run through thestandard STSDAS calwf3 calibration program asfollows:
(1) The best WFC3 UVIS super-bias that was avail-able at the time of processing(090611120 bia.fits) was subtracted from all images.This is an on-orbit super-bias created from 120UVIS bias frames, each of which was unbinned, andused all four on-chip amplifiers (see this URL27).The measured on-orbit UVIS read-noise levels are3.1e− in Amp A, 3.2 e− in Amp B, 3.1 e− in AmpC, and 3.2 e− in Amp D, respectively, or on averageabout 3.15 e− per pixel across the entire UVIS CCDarray.
(2) A null dark frame was applied, since the onlyavailable darks at the time were from the ground-based thermal vacuum testing in 2007–2008, andthese were not found to reduce the noise in the out-put ERS frames. Hence, the subtraction of actualon-orbit 2D dark-frames was omitted until better,high signal-to-noise ratio on-orbit dark-frames havebeen accumulated in Cycle 17 and beyond. Instead,a constant dark-level of 1.5 e− /pix/hr was sub-tracted from all the images, as measured from theaverage dark-current level in the few on-orbit dark-frames available thus far. This dark-level is about5× higher than the ground-based thermal vacuumtests had suggested, but still quite low enough tonot add significant image noise in an average 1200sec UVIS exposure.
(3) A bad pixel file (tb41828mi bpx.fits) was created(by H. Bushouse) and updated over the one avail-able in the “Office of Space Sciences Payload Data
26 www.stsci.edu/hst/observatory/cdbs/SIfileInfo/WFC3/reftablequeryindex
27 www.stsci.edu/hst/wfc3/lbn archive/2009 09 09 new uvis superbias
Processing Unified System” or “OPUS” pipeline atthe time, and applied to all the UVIS images.
(4) All flat-fields came from the 2007–2008 WFC3thermal vacuum ground tests and had high signal-to-noise ratio. We used these flats, since the WFC3data base is not yet large enough to make a reli-able set of on-board sky-superflats. (As in the casefor the WFPC2 Medium-Deep Survey, this can andwill be done during subsequent years of WFC3 us-age). These thermal vacuum flats left some large-scale gradients in the flat-fielded data, due to theillumination difference between the thermal vacuumoptical stimulus and the real on-orbit WFC3 il-lumination by the zodiacal sky-background. Foreach passband, the mean UV-sky-background wasremoved from the individual ERS images (as partof MultiDrizzle), and the resulting images were com-bined into a median image in each UV filter. Thelarge scale gradients from this illumination differ-ence correspond to a level of about ∼5–10% of theon-orbit zodiacal sky-background and have very lowspatial frequency. This situation will be remediedwith on-orbit internal flats and sky-flats, that willbe accumulated during Cycle 17 and beyond. Sincethe UV sky-background is very low to begin with(∼25.5 mag arcsec−2 , see Table 2 and Windhorstet al. 2002), these residual 1–2% sky-gradients affectthe object photometry only at the level of AB>
∼ 27–28 mag, i.e., well below the UVIS catalog com-pleteness limits discussed in §5.4. Also, the spatialscales of these gradients are much larger than ∼100pixels, and faint objects are small (see §5.5 and fig-ures therein; see also Windhorst et al. 2008), so thatthese gradients do not affect the faint object find-ing procedure, catalog reliability and completenesssignificantly (see §5.1–5.4).
We suspect, but have at this stage not been ableto prove with the currently available data, that thisremaining low-level sky gradient is of multiplicativeand not of additive nature. Once we have beenable to demonstrate this with a full suite of sky-flats, we will re-process all the UVIS data again,and remove these low-level gradients accordingly.For now, these gradients are not visible in thehigh quality, high contrast color reproductions ofFig. 5a–5b. Hence, they do not significantly affectthe subsequent object-finding and their surroundingsky-subtraction procedures, which assume linear re-maining sky-gradients. This is corroborated by thequality of the panchromatic object counts discussedbelow, and consistency with the counts from otherauthors in the flux range where these surveys over-lap. In other words, any remaining low-level skygradients do not significantly affect the UVIS objectcatalogs generated for the current science purposesto AB'25.5–26.0 mag.
We also checked for CCD window ghosts or fil-ter ghosts next to the brightest stars. These arein general very faint, or of very low surface bright-ness (SB) and much larger than the galaxies we are

8
studying here. Such window ghosts do not affect theWFC IR images. In the WFC 3UVIS images, theyonly amount to 0.4% of the stellar peak flux in theF225W filter, and are much dimmer in the redderUVIS filters (Wong et al. 2010). No obvious filterghost-like objects were found by the SExtractor ob-ject finder (Bertin & Arnouts 1996) surrounding thebright stars in the ERS.
4.1.2. WFC3 IR
The reduction of the ERS WFC3 IR data largelyfollowed the procedures as described in Yan et al.(2010). We used the calwf3 task included in theSTSDAS package to process the raw WFC3 IR im-ages, using the latest reference files indicated by therelevant FITS header keywords. Additional correc-tions to the calibrated images were applied as fol-lows.
(1) We removed residual DC offsets between thefour detector quadrants, which was caused by anerror in the application of the quadrant-dependentgain values in calwf3 and documented in the WFC3STAN (September 2009 issue, see this URL 28; seealso Wong et al. 2010). Specifically, multiplicativegain correction factors were applied to each imagequadrant using g=1.004 for Quadrant 1 (upper left),g=0.992 for Quadrant 2 (lower left), g=1.017 forQuadrant 3 (lower right), and g=0.987 for Quadrant4 (upper right quadrant). Note that this quadrantissue was fixed in calwf3 v1.8 and later.
(2) For each passband, the mean near-IR sky-background was removed from the individual ERSimages, and the resulting images were combined intoa median image in each near-IR filter.
(3) A smooth background gradient still persisted inthe median image. This gradient was fitted by a 5-order Spline function, and was then subtracted fromthe individual near-IR images. This sky gradient isof order 1–2% of the zodiacal sky-background. Sincethe near-IR zodiacal sky-background is about 22.61,22.53, and 22.30 mag arcsec−2 in YsJH (see Table2), respectively, these remaining WFC3 IR gradi-ents do not affect the large-scale object finding andcatalog generation at levels brighter than AB'27.0mag.
We checked for persistence in the IR images leftover from saturated objects in previous exposures.Since the WFC3 IR observations just before theWFC3 ERS IR observations didn’t contain manyhighly saturated bright stars, very few obvious per-sistence problems were found. Since the ERS filterswere taken in the order F125, F160W, F098M, per-sistence would have been most obvious in the high-est throughput F125W filter, leading possibly to ob-jects with unusually high J-band fluxes compared toH- and Ys-band. Only very few such objects were
28 www.stsci.edu/hst/wfc3/documents/newsletters/STAN 09 01 2009
found, and where persistence was suspected, theywere removed from the SExtractor catalogs.
4.2. WFC3 Astrometry and MultiDrizzleProcedures
4.2.1. WFC3 UVIS Astrometry
The calibrated, flat-fielded WFC3 UVIS expo-sures were aligned to achieve astrometric registra-tion with the existing GOODS ACS reference frame(Giavalisco et al. 2004; GOODS v2.0 URL29. fromGrogin et al. 2009). To generate accurate SExtrac-tor (Bertin & Arnouts 1996) object catalogs in theF225W, F275W and F336W filters, the higher S/N-ratio GOODS ACS B-band images were used as thedetection image. This also provided an astromet-ric reference frame that was matched as closely aspossible to the wavelengths of the UVIS filters usedin these observations. Because the GOODS B-bandimages reach AB<
∼ 27.9 mag and so go much deeperthan the ERS UVIS images, they help optimallylocate the objects in the ERS UVIS mosaics (see§5.1).
The F225W and F275W ERS exposures takenseparately in successive orbits (see §3) needed tobe aligned with each other individually, in additionto their overall alignment onto the GOODS refer-ence frame. For each ERS filter, the relative align-ment between exposures was achieved iteratively,starting with an initial partial run of MultiDrizzle(Koekemoer et al. 2002) to place each exposure ontoa rectified pixel grid. These images were then cross-correlated with each other, after median filteringeach UVIS exposure and subtracting this smoothexposure to reduce the impact of cosmic rays andto identify the brighter real objects. This ensureda relative alignment between the sequential orbitalERS exposures to the sub-pixel level, correcting foroffsets that were introduced by the guide-star ac-quisitions and re-acquisitions at the start of eachsuccessive ERS orbit.
4.2.2. The WFC3 UVIS MultiDrizzle Procedure
These first-pass aligned images were then runthrough a full combination with MultiDrizzle(Koekemoer et al. 2002), which produced a maskof cosmic rays for each exposure, together with acleaned image of the field. The cosmic ray maskwas used to create a cleaner version of each expo-sure, by substituting pixels from the clean, com-bined image. These were then re-run through thecross-correlation routine to refine the relative shiftsbetween the exposures, achieving an ultimate rela-tive alignment between exposures with an accuracyof <
∼ 2–5 mas. This process was limited primarily bythe on-orbit cosmic ray density, and the availableflux in the faint UV objects visible in each individ-ual UVIS exposure. In the end, about 3 indepen-
29 http://archive.stsci.edu/pub/hlsp/goods/v2/h goods v2.0 rdm.html
9
dent input pixels from 4 exposures contributed toone MultiDrizzle UVIS output pixel. Of these, typ-ically <
∼ 1–2% were rejected in the cosmic ray rejec-tion, leaving on average 3 independent UVIS mea-surements contributing to one MultiDrizzle outputpixel in both the F225W and F275W filters. InF336W, about 2.3 independent input pixels fromthe 3 F336W exposures contributed to one outputpixel during the MultiDrizzle process.
After this relative alignment between exposureswas successfully achieved, each set of exposuresneeded to be aligned to the absolute GOODS as-trometric reference frame. This was achieved bygenerating catalogs from the cleaned, combined im-ages for each of the three ERS UVIS filters F225W,F275W, and F336W, and matching them to theGOODS B-band catalog (Giavalisco et al. 2004;Grogin et al. 2009). This was done by solving forlinear terms (shifts and rotations) using typically∼30–50 objects matched in each pointing, depend-ing on the UVIS filter used. This procedure success-fully removed the mean shift and rotational offsetsfor each visit relative to the GOODS astrometricframe. MultiDrizzle also produced “weight”-maps(Koekemoer et al. 2002), which are essential for thesubsequent object detection (§5.1), and for the com-putation of the effective area, which is needed forthe object counts (see the figures in §6–7).
In order to perform matched aperture photome-try (see §5.2), our approach was to create images atall wavelengths at the same pixel-scale. Since theIR data was necessarily created at 0′′.090 per pixel(see Appendix A), we created UVIS mosaics at thatsame pixel size. This essentially “smoothed” overthe remaining issue of the geometric distortion solu-tion (see Appendix A), and created a sufficient dataproduct for the purpose of producing matched aper-ture photometric catalogs, reliable total magnitudesin all 10 ERS filters, performing z'1–3 dropoutsearches, and many other “total magnitude appli-cations”. The performance of the panchromaticERS images for photometric redshift estimates isdescribed by Cohen et al. (2011). Further details onthe remaining uncertainties from the UV geometricdistortion and its corrections are given in AppendixA and in Fig. 4a–4b.
The current 0′′.090 per pixel UVIS image mosaicis referred to as “ERS version v0.7”. In the fu-ture, when the UV geometric distortion correctionis well measured, and better on-orbit WFC3 flat-fields or sky-flats become available, we will makehigher resolution images (0′′.030 per pixel) for ap-plications such as high-resolution faint-galaxy mor-phology, structure, half-light radii, and other high-precision small-scale measurements of faint galaxies,and make these end-products available to the com-munity.
4.2.3. IR Astrometry and MultiDrizzle Procedure
The WFC3 IR images processed as described insection 3 were first corrected for the instrumentgeometric distortion and then projected to a pre-specified astrometric reference grid according to theWorld Coordinate System (WCS) information pop-ulated in the image headers. This was done byusing the MultiDrizzle software (Koekemoer et al.2002) distributed in the STSDAS.DITHER pack-age. Similar to the processing of the UVIS imagesin §4.2.1, the GOODS version 2.0 ACS mosaics wereused as the astrometric reference. The only differ-ence is that the GOODS ACS mosaics were 3 × 3rebinned for comparison with the ERS IR data, giv-ing a spatial resolution of 0′′.090 per pixel for all ERSimages.
As usual, the projected ERS IR images show non-negligible positional offsets, which is mainly causedby the intrinsic astrometric inaccuracies of the guidestars used in the different HST visits. FollowingYan et al. (2010), about 6–12 common objects weremanually identified in each ERS IR input image andin the reference ACS z850 image. We subsequentlysolved for X-Y shift, rotation, and plate scale be-tween the two. These transformations were theninput to MultiDrizzle, and the drizzling processwas re-run to put each input image onto the pre-specified grid. We set the drizzling scale (“pixfrac”)to 0.8, so that in the IR about 5 input pixels from4 exposures, or 20 independent measurements con-tributed to one MultiDrizzle output pixel. Of these,typically <
∼ 10% or 2 pixels were rejected in the cos-mic ray rejection, leaving on average 18 independentmeasurements contributing to one MultiDrizzle out-put pixel.
4.3. Resulting ERS Mosaics and their Properties
4.3.1. The panchromatic 10-band ERS mosaics
Fig. 5a. shows the panchromatic 10-band colorimage of the entire ERS mosaic in the GOODS-South field. All 10 ERS filters in Fig. 5, 6, 13, and14 are shown at the 0′′.090 pixel sampling discussedin §4. All RGB color images of the 10-band ERSdata were made as follows. First, the mosaics inall 10 filters were registered to the common WCSof the ACS GOODS v2.0 reference frame to wellwithin one pixel. Second, all images were rescaledto Fν units of Jy per pixel using the AB zero-pointsof Table 2. Next, the blue gun of the RGB im-ages was assigned to a weighted version of the UVISimages in the F225W, F275W, and F336W filtersand the ACS F435W filter. The green gun was as-signed to a weighted version of the ACS F606W andF775W images, which had the highest S/N-ratio ofall available images. The red gun was assigned to aweighted version of the ACS z-band (F850LP) andWFC3 IR F098M, F125W, and F160W images. Allweighting was done with the typical image sky S/N-ratio, sometimes adjusted so as to not overempha-size the deepest multi-epoch GOODS v2.0 imagesin the V and i-filters. This procedure thus also

10
rebalanced the different sensitivities per unit timein these filters, as shown in Fig. 1a–1b, and cor-rected for the fact that some filters have their cen-tral FWHM-range overlap somewhat in wavelength,so they are not completely independent (see Table2). This is especially noticeable for the ACS z-bandfilter F850LP — which at the long wavelength sideis cut-off by the sharp decline in the QE-curve ofsilicon — and the IR F098M filter, which doesn’thave this problem at its blue side, but overlaps withF850LP for about 40% of its OTA×T×QE integral,where OTA is the net Optical Telescope Assemblyreflectivity, T in the product of the WFC3 optics re-flectivities and filter + window transmissions, andQE is the detector Quantum Efficiency as a functionof wavelength. (When the QE of the HgCdTe detec-tors produced by Teledyne increased from ∼10–20%in 2001 to >
∼ 80% after 2005, the F098M filter thusbecame almost a replacement of the ACS z-band).
In Fig 5a–5b, we used a log(log) stretch to op-timally display the enormous dynamic range of thefull resolution ERS color TIFF images. Fig. 5a onlydisplays the overlap between the 4×2 ERS UVISmosaics, the GOODS v2.0 ACS BViz mosaics, andthe 5×2 ERS IR mosaics. Each of the ERS mosaicsare 8079 × 5540 pixels in total, but only about 6500× 3000 pixels or 9′.75 × 4′.5 or 43.875 arcmin2 isin common between the UVIS and IR mosaics andshown in Fig. 5a–5b. The area of the individualUVIS mosaics used in each of the UV-optical galaxycounts of §7 is substantially larger than this, but thetotal usable area of the IR mosaics is comparable tothe area shown in Fig. 5a.
Fig. 5b (see Appendix B.1) shows a zoom of the10-band ERS color image, illustrating the high res-olution available over a factor of ten in wavelength,the very large dynamic range in color, and the sig-nificant sensitivity of these few orbit panchromaticimages. Further noteworthy objects in the imagesare discussed in Appendix B.1 below.
4.3.2. Astrometric quality of the ERS mosaics
To compare the astrometry of our WFC3 ERScatalogs to our catalogs derived from the GOODSACS v2.0 images, we selected the WFC3 H-band, because the geometrical distortion correction(GDC) was measured thus far in the F160W fil-ter only (see Appendix A). Amongst the GOODSACS v2.0 images, we select the z’-band filter as theclosest in wavelength to compare the ERS F160Wimages to astrometrically, and because most faintERS stars are expected to be red (see $ 5.5). TheGDC of the ACS/WFC has been well measured andcalibrated over time and as a function of wavelength(Maybhate et al. 2010, Anderson 2002, 2003, 2007),and so is not a major source of uncertainty in this as-trometric comparison. The exposure-time averagedeffective epochs of the GOODS v2.0 ACS/WFCmosaics are: 2002.7796 in F435W, 2002.9755 inF606W, 2003.6083 in F775W and 2003.7634 in
F850LP, respectively. Due to a continued GOODShigh-z SN search that lasted from mid 2002 throughearly 2005, the spread on these numbers is about oneyear, yielding possibly somewhat elongated ACS im-ages for very high proper motion stars in each ofthe GOODS v2.0 image stacks. The effective time-averaged epoch for the WFC UVIS ERS data is JD2009.6918 in F225W, F275W, and F336W with aspread of 2 days, while for the WFC3 IR channelimages the effective epoch is 2009.7370 in F098M,F125W, and F160W with a spread of about oneweek. For the WFC3 ERS images, image elongationfor high proper motion stars is thus not a concern.The effective (WFC ERS–GOODS v2.0) epoch dif-ference to be used for proper motions derived fromthis comparison is thus (2009.7370–2003.7634) =5.97±1 years, where the dispersion is dominatedby the GOODS ACS z’-band image-spread of aboutone year.
Fig. 4c shows the measured residual astromet-ric offsets in (RA, DEC) for all 4614 ERS objectsmatched between our WFC3 H-band object cata-log and our GOODS ACS/WFC v2.0 z’-band cata-log, as well as their histograms in both coordinatesfor 4511 matched ERS objects classified as galax-ies (black) and 103 ERS objects classified as stars(red). Best fit Gaussians are also shown for each ofthe histograms. As discussed in $ 4.2, the WCS co-ordinate system in the FITS headers of the WFC3ERS images was by definition brought onto the wellestablished GOODS ACS v2.0 WCS. This was doneby applying WCS offsets averaged over all ERS ob-jects to the WFC3 FITS headers. The histogramsand curves in Fig. 4c show that this could be donewith an accuracy of 0.32 ± 0.46 (m.e.) m.a.s. inRA, and 0.10 ± 0.41 (m.e.) m.a.s. in DEC, re-spectively, i.e. in general to within 0.5 m.a.s. bothrandomly and systematically. While residual errorsin the WFC3 GDC are large (see §4.2 and AppendixA), for a large number of objects spread over all theERS images these errors apparently average out wellenough to establish the overall WCS coordinate sys-tem of both the ERS UVIS and IR mosaics onto theGOODS v2.0 ACS/WFC mosaics to within 0.4–0.5m.a.s. on average.
For the 4511 ERS galaxies alone, Fig. 4cshows that the residual WFC3 offsets compared toGOODS ACS v2.0 are ∆RA = –0.64 ± 0.47 (m.e.)m.a.s. and ∆DEC = +0.38 ± 0.42 (m.e.) m.a.s., orat the 1.4 and 0.9-σ level in RA and DEC, respec-tively. For the galaxies, these ERS offsets are indeedstatistically insignificant, although they are not ex-actly equal to zero, because the matching onto theACS WCS was done including the ERS stars as well— before it was known what the optimal star-galaxyseparation method would be. (Because the residualoffsets for all ERS galaxies alone are within the 0.4–0.5 m.a.s. errors quoted above, no second iterationwas done in bringing the WFC3 WCS system on topof the GOODS ACS v2.0 WCS system.)

11
In total, 21 out of the 103 ERS stellar candi-dates show proper motion at the ≥3-σ level in RAor DEC, respectively, as shown by the green aster-isks in Fig. 4c. In total, 37 out of the 103 ERSstellar candidates show proper motion at the ≥2-σlevel, also shown in Fig. 4c. Only about 5 stars areexpected at ≥2-σ for a random Gaussian distribu-tion, and so the stellar (∆RA, ∆DEC) offsets havea non-Gaussian distribution, as shown by the his-tograms in Fig. 4c. Hence, proper motion allows usto confirm statistically about 32 out of the 103 stel-lar candidates in the ERS. As a consequence, ERSproper motions alone cannot prove that all our ERSobjects classified as stellar are in fact Galactic stars.For this reason, we will also consider object colorsin §5.5 as confirmation of the stellar classifications.
Statistically, proper motions do cause significantoffsets in the average (∆RA, ∆DEC) distributionof the 103 ERS objects classified as stars (Fig.4c). For these stellar candidates, we find on av-erage that ∆RA = 13.71 ± 3.34 (m.e.) m.a.s., or2.30±0.56 m.a.s./yr, and ∆DEC = –12.04 ± 2.09(m.e.) m.a.s., or 2.02±0.35 m.a.s./yr. These con-stitute 4.1-σ and 5.8-σ detections of the statisticalproper motion of all 103 ERS stellar candidates.The KS probability that the stellar ∆RA values aredrawn from same distribution as the ERS galaxypopulation is 9.8×10⁻⁵, while for the stellar ∆DECvalues this probability is 11×10−5. Hence, averagestellar proper motion is detected at high significancelevel for the sample of 103 ERS stellar candidates.This is a significant result, since the star-galaxy sep-aration of $ 5.5) was done completely independentlyof any proper motion information. A further dis-cussion of this result is given in $ 5.6 and 6.
Fig. 6c shows a log(log) color reproduction of the20 ERS stars with the highest (>
∼ 3-σ) proper mo-tion (green symbols in Fig. 4c). The images used asimilar color balance as in Fig. 5a–5b, except thatonly the 2009 WFC3 UVIS filters are shown in theBlue gun, all the 2003 ACS BViz filters were usedin the Green gun, and all the 2009 WFC3 IR filtersin the Red gun. The proper motion of these stars isbest visible as significant centroid-displacements be-tween the Green 2003 ACS colors and the Blue+Red(or violet) 2009 WFC3 colors (one has to magnifythe PDF figure to best see the significant centralgreen-to-white-to-orange displacement).
4.3.3. The panchromatic ERS PSFs
Fig. 6a shows a full color reproduction of a stel-lar image in the 10-band ERS color images in theGOODS-South field, and Fig. 6b shows a “double”star. These images give a qualitative impression ofthe significant dynamic range in both intensity andwavelength that is present in the ERS images. Fig.7a show images in all 10 ERS filters of an isolatedbright star that was unsaturated in all filters, andFig. 7b shows its 10-band stellar light-profiles. Ta-ble 2 lists the stellar PSF-FWHM values in the 10
ERS bands. These include the contribution formthe OTA and its wavefront errors and the specificinstrument pixel sampling.
Table 2 and Fig. 7b show the progression of theHST PSF (λ/D) with wavelength in the 10 ERSfilters. Table 2 implies that the larger pixel val-ues used in the multi-drizzling of §4.2.2 indeed addto the effective PSF diameter. Table 2 also showsthat that HST is diffraction limited in V-band andlongwards, while shortward of V-band, the PSF-FWHM starts to increase again due to mirror micro-roughness in the ultraviolet. At wavelengths shorterthan the V-band, HST is no longer diffraction lim-ited, resulting in wider image-wings, and a some-what larger fraction of the stellar flux visible out-side the PSF-core. The “red halo” at λ>
∼ 0.8 µm isdue to noticeable Airy rings in the stellar images inthe WFC3 IR channel, and the well known red haloin the ACS z-band (Maybhate et al. 2010) has anadditional component from light scattered off theCCD substrate. Details of the on-orbit characteri-zation of the WFC3 UVIS and IR PSFs are givenby Hartig (2009ab).
4.3.4. The 10-band ERS Area and Depth
Table 1 summarizes the exposure times and the ac-tual achieved depth in each of the observed ERSfilters, while Table 2 also lists the effective area cov-ered in each filter mosaic at the quoted depth.
The histograms of Fig. 8a–8c give the cumula-tive distribution of the maximum pixel area thatpossesses a specified fraction of total orbital expo-sure time. These effective areas must be quantifiedin order to properly do the object counts in §6–7.After Multi-drizzling the ERS mosaics in the UVand IR, these effective areas were computed fromthe weight maps, which include the total exposuretime, and the effects from CR-rejection, dithering,and drizzling. Fig 8a shows that about 50 arcmin2
of the UV mosaics has ∼80% of the UVIS expo-sure time, or ∼90% of the intended UV sensitivity.For reference, one 0′′.090 pixel could be composedof 5.2 native WFC3 UVIS pixels times the numberof exposures on that portion of sky. Due to over-lapping dithers (see Fig. 3), some pixels have morethan the total orbital exposure time contributing totheir flux measurement. The histograms of Fig. 8bgive the same information as Fig. 8a, but for thesix GOODS v2.0 mosaic tiles in BViz that overlapwith the ERS. Fig. 8c give the same information asFig. 8a, but for the ERS mosaics in the IR. About40 arcmin2 has ∼80% of the exposure time in theERS IR mosaics, or ∼90% of the intended IR sen-sitivity. The overall WFC3 UVIS–IR sensitivity is9–18% better than predicted from the ground-basedthermal vacuum tests (see §2.4 and Fig. 2), and soin essence 100% of the intended ERS exposure timewas achieved over the 50 arcmin2 UVIS images andthe 40 arcmin2 IR images.

12
5. CATALOG GENERATION FROM THE10-BAND ERS MOSAICS
5.1. Object Finding and Detection
All initial catalogs were generated using SExtrac-tor version 2.5.0 (Bertin & Arnouts 1996). In gen-eral, these catalogs were generated SExtractor’s sin-gle image mode for each ERS filter separately, sothat the object finding could be done using the totalobject flux from each ERS filter independently, asis required when determining the star counts (§6)and the galaxy counts (§7). SExtractor was onlyused in its dual image mode to generate the addi-tional catalogs that were used exclusively to makethe color-color diagrams in §5.6 to confirm our star-galaxy separation procedure, using the H-band asthe detection image. As stated in §4.2.1, the ACSB-band image was used as the detection image toget an optimal object definition in the UVIS filtersfor reasons explained in detail here.
It was necessary to change the parameters inSExtractor to handle the UVIS images slightly dif-ferently than the ACS/WFC and WFC3/IR ones.This is due to several factors, both cosmetic andphysical. The major difference is that galaxies ap-pear much smoother in the IR and more clumpy inthe UV, which occurs due to the specific distribu-tion of their young and old stellar populations aswell as their dust (see Windhorst et al. 2002 for adiscussion of this effect for all Hubble types). Hence,star-forming regions in well-resolved galaxies can bedeblended into separate objects by SExtractor if thedeblending is overly aggressive. Fortunately, mostof these intermediate redshift galaxies are not brightin the observed UV, causing the UVIS fields to ap-pear rather sparse, and making deblending a minorissue.
The UVIS images have a less uniform background(∼10–15% of sky), which as discussed in §4.1.1 canpossibly be improved, when accurate on-orbit UVISsky-flats have been accumulated over time. Forthese reasons, we adopted a seemingly low thresh-old for object detection with SExtractor, requiring4 connected pixels that are 0.75σ above the back-ground in the UV. Due to the clumpy nature of theERS objects in the UV, we convolved the UVIS im-age with a Gaussian kernel of FWHM of 6.0 pixelsfor the object detection phase only. The deblendingparameter, DEBLEND MINCONT, was set to 0.1,to assure that real objects were not over-deblended.It should be emphasized that object crowding is notan issue in these medium depth UV images (e.g.,Windhorst et al. 2008), so that the use of a largerSExtractor convolution filter, a lower SB-detectionthreshold, and less object deblending is fully justi-fied. The 6.0 pixel Gaussian convolution kernel im-proves the SB-sensitivity by ∼ 2 mag, given that thelow-level UV sky-gradients occur over much largerspatial scales than the typical faint galaxy sizes (see§4.1 and 5.5). Together with the fact that the UVIS
catalogs were made with SExtractor in dual imagemode — using the much deeper ACS B-band im-age as the detection image, as described above —avoids excessive deblending of the very clumpy UVobjects, which limits the number of spurious UVobjects detected, as shown in the discussion of theERS catalog reliability in §5.3.
The SExtractor input parameters for the ACS im-ages and WFC3/IR images were the same. The de-tection threshold was set to 1.5σ, again requiring 4connected pixels above the threshold for catalog in-clusion. The convolution filter was a Gaussian withFWHM of 3.0 pixels, and DEBLEND MINCONTwas set to 0.06. For all ten bands, the appropriateweight maps (see §4.2.2) were used in order to cor-rectly account for image borders (Fig. 3), as well asto properly characterize the photometric uncertain-ties and the effective areas for each mosaic (see Fig.8a–8c).
5.2. Object Extraction
Two post-processing steps were taken to clean thecatalogs of residual artifacts. First, due to the rel-atively small number of exposures per ERS filter,there were residual cosmic rays at the borders of thedither patterns, and in the chip gaps. These werecleaned by masking out all objects in regions wherethe number of exposures was less than three. There-fore, the total area coverage in each filter (Table 2 &Fig. 8a–8c) is slightly different. Secondly, SExtrac-tor will detect the diffraction spikes of bright pointsources. These are removed by searching for brightobjects with FWHM near the size of the PSF andsearching for surrounding objects in the catalog thatare both highly elongated and oriented radially out-ward in sets of 4 from that compact object. Sincethe number of bright stars is not large (see §4.3.2and figures therein, $ 5.5, & 6.1), this is only a mi-nor correction to the catalog, and only a few dozendiffraction spikes were found by SExtractor and re-moved in this way.
Magnitudes were all measured on the AB-scaleusing the most current zero-points available on theWFC3 website, which are listed in Table 2. BothPetrosian (1976) magnitudes were measured using aPetrosian factor of 2.0, and Kron (1980) magnitudeswere measured using a Kron-factor of 2.5 (SExtrac-tor parameter MAG AUTO). For the galaxy countsin §7.2, Kron magnitudes were used, because thecorrection to total magnitude — preferably using aSersic extrapolation — is less than that typicallyrequired for a Petrosian magnitude. Within theerrors, the Kron and Sersic based number countsare indistinguishable (Hill et al. 2010b). The totalmagnitude errors in the ERS as a function of totalAB-magnitude were determined from the SExtrac-tor errors in each filter, which are a combinationof the MultiDrizzle RMS-map errors and the imageshot-noise.
13
5.3. ERS Catalog Reliability
To test the reliability of ERS object catalogs, weperformed the negative image test (cf. Yan & Wind-horst 2004). In brief, all 10 ERS mosaics were mul-tiplied by –1.0, and then SExtractor was run withexactly the same parameters as the object findingprocedure in §. 5.1–5.2. This test showed that ourERS catalog generation was conservative due to thecombination of several factors. These include driz-zled the larger mosaic pixel size of 0′′.090, the re-quirement of four connected pixels above the detec-tion threshold, and the sizes of the Gaussian filtersapplied in the object detection phase. The choice ofthe SExtractor parameters listed in §5.1–5.2 weredetermined by trial and error to create the mostreliable catalogs at each wavelength.
In fact, these SExtractor parameter settingsyielded no plausible spurious detections when it wasrun on the 10 negative ERS images. In total, only6 negative “objects” were found, but these were allon the image borders, and the real ERS object cat-alogs were similar cleaned of such border defects. Ifthe noise in the ERS images were completely Gaus-sian, then at the >
∼ 5σ detection limit we would ex-
pect that 2.9×10⁻⁷ of the 6500×3000/4 indepen-dent ERS pixels (see Fig. 5a) would yield a bogusobject, or ∼1.4 bogus object in the combined 10-band catalog (the grand union) of 22,000 ERS ob-jects. This is consistent with no convincing bogusobjects found in the 10 negative ERS images afterdiscarding the image borders. This exercise showsthat at the 5σ 50% completeness level (see also Fig.9 below), our ERS object catalogs are >
∼ 99.97% re-liable. In astrophysical data samples, a compromisealways has to be sought between sample reliabil-ity and sample completeness, while ideally maxi-mizing the sum of the two (Windhorst, Kron, &Koo 1984b). The reason we choose here to haveessentially 100% reliable catalogs — at the expenseof some catalog incompleteness below — is the exis-tence of the deeper optical–near–IR ACS and WFC3images in the HUDF (Beckwith et al. 2006, Bouwenset al. 2010b, Yan et al. 2010) in the BVizYsJH fil-ters. These images made digging deeper into theERS image noise unnecessary. Instead, the faint-end of the galaxy counts at AB>
∼ 26–27 mag in §7will be derived in BVizYsJH from these HUDF im-ages, which is in roughly the same direction of thesky.
5.4. ERS Catalog Completeness
Fig. 9 shows the sample completeness functionsof the 10-band ERS images. These were derivedby Monte Carlo insertion of faint point sources intothe ERS images, and plotting the object recoveryratio as a function of total magnitude. Most faintgalaxies observed by HST are slightly resolved atthe HST diffraction limit (e.g., Cohen et al. 2003;Hathi et al. 2008; Windhorst et al.2008), so that forfaint galaxies these limits are slightly brighter than
for point sources, as discussed in §7.2 and shown inFig. 10a.
In summary, the WFC3 UVIS images are ∼50%complete for point-like objects with >
∼ 5-σ detec-tions in total flux for AB'26.3 mag in F225W,AB'26.4 mag in F275W, and AB'26.1 mag inF336W. The WFC3 IR images are ∼50% com-plete to AB'27.2 mag in F098M, AB'27.5 mag inF125W, and AB'27.2 mag in F160W, as listed inTable 1. The multi-year GOODS ASC/WFC v2.0images in BViz are substantially deeper than this,and reach AB>
∼ 27.5 mag in general. The actualstar counts in §6 appear indeed complete to roughlythese limits in the UV, but to slightly brighter lim-its in the IR due to the increasing object confusionof red stars with faint red background galaxies (seethe figure in §5.5).
The actual UV galaxy counts in §7.2 turn over ata level rather close to the above UVIS point-sourcesensitivity limits. This is due to the generally morecompact nature of the ERS objects, and the ex-tremely faint zodiacal sky-background in the UV. Inthe IR, the galaxy counts turn over at levels a littlebrighter than the 5-σ point-source sensitivity limitslisted in Table 2. This is due to the higher zodia-cal sky-background values in the near-IR (see Table2), combined with their somewhat larger sizes at thelonger wavelengths (§5.5 and figures therein; see alsoWindhorst et al. 2002), even though faint red fieldgalaxies selected in YsJH are in general still rathercompact. Object confusion at these flux levels isrelatively modest, especially at the HST diffractionlimit, although natural confusion — which due tothe intrinsic object sizes and not the instrumentalPSF-FWHM — becomes increasingly important atfainter fluxes (AB>
∼ 25 mag; e.g., Windhorst et al.2008).
In summary, the point-source sensitivity of ourERS catalogs is described by the simulations in Fig.9. The corresponding 50% point-source complete-ness limits are listed in Table 1. The actual observedpanchromatic star-counts (§6.1 and figures therein)are complete to roughly the 5-σ limits of Fig. 9 inthe WFC3 UVIS filters, and to the 10-σ limits ofFig. 9 in the ACS BViz and WFC3 IR filters.
Rather than repeating the object simulations ofFig. 9 to assess the actual completeness limits forthe slightly extended galaxies (see §5.5 and figurestherein), in §7 below we take a different and moreempirical approach of determining the ERS incom-pleteness for faint galaxies by directly comparingthe panchromatic ERS galaxy counts to AB<
∼ 25.5–27 mag to the galaxy counts in the much deeper,but adjacent HUDF field. Since the effects of cos-mic variance are relatively small over the 4′ sep-aration between the ERS and HUDF fields (see §7and Fig. 3), this comparison directly shows that theERS catalogs are approximately >
∼ 50% complete forsamples of compact galaxies (see §5.5) to flux levelsthat are approximately 0.5–1.0 mag brighter (from

14
the UVIS to the IR) than the ERS stellar samplesin the same filters.
5.5. Star Galaxy separation in the ERS Mosaics
Stars and galaxies were separated as follows. Ineach filter, the stellar locus was defined as shownin the usual plot of the object FWHM versus to-tal AB-magnitude (e.g., Cohen et al. 2003). Fig.10a illustrates our star-galaxy separation procedureused for the 10-band ERS images. Objects withFWHM<PSF-FWHM (from Table 2) are image de-fects, bad pixels, and some remaining CRs. Hence,objects to the left of the black vertical lines plottedat FWHM'0′′.07–0′′.15 are smaller than the PSF,and are discarded. Objects in the thin vertical fila-ments immediately larger than this are stars (plot-ted as thin reds dots in Fig. 10a), and they ingeneral have PSF-FWHM<
∼ FWHM<∼ (1+ε)×PSF-
FWHM, where 0<∼ ε<1. Fig. 10a shows that
ERS stars straddle the instrumental PSF-FWHMto AB'27 mag. Objects to the right of the blackdashed slanted lines are galaxies, and they in generalhave FWHM>
∼ (1+ε)×PSF-FWHM, where “1+ε” isa weak function of total S/N-ratio, as shown by thetwo solid slanted lines in each of the panels in Fig.10a.
Next, all ten independent ERS object catalogs— each with their independent star-galaxy separa-tion and photometry — were merged by astrometriccross-matching. In order to maximize the 10-bandinformation, we considered an object to be a starif it was classified as stellar in at least 3 out of 10ERS filters. This provides robust stellar classifica-tions, perhaps to fainter limits than can be done insingle filter alone.
From Fig. 10a, we can see that the stars sepa-rate out well from the galaxies to about AB'25.5–26.0 mag, and somewhat fainter in the ACS BVizfilters and the WFC3 IR filters. To these flux lev-els, the star counts follow a power-law rather well,as shown in §6.1. The choice to require an objectto be classified as a star in three filters — as op-posed to all ten filters — was made because starscan be either very red or sometimes very blue, andso stars are often not detected in all 10 ERS filters.Also, we are merging the data from three differentHST instruments and detectors (WFC3 UVIS CCD,ACS/WFC CCD, and the WFC3 IR detector), sosubtle PSF and sampling differences between theseinstruments can lead to the mis-classification of afaint star in some of the 10 ERS filters, dependingon its color. Since brighter stars are always seen atleast in three (adjacent) ERS filters, we require allof the fainter stars to be classified as stellar in atleast three of the ERS filters as well.
5.6. Confirmation of Star-Galaxy Separation:Proper Motion and Stellar Colors
As shown in §4.3.2 and Fig. 4c, all ERS objectstogether — which are >
∼ 97.8% galaxies — allowed
us to bring the WFC3 UVIS and IR coordinate sys-tem on average on top of the ACS WFC WCS towithin 0.4–0.5 m.a.s. in both RA and DEC. Afterhaving done this, the 4511 ERS objects classified asgalaxies show indeed no significant residual motionover 5.97 years. However, for all 103 ERS objectsclassified as stars, an average proper motion of 2.30–2.02 m.a.s./yr was detected at the 4.1–5.8-σ level inRA and DEC, respectively (see §4.3.2). For at least32 out of the 103 ERS stars, this proper motionwas discovered individually at the ≥3-σ level (seeFig. 4c). The total average proper motion of all 103ERS stars on the sky is 3.06 m.a.s./yr, summed inquadrature over the RA and DEC proper motions.The mean error is 0.66 m.a.s./yr, which amounts toa 4.6-σ detection of the overall ERS stellar propermotion. The dispersion on this number in Fig. 4c is6.70 m.a.s./yr. We will interpret these numbers inmore detail below. In conclusion, while ERS propermotions alone cannot confirm that all our ERS ob-jects classified as stellar are in fact Galactic stars,average stellar proper motion is detected at highsignificance level for the entire sample of 103 ERSstellar candidates, making it in retrospect likely thatmost of these are in fact Galactic stars.
The ERS colors in Fig. 10b are more conclusivein supporting our ERS star-galaxy separation pro-cedure a posteriori. Fig. 10b shows the (i–z) vs.(B–V) color-color diagram in the GOODS filters,where all ERS objects have the highest S/N ratio(see Fig. 9). ERS objects classified as galaxies asshown as black dots, and ERS objects classified asstars with green or red asterisks. Green asterisksmark ERS objects that show proper motion at the≥3-σ level in Fig. 4c (see §4.3.2). The (i–z) vs.(B–V) colors are compared to the Pickles (1998)model library SEDs (blue squares), which range inspectral type from O5V–M7V, and also show gi-ant branch models up to M7III. The observed ERSstellar colors are shown with their 1-σ error bars.Only stars with combined color errors along eachaxis <
∼ 0.5 mag are plotted. It is clear that withinthe errors, most stellar ERS objects have colors ofK–M type main sequence stars, although there area few ERS stars with color as blue as BV–GV types.
There are about 20 ERS stars in the color range0<
∼ (B–V)<∼ 1.4 mag with (i–z) colors >
∼ 0.3 mag red-der than the Pickles (1998) main sequence. At least8 of these also have significant proper motion at the>∼ 3-σ level, and are thus real Galactic stars. All 20objects significantly redder than the Pickles (1998)main sequence were inspected by eye and correlatedwith other data. Three have VLT redshifts: one isa Seyfert galaxy at z=1.031 in a group with similarspectroscopic redshifts, the other a compact ellip-tical at z=0.251 next to a very faint stellar object,and the third is a stellar object next to an object atz=2.217 with a neighbor at a similar redshift. Thelatter two stellar objects also have significant propermotion, and are likely real Galactic stars that are

15
very close to an extragalactic object whose VLT red-shift was actually measured.
Thus at least 17 — and likely 19 — of these 20ERS stars with colors significantly redder than thePickles (1998) main sequence have either signifi-cant proper motion and/or clear stellar morphology.Many of these appear to be stars that were unavoid-ably saturated in the ERS images. Because boththeir colors are >
∼ 0.0 mag — they have higher ADUin i-band than in z-band, and in V-band than inB-band — given the ACS/WFC QE curve. Hence,their measured (i–z) flux will be too red, and their(B–V) color slightly too blue. Since these stars aresaturated in nearly every ACS exposure, more accu-rate colors cannot be determined with the currentmosaics, and their appearance above the Pickles(1998) main sequence does thus not rule them out asstars. Some of the reddest stars well away from thePickles (1998) main sequence could be AGB starswith surrounding dust shells that could considerablyredden their (B–V) and (i–z) colors significantly.
We also need to address how many of the stellarobjects that are within the errors consistent withthe Pickles (1998) stellar main sequence could becompact background galaxies. Fig. 10b shows thatthe (i–z) vs. (B–V) color space of zero redshift stel-lar SEDs overlaps somewhat with the colors of inter-mediate redshift galaxies, which largely occupy theregion (B–V) <
∼ 1 mag and (i–z) >∼ 0.15 mag. This is
a limitation of the current color confirmation of thestellar ERS candidates. Only multi-parameter 10-band SED fitting of all ERS objects can address thisissue more fully, which we will address in a futurepaper (Cohen et al. 2011). However, the availableVLT spectra can give us some idea.
Among the 103 objects classified as ERS stars,many would have been bright enough to have beenincluded in the VLT redshift survey, which is com-plete to AB<
∼ 24 mag, but covered objects as faint asAB<
∼ 25 mag. Among the 103 stellar ERS objects,11 appear to be compact extragalactic objects con-firmed to have VLT redshifts z>0. One of these isa quasar with an underlying early-type galaxy atz=0.734.
In summary, this detailed study in Fig. 10b con-firms that at least 90–92 of the 103 stellar ERSobjects have either significant proper motions (Fig.4c), stellar colors consistent with the Pickles (1998)main sequence (Fig. 10b), and/or are not extra-galactic objects with VLT redshifts z>0. Conser-vatively, we can thus conclude that our ERS stellarobjects are indeed Galactic stars with >
∼ 87% relia-bility. This provides a posteriori confirmation thatour ERS star-galaxy separation method of §5.5 —which was based on measured effective image di-ameters only (Fig. 10a) — is indeed valid. Thisthen also means that we may consider the statisticalproper motions of all ERS stars in Fig. 4c, to inves-tigate if the implied average proper motion showsus something interesting about Galactic structure
of very faint stars at high Galactic latitude (theGOODS-South field has bII =–54). We discussthis in section 6 in more detail.
As a final remark, ideally one would like the star-galaxy separation procedure to also include accuratefits of a library of (redshifted) SEDs to the 10-bandERS object photometry, and so help decide whetheran object is most likely a zero-redshift star or a red-shifted galaxy. This is beyond the scope of the cur-rent paper, and is pursued by Cohen et al. (2011)for the ERS stars and galaxies separately. This pa-per will also attempt to do a stellar + power-lawAGN SED fits to all ERS objects, including on apixel-to-pixel basis. This procedure will also pro-vide better estimate of the AGN contamination ofthe ERS sample, rather than relying on the presenceof weak point-like components in the ERS imagesalone. Suffice to say here that in Fig. 10b mostERS stars have colors consistent with the stellarmain sequence, so that contamination of our stellarERS objects by weak AGN or other compact extra-galactic objects is likely small. This is confirmedby the high proper motion stars in Fig. 10b, whichhave statistically the same color-distribution as thestellar ERS objects without measurable proper mo-tion.
6. RESULTS ON ERS STARS
6.1. The Panchromatic ERS Star Counts toAB'26 mag
Fig. 11a shows the differential panchromatic starcounts in the 10-band ERS images. The star-galaxyseparation breaks down at fluxes AB>
∼ 26 mag inBVizYsJH. However, for AB>
∼ 22 mag galaxies out-number stars by a large margin, so the more un-certain star-galaxy separation for AB>
∼ 26 mag willnot affect the quality of the galaxy counts. The starcounts, of course, become correspondingly harder todo for AB>
∼ 25 mag, and so in section 6.2 and Fig.10b additional criteria such as colors and propermotion were used to confirm faint stars at higherconfidence.
The solid black line in the F850LP panel ofFig. 11a represents the spectroscopic star countsto AB'25 mag from the HST Cycle 14 ACS grismsurvey “PEARS” (Probing Evolution And Reion-ization Spectroscopically) of Pirzkal et al. (2009).Since for these objects we can use the low reso-lution ACS G800L spectroscopic data as indepen-dent confirmation of their stellar nature, they havehigher accuracy than the image-based star-countsalone. The southern PEARS ACS grism survey wasdone over a similar sized area to the ERS, cover-ing an overlapping portion of GOODS-S. Hence, itis encouraging that the Pirzkal et al. (2009) grismstar counts, which are for spectral types of M0 andlater, have the same slope as our direct-imaging ERSstar counts in F850LP. The slightly different starcount amplitude for the flux range 18<
∼ AB<∼ 25 mag
is likely due to the fact that the spectroscopic sam-

16
ple was limited to later spectral types, where thosegrism classifications were most reliable. The goodagreement in star counts between the two differentsurvey methods confirms that — as far as faint starsare concerned — our star-galaxy separation is accu-rate to about AB'25 mag.
Fig. 11b shows the ERS star count slope versusobserved wavelength in the flux ranges AB'19–25.5mag for the 3 UV WFC3 filters, AB'16–26 magfor the GOODS/ACS BViz filters, and AB'15–25mag for the 3 WFC3 IR filters, respectively. TheGALEX FUV and NUV points of Xu et al. (2005)are also plotted at 153 and 231 nm, and cover theflux range AB'17–23 mag, using primary color cri-teria to accomplish star-galaxy separation at the 4–6” FWHM GALEX resolution. The statistics of thestar counts in the three bluest ERS filters (F225W,F275W and F336W) are rather sparse (Fig. 11a).As a consequence, our three bluest best-fit ERSpower-law slope values are rather uncertain, as in-dicated by the larger error bars in Fig. 11b. TheGALEX FUV and NUV star count points of Xuet al. (2005) are complete to somewhat brighter lev-els (AB'23–24 mag), but have much better statis-tics. As a consequence, the GALEX FUV and NUVstar count slope points in Fig. 11b have smaller er-ror bars, and at the common wavelength of ∼230nm they therefore carry larger weight than the ERSstar count slope in the mid–UV.
Given these uncertainties, the Galactic star countslope at the faint-end is remarkably flat at all wave-lengths from the Balmer break to the near-IR, al-though it is rather poorly determined from the ERSdata alone below the Balmer break. The values ofthe best-fit ERS power-law star count slope is ingeneral of order 0.03–0.05 dex/mag. Including themore accurate GALEX star count slope values at150 and 230 nm, the panchromatic faint-end of thestar-count slope appears to be always in the range0.03–0.20, i.e. at all ERS wavelengths the faint star-count slope remains well below Euclidean value of0.6 dex/mag. This shows that to a depth of AB'25–26 mag at all wavelengths in the range 0.2–2 µm,the ERS images readily penetrate through most ofthe thick disk of our Galaxy at these latitudes (bII
'–54) in the direction of the Galactic anti-center(lII =224; Ryan et al. 2005; Beckwith et al. 2006).This trend was also seen in the red ACS imagingparallels of Ryan et al. (2005), and the red ACSGRAPES and PEARS grism observations of Pirzkalet al. (2005, 2009), respectively, each of which con-strained the scale-height of Galactic L & T dwarfsto about 300–400 pc.
In the bluest three WFC3 filters F225W, F275W,and F336W, the WFC3 ERS finds only 22, 18, and27 faint stellar candidates, respectively. Most of thefull sample of ERS stars have 10-band colors redenough to indicate Galactic halo K–M type starsand possibly a few L & T dwarfs, but a few of thefaint stars are blue (see §5.6 and Fig. 10b). The
latter could be faint Galactic white dwarfs, thoughthere were no UV detected stars that were not alsoseen in the ACS B-band. The effective ERS UVstellar detection limit of AB'25 mag could tracea T=2×10⁴K white dwarf with an absolute mag-nitude in the range Mbol'+15 to +10 mag (Har-ris et al. 2006) out to a distance of 1–10 kpc, re-spectively, assuming modest bolometric corrections.The faint stellar objects in the 10-band ERS dataare obviously of great interest by themselves, andwill be studied in more detail in a future paper.An important lesson learned for UV observationsof high-latitude fields is that there are so few UVbright stars, that one has to ensure that individualexposures are long enough in order to align and driz-zle (or stack) them using faint galaxies. In the ERSUV images we did this using the cross-correlationtechnique, as explained in more detail in AppendixA.
6.2. The Nature of Faint ERS Stars from ProperMotion and Stellar Colors
Fig. 10b suggest that the majority of ERS starshave red colors characteristic of faint red main se-quence stars. Their typical spectral type is in therange K0V–M5V with an average spectral type of∼K5V. For these stars, the expected MV rangesfrom +5.8 to +12.3 mag with an average of MV
∼+8 mag. With the flat ERS star count slope ofFig. 11a, the average ERS star has an AB magni-tude of ∼23 mag, while the ERS stellar detectionlimit is AB<
∼ 26 mag. Hence, the average faint redERS star will be at a distance of about R'10 kpcfrom the Sun. The direction of the GOODS-Southfield at RA=03h 32m 39s, DEC=–2747′ 29′′.1 is inthe Southern Galactic hemisphere, about 54 be-low the plane of the Milky Way, and in the generaldirection of the Galactic anti-center. Stars in thisdirection at ∼10 kpc distance from the Sun will thusbe bulge and disk stars ∼8 kpc below the Galacticplane, i.e., well below the outer Orion arm of theGalaxy. At this distance, the above average ERSproper motion of 3.06 ± 0.66 m.a.s./yr amounts toan average stellar tangential velocity of <
∼ 145 ± 31km/sec (m.e.). These stellar velocities and their dis-persion are in part due to the projected solar motionin the sky — compared to the Galactic Local Stan-dard of Rest (LSR) — and in part due to the truespace velocities of ERS stars in the Galactic bulgeand disk. While a detailed discussion of the propermotion of ERS stars and its implication for Galacticstructure is beyond the scope of the current paper,we will here briefly discuss how our ERS proper mo-tion results compare to previous proper motion andradial velocity observations of the Galactic bulgeand disk at intermediate to high Galactic latitude.
A proper motion study to V<∼ 22.5 mag at the
North Galactic Pole by Majewski (1992) shows asystemic velocity of –120 km/sec at the edge of thethick disk (Z >
∼ 5.5 kpc). Clarkson et al. (2008) show

17
similar proper motion values at R∼5 kpc, but inBaade’s window from multi-epoch HST/ACS im-ages that are effectively complete to about I<
∼ 21mag given the more crowded images at low Galacticlatitudes. Kinman et al. (2007) find that GalacticBlue Horizontal Branch (BHB) stars with an aver-age distance to the Galactic plane of Z <
∼ 8 kpc havezero galactic rotation and roughly isotropic velocitydispersions of 93–81 km/sec in the tangential and Zdirections, respectively, or∼123 km/sec in the planeof the sky. Theoretical disk+bulge+halo models(Battaglia et al. 2005, Klypin et al. 2002) predict ve-locity dispersions at R∼5-10 kpc of 150 km/sec forthe Galactic bulge+thick disk components.
These values are very similar to the 145 km/secvalue implied from the average proper motion ob-served for our faint red ERS stars at relatively highGalactic latitude (bII =-54). In other words, theGalactic (thick disk+bulge) velocity dispersion im-plied from our faint red ERS stellar proper motionsis consistent with these previous observations andtheoretical model predictions. It is worth noting,however, that these previous observations are basedon high resolution radial velocities and proper mo-tions of Galactic stars with V<
∼ 16 mag, or propermotions alone for stars with V<
∼ 22.5 mag. OurERS observations push this substantially fainter forproper motions at high Galactic latitudes, to fluxlevels (AB<
∼ 25–26 mag) where high resolution spec-troscopy cannot be done with current ground basedfacilities. Systematic proper motion studies of veryfaint stars at HST resolution at high Galactic lat-itudes thus have the potential to sample part ofGalactic structure that is otherwise not easily ac-cessible. This topic will be studied in further detailin a subsequent paper.
7. RESULTS ON GALAXIES IN THE ERS
7.1. The Panchromatic ERS Galaxy Counts toAB'26–27 mag
Fig. 11a also shows the differential panchromaticgalaxy number counts in the 10-band ERS images.No completeness corrections — as implied by Fig.9 and 10a — were applied to the faint-end of thepanchromatic ERS galaxy counts in Fig. 11a. In-stead, to be conservative, the data points are notplotted in all panels of Fig. 12 at the flux levelwhere the counts clearly start to deviate from abest-fit faint-end power-law (see Fig. 11a & 11c)by more than 50%. This in general occurs 0.5–1.0mag brighter than the 50% point-source complete-ness limits listed in Table 1, as derived from Fig.9.
Fig. 11c shows the ERS galaxy count slope versusobserved wavelength in the flux ranges AB'19–25mag for the 3 UV WFC3 filters, AB'18–26 magfor the GOODS/ACS BViz filters, and AB'17–25mag for the 3 WFC3 IR filters, respectively. TheGALEX FUV and NUV points of Xu et al. (2005)are also plotted at 153 and 231 nm, and cover
AB=17–23 mag, again using primary color crite-ria to accomplish star-galaxy separation at the 4–6” FWHM GALEX resolution. The statistics ofthe galaxy counts in the three bluest ERS filters(F225W, F275W and F336W) are sparse (Fig. 11a),and at the BRIGHT-END the ERS object defini-tion and deblending is more complex given the sizesof the brighter objects (Fig. 10a). As a conse-quence, the best-fit ERS galaxy count power-lawslope values become somewhat more uncertain atthe bluer ERS wavelengths (Fig. 11c). The GALEXFUV and NUV galaxy counts of Xu et al. (2005)are complete to somewhat brighter levels (AB'25mag), but have much better statistics than the ERS.Given the much larger size of the GALEX beam(4–6” FWHM), they do however suffer from moreuncertain star-galaxy separation, which for GALEXneeded to be done by using multi-color informationas well (Baldry et al. 2010). At the longer GALEXwavelength, it may be harder to separate Galacticstars from low redshift older galaxies using colorsalone. As a consequence, the GALEX NUV countslope point in Fig. 11c has a somewhat larger errorbar at the common wavelength of ∼230 nm.
Given the above uncertainties in the GALEX andERS UV galaxy count slopes, the galaxy countsshow the well known trend of a steepening of thebest-fit power-law slope at the bluer wavelengths,which is caused by a combination of the more sig-nificant K-correction and the shape of the galaxyredshift distribution at the selection wavelength.The galaxy count slope changes significantly froma>
∼ 0.44 dex/mag at 0.23 µm wavelength to a'0.26dex/mag at 1.55 µm wavelength. Hence, the galaxycounts have a slope flatter than the Euclidean valueof a'0.6 dex/mag. However, at wavelengths be-low 0.4 µm the UV galaxy counts are steeper thanthe a ≤0.4 dex/mag value required for their sky-brightness integral to converge to a finite value, ifthey were to continue with this power-law slope forAB>
∼ 27 mag. That is, the UV galaxy counts willhave to turn over with a slope flatter than ≤0.4dex/mag for AB>
∼ 27 mag. In §7.3 we will confirmthat they indeed do so.
7.2. The Panchromatic Galaxy Counts for10<
∼ AB<∼ 30 mag
Fig. 12a–12j show the galaxy number countsin the 10-band ERS images compared to a num-ber of other panchromatic surveys at the brightend and at the faint end. At the bright end,we added the counts from the Galaxy and MassAssembly (GAMA) survey (Driver et al. 2009) inNUV+ugrizYJH, which cover AB=10–21 mag (Xuet al. 2005; Hill et al. 2010a). Details on the ground-based data obtained in the GAMA survey are givenby Driver et al. (2009) and Hill et al. (2010a). TheGAMA survey also uses matched aperture Kronmagnitudes, which are comparable to our total mag-nitudes used for the ERS.

18
The GAMAs star-galaxy separation procedure isquite different than for the ERS, since there is a sig-nificant potential for contamination by stars whichdominate the number counts at brighter magnitudes(Fig. 11a). The GAMA star-galaxy separationtherefore uses the (rPSF –rmodel) parameter to de-termine how extended an object is, and also usesthe well-defined stellar locus in the (g–i) vs. (J–K)color-color diagram. Details of the star galaxy sepa-ration methods used in the GAMA survey are givenby Baldry et al. (2010).
At the faint end in Fig. 12d–12j, we added theHUDF counts in BViz from Beckwith et al. (2006),which cover AB=24–30 mag, and the HUDF countsfrom the Bouwens et al. (2010b) data in the F105W,F125W, and F160W filters (hereafter YJH), as com-piled by Yan et al. (2010), which cover AB=24–30mag. In the UV, we added the WHT U-band countsand the HDF-North and South F300W counts ascompiled by Metcalfe et al. (2001), the deep LBTU-band counts of Grazian et al. (2009), as well asthe deep HST STIS UV counts of Gardner et al.(2000).
We note that the filter systems in the compar-isons in each of Fig. 12a–12j are not quite identical,although they were chosen in every case to be asclose as possible in wavelength (typically to within0.1 dex). Hence where necessary, small but appro-priate AB-mag offsets or color transformations weremade between the filters and models used in eachplot, following Metcalfe et al. (2001) or Windhorstet al. (1991). These corrections generally containsome color dependence. When applying them as asingle AB-flux scale correction to a given survey canintroduce uncertainties of order 0.1 mag in the flux-scale used. Over the entire AB=10–30 mag rangeshown in Fig. 12a–12j, such ∼0.1 mag offsets wouldnot be noticeable. However, for a detailed set ofmodeling in subsequent work, more subtle flux andcolor dependent corrections may need to be applied.This will be the subject of a future paper.
The error bars in each of the counts in Fig. 12a–12j are Poisson, and therefore do not include effectsfrom cosmic variance. To increase the statisticswhere necessary at the bright-end of each survey,bins were combined logarithmically using the localslope of the galaxy counts, following the prescrip-tion of Windhorst, van Heerde & Katgert (1984a).At the faint-end, the counts are not plotted in Fig.12a–12j fainter than the flux level where these aredeemed complete. Based on Fig. 9 and 11a, thisoccurs in general where the counts turn over sig-nificantly within the statistical error bars. Hence,in principle, the panchromatic counts of Fig. 12a–12j should be comparable over the entire flux rangeAB'10–30 mag, except for the effects of cosmicvariance. The latter is small for the panchromatic∼116 deg2 GAMA survey, but it could be impor-tant for the other panchromatic survey areas plot-ted, such as the ERS and the HUDF which are both
(disjoint) parts of GOODS-S, as well as the HDF-North (in GOODS-North) plus the HDF-South andvarious other ground-based surveys in the U-band.
In the flux range where the panchromatic GAMAand HUDF counts in Fig. 12a–12j overlap with thepanchromatic ERS counts, the agreement is in gen-eral quite good, except at the bright-end of the ERS,which suffers from cosmic variance, and from thefact that the GOODS/ERS field was chosen to bedevoid of objects much brighter than AB=18 mag.As a consequence, the bright end of the ERS galaxycounts also suffers somewhat from incompleteness.The same is true for the bright end of the HUDF,which suffers similarly from cosmic variance and theavoidance of objects much brighter than AB∼21–22mag when that field was selected in early 2003 forthe ultradeep HST survey. The HUDF is adjacentto, but does not overlap with the ERS area (see Fig.3). The HUDF galaxy counts in BVizYsJH are ingood agreement with the ERS galaxy counts to theflux levels where the panchromatic ERS counts areconsidered complete (AB'26–27 mag in Fig. 11a).
The good agreement between these various sur-veys also implies that the flux scales of the panchro-matic ERS counts are approximately correct. Hadone of the ERS filter zero-points been off signifi-cantly (e.g., by more than 0.1–0.2 mag), we wouldhave noticed this as a significant offset betweenthe counts. Note this argument only holds for thecounts at AB>
∼ 20 mag, as these cover the same gen-eral area of sky in the GOODS-South field. Hence,cosmic variance likely affects these counts similarlyover such scales (<
∼ 30%, Somerville et al. 2004).
7.3. Modeling the Panchromatic Galaxy Countsfor 10<
∼ AB<∼ 30 mag
Fig. 12a–12j over-plots simple galaxy evolutionmodels by Driver et al. (1995, 1998), which havebeen updated for the current comparison with theERS. Driver et al. (1995, 1998) and Cohen et al.(2003) provide further details of these models. Inshort, they use the best available local LF as afunction of galaxy type, and K-corrections from theBruzual & Charlot (2003) spectral evolution mod-els, also as a function of galaxy type. The localgalaxy LF then gets integrated with the WMAP-year 7 (Komatsu et al.2010) cosmological volumeelement to predict the number density of galaxiesobserved to the total-flux limit in each ERS filter.These models also include internal reddening as afunction of galaxy type.
These models have been updated with the bestavailable local panchromatic LFs in ugrizYJHKfrom the MGC survey by Hill et al. (2010b), and inthe UV they use the GALEX LFs of Robotham &Driver (2010). These LFs will be updated in futurework with GAMA redshifts from the 3-year AATsurvey that was concluded in 2010. Robotham et al.(2010) provide further details on the GAMA red-shift survey. This GAMA data set is currently 99%
19
redshift-complete for rPetro'19.4 mag, and pro-vides high-fidelity, matched-volume panchromaticLFs, which are essential to interpret the higher red-shift panchromatic ERS work.
Evolution of the faint-end LF-slope is not yet in-cluded in these simple models, but the panchro-matic local GAMA LFs automatically includes thewell-known steepening of the local LF towardsshorter rest-frame wavelengths, where the local LFis dominated by the more rapidly star-forming late-type galaxies (see Driver et al. 1998; Robotham& Driver 2010; Hill et al. 2010b). The epoch-dependent galaxy redshift distribution is also notan input to these models, but can instead be in-ferred from the local LF as a function of type(e.g., Driver et al. 1996), the total constraints pro-vided by the panchromatic galaxy counts (fig. 12a–12j), the adopted K-corrections as a function ofgalaxy type, and the adopted evolutionary modelparameters. These simple evolution models usedare either a pure luminosity evolution model (PLE)with e(z) = 2.5 log[(1+z)β ] and PLE exponent β,or a number density evolution (NDE) model withn(z) = no [(1+z)γ ] and NDE exponent γ, or a com-bination thereof.
Based on the currently available, best panchro-matic local GAMA LFs, Fig. 12a–12j showfor AB=10–30 mag the pure luminosity evolutionmodel prediction with PLE exponent β=1 (dot-ted lines), the number density evolution modelprediction with NDE exponent γ=1 (short-dashedlines), or a combination of both models indicated byboth parameters β=γ=1 (long-dashed lines). Thesolid lines show in all cases the non-evolving model(β=γ=0).
Over the entire flux range AB'10–30 mag, Fig.12a–12j show that no single PLE model fits allthe available galaxy count data, since there is notenough volume at high redshift to make any PLEmodel fit the high observed counts, especially in thevisual to near-IR (Fig. 12d–12j). This means thatone has to invoke number density evolution (NDE)as well, i.e., β >
∼ 1 and some modest amount of lu-minosity evolution for γ >
∼ 0. The best models usingthese PLE or PDE prescriptions are either the β'1or the γ'1 model. Fig. 12a–12j also shows that nosingle combined PLE+NDE model fits the panchro-matic galaxy counts in all 10 bands simultaneouslyover the entire observed range AB'10–30 mag, noteven with the best available panchromatic local LFfrom the GAMA survey (Hill et al. 2010b).
In particular, Fig. 12d–12j show that at the faint-end of the galaxy counts in YJH there exists a signif-icant excess in observed object numbers comparedto these simple models. This could be due to eitheran additional population of objects at high redshifts,or — more likely — due to lower luminosity objectsat lower redshifts, and/or because some essentialaspects are missing in these models. A detailed dis-cussion of these possibilities is beyond the scope of
the current paper, but the reader is referred to e.g.,Bouwens et al. (2010), Yan et al. (2010), and Wyitheet al. (2011) for a discussion of some of these possi-bilities.
More realistic galaxy evolution models would beones in which the faint-end Schechter LF-slope αalso evolves with redshift, as has been suggested bye.g., Ryan et al. (2007) and Khochfar et al. (2007).In particular, the faint-end LF-slope α steepenssignificantly at higher redshifts, which was sug-gested by e.g., Yan & Windhorst (2004), Ryan et al.(2007), Hathi et al. (2010), and Oesch et al. (2010).One would like to compare our panchromatic ERSgalaxy counts from 0.2–2 µm over the entire ob-served range AB=10–30 mag (Fig. 12a–12j) tostate-of-the art hierarchical simulations that reachfrom z=8 to z=0, and properly fold star-formationand stellar population evolution models with theseΛCDM simulations. Such models have been made,e.g., by Croton et al. (2006), de Lucia & Blaizot(2007), and Nagamine et al. (2005a, 2005b), andare discussed in further detail by e.g., Kitzbichler &White (2007), Monaco, Fontanot, & Taffoni (2007),and Nagamine (2006). It is difficult for such mod-els to predict reliable panchromatic galaxy countsfrom 0.2–2 µm that cover the entire observed rangeAB=10–30 mag, because such simulations take avery large amount of computing time to cover thelow redshift regime (z<
∼ 3), to cover the entire galaxyLF, and to let and them run all the way to z=0. Inaddition, such models need to include increasinglycomplex physics with cosmic time, such as hierarchi-cal merging and/or downsizing, feedback processesfrom supernovae and AGN, and how these processeschanged the faint-end and bright-end of the galaxyLF, respectively, over cosmic time, as well as includethe physics of dust. This will be the subject of afuture paper that compares the observed panchro-matic galaxy counts from 0.2–2 µm over the entireflux range AB=10–30 mag to available hierarchicalmodels.
For now, we conclude that the simple PLE+PDEmodels with the best available observed panchro-matic local LF from GAMA can explain each of the10-band counts for 10<
∼ AB<∼ 30 mag individually,
but no single one of the simple PLE+NDE modelscan explain the counts over this entire flux range inall 10 filters simultaneously.
8. SUMMARY AND CONCLUSIONS
In this paper, we presented the new HST WFC3Early Release Science (ERS) observations in theGOODS-South field. We presented the scientificrationale of this ERS survey and its data, thedata taking plus data reduction procedures of thepanchromatic 10-band ERS mosaics. We describedin detail the procedure of generating object catalogsacross the 10 different ERS filters.
The new WFC3 ERS data provide calibrated,drizzled mosaics in the UV filters F225W, F275W,

20
and F336W, as well as in the near-IR filters F098M(Ys), F125W (J), and F160W (H) in 1–2 HST or-bits per filter. Together with the existing HST Ad-vanced Camera for Surveys (ACS) GOODS-Southmosaics in the BViz filters, these panchromatic 10-band ERS data cover 40–50 square arcmin at 0′′.07–0′′.15 FWHM resolution and 0′′.090 Multidrizzledpixels to depths of AB'26.0–27.0 mag (5-σ) forpoint sources and AB'25.5–26.5 mag for compactgalaxies. The galaxy samples are >
∼ 50% completeto these limits, and >
∼ 99.97% reliable.We also described the high quality star-galaxy
separation made possible by the superb resolutionof HST/WFC3 and ACS over a factor of 10 in wave-length to AB'25–26 mag from the UV to the near-IR, respectively, using proper motion and BViz col-ors to confirm the star-galaxy separation procedure,which has an overall reliability of >
∼ 87% for stars.Our main science results are:
1) We present the resulting Galactic star counts andgalaxy counts in 10 different filters. From the ERSdata, these could be accurately determined fromAB'19 mag to AB'26 mag over a full factor of10 in wavelength from the mid-UV to the near-IR.
2) Both the Galactic stars counts and the galaxycounts show mild but significant trends of decreas-ing count slopes from the mid–UV to the near-IRover a factor of 10 in wavelength:
2a) The faint-end of the Galactic star count slope isremarkably flat at all wavelengths from the Balmerbreak to the near-IR. The values of the best fitpower-law star count slope is in general of order0.03–0.05 dex/mag above the Balmer break, i.e.well below Euclidean value of 0.6 dex/mag. Thisshows that to a depth of AB'25–26 mag at all wave-lengths in the range 0.2–2 µm, the ERS images arelooking through most of the thick stellar disk of ourGalaxy at intermediate latitudes.
2b) We measured the proper motion for 103 ERSstars, most of which have colors consistent with thestellar locus in a (i–z) vs. (B–V) color-color di-agram. Their ensemble average proper motion is∼3.06±0.67 m.a.s./year. This is a 4.6σ measure-ment of the average proper motion of faint starswith 16<
∼ AB<∼ 26 mag. At the typical distance of
these faint Galactic K–M type stars (∼ 10 kpc), theaverage ERS proper motion correspond to a veloc-ity of ∼145 km s−1 , consistent with Galactic struc-ture models and previous stellar radial velocity andproper motion observations at much brighter levels.
3) The galaxy count slope changes significantlyfrom a'0.44 dex/mag at 0.23 µm wavelength toa'0.26 dex/mag at 1.55 µm wavelength, showingthe well known trend of a steepening of the best-fit power-law slope at the bluer wavelengths. Thisis caused by a combination of the more significantK-correction and the shape of the galaxy redshiftdistribution at the selection wavelength.
4) We combine the 10-band ERS counts with the
panchromatic GAMA counts at the bright end(10<
∼ AB<∼ 20 mag), and with the ultradeep HUDF
counts in BVizYsJH and other available HST UVcounts at the faint end (24<
∼ AB<∼ 30 mag). The
galaxy counts are now well measured over the entireflux range 10<
∼ AB<∼ 30 mag over nearly a factor of
10 in wavelength.
5) We fit simple galaxy evolution models to thesepanchromatic galaxy counts over this entire fluxrange 10<
∼ AB<∼ 30 mag, using the best available 10-
band local galaxy luminosity functions (LFs) fromthe GAMA survey (Hill et al.2010a), as well as sim-ple prescriptions of luminosity and/or density evo-lution. While these models can explain each of the10-band counts for 10<
∼ AB<∼ 30 mag individually, no
single one of the simple PLE+NDE models can ex-plain the counts over this entire flux range in all 10filters simultaneously. Any more sophisticated mod-els of galaxy assembly, including hierarchical merg-ing and/or downsizing with or without feedback,need to at least reproduce the overall constraintsprovided by the current panchromatic galaxy countsfor 10<
∼ AB<∼ 30 mag over a factor of 10 in wave-
length.These surveys also emphasize the need for extend-
ing this work to levels fainter than AB>∼ 30 mag and
at longer wavelengths, which the James Webb SpaceTelescope will do for wavelengths in the range 0.6–28 µm after its launch in 2015. The unique abilitiesof WFC3 to do deep UV imaging will need to beexplored fully before that time.
6) We show examples of interesting panchromaticfaint galaxy structure in intermediate redshift ob-jects, including early-type galaxies with nuclearstar-forming rings and bars, and/or weak AGN ac-tivity, and some objects of other unusual appear-ance.
The panchromatic ERS database is very rich instructural information at all rest-frame wavelengthswhere young or older stars shine during the peakepoch in the cosmic star-formation rate (z'1–2),and constitutes a unique new HST data base forthe community to explore in the future.
This paper is based on Early Release Science ob-servations made by the WFC3 Scientific OversightCommittee. We are grateful to the Director ofthe Space Telescope Science Institute, Dr. MattMountain, for generously awarding Director’s Dis-cretionary time for this program. We thank Drs.Neill Reid, Ken Sembach, Ms. Tricia Royle, andthe STScI OPUS staff for making it possible tohave the ERS data optimally scheduled. We alsothank WFC3 IPT and the GSFC WFC3 Projectfor their very hard dedicated work since 1998 tomake this wonderful instrument work, and for theirtimely delivery of the essential hardware and soft-ware to make the acquisition and reduction of thenew WFC3 data possible. We also thank the entire

21
GOODS team, and in particular Drs. Norman Gro-gin and Mauro Giavalisco for making the exquisiteGOODS v2.0 mosaics available. We thank Drs.Norman Grogin and Paul Schmidtke for helpful dis-cussions. We thank the referee for very thoughtfulsuggestions, which helped improve the presentationof this paper, and for prompting a more detailedstudy of the ERS stellar proper motions and col-ors, which we believe illustrates the multi-facetedpromise of the ERS data.
Support for HST program 11359 was providedby NASA through grant GO-11359 from the SpaceTelescope Science Institute, which is operated bythe Association of Universities for Research in As-tronomy, Inc., under NASA contract NAS 5-26555.
RAW also acknowledges support from NASA JWSTInterdisciplinary Scientist grant NAG5-12460 fromGSFC. HY is supported by the long-term fellowshipprogram of the Center for Cosmology and AstroPar-ticle Physics (CCAPP) at The Ohio State Univer-sity.
We thank the STS-125 astronauts for risking theirlives during the Shuttle Servicing Missions SM4 toHubble, and for successfully installing WFC3 intoHST in May 2009. We dedicate this paper to thememory of the STS-107 Columbia Shuttle astro-nauts and of Dr. Rodger Doxsey, who during theirlives contributed so much to the Space Shuttle andthe Hubble Space Telescope projects.
REFERENCES
Abraham, R. G., Tanvir, N. R., Santiago, B. X., Ellis, R. S.,Glazebrook, K., & van den Bergh, S. 1996, MNRAS, 279,L47
Abraham, R. G., Ellis, R. S., Fabian, A. C., Tanvir, N. R.,& Glazebrook, K. 1999, MNRAS, 303, 641
Abraham, R., et al. 2007, ApJ, 669, 184Afonso, J., Mobasher, B., Koekemoer, A., Norris, R. P., &
Cram, L. 2006, AJ, 131, 1216Anderson, J. 2002, in “The 2002 HST Calibration
Workshop”, p. 13 Eds S. Arribas, A. Koekemoer, & B.Whitmore (Baltimore: STScI)
Anderson, J. 2003, ASP Conf. Ser. 296, 125 (Eds. G. Piotto,G. Meylan, S. G. Djorgovski, & M. Riello)
Anderson, J. 2007, Instrument Science Report ACS 2007-08(Baltimore: STScI)
Baggett, S., Boucarut, R., Telfer, R., Kim Quijano, J., &Quijada, M. 2007, Instrument Science Report WFC3 2007-03
Baldry, I. K., et al. 2010, MNRAS, 404, 86Balestra, I., et al. 2010, A&A, 512, 12Battaglia, G., et al. 2005, MNRAS, 364, 433Beckwith, S. V., Stiavelli, M., Koekemoer, A. M., et al. 2006,
AJ, 132, 1729Bertin, E., & Arnouts, S. 1996, A&AS, 117, 393Blandford, R. D., et al. 2010, in “New Worlds, New Horizons
in Astronomy and Astrophysics, Committee for a DecadalSurvey of Astronomy and Astrophysics” National ResearchCouncil, (Washington DC: the National Academies Press;http://www.nap.edu/catalog/12951.html )
Bond, H. E., & Kim Quijano, J., et al. 2007, “Wide FieldCamera 3 Instrument Handbook, Version 1.0” (Baltimore:STScI)
Bouwens, R. J., et al. 2010a, ApJ, 708, L69Bouwens, R. J., et al. 2010b, ApJ, 709, L133Bruzual, G., & Charlot, S. 2003, MNRAS, 344, 1000Burgarella, D., et al. 2006, A&A, 450, 69Chandar, R., et al. 2010, ApJ, 719, 966Clarkson, W., Sahu, K., Anderson, J., et al. 2008, ApJ, 684,
1110Cohen, S. H., Windhorst, R. A., Odewahn, S. C., Chiarenza,
C. A. T., & Driver, S. P. 2003, AJ, 125, 1762Cohen, S. H., et al. 2006, ApJ, 639, 731Cohen, S. H., et al. 2011, BAAS, 217 (Abstract 335.18)Comastri, A., et al. 2011, ApJ, in preparationConselice, C. J. Bershady, M. A., Dickinson, M., & Papovich,
C. 2003, AJ, 126, 1183Croton, D. J., et al. 2006, MNRAS, 365, 11de Lucia, G., & Blaizot, J. 2007, MNRAS, 375, 2de Lucia, G., Springel, V., White, S. D. M., Croton, D., &
Kauffmann, G. 2006, MNRAS, 366, 499di Matteo, T., Springel, V., & Hernquist, L. 2005, Nature,
433, 604Dickinson, M., Papovich, C., Ferguson, H. C., & Budavari,
T. 2003, ApJ, 587, 25Dickinson, M., et al. 2004, ApJ, 600, L99Driver, S. P., Windhorst, R. A., Ostrander, E. J., Keel, W.
C., Griffiths, R. E., & Ratnatunga, K. U. 1995, ApJL, 449,L23
Driver, S. P., Couch, W. J., Phillipps, S., & Windhorst, R.A. 1996, ApJL, 466, 5
Driver, S. P., Fernandez-Soto, A., Couch, W. J., Odewahn, S.C., Windhorst, R. A., Phillipps, S., Lanzetta, K., & Yahil,A. 1998, ApJL, 496, L93
Driver, S. P., et al. 2009, Astron. & Geophys. 50, 5.12Ferreras, I., et al. 2009, ApJ, 706, 158Finkelstein, S., et al. 2010, ApJ, resubmitted (astro-
ph/1008.0634)Gardner, J. P., Brown, T. M., Ferguson, H. C. 2000, ApJL,
542, L79Gardner, J. P., Mather, J. C., Clampin, M., et al. 2006, Space
Sc. Rev., 123, 485Giacconi, R., et al. 2002, ApJS, 139, 369Giavalisco, M., Ferguson, H. C., Koekemoer, A. M.,
Dickinson, M., et al. 2004, ApJ, 600, L93Glazebrook, K., Ellis, R., Santiago, B., & Griffiths, R. 1995,
MNRAS, 275, L19Grazian, A., Menci, N., Giallongo, E., et al. 2009, A& A, 505,
1041Grogin, N., et al. 2009, GOODS v2.0 mosaics, priv. comm.
(see also this URL30
Gruppioni, C., et al. 2010, A&A, 518, L27Haardt, F., Madau, P. 1996, ApJ, 461, 20Harris, H. C., Munn, J. A., Kilic, M., et al. 2006, AJ, 131,
571Hartig, G. F. 2009a, Instrument Science Report WFC3-2009-
37 (Baltimore: STScI)Hartig, G. F. 2009b, Instrument Science Report WFC3-2009-
38 (Baltimore: STScI)Hathi, N. P., et al. 2008, AJ, 135, 156Hathi, N. P., et al. 2010, ApJ, 720, 1708 (arXiv:1004.5141v2)Hill, D. T., Driver S. P., Cameron E., Cross N. J. G., Liske
J., & Robotham, A. 2010a, MNRAS, 404, 1215Hill, D. T., et al. 2010b, MNRAS, in press, doi:
10.1111/j.1365-2966.2010.17950Hopkins, A. M. 2004, ApJ, 615, 209Hopkins A. M., & Beacom, J. F. 2006, ApJ, 651, 142Hopkins, P. F., Hernquist, L., Cox, T. J., Di Matteo, T.,
Robertson, B., & Springel, V. 2006, ApJS, 163, 1Hopkins, P. F., et al. 2010, ApJ, 715, 202Kalirai, J. S., et al. 2009a, Instrument Science Report WFC3
2009-31Kalirai, J. S., et al. 2009b, Instrument Science Report WFC3
2009-30Kellermann, K. I., Fomalont, E. B., Mainieri, V., Padovani,
P., Rosati, P., Shaver, P., Tozzi, P., & Miller, N. 2008,ApJS, 179, 71
Khochfar, S., Silk, J., Windhorst, R. A., & Ryan, R., Jr. 2007,ApJL, 668, L115
Kimble, R. A., MacKenty, J. W., O’Connell, R. W.,Townsend, J. A., & the WFC3 Team 2010, BAAS, 215,46.312
Kinman, T. D., Cacciari, C., Bragaglia, A., Buzzoni, A., &Spagna, A. 2007, MNRAS, 375, 1381
Kitzbichler, M. G., & White, S. D. M. 2007, MNRAS, 376, 2Klypin, A., Zhao, H., & Somerville, R. S. 2002, ApJ, 573, 597
30 http://archive.stsci.edu/pub/hlsp/goods/v2/h goods v2.0 rdm.html

22
Koekemoer, A. M., Fruchter, A. S., Hook, R. N., & Hack, W.2002, in “The HST Calibration Workshop: Hubble afterthe Installation of the ACS and the NICMOS CoolingSystem”, p. 337, Eds. S. Arribas, A. Koekemoer, & B.Whitmore. (Baltimore: STScI)
Komatsu, E., et al. 2010, arXiv, 1001.4538Kron, R. G. 1980, ApJS, 43, 305Labbe, I., et al. 2003, AJ, 125, 1107Law, D. R., et al. 2007, ApJ, 656, 1Law, D. R., et al. 2009, ApJ, 697, 2057Lilly, S., J., et al. 1998, ApJ, 500, 75Luo, B., et al. 2010, ApJS, 187, 560Luo, B., et al. 2011, ApJS, in preparationLutz, D., et al. 2010, A&A, in preparationMadau, P., Pozzetti, L., & Dickinson, M. 1998, ApJ, 498, 106Majewski, S. R. 1992, ApJS, 78, 87Malhotra, S., et al. 2005, ApJ, 626, 666Maybhate, A., et al. 2010, “ACS Instrument Handbook”,
Version 9.0 (Baltimore: STScI)Melbourne, J., et al. 2005, ApJ 625, L27Metcalfe, N., Shanks, T., Campos, A., McCracken, H. J.,
Fong, R. 2001, MNRAS, 323, 795Monaco, P., Fontanot, F., & Taffoni, G., 2007, MNRAS, 1189Nagamine, K., Cen, R., Hernquist, L., Ostriker, J. P., &
Springel, V. 2005a, ApJ, 627, 608Nagamine, K., Cen, R., & Hernquist, L. 2005b, ApJ, 618, 23Nagamine, K., 2006, ApJ, 653, 881Nonino, M., Dickinson, M., Rosati, P., et al. 2009, ApJS, 183,
244 (0906.4250v1)Oke, J. B. 1974, ApJS, 27, 21Oesch, P. A., et al. 2010a, ApJ, 709, L16Oesch, P. A., et al. 2010b, ApJ, 725, L150Papovich, C., Dickinson, M., Giavalisco, M., Conselice, C. J.,
& Ferguson, H. C. 2005, ApJ, 631, 101Peng, Y., et al. 2010, arXiv1003.4747PPetrosian, V. 1976, ApJ, 209, L1Pickles, A. J. 1998, PASP, 110, 863Pirzkal, N., et al. 2004, ApJS, 154, 501Pirzkal, N., et al. 2005, ApJ, 622, 319Pirzkal, N., et al. 2009, ApJ, 695, 1591Popesso, P., et al. 2009, A&A, 494, 443Retzlaff, J., et al. 2010, 511, 50Rhoads, J. E., et al. 2009, ApJ, 697, 942Robertson, B. E. 2010, ApJ, 713, 1266Robotham, A., et al. 2010, PASA, 27, 76Robotham, A., & Driver, S. P. 2010, MNRAS, submittedRutkowski, M. J., et al. 2010, ApJ, submittedRyan, R. E., Jr., Hathi, N. P., Cohen, S. H., & Windhorst,
R. A. 2005, ApJL, 631, L159Ryan, R. E., Jr., et al. 2007, ApJ, 668, 839
Ryan, R. E. Jr., Cohen, S. H., Windhorst, R. A., & Silk, J.2008, ApJ, 678, 751
Ryan, R. E., Jr., et al. 2010, ApJ, resubmitted (astro-ph/1007.1460)
Scannapieco, E., Silk, J., & Bouwens, R. 2005, ApJL, 635,L13
Somerville, R. S., et al. 2004, ApJL, 600, L171Steinbring, E., et al. 2004, ApJS 155, 15Straughn, A. N., et al. 2008, AJ, 135, 1624Straughn, A. N., et al. 2009, AJ, 138, 1022Straughn, A. N., et al. 2011, AJ, 141, 14 (8pp)
(arXiv:1005.3071S)van Dokkum, P. G., & Brammer, G. 2010, ApJ, 718, L73Vanzella, E., et al. 2005, A&A, 434, 53Vanzella, E., et al. 2009, ApJ, 695, 1163Windhorst, R. A., van Heerde, G. M., & Katgert, P. 1984a,
A&AS, 58, 1Windhorst, R. A., Kron, R. G., & Koo, D. C. 1984b, A&AS,
58, 39Windhorst, R. A., et al. 1991, ApJ, 380, 362Windhorst, R. A., et al. 2002, ApJS, 143, 113Windhorst, R. A., Cohen, S. H., Jansen, R. A., Conselice, C.,
& Yan, H. 2006, NewAR, 50, 113Windhorst, R. A., Hathi, N. P., Cohen, S. H., Jansen, R.
A. Kawata, D., Driver, S. P., & Gibson, B. 2008, J. Adv.Space Res., 41, 1965
Wong, M. H., Pavlovsky, C., & Long, K., et al. 2010,Wide Field Camera 3 Instrument Handbook, Version 2.0(Baltimore, STScI)
Wyithe, J. S. B., Yan, H., Windhorst, R. A., & Mao, S.2011, Nature, Vol. 469, Issue 7330, pg. 1–4, in press (astro-ph/1101.xxxx)
Xu, K., et al. 2005, ApJ, 619, L11
Yan, H., & Windhorst, R. A. 2004, ApJL, 612, L93Yan, H., Dickinson, M., Eisenhardt, P. R. M., Ferguson, H.
C., Grogin, N. A. 2004, ApJ, 616, 63Yan, H., Dickinson, M., Stern, D., Eisenhardt, P. R. M., et al.
2005, ApJ, 634, 109Yan, H., Windhorst, R. A., Hathi, N. P., Cohen, S. H., Ryan,
R. E., O’Connell, R. W., & McCarthy, P. J. 2010, ApJ,Res. in Astr. & Astrop., 10, 867 (astro-ph/0910.0077)
Yan, H., Yan, L., Zamojski, M. A., Windhorst, R. A.,McCarthy, P. J., Fan, X., Rottgering, H. J. A., Koekemoer,A. M., Robertson, B. E., Dave, R., & Cai, Z. 2011, ApJL,in press (arXiv1010.2261)
Yan, H., et al. 2010, ApJ, submitted

23
APPENDIX A. The Wavelength-Dependent UVIS Geometric Distortion Correction
Given the issues related to the GDC discussed in §4.2.2, it was apparent that some astrometric residualsremained — at the level of <
∼ 2–3 Multidrizzled pixels — that were a function of position across both UVISdetectors, after the shifts and rotations had been removed. A worst case is shown in the lower panel ofFig. 4a. These residuals were apparent between the three UVIS filters, as well as relative to the GOODSastrometric frame. At the time of the data reduction, the best available Instrument Distortion Coefficients(IDCtab’s; file t982101i uv idc.fits) — which are used for the GDC — had been created using the WFC3SMOV F606W data alone (see this URL31). This GDC did not yet include any wavelength-dependentdistortion terms, though these will be measured during Cycle 18 or beyond (see this URL32), and distributedto the community by the WFC3 instrument team. Since our WFC3/UVIS data is all taken at wavelengthsbelow 3500 A, it is likely that the remaining astrometric residuals are indicative of the absence of thesecolor-dependent terms in the currently existing GDC tables. The wavelength-dependent terms of the GDCcome from the different index of refraction of the glass optics and filters in the UVIS channel of WFC3.This is in addition to the first–third order geometric distortion coefficients, which results from the CCD tilt(which was necessary to minimize internal reflections), and from other reflective optics, and are thereforelargely wavelength-independent.
The ultimate goal of the UVIS part of the WFC3/ERS is to create images in F225W, F275W, and F336Wfilters at the same pixel scale (0′′.030 per pixel) and astrometric grid as the GOODS ACS images (Giavaliscoet al. 2004) of the same portion of the GOODS-South field. As discussed in §2, the eight ERS UVIS pointingswere designed to overlap with each other, in order to achieve the best possible astrometric precision. Afterthe extensive astrometric work described above, it turned out that we had reached the limit of what waspossible with the present wavelength-independent geometric distortion solution. We were able to align allUVIS images such that the average object was well aligned with the GOODS B-band image. However,objects near the individual UVIS field edges were not well aligned (lower panel of Fig. 4a). Fig. B.1 of theWFC3 Instrument Handbook (Wong et al. 2010) also suggests that in these locations the geometric distortionis the largest. This was most noticeable on the few stars in the overlap regions between pointings, as Fig.4a demonstrated.
Some of these stars also showed significant proper motion between the original 2004–2007 GOODS ob-servations and the 2009 ERS observations, complicating their use as astrometric fiducials (see §4.3.2 and6). This is quite visible as significant color offsets in some of the ERS bright star images in the very highresolution versions of Fig. 5a–5b and Fig. 6c, which are available on the URL quoted in the figure caption.In attempting to create a 0′′.030 per pixel UVIS mosaic, the stars in the overlap regions of the 8 UVISpointings were somewhat elongated (Fig. 4a), even though the exposures from the same UVIS orbit werewell aligned — i.e., having round stars and astrometric residuals to a fraction of a pixel — and even thougheach pointing was well matched to the GOODS frame. In other words, even after correcting the WCS in theFITS headers for both the relative and the absolute position deviations, there still remained some astrometricresiduals primarily at the field edges, that we suspect are likely due to the uncertain wavelength dependenceof the GDC (Fig. 4b).
Fig. 4b shows the astrometric residuals for four of our ERS pointings in the F336W filter (visits 25, 26,29, 30). Each frame within a visit was registered using the MultiDrizzle scripts of Koekemoer et al. (2002),which CR-cleaned and cross-correlated the images, to revise the flat-fielded (“FLT”) image WCS headerkeywords, as described in §4.2.1. These images were then drizzled with PIXFRAC=1.0 to a scale of 0′′.030per pixel and to a position angle of 0 degrees (final rot=0). The PA(V3) was 111 degrees. Catalogs were thencreated with SExtractor (Bertin & Arnouts 1996), which were in turn matched in equatorial coordinates toa similar catalog made from the GOODS-South B-band image (GOODS v2.0; Giavalisco et al. 2004; Grogin2009, priv. comm.). Note that all four visits in Fig. 4b show similar bimodal residuals, suggesting thatthis is a systematic error. We suspect that this is due to the wavelength-dependent geometric distortion inthe UV, since the only distortion solution available at the time of the data processing was measured in theF606W filter. Since two distinct blobs of points occur in similar locations in all four panels of Fig. 4b,the MultiDrizzle images of objects seen in only one pointing — which includes 80–90% of the total ERSarea (see Fig. 3 and 8a) — are round at 0′′.090 pixel sampling. However, the images of the brighter objectsin the overlap areas between mosaic pointings — 10–20% of the total area — are not always completelyround, as shown in Fig. 4a. (Visual inspection of the F225W and F275W mosaics showed similar trends forbright stars as seen for F336W in Fig. 4a–4b — confirming our conjecture that this is due to the geometricdistortion correction only having been calibrated in the F606W filter. However, these trends are seen atlower S/N ratio than in F336W — since faint stars are red, see §4.3.2 and figures therein — and so Fig.4a–4b are not reproduced here for F225W and F275W.)
31 http://www.stsci.edu/hst/wfc3/idctab lbn32 http://www.stsci.edu/hst/wfc3/STAN 09 2009

24
When Multi-drizzling the four exposures of each pointing, each individual object is well aligned with itself.However, in the WFC3 field corners, an object can be offset from the GOODS WCS by ±0′′.1–0′′.2 (Fig.4a–4b). In the area of field overlap, an object in the ERS image corners or at a visit’s field edges can thus bemisaligned with itself by ∼0′′.1–0′′.2, and so be elongated (see Fig. 4a), but still be on average on top of theGOODS v2.0 WCS. In other words, with the current wavelength-independent GDC and MultiDrizzle, wecannot have it both ways for a given object in the image borders of the ERS mosaic, until the wavelength-dependent GDC has been fully measured in the UV, and a sufficient larger number of dither-points is availableto take full advantage of the full 0′′.0.0395 pixel sampling of the WFC3 UVIS images. This is at the momentnot the case. Therefore, in this paper we use the total-flux measurements from the UVIS images that wereMultidrizzled at 0′′.090/pixel, and use large enough apertures that the total flux measurements are reliable.
For the WFC3 IR Channel, the GDC has only been measured in the F160W filter (see this URL33), andso the GDC in the other two ERS IR filters F098M and F125W is correspondingly more uncertain. However,because the WFC3 IR Channel GDC is much smaller to begin with (see Wong et al. 2010) — due to theIR Channel design — and because of the larger IR channel pixels, the wavelength dependence of the IRChannel GDC is much less of an issue than for the WFC3 UVIS channel. As for the WFC3 UVIS channel,the wavelength dependence of the IR Channel GDC will be measured in more detail in Cycle 17 and beyond,and will be applied to a future version of the ERS data release and discussed in subsequent ERS papers.
APPENDIX B. Other Applications of the ERS Data:
B.1. Interesting Classes of Objects in the Panchromatic ERS mosaics
Fig. 13 shows several panchromatic postage stamps of lower redshift early-type galaxies in the ERS withnuclear star-forming rings, bars, or other interesting nuclear structure. Each postage stamp is displayedat a slightly different color stretch, that best brings out the UV nuclear structure. Rutkowski et al. (2011)present examples of ellipticals at z'0.3–1.5 with various amounts of UV-excess flux. These galaxies are redand relatively featureless in the optical, but show considerable emission in the UV, which is not all point-like.Hathi et al. (2010) and Ryan et al. (2010) present ERS samples of faint UV-dropouts and very high redshiftred galaxies, respectively. Many more such studies can be done with the ERS data.
Fig. 14 shows panchromatic postage stamps of objects with interesting morphological structure in the 10-band ERS color images of the GOODS-South field, yielding high signal-to-noise ratio detections of galaxiesresembling the main cosmological parameters H0 , Ω, ρo, w, and Λ, respectively. The panchromatic galaxymorphology and structure in the ERS images is so rich that a patient investigator can find galaxies of nearlyany appearance in the epoch z'1–3. This is because galaxy merging was in full swing in this epoch.
B.2. Examples of Uses and Future Potential of WFC3 IR Grism Data
Fig. 15a–15d displays the WFC3 G102 and G141 grism images of the same region in the GOODS-South field(green box in Fig. 3), together with short finder exposures in the WFC3 grism continuum filters F098M andF140W. For a detailed discussion of the ACS G800L and WFC ERS G102 and G141 grism spectra, pleasesee Straughn et al. (2009, 2011). All brighter object WFC3 grism spectra in Fig. 15a–15d show a 0th orderimage to their left, displaced by about twice the spectral image length, which should not be confused withreal emission lines. When one zooms in on the full-resolution version of this image (see the caption of Fig.15a–15d), many faint object spectra are visible to a continuum flux as faint as AB∼25–25.5 mag in two HSTorbits, including many faint emission line galaxies.
Fig. 15e–15f show examples of some specific WFC3 G102 and G141 spectra for emission line galaxies in theERS at z=0.738 and z=0.610. For the emission line galaxy at z=0.610, the available lower-resolution ACSG800L grism spectrum is also shown in green. For further details, see Straughn et al. (2011). Fig. 15f showsthat WFC3 near-IR grisms G102 and G141 have a spectral resolution of R'210 and R'130, respectively,while the ACS G800L has a lower resolution of R'100. It is clear from Fig. 15f that R>
∼ 200 is far superiorfor faint emission-line (and by implication also for weak absorption feature) detection than an R∼100 grism.This should be a critical consideration for the design of the JDEM/WFIRST missions that are now beingplanned (Blandford et al. 2010) to carry out wide-field near-infrared imaging and grism spectroscopy fromspace for this coming decade.
In conclusion, the WFC3 broad-band IR filters and its G102 and G141 grisms provide low-resolutionimaging and faint object spectroscopy over the entire 0.80–1.70 µm-range, unimpeded by the ground-basedOH-forest. They have shown the tremendous power of the WFC3 IR grism data above the Earth’s atmo-sphere, which are now used by a number of different WFC3 GO programs in HST Cycle 17 and beyond.They also illustrate the discovery power of the new frontier that will be opened up by the near–mid infrared6.5 meter James Webb Space Telescope (JWST) after its launch in 2015 (Gardner et al. 2006, Windhorstet al. 2006), and by future wide-field near-infrared space missions such as JDEM/WFIRST and Euclid.
33 http://www.stsci.edu/hst/wfc3/STAN 09 2009

25
Table 1. Filters, Exposure Times, & Depths of the WFC3 ERS & GOODS-South ACSdata.
============================================================================Channel Filter1 Filter2 Filter3 Filter4 GRISM GRISM TOTAL ORBITS----------------------------------------------------------------------------
WFC3/UVIS F225W F275W F336W --Orbits 2 2 1 -- 5x8 = 40 DirectDepth (AB) 26.3 26.4 26.1 --nJy 110 100 132 --
ACS/WFC F435W F606W F775W F850LP G800LOrbits 3 3 4 9 80 15x19=285 DirectDepth (AB) 27.9 28.1 27.5 27.3 27.0 2x20= 40 GrismnJy 14 14 27 44 58
WFC3/IR F098M F125W F160W G102 G141Orbits 2 2 2 2 2 6x10= 60 DirectDepth (AB) 27.2 27.55 27.25 25.2 25.5 1x 4= 4 GrismnJy 48 36 48 303 230
----------------------------------------------------------------------------TOTAL WFC3 ERS ORBITS (Aug. 2009--Oct. 2009) 104TOTAL ACS GOODS ORBITS inside ERS (Jul. 2002--Mar. 2005) 325TOTAL HST ORBITS (Jul. 2002--Oct. 2009) 429----------------------------------------------------------------------------
Notes to Table 1:
Note 1: The orbital integration times listed are those as achieved for the WFC3 UVIS and IR ERS obser-vations, as well as for the GOODS ACS v2.0 observations. For the ACS grism, 40 out of 200 orbits ACSG800L observations from the HST Cycle 14 PEARS project 10530 (PI: S. Malhotra; Malhotra et al. 2005;Pirzkal et al. 2004, 2005, 2009; Straughn et al. 2008, 2009) that reside inside the ERS mosaic are listed (seeFig. 3).
Note 2: The listed depth is the 50% completeness limit for 5-σ detections in total SExtractor AB-magnitudesfor typical compact objects at this flux level (circular aperture with 0′′.4 radius; 0.50 arcsec2 aperture), asderived from Fig. 9.
Note 3: For spectral continuum detection in the G102 and G141 grisms, these flux limits are about 2.0–1.8mag brighter, respectively.
Note 4: We note that the pre-flight WFC3 ETC sensitivity values were 0.15–0.2 mag more conservative inboth the UVIS and the IR than the in-flight values quoted here in Table 1, as also shown in Fig. 2.
Note 5: Due to the limited observing time available, and its poorer prism performance, UV-prism observationsin P280 were not taken as part of the ERS.

26
Table 2. ERS Filters, PSFs, Zero-points, Sky-background, and Effective Area
==============================================================================HST- ERS Central Filter PSF Zeropoint Sky-back EffectiveInstrument Filter Lambda FWHM FWHM (AB-mag@ ground Area/Mode (mum) (mum) (") 1e-/sec) mag/(")^2 (arcm^2)------------------------------------------------------------------------------
WFC3/UVIS F225W 0.2341 0.0547 0.092 24.06 25.46 53.2WFC3/UVIS F275W 0.2715 0.0481 0.087 24.14 25.64 55.3WFC3/UVIS F336W 0.3361 0.0554 0.080 24.64 24.82 51.6ACS/WFC F435W 0.4297 0.1038 0.080 25.673 23.66 72.4ACS/WFC F606W 0.5907 0.2342 0.074 26.486 22.86 79.2ACS/WFC F775W 0.7764 0.1528 0.077 25.654 22.64 79.3ACS/WFC F850LP 0.9445 0.1229 0.088 24.862 22.58 80.3WFC3/IR F098M 0.9829 0.1695 0.129 25.68 22.61 44.8WFC3/IR F125W 1.2459 0.3015 0.136 26.25 22.53 44.7WFC3/IR F160W 1.5405 0.2879 0.150 25.96 22.30 44.7
------------------------------------------------------------------------------
Notes to Table 2:
Note 1: The panchromatic PSF FWHM was measured from ERS stars as in Fig. 7a–7b, and includes thecontribution from the OTA and its wavefront errors, the specific instrument pixel sampling or ModulationTransfer Function (MTF).
Note 2: The WFC3 zero-points are in AB magnitudes for 1.0 e− /sec from this URL34.
Note 3: The GOODS BViz sky-background values are from Hathi et al. (2008).
Note 4: The effective areas used in this paper are in units of arcminutes squared for the effective number ofWFC3 or ACS tiles available and used.
Note 5: The GOODS v2.0 BViz data release is from this URL35.
Note 6: The panchromatic effective ERS area was derived from Fig. 8a–8c for the WFC3 mosaics and therelevant GOODS tiles, and indicates the total area over which at least half of the total ERS exposure timewas available. (Fig. 8 shows that >
∼ 80% of the total ERS exposure time was available for 50 square arcminin the WFC3 UVIS filters, and for 40 square arcmin in the WFC3 IR filters).
34 http://www.stsci.edu/hst/wfc3/phot zp lbn35 http://archive.stsci.edu/pub/hlsp/goods/v2/h goods v2.0 rdm.html

27
Fig. 1a. (Top panel) The full panchromatic HST/WFC3 and ACS filter set used in the ERS imaging ofthe GOODS-South field. Plotted is the overall system throughput, or the HST Optical Telescope Assemblythroughput OTA × filter transmission T × detector QE. (Middle and bottom panels) Spectral energydistributions for two single burst model galaxies with ages of 0.1 and 1 Gyr and redshifts of z=0, 2, 4,6, 8, are shown as black, blue, green, yellow, and red curves, respectively. IGM absorption shortward ofLyman-α was applied following Haardt & Madau (1996). The UVIS filters sample the Lyman-α forest andLyman continuum breaks, while the near-IR filters probe the 4000 A and Balmer breaks at these redshifts.Additional photometry is available from ground-based VLT K-band imaging, and Spitzer/IRAC imaging at3.5, 4.5, 5.6 and 8.5 micron.

28
Fig. 1b. Mass sensitivity of the WFC3 ERS filters used. The three panels show the depth of the WFC3 ERSimages as horizontal bars, compared to evolving galaxy models of different masses at three redshifts. Thetop panel is for z=1 and a stellar mass of 109 M . The solid lines represent nearly instantaneous bursts,and the dashed lines are for declining star-formation with a 1 Gyr e-folding time. The colors refer to ages of10, 100, 500, 1000, 1400, 2000, and 3000 Myrs from cyan to red. The middle panel shows similar models atz=1.5 for 4 × 10⁹ M , while the bottom panel is for z=2 and masses of 1010 M . At z=1, the WFC3 ERSreaches masses of 0.02 M∗ for typical star-formation histories. Both the flux scale and the wavelength scaleare logarithmic, illustrating WFC3’s exquisite panchromatic coverage and sensitivity in probing the stellarmasses of galaxies through its IR channel, and the star-formation in galaxies through its UVIS channel.

29
Fig. 2. Ratio of on-orbit count rate to that obtained in ground-based thermal vacuum tests for variousWFC3 filters in the UVIS (left panel) and IR (right panel), respectively. On-orbit rates are significantlyhigher than in ground tests. See text for details.
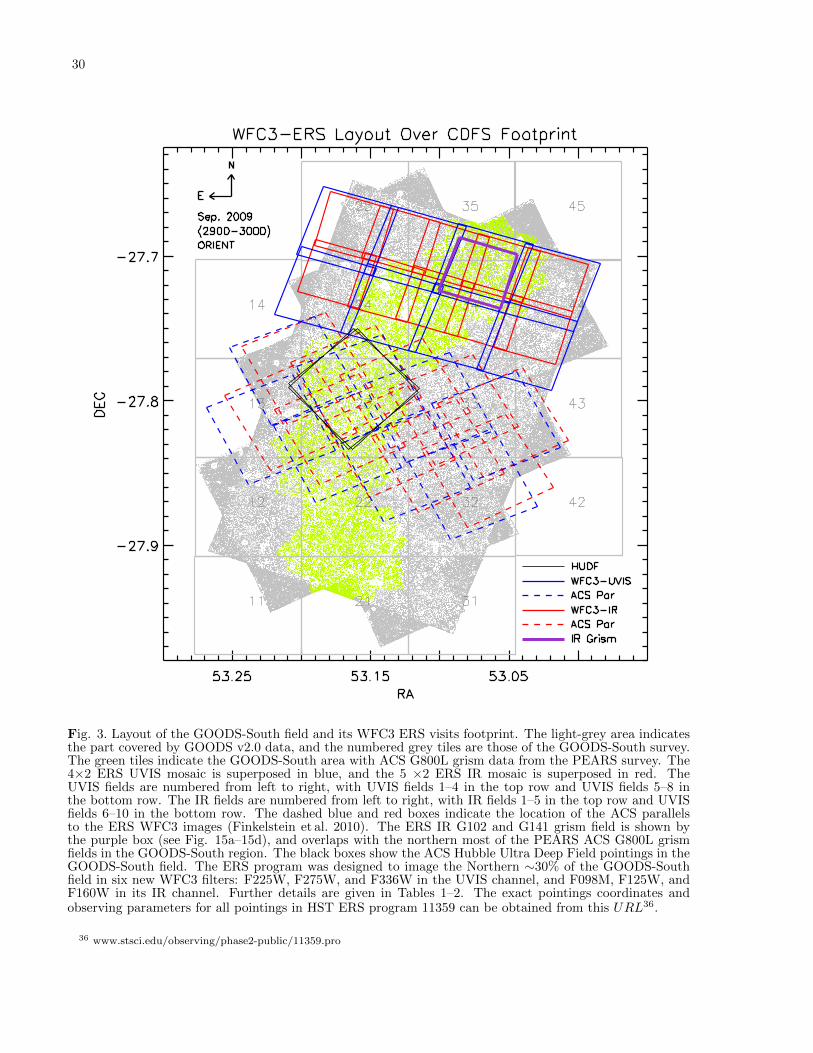
30
Fig. 3. Layout of the GOODS-South field and its WFC3 ERS visits footprint. The light-grey area indicatesthe part covered by GOODS v2.0 data, and the numbered grey tiles are those of the GOODS-South survey.The green tiles indicate the GOODS-South area with ACS G800L grism data from the PEARS survey. The4×2 ERS UVIS mosaic is superposed in blue, and the 5 ×2 ERS IR mosaic is superposed in red. TheUVIS fields are numbered from left to right, with UVIS fields 1–4 in the top row and UVIS fields 5–8 inthe bottom row. The IR fields are numbered from left to right, with IR fields 1–5 in the top row and UVISfields 6–10 in the bottom row. The dashed blue and red boxes indicate the location of the ACS parallelsto the ERS WFC3 images (Finkelstein et al. 2010). The ERS IR G102 and G141 grism field is shown bythe purple box (see Fig. 15a–15d), and overlaps with the northern most of the PEARS ACS G800L grismfields in the GOODS-South region. The black boxes show the ACS Hubble Ultra Deep Field pointings in theGOODS-South field. The ERS program was designed to image the Northern ∼30% of the GOODS-Southfield in six new WFC3 filters: F225W, F275W, and F336W in the UVIS channel, and F098M, F125W, andF160W in its IR channel. Further details are given in Tables 1–2. The exact pointings coordinates andobserving parameters for all pointings in HST ERS program 11359 can be obtained from this URL36.
36 www.stsci.edu/observing/phase2-public/11359.pro

31
F336W_combined
Offset=(0.061",0.302")
F336W_visit29 (Chip Top)
F336W_visit25 (Chip Bottom)
Fig. 4a. An ERS star imaged in the overlap region between UVIS visit 25 (upper panel) and visit 29 (middlepanel) in the F336W filter. While the star is properly processed by MultiDrizzle in these individual visits(i.e., its images are round in the upper and middle panels), it is clearly displaced by (0′′.061, 0′′.301) in itsWCS location between these two visits, as shown in the combined image (bottom panel). This is due tothe wavelength-dependent geometric distortion correction (GDC). The GDC causes this star — and otherobjects in the mosaic border regions — to be elongated by approximately this amount when a MultiDrizzleis done of all available pointings, as can be seen in the bottom panel. A full wavelength-dependent GDCwill make the images in the border regions round as well across the full MultiDrizzle mosaic. A propermeasurement and continued monitoring of the wavelength-dependent GDC is scheduled for Cycle 18 andbeyond.

32
Fig. 4b. The astrometric residuals for four of our ERS pointings in the F336W filter, defined as the differencesbetween visits 25, 26, 29, or 30 and the image mosaic that was Multidrizzled using these four visits. Notethat all four visits show similar bimodal residuals, suggesting that this is a systematic error. We suspect thatthis is due to the wavelength-dependent geometric distortion in the UV, since the only currently availabledistortion solution was measured in the F606W filter. Since two distinct groups of points occur in similarlocations in all four panels, the MultiDrizzle images of objects seen in only one pointing — which includes80–90% of the total ERS area (see Fig. 3 and 8a) — are round at 0′′.090 pixel sampling. However, the imagesof the brighter objects in the overlap areas between mosaic pointings — 10–20% of the total area — are notalways round, as can be seen in Fig. 4a. (We confirmed this by visual inspection of the F225W and F275Wmosaics, where this trend is seen at lower S/N ratio (see Appendix A), since faint stars are red (see §4.3.2).)

33
Fig. 4c. The measured residual astrometric offsets in (RA, DEC) for all 4614 ERS objects in our WFC3IR H-band object catalogs relative to our object catalogs based on the GOODS ACS/WFC v2.0 z’-bandimages. The 4511 ERS objects classified as galaxies are shown as small black dots, and the 103 ERSobjects classified as stellar are shown as red or green asterisks. Histograms normalized to unity are alsoshown in each coordinate: black histograms indicate ERS galaxies and red histograms ERS stellar objects.Best fit Gaussians are also shown for each of these histograms. Objects classified as ERS galaxies have anearly Gaussian error distribution centered around (∆RA, ∆DEC) = (0, 0), while objects classified as ERSstars have on average (red asterisks) — and in a significant number of individual cases (green asterisks) —significant evidence for proper motion at the >
∼ 3σ level. Further details are given in §4.3.2 & 5.6.

34
Fig. 5a. Panchromatic 10-band color image of the entire ERS mosaic in the GOODS-South field. [Thisimage is only displayed in the electronic version of this journal paper.] Shown are the common cross sectionsbetween the 4×2 ERS UVIS mosaics, the GOODS v2.0 ACS BViz, and the 5×2 ERS IR mosaics. The totalimage shown is 6500 × 3000 pixels, or 9′.75 × 4′.5. We used color weighting of the 10 ERS filters as describedin the text, and log(log) stretch. [For best display, please zoom in on the full-resolution version of this image,which is available on this URL 37]. Note that in these color images the reddest objects are not necessarilyat z>7, due to the way the colors were combined.
37 http://www.asu.edu/clas/hst/www/wfc3ers/ERS2 loglog.tif

35
Fig. 6a. Log(log) color reproduction of a bright but unsaturated star image in the 10-band ERS color imagesin the GOODS-South field, using the same color balance prescription as in Fig. 5a–5b. Fig. 6b. Same for a“double” star. These images give a qualitative impression of the significant dynamic range in both intensityand wavelength that is present in these panchromatic ERS images.

36
Fig. 6c Log(log) color reproduction of the 20 ERS stars with the highest (>∼ 3-σ) proper motion, as discussed
in §4.3.2 and Fig. 4c. Each image is 85×85 pixels or 7′′.65×7′′.65 on the side. The images used a similarcolor balance as in Fig. 5a–5b, except that only the 2009 WFC3 UVIS filters F225W, F275W, and F336are now in the Blue gun, all the 2003 ACS BViz filters F438W, F606W, F775W, and F850LP are in theGreen gun, and the 2009 WFC3 IR filters F098M, F125W, and F160W are in the Red gun. The RGB colorswere further adjusted such that the proper motion between the Green 2003 ACS colors and the Blue+Red(or violet) 2009 WFC3 colors were maximally contrasted. In many cases, the proper motion is visible as anoffset between the centroids of the Green and the Red+Blue images. For details, see text.
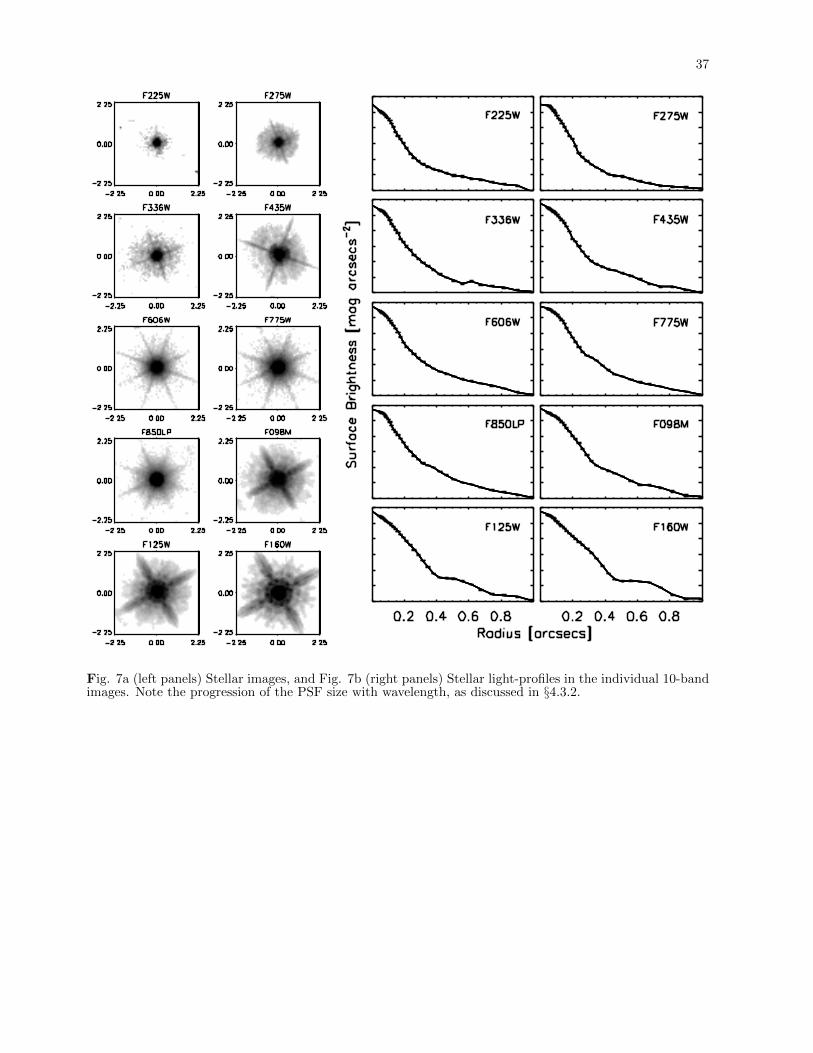
37
Fig. 7a (left panels) Stellar images, and Fig. 7b (right panels) Stellar light-profiles in the individual 10-bandimages. Note the progression of the PSF size with wavelength, as discussed in §4.3.2.
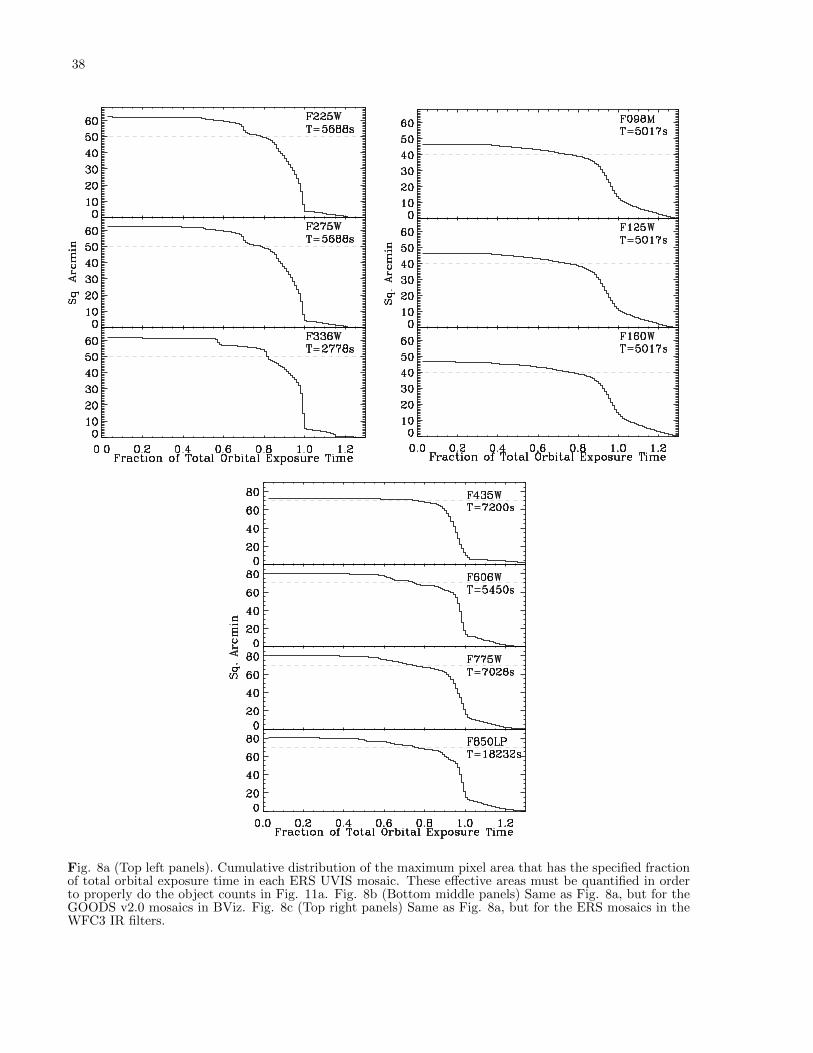
38
Fig. 8a (Top left panels). Cumulative distribution of the maximum pixel area that has the specified fractionof total orbital exposure time in each ERS UVIS mosaic. These effective areas must be quantified in orderto properly do the object counts in Fig. 11a. Fig. 8b (Bottom middle panels) Same as Fig. 8a, but for theGOODS v2.0 mosaics in BViz. Fig. 8c (Top right panels) Same as Fig. 8a, but for the ERS mosaics in theWFC3 IR filters.
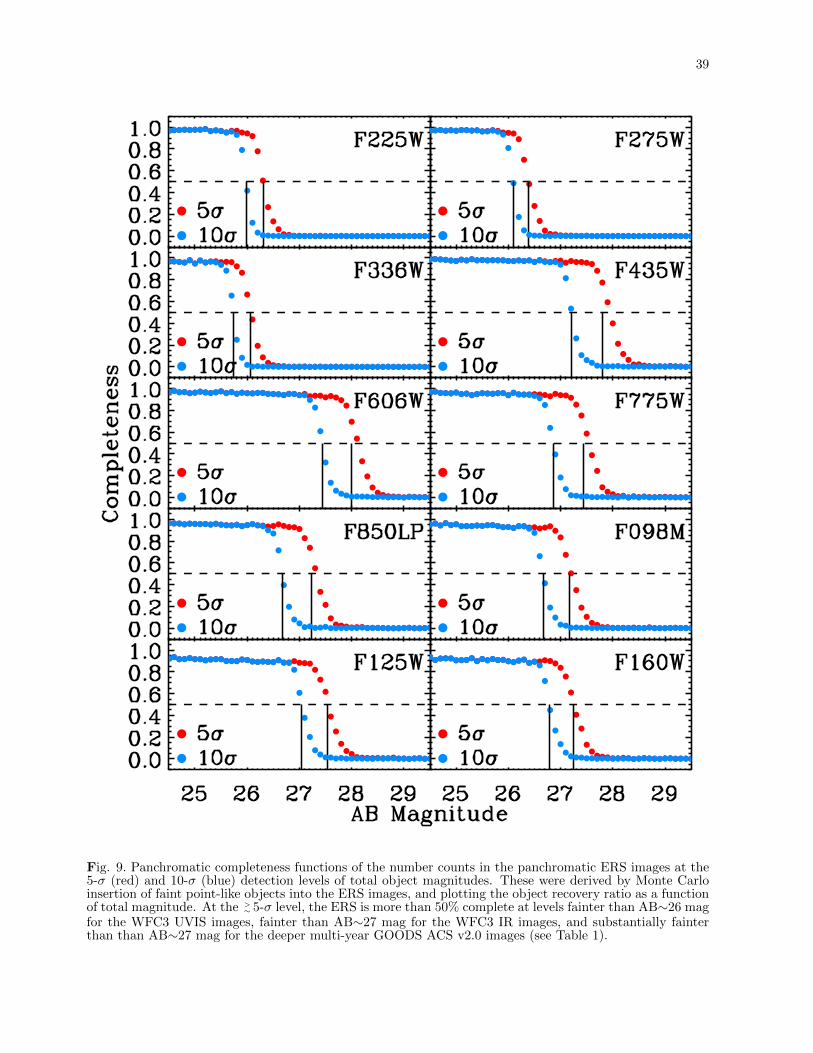
39
Fig. 9. Panchromatic completeness functions of the number counts in the panchromatic ERS images at the5-σ (red) and 10-σ (blue) detection levels of total object magnitudes. These were derived by Monte Carloinsertion of faint point-like objects into the ERS images, and plotting the object recovery ratio as a functionof total magnitude. At the >
∼ 5-σ level, the ERS is more than 50% complete at levels fainter than AB∼26 magfor the WFC3 UVIS images, fainter than AB∼27 mag for the WFC3 IR images, and substantially fainterthan than AB∼27 mag for the deeper multi-year GOODS ACS v2.0 images (see Table 1).
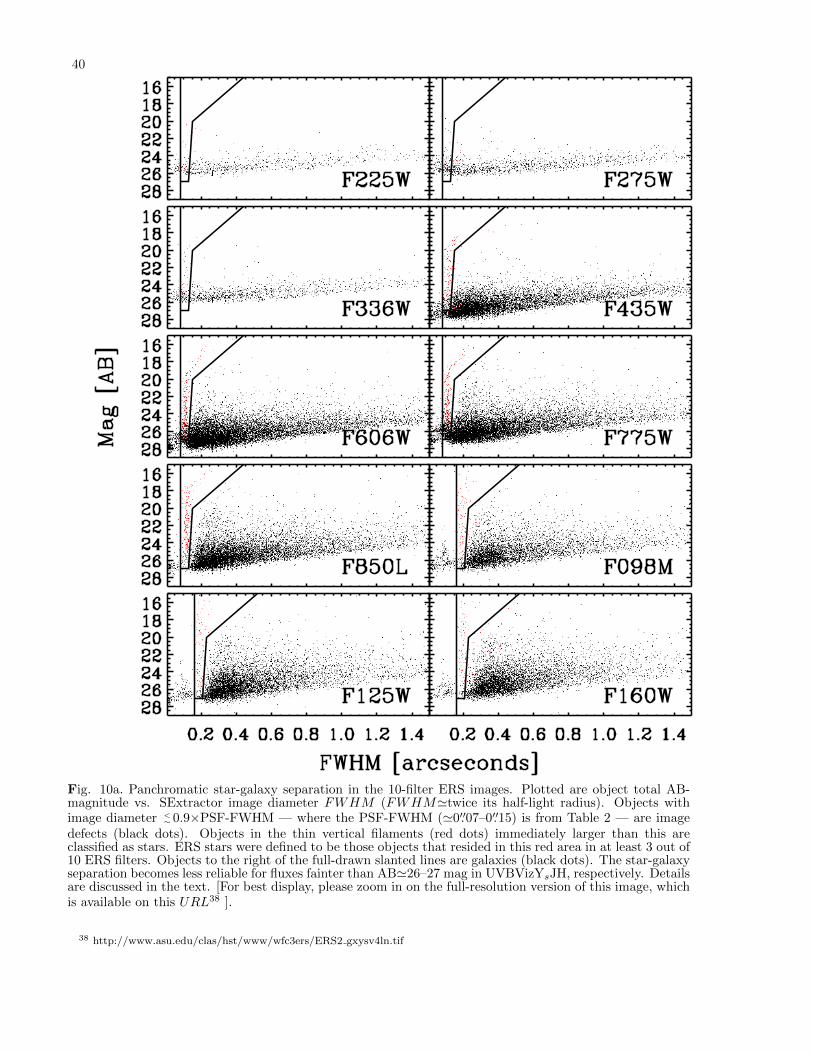
40
Fig. 10a. Panchromatic star-galaxy separation in the 10-filter ERS images. Plotted are object total AB-magnitude vs. SExtractor image diameter FWHM (FWHM'twice its half-light radius). Objects withimage diameter <
∼ 0.9×PSF-FWHM — where the PSF-FWHM ('0′′.07–0′′.15) is from Table 2 — are imagedefects (black dots). Objects in the thin vertical filaments (red dots) immediately larger than this areclassified as stars. ERS stars were defined to be those objects that resided in this red area in at least 3 out of10 ERS filters. Objects to the right of the full-drawn slanted lines are galaxies (black dots). The star-galaxyseparation becomes less reliable for fluxes fainter than AB'26–27 mag in UVBVizYsJH, respectively. Detailsare discussed in the text. [For best display, please zoom in on the full-resolution version of this image, whichis available on this URL38 ].
38 http://www.asu.edu/clas/hst/www/wfc3ers/ERS2 gxysv4ln.tif

41
Fig. 10b. The (i–z) vs. (B–V) color-color diagram in the GOODS BViz filters for all ERS galaxies (blackdots) and stars (red and green asterisks). These are compared to the Pickles (1998) model stellar SEDlibrary (blue squares), which range in spectral type from O5V–M7V, and also show the giant branch modelsup to type M7III. The observed ERS stellar colors are shown with their 1-σ error bars. Only stars withcombined color errors along each axis <
∼ 0.5 mag are plotted. Green asterisks mark ERS stars with propermotion established at the ≥2-σ level.

42
Fig. 11a. Differential panchromatic star counts (red asterisks) and differential panchromatic galaxy numbercounts in the ERS images (black dots), with the optimized star-galaxy separation from Fig. 10a. All 10 ERSfilters are shown in units of object numbers per 0.5 mag per deg2, but in the three bluest filters (F225W,F275W, and F336W) some of the brightest bins were doubled to 1.0 mag in width to improve statistics. Thesolid black line in the F850LP panel are the spectroscopic star counts from the HST PEARS ACS grismsurveys of Pirzkal et al. (2009), which are in good agreement with our F850LP star counts.

43
Fig. 11b. (Left panel) ERS Star count slope (filled circles) versus observed wavelength in the flux rangesAB'19–25.5 mag for the 3 UV WFC3 filters, AB'16–26 mag for the GOODS/ACS BViz filters, and AB'15–25 mag for the 3 WFC3 IR filters, respectively. The faint-end of the Galactic star count slope is remarkablyflat at all wavelengths from the mid–UV to the near-IR, with best fit power-law slopes in general of order0.03–0.20 dex/mag. The two bluest points at 153 and 231 nm are from the GALEX star counts of Xu et al.(2005; open squares), which cover AB=17–23 mag. The ERS counts at the shortest wavelength suffer fromsmall number statistics and so are less reliable (see Fig. 10a and 11a). For further details, see the text.
Fig. 11c. (Right panel) ERS Galaxy count slope (filled circles) versus observed wavelength in the flux rangesAB'19–25 mag for the 3 UV WFC3 filters, AB'18–26 mag for the GOODS/ACS BViz filters, and AB'17–25 mag for the 3 WFC3 IR filters, respectively. The two bluest points at 153 and 231 nm are from theGALEX galaxy counts of Xu et al. (2005; open squares), which cover AB=17–23 mag. The galaxy countsshow the well known trend of a steepening of the best-fit power-law slope at the bluer wavelengths, which iscaused by a combination of the more significant K-correction and the shape of the galaxy redshift distributionat the selection wavelength.
44
Fig. 12a–12c. Differential galaxy number counts for the entire flux range AB=10–30 mag in the F225W(12a), F275 (12b), and F336W (12c) filters. For comparison at the bright end, we added to the ERS numbercounts from Fig. 11a the panchromatic GAMA survey (Driver et al. 2009) counts in NUV+ugrizYJH, whichcover AB=10–21 mag (Xu et al. 2005; Hill et al. 2010a). At the faint end, we added the WHT U-band andHDF-North and South F300W counts of Metcalfe et al. (2001), the deep LBT U-band counts of Grazianet al. (2009), as well as the deep HST STIS counts of Gardner et al. (2000). Best fit luminosity and numberdensity evolution models cover AB'10–30 mag (see Driver et al. 1998; Hill et al. 2010a).

45
Fig. 12d–12g. Differential galaxy number counts for the entire flux range AB=10–30 mag in the F435W(12d), F606W (12e), F775W (12f), and F850LP (12g) filters. Further details are given in the caption of Fig.12a–12c. At the faint end, we also added the HUDF counts in BViz from Beckwith et al. (2006), which coverAB=23–30 mag.

46
Fig. 12h–12j. Differential galaxy number counts for the entire flux range AB=10–30 mag in theF098M/F105W (12h), F125W (12i) and F160W (12j) filters. Further details are given in the caption ofFig. 12a–12c. At the faint end, we also added the HUDF counts from the Bouwens et al. (2009) YJH data,as compiled by Yan et al. (2010), which cover AB=24–30 mag.

47
Fig. 5b. Enlargement of the panchromatic 10-band ERS color image in the GOODS-South field (see Fig.5a). [For best display, please zoom in on the full-resolution version of this image, which is available on thisURL39 ].
39 http://www.asu.edu/clas/hst/www/wfc3ers/ERS2 gxysv4ln.tif

48
Fig. 13. Panchromatic postage stamps of early-type galaxies in the ERS with nuclear star-forming rings,bars, or other interesting nuclear structure. Each postage stamp is displayed at a slightly different colorstretch that best brings out the UV nuclear structure. For further details, see Rutkowski et al. (2011).

49
Fig. 14. Panchromatic postage stamps of objects with interesting morphological structure in the 10-bandERS color images of the GOODS-South field: from left to right, high signal-to-noise detections of ERSgalaxies resembling the main cosmological parameters H0 , Ω, ρo, w, and Λ, respectively. These imagesillustrate the rich and unique morphological information available in the 10-band panchromatic ERS dataset.

50
Fig. 15a–15d. The 4212 sec WFC3 G102 (top right) and G141 (bottom right) grism exposures of a singleWFC3 pointing in the GOODS-South field (green box in Fig. 3), together with their 1612 sec finder imagesin F098M (top left) and G141 (bottom left), respectively. Each image is a 4-point dithered mosaic. [For bestdisplay, please zoom in on the full-resolution PDF version of this image]. All brighter object grism spectrashow a 0th order image to their left, displaced by about twice the spectral image length, which should not beconfused with real emission lines. Many faint object spectra are visible to a continuum flux of AB<
∼ 25–25.5mag, including many faint emission line galaxies. For details, see Straughn et al. (2009, 2011).

51
Fig. 15e–15f. Examples of WFC3 G102 and G141 spectra of emission line galaxies extracted from the ERSgrism images (Fig. 15a–15d). The left panel shows an ELG at z=0.738 and the right panel at z=0.610. Thelatter also shows the available lower-resolution ACS G800L grism spectrum (green). The WFC3 G102 andG141 spectra allow for low-resolution faint object spectroscopy over the entire 0.80–1.70µm-range unimpededby the ground-based OH-forest. For further details, see Straughn et al. (2009, 2011).