Radio, X-ray and gamma-ray surface brightness profiles as powerful diagnostic tools for non-thermal...
15
arXiv:1012.4579v1 [astro-ph.HE] 21 Dec 2010 Mon. Not. R. Astron. Soc. 000, 1–15 (2010) Printed 22 December 2010 (MN L A T E X style file v2.2) Radio, X-ray and gamma-ray surface brightness profiles as powerful diagnostic tools for non-thermal SNR shells O. Petruk 1,2 , S. Orlando 3 , V. Beshley 2 , F. Bocchino 3 1 Institute for Applied Problems in Mechanics and Mathematics, Naukova St. 3-b, 79060 Lviv, Ukraine 2 Astronomical Observatory, National University, Kyryla and Methodia St. 8, 79008 Lviv, Ukraine 3 INAF - Osservatorio Astronomico di Palermo “G.S. Vaiana”, Piazza del Parlamento 1, 90134 Palermo, Italy Accepted .... Received ...; in original form ... ABSTRACT Distributions of nonthermal surface brightness of supernova remnants (SNRs) con- tain important information about the properties of magnetic field and acceleration of charged particles. In the present paper, the synchrotron radio, X-ray, and inverse- Compton (IC) γ -ray maps of adiabatic SNRs in uniform interstellar medium and interstellar magnetic field are modeled and their morphology is analyzed, with par- ticular emphasis to comparison of azimuthal and radial variations of brightness in radio, X-rays, and γ -rays. Approximate analytical formulae for the azimuthal and ra- dial profiles of the synchrotron radio and X-ray as well as the IC γ -ray brightness are derived. They reveal the main factors which influence the pattern of the surface brightness distribution due to leptonic emission processes in shells of SNRs and can account for some non-linear effects of acceleration if necessary. These approximations provide observers and theorists with a set of simple diagnostic tools for quick analysis of the non-thermal maps of SNRs. Key words: ISM: supernova remnants – shock waves – ISM: cosmic rays – radiation mechanisms: non-thermal – acceleration of particles 1 INTRODUCTION Non-thermal images of SNRs are rich sources of information about the properties of interstellar magnetic field (ISMF) behavior and kinetics of charged particles in vicinity of the strong non-relativistic shocks. Despite of their importance, images of SNRs – in contrast to broad-band spectra – are not well studied. Synchrotron X-ray brightness profiles were used as di- agnostic tools for the estimate of the post-shock magnetic field in some SNRs (e.g. Berezhko & V¨olk 2004). Radio az- imuthal profiles were used for determination of some proper- ties of SN 1006 (Petruk et al. 2009c, hereafter Paper I) and X-ray radial profiles were used to detect the shock precursor in SN 1006 and prove particle acceleration (Morlino et al. 2010). A detailed approach to modeling the synchrotron im- ages of adiabatic SNRs in uniform ISMF and uniform in- terstellar medium (ISM) is developed by Reynolds (1998). Fulbright & Reynolds (1990); Reynolds (1998, 2004) use modeled synchrotron maps of SNRs to put constraints on properties of accelerated particles. Properties of the inverse- Compton (IC) γ-ray maps are investigated and compared to radio images in Petruk et al. (2009a, hereafter Paper II). The influence of nonuniform ISM and/or nonuniform ISMF on the thermal X-ray morphology of adiabatic SNRs are studied in Hnatyk & Petruk (1999), on the radio maps in Orlando et al. (2007) and on the synchrotron X-ray and IC γ-ray images in Orlando et al. (2010). All studies of SNR maps assume classic MHD and test- particle theory of acceleration. Though they neglect effects of the back-reaction of the efficiently accelerated particles, they are able to explain general properties of the distribution of the surface brightness in radio, X-rays and γ-rays. This is because the classic theory, in contrast to the non-linear one, is able to deal with oblique shocks, that is vital for synthesis of SNR images. At present, the theory which considers effects of ac- celerated particles on the shock and on acceleration it- self is developed for the initially quasi-parallel shocks only. One may therefore model the only radial profiles of bright- ness, in the rather narrow region close to the shock (in order to be certain that obliquity does not introduce prominent modifications). Effects of non-linear accelera- tion on the radial profiles of brightness are considered in Ellison & Cassam-Chena¨ ı (2005); Cassam-Chena¨ ı et al. (2005); Lee et al. (2008); Zirakashvili & Aharonian (2010). Future studies on SNR morphology should take into account the NLA effects. Nevertheless, the classic approach is able to reveal the general properties of SNR maps de- c 2010 RAS
-
Upload
independent -
Category
Documents
-
view
2 -
download
0
Transcript of Radio, X-ray and gamma-ray surface brightness profiles as powerful diagnostic tools for non-thermal...
arX
iv:1
012.
4579
v1 [
astr
o-ph
.HE
] 2
1 D
ec 2
010
Mon. Not. R. Astron. Soc. 000, 1–15 (2010) Printed 22 December 2010 (MN LATEX style file v2.2)
Radio, X-ray and gamma-ray surface brightness profiles as
powerful diagnostic tools for non-thermal SNR shells
O. Petruk1,2, S. Orlando3, V. Beshley2, F. Bocchino31Institute for Applied Problems in Mechanics and Mathematics, Naukova St. 3-b, 79060 Lviv, Ukraine2Astronomical Observatory, National University, Kyryla and Methodia St. 8, 79008 Lviv, Ukraine3INAF - Osservatorio Astronomico di Palermo “G.S. Vaiana”, Piazza del Parlamento 1, 90134 Palermo, Italy
Accepted .... Received ...; in original form ...
ABSTRACT
Distributions of nonthermal surface brightness of supernova remnants (SNRs) con-tain important information about the properties of magnetic field and accelerationof charged particles. In the present paper, the synchrotron radio, X-ray, and inverse-Compton (IC) γ-ray maps of adiabatic SNRs in uniform interstellar medium andinterstellar magnetic field are modeled and their morphology is analyzed, with par-ticular emphasis to comparison of azimuthal and radial variations of brightness inradio, X-rays, and γ-rays. Approximate analytical formulae for the azimuthal and ra-dial profiles of the synchrotron radio and X-ray as well as the IC γ-ray brightnessare derived. They reveal the main factors which influence the pattern of the surfacebrightness distribution due to leptonic emission processes in shells of SNRs and canaccount for some non-linear effects of acceleration if necessary. These approximationsprovide observers and theorists with a set of simple diagnostic tools for quick analysisof the non-thermal maps of SNRs.
Key words: ISM: supernova remnants – shock waves – ISM: cosmic rays – radiationmechanisms: non-thermal – acceleration of particles
1 INTRODUCTION
Non-thermal images of SNRs are rich sources of informationabout the properties of interstellar magnetic field (ISMF)behavior and kinetics of charged particles in vicinity of thestrong non-relativistic shocks. Despite of their importance,images of SNRs – in contrast to broad-band spectra – arenot well studied.
Synchrotron X-ray brightness profiles were used as di-agnostic tools for the estimate of the post-shock magneticfield in some SNRs (e.g. Berezhko & Volk 2004). Radio az-imuthal profiles were used for determination of some proper-ties of SN 1006 (Petruk et al. 2009c, hereafter Paper I) andX-ray radial profiles were used to detect the shock precursorin SN 1006 and prove particle acceleration (Morlino et al.2010).
A detailed approach to modeling the synchrotron im-ages of adiabatic SNRs in uniform ISMF and uniform in-terstellar medium (ISM) is developed by Reynolds (1998).Fulbright & Reynolds (1990); Reynolds (1998, 2004) usemodeled synchrotron maps of SNRs to put constraints onproperties of accelerated particles. Properties of the inverse-Compton (IC) γ-ray maps are investigated and compared toradio images in Petruk et al. (2009a, hereafter Paper II).
The influence of nonuniform ISM and/or nonuniform
ISMF on the thermal X-ray morphology of adiabatic SNRsare studied in Hnatyk & Petruk (1999), on the radio mapsin Orlando et al. (2007) and on the synchrotron X-ray andIC γ-ray images in Orlando et al. (2010).
All studies of SNR maps assume classic MHD and test-particle theory of acceleration. Though they neglect effectsof the back-reaction of the efficiently accelerated particles,they are able to explain general properties of the distributionof the surface brightness in radio, X-rays and γ-rays. This isbecause the classic theory, in contrast to the non-linear one,is able to deal with oblique shocks, that is vital for synthesisof SNR images.
At present, the theory which considers effects of ac-celerated particles on the shock and on acceleration it-self is developed for the initially quasi-parallel shocks only.One may therefore model the only radial profiles of bright-ness, in the rather narrow region close to the shock (inorder to be certain that obliquity does not introduceprominent modifications). Effects of non-linear accelera-tion on the radial profiles of brightness are consideredin Ellison & Cassam-Chenaı (2005); Cassam-Chenaı et al.(2005); Lee et al. (2008); Zirakashvili & Aharonian (2010).
Future studies on SNR morphology should take intoaccount the NLA effects. Nevertheless, the classic approachis able to reveal the general properties of SNR maps de-
c© 2010 RAS

2 Petruk O. et al.
termined by MF behavior and particle acceleration. Besidethat, it is important to know the properties of the ‘classic’images because they create the reference base for investiga-tion of the efficiency of NLA effects in the surface brightnessdistribution of SNRs.
In Paper I, we introduced a method to derive an aspectangle of ISMF from the radio brightness of SNR. In Paper II,we synthesized radio and IC γ-ray maps and concluded thatcoincidence of the position of the γ-ray and radio limbs isnot a common case in theoretical models, because differentparameters are dominant in determintion of the radio andγ-ray brightness variations. On the other hand, radio, X-ray and γ-ray observations (Petruk et al. 2009c; Miceli et al.2009; Acero at al. 2010) show that radio, X-ray and γ-raylimbs coincide in SN 1006. As discussed in Paper II, such co-incidence might be attributed to a combination of obliquitydependences of magnetic field and properties of emittingparticles, as well as orientation versus the observer.
In the present paper, we make a step forward extend-ing our model of non-thermal leptonic emission of SedovSNRs in uniform medium to the X-ray band. We also derivebrightness profiles for representative parameters which aresuited for the comparison with adiabatic SNRs. Moreover,we derive analytical approximations of the azimuthal and ra-dial profiles of radio, X-ray and γ-ray brightness which areextremely useful to demonstrate their dependence on theacceleration parameters, magnetic field orientation and theviewing geometry; they can also be directly and very easilyfitted to SNR images to derive estimations for the best-fitquantities. While the analytical approximation cannot sub-stitute the more accurate numerical simulations, we showthat they retain enough accuracy to represent an effectivediagnostic tool for the study of non-thermal SNR shells.
2 RIGOROUS TREATMENT OF
SYNCHROTRON AND IC EMISSION OF
SEDOV SNRS
2.1 General considerations
The present paper is continuation of the study in Paper II.The model and numerical realisation are therefore similarto those used in the Paper II; the reader is referred to thispaper for more details. In short, in order to investigate theproperties of the leptonic emission of Sedov SNR, we usethe Sedov (1959) solutions for dynamics of fluid as well asthe Reynolds (1998) description of the MF behavior down-stream of the shock. The use of analytical solutions allowsus to reduce the computational time considerably. We followReynolds (1998) also in calculation of the evolution of thedistribution function N(E) of relativistic electrons down-stream of the shock (see Appendix A for details).
The ISMF orientation versus observer is described bythe aspect angle φo, an angle between ISMF and the lineof sight. Let us define also the obliquity angle Θo as theangle between ISMF and the normal to the shock, and theazimuth angle ϕ in the projection plane which is measuredfrom the direction of the component of ISMF in the planeof the sky (see Fig. 1 in Paper II).
The compression factor for ISMF at the shock front σB
is modulated from unity at parallel shock to σ = (γ+1)/(γ−
1) at perpendicular one (where γ is the adiabatic index), inagreement with Reynolds (1998).
At the shock, the energy spectrum of relativistic elec-trons is taken to be N(E) = KE−s exp (−(E/Emax)
α),where Emax is the maximum energy of electrons, s the spec-tral index, K the normalization, free parameter α regulatesthe rate of the spectrum decrease around the high-energyend1. Evolution of the ‘electron injection ability’ of the shockis represented as K ∝ V −b where V is the shock velocity,and b is a constant. The variation of the distribution N(E)over the surface of the SNR and its evolution downstreamof the shock are calculated as described by Reynolds (1998).Following Reynolds (1998), we synthesize the synchrotronand IC emission, considering each of the three cases of vari-ation of electron injection efficiency with the shock obliquity(quasi-perpendicular, isotropic, and quasi-parallel particleinjection) and each of the three alternatives for time andspatial dependence of Emax (time-limited, loss-limited andescape-limited with a gyrofactor η as a parameter; it is aratio of the mean free path of a particle to its gyroradius).Both the synchrotron and the IC losses are included as chan-nels for the radiative losses of relativistic electrons, thoughthe IC losses are quite small comparing to synchrotron dueto large MF considered.
The surface brightness is calculated by integrating emis-sivities along the line of sight within the SNR. The emissivityof electrons is given by
q(ε) =
∫ ∞
0
N(E)p(E, ε)dE (1)
where ε is the photon energy and p is the spectral distribu-tion of synchrotron or IC radiation power of electron. Weassume that information about orientation of B inside SNRis lost because of turbulence, in practice, we use an averageaspect angle downstream. The distribution p is calculatedwith the use of the analytical approximation developed byPetruk (2009, see also Paper II).
2.2 Images
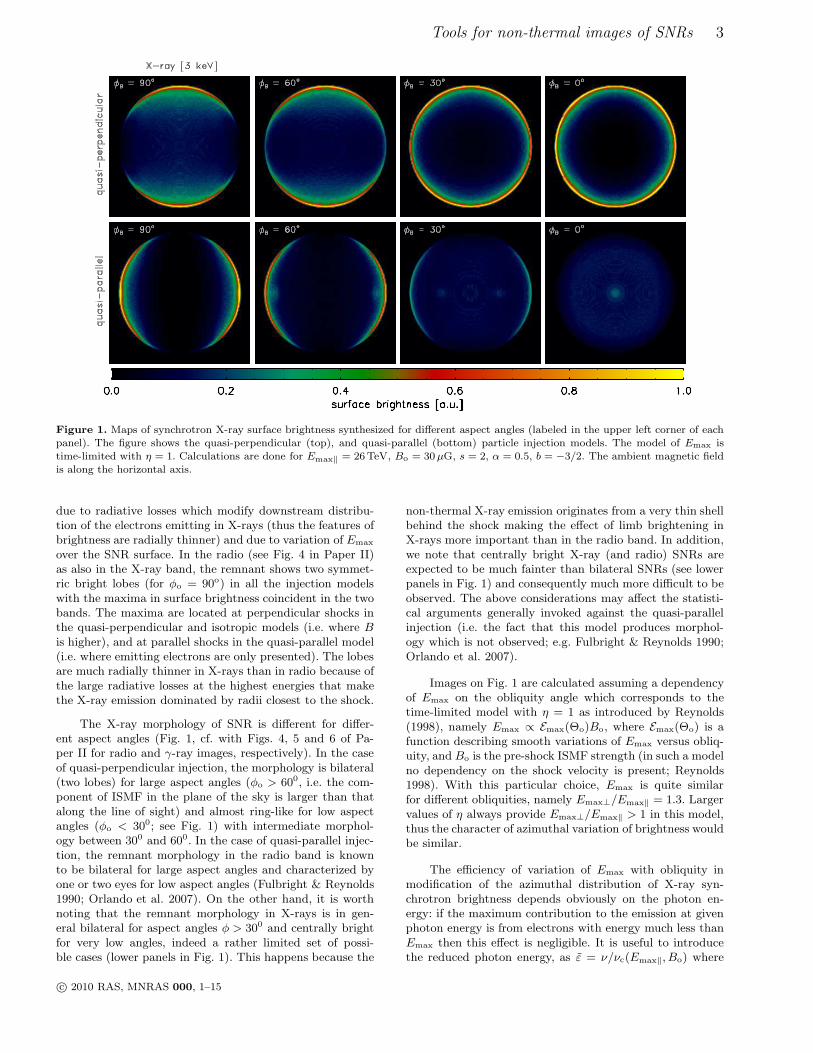
The resulting synchrotron radio images and the IC γ-ray im-ages synthesized by our model have been already presentedin Paper I and Paper II. Therefore, we present here only theX-ray images (see Fig. 1), adding appropriate references tothe previous work to let the reader do a quick comparison.
The pattern of synchrotron X-ray brightness of SNR isin general similar to the radio one. In most cases, the brightX-ray limbs or other features are located in the same az-imuth as in the radio images. The only differences appear
1 A number of observations (Ellison et al. 2000, 2001;Lazendic et al. 2004; Uchiyama et al. 2003) reveal evidenceof broadening of the high-energy cut-off, i.e. α < 1. Such broad-ening should be attributed to the physics of acceleration (Petruk2006), rather than to the effect of superposition of spectra indifferent conditions along the line of sight as it was suggestedinitially by Reynolds (1996). From other side, theoretical modelof Zirakashvili & Aharonian (2007) demonstrates that it shouldbe α = 2 for the loss-limited models, whereas in practice, takingthe time evolution into account it could be between 1 and 2(Schure et al. 2010). Also Kang & Ryu (2010) suggest thatα > 1.
c© 2010 RAS, MNRAS 000, 1–15
Tools for non-thermal images of SNRs 3
Figure 1. Maps of synchrotron X-ray surface brightness synthesized for different aspect angles (labeled in the upper left corner of eachpanel). The figure shows the quasi-perpendicular (top), and quasi-parallel (bottom) particle injection models. The model of Emax istime-limited with η = 1. Calculations are done for Emax‖ = 26TeV, Bo = 30µG, s = 2, α = 0.5, b = −3/2. The ambient magnetic fieldis along the horizontal axis.
due to radiative losses which modify downstream distribu-tion of the electrons emitting in X-rays (thus the features ofbrightness are radially thinner) and due to variation of Emax
over the SNR surface. In the radio (see Fig. 4 in Paper II)as also in the X-ray band, the remnant shows two symmet-ric bright lobes (for φo = 90o) in all the injection modelswith the maxima in surface brightness coincident in the twobands. The maxima are located at perpendicular shocks inthe quasi-perpendicular and isotropic models (i.e. where Bis higher), and at parallel shocks in the quasi-parallel model(i.e. where emitting electrons are only presented). The lobesare much radially thinner in X-rays than in radio because ofthe large radiative losses at the highest energies that makethe X-ray emission dominated by radii closest to the shock.
The X-ray morphology of SNR is different for differ-ent aspect angles (Fig. 1, cf. with Figs. 4, 5 and 6 of Pa-per II for radio and γ-ray images, respectively). In the caseof quasi-perpendicular injection, the morphology is bilateral(two lobes) for large aspect angles (φo > 600, i.e. the com-ponent of ISMF in the plane of the sky is larger than thatalong the line of sight) and almost ring-like for low aspectangles (φo < 300; see Fig. 1) with intermediate morphol-ogy between 300 and 600. In the case of quasi-parallel injec-tion, the remnant morphology in the radio band is knownto be bilateral for large aspect angles and characterized byone or two eyes for low aspect angles (Fulbright & Reynolds1990; Orlando et al. 2007). On the other hand, it is worthnoting that the remnant morphology in X-rays is in gen-eral bilateral for aspect angles φ > 300 and centrally brightfor very low angles, indeed a rather limited set of possi-ble cases (lower panels in Fig. 1). This happens because the
non-thermal X-ray emission originates from a very thin shellbehind the shock making the effect of limb brightening inX-rays more important than in the radio band. In addition,we note that centrally bright X-ray (and radio) SNRs areexpected to be much fainter than bilateral SNRs (see lowerpanels in Fig. 1) and consequently much more difficult to beobserved. The above considerations may affect the statisti-cal arguments generally invoked against the quasi-parallelinjection (i.e. the fact that this model produces morphol-ogy which is not observed; e.g. Fulbright & Reynolds 1990;Orlando et al. 2007).
Images on Fig. 1 are calculated assuming a dependencyof Emax on the obliquity angle which corresponds to thetime-limited model with η = 1 as introduced by Reynolds(1998), namely Emax ∝ Emax(Θo)Bo, where Emax(Θo) is afunction describing smooth variations of Emax versus obliq-uity, and Bo is the pre-shock ISMF strength (in such a modelno dependency on the shock velocity is present; Reynolds1998). With this particular choice, Emax is quite similarfor different obliquities, namely Emax⊥/Emax‖ = 1.3. Largervalues of η always provide Emax⊥/Emax‖ > 1 in this model,thus the character of azimuthal variation of brightness wouldbe similar.
The efficiency of variation of Emax with obliquity inmodification of the azimuthal distribution of X-ray syn-chrotron brightness depends obviously on the photon en-ergy: if the maximum contribution to the emission at givenphoton energy is from electrons with energy much less thanEmax then this effect is negligible. It is useful to introducethe reduced photon energy, as ε = ν/νc(Emax‖, Bo) where
c© 2010 RAS, MNRAS 000, 1–15
4 Petruk O. et al.
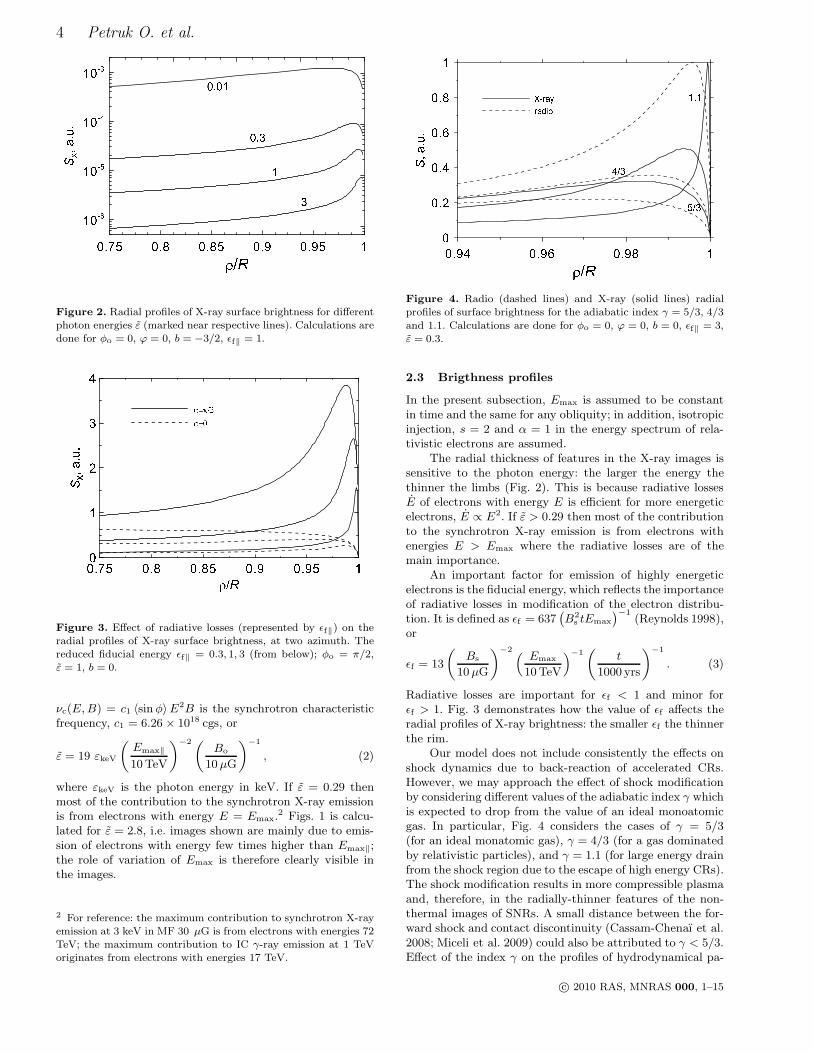
Figure 2. Radial profiles of X-ray surface brightness for differentphoton energies ε (marked near respective lines). Calculations aredone for φo = 0, ϕ = 0, b = −3/2, ǫf‖ = 1.
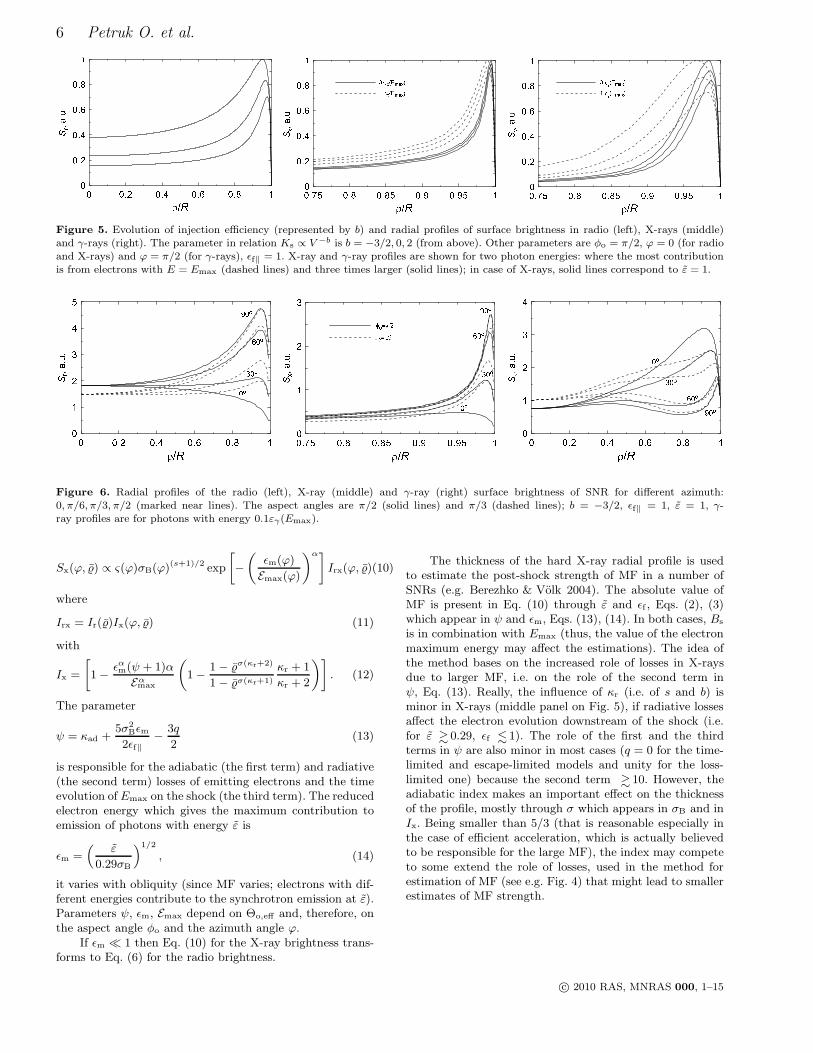
Figure 3. Effect of radiative losses (represented by ǫf‖) on theradial profiles of X-ray surface brightness, at two azimuth. Thereduced fiducial energy ǫf‖ = 0.3, 1, 3 (from below); φo = π/2,ε = 1, b = 0.
νc(E,B) = c1 〈sinφ〉E2B is the synchrotron characteristicfrequency, c1 = 6.26 × 10¹⁸ cgs, or
ε = 19 εkeV
(
Emax‖
10TeV
)−2(
Bo
10µG
)−1
, (2)
where εkeV is the photon energy in keV. If ε = 0.29 thenmost of the contribution to the synchrotron X-ray emissionis from electrons with energy E = Emax.
2 Figs. 1 is calcu-lated for ε = 2.8, i.e. images shown are mainly due to emis-sion of electrons with energy few times higher than Emax‖;the role of variation of Emax is therefore clearly visible inthe images.
2 For reference: the maximum contribution to synchrotron X-rayemission at 3 keV in MF 30 µG is from electrons with energies 72TeV; the maximum contribution to IC γ-ray emission at 1 TeVoriginates from electrons with energies 17 TeV.
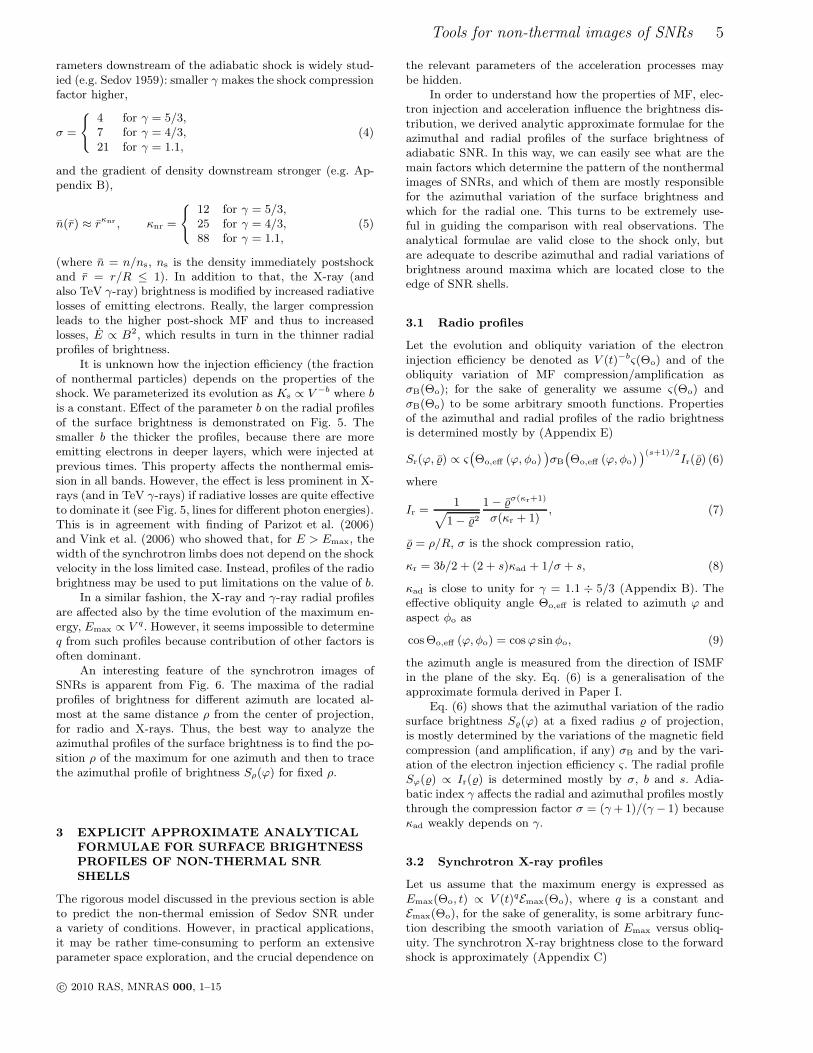
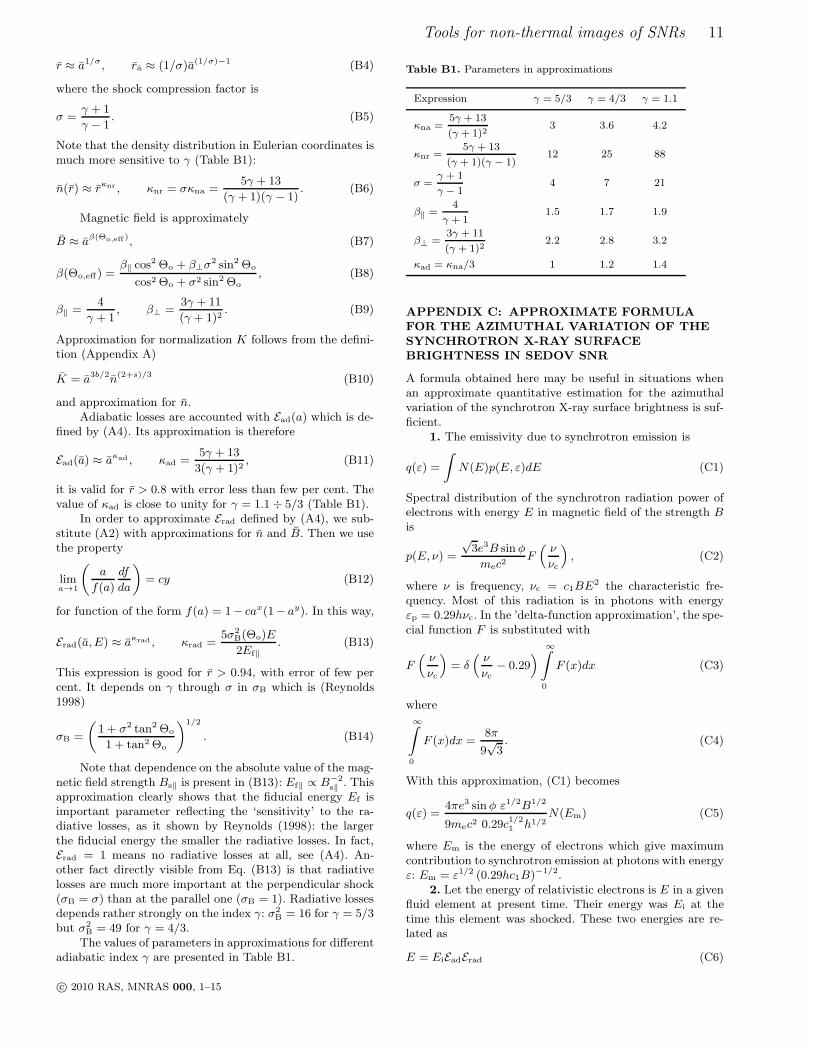
Figure 4. Radio (dashed lines) and X-ray (solid lines) radialprofiles of surface brightness for the adiabatic index γ = 5/3, 4/3
and 1.1. Calculations are done for φo = 0, ϕ = 0, b = 0, ǫf‖ = 3,ε = 0.3.
2.3 Brigthness profiles
In the present subsection, Emax is assumed to be constantin time and the same for any obliquity; in addition, isotropicinjection, s = 2 and α = 1 in the energy spectrum of rela-tivistic electrons are assumed.
The radial thickness of features in the X-ray images issensitive to the photon energy: the larger the energy thethinner the limbs (Fig. 2). This is because radiative lossesE of electrons with energy E is efficient for more energeticelectrons, E ∝ E2. If ε > 0.29 then most of the contributionto the synchrotron X-ray emission is from electrons withenergies E > Emax where the radiative losses are of themain importance.
An important factor for emission of highly energeticelectrons is the fiducial energy, which reflects the importanceof radiative losses in modification of the electron distribu-tion. It is defined as ǫf = 637
(
B2s tEmax
)−1(Reynolds 1998),
or
ǫf = 13
(
Bs
10µG
)−2(
Emax
10TeV
)−1(
t
1000 yrs
)−1
. (3)
Radiative losses are important for ǫf < 1 and minor forǫf > 1. Fig. 3 demonstrates how the value of ǫf affects theradial profiles of X-ray brightness: the smaller ǫf the thinnerthe rim.
Our model does not include consistently the effects onshock dynamics due to back-reaction of accelerated CRs.However, we may approach the effect of shock modificationby considering different values of the adiabatic index γ whichis expected to drop from the value of an ideal monoatomicgas. In particular, Fig. 4 considers the cases of γ = 5/3(for an ideal monatomic gas), γ = 4/3 (for a gas dominatedby relativistic particles), and γ = 1.1 (for large energy drainfrom the shock region due to the escape of high energy CRs).The shock modification results in more compressible plasmaand, therefore, in the radially-thinner features of the non-thermal images of SNRs. A small distance between the for-ward shock and contact discontinuity (Cassam-Chenaı et al.2008; Miceli et al. 2009) could also be attributed to γ < 5/3.Effect of the index γ on the profiles of hydrodynamical pa-
c© 2010 RAS, MNRAS 000, 1–15
Tools for non-thermal images of SNRs 5
rameters downstream of the adiabatic shock is widely stud-ied (e.g. Sedov 1959): smaller γ makes the shock compressionfactor higher,
σ =
{
4 for γ = 5/3,7 for γ = 4/3,21 for γ = 1.1,
(4)
and the gradient of density downstream stronger (e.g. Ap-pendix B),
n(r) ≈ rκnr , κnr =
{
12 for γ = 5/3,25 for γ = 4/3,88 for γ = 1.1,
(5)
(where n = n/ns, ns is the density immediately postshockand r = r/R ≤ 1). In addition to that, the X-ray (andalso TeV γ-ray) brightness is modified by increased radiativelosses of emitting electrons. Really, the larger compressionleads to the higher post-shock MF and thus to increasedlosses, E ∝ B2, which results in turn in the thinner radialprofiles of brightness.
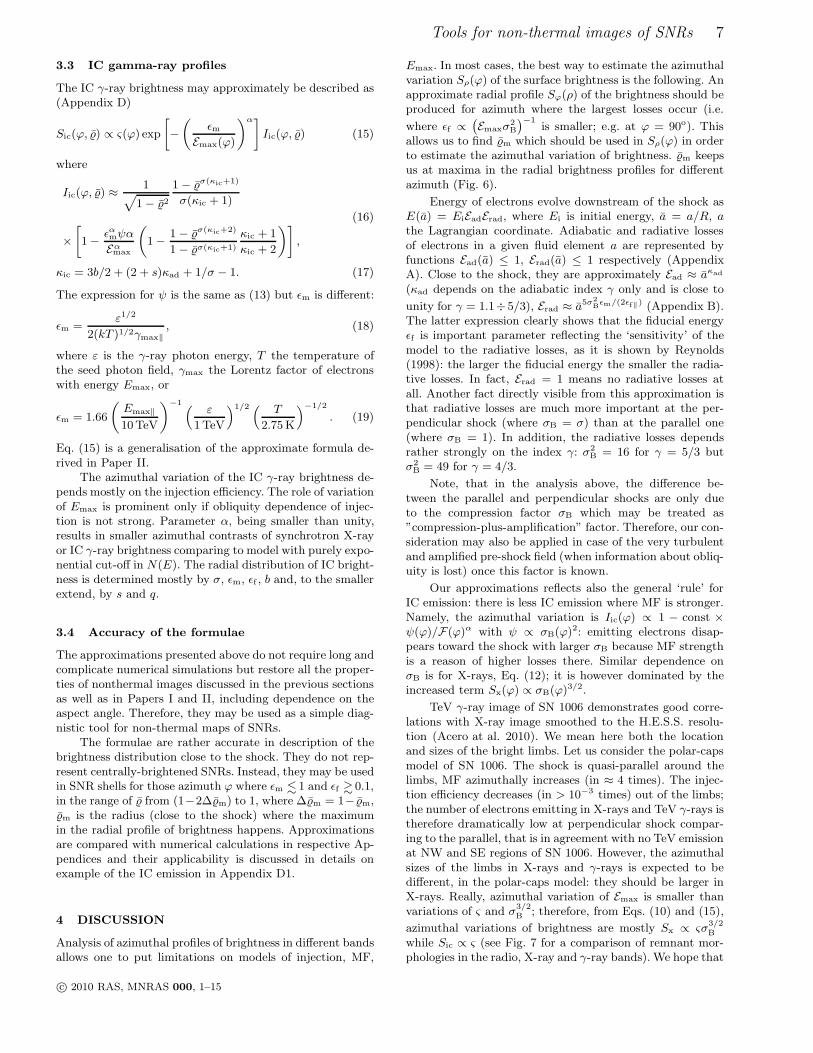
It is unknown how the injection efficiency (the fractionof nonthermal particles) depends on the properties of theshock. We parameterized its evolution as Ks ∝ V −b where bis a constant. Effect of the parameter b on the radial profilesof the surface brightness is demonstrated on Fig. 5. Thesmaller b the thicker the profiles, because there are moreemitting electrons in deeper layers, which were injected atprevious times. This property affects the nonthermal emis-sion in all bands. However, the effect is less prominent in X-rays (and in TeV γ-rays) if radiative losses are quite effectiveto dominate it (see Fig. 5, lines for different photon energies).This is in agreement with finding of Parizot et al. (2006)and Vink et al. (2006) who showed that, for E > Emax, thewidth of the synchrotron limbs does not depend on the shockvelocity in the loss limited case. Instead, profiles of the radiobrightness may be used to put limitations on the value of b.
In a similar fashion, the X-ray and γ-ray radial profilesare affected also by the time evolution of the maximum en-ergy, Emax ∝ V q. However, it seems impossible to determineq from such profiles because contribution of other factors isoften dominant.
An interesting feature of the synchrotron images ofSNRs is apparent from Fig. 6. The maxima of the radialprofiles of brightness for different azimuth are located al-most at the same distance ρ from the center of projection,for radio and X-rays. Thus, the best way to analyze theazimuthal profiles of the surface brightness is to find the po-sition ρ of the maximum for one azimuth and then to tracethe azimuthal profile of brightness Sρ(ϕ) for fixed ρ.
3 EXPLICIT APPROXIMATE ANALYTICAL
FORMULAE FOR SURFACE BRIGHTNESS
PROFILES OF NON-THERMAL SNR
SHELLS
The rigorous model discussed in the previous section is ableto predict the non-thermal emission of Sedov SNR undera variety of conditions. However, in practical applications,it may be rather time-consuming to perform an extensiveparameter space exploration, and the crucial dependence on
the relevant parameters of the acceleration processes maybe hidden.
In order to understand how the properties of MF, elec-tron injection and acceleration influence the brightness dis-tribution, we derived analytic approximate formulae for theazimuthal and radial profiles of the surface brightness ofadiabatic SNR. In this way, we can easily see what are themain factors which determine the pattern of the nonthermalimages of SNRs, and which of them are mostly responsiblefor the azimuthal variation of the surface brightness andwhich for the radial one. This turns to be extremely use-ful in guiding the comparison with real observations. Theanalytical formulae are valid close to the shock only, butare adequate to describe azimuthal and radial variations ofbrightness around maxima which are located close to theedge of SNR shells.
3.1 Radio profiles
Let the evolution and obliquity variation of the electroninjection efficiency be denoted as V (t)−bς(Θo) and of theobliquity variation of MF compression/amplification asσB(Θo); for the sake of generality we assume ς(Θo) andσB(Θo) to be some arbitrary smooth functions. Propertiesof the azimuthal and radial profiles of the radio brightnessis determined mostly by (Appendix E)
Sr(ϕ, ¯) ∝ ς(
Θo,eff (ϕ, φo))
σB
(
Θo,eff (ϕ, φo))(s+1)/2
Ir(¯) (6)
where
Ir =1
√
1− ¯2
1− ¯σ(κr+1)
σ(κr + 1), (7)
¯ = ρ/R, σ is the shock compression ratio,
κr = 3b/2 + (2 + s)κad + 1/σ + s, (8)
κad is close to unity for γ = 1.1 ÷ 5/3 (Appendix B). Theeffective obliquity angle Θo,eff is related to azimuth ϕ andaspect φo as
cosΘo,eff (ϕ, φo) = cosϕ sinφo, (9)
the azimuth angle is measured from the direction of ISMFin the plane of the sky. Eq. (6) is a generalisation of theapproximate formula derived in Paper I.
Eq. (6) shows that the azimuthal variation of the radiosurface brightness S(ϕ) at a fixed radius of projection,is mostly determined by the variations of the magnetic fieldcompression (and amplification, if any) σB and by the vari-ation of the electron injection efficiency ς. The radial profileSϕ() ∝ Ir() is determined mostly by σ, b and s. Adia-batic index γ affects the radial and azimuthal profiles mostlythrough the compression factor σ = (γ+1)/(γ − 1) becauseκad weakly depends on γ.
3.2 Synchrotron X-ray profiles
Let us assume that the maximum energy is expressed asEmax(Θo, t) ∝ V (t)qEmax(Θo), where q is a constant andEmax(Θo), for the sake of generality, is some arbitrary func-tion describing the smooth variation of Emax versus obliq-uity. The synchrotron X-ray brightness close to the forwardshock is approximately (Appendix C)
c© 2010 RAS, MNRAS 000, 1–15
6 Petruk O. et al.
Figure 5. Evolution of injection efficiency (represented by b) and radial profiles of surface brightness in radio (left), X-rays (middle)and γ-rays (right). The parameter in relation Ks ∝ V −b is b = −3/2, 0, 2 (from above). Other parameters are φo = π/2, ϕ = 0 (for radioand X-rays) and ϕ = π/2 (for γ-rays), ǫf‖ = 1. X-ray and γ-ray profiles are shown for two photon energies: where the most contributionis from electrons with E = Emax (dashed lines) and three times larger (solid lines); in case of X-rays, solid lines correspond to ε = 1.
Figure 6. Radial profiles of the radio (left), X-ray (middle) and γ-ray (right) surface brightness of SNR for different azimuth:0, π/6, π/3, π/2 (marked near lines). The aspect angles are π/2 (solid lines) and π/3 (dashed lines); b = −3/2, ǫf‖ = 1, ε = 1, γ-ray profiles are for photons with energy 0.1εγ(Emax).
Sx(ϕ, ¯) ∝ ς(ϕ)σB(ϕ)(s+1)/2 exp
[
−(
ǫm(ϕ)
Emax(ϕ)
)α]
Irx(ϕ, ¯)(10)
where
Irx = Ir(¯)Ix(ϕ, ¯) (11)
with
Ix =
[
1− ǫαm(ψ + 1)α
Eαmax
(
1− 1− ¯σ(κr+2)
1− ¯σ(κr+1)
κr + 1
κr + 2
)]
. (12)
The parameter
ψ = κad +5σ2
Bǫm2ǫf‖
− 3q
2(13)
is responsible for the adiabatic (the first term) and radiative(the second term) losses of emitting electrons and the timeevolution of Emax on the shock (the third term). The reducedelectron energy which gives the maximum contribution toemission of photons with energy ε is
ǫm =(
ε
0.29σB
)1/2
, (14)
it varies with obliquity (since MF varies; electrons with dif-ferent energies contribute to the synchrotron emission at ε).Parameters ψ, ǫm, Emax depend on Θo,eff and, therefore, onthe aspect angle φo and the azimuth angle ϕ.
If ǫm ≪ 1 then Eq. (10) for the X-ray brightness trans-forms to Eq. (6) for the radio brightness.
The thickness of the hard X-ray radial profile is usedto estimate the post-shock strength of MF in a number ofSNRs (e.g. Berezhko & Volk 2004). The absolute value ofMF is present in Eq. (10) through ε and ǫf , Eqs. (2), (3)which appear in ψ and ǫm, Eqs. (13), (14). In both cases, Bs
is in combination with Emax (thus, the value of the electronmaximum energy may affect the estimations). The idea ofthe method bases on the increased role of losses in X-raysdue to larger MF, i.e. on the role of the second term inψ, Eq. (13). Really, the influence of κr (i.e. of s and b) isminor in X-rays (middle panel on Fig. 5), if radiative lossesaffect the electron evolution downstream of the shock (i.e.for ε >∼ 0.29, ǫf <∼ 1). The role of the first and the thirdterms in ψ are also minor in most cases (q = 0 for the time-limited and escape-limited models and unity for the loss-limited one) because the second term >∼ 10. However, theadiabatic index makes an important effect on the thicknessof the profile, mostly through σ which appears in σB and inIx. Being smaller than 5/3 (that is reasonable especially inthe case of efficient acceleration, which is actually believedto be responsible for the large MF), the index may competeto some extend the role of losses, used in the method forestimation of MF (see e.g. Fig. 4) that might lead to smallerestimates of MF strength.
c© 2010 RAS, MNRAS 000, 1–15
Tools for non-thermal images of SNRs 7
3.3 IC gamma-ray profiles
The IC γ-ray brightness may approximately be described as(Appendix D)
Sic(ϕ, ¯) ∝ ς(ϕ) exp
[
−(
ǫmEmax(ϕ)
)α]
Iic(ϕ, ¯) (15)
where
Iic(ϕ, ¯) ≈1
√
1− ¯2
1− ¯σ(κic+1)
σ(κic + 1)
×[
1− ǫαmψα
Eαmax
(
1− 1− ¯σ(κic+2)
1− ¯σ(κic+1)
κic + 1
κic + 2
)]
,
(16)
κic = 3b/2 + (2 + s)κad + 1/σ − 1. (17)
The expression for ψ is the same as (13) but ǫm is different:
ǫm =ε1/2
2(kT )1/2γmax‖
, (18)
where ε is the γ-ray photon energy, T the temperature ofthe seed photon field, γmax the Lorentz factor of electronswith energy Emax, or
ǫm = 1.66
(
Emax‖
10TeV
)−1(
ε
1TeV
)1/2 ( T
2.75K
)−1/2
. (19)
Eq. (15) is a generalisation of the approximate formula de-rived in Paper II.
The azimuthal variation of the IC γ-ray brightness de-pends mostly on the injection efficiency. The role of variationof Emax is prominent only if obliquity dependence of injec-tion is not strong. Parameter α, being smaller than unity,results in smaller azimuthal contrasts of synchrotron X-rayor IC γ-ray brightness comparing to model with purely expo-nential cut-off in N(E). The radial distribution of IC bright-ness is determined mostly by σ, ǫm, ǫf , b and, to the smallerextend, by s and q.
3.4 Accuracy of the formulae
The approximations presented above do not require long andcomplicate numerical simulations but restore all the proper-ties of nonthermal images discussed in the previous sectionsas well as in Papers I and II, including dependence on theaspect angle. Therefore, they may be used as a simple diag-nistic tool for non-thermal maps of SNRs.
The formulae are rather accurate in description of thebrightness distribution close to the shock. They do not rep-resent centrally-brightened SNRs. Instead, they may be usedin SNR shells for those azimuth ϕ where ǫm <∼ 1 and ǫf >∼ 0.1,in the range of ¯ from (1−2∆¯m) to 1, where ∆¯m = 1− ¯m,¯m is the radius (close to the shock) where the maximumin the radial profile of brightness happens. Approximationsare compared with numerical calculations in respective Ap-pendices and their applicability is discussed in details onexample of the IC emission in Appendix D1.
4 DISCUSSION
Analysis of azimuthal profiles of brightness in different bandsallows one to put limitations on models of injection, MF,
Emax. In most cases, the best way to estimate the azimuthalvariation Sρ(ϕ) of the surface brightness is the following. Anapproximate radial profile Sϕ(ρ) of the brightness should beproduced for azimuth where the largest losses occur (i.e.
where ǫf ∝(
Emaxσ2B
)−1is smaller; e.g. at ϕ = 90o). This
allows us to find ¯m which should be used in Sρ(ϕ) in orderto estimate the azimuthal variation of brightness. ¯m keepsus at maxima in the radial brightness profiles for differentazimuth (Fig. 6).
Energy of electrons evolve downstream of the shock asE(a) = EiEadErad, where Ei is initial energy, a = a/R, athe Lagrangian coordinate. Adiabatic and radiative lossesof electrons in a given fluid element a are represented byfunctions Ead(a) ≤ 1, Erad(a) ≤ 1 respectively (AppendixA). Close to the shock, they are approximately Ead ≈ aκad
(κad depends on the adiabatic index γ only and is close to
unity for γ = 1.1÷5/3), Erad ≈ a5σ2
Bǫm/(2ǫf‖) (Appendix B).
The latter expression clearly shows that the fiducial energyǫf is important parameter reflecting the ‘sensitivity’ of themodel to the radiative losses, as it is shown by Reynolds(1998): the larger the fiducial energy the smaller the radia-tive losses. In fact, Erad = 1 means no radiative losses atall. Another fact directly visible from this approximation isthat radiative losses are much more important at the per-pendicular shock (where σB = σ) than at the parallel one(where σB = 1). In addition, the radiative losses dependsrather strongly on the index γ: σ2
B = 16 for γ = 5/3 butσ2B = 49 for γ = 4/3.
Note, that in the analysis above, the difference be-tween the parallel and perpendicular shocks are only dueto the compression factor σB which may be treated as”compression-plus-amplification” factor. Therefore, our con-sideration may also be applied in case of the very turbulentand amplified pre-shock field (when information about obliq-uity is lost) once this factor is known.
Our approximations reflects also the general ‘rule’ forIC emission: there is less IC emission where MF is stronger.Namely, the azimuthal variation is Iic(ϕ) ∝ 1 − const ×ψ(ϕ)/F(ϕ)α with ψ ∝ σB(ϕ)
2: emitting electrons disap-pears toward the shock with larger σB because MF strengthis a reason of higher losses there. Similar dependence onσB is for X-rays, Eq. (12); it is however dominated by theincreased term Sx(ϕ) ∝ σB(ϕ)
3/2.
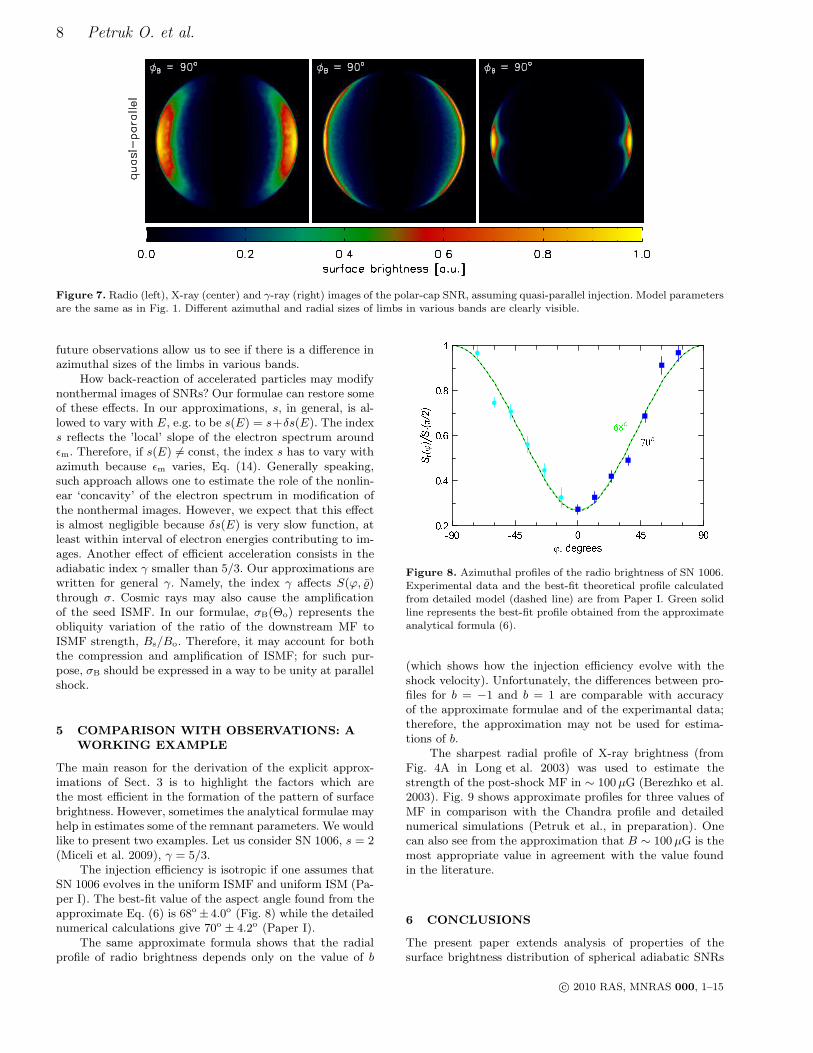
TeV γ-ray image of SN 1006 demonstrates good corre-lations with X-ray image smoothed to the H.E.S.S. resolu-tion (Acero at al. 2010). We mean here both the locationand sizes of the bright limbs. Let us consider the polar-capsmodel of SN 1006. The shock is quasi-parallel around thelimbs, MF azimuthally increases (in ≈ 4 times). The injec-tion efficiency decreases (in > 10−3 times) out of the limbs;the number of electrons emitting in X-rays and TeV γ-rays istherefore dramatically low at perpendicular shock compar-ing to the parallel, that is in agreement with no TeV emissionat NW and SE regions of SN 1006. However, the azimuthalsizes of the limbs in X-rays and γ-rays is expected to bedifferent, in the polar-caps model: they should be larger inX-rays. Really, azimuthal variation of Emax is smaller thanvariations of ς and σ
3/2B ; therefore, from Eqs. (10) and (15),
azimuthal variations of brightness are mostly Sx ∝ ςσ3/2B
while Sic ∝ ς (see Fig. 7 for a comparison of remnant mor-phologies in the radio, X-ray and γ-ray bands). We hope that
c© 2010 RAS, MNRAS 000, 1–15
8 Petruk O. et al.
Figure 7. Radio (left), X-ray (center) and γ-ray (right) images of the polar-cap SNR, assuming quasi-parallel injection. Model parametersare the same as in Fig. 1. Different azimuthal and radial sizes of limbs in various bands are clearly visible.
future observations allow us to see if there is a difference inazimuthal sizes of the limbs in various bands.
How back-reaction of accelerated particles may modifynonthermal images of SNRs? Our formulae can restore someof these effects. In our approximations, s, in general, is al-lowed to vary with E, e.g. to be s(E) = s+δs(E). The indexs reflects the ’local’ slope of the electron spectrum aroundǫm. Therefore, if s(E) 6= const, the index s has to vary withazimuth because ǫm varies, Eq. (14). Generally speaking,such approach allows one to estimate the role of the nonlin-ear ‘concavity’ of the electron spectrum in modification ofthe nonthermal images. However, we expect that this effectis almost negligible because δs(E) is very slow function, atleast within interval of electron energies contributing to im-ages. Another effect of efficient acceleration consists in theadiabatic index γ smaller than 5/3. Our approximations arewritten for general γ. Namely, the index γ affects S(ϕ, ¯)through σ. Cosmic rays may also cause the amplificationof the seed ISMF. In our formulae, σB(Θo) represents theobliquity variation of the ratio of the downstream MF toISMF strength, Bs/Bo. Therefore, it may account for boththe compression and amplification of ISMF; for such pur-pose, σB should be expressed in a way to be unity at parallelshock.
5 COMPARISON WITH OBSERVATIONS: A
WORKING EXAMPLE
The main reason for the derivation of the explicit approx-imations of Sect. 3 is to highlight the factors which arethe most efficient in the formation of the pattern of surfacebrightness. However, sometimes the analytical formulae mayhelp in estimates some of the remnant parameters. We wouldlike to present two examples. Let us consider SN 1006, s = 2(Miceli et al. 2009), γ = 5/3.
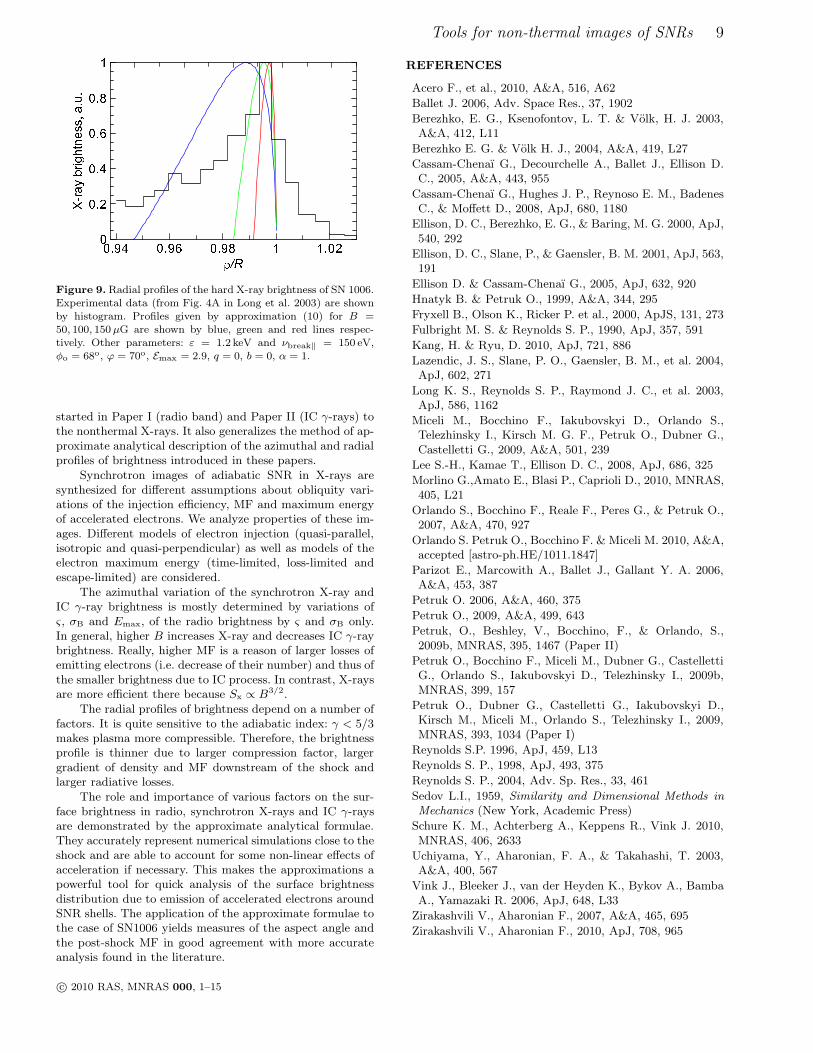
The injection efficiency is isotropic if one assumes thatSN 1006 evolves in the uniform ISMF and uniform ISM (Pa-per I). The best-fit value of the aspect angle found from theapproximate Eq. (6) is 68o ± 4.0o (Fig. 8) while the detailednumerical calculations give 70o ± 4.2o (Paper I).
The same approximate formula shows that the radialprofile of radio brightness depends only on the value of b
Figure 8. Azimuthal profiles of the radio brightness of SN 1006.Experimental data and the best-fit theoretical profile calculatedfrom detailed model (dashed line) are from Paper I. Green solidline represents the best-fit profile obtained from the approximateanalytical formula (6).
(which shows how the injection efficiency evolve with theshock velocity). Unfortunately, the differences between pro-files for b = −1 and b = 1 are comparable with accuracyof the approximate formulae and of the experimantal data;therefore, the approximation may not be used for estima-tions of b.
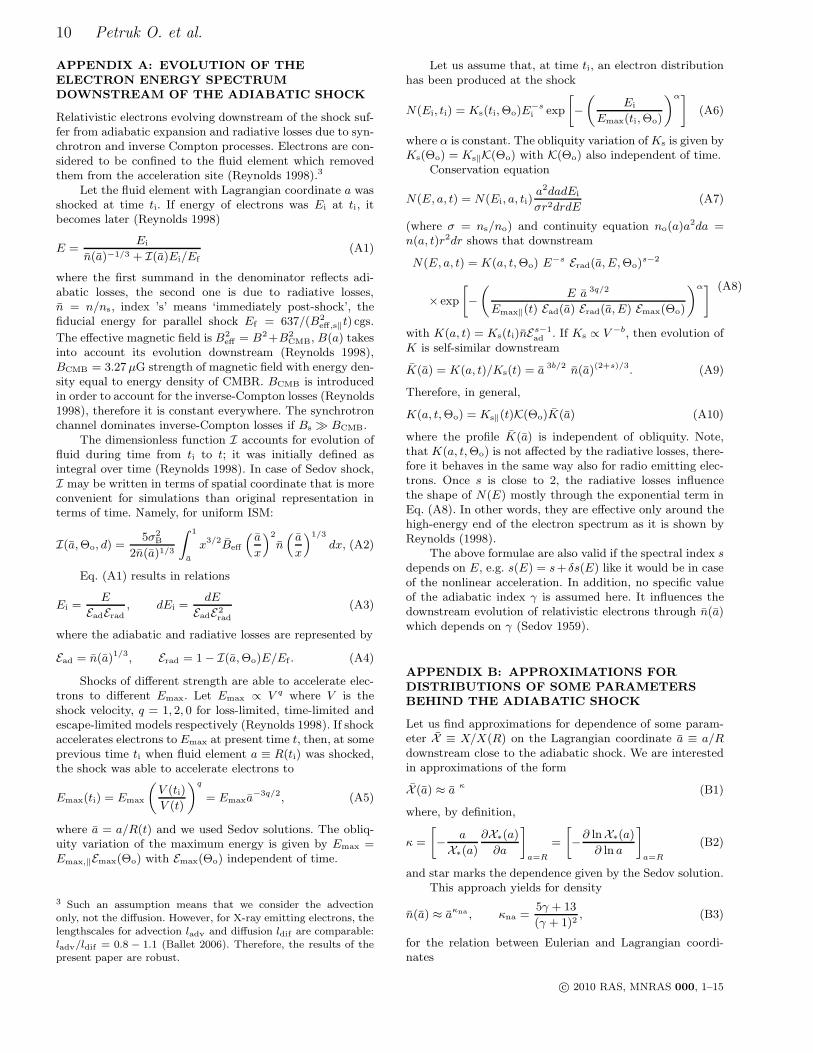
The sharpest radial profile of X-ray brightness (fromFig. 4A in Long et al. 2003) was used to estimate thestrength of the post-shock MF in ∼ 100µG (Berezhko et al.2003). Fig. 9 shows approximate profiles for three values ofMF in comparison with the Chandra profile and detailednumerical simulations (Petruk et al., in preparation). Onecan also see from the approximation that B ∼ 100µG is themost appropriate value in agreement with the value foundin the literature.
6 CONCLUSIONS
The present paper extends analysis of properties of thesurface brightness distribution of spherical adiabatic SNRs
c© 2010 RAS, MNRAS 000, 1–15
Tools for non-thermal images of SNRs 9
Figure 9.Radial profiles of the hard X-ray brightness of SN 1006.Experimental data (from Fig. 4A in Long et al. 2003) are shownby histogram. Profiles given by approximation (10) for B =50, 100, 150 µG are shown by blue, green and red lines respec-tively. Other parameters: ε = 1.2 keV and νbreak‖ = 150 eV,φo = 68o, ϕ = 70o, Emax = 2.9, q = 0, b = 0, α = 1.
started in Paper I (radio band) and Paper II (IC γ-rays) tothe nonthermal X-rays. It also generalizes the method of ap-proximate analytical description of the azimuthal and radialprofiles of brightness introduced in these papers.
Synchrotron images of adiabatic SNR in X-rays aresynthesized for different assumptions about obliquity vari-ations of the injection efficiency, MF and maximum energyof accelerated electrons. We analyze properties of these im-ages. Different models of electron injection (quasi-parallel,isotropic and quasi-perpendicular) as well as models of theelectron maximum energy (time-limited, loss-limited andescape-limited) are considered.
The azimuthal variation of the synchrotron X-ray andIC γ-ray brightness is mostly determined by variations ofς, σB and Emax, of the radio brightness by ς and σB only.In general, higher B increases X-ray and decreases IC γ-raybrightness. Really, higher MF is a reason of larger losses ofemitting electrons (i.e. decrease of their number) and thus ofthe smaller brightness due to IC process. In contrast, X-raysare more efficient there because Sx ∝ B3/2.
The radial profiles of brightness depend on a number offactors. It is quite sensitive to the adiabatic index: γ < 5/3makes plasma more compressible. Therefore, the brightnessprofile is thinner due to larger compression factor, largergradient of density and MF downstream of the shock andlarger radiative losses.
The role and importance of various factors on the sur-face brightness in radio, synchrotron X-rays and IC γ-raysare demonstrated by the approximate analytical formulae.They accurately represent numerical simulations close to theshock and are able to account for some non-linear effects ofacceleration if necessary. This makes the approximations apowerful tool for quick analysis of the surface brightnessdistribution due to emission of accelerated electrons aroundSNR shells. The application of the approximate formulae tothe case of SN1006 yields measures of the aspect angle andthe post-shock MF in good agreement with more accurateanalysis found in the literature.
REFERENCES
Acero F., et al., 2010, A&A, 516, A62
Ballet J. 2006, Adv. Space Res., 37, 1902
Berezhko, E. G., Ksenofontov, L. T. & Volk, H. J. 2003,A&A, 412, L11
Berezhko E. G. & Volk H. J., 2004, A&A, 419, L27
Cassam-Chenaı G., Decourchelle A., Ballet J., Ellison D.C., 2005, A&A, 443, 955
Cassam-Chenaı G., Hughes J. P., Reynoso E. M., BadenesC., & Moffett D., 2008, ApJ, 680, 1180
Ellison, D. C., Berezhko, E. G., & Baring, M. G. 2000, ApJ,540, 292
Ellison, D. C., Slane, P., & Gaensler, B. M. 2001, ApJ, 563,191
Ellison D. & Cassam-Chenaı G., 2005, ApJ, 632, 920
Hnatyk B. & Petruk O., 1999, A&A, 344, 295
Fryxell B., Olson K., Ricker P. et al., 2000, ApJS, 131, 273
Fulbright M. S. & Reynolds S. P., 1990, ApJ, 357, 591
Kang, H. & Ryu, D. 2010, ApJ, 721, 886
Lazendic, J. S., Slane, P. O., Gaensler, B. M., et al. 2004,ApJ, 602, 271
Long K. S., Reynolds S. P., Raymond J. C., et al. 2003,ApJ, 586, 1162
Miceli M., Bocchino F., Iakubovskyi D., Orlando S.,Telezhinsky I., Kirsch M. G. F., Petruk O., Dubner G.,Castelletti G., 2009, A&A, 501, 239
Lee S.-H., Kamae T., Ellison D. C., 2008, ApJ, 686, 325
Morlino G.,Amato E., Blasi P., Caprioli D., 2010, MNRAS,405, L21
Orlando S., Bocchino F., Reale F., Peres G., & Petruk O.,2007, A&A, 470, 927
Orlando S. Petruk O., Bocchino F. & Miceli M. 2010, A&A,accepted [astro-ph.HE/1011.1847]
Parizot E., Marcowith A., Ballet J., Gallant Y. A. 2006,A&A, 453, 387
Petruk O. 2006, A&A, 460, 375
Petruk O., 2009, A&A, 499, 643
Petruk, O., Beshley, V., Bocchino, F., & Orlando, S.,2009b, MNRAS, 395, 1467 (Paper II)
Petruk O., Bocchino F., Miceli M., Dubner G., CastellettiG., Orlando S., Iakubovskyi D., Telezhinsky I., 2009b,MNRAS, 399, 157
Petruk O., Dubner G., Castelletti G., Iakubovskyi D.,Kirsch M., Miceli M., Orlando S., Telezhinsky I., 2009,MNRAS, 393, 1034 (Paper I)
Reynolds S.P. 1996, ApJ, 459, L13
Reynolds S. P., 1998, ApJ, 493, 375
Reynolds S. P., 2004, Adv. Sp. Res., 33, 461
Sedov L.I., 1959, Similarity and Dimensional Methods in
Mechanics (New York, Academic Press)
Schure K. M., Achterberg A., Keppens R., Vink J. 2010,MNRAS, 406, 2633
Uchiyama, Y., Aharonian, F. A., & Takahashi, T. 2003,A&A, 400, 567
Vink J., Bleeker J., van der Heyden K., Bykov A., BambaA., Yamazaki R. 2006, ApJ, 648, L33
Zirakashvili V., Aharonian F., 2007, A&A, 465, 695
Zirakashvili V., Aharonian F., 2010, ApJ, 708, 965
c© 2010 RAS, MNRAS 000, 1–15
10 Petruk O. et al.
APPENDIX A: EVOLUTION OF THE
ELECTRON ENERGY SPECTRUM
DOWNSTREAM OF THE ADIABATIC SHOCK
Relativistic electrons evolving downstream of the shock suf-fer from adiabatic expansion and radiative losses due to syn-chrotron and inverse Compton processes. Electrons are con-sidered to be confined to the fluid element which removedthem from the acceleration site (Reynolds 1998).3
Let the fluid element with Lagrangian coordinate a wasshocked at time ti. If energy of electrons was Ei at ti, itbecomes later (Reynolds 1998)
E =Ei
n(a)−1/3 + I(a)Ei/Ef(A1)
where the first summand in the denominator reflects adi-abatic losses, the second one is due to radiative losses,n = n/ns, index ’s’ means ‘immediately post-shock’, thefiducial energy for parallel shock Ef = 637/(B2
eff,s‖t) cgs.
The effective magnetic field is B2eff = B2+B2
CMB, B(a) takesinto account its evolution downstream (Reynolds 1998),BCMB = 3.27µG strength of magnetic field with energy den-sity equal to energy density of CMBR. BCMB is introducedin order to account for the inverse-Compton losses (Reynolds1998), therefore it is constant everywhere. The synchrotronchannel dominates inverse-Compton losses if Bs ≫ BCMB.
The dimensionless function I accounts for evolution offluid during time from ti to t; it was initially defined asintegral over time (Reynolds 1998). In case of Sedov shock,I may be written in terms of spatial coordinate that is moreconvenient for simulations than original representation interms of time. Namely, for uniform ISM:
I(a,Θo, d) =5σ2
B
2n(a)1/3
∫ 1
a
x3/2Beff
(
a
x
)2
n(
a
x
)1/3
dx, (A2)
Eq. (A1) results in relations
Ei =E
EadErad, dEi =
dE
EadE2rad
(A3)
where the adiabatic and radiative losses are represented by
Ead = n(a)1/3, Erad = 1− I(a,Θo)E/Ef . (A4)
Shocks of different strength are able to accelerate elec-trons to different Emax. Let Emax ∝ V q where V is theshock velocity, q = 1, 2, 0 for loss-limited, time-limited andescape-limited models respectively (Reynolds 1998). If shockaccelerates electrons to Emax at present time t, then, at someprevious time ti when fluid element a ≡ R(ti) was shocked,the shock was able to accelerate electrons to
Emax(ti) = Emax
(
V (ti)
V (t)
)q
= Emaxa−3q/2, (A5)
where a = a/R(t) and we used Sedov solutions. The obliq-uity variation of the maximum energy is given by Emax =Emax,‖Emax(Θo) with Emax(Θo) independent of time.
3 Such an assumption means that we consider the advectiononly, not the diffusion. However, for X-ray emitting electrons, thelengthscales for advection ladv and diffusion ldif are comparable:ladv/ldif = 0.8 − 1.1 (Ballet 2006). Therefore, the results of thepresent paper are robust.
Let us assume that, at time ti, an electron distributionhas been produced at the shock
N(Ei, ti) = Ks(ti,Θo)E−si exp
[
−(
Ei
Emax(ti,Θo)
)α]
(A6)
where α is constant. The obliquity variation ofKs is given byKs(Θo) = Ks‖K(Θo) with K(Θo) also independent of time.
Conservation equation
N(E, a, t) = N(Ei, a, ti)a2dadEi
σr2drdE(A7)
(where σ = ns/no) and continuity equation no(a)a2da =
n(a, t)r2dr shows that downstream
N(E, a, t) = K(a, t,Θo) E−s Erad(a, E,Θo)
s−2
× exp
[
−(
E a 3q/2
Emax‖(t) Ead(a) Erad(a, E) Emax(Θo)
)α] (A8)
with K(a, t) = Ks(ti)nEs−1ad . If Ks ∝ V −b, then evolution of
K is self-similar downstream
K(a) = K(a, t)/Ks(t) = a 3b/2 n(a)(2+s)/3. (A9)
Therefore, in general,
K(a, t,Θo) = Ks‖(t)K(Θo)K(a) (A10)
where the profile K(a) is independent of obliquity. Note,that K(a, t,Θo) is not affected by the radiative losses, there-fore it behaves in the same way also for radio emitting elec-trons. Once s is close to 2, the radiative losses influencethe shape of N(E) mostly through the exponential term inEq. (A8). In other words, they are effective only around thehigh-energy end of the electron spectrum as it is shown byReynolds (1998).
The above formulae are also valid if the spectral index sdepends on E, e.g. s(E) = s+ δs(E) like it would be in caseof the nonlinear acceleration. In addition, no specific valueof the adiabatic index γ is assumed here. It influences thedownstream evolution of relativistic electrons through n(a)which depends on γ (Sedov 1959).
APPENDIX B: APPROXIMATIONS FOR
DISTRIBUTIONS OF SOME PARAMETERS
BEHIND THE ADIABATIC SHOCK
Let us find approximations for dependence of some param-eter X ≡ X/X(R) on the Lagrangian coordinate a ≡ a/Rdownstream close to the adiabatic shock. We are interestedin approximations of the form
X (a) ≈ a κ (B1)
where, by definition,
κ =
[
− a
X∗(a)
∂X∗(a)
∂a
]
a=R
=
[
−∂ lnX∗(a)
∂ ln a
]
a=R
(B2)
and star marks the dependence given by the Sedov solution.This approach yields for density
n(a) ≈ aκna , κna =5γ + 13
(γ + 1)2, (B3)
for the relation between Eulerian and Lagrangian coordi-nates
c© 2010 RAS, MNRAS 000, 1–15
Tools for non-thermal images of SNRs 11
r ≈ a1/σ, ra ≈ (1/σ)a(1/σ)−1 (B4)
where the shock compression factor is
σ =γ + 1
γ − 1. (B5)
Note that the density distribution in Eulerian coordinates ismuch more sensitive to γ (Table B1):
n(r) ≈ rκnr , κnr = σκna =5γ + 13
(γ + 1)(γ − 1). (B6)
Magnetic field is approximately
B ≈ aβ(Θo,eff ), (B7)
β(Θo,eff) =β‖ cos
2 Θo + β⊥σ2 sin2 Θo
cos2 Θo + σ2 sin2 Θo
, (B8)
β‖ =4
γ + 1, β⊥ =
3γ + 11
(γ + 1)2. (B9)
Approximation for normalization K follows from the defini-tion (Appendix A)
K = a3b/2n(2+s)/3 (B10)
and approximation for n.Adiabatic losses are accounted with Ead(a) which is de-
fined by (A4). Its approximation is therefore
Ead(a) ≈ aκad , κad =5γ + 13
3(γ + 1)2, (B11)
it is valid for r > 0.8 with error less than few per cent. Thevalue of κad is close to unity for γ = 1.1÷ 5/3 (Table B1).
In order to approximate Erad defined by (A4), we sub-stitute (A2) with approximations for n and B. Then we usethe property
lima→1
(
a
f(a)
df
da
)
= cy (B12)
for function of the form f(a) = 1− cax(1− ay). In this way,
Erad(a, E) ≈ aκrad , κrad =5σ2
B(Θo)E
2Ef‖
. (B13)
This expression is good for r > 0.94, with error of few percent. It depends on γ through σ in σB which is (Reynolds1998)
σB =
(
1 + σ2 tan2 Θo
1 + tan2 Θo
)1/2
. (B14)
Note that dependence on the absolute value of the mag-netic field strength Bs‖ is present in (B13): Ef‖ ∝ B−2
s‖ . Thisapproximation clearly shows that the fiducial energy Ef isimportant parameter reflecting the ‘sensitivity’ to the ra-diative losses, as it shown by Reynolds (1998): the largerthe fiducial energy the smaller the radiative losses. In fact,Erad = 1 means no radiative losses at all, see (A4). An-other fact directly visible from Eq. (B13) is that radiativelosses are much more important at the perpendicular shock(σB = σ) than at the parallel one (σB = 1). Radiative lossesdepends rather strongly on the index γ: σ2
B = 16 for γ = 5/3but σ2
B = 49 for γ = 4/3.The values of parameters in approximations for different
adiabatic index γ are presented in Table B1.
Table B1. Parameters in approximations
Expression γ = 5/3 γ = 4/3 γ = 1.1
κna =5γ + 13
(γ + 1)23 3.6 4.2
κnr =5γ + 13
(γ + 1)(γ − 1)12 25 88
σ =γ + 1
γ − 14 7 21
β‖ =4
γ + 11.5 1.7 1.9
β⊥ =3γ + 11
(γ + 1)22.2 2.8 3.2
κad = κna/3 1 1.2 1.4
APPENDIX C: APPROXIMATE FORMULA
FOR THE AZIMUTHAL VARIATION OF THE
SYNCHROTRON X-RAY SURFACE
BRIGHTNESS IN SEDOV SNR
A formula obtained here may be useful in situations whenan approximate quantitative estimation for the azimuthalvariation of the synchrotron X-ray surface brightness is suf-ficient.
1. The emissivity due to synchrotron emission is
q(ε) =
∫
N(E)p(E, ε)dE (C1)
Spectral distribution of the synchrotron radiation power ofelectrons with energy E in magnetic field of the strength Bis
p(E, ν) =
√3e3B sinφ
mec2F(
ν
νc
)
, (C2)
where ν is frequency, νc = c1BE2 the characteristic fre-
quency. Most of this radiation is in photons with energyεp = 0.29hνc. In the ’delta-function approximation’, the spe-cial function F is substituted with
F(
ν
νc
)
= δ(
ν
νc− 0.29
)
∞∫
0
F (x)dx (C3)
where
∞∫
0
F (x)dx =8π
9√3. (C4)
With this approximation, (C1) becomes
q(ε) =4πe3 sinφ ε1/2B1/2
9mec2 0.29c1/21 h1/2
N(Em) (C5)
where Em is the energy of electrons which give maximumcontribution to synchrotron emission at photons with energyε: Em = ε1/2 (0.29hc1B)−1/2.
2. Let the energy of relativistic electrons is E in a givenfluid element at present time. Their energy was Ei at thetime this element was shocked. These two energies are re-lated as
E = EiEadErad (C6)
c© 2010 RAS, MNRAS 000, 1–15
12 Petruk O. et al.
where Ead accounts for the adiabatic losses and Erad for theradiative losses (Appendix A). There are approximationsvalid close to the shock (Appendix B):
Ead ≈ aκad , Erad ≈ a5σ2
BE/2Ef,‖ (C7)
where a = a/R, a is Lagrangian coordinate of the fluid ele-ment, Ef,‖ is the fiducial energy for parallel shock, κad de-pends on γ and is given by (B11); κad = 1 for γ = 5/3(for other γ see Table B1). The factor σB represents com-pression in the classical MHD (Reynolds 1998) but may beinterpreted also as amplification-plus-compression factor. Inthe latter case, it should be written in a way to be unity atparallel shock.
The downstream evolution of K in a Sedov SNR is (Ap-pendix A)
K ∝ ς(Θo)K(a) (C8)
where ς is injection efficiency. With the approximations (C7)and s close to 2, the distribution N(E) may be written from(A8) as
N(E,Θo) ∝ ς(Θo)K(a)E−s exp
[
−(
Ea−ψ(E,Θo)
Emax,‖Emax(Θo)
)α]
(C9)
where
ψ(E,Θo) = κad +5σB(Θo)
2E
2Ef,‖− 3q
2(C10)
and s is allowed to vary with E.3. Let us consider the azimuthal profile of the syn-
chrotron X-ray brightness S at a given radius from thecenter of the SNR projection.
Like in Paper II, we consider the ‘effective’ obliquityangle Θo,eff which, for a given azimuth, equals to the obliq-uity angle for a sector with the same azimuth in the plane ofthe sky (see details in Paper II). The relation between theazimuthal angle ϕ, the obliquity angle Θo,eff and the aspectangle φo is as simple as
cosΘo,eff (ϕ, φo) = cosϕ sinφo (C11)
for the azimuth angle ϕmeasured from the direction of ISMFin the plane of the sky.
The surface brightness of SNR projection at distance from the center and at azimuth ϕ is
S(¯, ϕ) = 2
∫ 1
a( ¯)
q(a)rrada
√
r2 − ¯2. (C12)
where ra is the derivative of r(a) in respect to a. The az-imuthal variation of the synchrotron X-ray brightness is ap-proximately
Sx ∝ ς(Θo,eff )σB(Θo,eff )(s+1)/2Irx(Θo,eff , ¯)
× exp
[
−
(
Ems(ε,Θo,eff )
Emax,‖Emax(Θo,eff )
)α] (C13)
where
Irx =
∫ 1
a( ¯)
KB(s+1)/2rra√
r2 − ¯2
× exp
[
−
(
Ems
Emax,‖Emax
)α(
a−αψ(Em)B−α/2 − 1)
]
da,
(C14)
reflects the dependence on ρ, Ems is Em for B = 1:
Ems(ε,Θo,eff) =
(
ε
0.29hc1BoσB(Θo,eff)
)1/2
. (C15)
Note, that Ems ∝ ε1/2, i.e. S depends in our approximationon the energy ε of observed X-ray photons.
4. Let us approximate Irx. First, we use the approxima-tions a ≈ rσ, KB(s+1)/2ra ≈ aκr/σ, which are valid closeto the shock (Appendix B), σ is the shock compression ra-
tio. Next, we expand r/√
r2 − ¯2 in powers of the smallparameter (r − 1) and consider the only first term of thedecomposition:
r√
r2 − ¯2≈ 1
√
1− ¯2. (C16)
The exponential term in the integral expands in powers ofthe small parameter (1− a):
exp(
−x1(a−x2 − 1)
)
≈ 1− x1x2(1− a). (C17)
In addition, Ems is used instead of Em.Close to the shock, the integral of interest is therefore
Irx(ϕ, ¯) ≈ Ir(ρ)Ix(ϕ, ¯) (C18)
where
Ir =1
σ√
1− ¯2
1− ¯σ(κr+1)
κr + 1, (C19)
Ix =
[
1− ǫαm(ψ + β/2)α
Eαmax
(
1− 1− ¯σ(κr+2)
1− ¯σ(κr+1)
κr + 1
κr + 2
)]
.(C20)
The parameter
ψ = κad +5σ2
Bǫm2ǫf‖
− 3q
2(C21)
is responsible for the losses of emitting electrons and thetime evolution of Emax on the shock. The value of κad israther close to unity for γ = 1.1 ÷ 5/3 (Table B1); unlessradiative losses (the second term in ψ) are negligible, onemay use κad ≈ 1 for any γ. Other parameters are
ǫm =Ems
Emax,‖
=(
ε
0.29σB
)1/2
, (C22)
β is given by Eq. (B8),
κr =3b
2+
2 + s
3κna +
s+ 1
2β +
1
σ− 1. (C23)
Parameters ψ, ǫm, σB, Emax and β depend on Θo,eff andtherefore on the aspect angle φo and the azimuth angle ϕ.
The parameter β reflects differences between MF dis-tribution downstream the shock of the different obliquity. Itvaries from β‖ at parallel shock to β⊥ at perpendicular one,Eq. (B8). In the approximate formulae, it appears in thecombination β/2; the role of β ∈ [β‖;β⊥] is minor in mod-ification of the approximate azimuthal and radial profiles.Therefore, in order to simplify the approximation, we maytake β/2 ≈ 1.
The index s in (C9), in general, is allowed to vary withE, e.g. to be s(E) = s + δs(E). In our approximation, dueto (C3), s reflects the ’local’ slope of the electron spectrumappropriate to ǫm. Therefore, if one assumes s(E) 6= const,the index s(ǫm) may vary with azimuth because ǫm varies,Eq. (C22).
c© 2010 RAS, MNRAS 000, 1–15
Tools for non-thermal images of SNRs 13
5. The final formula is
Sx(ϕ, ¯) ∝ ς(ϕ)σB(ϕ)(s+1)/2 exp
[
−(
ǫm(ϕ)
Emax(ϕ)
)α]
Irx(ϕ, ¯; ǫf‖)(C24)
where only Ix depends on ¯ and ǫf‖.The formula Eq. (C24) gives us the possibility to ap-
proximate both the azimuthal and the radial brightness pro-files of X-ray brightness for ¯ close to unity. It may be used(with a bit larger errors compared to the case of IC emis-sion; Fig. C1, cf. Fig. D1), for those azimuth ϕ where ǫm <∼ 1
and ǫf >∼ 0.1, in the range of ¯ from 1 − 2∆¯m to 1, where∆¯m = 1 − ¯m, ¯m is the radius where the maximum inthe radial profile of brightness happens. We have in mindthe maximum which is close to the shock, say ¯m > 0.95;therefore, in order to determine ¯m, one should look for theazimuth with the largest radiative losses. This is discussedin details on example of the IC emission in Sect. D.
Adiabatic index γ affects the approximation through σ,κr, κad.
APPENDIX D: APPROXIMATE FORMULA
FOR THE IC GAMMA-RAY SURFACE
BRIGHTNESS IN SEDOV SNR
In Paper II, we have developed an analytic approximationfor the azimuthal variation of the surface brightness of Se-dov SNR in γ-rays due to the inverse-Compton process,for regions close to the forward shock. The approximation,Eq. (11), in the cited paper accounts to zeroth order. How-ever, like in the case of the X-ray brightness, the fall of theγ-ray emissivity downstream of the shock is quite strong incase of the efficient radiative losses of electrons. Therefore,in such cases of the efficient losses we need to consider thenext order of approximation.
Adopting the approach from the Appendix C to ICemission (see also some details in Paper II), we come tothe approximation
Sic(ϕ) ∝ ς(Θo,eff) exp
[
−(
Em(ε)
Emax,‖Emax(Θo,eff)
)α]
Iic(Θo,eff , ρ)(D1)
where the energy Em of electrons which gives maximum con-tribution to IC emission at photons with energy ε is (e.g.Petruk 2009)
Em =mec
2ε1/2
2(kT )1/2, (D2)
T is the temperature of the black-body photons.The factor
Iic =
∫ 1
a( ¯)
Krrada√
r2 − ¯2exp
[
−(
Em
Emax,‖Emax
)α(
a−αψ − 1)
]
(D3)
is approximately
Iic(ϕ, ¯) ≈1
σ√
1− ¯2
1− ¯σ(κic+1)
κic + 1
×[
1− ǫαmψα
Eαmax
(
1− 1− ¯σ(κic+2)
1− ¯σ(κic+1)
κic + 1
κic + 2
)]
.
(D4)
where κic and σ comes from the approximations a ≈ rσ,Kra ≈ aκic/σ,
ψ = κad +5σ2
Bǫm2ǫf‖
− 3q
2, (D5)
ǫm =Em
Emax,‖
=ε1/2
2(kT )1/2γmax‖
, (D6)
κic =3b
2+
2 + s
3κna +
1
σ− 1. (D7)
The final formula is
Sic(ϕ, ¯) ∝ ς(ϕ) exp
[
−(
ǫmEmax(ϕ)
)α]
Iic(ϕ, ¯; ǫf‖) (D8)
It gives us the possibility to approximate both the azimuthaland the radial brightness profiles for ¯ close to unity.
D1 Accuracy of the approximation
Fig. D1 demonstrates accuracy of the approximation (D8)(left and middle panels show in fact the variation of Iicbecause both ς and Emax are constant there). Our calcu-lations may be summarized as follows: this approximationmay be used, with errors less than ∼ 30%, for those azimuthϕ where ǫm <∼ 1 and ǫf >∼ 0.1, in the range of ¯ from 1−2∆¯mto 1, where ∆¯m = 1 − ¯m, ¯m is the radius (close to theshock) where the maximum in the radial profile of bright-ness happens; in addition, approximation may not be usedfor ¯<∼ 0.9. If for some azimuth, the above conditions on ǫmand ǫf do not hold, the accuracy of approximation graduallydecreases because the role of the exponent in N(E) and ofthe radiative losses may not be described by the first termsin the decompositions used for derivation of the formula.
Let’s consider Fig. D1. The photon energy ǫm does notchange with azimuth for IC process. On the left panels,the reduced fiducial energy ǫf(ϕ) = ǫf‖/(Emaxσ
2B) >∼ 0.1 for
any azimuth: ǫf‖ = 3 at the parallel shock and ǫf⊥ = 0.19at the perpendicular shock. The approximation is accuratefor any azimuth, for 0.98 <∼ ¯ ≤ 1 at ϕ = 90o and for awider range of at ϕ = 0o. Middle panels on Fig. D1 showthe same case except of ǫf‖ = 1. At parallel shock (i.e.ϕ = 90o), the range for ¯ is smaller, 0.99 <∼ ¯ ≤ 1 (lowerpanel). Therefore, the approximation of the azimuthal pro-file for ¯ = 0.98 is inaccurate (upper panel, blue line), espe-cially for ϕ > 45o where ǫf decreases; it is ǫf⊥ = 0.06. Theazimuthal profile is however accurate for ¯ = 0.99 (blackline). Similar situation is for variable Emax (right panels onFig. D1). Emax⊥/Emax‖ = 3.25 for considered model, there-fore ǫf‖/ǫf⊥ = 52. Therefore, in order to obtain a repre-sentative approximation, the lowest possible ǫf‖ should beabout 0.1× 52 = 5.2. We see from the figure that accuracydecreases toward smaller ǫf (i.e. where the role of radiativelosses are very efficient in modification of the electron dis-tribution) and for smaller ¯.
In general, the accuracy of the approximation is bet-ter for larger ǫf and smaller ǫm. With decreasing of the as-pect angle φo, the accuracy of the approximations for theazimuthal profile increases at the beginning (because con-trasts in σB, ǫf and Emax are lower) and then decreasesagain, for the case of the quasi-parallel injection, becauseSNR becomes centrally-brightened while our approximationis developed for regions close to the edge of SNR.
c© 2010 RAS, MNRAS 000, 1–15

14 Petruk O. et al.
Figure C1. Azimuthal (upper panels) and radial (lower panels) profiles of the X-ray surface brightness Sx (solid lines) and its approx-imations (C24) (dahsed lines). Calculations are done for φo = 90o, b = 0, isotropic injection, γ = 5/3, s = 2, α = 1. Models of Emax:Emax = const (left and middle panels) and time-limited one with η = 1.5 (right panels). The reduced electron energy is ǫm = 1 and thereduced fiducial energy is ǫf‖ = 3 (left), ǫf‖ = 1 (middle), ǫf‖ = 5 (right panels).
Figure D1. Azimuthal (upper panels) and radial (lower panels) profiles of the IC surface brightness Sic (solid lines) and its approx-imations (D8) (dahsed lines). Calculations are done for φo = 90o, b = 0, isotropic injection, γ = 5/3, s = 2, α = 1. Models of Emax:Emax = const (left and middle panels) and time-limited one with η = 1.5 (right panels). The reduced electron energy is ǫm = 1 and thereduced fiducial energy is ǫf‖ = 3 (left), ǫf‖ = 1 (middle), ǫf‖ = 5 (right panels).
c© 2010 RAS, MNRAS 000, 1–15
Tools for non-thermal images of SNRs 15
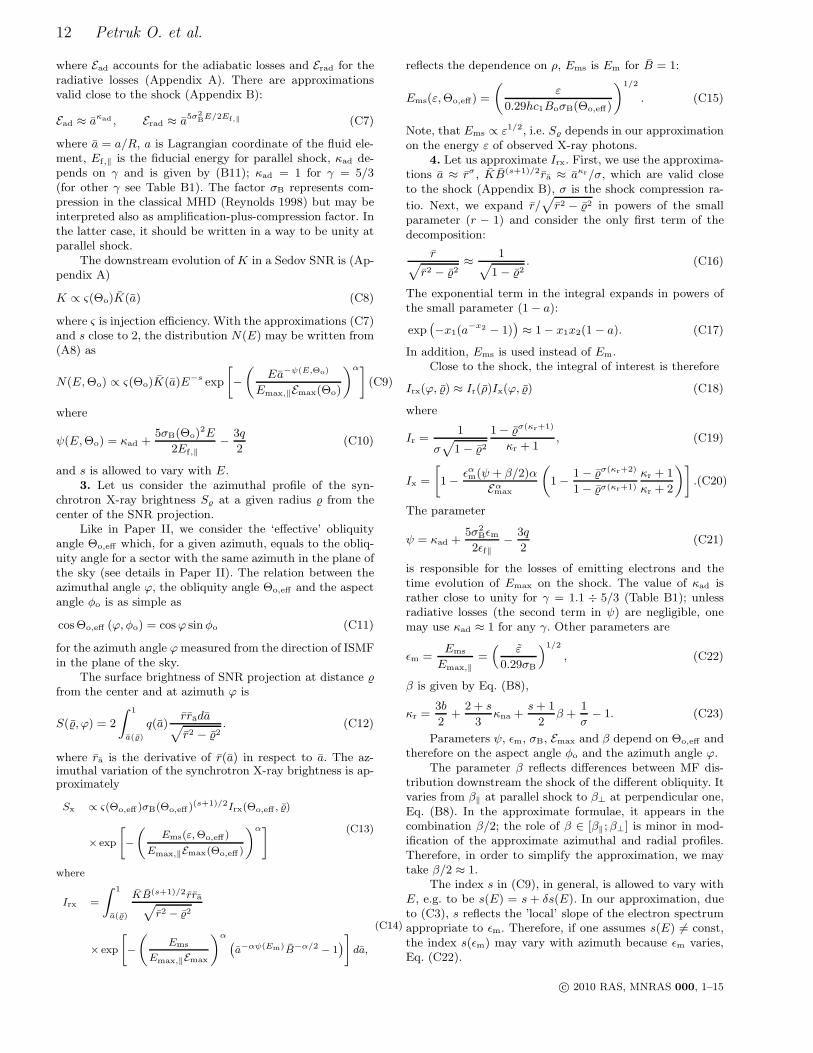
Figure D2. Radial profile of the radio brightness S (solid lines)and its approximation (C19) (dashed lines) for azimuth ϕ = 0o
(black lines) and ϕ = 90o (blue lines), φo = 90o. For smalleraspects, φo < 90o, the approximation agree better with the nu-merical profiles.
APPENDIX E: APPROXIMATE FORMULA
FOR THE RADIO SURFACE BRIGHTNESS IN
SEDOV SNR
An analytic approximation for the azimuthal variation of theradio surface brightness of Sedov SNR (Paper I) may be ex-tended to allow also for a description of the radial variationclose to the forward shock. Namely, the correction consistsin a factor Ir:
Sr(ϕ, ¯) ∝ ς(ϕ)σB(ϕ)(s+1)/2Ir(¯) (E1)
where Ir is the same as for the X-ray approximation (C18).Accuracy of this approximation for the radial profile ofbrightness is demonstrated on Fig. D2 and on Fig. 2 in Pa-per I for the azimuthal profiles. Ir varies with azimuth lessthan 10% (cf. e.g. black and blue dashed lines on Fig. D2).This variation is due only to β(Θo). Thus, β may be takenconstant with a good choice β/2 = 1 (see also Appendix C).
The smaller φo, the smaller differences between the ra-dial profiles for azimuth ϕ = 0o and 90o (black and bluesolid lines approach one another with decrease of the aspectangle).
c© 2010 RAS, MNRAS 000, 1–15