
AGN Activity and Black Hole Masses in Low Surface Brightness Galaxies
27
arXiv:1108.0763v1 [astro-ph.CO] 3 Aug 2011 Mon. Not. R. Astron. Soc. 000, ??–?? (2006) Printed 4 August 2011 (MN L A T E X style file v2.2) AGN Activity and Black Hole Masses in Low Surface Brightness Galaxies S. Ramya 1 ⋆ , T. P. Prabhu 1 †, M. Das 1,2 ‡ 1 Indian Institute of Astrophysics, Koramanagala, Bangalore-34, India. 2 Birla Institute of Technology and Science - Pilani, Hyderabad Campus, Jawahar Nagar, Shameerpet Mandal, Hyderabad, 500078, India. Received / Accepted ABSTRACT We present medium resolution optical spectroscopy of a sample of nine Low Surface Brightness (LSB) galaxies. For those that show clear signatures of AGN emission, we have disentangled the AGN component from stellar light and any Fe i and Fe ii contribution. We have decomposed the Hα line into narrow and broad components and determined the velocities of the broad components; typical values lie between 900–2500 km s −1 . Of the galaxies in our study, UGC 6614, UGC 1922, UGC 6968 and LSBC F568-6 (Malin 2) show clear signatures of AGN activity. We have calcu- lated the approximate black hole masses for these galaxies from the Hα line emission using the virial approximation. The black hole masses are ∼ 3 × 10 5 M ⊙ for three galaxies and lie in the intermediate mass black holes domain rather than the super- massive range. UGC 6614 harbors a BH of mass 3.8 × 10 6 M ⊙ ; it also shows an interesting feature blueward of Hα and Hβ implying outflow of gas or a one-sided jet streaming towards us. We have also measured the bulge stellar velocity dispersions using the Ca ii Triplet lines and plotted these galaxies on the M − σ plot. We find that all the three galaxies UGC 6614, UGC 6968 and F568-6 lie below the M − σ relation for nearby galaxies. Thus we find that although the bulges of LSB galaxies may be well evolved, their nuclear black hole masses are lower than those found in bright galaxies and lie offset from the M − σ correlation. Key words: galaxies : Low surface brightness; active galactic nuclei. ⋆ E-mail : [email protected] (SR) † E-mail : [email protected] (TPP) ‡ E-mail : [email protected] (MD)
-
Upload
independent -
Category
Documents
-
view
3 -
download
0
Transcript of AGN Activity and Black Hole Masses in Low Surface Brightness Galaxies

arX
iv:1
108.
0763
v1 [
astr
o-ph
.CO
] 3
Aug
201
1
Mon. Not. R. Astron. Soc.000, ??–?? (2006) Printed 4 August 2011 (MN LATEX style file v2.2)
AGN Activity and Black Hole Masses in Low Surface
Brightness Galaxies
S. Ramya1⋆, T. P. Prabhu1†, M. Das1,2‡1 Indian Institute of Astrophysics, Koramanagala, Bangalore-34, India.
2 Birla Institute of Technology and Science - Pilani, Hyderabad Campus, Jawahar Nagar, Shameerpet Mandal, Hyderabad, 500078, India.
Received/ Accepted
ABSTRACT
We present medium resolution optical spectroscopy of a sample of nine Low Surface
Brightness (LSB) galaxies. For those that show clear signatures of AGN emission,
we have disentangled the AGN component from stellar light and any Fei and Feii
contribution. We have decomposed the Hα line into narrow and broad components
and determined the velocities of the broad components; typical values lie between
900–2500 km s−1. Of the galaxies in our study, UGC 6614, UGC 1922, UGC 6968
and LSBC F568-6 (Malin 2) show clear signatures of AGN activity. We have calcu-
lated the approximate black hole masses for these galaxies from the Hα line emission
using the virial approximation. The black hole masses are∼ 3 × 10⁵ M⊙ for three
galaxies and lie in the intermediate mass black holes domainrather than the super-
massive range. UGC 6614 harbors a BH of mass 3.8 × 10⁶ M⊙; it also shows an
interesting feature blueward of Hα and Hβ implying outflow of gas or a one-sided jet
streaming towards us. We have also measured the bulge stellar velocity dispersions
using the Caii Triplet lines and plotted these galaxies on theM − σ plot. We find
that all the three galaxies UGC 6614, UGC 6968 and F568-6 lie below theM − σ
relation for nearby galaxies. Thus we find that although the bulges of LSB galaxies
may be well evolved, their nuclear black hole masses are lower than those found in
bright galaxies and lie offset from theM − σ correlation.
Key words: galaxies : Low surface brightness; active galactic nuclei.
⋆ E-mail : [email protected] (SR)† E-mail : [email protected] (TPP)‡ E-mail : [email protected] (MD)
2 S. Ramya et al.
1 INTRODUCTION
Low Surface Brightness (LSB) galaxies are an extreme class of late type spiral galaxies (Impey & Bothun
1997). They are poor in star formation (Boissier et al. 2008;O’Neil et al. 2004), have low metal-
licities (McGaugh 1994) and low dust masses (Rahman et al. 2007; Hinz et al. 2007). However,
they are gas rich (Hi) and their Hi disks are far more extended than their diffuse stellar disks
(O’Neil et al. 2004). Their disks have weak spiral arms and their bar perturbations are not as
prominent as those seen in bright galaxies. This low level ofdisk activity can be attributed to
the presence of dark matter halos (de Blok et al. 2001) that tend to prevent the formation of disk
instabilities (Mayer & Wadsley 2004; Mihos et al. 1997; Galaz et al. 2011). Surveys show that al-
though LSB galaxies are common in our local universe they arepreferentially found in low density
environments (Rosenbaum et al. 2009) and can have widely varying morphologies; starting from
the populous dwarf LSB galaxies (Schombert et al. 2001) to the giant LSB galaxies (GLSB), of
which Malin 1 is a good example (Pickering et al. 1997).
Although a lot of work has been done towards understanding the stellar and gas content of
LSB galaxies, not much is known about their nuclear activityor central black hole (BH) masses.
A significant fraction of GLSB galaxies have active galacticnuclei (AGN) that are often asso-
ciated with massive bulges (Schombert 1998; Impey et al. 2001). The AGN may be radio bright
(Das et al. 2009a) and visible at X-ray wavelengths as well (Naik et al. 2010; Das et al. 2009b). It
is now well established that the black hole masses in galaxies are correlated with their bulge veloc-
ity dispersions (M −σ) and bulge luminosities (M − L) (Ferrarese & Merritt 2000; Gebhardt et al.
2000) which suggests that black hole formation, galaxy evolution and AGN activity are all in-
terlinked (Schawinski et al. 2010; Somerville et al. 2008; Merloni & Heinz 2008). However, the
M − σ and M − L relations show less scatter when only ellipticals and earlytype galaxies are
included (Gultekin et al. 2009). Late type spirals introduce more scatter in the correlations. This
may be due to a larger intrinsic scatter in the BH masses of late type spirals or simply measurement
uncertainities since late type spirals, in general, have smaller bulges. They also show weaker AGN
activity compared to the earlier type galaxies (Ho 2008). Alternatively, In a study by Beifiori et al.
(2009) involving HST observations of 105 nearby galaxies spanning a wide range of Hubble types
from ellipticals to late-type spirals, the estimated blackhole masses upper limits appear to lie
closer to the expected black hole masses in the most massive elliptical galaxies with values ofσ
above 220 km/s than for galaxies withσ in the range 90-220 km s−1which appears to be consistent
with a coevolution of supermassive black holes and galaxiesdriven by dry mergers.

AGN Activity and Black Hole Masses in Low Surface BrightnessGalaxies 3
It is not clear where LSB galaxies lie on theM −σ plot. Their bulge velocity and disk rotation
speeds suggest that they lie below theM − σ correlation for bright galaxies (Pizzella et al. 2005).
X-ray studies also suggest that GLSB galaxies do not lie on the radio-x-ray correlation (Das et al.
2009b) and their black hole masses maybe quite low (Naik et al. 2010). In this paper we use de-
tailed optical spectroscopy to determine the position of a sample of LSB galaxies on theM − σ
diagram. We observed the nuclear spectra of several bulge dominated LSB galaxies; for galaxies
that showed AGN emission, we estimated both the black hole masses and also the bulge veloc-
ity dispersion. In the following sections we present our observations, the results and discuss the
implications of our findings.
2 SAMPLE SELECTION
Our sample consists of nine large, bulge dominated LSB galaxies from Schombert & Bothun
(1987), of which eight have been observed further by Schombert (1998). The basic parameters
of the galaxies are listed in Table 1. The LSB galaxies in the Schombert sample were all Hi rich,
giant, spiral galaxies that were derived from the UGC catalogue; they have systemic velocities that
are less than 15, 000 km s−1. We chose a subset of eight nearby galaxies from that sample that had
vsys≤ 10, 000 km s−1 and appear to be bulge dominated galaxies with LSB disks. Thelast galaxy
in our list, F568-6 (or Malin 2), has been observed by Sprayberry et al. (1995) and is also bulge
dominated. The properties of individual galaxies are summarized below.
UGC 1378: This galaxy has a prominent bulge and a diffuse stellar disk. It is classified as an LSB
galaxy with an active nucleus by Schombert (1998). The bulgeshows diffuse x-ray emission, pos-
sibly associated with an old stellar population (Das et al. 2009b).
UGC 1922: The disk of this galaxy is featureless but has a bright bulge that also shows diffuse
x-ray emission. It is classified as an LSB galaxy with an active nucleus by Schombert (1998).
UGC 1922 is also one of the few LSB galaxies that have a significant concentration of molecular
gas (O’Neil & Schinnerer 2003).
UGC 3968: Not much is known about this LSB galaxy except that it has a prominent bulge with a
faint disk. The 2MASS image reveals a bar associated with thebulge and two faint spiral arms. It
is also classified as an LSB galaxy by Schombert (1998) but it is not clear whether the galaxy has
an AGN.
UGC 4219: Not much is known about this giant LSB galaxy either. According to Schombert
(1998), the galaxy has a large bulge and an AGN. The LSB disk shows faint spiral arms.
4 S. Ramya et al.
UGC 6614: This is a well studied giant LSB galaxy (de Blok et al. 1995a).It is close to face
on in morphology and has a large bulge surrounded by a ring like feature (Rahman et al. 2007,
Hinz et al. 2007). The disk has faint but tightly wound spiralarms (Pickering et al. 1997). The
bulge hosts an AGN that is bright at optical (Schombert 1998), radio (Das et al. 2006) and x-ray
(Naik et al. 2010) wavelengths.
UGC 6754: This galaxy has an LSB disk (Schombert & Bothun 1987) and a prominent bulge but
does not appear to have an AGN (Schombert 1998). The disk has flocculent spiral arms and only
patchy star formation (Amram et al. 1994).
UGC 6968: Not much is known about this galaxy but it is described as an LSB galaxy having a
prominent bulge and an AGN (Schombert 1998). There are two faint spiral arms extending out
into the disk.
UGC 7357: This galaxy has an LSB disk (MacArthur et al. 2003) and a bright bulge. But does not
appear to have an AGN (Schombert 1998). The disk is fairly featureless.
F568-6 (Malin 2): This is also a relatively well studied giant LSB galaxy. It has an LSB disk
(Schombert & Bothun 1987), prominent bulge and an AGN (Schombert 1998). Like UGC 1922,
it is one of the rare LSB galaxies that have a significant mass of molecular gas (Das et al. 2010).
3 OBSERVATIONS AND DATA REDUCTION
3.1 HCT Data :
The LSB galaxies were observed using the 2m Himalayan Chandra Telescope (HCT) at the Indian
Astronomical Observatory (IAO), Hanle, which is remotely controlled from the Centre for Re-
search and Education in Science and Technology (CREST), Indian Institute of Astrophysics (IIA),
Bangalore. The spectra were obtained using a 11′ × 1.′′92 slit (#167l) in combination with a grism
#7 (blue region) and grism #8 (red region) which cover the wavelength ranges of 3700–7200 Å
and 5500–9000 Å with dispersions of 1.46 Å pixel−1 and 1.26 Å pixel−1 respectively. The spectral
resolution is around∼ 8.7 Å (398 km s−1 FWHM or σ = 169 km s−1 at Hα) for grism #7 and∼ 7
Å ( σ = 136 and 103 km s−1 at Hα and Caii Triplet respectively) for grism #8. The slit was placed
at the centre of the galaxy covering a central region of∼ 2′′ × 5′′ (1′′ corresponds to 415 pc at a
redshift of∼ 0.03).
Data reduction was carried out using the standard tasks available within IRAF1 which includes
1 Image Reduction & Analysis Facility Software distributed by National Optical Astronomy Observatories, which are operated by the Association
of Universities for Research in Astronomy, Inc., under co-operative agreement with the National Science Foundation

AGN Activity and Black Hole Masses in Low Surface BrightnessGalaxies 5
bias subtraction, extraction of one dimensional spectra, wavelength calibration using the ferrous
argon lamp for grism #7 and ferrous neon lamp for grism #8. Thewavelength calibrated spectra
were flux calibrated using one of the spectroscopic standards of Oke (1990) observed on the same
night and then corrected for the redshifts of the galaxies. Flux calibrated spectra were corrected for
galactic extinction using Schlegel et al. (1998). The spectra were not corrected for intrinsic dust
extinction because LSB galaxies are known to have intrinsically less dust (Greene & Ho 2007;
Mei et al. 2009). The blue and the red spectra were combined together with the help ofscombine
within specredpackage using a suitable scale factor estimated at the flat continuum portions of
the overlapping part of the spectra. A log of the observations are presented in Table 2 and the flux
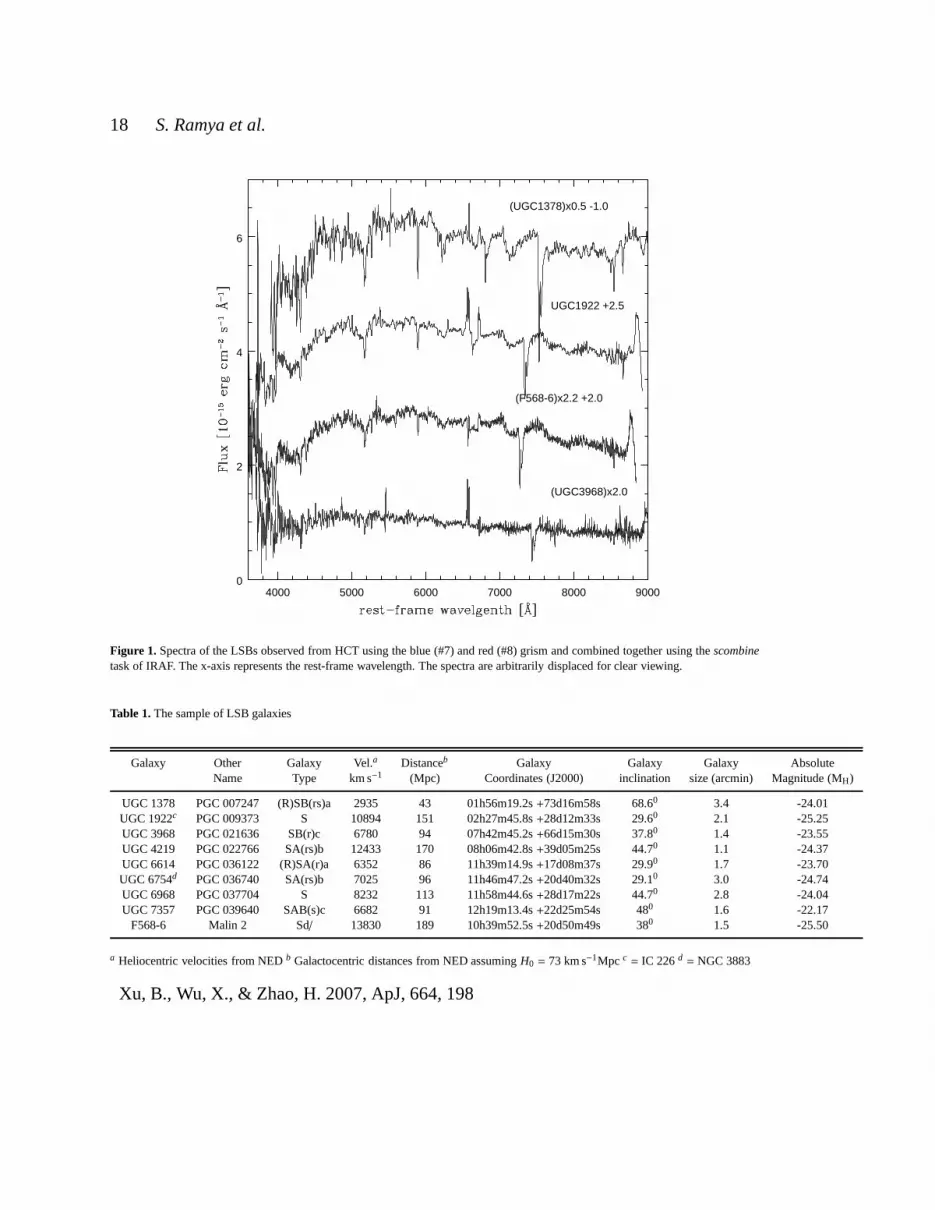
calibrated HCT spectra are plotted in Figure 1. We have used the HCT observations to identify the
LSB galaxies that host AGN activity. The black hole masses and bulge velocity dispersions were
determined using SDSS data for all but one of these galaxies.
3.2 SDSS DR7 Data :
Our pilot project on LSB galaxies was started in the year 2006wherein careful selection of objects
for which SDSS data were unavailable was considered. But when the DR7 data was released to
the astronomy community, we found that a few galaxies from our sample were included. The
resolution of the SDSS data is better (∼ 70 km s−1). Due to this, we have used SDSS DR7 data
of our sample LSB galaxies for modeling/estimating the BH masses and velocity dispersions. For
measuring the stellar velocity dispersion, SDSS offers a set of about 32 spectra of giant G and
K stars of old open cluster M67. The stellar templates were observed in an identical manner as
the SDSS LSB spectra and hence effects arising due to template mismatch are minimal. SDSS
spectra are observed through a fiber of 3′′ diameter which transforms into an area of 2.9 kpc
diameter for a redshift of z∼ 0.021. This area includes sufficient stellar light, nevertheless with
stellar templates observed in the same setup, most of the stellar light would be removed after
decomposition. In comparison, HCT spectra cover an area of∼ 5.4×13.5 kpc at the same redshift
and the stellar templates were not observed in the same setup. Thus, for the estimation of BH
masses after decomposing the broad and narrow components inthe Hα region, and for the stellar
velocity dispersion, we use SDSS spectra to give a conservative estimate of the above parameters.

6 S. Ramya et al.
4 SPECTRAL DECOMPOSITION
The emission lines appear weak in our sample, but the Hα emission line is clearly present in several
of the galaxies. In order to isolate the Balmer and major nebular emission lines better, we have
decomposed the observed spectrum into different constituents. Major contribution to the observed
spectra arises from the underlying stellar population, andwe use high-resolution model spectra
of Starburst99 (Leitherer et al. 1999) after degrading it tothe resolution of the observed spectra.
While a composite spectrum based on stellar spectral libraries would have been more realistic,
Starburst99 is simpler to use. The decomposition was executed only up to the wavelength of 7000
Å as the Starburst99 high resolution model spectra are available only upto the above mentioned
wavelength.
The [Nii] λ 6584 and [Oiii] λ 5007 lines along with Hα and Hβ lines are used to calculate
oxygen abundance assuming the empirical relation obtainedby Pettini & Pagel (2004). The oxy-
gen abundances and hence metallicities are close to solar invalue, particularly for F568-6 and
UGC 6614 (see also McGaugh (1994) for UGC 6614). The exception is the galaxy UGC 7357
which may have metallicity slightly less than solar. We havehence adopted solar abundances in
applying the Starburst99 model. The method of Mei et al. (2009) was used for decomposition of
stellar light, along with emission from the Fei and Feii complexes, and in a few cases, a power
law component. We use Veron-Cetty et al. (2001) spectra of IZw 1 to model the Fei and Feii
complexes. Levenberg-Marquardt algorithm (Press et al. 1993) was used for the decomposition.
Figure 2 shows the decomposed spectra plotted at the bottom of each plot. These spectra now
show only the gas emission due to star formation and/or the active nucleus.
According to Schombert (1998), in their sample of LSB galaxies, 95% showed nuclear emis-
sion. Our sample consists of bulge dominated LSB galaxies and is a subset of the Schombert
sample. Out of the 9 galaxies observed, we find that only 4 galaxies show broad Hα profiles emis-
sion, along with strong emissions from [Nii], [S ii], [O iii] and ø, which hint the presence of an
AGN. The line fluxes of various lines are presented in Table 3.We have adopted SDSS spectra
for estimating the fluxes of broad and narrow components of Hα and hence in the calculation of
BH masses, as well as stellar velocity dispersions. The SDSSspectra were taken through a fiber
aperture of 3 arcsec in diameter (corresponding to 2.9 kpc ata redshift of 0.05). The broad and
narrow components of Hα are seperated using thefitprofs task of IRAF. Figure 3 shows the fits
to the Hα line profiles. The broad Hα line in AGN spectra are generally asymmetric. The above
procedure of multiple Gaussian fit results in slightly larger errors due to this. The Hα fluxes for

AGN Activity and Black Hole Masses in Low Surface BrightnessGalaxies 7
broad and narrow components, Hα luminosity, full width at half maximum (FWHM) of the broad
Hα lines are all listed in Table 3.
We have adopted the penalized-pixel fitting (pPxF) algorithm of Cappellari & Emsellem (2004)
for recovering the stellar velocity dispersion. pPxF is gauss-hermite parametrization (van der Marel & Franx
1993, Gerhard 1993) that works in the pixel space. The reasonis that in pixel space, it is easy to
mask gas emission lines or bad pixels from the fit and the continuum matching can be directly
taken into account (Cappellari & Emsellem 2004). Also, the estimation of measurement errors are
simplified. PPxF creates an algorithm, wherein, initial guesses for V (redshift, z) andσ are pro-
vided. The model spectra are convolved with a broadening function using initialσ values.χ2 is
calculated for each dataset. The residuals orχ2 for each of the data points is perturbed and fed into
a non-linear least squares optimization routine, in this case, monte-carlo optimization. The whole
procedure is iterated to obtain V,σ and gauss-hermite polynomials. The estimation of gauss-
hermite polynomials becomes a problem if the observed velocity dispersion is of order 2 pixels
orσ < 140 km s−1 (1 pix= 70 km s−1 for SDSS data). A detailed explanation of the procedure can
be obtained from Cappellari & Emsellem (2004).
With the availability of libraries with high spectral resolution stellar and galaxy spectra, tem-
plates can be carefully matched with the observed galaxy spectra. The 32 G and K giant stars of
old open cluster M67 observed with the SDSS are used as stellar templates. Empirically, early K
giants consistently provide the closest match to both the Mgib and Caii Triplet regions of many
AGN samples. Here, we have tried to measure the stellar velocity dispersion by fitting the Caii
Triplet lines for these galaxies UGC 6614, UGC 6968 and F568-6. According to Greene & Ho
(2007), the optimal spectral region for measuringσ depends on the Eddington ratio, continuum
level of the AGN, and redshift of interest which suggests that for z< 0.05, Caii Triplet is the region
of choice for Eddington ratio≤ 0.5 for the most reliable measurement ofσ. The pPxF code was
applied to only Caii Triplet region to estimateσ. Figure 4 displays the fits to the data; fitting error
of ∼ 10% is estimated from the residuals.
5 AGN ACTIVITY AND BLACK HOLE MASSES
5.1 Emission Line Diagnostic Diagram
It is interesting to investigate the positions occupied by these LSB galaxies in the BPT diagnos-
tic diagram (first given by Baldwin et al. 1981 and improved further by Veilleux & Osterbrock
1987, Kewley et al. 2001, Kewley et al. 2006 and references therein). Figure 5 shows the diagnos-

8 S. Ramya et al.
tic diagrams plotted for [Oiii]/Hβ vs. [N ii]/Hα, [S ii]/Hα and ø/Hα respectively. Also plotted in
these diagrams are the demarcation lines between starbursts, Seyferts and LINERS obtained from
Kewley et al. 2001, Kauffmann et al. 2003, Kewley et al. 2006. From the plots, four galaxies ap-
pear strong candidates for AGN, showing LINER-like activity. Of these, the galaxies F568-6 and
UGC 6614 also show a high value of [Oiii]/Hβ∼1.5 when compared to other galaxies in the sam-
ple and could be Seyfert-like. It may be noted that the [Oiii]/Hβ ratio for low-mass AGNs selected
from SDSS is 1.9 for one kind of sample (Greene & Ho 2007). The width of the broad Hα lines
observed in these galaxies is below∼ 2000 km s−1 indicating that they both belong to the class of
narrow-line Seyfert 1s (NLS1s) galaxies.
5.2 Stellar Velocity Dispersion σ∗
The stellar velocity dispersionσ∗ is measured using the Caii Triplet lines adopting the pPxF code
of Cappellari & Emsellem (2004). We could detect the Caii Triplet lines at 8542 Å and 8662 Å
in some of our galaxies such as UGC 6614 and F568-6. Hoever, due to template mismatch, we
could not estimate theσ∗ using the HCT spectra. Hence we used the SDSS spectra for measuring
σ∗. The spectral resolution of SDSS spectra are about 4 Å, whichamounts to a velocity width of
about 140 km s−1 andσ = 70 km s−1. The derived values for UGC 6614, UGC 6968 and LSBC
F568-6, are in the range 150–210 km s−1. The SDSS spectrum is not available for the galaxy UGC
1922 and hence we could not estimate the stellar velocity dispersion for this galaxy. We estimate
σ∗ ∼ 157,∼ 196 and∼ 209 km s−1 for UGC 6614, UGCC 6968 and f568-6, respectively using
SDSS spectra. These values are shown in Table 4. Figure 4 shows the fits to the observed data
obtained using the pPxF code.
There is some discussion in the literature on the need to reduce the observed stellar velocity
dispersions to a uniform system, since the observed values are averaged over the slit or aperture
size which will translate into different sizes on the face of the galaxy with respect to the bulge
scale length. Jorgensen et al. (1995) transform the values to the equivalent of an aperture of radius
re/8, wherere is the effective bulge radius. The effective bulge radius is about 4.′′2 for UGC 6968 as
calculated by Gavazzi et al. (2000) using near-IRH band image of the galaxy. Though McGaugh
(1994) have attempted only to fit the disk, the bulge is visible in their surface brightness profile
plots for the galaxies UGC 6614 and F568-6. de Blok et al. (1995b) have also obtained the surface
brightness profile for UGC 6614 and fit only the disk. The effective bulge radius re for the galaxies
UGC 1922, UGC 6614 and F568-6 are not available in the literature. On the other hand, as pointed

AGN Activity and Black Hole Masses in Low Surface BrightnessGalaxies 9
out by Ferrarese & Merritt (2000), the applied corrections for the velocity dispersionσ∗ are very
small, the maximum correction being< 5%. Greene & Ho (2005) and Pizzella et al. (2004) find
that radial dependence ofσ∗ is flat with less than 7% correction for early-type galaxies.Following
these arguements, we have not applied any correction based on re to σ∗, the spectra are extracted
from a region of 2′′ × 5′′.
5.3 The Mass of Central Black Hole (MBH)
The blackhole masses are calculated using the equation given in Greene & Ho (2007) using Hα
luminosity and FWHM. The masses are∼ 0.3 × 10⁶ M⊙ for the galaxies UGC 1922, UGC 6968
and F568-6, and lie on the lower mass tail of the low-mass blackhole sample of Greene & Ho
(2007) which has a median mass of 1.3 × 10⁶ M⊙. UGC 6614 has a slightly higher BH mass of
3.8 × 10⁶ M⊙. The averageLbol/LEdd ratio calculated for their sample is about 0.4 and suggests
that their sources are radiating at high fraction of Eddington limit (Greene & Ho 2007). We find
the values of 0.18, 0.023, 0.046 and 0.106 for UGC 1922, UGC 6614, UGC 6968 and F568-
6 respectively. While these are lower compared to the medianfor the sample of Greene & Ho
(2007), they are within their observed range.
We could identify clear signature for AGN in 4 out of 9 objectsin our sample which agrees
with the high (50%) occurrence of AGN found by Schombert (1998) in LBGs.
5.4 Interesting case of UGC 6614
The emission line spectra of UGC 6614 obtained after the decomposition of stellar light shows an
interesting feature. A bump is noticed at the blueward of theHα emission from the galaxy. This
blue bump is noticeable in the observed flux calibrated spectra before spectral decomposition but
is clearly seen after the decomposition. The blue bump is theexcess emission at Hα which could
be arising from ionised gas travelling at speeds∼ 3600 km s−1 towards us, centered at 3920 km s−1.
The blue bump is also noticed blueward of Hβ and the velocities with which the gas streaming out
towards us∼ 3600 km s−1 (median value of Hα and Hβ) centered at 3360 km s−1 from Hβ, similar
to Hα. This emission at Hα and Hβ wavelengths overlap indicating the feature to be real as shown
in Figure 6. Das et al. (2009a) detected a compact core and a one-sided radio jet in UGC 6614
from 610 MHz map. An extended feature is also indicated in a low resolution VLA map at 1420
MHz (Das et al. 2009a). The blue shifted ionized gas emissioncould indicate a jet or hotspot along
10 S. Ramya et al.
the line-of-sight. Similar asymmetric blue bump of the [OIII] lines were detected from a bunch of
Type 1 - Type 2 Seyferts from SDSS DR2 sample by Greene & Ho (2005). These wings indicate
radial motions in the NLR, associated with an outflow. The outflowing components are principally
responsible for imparting supervirial motions to the gas and originate from a more compact region
closer to the centre (Greene & Ho 2005).
5.5 The MBH − σ∗ Plot
The Caii Triplet line widths and masses of blackholes for the three galaxies in our sample are
shown in theMBH − σ∗ plot in Figure 7. Also plotted in the figure are the linear regression
lines given by Gultekin et al. (2009), Tremaine et al. (2002) and Ferrarese & Ford (2005) (dot-
ted, dashed and solid lines respectively) forMBH againstσ∗. The low-mass AGNs hosted within
LSB galaxies occupy the region just below the lowest mass blackhole of Circinus galaxy from
the sample of Gultekin et al. (2009), well below extrapolations of high-mass blackholes. On the
other hand, three AGNs in LSBs observed by Mei et al. (2009) inthe blackhole mass range of
2.8− 20× 106 M⊙ lie closer to the Tremaine et al. (2002) relation, though systematically lower. It
would be of interest to study more LSBGs and low luminosity AGN of Greene & Ho (2007) for a
better understanding of faint luminosity end ofMBH − σ∗ relation.
6 DISCUSSION
1. Intermediate Mass Black Hole (IMBH) in GLSB galaxies: One of the main results of our
spectroscopic study is the detection of broad Hα emission in GLSBs and the subsequent estimation
of nuclear black hole masses from SDSS spectra in bulge-dominated GLSB galaxies. The AGNs
fall in Seyfert-LINER region in the diagnostic diagram (refer figure 5).
We obtained masses∼ 3 × 10⁵ M⊙ for three GLSB galaxies in our sample, which fall in the
IMBH range rather than the SMBH range. A higher blackhole mass is estimated for UGC 6614
which is∼ 3.8 × 10⁶ M⊙ and a similar estimate was given earlier by Das et al. (2009b)based on a
low resolution optical spectrum from Sprayberry et al. (1995). Another estimate of∼ 1.2×10⁵ M⊙
was derived later from AGN X-ray variability studies by Naiket al. (2010), which is lower than
the present estimate. It must be borne in mind that these estimates are fairly approximate as they
are based on the assumption that the gas in the broad line region in the AGN is in virial equilibrium
(Kaspi et al. 2000).
IMBHs are fairly rare in the galactic nuclei and have been detected mainly in late type spi-
AGN Activity and Black Hole Masses in Low Surface BrightnessGalaxies 11
rals (Filippenko & Ho 2003; Greene & Ho 2004; Satyapal et al. 2007), nearby galaxies (Seth et al.
2010) or dwarf galaxies (Barth et al. 2004). They are difficult to detect dynamically at large dis-
tances; hence AGN activity is one of the main methods throughwhich we detect them. The pres-
ence of IMBHs in GLSB galaxies is surprising as their bulges are well developed; in fact a SMBH
would be far more typical for these bulges. This suggests that the lack of disk evolution in these
extreme late type galaxies has affected the evolution of their nuclear BHs. Galactic disk activity
contributes to the growth of SMBHs through gas inflow, star formation and mass accumulation in
the nuclei of spiral galaxies as observed in bulge dominated, star forming early type spirals. Large
scale disk instabilities such as bars and spiral arms exert gravitational torques that funnel gas into
galaxy centers leading to nuclear star formation and the build-up of central mass concentrations
(e.g. Friedli & Benz 1993). This can result in the growth of nuclear black holes and bulges in
galaxies (Kormendy & Kennicutt 2004). This process of disk evolution leading to the growth of
central mass concentrations in galaxies is prevented from happening or slowed down when there is
a dominant dark matter halo (Ostriker & Peebles 1973). Thus,the lack of disk evolution and rela-
tively low mass of the black hole may share the same origin - which is the presence of a dominant
dark halo in the galaxy.
2. Constraining the M − σ relation for extreme late type galaxies: In the past ten years
the M − σ andM − L relations have become established benchmarks for galaxy and BH evolu-
tion theories. Our present work affects these correlations in two ways; first it helps constrainthe
low mass end of theM − σ correlation and secondly it helps to constrain the scatter in the plot
(Gultekin et al. 2010). The low mass end of theM − σ relation is populated by late type galaxies
or dwarf galaxies; many are often outliers in the plot. Our present work shows that extreme late
type galaxies are also fairly offset from the mainM −σ line (Figure 7). It also suggests that dwarf
galaxies and extreme late type galaxies have different evolutionary paths compared to early type
galaxies and the more massive ellipticals at the high SMBH end of theM − σ relation. Models of
galaxy evolution thus need to incorporate late type systemssuch as GLSB galaxies in their overall
picture.
The late type spirals also increase the scatter in the correlation which is tighter when only
ellipticals and early type spirals are included (Tremaine et al. 2002, Beifiori et al. 2009). Many
theoretical studies have been undertaken to explain theM−σ correlation and predict the high mass
end of the plot (Natarajan & Treister 2009). Dalla Bonta et al. (2009) carried out HST observations
of three brightest cluster galaxies (BCGs) and estimated masses of SMBHs to be∼ 109 M⊙ present
in these BCGs. While for one galaxy, SMBH mass correlates well in theM−σ andM−L plot at the
12 S. Ramya et al.
high mass end, the other two galaxies show inconsistencies with the two relations. The sample is
small to derive any conclusions, but hints that there could be scatter in the SMBH scaling relations
at the high mass end as well (Dalla Bonta et al. 2009).
However the low mass end does not appear to have a clear cutoff according to most models
(Volonteri & Natarajan 2009). In fact, we could be missing observationally a large fraction of the
lower mass BHs in the centres of galaxies. Thus there is an increase in the scatter at the low mass
end of the correlation. This scatter could be due to measurement errors or could be intrinsic to
the BH evolution processes in the galaxies, themselves (Volonteri 2007). Our present study is thus
important for understanding the overall trends in the low mass end of the BH mass spectrum.
3. AGN evolution in late type galaxies: Studies have shown that the space density of high
luminosity AGNs peak at redshift ofz ∼ 2; this is also the redshift at which the most massive
SMBHs were formed in galaxies (Cowie et al. 2003; Hasinger etal. 2005). However, in the local
universe the most rapidly growing BHs appear to be those in the lower mass range of 106−107 M⊙
(Goulding et al. 2010). Also, studies of nearby galaxies show that it is the most massive BHs in late
type galaxies that are growing at the present epoch (Schawinski et al. 2010). The GLSB galaxies
in our sample fall into the latter category as they have largebulges; though they have lower BH
masses, they appear to be accreting and hence luminous in theoptical domain.
4. Decoupled Bulge-Disk Evolution in GLSB galaxies: As suggested by Das et al. (2009b),
the bulges of GLSB galaxies appear to be very evolved compared to their disks. In general bulges
form in two ways; one is through repeated galaxy mergers or accretion events that lead to the
formation of a central spheroidal mass distribution (Springel et al. 2005). The second is through
secular evolutionary processes where disk instabilities lead to bars, spiral arms, gas infall and
the evolution of a disky pseudobulge (Kormendy & Kennicutt 2004). These processes result in
disk star formation and enhanced disk structure, both of which are not observed in most GLSB
galaxies; instead their disks are metal poor and often fairly featureless. So the bulges in GLSB
galaxies probably formed in a different way; one possibility is that galaxy mergers resulted in
spheroidal bulges and then the disks were rebuilt from accreted gas (Springel & Hernquist 2005).
Such an evolutionary scenerio would lead to a bulge that is relatively decoupled from its disk or
its central black hole.
5. BHs in Halo Dominated Galaxies: Although the correlation of BH mass and galaxy prop-
erties is now well established, it is still not clear exactlywhat regulates black hole growth (e.g.
Booth & Schaye (2010) and references therein). Mass accretion close to the black hole, bulge
mass and the mass of the dark matter halo are some of the factors important for regulating black

AGN Activity and Black Hole Masses in Low Surface BrightnessGalaxies 13
hole growth in galaxies. It is not clear which factor is the most important or whether all the
processes play a role. Several theoretical studies have explored how the potential of the dark
halo may regulate bulge evolution and black hole growth (Booth & Schaye 2010; Xu et al. 2007;
Silk & Rees 1998) and there are observational studies that indicate a correlation between the dark
halo and black hole mass (Baes et al. 2003; Ferrarese 2002; Pizzella et al. 2005). On the other
hand, some studies show that nuclear black holes masses do not correlate with the dark halo mat-
ter haloes of galaxies and dark matter gravity is not directly responsible for black hole growth
(Kormendy & Bender 2011; Ho 2007). Such studies suggest thatSMBHs co-evolve with classical
bulges or ellipticals only. GLSB galaxies are halo dominated and often bulge dominated as well.
Hence they are ideal systems to study the dark halo-BH relation and this should be investigated in
future studies.
7 CONCLUSION
(i) The paper presents spectroscopic observations of the nuclear regions of nine low surface
brightness galaxies observed in the wavelength range 3700–9000 Å. The stellar light has been
subtracted from the nuclear spectra to obtain only gas emission spectra. Broad Hα lines along
with strong [Nii], [Sii], [Oi] lines are detected in four galaxies namely UGC 1922, UGC 6614,
UGC 6968 and F568-6 confirming the presence of AGN activity inthese LSB galaxies. SDSS
spectra of three galaxies namely, UGC 6614, UGC 6968 and F568-6 are used to estimate the BH
masses and stellar velocity dispersion as the resolution ofthe SDSS spectra is good enough (∼ 70
km s−1) to give a conservative estimate on the above parameters.
(ii) The BPT AGN diagnostic diagram was created using the emission line ratios. It is clearly
seen that the above four galaxies lie in the AGN regime and more closely, in the Seyfert regime.
UGC 3968 might also host a starburst-AGN composite nucleus.
(iii) The broad Hα line widths (900–2500 km s−1) and luminosities (1039 erg s−1) are used to
deduce the nuclear blackhole masses in the aforementioned galaxies; the masses for three galaxies
are∼ 3 × 10⁵ M⊙ and for UGC 6614, the BH mass is estimated to be about 3.8 × 10⁶ M⊙. The
masses suggest that the nuclei of LSB galaxies have IMBHs rather than the SMBHs found in the
centres of brighter galaxies. UGC 6614 also shows an interesting feature of a blueshifted bump of
Hα emission which can be attributed to outflow of gas travellingat speeds of 3600 km s−1 towards
us. The blue bump feature is detected in the Hβ region as well. There could be more such AGN

14 S. Ramya et al.
in the sample that may be identified through other means such as the reverberation technique with
improved sensitivity.
(iv) The stellar velocity dispersion,σ∗ is measured for the three galaxies UGC 6614, UGC
6968 and F568-6; the values lie between 150–210 km s−1. The three low-mass BHs lie below the
standard line in theM − σ∗ plot and lower than the ones studied by Mei et al. (2009).
8 ACKNOWLEDGEMENTS
We would like to thank the anonymous referee for suggestionsand clarifications which enhanced
the quality of the paper immensely. We thank Dr. J.E. Greene for providing the SDSS templates
and IDL fitting routine, Dr. Monica Valluri for suggestions,fruitful discussions and for introduc-
tion to pPxF algorithm, and Dr. T. Sivarani for help and discussions for the pPxF fitting routines.
We thank the staff of IAO and CREST for their help during the observations.
This research has made use of the NASA/IPAC Extragalactic Database (NED) which is operated
by the Jet Propulsion Laboratory, California Institute of Technology, under contract with the Na-
tional Aeronautics and Space Administration.
The SDSS is managed by the Astrophysical Research Consortium (ARC) for the Participating In-
stitutions. The Participating Institutions are The University of Chicago,Fermilab, the Institute for
Advanced Study, the Japan Participation Group, The Johns Hopkins University, Los Alamos Na-
tional Laboratory,the Max-Planck-Institute for Astronomy (MPIA), the Max-Planck-Institute for
Astrophysics (MPA), New Mexico State University, Princeton University, the United States Naval
Observatory, and the University of Washington.
RS would like to thank the University Grants Commission (UGC) for their UGC-CSIR NET fel-
lowship given by the Government of India.
REFERENCES
Amram, P., Marcelin, M., Balkowski, C., Cayatte, V., Sullivan, III, W. T., & Le Coarer, E. 1994,
A&AS, 103, 5
Baes, M., Buyle, P., Hau, G. K. T., & Dejonghe, H. 2003, MNRAS,341, L44
Baldwin, J. A., Phillips, M. M., & Terlevich, R. 1981, PASP, 93, 5
Barth, A. J., Ho, L. C., Rutledge, R. E., & Sargent, W. L. W. 2004, ApJ, 607, 90
Beifiori, A., Sarzi, M., Corsini, E. M., Dalla Bonta, E., Pizzella, A., Coccato, L., & Bertola, F.
2009, ApJ, 692, 856

AGN Activity and Black Hole Masses in Low Surface BrightnessGalaxies 15
Boissier, S., Gil de Paz, A., Boselli, A., Buat, V., Madore, B., Chemin, L., Balkowski, C., Amram,
P., Carignan, C., & van Driel, W. 2008, ApJ, 681, 244
Booth, C. M. & Schaye, J. 2010, MNRAS, L54+
Cappellari, M. & Emsellem, E. 2004, PASP, 116, 138
Cowie, L. L., Barger, A. J., Bautz, M. W., Brandt, W. N., & Garmire, G. P. 2003, ApJ, 584, L57
Dalla Bonta, E., Ferrarese, L., Corsini, E. M., Miralda-Escude, J., Coccato, L., Sarzi, M., Pizzella,
A., & Beifiori, A. 2009, ApJ, 690, 537
Das, M., Boone, F., & Viallefond, F. 2010, A&A, 523, A63+
Das, M., Kantharia, N. G., Vogel, S. N., & McGaugh, S. S. 2009a, in Astronomical Society of
the Pacific Conference Series, Vol. 407, Astronomical Society of the Pacific Conference Series,
ed. D. J. Saikia, D. A. Green, Y. Gupta, & T. Venturi, 167–+
Das, M., O’Neil, K., Vogel, S. N., & McGaugh, S. 2006, ApJ, 651, 853
Das, M., Reynolds, C. S., Vogel, S. N., McGaugh, S. S., & Kantharia, N. G. 2009b, ApJ, 693,
1300
de Blok, W. J. G., McGaugh, S. S., Bosma, A., & Rubin, V. C. 2001, ApJ, 552, L23
de Blok, W. J. G., van der Hulst, J. M., & Bothun, G. D. 1995a, MNRAS, 274, 235
—. 1995b, MNRAS, 274, 235
Ferrarese, L. 2002, ApJ, 578, 90
Ferrarese, L. & Ford, H. 2005, Space Sci. Rev., 116, 523
Ferrarese, L. & Merritt, D. 2000, ApJ, 539, L9
Filippenko, A. V. & Ho, L. C. 2003, ApJ, 588, L13
Friedli, D. & Benz, W. 1993, A&A, 268, 65
Galaz, G., Herrera-Camus, R., Garcia-Lambas, D., & Padilla, N. 2011, ApJ, 728, 74
Gavazzi, G., Franzetti, P., Scodeggio, M., Boselli, A., & Pierini, D. 2000, A&A, 361, 863
Gebhardt, K., Bender, R., Bower, G., Dressler, A., Faber, S.M., Filippenko, A. V., Green, R.,
Grillmair, C., Ho, L. C., Kormendy, J., Lauer, T. R., Magorrian, J., Pinkney, J., Richstone, D.,
& Tremaine, S. 2000, ApJ, 539
Gerhard, O. E. 1993, MNRAS, 265, 213
Goulding, A. D., Alexander, D. M., Lehmer, B. D., & Mullaney,J. R. 2010, MNRAS, 662
Greene, J. E. & Ho, L. C. 2004, ApJ, 610, 722
—. 2005, ApJ, 627, 721
—. 2007, ApJ, 670, 92
Gultekin, K., Cackett, E. M., Miller, J. M., Di Matteo, T., Markoff, S., & Richstone, D. O. 2010, in

16 S. Ramya et al.
Bulletin of the American Astronomical Society, Vol. 41, Bulletin of the American Astronomical
Society, 440–+
Gultekin, K., Richstone, D. O., Gebhardt, K., Lauer, T. R.,Tremaine, S., Aller, M. C., Bender,
R., Dressler, A., Faber, S. M., Filippenko, A. V., Green, R.,Ho, L. C., Kormendy, J., Magorrian,
J., Pinkney, J., & Siopis, C. 2009, ApJ, 698, 198
Hasinger, G., Miyaji, T., & Schmidt, M. 2005, A&A, 441, 417
Hinz, J. L., Rieke, M. J., Rieke, G. H., Willmer, C. N. A., Misselt, K., Engelbracht, C. W.,
Blaylock, M., & Pickering, T. E. 2007, ApJ, 663, 895
Ho, L. C. 2007, ApJ, 668, 94
—. 2008, ARA&A, 46, 475
Impey, C. & Bothun, G. 1997, ARA&A, 35, 267
Impey, C., Burkholder, V., & Sprayberry, D. 2001, AJ, 122, 2341
Jorgensen, I., Franx, M., & Kjaergaard, P. 1995, MNRAS, 276,1341
Kaspi, S., Smith, P. S., Netzer, H., Maoz, D., Jannuzi, B. T.,& Giveon, U. 2000, ApJ, 533, 631
Kauffmann, G., Heckman, T. M., Tremonti, C., Brinchmann, J., Charlot, S., White, S. D. M.,
Ridgway, S. E., Brinkmann, J., Fukugita, M., Hall, P. B., Ivezic, Z., Richards, G. T., & Schnei-
der, D. P. 2003, MNRAS, 346, 1055
Kewley, L. J., Dopita, M. A., Sutherland, R. S., Heisler, C. A., & Trevena, J. 2001, ApJ, 556, 121
Kewley, L. J., Groves, B., Kauffmann, G., & Heckman, T. 2006, MNRAS, 372, 961
Kormendy, J. & Bender, R. 2011, Nature, 469, 377
Kormendy, J. & Kennicutt, Jr., R. C. 2004, ARA&A, 42, 603
Leitherer, C., Schaerer, D., Goldader, J. D., Gonzalez Delgado, R. M., Robert, C., Kune, D. F.,
de Mello, D. F., Devost, D., & Heckman, T. M. 1999, ApJS, 123, 3
MacArthur, L. A., Courteau, S., & Holtzman, J. A. 2003, ApJ, 582, 689
Mayer, L. & Wadsley, J. 2004, MNRAS, 347, 277
McGaugh, S. S. 1994, ApJ, 426, 135
Mei, L., Yuan, W., & Dong, X. 2009, Research in Astronomy and Astrophysics, 9, 269
Merloni, A. & Heinz, S. 2008, MNRAS, 388, 1011
Mihos, J. C., McGaugh, S. S., & de Blok, W. J. G. 1997, ApJ, 477,L79+
Naik, S., Das, M., Jain, C., & Paul, B. 2010, MNRAS, in press (ArXiv:1001.5096v1)
Natarajan, P. & Treister, E. 2009, MNRAS, 393, 838
Oke, J. B. 1990, AJ, 99, 1621
O’Neil, K., Bothun, G., van Driel, W., & Monnier Ragaigne, D.2004, A&A, 428, 823

AGN Activity and Black Hole Masses in Low Surface BrightnessGalaxies 17
O’Neil, K. & Schinnerer, E. 2003, ApJ, 588, L81
Ostriker, J. P. & Peebles, P. J. E. 1973, ApJ, 186, 467
Pettini, M. & Pagel, B. E. J. 2004, MNRAS, 348, L59
Pickering, T. E., Impey, C. D., van Gorkom, J. H., & Bothun, G.D. 1997, AJ, 114, 1858
Pizzella, A., Corsini, E. M., Dalla Bonta, E., Sarzi, M., Coccato, L., & Bertola, F. 2005, ApJ,
631, 785
Pizzella, A., Corsini, E. M., Vega Beltran, J. C., & Bertola, F. 2004, A&A, 424, 447
Press, W. H., Teukolsky, S. A., Vetterling, W. T., Flannery,B. P., Lloyd, C., & Rees, P. 1993, The
Observatory, vol. 113, no. 1115, 214
Rahman, N., Howell, J. H., Helou, G., Mazzarella, J. M., & Buckalew, B. 2007, ApJ, 663, 908
Rosenbaum, S. D., Krusch, E., Bomans, D. J., & Dettmar, R. 2009, A&A, 504, 807
Satyapal, S., Vega, D., Heckman, T., O’Halloran, B., & Dudik, R. 2007, ApJ, 663, L9
Schawinski, K., Dowlin, N., Thomas, D., Urry, C. M., & Edmondson, E. 2010, ApJ, 714, L108
Schlegel, D. J., Finkbeiner, D. P., & Davis, M. 1998, ApJ, 500, 525
Schombert, J. 1998, AJ, 116, 1650
Schombert, J. M. & Bothun, G. D. 1987, AJ, 93, 60
Schombert, J. M., McGaugh, S. S., & Eder, J. A. 2001, AJ, 121, 2420
Seth, A. C., Cappellari, M., Neumayer, N., Caldwell, N., Bastian, N., Olsen, K., Blum, R. D.,
Debattista, V. P., McDermid, R., Puzia, T., & Stephens, A. 2010, ApJ, 714, 713
Silk, J. & Rees, M. J. 1998, A&A, 331, L1
Somerville, R. S., Hopkins, P. F., Cox, T. J., Robertson, B. E., & Hernquist, L. 2008, MNRAS,
391, 481
Sprayberry, D., Impey, C. D., Bothun, G. D., & Irwin, M. J. 1995, AJ, 109, 558
Springel, V., Di Matteo, T., & Hernquist, L. 2005, MNRAS, 361, 776
Springel, V. & Hernquist, L. 2005, ApJ, 622, L9
Tremaine, S., Gebhardt, K., Bender, R., Bower, G., Dressler, A., Faber, S. M., Filippenko, A. V.,
Green, R., Grillmair, C., Ho, L. C., Kormendy, J., Lauer, T. R., Magorrian, J., Pinkney, J., &
Richstone, D. 2002, ApJ, 574, 740
van der Marel, R. P. & Franx, M. 1993, ApJ, 407, 525
Veilleux, S. & Osterbrock, D. E. 1987, ApJS, 63, 295
Veron-Cetty, M., Veron, P., & Goncalves, A. C. 2001, A&A,372, 730
Volonteri, M. 2007, ApJ, 663, L5
Volonteri, M. & Natarajan, P. 2009, MNRAS, 400, 1911
18 S. Ramya et al.
4000 5000 6000 7000 8000 90000
2
4
6
(UGC1378)x0.5 -1.0
(UGC3968)x2.0
(F568-6)x2.2 +2.0
UGC1922 +2.5
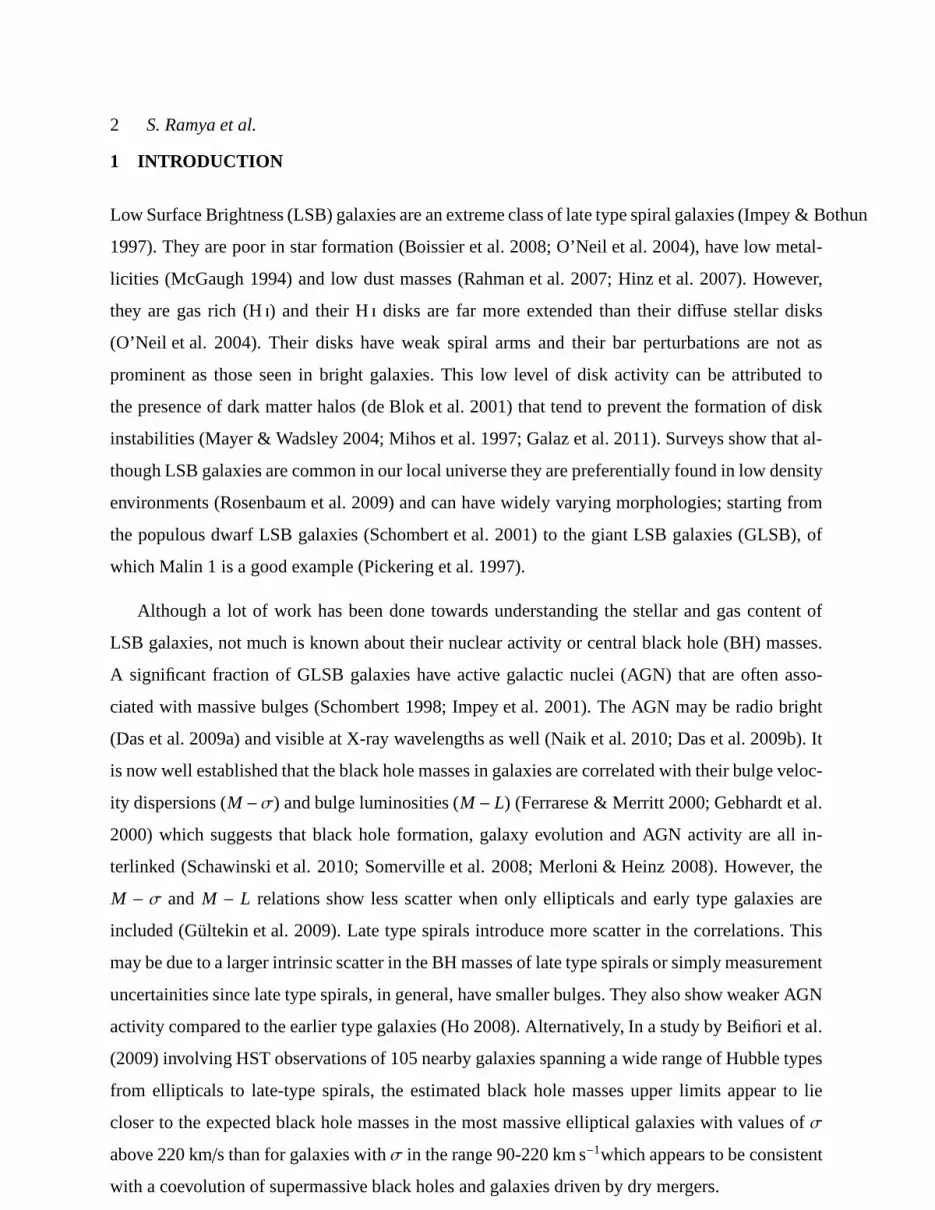
Figure 1. Spectra of the LSBs observed from HCT using the blue (#7) and red (#8) grism and combined together using thescombinetask of IRAF. The x-axis represents the rest-frame wavelength. The spectra are arbitrarily displaced for clear viewing.
Table 1. The sample of LSB galaxies
Galaxy Other Galaxy Vel.a Distanceb Galaxy Galaxy Galaxy AbsoluteName Type km s−1 (Mpc) Coordinates (J2000) inclination size (arcmin) Magnitude (MH)
UGC 1378 PGC 007247 (R)SB(rs)a 2935 43 01h56m19.2s+73d16m58s 68.60 3.4 -24.01UGC 1922c PGC 009373 S 10894 151 02h27m45.8s+28d12m33s 29.60 2.1 -25.25UGC 3968 PGC 021636 SB(r)c 6780 94 07h42m45.2s+66d15m30s 37.80 1.4 -23.55UGC 4219 PGC 022766 SA(rs)b 12433 170 08h06m42.8s+39d05m25s 44.70 1.1 -24.37UGC 6614 PGC 036122 (R)SA(r)a 6352 86 11h39m14.9s+17d08m37s 29.90 1.7 -23.70UGC 6754d PGC 036740 SA(rs)b 7025 96 11h46m47.2s+20d40m32s 29.10 3.0 -24.74UGC 6968 PGC 037704 S 8232 113 11h58m44.6s+28d17m22s 44.70 2.8 -24.04UGC 7357 PGC 039640 SAB(s)c 6682 91 12h19m13.4s+22d25m54s 480 1.6 -22.17
F568-6 Malin 2 Sd/ 13830 189 10h39m52.5s+20d50m49s 380 1.5 -25.50
a Heliocentric velocities from NEDb Galactocentric distances from NED assumingH0 = 73 km s−1Mpc c = IC 226d = NGC 3883
Xu, B., Wu, X., & Zhao, H. 2007, ApJ, 664, 198

AGN Activity and Black Hole Masses in Low Surface BrightnessGalaxies 19
4000 5000 6000 7000 8000 9000
1
2
3
4
5
UGC6614 +2.5
UGC7357 +0.7
UGC6968 +1.4
UGC6754 +0.8
UGC4219 +1.7
Figure 1. - Continued
Table 2. Observation details of long slit spectra obtained fromHCT.
Galaxy Date of Obs. Exptimea
Gr7 / Gr8 in sec
UGC 1378 22-11-2006 3600/ 3600UGC 1922 22-12-2006 3600/ 3600UGC 3968 22-11-2006 1800/ 3600UGC 4219 19-02-2007 2400/ 2400UGC 6614 05-07-2006 3600/ 3600UGC 6754 19-02-2007 1800/ 2400UGC 6968 14-05-2007 1800/ 2400UGC 7357 19-02-2007 2400/ 1510
F568-6 22-12-2006 3600/ 3600
a - Exposure times in the grism 7 (blue) and grism 8 (red).

20 S. Ramya et al.
UGC 1378 UGC 1922
UGC 3968 UGC 4219
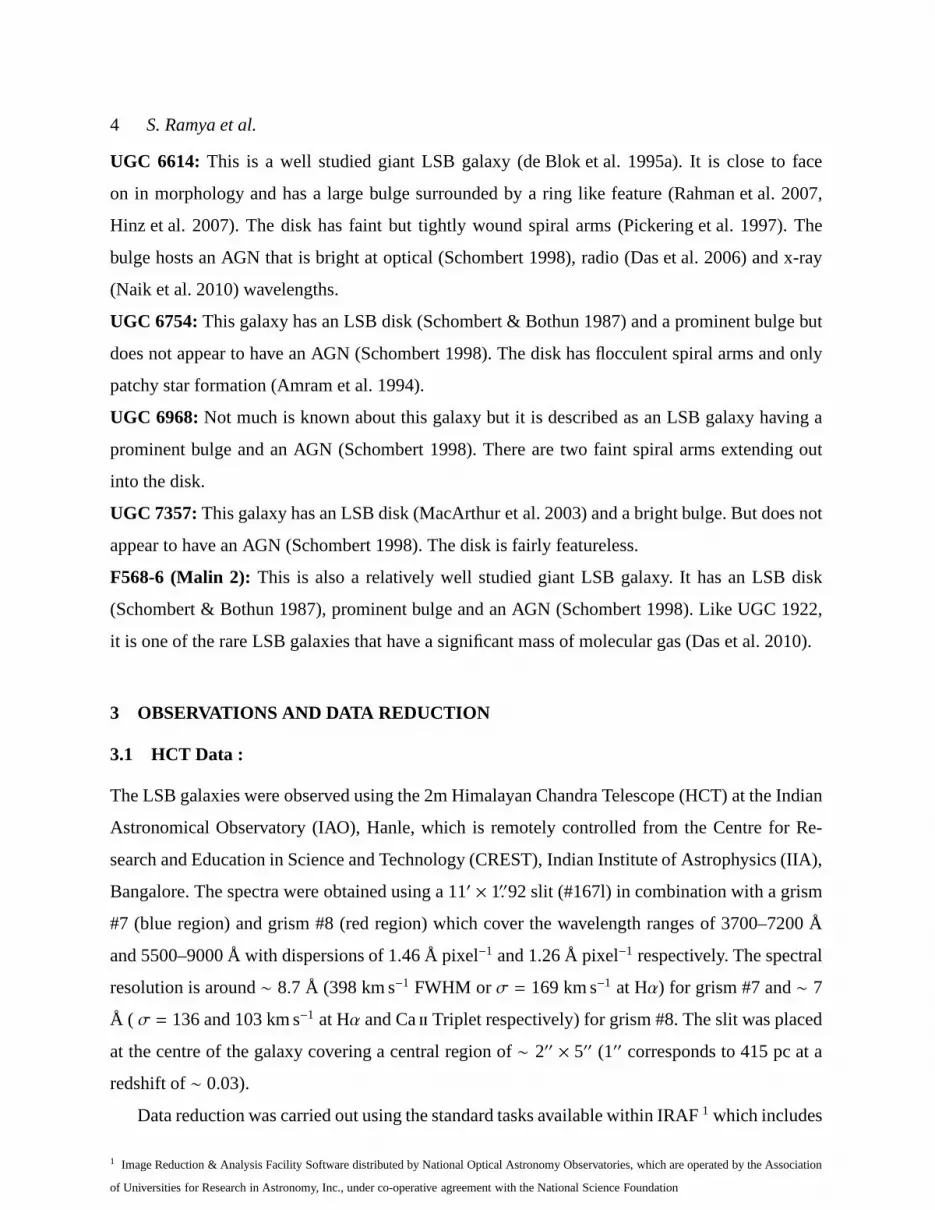
Figure 2. Plots show observed HCT spectra on the top, with best fitting Gyr model showing the age of the underlying stellar populationas a dashed line. Fei and ii template spectra taken from Veron-Cetty et al. (2001) are plotted as dot-dashed. Dotted lines seen inUGC 1378, UGC 3968 and in UGC 4219 are power-law continuum following Mei et al. (2009). The bottom spectra drawn as thicksolid lines show the subtracted spectrum. The x-axis represents the rest-frame wavelength.

AGN Activity and Black Hole Masses in Low Surface BrightnessGalaxies 21
UGC 6614 UGC 6754
UGC 6968 UGC 7357
LSBC F568-6
Figure 2. - Continued. UGC 6614 and UGC 6968 are best fit using only the stellar spectra from Starburst99, while the spectra of UGC7357 and F568-6 require additional power-law continuum shown as dotted lines in this figure.

22 S. Ramya et al.
6540 6560 6580 66001
1.1
1.2
1.3
1.4
6520 6540 6560 6580 66000.8
1
1.2
1.4
1.6
Figure 3. Fits to the broad and narrow emission line components for thegalaxies F568-6 and UGC 1922 from SDSS. The points showthe observed spectra after decomposition. The dotted linesshow the individual gaussian fits to the lines and the solid line shows thecombined fits for the region. The spectra used for estimatingBH mass in F568-6 is the SDSS spectra while for UGC 1922, we haveused HCT spectra as SDSS data for this galaxy is unavailable.
Figure 3. - Continuedusing the SDSS spectra for the two galaxies UGC 6614 and UGC 6968.

AGN Activity and Black Hole Masses in Low Surface BrightnessGalaxies 23
3300 3400 3500 3600 3700 3800pixels
0.6
0.7
0.8
0.9
1.0
1.1
coun
ts
3400 3450 3500 3550 3600 3650 3700 3750pixels
0.7
0.8
0.9
1.0
1.1
coun
ts
3400 3500 3600 3700 3800pixels
0.7
0.8
0.9
1.0
1.1
1.2
coun
ts
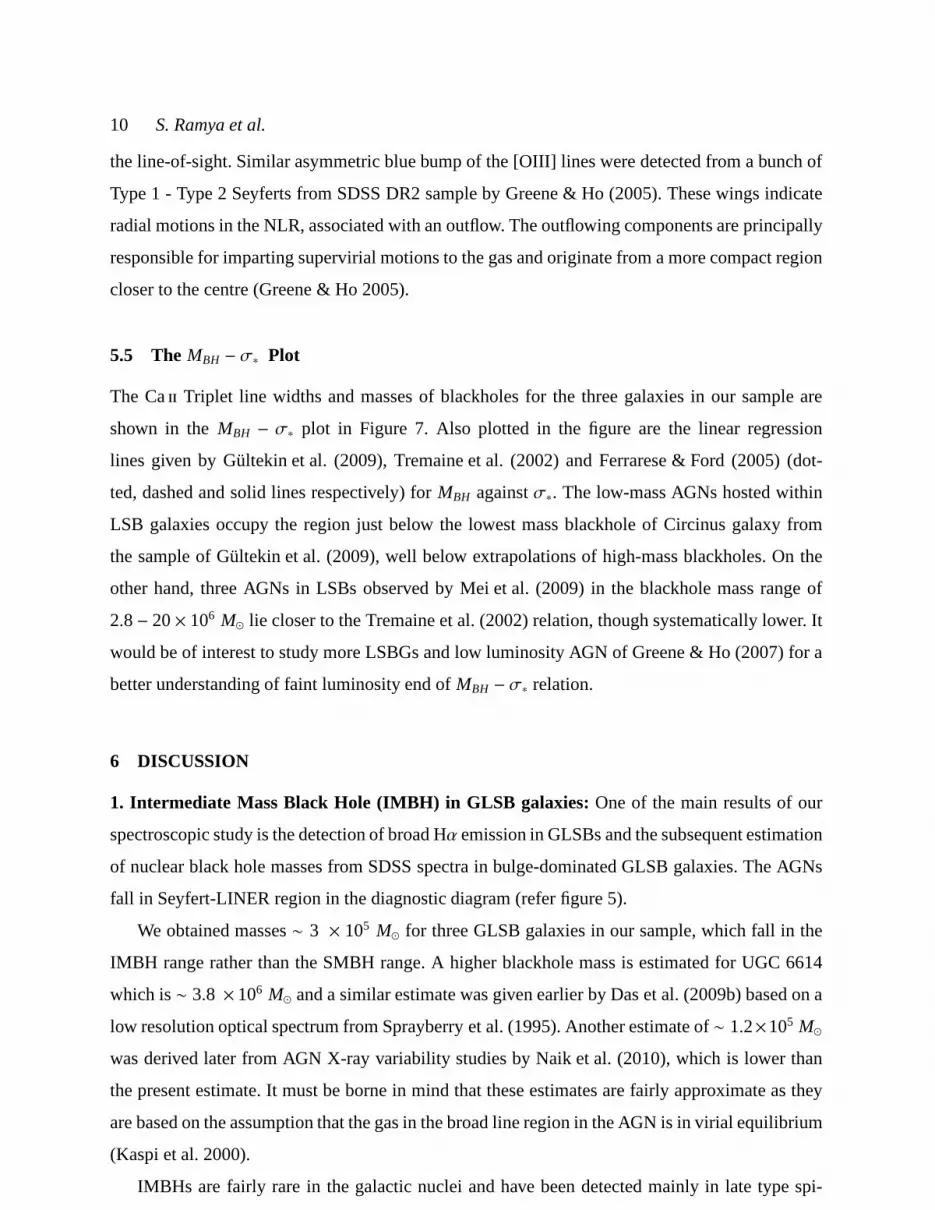
Figure 4. Fits to the observed SDSS spectra using the pPxF code. The thick black line represents the observed spectra, the red line isthe best fit SDSS template for the Caii Triplet region to estimate the velocity dispersionσ∗ for the three galaxies namely (from top tobottom) UGC 6614, UGC 6968 and F568-6. Measuredσ∗ is 157, 196 and 209 km s−1 respectively for the three galaxies. Green dotsshow the residues of the fit.

24 S. Ramya et al.
-1.5 -1 -0.5 0 0.5
-1
-0.5
0
0.5
1
1
2
3
4
5 67
-1 -0.5 0 0.5
1
2
3
4
5 67
-2 -1.5 -1 -0.5 0
1
2
3
4
1- UGC 1922; 2- UGC 6614; 3- UGC 6968; 4- LSBC F568-6; 5- UGC 7357; 6- UGC 3968; 7- UGC 4219.
Figure 5. Diagnostic diagrams for the sample of LSB galaxies, observed from HCT. The dashed line in the leftmost figure,log([O iii]/Hβ) vs log([Nii]/Hα), is the starburst-Seyfert demarcation taken from Kauffmann et al. (2003). The dotted line is the extremestarburst line of Kewley et al. (2001). The solid lines showing the demarcation in log([Oiii]/Hβ) vs log([Sii]/Hα) and log([Oiii]/Hβ) vslog([O i]/Hα) is taken from Kewley et al. (2001). The straight line drawn in the centre and right plots is the Seyfert-LINER demarcationline taken from Kewley et al. (2006). The [Oi] emission was clearly detected only in four of the galaxies UGC 1922, UGC 6614, UGC6968 and F568-6. These galaxies definitely host near-Seyfert kind of nuclei. UGC 7357 and UGC 4219 clearly fall in the starburstregime, and the galaxy UGC 3968 might be hosting a starburst-AGN composite nucleus as seen from the diagnostic diagrams.

AGN Activity and Black Hole Masses in Low Surface BrightnessGalaxies 25
-5000 0 5000
0.8
1
1.2
1.4
1.6
1.8
2
Figure 6. Line fits for the region around Hα and Hβ for the galaxy UGC 6614. The x-axis is interms of velocities.A blue bump isclearly noticeable around Hα and Hβ which is centered at−3600± 300 km s−1 and moving at a velocity of∼ 3600 km s−1 towards us.
60 70 80 90 100 200 300
1 - UGC 6614
2 - UGC 6968
3 - f568-6
1
2
3
Figure 7. M−σ plot for the LSBs. Points represent theMBH and velocity dispersion of the 3 LSBs UGC 6968, UGC 6614 and F568-6.The solid line is theMBH-σ∗ relation taken from Ferrarese & Merritt (2000), the dashed line is from Tremaine et al. (2002) and dottedline is taken from Gultekin et al. (2009). TheMBH andσ∗ are estimated from the SDSS spectra.

26
S.R
am
yaeta
l.Table 3. Fluxes of emission lines in the units of 10−15 erg cm−2 s−1 obtained fromHCT spectra.
Galaxy [OII] Hβ [OIII] [OI] Hαa [NII] [SII]3727 Å 4861 Å 5007 Å 6300 Å 6563narrow 6548 Å 6584 Å 6717 Å 6731 Å
UGC 1378 ** ** 5.75± 0.54 ** 5.30± 0.81 ** 8.20± 0.87 5.30± 1.56 4.74± 1.25d (9.41± 0.84) (10.12± 1.19) (10.16± 0.98) (13.07± 3.12) (12.72± 3.03))
UGC 1922 31.01± 0.07 4.35± 0.67 3.32± 0.56 2.21± 0.73 **b 3.77± 0.69 8.29± 0.59 5.20± 1.36 3.56± 0.89d (9.60± 0.23) (9.47± 1.08) (8.44± 1.23) (9.82± 3.06) ** (15.58± 1.88) (18.72± 3.08) (11.67± 2.60) (9.93± 2.95)
UGC 3968 ** 2.08± 0.13 ** ** 3 .50± 0.51 1.81± 0.52 2.75± 0.35 0.91± 0.40 1.45± 0.59d ** (8 .76± 0.71) ** ** (10 .41± 0.92) (14.73± 3.01) (9.47± 0.91) (8.02± 2.75) (13.31± 4.58)
UGC 4219 ** 1.10± 0.25 ** ** 4 .45± 0.50 0.58± 0.35 1.08± 0.39 0.69± 0.45 0.46± 0.38d ** (10 .03± 2.59) ** ** (11 .75± 0.86) (8.91± 5.37) (10.30± 3.76) (11.37± 9.13) (10.64± 10.57)
UGC 6614 7.89± 0.09 2.56± 0.35 5.12± 0.31 3.78± 0.86 **b 1.69± 0.55 5.58± 0.40 5.46± 0.36c
d ** (10 .52± 1.80) (12.41± 0.94) (13.93± 2.88) (15.63± 0.98) (16.78± 3.91) (15.63± 0.98) (18.55± 2.13)UGC 6754 ** ** 0.59± 0.38 ** 1.41± 0.83 ** 0.18± 0.42 0.54± 0.33 0.76± 0.56
d ** ** (8 .59± 6.63) ** (5.54± 8.57) ** (5.83± 4.84) (7.34± 4.46) (11.15± 8.04)UGC 6968 ** 4.52± 0.62 3.49± 0.43 1.14± 0.41 **b 0.40± 0.53 2.10± 0.53 1.49± 0.61 2.14± 1.09
d ** (15 .80± 2.58) (12.25± 1.83) (7.45± 3.57) ** ** ** (6 .78± 2.60) (15.06± 7.56)UGC 7357 ** 2.03± 0.08 0.45± 0.08 ** 4.60± 0.06 1.16± 0.09 2.57± 0.07 2.31± 0.16 1.83± 0.13
d ** (8 .51± 0.25) (3.95± 0.48) ** (8.21± 0.16) (10.37± 0.78) (9.85± 0.36) (10.25± 0.36) (11.12± 0.79)F568-6 *** 1.66± 0.26 1.55± 0.31 0.49± 0.39 **b ** 2 .34± 1.99 0.79± 0.61 0.54± 0.39
d ** (12 .57± 2.23) (10.17± 1.56) (9.65± 2.33) ** ** (15 .31± 1.31) (11.56± 7.78) (9.77± 7.51)
a - Hα fluxes for the objects which do not host AGN.b - broad Hα line is detected and hence separation of broad and narrow lines is done. These are deblended and given in the Table 4.c - The telluric lineλ6870 Å exactly coincided with the [Sii] emission. After the telluric line correction, the lines could not be resolved and hence the lines could not be deblended. Hence total [Sii] flux is given here.d - The values quoted inside the brackets, in the second row foreach of the galaxies are FWHM of each of the lines whose fluxes are given above.

AGN Activity and Black Hole Masses in Low Surface BrightnessGalaxies 27
Table 4. Hα flux for narrow and broad components in erg cm−2 s−1, luminosity of broad Hα line, FWHM of the broad Hα line, σ∗calculated using Caii Triplet lines from SDSS spectra for three galaxies UGC 6614,UGC 6968 and F568-6. Due to unavailability ofSDSS data for UGC 1922, HCT spectra is used for estimation of BH mass.
Galaxy Hαa LHα fwhmb σ∗ MBH
Broad Narrow ×1040erg s−1 km s−1 km s−1 ×10⁶M⊙
UGC 1922 8.13± 1.50 4.79± 1.93 2.21± 0.410 855.7± 140.7 ** 0 .39+0.18−0.15
UGC 6614 32.77± 3.62 5.11± 0.71 2.91± 0.020 2456.5± 167.3 157.3± 13.1 3.89+1.21−1.04
UGC 6968 3.54± 1.68 1.83± 0.69 0.54± 0.001 1244.7± 742.8 195.8± 16.4 0.45+0.81−0.38
F568-6 2.01± 0.84 0.93± 0.40 0.85± 0.020 899.6± 372.4 209.1± 18.0 0.29+0.32−0.20
a- Hα fluxes of the broad and narrow components in units of 10−15 erg cm−2 s−1.b- FWHM of the broad line of Hα.


![masos for the masses part three - []](https://static.fdokumen.com/doc/165x107/6328d98472264f12480374b5/masos-for-the-masses-part-three-.jpg)

