The 1.4-GHz radio properties of hard X-ray-selected AGN
10
MNRAS 447, 1289–1298 (2015) doi:10.1093/mnras/stu2455 The 1.4-GHz radio properties of hard X-ray-selected AGN F. Panessa, 1‹ A. Tarchi, 2 P. Castangia, 2 E. Maiorano, 3 L. Bassani, 3 G. Bicknell, 4 A. Bazzano, 1 A. J. Bird, 5 A. Malizia 3 and P. Ubertini 1 1 INAF – Istituto di Astrofisica e Planetologia Spaziali di Roma (IAPS), Via del Fosso del Cavaliere 100, I-00133 Roma, Italy 2 Osservatorio Astronomico di Cagliari (OAC-INAF),Via della Scienza 5, I-09047 Selargius (CA), Italy 3 Istituto di Astrofisica Spaziale e Fisica Cosmica (IASF-INAF), Via P. Gobetti 101, I-40129 Bologna, Italy 4 Research School of Astronomy & Astrophysics, Mt Stromlo Observatory, Cotter Rd, Weston, ACT 2611, Australia 5 Physics & Astronomy, University of Southampton, Highfield, Southampton SO17 1BJ, UK Accepted 2014 November 20. Received 2014 November 10; in original form 2014 July 14 ABSTRACT We have analysed the NRAO Very Large Array Sky Survey and Sydney University Molonglo Sky Survey data at 1.4 GHz and 843 MHz for a well-defined complete sample of hard X-ray AGN observed by INTEGRAL. A large number (70/79) of sources are detected in the radio band, showing a wide range of radio morphologies, from unresolved or slightly resolved cores to extended emission over several hundreds of kpc scales. The radio fluxes have been correlated with the 2–10 keV and 20–100 keV emission, revealing significant correlations with slopes consistent with those expected for radiatively efficient accreting systems. The high-energy emission coming from the inner accretion regions correlates with the radio emission averaged over hundreds of kpc scales (i.e. thousands of years). Key words: galaxies: active – galaxies: Seyfert – radio continuum: galaxies. 1 INTRODUCTION How active galactic nuclei (AGN) are involved in the process of galaxy formation is one of the main issues in modern astrophysics. AGN and galaxy evolution are connected through feedback pro- cesses regulating both the accretion history and the star formation (e.g. Cattaneo et al. 2009). The mechanical (kinetic) energy re- leased by accelerated particles in jets is one of the possible sources of AGN feedback into the interstellar matter of the host galaxy (Cattaneo et al. 2006; Croton et al. 2006; Marulli et al. 2008). The knowledge of the connection between the radio emission (linked to the jet) and the X-ray emission (from accretion) is one of the key ingredients to build up more robust AGN-galaxy evolutionary models (La Franca, Melini & Fiore 2010; Bonchi et al. 2013). The X-ray versus radio connection is also fundamental within the disc– jet coupling paradigm in accreting systems (Merloni, Heinz & di 2003; Falcke, K¨ ording & Markoff 2004). However, the details of the link between the accreting disc, the X-ray corona and the jet are still under investigation. The relation between the radio and the X-ray emission has been explored for different classes of AGN, with correlation slopes typi- cally distributed around unity (Canosa et al. 1999; Brinkmann et al. 2000; Panessa et al. 2007). The discovery of a ‘Fundamental Plane’ relation between the X-ray and radio luminosities, and the black hole (BH) mass (Merloni et al. 2003; Falcke et al. 2004) has been E-mail: [email protected] interpreted in the framework of a radiatively inefficient accretion flow accompanied by a relativistic jet at work both in X-ray bina- ries (XRBs) and low-luminosity AGN (e.g. Narayan & Yi 1994). Recently, Coriat et al. (2011) have shown that some XRBs follow a steeper radio–X-ray correlation (correlation slope of 1.4) compared to the standard 0.5–0.7 (Gallo, Fender & Pooley 2003; Merloni et al. 2003), suggesting that these sources are accreting at high Ed- dington ratios and are radiatively efficient. Dong, Wu & Cao (2014) have confirmed this result for a sample of bright radiatively efficient AGN, with a positive correlation slope of ∼1.6, justified within the disc–corona model for efficient accreting sources (e.g. Cao, Wu & Dong 2014). On the other hand, Burlon et al. (2013) have explored the association between hard X-ray AGN observed by Swift/BAT and AT20G 1 radio sources in the southern sky, finding a possible correlation between the 15–55 keV and 20 GHz luminosities (slope of ∼0.7), however, likely driven by distances effects and therefore not intrinsically significant. Here, we aim at testing the validity of such correlations in a well-defined complete sample of relatively high-luminosity AGN, selected at hard X-ray as those observed by the INTEGRAL satel- lite (e.g. Bird et al. 2010). INTEGRAL/IBIS is surveying the sky above 20 keV with a sensitivity better than a few mCrab 2 and a point source location accuracy of 1–3 arcmin depending on the 1 The AT20G Survey is a blind 20GHz survey of the entire southern sky carried out using the Australia Telescope Compact Array (ATCA). 2 The conversion factor in the 20–40 keV range is 10 mCrab = 7.57 × 10 −11 erg cm −2 s −1 ; see Bird et al. (2010). C 2014 The Authors Published by Oxford University Press on behalf of the Royal Astronomical Society Downloaded from https://academic.oup.com/mnras/article/447/2/1289/2593628 by guest on 10 January 2022
-
Upload
khangminh22 -
Category
Documents
-
view
0 -
download
0
Transcript of The 1.4-GHz radio properties of hard X-ray-selected AGN

MNRAS 447, 1289–1298 (2015) doi:10.1093/mnras/stu2455
The 1.4-GHz radio properties of hard X-ray-selected AGN
F. Panessa,1‹ A. Tarchi,2 P. Castangia,2 E. Maiorano,3 L. Bassani,3 G. Bicknell,4
A. Bazzano,1 A. J. Bird,5 A. Malizia3 and P. Ubertini11INAF – Istituto di Astrofisica e Planetologia Spaziali di Roma (IAPS), Via del Fosso del Cavaliere 100, I-00133 Roma, Italy2Osservatorio Astronomico di Cagliari (OAC-INAF),Via della Scienza 5, I-09047 Selargius (CA), Italy3Istituto di Astrofisica Spaziale e Fisica Cosmica (IASF-INAF), Via P. Gobetti 101, I-40129 Bologna, Italy4Research School of Astronomy & Astrophysics, Mt Stromlo Observatory, Cotter Rd, Weston, ACT 2611, Australia5Physics & Astronomy, University of Southampton, Highfield, Southampton SO17 1BJ, UK
Accepted 2014 November 20. Received 2014 November 10; in original form 2014 July 14
ABSTRACTWe have analysed the NRAO Very Large Array Sky Survey and Sydney University MolongloSky Survey data at 1.4 GHz and 843 MHz for a well-defined complete sample of hard X-rayAGN observed by INTEGRAL. A large number (70/79) of sources are detected in the radioband, showing a wide range of radio morphologies, from unresolved or slightly resolved coresto extended emission over several hundreds of kpc scales. The radio fluxes have been correlatedwith the 2–10 keV and 20–100 keV emission, revealing significant correlations with slopesconsistent with those expected for radiatively efficient accreting systems. The high-energyemission coming from the inner accretion regions correlates with the radio emission averagedover hundreds of kpc scales (i.e. thousands of years).
Key words: galaxies: active – galaxies: Seyfert – radio continuum: galaxies.
1 IN T RO D U C T I O N
How active galactic nuclei (AGN) are involved in the process ofgalaxy formation is one of the main issues in modern astrophysics.AGN and galaxy evolution are connected through feedback pro-cesses regulating both the accretion history and the star formation(e.g. Cattaneo et al. 2009). The mechanical (kinetic) energy re-leased by accelerated particles in jets is one of the possible sourcesof AGN feedback into the interstellar matter of the host galaxy(Cattaneo et al. 2006; Croton et al. 2006; Marulli et al. 2008). Theknowledge of the connection between the radio emission (linkedto the jet) and the X-ray emission (from accretion) is one of thekey ingredients to build up more robust AGN-galaxy evolutionarymodels (La Franca, Melini & Fiore 2010; Bonchi et al. 2013). TheX-ray versus radio connection is also fundamental within the disc–jet coupling paradigm in accreting systems (Merloni, Heinz & di2003; Falcke, Kording & Markoff 2004). However, the details ofthe link between the accreting disc, the X-ray corona and the jet arestill under investigation.
The relation between the radio and the X-ray emission has beenexplored for different classes of AGN, with correlation slopes typi-cally distributed around unity (Canosa et al. 1999; Brinkmann et al.2000; Panessa et al. 2007). The discovery of a ‘Fundamental Plane’relation between the X-ray and radio luminosities, and the blackhole (BH) mass (Merloni et al. 2003; Falcke et al. 2004) has been
�E-mail: [email protected]
interpreted in the framework of a radiatively inefficient accretionflow accompanied by a relativistic jet at work both in X-ray bina-ries (XRBs) and low-luminosity AGN (e.g. Narayan & Yi 1994).Recently, Coriat et al. (2011) have shown that some XRBs follow asteeper radio–X-ray correlation (correlation slope of 1.4) comparedto the standard 0.5–0.7 (Gallo, Fender & Pooley 2003; Merloniet al. 2003), suggesting that these sources are accreting at high Ed-dington ratios and are radiatively efficient. Dong, Wu & Cao (2014)have confirmed this result for a sample of bright radiatively efficientAGN, with a positive correlation slope of ∼1.6, justified within thedisc–corona model for efficient accreting sources (e.g. Cao, Wu &Dong 2014). On the other hand, Burlon et al. (2013) have exploredthe association between hard X-ray AGN observed by Swift/BATand AT20G1 radio sources in the southern sky, finding a possiblecorrelation between the 15–55 keV and 20 GHz luminosities (slopeof ∼0.7), however, likely driven by distances effects and thereforenot intrinsically significant.
Here, we aim at testing the validity of such correlations in awell-defined complete sample of relatively high-luminosity AGN,selected at hard X-ray as those observed by the INTEGRAL satel-lite (e.g. Bird et al. 2010). INTEGRAL/IBIS is surveying the skyabove 20 keV with a sensitivity better than a few mCrab2 and apoint source location accuracy of 1–3 arcmin depending on the
1 The AT20G Survey is a blind 20 GHz survey of the entire southern skycarried out using the Australia Telescope Compact Array (ATCA).2 The conversion factor in the 20–40 keV range is 10 mCrab = 7.57 ×10⁻¹¹ erg cm−2 s−1; see Bird et al. (2010).
C© 2014 The AuthorsPublished by Oxford University Press on behalf of the Royal Astronomical Society
Dow
nloaded from https://academ
ic.oup.com/m
nras/article/447/2/1289/2593628 by guest on 10 January 2022

1290 F. Panessa et al.
source significance and the observation exposure (Bird et al. 2007).Hard X-ray-selected samples are almost unbiased with respect toabsorption and are mostly located in the nearby Universe, reducingas much as possible the selection effects (Malizia et al. 2009). Thesample used here comprises bright AGN (41.5 < L2−10 keV < 44.5 inerg s−1), with Eddington ratios Lbol/LEdd ≥ 10−3, good candidatesfor radiating at efficient accretion regimes.
In Section 2, we present the INTEGRAL sample and the treat-ment of the X-ray data; in Sections 3 and 4, we describe the radiodata analysis and the radio properties of the sample; in Section 5,the radio versus X-ray correlation statistical results are presented;in Sections 6 and 7, we report our discussion and conclusions.Throughout this paper, we assume a flat � cold dark matter cos-mology with (�M, ��) = (0.3, 0.7) and a Hubble constant of70 km s−1 Mpc−1 (Jarosik et al. 2011).
2 TH E S A M P L E A N D T H E X - R AY DATA
The sample is extracted from the third INTEGRAL/IBIS surveywhich lists around 140 (identified and candidates) AGN (Bird et al.2007). To this large sample, the V/Vmax test3 has been applied toobtain a complete sample of 79 AGN selected in the hard (20–40 keV) X-ray band above ∼5σ confidence level (see Malizia et al.2009 for the detailed definition of the method and sample); the sam-ple includes 46 Seyfert 1 (including 6 narrow-line objects) and 33Seyfert 2. The original sample in Malizia et al. (2009) contains alsonine blazars, which we have excluded in the present study becauseDoppler boosting effects prevent from a correct determination ofthe intrinsic radio luminosity.
The X-ray properties of the sample are described in Maliziaet al. (2009) where the 20–100 keV fluxes were taken from the IN-TEGRAL survey (Bird et al. 2007), while the 2–10 keV observedfluxes and column densities were collected from the literature. Inorder to obtain the 2–10 keV unabsorbed fluxes from the observedones, we have here applied a correction factor proportional to themeasured X-ray column density NH as in column 8 of table 1 inMalizia et al. (2009), assuming simple photoelectric absorption inXSPEC. The sample includes five Compton thick AGN (MKN 3,NGC 3281, NGC 4945, Circinus galaxy, IGR J16351−5806 andNGC 1068), for which both 2–10 and 20–100 keV fluxes require acorrection (the hard X-ray fluxes are very marginally affected byabsorption for NH < 1024 cm−2). In Malizia et al. (2009), the cor-rection in the 20–40 keV flux as a function of NH was calculatedusing a simple absorbed power-law model in XSPEC, obtaining anaverage flux reduction negligible below log NH = 24 and progres-sively more important thereafter (8, 25 and 64 per cent reduction inthe ranges 24–24.5, 24.5–25 and 25–25.5, respectively). In Burlonet al. (2011), the observed/intrinsic flux ratio is plotted against theNH value, a few Compton thick sources with available observed andintrinsic luminosities are overplotted to the predicted trend for localAGN. The flux reduction is 40, 85 and 94 per cent in the ranges24–24.5, 24.5–25 and 25–25.5, respectively. In this work, we haveapplied a tentative flux correction as in Burlon et al. (2011). Weshould also consider that for the heavily absorbed source NGC
3 A test of the uniformity of the space distribution in a flux-limited sample isintroduced by Schmidt (1968). The test compares the volume (V) enclosedwithin the distance of a source with the maximum volume (Vmax) that wouldbe enclosed at the maximum redshift at which the object would be detectable.
1068 (NH > 1025 cm−2), an estimate of the intrinsic hard lumi-nosity is difficult to obtain, given its spectral complexity and theunknown precise value of NH (Iwasawa, Fabian & Matt 1997; Mattet al. 2004).
3 TH E R A D I O DATA
The NRAO VLA Sky Survey (NVSS; Condon et al. 1998) is a1.4 GHz continuum survey covering the entire sky north of −40 degdeclination. The restoring beam of the NVSS maps is 45 arcsecfull width at half-maximum (FWHM) and the rms brightness fluc-tuations in the images are about 0.45 mJy beam−1. The SydneyUniversity Molonglo Sky Survey (SUMSS; Bock, Large & Sadler1999; Mauch et al. 2003) at 843 MHz covers the whole sky southof declination −30 deg and produces images with a resolutionof 45 arcsec × 45 arcsec cosec |dec| and an rms noise level of∼1 mJy beam−1. Thus, SUMSS and NVSS have similar sensitivityand resolution, and together cover the whole sky.
We extracted maps of about 30 arcmin × 30 arcmin in size fromthe Postage Stamp Services available for both surveys centring therequested map at the coordinates of the optical nucleus of the galaxyassociated by Malizia et al. (2009) to the INTEGRAL source. FITSimages were imported into NRAO Astronomical Image ProcessingSystem (AIPS) and analysed using standard AIPS tasks. When the ra-dio sources are either unresolved or slightly resolved, all parametersand associated errors were determined through a Gaussian fit of eachcomponent using the AIPS task IMFIT. For extended sources, coor-dinates and flux density of the radio emission peaks were obtainedusing the AIPS task TVSTAT. The integrated flux density were alsoobtained using TVSTAT over a polygon encompassing the radioemission visible down to the 3σ level of the map to avoid confusionwith the extended background emission.
The measured quantities are collected in Table 1.For unresolved sources, i.e. those for which IMFIT computes
FWHM values smaller than one-half the restoring beam4 size inboth dimensions, the reported sizes are set to one-half the restoringbeam size at FWHM. These dimensions are obviously upper limitsbecause the true dimensions are not known. We define slightly re-solved sources as those for which IMFIT computes values for thesize larger than one-half the restoring beam size at FWHM in at leastone of the two dimensions. In this case, the reported angular size isthe deconvolved size provided by IMFIT for the slightly-resolveddimension(s) and one-half the restoring beam size at FWHM, other-wise. For those sources marked as resolved, namely those for whichfitting the emission with a single Gaussian was clearly not suitable,the extension of the radio source has been computed directly fromthe map by measuring the extension of the radio emission visibleabove a 3σ level in two orthogonal directions. Note that the differentfrequency between the two surveys does not allow a direct compar-ison of the linear dimensions, different radio structures are indeeddetected depending on the observational frequency. The errors onthe estimated quantities were directly provided by the task IMFIT(when used). For the extended sources, we decided to use the noiseof the map (determined from a source-free rectangular region) asthe uncertainty on the peak flux density, while the uncertainty on
4 The restoring beam size of the NVSS and SUMSS images is 45 arcsec×45 arcsec and 43 arcsec × 43 arcsec, respectively.
MNRAS 447, 1289–1298 (2015)
Dow
nloaded from https://academ
ic.oup.com/m
nras/article/447/2/1289/2593628 by guest on 10 January 2022

The radio properties of hard X-ray AGN 1291
the integrated flux density was computed using the formula
�Si = σ × 2
√pixarea
pixbeam,
where σ is the rms noise, pixarea and pixbeam are the number of pixelwithin the area over which we integrate and the pixel in the beam,respectively.
For the SUMSS sources, the flux density at 843 MHz has beenconverted into 1.4-GHz flux density assuming Sν ∝ ν−α with
Table 1. The NVSS data for the INTEGRAL/IBIS complete sample of AGN.
Name Class z LX LHX Sp Si Lp Li Dmin Dmaj Mor. M Ref.(1) (2) (3) (4) (5) (6) (7) (8) (9) (10) (11) (12) (13) (14)
IGR J00333+6122 Sy 1.5 0.1050 44.19 44.44 9.0 9.5 39.46 39.48 < 49.09 < 49.09 U 8.5 1NGC 788 Sy 2 0.0136 42.86 43.29 6.0 19.5 37.61 38.17 27.13 35.6 R 7.5 2NGC 1068 Sy 2 0.0038 42.95 43.35 4.5e3 5.0e3 39.27 39.32 17.05 18.95 R 7.2 2QSO B0241+62 Sy 1 0.0440 43.87 44.41 353.8 374.9 40.30 40.32 < 20.57 < 20.57 U 8.5 3NGC 1142 Sy 2 0.0288 43.82 43.96 139.5 158.4 39.53 39.58 < 13.46 < 13.46 U 9.4 2B3 0309+411B Sy 1 0.1360 45.04 44.99 344.8 389.5 41.27 41.44 423.9 1373 R – –NGC 1275 Sy 2 0.0175 42.89 43.38 2.3e4 2.3e4 41.30 41.33 93.81 109.1 R 8.5 23C 111 Sy 1 0.0485 44.52 44.66 3.5 15.1 41.38 42.01 320.5 393 R 9.6 2LEDA 168563 Sy 1 0.0290 43.90 44.04 12.4 15.0 38.48 38.56 < 13.56 15.68 S 8.0 44U 0517+17 Sy 1.5 0.0179 43.23 43.62 6.0 6.1 37.75 37.76 < 8.368 8.484 S 7.0 5MCG+08-11-11 Sy 1.5 0.0205 43.69 43.74 228.5 249.3 39.45 39.50 38.33 84.34 R 8.1 2Mrk 3 Sy 2 0.0135 44.17 43.79 1.1e3 1.1e3 39.76 39.77 < 6.311 < 6.311 U 8.7 2Mrk 6 Sy 1.5 0.0188 43.27 43.57 259.6 281.2 39.43 39.46 < 8.789 < 8.789 U 8.2 2IGR J07565−4139 Sy 2 0.0210 42.14 43.21 5.4 3.9 37.84 37.70 < 9.381 14.05 S∗ – –IGR J07597−3842 Sy 1.2 0.0400 43.90 44.11 3.8 3.6 38.24 38.22 < 18.7 < 18.7 U 8.3 1ESO 209−12 Sy 1 0.0396 43.43 43.87 37.6 45.6 39.23 39.32 < 17.69 36.7 S∗ – –FRL 1146 Sy 1.5 0.0316 43.39 43.56 13.1 21.8 38.61 38.82 63.03 94.55 R – –SWIFT J0917.2−6221 Sy 1 0.0573 44.17 44.17 41.4 46.1 39.60 39.64 < 25.6 35.35 S∗ 9.9 6MCG−05-23-16 Sy 2 0.0085 43.09 43.34 14.1 14.8 37.47 37.49 < 3.974 < 3.974 U 6.3 2IGR J09523−6231 Sy 1.9 0.2520 45.28 45.22 5.6 5.0 40.02 39.97 < 112.6 < 112.6 U∗ 7.6 2SWIFT J1009.3−4250 Sy 2 0.0330 42.96 43.81 17.2 16.8 38.74 38.73 < 14.74 28.52 S∗ – –NGC 3281 Sy 2 0.0115 43.68 43.35 73.1 81.6 38.45 38.50 < 5.376 < 5.376 U 8.0 2SWIFT J1038.8−4942 Sy 1.5 0.0600 44.04 44.04 3.1 2.9 38.51 38.48 < 26.8 30.67 S∗ – –IGR J10404−4625 Sy 2 0.2392 44.93 45.58 42.0 43.3 40.84 40.86 < 106.9 204 S∗ – –NGC 3783 Sy 1 0.0097 43.07 43.42 35.5 45.5 38.00 38.15 16.93 55.63 R 7.5 2IGR J12026−5349 Sy 2 0.0280 43.11 43.81 49.9 57.5 39.06 39.34 87.27 143.1 R – –NGC 4151 Sy 1.5 0.0033 43.05 43.16 348.9 370.7 38.04 38.07 < 1.543 < 1.543 U 7.5 2Mrk 50 Sy 1 0.0234 43.05 43.20 < 1.5 – < 37.37 – – – – 7.5 7NGC 4388 Sy 2 0.0084 43.00 43.54 93.5 125.5 38.29 38.48 28.27 49.22 R 7.2 2NGC 4507 Sy 2 0.0118 43.08 43.70 47.6 67.1 38.28 38.43 < 5.999 8.086 R 7.6 2LEDA 170194 Sy 2 0.0360 43.48 44.22 35.4 40.6 39.13 39.23 76.3 130.2 R 8.9 2NGC 4593 Sy 1 0.0090 42.80 43.09 4.0 8.3 37.18 37.81 15.71 35.9 R 7.0 2IGR J12415−5750 Sy 1 0.0230 42.93 43.40 15.1 16.9 38.37 38.42 < 10.27 15.83 S∗ 8.0 1NGC 4945 Sy 2 0.0019 42.20 42.55 3.9e3 4.5e3 38.62 38.89 10.19 27 R 6.2 2IGR J13091+1137 Sy 2 0.0251 43.44 43.77 < 1.4 – < 37.42 – – – – 8.6 2IGR J13109−5552 Sy 1 0.0850 43.88 44.56 408.9 530.5 40.94 41.21 201.3 667.6 R∗ – –Cen A Sy 2 0.0018 42.36 42.70 6.5e3 2.1e4 39.35 40.53 4.264 33.66 R∗ 8.0 2MCG−06-30-15 Sy 1.2 0.0077 42.63 42.76 < 1.5 – < 36.40 – – – – 6.7 2NGC 5252 Sy 2 0.0230 43.72 43.71 15.9 16.9 38.39 38.41 < 10.75 < 10.75 U 9.0 24U 1344−60 Sy 1.5 0.0130 43.70 43.41 < 9.2 – 37.50 41.54 – – –∗ – –IC 4329A Sy 1.2 0.0160 43.74 44.06 63.6 69.0 38.67 38.76 37.9 113.7 R 7.0 2Circinus Galaxy Sy 2 0.0014 42.39 42.15 715.3 1256.9 37.64 38.04 10.3 16.41 R∗ 6.0 2NGC 5506 Sy 1.9 0.0062 42.83 42.85 332.3 345.7 38.57 38.59 < 2.898 < 2.898 U 6.7 2ESO 511−G030 Sy 1 0.2239 45.13 45.56 8.3 14.0 40.08 40.31 118.6 224.8 R 8.7 8IGR J14515−5542 Sy 2 0.0180 42.68 43.04 16.5 16.5 38.19 38.19 < 8.041 11.79 S∗ – –IC 4518A Sy 2 0.0163 42.83 43.09 144.3 184.2 39.05 39.33 48.77 71.12 R∗ 7.5 9IGR J16024−6107 Sy 2 0.0110 41.66 42.46 8.8 6.1 37.49 37.33 < 4.914 < 4.914 U∗ – –IGR J16119−6036 Sy 1 0.0160 42.24 43.13 < 4.9 – < 37.41 – – – –∗ – –IGR J16185−5928 NLS1 0.0350 43.10 43.67 4.7 5.3 38.23 38.27 < 15.64 38.04 A∗ 7.4 1IGR J16351−5806 Sy 2 0.0091 42.51 42.74 69.8 84.2 38.22 38.41 27.23 30.63 R∗ – –IGR J16385−2057 NLS1 0.0269 43.02 43.39 6.5 7.2 38.13 38.24 < 12.58 15.34 S 6.8 1IGR J16426+6536 NLS1 0.3230 – 45.97 < 1.2 – < 39.57 – – – – 7 1IGR J16482−3036 Sy 1 0.0310 43.60 43.79 2.4 7.8 37.89 38.40 57.97 112.1 R 8.2 1IGR J16558−5203 Sy 1.2 0.0540 44.33 44.31 5.3 3.0 38.65 38.40 < 24.12 < 24.12 U∗ 7.9 1NGC 6300 Sy 2 0.0037 41.87 42.28 18.8 64.3 36.92 37.54 11.53 20.3 R∗ 5.5 2GRS 1734−292 Sy 1 0.0214 43.56 43.90 46.3 48.5 38.79 38.81 < 10 < 10 U 8.9 22E 1739.1−1210 Sy 1 0.0370 43.56 43.89 3.4 3.1 38.13 38.09 < 17.3 < 17.3 U 8.2 1
MNRAS 447, 1289–1298 (2015)
Dow
nloaded from https://academ
ic.oup.com/m
nras/article/447/2/1289/2593628 by guest on 10 January 2022

1292 F. Panessa et al.
Table 1 – continued
Name Class z LX LHX Sp Si Lp Li Dmin Dmaj Mor. M Ref.(1) (2) (3) (4) (5) (6) (7) (8) (9) (10) (11) (12) (13) (14)
IGR J17488−3253 Sy 1 0.0200 43.07 43.52 < 1.2 – < 37.14 – – – – – –IGR J17513−2011 Sy 1.9 0.0470 43.40 44.10 1.5 1.8 37.99 38.06 < 21.97 59.68 A 6.0 2IGR J18027−1455 Sy 1 0.0350 43.23 44.04 5.7 8.4 38.51 38.87 30.54 144 R – –IGR J18249−3243 Sy 1 0.3550 45.13 45.47 2.7e3 4.1e3 43.01 43.18 1593 1770 R – –IGR J18259−0706 Sy 1 0.0370 43.19 43.66 2.7 9.6 38.66 38.89 69.19 133.8 R – –ESO 103−35 Sy 2 0.0133 43.26 43.49 24.5 26.0 38.10 38.13 < 5.941 < 5.941 U∗ 7.1 23C 390.3 Sy 1 0.0561 44.34 44.60 4.2e3 7.0e3 41.61 42.02 230.8 419.6 R 8.5 22E 1853.7+1534 Sy 1 0.0840 44.25 44.56 3.5 3.4 38.86 38.84 < 39.27 < 39.27 U 8.2 1IGR J19378−0617 NLS1 0.0106 42.91 42.64 39.3 44.0 38.11 38.16 < 4.955 < 4.955 U 6.8 10NGC 6814 Sy 1.5 0.0052 40.98 42.52 13.7 52.9 37.07 37.66 18.8 27.88 R 7.1 2Cyg A Sy 2 0.0561 44.68 44.73 4.6e5 1.7e6 43.81 44.17 279.8 468.6 R 9.4 11IGR J20186+4043 Sy 2 0.0144 42.57 42.98 < 4.1 – < 37.39 – – – – – –4C 74.26 Sy 1 0.1040 44.75 45.04 190.5 208.8 41.25 41.76 259.3 1724 R 9.6 2S52116+81 Sy 1 0.0840 44.25 44.77 243.8 311.6 40.71 40.99 345.6 701.6 R 8.8 2IGR J21247+5058 Sy 1 0.0200 43.81 43.96 210.6 399.6 39.51 40.47 82.28 279.3 R 6.6 1SWIFT J2127.4+5654 NLS1 0.0140 42.89 43.04 6.0 7.3 37.53 37.62 < 6.545 7.918 S 7.2 1RX J2135.9+4728 Sy 1 0.0250 43.00 43.32 6.6 7.2 38.08 38.12 < 11.69 < 11.69 U – –NGC 7172 Sy 2 0.0087 42.51 43.11 33.3 39.1 37.87 38.01 17.35 36.88 R 7.7 2MR 2251−178 Sy 1 0.0640 44.23 44.79 15.2 17.4 39.26 39.32 < 29.92 < 29.92 U 6.9 2MCG−02-58-22 Sy 1.5 0.0469 44.16 44.25 30.8 34.8 39.29 39.35 < 21.93 < 21.93 U 7.1 2IGR J23308+7120 Sy 2 0.037 42.80 43.55 2.1 4.0 37.92 38.20 25 40.31 S – –IGR J23524+5842 Sy 2 0.1640 44.41 44.85 < 1.5 – < 39.06 – – – – – –
Notes. Col. (1) galaxy name; cols (2 and 3) optical classification and redshift from Malizia et al. (2009); cols (4 and 5) 2–10 keV and 20–100 keVlogarithmic luminosities in erg s−1, corrected for absorption; cols (6 and 7) peak flux density (mJy beam−1) and integrated flux density (mJy) at1.4 GHz; for the SUMSS data the 843 MHz flux has been converted to 1.4 GHz assuming a spectral index of 0.7; cols (8 and 9) 1.4-GHz peak andintegrated logarithmic luminosities in erg s−1; cols (10 and 11) minor and major axis sizes in kpc measured from the deconvolved sizes at 1.4 GHzfrom the NVSS and at 843 MHz from the SUMSS; col. (12) radio morphology class, adopting the definitions by Ulvestad & Wilson (1984): ‘U’(single, unresolved), ‘S’ (single, slightly resolved), ‘R’ (resolved) and ‘A’ (ambiguous). ∗ source from the SUMSS survey; cols (13 and 14) logarithmof BH mass (in M�) and relative reference: (1) Masetti web page: http://www.iasfbo.inaf.it/∼masetti/IGR/main.html, (2) Wang, Mao & Wei (2009),(3) Beckmann et al. (2009), (4) Raimundo et al. (2012), (5) Stalin et al. (2011), (6) Perez et al. (1989), (7) Barth et al. (2011), (8) Winter et al. (2009),(9) Kim, Im & Kim (2010), (10) Alonso-Herrero et al. (2013), (11) McKernan, Ford & Reynolds (2010).
α = 0.7. This is an average slope value expected for radio op-tically thin synchrotron emission, however, slopes can vary fromsteep to flat or inverted depending on the source, usually Seyfertradio cores show flat/inverted slopes on arcsecond scales (Ho &Ulvestad 2001), while steep optically thin synchrotron slopes areassociated with extended structures such as lobes. The flux mea-sured can vary by ∼30 per cent from steep to flat/inverted slopesduring the conversion from 843 MHz to 1.4 GHz; however, thisaffects only marginally the results on our correlations (see the nextsection) as the SUMSS sources will probably have spectral slopevariously distributed, and these differences will be averaged in thestatistical treatment of the fluxes.
The absolute calibration of both the NVSS and SUMSS fluxdensity scale is 3 per cent (Kaplan et al. 1998, uncertainties relativeto the Baars et al. 1977 scale).
Following the classification outlined before and adopting defini-tions consistent with those of Ulvestad & Wilson (1984) and Ho &Ulvestad (2001) for the radio morphology we distinguish betweenfour classes in our sample: ‘U’ (single, unresolved), ‘S’ (single,slightly resolved), ‘R’ (diffuse or linear, clearly resolved) and ‘A’(ambiguous, marginally detected). By way of example, in Fig. 1 weshow radio images of four galaxies selected as prototype of the dif-ferent morphological classes proposed, i.e. NGC 5252, NGC 4507,4C 74.26 and IGR J17513−2011, as U, S, R and A, respectively.
Of the two sources labelled as ‘ambiguous’, one is onlymarginally detected (IGR J17513−2011) and one is possibly con-taminated by a background radio source (IGR J16185−5928). Note
that also in the NVSS image of IGR J16385−2057, there is a back-ground radio galaxy which might contaminate the radio emissionmeasured; however, this source is still under study and we report itas S (see Tarchi et al. in preparation).
4 TH E R A D I O PRO P E RTI E S O F TH E INTEGRALSAMPLE
The complete hard X-ray INTEGRAL sample offers the opportunityto study the characteristics of the radio emission at kpc scales for asample of bright local AGN.
A galaxy was considered detected in the NVSS/SUMSS mapswhen a source with a peak flux density greater than or equal to threetimes the rms noise of the map was found coincident, within theuncertainties, with the optical position given in Malizia et al. (2009).Of the 79 sources in this sample, 58 sources belong to the NVSSsurvey, the remaining 21 have been observed with the SUMSSsurvey. In our sample, only nine sources have not been detected. Wehave checked for a possible detection in other observations availablein literature and, of the nine undetected sources, only MCG−6-30-15 has been detected with Very Large Array (VLA) at 8.4 GHzwith 0.64 mJy (Mundell et al. 2009), while IGR J17488−3253 hasan upper limit of 2.1 mJy with GMRT at 0.61 GHz (Pandey et al.2006), IGR J20186+4043 has been observed with VLA-D and hasbeen associated with an extended radio source, possibility the AGNcounterpart, although the association is not secure (Bykov et al.2006). The remaining sources have no other radio data.
MNRAS 447, 1289–1298 (2015)
Dow
nloaded from https://academ
ic.oup.com/m
nras/article/447/2/1289/2593628 by guest on 10 January 2022

The radio properties of hard X-ray AGN 1293
Figure 1. Prototype of the different morphological classes proposed, i.e. top left: NGC 5252 (U), top right: NGC 4507 (S), bottom left: 4C 74.26 (R) andbottom right: IGR J17513−2011 (A). The NED optical position is marked with a cross.
Limiting this work to the NVSS and SUMSS observations, thesample detection rate is therefore 89 per cent. This fraction is similarto the 85 per cent found for an optically selected sample observedwith VLA (1.4 and 5 GHz) at high resolution (∼1 arcsec) by Ho& Ulvestad (2001). The first and only (up to now) radio follow-up of hard X-ray selected sources has been reported in Burlonet al. (2013), where only 20 per cent of the Swift/BAT AGN areassociated with a 20-GHz AT20G detection in the southern sky.However, the low detection rate could be ascribed to the low sensi-tivity of the AT20G survey (∼40 m Jy) and to the higher observingfrequency with respect to the NVSS/SUMSS surveys, suggestingthat only bright radio sources are revealed. Indeed, the radio lu-minosities of Seyfert galaxies in Burlon et al. (2013) are almostuniformly distributed from 1039 to 1044 erg s−1, while INTEGRALsources show 1.4-GHz peak luminosities that vary from ∼1037 upto ∼1044 erg s−1, with a peak distribution around 1037–1040 erg s−1.However, INTEGRAL AGN are still radio bright when comparedwith optically selected Seyferts, whose radio luminosities are typi-
cally found in the range 1034–42 erg s−1 (Nagar et al. 2002; Panessaet al. 2007).
A measure of the radio brightness with respect to other wave-lengths is given by the radio loudness, classically defined by theratio between the radio and the optical luminosities. Among opti-cally selected AGN, the radio-loudness parameter shows a bimodaldistribution dividing radio-loud and radio-quiet AGN at the limitof R ≡ LR/LB ≤ 10 (Kellermann et al. 1989). Lately, Terashima &Wilson (2003) have introduced the X-ray radio-loudness parameterRX ≡ LR/L2−10 keV. Indeed, the X-ray luminosity is ideal to avoidextinction problems which normally occur in the optical band. Aneven more absorption unbiased measure is given by using the hardX-ray luminosity; therefore, here we define the hard X-ray radio-loudness parameter as RHX ≡ LR/L20−100 keV. In Fig. 2, we plotthe X-ray and hard X-ray radio-loudness histograms, the blue lineshows the radio-loud versus radio-quiet limit set by Terashima &Wilson (2003), i.e. RX = −4.5. The INTEGRAL sample is character-ized both by radio-quiet and radio-loud AGN, with a prevalence of
MNRAS 447, 1289–1298 (2015)
Dow
nloaded from https://academ
ic.oup.com/m
nras/article/447/2/1289/2593628 by guest on 10 January 2022

1294 F. Panessa et al.
Figure 2. Left: X-ray radio loudness given by the ratio of the 1.4-GHz peak luminosity over the 2–10 keV luminosity. The blue line is the radio-loud versusradio-quiet limit set by Terashima & Wilson (2003). Right: hard X-ray radio loudness given by the ratio of the 1.4-GHz peak luminosity over the 20–100 keVluminosity.
radio-quiet AGN; however, the hard X-ray emission is clearly dom-inant with respect to the radio emission. From a comparison withthe radio-loudness distribution in the BAT sample from Burlon et al.(2013), we find that their sources are more radio loud (−4 < logRHX < 0). Again, the high limiting flux density of the AT20G sur-vey allows the detection of only very bright radio sources, while theuse of NVSS/SUMSS data allows the detection of low radio lumi-nosity sources also. No bimodality is found in the radio-loudnessdistribution, in agreement with recent findings that suggest that thebimodality is a consequence of selection biases while well-selectedsamples of AGN show a continuous level of radio loudness (e.g.Cirasuolo et al. 2003; La Franca et al. 2010).
In our sample, a wide range of radio morphologies is seen. 36of the 70 objects (51 per cent) detected in the NVSS/SUMSS mapsshow an unresolved (22) or slightly resolved (14) central sourcecoincident, within the uncertainties, with the position of the opticalnucleus. Except for the two ‘ambiguous’, the remaining 31 sources(44 per cent of all detected objects) show evident extended emission,either ‘linear’ or ‘diffuse’, with linear sizes ranging from a few kpcto hundreds of kpc. In particular, sources with ‘linear’ radio mor-phology show triple or double emitting structures, thus indicatingthe presence of large-scale radio jets/lobes, with or without a com-pact core, respectively, typically found in powerful radio galaxies.Indeed, some of the sources in the sample labelled as ‘resolved’(e.g. Cen A and Cyg A) are among the most famous radio galaxies
in the sky. Extended-diffuse morphologies might appear unresolvedor slightly resolved sources if the host galaxy is distant enough (forthe survey angular resolution). However, in our sample of localgalaxies, U, S and R sources are equally distributed in redshift;interestingly, one of the most distant sources, IGR J18249−3243,is one of the most extended ones (see Landi et al. 2009).
5 T H E X - R AY V E R S U S R A D I O C O R R E L AT I O N
We have used the ASURV program (Feigelson & Nelson 1985; Isobe,Feigelson & Nelson 1986) for the statistical analysis of our correla-tions, which includes several statistical methods that deal with datasets containing both detections and non-detections (upper limits inour case). Within the program, we have used the generalized ver-sion of Spearman’s rank order correlation coefficient and the gen-eralized Kendall’s τ test to compute the correlation significance.The Buckley–James regression method has been used to calculatethe linear regression coefficients. In Table 2, we report the resultsof the statistical analysis.
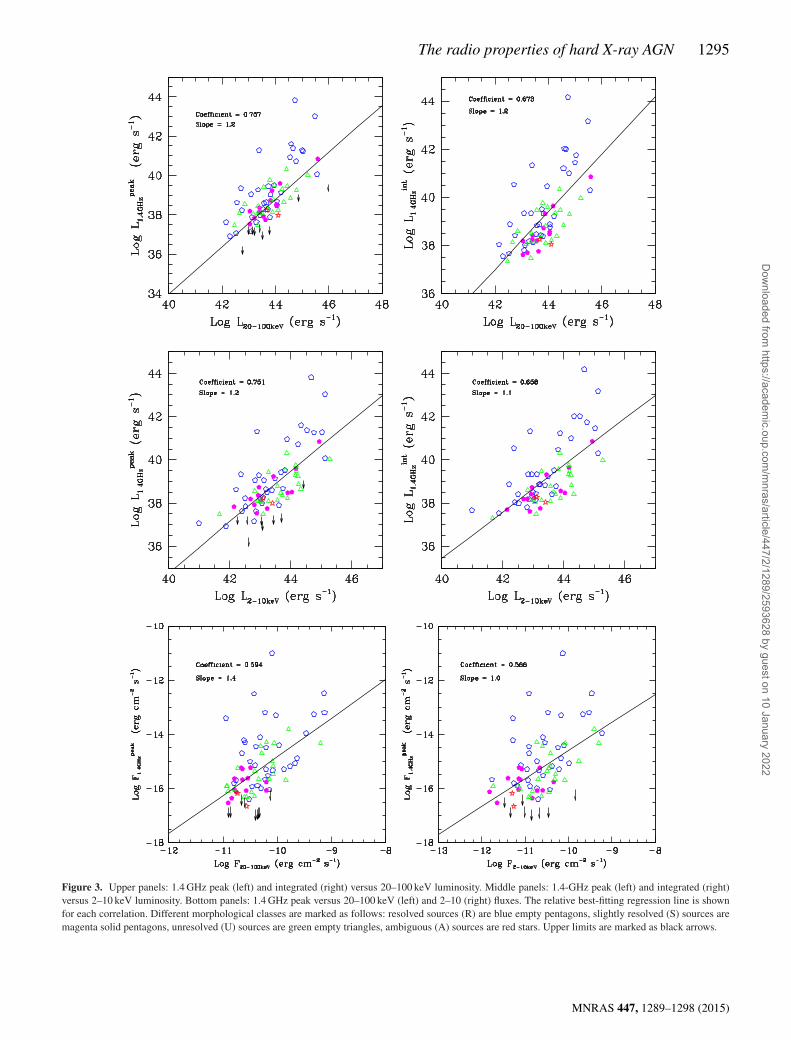
In Fig. 3, we show the 1.4-GHz peak (left) and integrated (right)luminosity versus the 20–100 keV luminosity with its best-fittingregression lines. The two correlations are both highly significant(see Table 2) and display a very similar slope (1.21 ± 0.15 and1.20 ± 0.16, respectively). A similar result is obtained if the radiopeak and integrated luminosities are plotted against the 2–10 keV
Table 2. The NVSS data for the INTEGRAL/IBIS complete sample of AGN.
Variables N Spearman p-value z-score p-value Partial τ σ Prob. a b(1) (2) (3) (4) (5) (6) (7) (8) (9) (10) (11)
log L1.4 GHz peak versus log LHX 79 0.757 0.0 7.390 0.0 0.33 0.05 0.0 1.21 ± 0.15 −14.0log L1.4 GHz int versus log LHX 70 0.673 1.1 × 10⁻⁸ 6.136 0.0 0.28 0.06 0.0 1.20 ± 0.16 −13.4log L1.4 GHz peak versus log LX 78 0.751 0.0 7.270 0.0 0.32 0.06 0.0 1.17 ± 0.13 −12.1log L1.4 GHz int versus log LX 70 0.658 2.3 × 10⁻⁸ 5.918 1.7 × 10⁻⁹ 0.28 0.06 1.4 × 10⁻⁴ 1.08 ± 0.15 −7.7log F1.4 GHzpeak versus log FHX 79 0.594 7.8 × 10⁻⁸ 5.581 1.2 × 10⁻⁸ – – – 1.42 ± 0.26 −0.6log F1.4 GHzpeak versus log FX 78 0.566 3.4 × 10⁻⁷ 5.250 7.6 × 10⁻⁸ – – – 1.03 ± 0.20 −4.3
Notes. Cols (2–4): number of variables, Spearman’s ρ correlation coefficient and probability for rejecting the null hypothesis that there is no correlation;cols (5 and 6): generalized Kendall’s τ z-score and probability for the null hypothesis; cols (7–9): partial Kendall’s τ correlation coefficient, the square rootof the variance, σ , and the associated probability P for the null hypothesis; cols (10 and 11): correlation coefficient of the best-fitting linear regression linecalculated using Backley–James linear regression method, Y = a × X + b.
MNRAS 447, 1289–1298 (2015)
Dow
nloaded from https://academ
ic.oup.com/m
nras/article/447/2/1289/2593628 by guest on 10 January 2022
The radio properties of hard X-ray AGN 1295
Figure 3. Upper panels: 1.4 GHz peak (left) and integrated (right) versus 20–100 keV luminosity. Middle panels: 1.4-GHz peak (left) and integrated (right)versus 2–10 keV luminosity. Bottom panels: 1.4 GHz peak versus 20–100 keV (left) and 2–10 (right) fluxes. The relative best-fitting regression line is shownfor each correlation. Different morphological classes are marked as follows: resolved sources (R) are blue empty pentagons, slightly resolved (S) sources aremagenta solid pentagons, unresolved (U) sources are green empty triangles, ambiguous (A) sources are red stars. Upper limits are marked as black arrows.
MNRAS 447, 1289–1298 (2015)
Dow
nloaded from https://academ
ic.oup.com/m
nras/article/447/2/1289/2593628 by guest on 10 January 2022

1296 F. Panessa et al.
luminosity (Fig. 3), i.e. high significance and correlation slopes of1.12 ± 0.13 and 1.08 ± 0.15, consistent within errors. We note thathard X-ray fluxes show typically larger values than the 2–10 keVones, this naturally yields to a steeper correlation slope.
Luminosity–luminosity correlations may be distance driven. Tocheck for a possible dependence on the distance, we have performeda partial Kendall τ correlation test, which computes partial corre-lation coefficient and significance for censored data using threevariables, where we took the distance as the third variable (Akritas& Siebert 1996). The partial Kendall’s τ test results (see Table 2)suggest that the correlations are not driven by distance effects. Asa further check, we compute the correlation significance for theflux–flux plot of 1.4-GHz peak flux versus 20–100 and 2–10 keVfluxes (Fig. 3) and, despite the large scatter, the correlation remainsstatistically significant.
We compare our results with those from Burlon et al. (2013),in which the 15–55 keV BAT luminosities are correlated with the20 GHz ones. As pointed out by the authors, at 20 GHz most ofthe extended structures are resolved, allowing a more direct com-parison between the core radio emission and the hard X-rays. Thecorrelation slope for their Seyfert sample is log L15−55 keV ∝ 0.7log L20 GHz, slightly steeper but in agreement within errors with thevalues found in our sample; however, the weak correlation found isclearly driven by distance effects, in fact their sample is character-ized by several sources at high z.
6 D ISCUSSION
In BH systems, the X-ray emission typically originates in the ac-cretion flow surrounded by a hot corona or alternatively at the baseof a jet (Markoff, Nowak & Wilms 2005). The radio emission isassociated with the presence of a jet of relativistic particles emit-ting synchrotron radiation at radio frequencies. AGN with powerfulrelativistic jets only makes up 10–20 per cent of the entire AGNpopulation (Kellermann et al. 1989), the majority of which is in-stead quiet in the radio, although not silent (Ho & Ulvestad 2001).Radio cores are almost ubiquitously observed depending on the sur-vey flux limit and frequency. The 89 per cent detection rate of radiosources found within the INTEGRAL AGN survey is in agreementwith these previous statements.
The existence of a relation between the X-ray and the radio emis-sion in both stellar and supermassive BHs has opened new scenar-ios on the comprehension of the accretion–ejection mechanisms(Corbel et al. 2003; Gallo et al. 2003; Merloni et al. 2003;Falcke et al. 2004). Stellar-mass BHs follow a standard relationLR ∝ L0.5−0.7
X when they are found in their soft state (Corbelet al. 2003; Gallo et al. 2003). Interestingly, the Fundamental Plane,which unifies XRBs and AGN by scaling the radio and X-ray lu-minosity with the BH mass, displays the same slope (Merloni et al.2003). For these classes of sources it has been proposed that aninefficient accretion flow model coupled with a (scale invariant) jetcan reproduce the observed slope. Indeed, when the disc accretes atradiatively inefficient regime, the advected flow plus jet can explainboth the X-ray and radio emission (e.g. Narayan & Yi 1994).
Since the discovery of the original correlation, more and moreoutliers to the standard correlation are found, i.e. for a given X-rayluminosity the radio emission is fainter resulting in steeper slopes(e.g. Soleri et al. 2010). Coriat et al. (2011) propose that, assum-ing a standard emission model of compact jets, the steeper rela-tion (∼1.4) implies that the accretion flow is radiatively efficient,where the limit for the transition between radiatively inefficientand radiatively efficient is set to an X-ray luminosity higher than
Figure 4. Distribution of the log Eddington ratio defined as the logarithm ofthe ratio between the bolometric luminosity and the Eddington luminosity,Lbol/LEdd.
5 × 10⁻³ LEdd. Dong et al. (2014) have confirmed this hypoth-esis for a sample of high Eddington ratio AGN, by assumingLR ∝ Q1.4
jet ∝ M1.4. The significant correlation found for the INTE-GRAL AGN sample confirms these previous works. The 1.4 GHzversus 20–100 keV emission correlates with a slope of 1.2 ± 0.15,steeper than the classical 0.5–0.7, and consistent within errors withthe expected 1.4. Indeed, the Eddington ratios (Lbol/LEdd ≥ 10−3,where the bolometric luminosity is derived by applying a correctionfactor of 20 to the 2–10 keV luminosity; see Vasudevan & Fabian2007) of the INTEGRAL sample (see Fig. 4) strongly suggest thatthese sources are efficient accreting systems, as expected from theirhard X-ray selection, and behave like the outliers XRB systems dis-cussed by Coriat et al. (2011). All the above-mentioned theoreticalconsiderations assume a standard behaviour for the jet and ascribethe observed correlation slope to a particular accretion regime; how-ever, the jet emission depends on several parameters: a change inone of those (e.g. the magnetic field) could modify the radio outputwith strong influence in the correlation slope (see the discussion inCoriat et al. 2011).
We note that the radio data presented here comprise the emissionover kpc scale extension. At intermediate radio resolutions (such asthose of the VLA-A observation, i.e. arcsec), the emission comesfrom pc scales and the X-ray emission still correlates with the radioemission at 1.4, 5 and 15 GHz (Panessa et al. 2007), with a similarlevel of significance. However, at very long baseline interferometryscales (milliarcsec), no correlation is found for a sample of Seyfertgalaxies, suggesting that the very inner radio core emission at sub-pc scales is not related to the X-rays (Panessa & Giroletti 2013).All these pieces of evidence support the idea that the disc–coronaemission correlates with the total radio emission, rather than withthe inner jet emission.
However, all the above-mentioned works cannot rely on the si-multaneity of the radio versus X-ray data. When simultaneous dataare taken, only very weak correlations are found (Jones et al. 2011;King et al. 2011, 2013). For both nearby AGN NGC 4051 andNGC 4395, the intrinsic X-ray variability is observed to be strongerthan the radio variability. Assuming that the corona is at the baseof a jet, the X-ray variations may be filtered by the corona and onlypartially transferred to the jet. However in these works, radio dataare at arcsec scales, implying that the radio emission is averaged on
MNRAS 447, 1289–1298 (2015)
Dow
nloaded from https://academ
ic.oup.com/m
nras/article/447/2/1289/2593628 by guest on 10 January 2022

The radio properties of hard X-ray AGN 1297
a few hundreds pc, the different X-ray versus radio spatial scalessampled could explain the different variability. Interestingly, thesimultaneous LR ∝ LX slopes are steeper (around unity) than thestandard 0.6, suggesting that these sources are X-ray bright and thattheir emission is accretion dominated.
In interpreting the X-rays and hard X-rays versus 1.4 GHz corre-lations with our data sets we should consider two more importantaspects. One is that the lower the radio frequency is, the more theemission is contaminated by diffuse components, such as lobes ona few kpc to hundreds of kpc spatial scales. This implies that thetime-scales sampled by the NVSS and SUMSS surveys vary overthousands of years, i.e. the time needed by electrons to propagateinto the medium. On the other hand, the X-ray flux is averaged overtens of ks observations (few days), while the INTEGRAL hard X-rayemission is averaged over months to several years of sky surveying.Both the X-ray and hard X-ray emission are produced within theinner region of the accretion flow (inner disc–corona); therefore,the X-ray spatial scale sampled is of a few gravitational radii. Sum-marizing, the radio emission is averaged on much larger spatial andtime-scales with respect to the X-ray and hard X-ray emission. Asa consequence, the present correlations suggest that the accretion-related X-ray emission is related to the diffuse/total radio emissionemitted over larger scales. Within our group, we are developing amodel which correlates the hard X-ray emission with the total radioemission assuming a more or less spherical bubble on scales ofseveral arc minutes, fed by jets issuing from the core (see Wagner& Bicknell 2011; Wagner, Bicknell & Umemura 2012). Details onthis theoretical treatment and interpretation of the X-ray/radio cor-relations examined here and its implications will be presented anddiscussed in a future work (Bicknell et al. in preparation).
7 C O N C L U S I O N
We have selected a complete sample of hard X-ray AGN from theINTEGRAL survey in order to study the relation between the X-ray and hard X-ray emission with the radio emission in a sampleof bright sources. First, we have analysed the radio images fromthe NVSS and SUMSS surveys detecting a large fraction of sources(89 per cent), with different morphologies, from unresolved/slightlyresolved to extended sources over hundreds of kpc scales. We findthe existence of a significant correlation between the X-ray andhard X-ray luminosities and the peak and integrated 1.4-GHz radioluminosities. Correlation slopes are around 1–1.2, clearly steeperthan the classical 0.6 value found in the Fundamental Plane for BHactivity and consistent with the 1.4 expected for sources belongingto the efficient accretion branch (Coriat et al. 2011; Dong et al.2014). This suggests that the INTEGRAL AGN are X-ray-dominated(accretion dominated) sources accreting at high Eddington ratiosand the high-energy emission from the central engine is relatedto the radio emission averaged over kpc scales (i.e. thousands ofyears).
AC K N OW L E D G E M E N T S
We thank the anonymous referee for the valuable comments that im-proved this work. FP thanks Davide Burlon and Piergiorgio Casellafor the fruitful scientific discussions. AT and PC would like to thankMatteo Murgia for useful suggestions on the analysis of radio data.EM acknowledges Paola Parma for the technical support during partof the radio data analysis. FP acknowledges support by INTEGRALASI/INAF no. 2013-025.R.O.
R E F E R E N C E S
Akritas M. G., Siebert J., 1996, MNRAS, 278, 919Alonso-Herrero A., Pereira-Santaella M., Rieke G. H., Diamond-Stanic
A. M., Wang Y., Hernan-Caballero A., Rigopoulou D., 2013, ApJ,765, 78
Baars J. W. M., Genzel R., Pauliny-Toth I. I. K., Witzel A., 1977, A&A, 61,99
Barth A. J. et al., 2011, ApJ, 743, L4Beckmann V. et al., 2009, A&A, 505, 417Bird A. J. et al., 2007, ApJS, 170, 175Bird A. J. et al., 2010, ApJS, 186, 1Bock D. C.-J., Large M. I., Sadler E. M., 1999, AJ, 117, 1578Bonchi A., La Franca F., Melini G., Bongiorno A., Fiore F., 2013, MNRAS,
429, 1970Brinkmann W., Laurent-Muehleisen S. A., Voges W., Siebert J., Becker
R. H., Brotherton M. S., White R. L., Gregg M. D., 2000, A&A,356, 445
Burlon D., Ajello M., Greiner J., Comastri A., Merloni A., Gehrels N., 2011,ApJ, 728, 58
Burlon D., Ghirlanda G., Murphy T., Chhetri R., Sadler E., Ajello M., 2013,MNRAS, 431, 2471
Bykov A. M. et al., 2006, ApJ, 649, L21Canosa C. M., Worrall D. M., Hardcastle M. J., Birkinshaw M., 1999,
MNRAS, 310, 30Cao X.-F., Wu Q., Dong A.-J., 2014, ApJ, 788, 52Cattaneo A., Dekel A., Devriendt J., Guiderdoni B., Blaizot J., 2006,
MNRAS, 370, 1651Cattaneo A. et al., 2009, Nature, 460, 213Cirasuolo M., Magliocchetti M., Celotti A., Danese L., 2003, MNRAS, 341,
993Condon J. J., Cotton W. D., Greisen E. W., Yin Q. F., Perley R. A., Taylor
G. B., Broderick J. J., 1998, AJ, 115, 1693Corbel S., Nowak M. A., Fender R. P., Tzioumis A. K., Markoff S., 2003,
A&A, 400, 1007Coriat M. et al., 2011, MNRAS, 414, 677Croton D. J. et al., 2006, MNRAS, 365, 11Dong A.-J., Wu Q., Cao X.-F., 2014, ApJ, 787, L20Falcke H., Kording E., Markoff S., 2004, A&A, 414, 895Feigelson E. D., Nelson P. I., 1985, ApJ, 293, 192Gallo E., Fender R. P., Pooley G. G., 2003, MNRAS, 344, 60Ho L. C., Ulvestad J. S., 2001, ApJS, 133, 77Isobe T., Feigelson E. D., Nelson P. I., 1986, ApJ, 306, 490Iwasawa K., Fabian A. C., Matt G., 1997, MNRAS, 289, 443Jarosik N. et al., 2011, ApJS, 192, 14Jones S., McHardy I., Moss D., Seymour N., Breedt E., Uttley P., Kording
E., Tudose V., 2011, MNRAS, 412, 2641Kaplan D. L., Condon J. J., Arzoumanian Z., Cordes J. M., 1998, ApJS,
119, 75Kellermann K. I., Sramek R., Schmidt M., Shaffer D. B., Green R., 1989,
AJ, 98, 1195Kim D., Im M., Kim M., 2010, ApJ, 724, 386King A. L. et al., 2011, ApJ, 729, 19King A. L., Miller J. M., Reynolds M. T., Gultekin K., Gallo E., Maitra D.,
2013, ApJ, 774, L25La Franca F., Melini G., Fiore F., 2010, ApJ, 718, 368Landi R. et al., 2009, A&A, 493, 893McKernan B., Ford K. E. S., Reynolds C. S., 2010, MNRAS, 407, 2399Malizia A., Stephen J. B., Bassani L., Bird A. J., Panessa F., Ubertini P.,
2009, MNRAS, 399, 944Markoff S., Nowak M. A., Wilms J., 2005, ApJ, 635, 1203Marulli F., Bonoli S., Branchini E., Moscardini L., Springel V., 2008,
MNRAS, 385, 1846Matt G., Bianchi S., Guainazzi M., Molendi S., 2004, A&A, 414, 155Mauch T., Murphy T., Buttery H. J., Curran J., Hunstead R. W., Piestrzynski
B., Robertson J. G., Sadler E. M., 2003, MNRAS, 342, 1117Merloni A., Heinz S., di Matteo T., 2003, MNRAS, 345, 1057Mundell C. G., Ferruit P., Nagar N., Wilson A. S., 2009, ApJ, 703, 802
MNRAS 447, 1289–1298 (2015)
Dow
nloaded from https://academ
ic.oup.com/m
nras/article/447/2/1289/2593628 by guest on 10 January 2022

1298 F. Panessa et al.
Nagar N. M., Falcke H., Wilson A. S., Ulvestad J. S., 2002, A&A, 392, 53Narayan R., Yi I., 1994, ApJ, 428, L13Pandey M., Rao A. P., Manchanda R., Durouchoux P., Ishwara-Chandra
C. H., 2006, A&A, 453, 83Panessa F., Giroletti M., 2013, MNRAS, 432, 1138Panessa F., Barcons X., Bassani L., Cappi M., Carrera F. J., Ho L. C.,
Pellegrini S., 2007, A&A, 467, 519Perez E., Manchado A., Garcia-Lario P., Pottasch S. R., 1989, A&A, 215,
262Raimundo S. I., Fabian A. C., Vasudevan R. V., Gandhi P., Wu J., 2012,
MNRAS, 419, 2529Schmidt M., 1968, ApJ, 151, 393Soleri P. et al., 2010, MNRAS, 406, 1471
Stalin C. S., Jeyakumar S., Coziol R., Pawase R. S., Thakur S. S., 2011,MNRAS, 416, 225
Terashima Y., Wilson A. S., 2003, ApJ, 583, 145Ulvestad J. S., Wilson A. S., 1984, ApJ, 285, 439Vasudevan R. V., Fabian A. C., 2007, MNRAS, 381, 1235Wagner A. Y., Bicknell G. V., 2011, ApJ, 728, 29Wagner A. Y., Bicknell G. V., Umemura M., 2012, ApJ, 757, 136Wang J., Mao Y. F., Wei J. Y., 2009, AJ, 137, 3388Winter L. M., Mushotzky R. F., Reynolds C. S., Tueller J., 2009, ApJ, 690,
1322
This paper has been typeset from a TEX/LATEX file prepared by the author.
MNRAS 447, 1289–1298 (2015)
Dow
nloaded from https://academ
ic.oup.com/m
nras/article/447/2/1289/2593628 by guest on 10 January 2022