The AGN contribution to mid-infrared surveys
20
arXiv:astro-ph/0111412v1 21 Nov 2001 Astronomy & Astrophysics manuscript no. (will be inserted by hand later) The AGN contribution to mid-infrared surveys X-ray counterparts of the mid-IR sources in the Lockman Hole and HDF ⋆ D. Fadda 1,2 , H. Flores 2,3 , G. Hasinger 4 , A. Franceschini 5 , B. Altieri 6 , C.J. Cesarsky 7 , D. Elbaz 2 , and Ph. Ferrando 2 1 Instituto de Astrof´ ısica de Canarias (IAC), Via Lactea S/N, E-38205 La Laguna, Tenerife, Spain, e-mail: [email protected] 2 CEA Saclay - Service d’Astrophysique, Orme des Merisiers, F91191 Gif-sur-Yvette Cedex, France 3 Observatoire de Paris Meudon, DAEC, F92195 Meudon Principal Cedex, France 4 AIP, An der Sternwarte 16, D14482 Potsdam, Germany 5 Dipartimento di Astronomia, Universit`a di Padova, Vicolo dell’Osservatorio 5, I35122 Padova, Italy 6 XMM-Newton Operations Centre, ESA Vilspa, Apartado 50727, E-28080 Madrid, Spain 7 ESO, Karl-Schwarzschild Straße 2, D85748 Garching bei M¨ unchen, Germany Received -; accepted - Abstract. We provide constraints on the AGN contribution to the mid-IR extragalactic background light from a correlation analysis of deep X-ray and mid-IR observations in two regions centred on the Lockman Hole and Hubble Deep Field North (HDFN). The Lockman region, of more than 200 square arcminutes, was observed by ISOCAM and XMM–Newton to a depth of 0.3 mJy at 15 μm (resolving more than 30% of the mid-IR background). In the same area XMM–Newton reached flux limits of 1.4 ×10 -15 erg cm -2 s -1 in the 2–10 keV energy band and 2.4 ×10 -15 erg cm -2 s -1 in the 5–10 keV energy band, resolving about 80% of the 2–10 keV and 60% of the 5–10 keV backgrounds (the deepest observation in this hard band to date). Among the 76 galaxies detected by XMM– Newton, 24 show mid-IR emission, but the relative percentage of X-ray sources with mid-IR counterparts increases with the band energy: from 30% of the 0.5–2 keV sources up to 63% of the 5–10 keV sources. In contrast, only a small fraction of the mid-IR sources (around 10%) show X-ray emission within the sensitivity limits of XMM– Newton observations. The region centred on the HDFN has been observed by ISOCAM (24 square arcminutes) to a depth of 0.05 mJy (more than 50% of the mid-IR background is resolved at this limit) and covered with a 1 Msec exposure by Chandra. In this case, 25% of the mid-IR sources are detected in the X-ray, while 30–40% of the X-ray sources show mid-IR emission. Under the conservative assumption that all XMM sources except stars or galaxy clusters are AGN–dominated, AGNs contribute (15 ± 5)% of the total mid-IR flux in the Lockman Hole. For the HDFN we have assumed that AGN–dominated sources are luminous X-ray sources and sources with SEDs from radio to X-ray wavelengths typical of local AGNs, in which case we find that (18 ± 7)% of the mid-IR flux are due to AGN emission. If we put together all the existing information from the deepest HDFN data to the bright large-area sample in the ELAIS S1 region observed with BeppoSAX (for a total of 50 X-ray–mid-IR matched sources) using the median mid-IR to X-ray spectral indices as a function of the X-ray flux, we find an AGN contribution to the 15 μm background of (17 ± 2)%. This figure should be taken as an upper limit to the AGN contribution to the CIRB energy density, assuming standard SEDs for IR sources. We conclude that the population of IR luminous galaxies detected in the ISOCAM deep surveys, and the CIRB sources themselves, are mainly constituted by dust-obscured starbursts. Key words. cosmology — infrared observations — X-ray observations Send offprint requests to : D. Fadda ⋆ Partially based on observations with ISO and XMM, ESA projects with instruments funded by ESA Member States with the participation of ISAS and NASA, and on observations with the Canada–France–Hawaii Telescope at Mauna Kea, Hawaii. 1. Introduction The discovery of luminous mid-IR sources in the deep ISOCAM surveys (Aussel et al. 1999; Elbaz et al. 1999) sheds new light on the star formation history of the Universe (Rowan-Robinson et al. 1997; Flores et al. 1999) and the origin of the infrared extragalactic background light (Puget et al. 1998; Elbaz et al. 2001). Mid-IR ob-
-
Upload
independent -
Category
Documents
-
view
1 -
download
0
Transcript of The AGN contribution to mid-infrared surveys
arX
iv:a
stro
-ph/
0111
412v
1 2
1 N
ov 2
001
Astronomy & Astrophysics manuscript no.(will be inserted by hand later)
The AGN contribution to mid-infrared surveys
X-ray counterparts of the mid-IR sources in the Lockman Hole and HDF ⋆
D. Fadda1,2, H. Flores2,3, G. Hasinger4, A. Franceschini5, B. Altieri6, C.J. Cesarsky7, D. Elbaz2, and Ph.Ferrando2
1 Instituto de Astrofısica de Canarias (IAC), Via Lactea S/N, E-38205 La Laguna, Tenerife, Spain,e-mail: [email protected]
2 CEA Saclay - Service d’Astrophysique, Orme des Merisiers, F91191 Gif-sur-Yvette Cedex, France3 Observatoire de Paris Meudon, DAEC, F92195 Meudon Principal Cedex, France4 AIP, An der Sternwarte 16, D14482 Potsdam, Germany5 Dipartimento di Astronomia, Universita di Padova, Vicolo dell’Osservatorio 5, I35122 Padova, Italy6 XMM-Newton Operations Centre, ESA Vilspa, Apartado 50727, E-28080 Madrid, Spain7 ESO, Karl-Schwarzschild Straße 2, D85748 Garching bei Munchen, Germany
Received -; accepted -
Abstract. We provide constraints on the AGN contribution to the mid-IR extragalactic background light froma correlation analysis of deep X-ray and mid-IR observations in two regions centred on the Lockman Hole andHubble Deep Field North (HDFN). The Lockman region, of more than 200 square arcminutes, was observed byISOCAM and XMM–Newton to a depth of 0.3 mJy at 15 µm (resolving more than 30% of the mid-IR background).In the same area XMM–Newton reached flux limits of 1.4 ×10⁻¹⁵ erg cm−2 s−1 in the 2–10 keV energy band and2.4 ×10−15 erg cm−2 s−1 in the 5–10 keV energy band, resolving about 80% of the 2–10 keV and 60% of the 5–10keV backgrounds (the deepest observation in this hard band to date). Among the 76 galaxies detected by XMM–Newton, 24 show mid-IR emission, but the relative percentage of X-ray sources with mid-IR counterparts increaseswith the band energy: from 30% of the 0.5–2 keV sources up to 63% of the 5–10 keV sources. In contrast, onlya small fraction of the mid-IR sources (around 10%) show X-ray emission within the sensitivity limits of XMM–Newton observations. The region centred on the HDFN has been observed by ISOCAM (24 square arcminutes)to a depth of 0.05 mJy (more than 50% of the mid-IR background is resolved at this limit) and covered with a 1Msec exposure by Chandra. In this case, 25% of the mid-IR sources are detected in the X-ray, while 30–40% ofthe X-ray sources show mid-IR emission. Under the conservative assumption that all XMM sources except starsor galaxy clusters are AGN–dominated, AGNs contribute (15 ± 5)% of the total mid-IR flux in the LockmanHole. For the HDFN we have assumed that AGN–dominated sources are luminous X-ray sources and sources withSEDs from radio to X-ray wavelengths typical of local AGNs, in which case we find that (18± 7)% of the mid-IRflux are due to AGN emission. If we put together all the existing information from the deepest HDFN data tothe bright large-area sample in the ELAIS S1 region observed with BeppoSAX (for a total of 50 X-ray–mid-IRmatched sources) using the median mid-IR to X-ray spectral indices as a function of the X-ray flux, we find anAGN contribution to the 15 µm background of (17 ± 2)%. This figure should be taken as an upper limit to theAGN contribution to the CIRB energy density, assuming standard SEDs for IR sources. We conclude that thepopulation of IR luminous galaxies detected in the ISOCAM deep surveys, and the CIRB sources themselves, aremainly constituted by dust-obscured starbursts.
Key words. cosmology — infrared observations — X-ray observations
Send offprint requests to: D. Fadda⋆ Partially based on observations with ISO and XMM, ESA
projects with instruments funded by ESA Member States withthe participation of ISAS and NASA, and on observations withthe Canada–France–Hawaii Telescope at Mauna Kea, Hawaii.
1. Introduction
The discovery of luminous mid-IR sources in the deepISOCAM surveys (Aussel et al. 1999; Elbaz et al. 1999)sheds new light on the star formation history of theUniverse (Rowan-Robinson et al. 1997; Flores et al. 1999)and the origin of the infrared extragalactic backgroundlight (Puget et al. 1998; Elbaz et al. 2001). Mid-IR ob-
2 D. Fadda et al.: The AGN contribution to mid-infrared surveys
servations appear to be fundamental to our understand-ing of the evolution of the Universe because they offerviews of obscured star formation with a resolution suffi-cient to identify optical counterparts of the infrared emit-ters, which is often not the case of far-IR and sub-mmobservations. In particular, the ISOCAM 15 µm-centredband has proven to be well suited to the study of star for-mation up to redshifts of 1.5 (Elbaz et al. 2001), as well asto the resolution of a large part of the infrared backgrounddetected by the DIRBE and FIRAS experiments (Pugetet al. 1998; Fixsen et al. 1998; Hauser et al. 1998). Sincea large part of the star formation is detectable only in theinfrared and ISOCAM sources are rare with respect tooptical/UV sources, this implies that a large part of starforming activity occurs in rare, very luminous systems.
Obscured AGNs are known to be the major contrib-utors to the hard X-ray background (e.g. Comastri et al.1995) and a large fraction of their optical–UV energy isre-radiated at longer wavelengths, from the near-infraredto the sub-millimetre region. Although the shape of the in-frared spectrum of such sources is unknown, some authorsclaim that absorbed AGNs could contribute a substantialfraction (up to 50%) of the infrared background (Almainiet al. 1999; Fabian & Iwasawa 1999). However, the natureof the energy source in powerful infrared emitters is stilla matter of debate. Recent ISO results suggest that mostof these galaxies could host an AGN, that but their emis-sion is dominated by vigorous star formation (Genzel etal. 1998; Lutz et al. 1998). Tran et al. (2001), analysingalmost 80 mid-IR spectra of luminous and ultraluminousinfrared galaxies, found that the average contributions ofstar formation to the infrared luminosity are 82–94% forlow-luminosity sources (LIR < 1012.4 L⊙) and 44–55% forhigh luminosity sources (LIR ≥ 1012.4 L⊙).
If the bulk of the ISOCAM 15 µm galaxies, which havea typical luminosity in the 1011 L⊙ < LIR < 1012 L⊙
range and make up most of the infrared background (Elbazet al. 2001), were dusty starbursts, this would have im-portant implications on the star formation history of theUniverse (see Flores et al. 1999).
When detailed optical spectra are not available, it is inprinciple possible to classify mid-IR galaxies using mid-IRbased diagnostic diagrams (Laurent et al. 2000) or fittingtemplates with multi-wavelength data (Flores et al. 1999).The major drawback of the multi-wavelength approachis the similarity of starburst and Seyfert-2 SEDs in theradio–optical domain (see examples in Flores et al. 1999).On the other hand, the mid-IR diagnostic by Laurent etal. (2000), which is based on only five local AGNs, stronglydepends on the source redshift. Moreover, in the case ofdeep surveys, large photometric errors make it difficult todistinguish between starburst- and AGN-dominated mid-IR sources.
A direct approach consists in cross-correlating mid-IRand X-ray observations to detect AGNs and, in particular,using hard X-ray energy bands which are less sensitive tothe extinction and are thus able to reveal obscured AGNs.
In this perspective, we compared a recent XMM–Newton observation (Hasinger et al. 2001) with the mid-IR ISOCAM surveys at 6.75 µm and 15 µm (Fadda et al.2002) of a region located in the Lockman Hole and thedeep Chandra observation (Brandt et al. 2001a) with theISOCAM survey (Aussel et al. 1999) of a region centredon the Hubble Deep Field.
Pioneering studies of this type have been alreadytried by comparing BeppoSAX with ISOCAM data in theElais-S1 field (Alexander et al. 2001) and Chandra withISOCAM data in the HDFN field (Hornschemeier et al.2001). However, these studies are respectively affected bythe low sensitivity of the surveys and the small area ob-served. The present one is the first study with a sufficientdepth and sky coverage to obtain a statistically significantset of sources with hard X-ray and mid-IR emission.
In this paper, after discussing the cross-correlation ofmid-IR and X-ray catalogues and the common optical,mid-IR and X-ray properties of the sources, we comparethe sources detected in the surveys made in the Lockman,HDFN and Elais-S1 regions with ISOCAM and differentX-ray satellites (XMM, Chandra and Beppo-SAX) withlocal templates. Finally, we estimate the AGN contribu-tion to the extragalactic infrared light.
2. Observations
A region of 20×20 square arcminutes in the Lockman Hole,centred on the sky position 10:52:07+57:21:02 (2000),which corresponds to the centre of the ROSAT HRI im-age (Hasinger et al. 1993, 1998), has been surveyed byISOCAM, the mid-IR camera on board ISO (Fadda et al.2002). The field was observed for a total of 45 ks at 15 µmand 70 ks at 6.75 µm. Moreover, a shallow survey has beendone at 15 µm on a region of 40 × 40 arcmin2 with thesame centre for a total exposure time of 55 ks. Combiningthe two surveys, ISOCAM observed at 15 µm the centralregion for a total of 60 ks.
If we compare this observation with the deepestISOCAM surveys performed in the HDFN region (24.3square arcminutes for 22 ks at 15 µm and 10.4 square ar-cminutes for 23 ks at 6.75 µm, Aussel et al. 1999), theLockman Deep Survey is 16 times more extended and ∼4 times shallower at 15 µm than the HDF survey (thesensitivity depending on the integration time and on theredundancy of the observations). ISOCAM data have beenreduced using the PRETI pipeline (see Starck et al. 1999)with a few improvements as described by Fadda et al.(2000).
The XMM–Newton observation of the Lockman Holehas been done during the verification phase of the satel-lite (Hasinger et al. 2001) and is centred on the sky posi-tion 10:52:43+57:28:48 (2000) which was the centre of thePSPC ROSAT image (Hasinger et al. 1998). The total ex-posure time of this observation was 190 ks, but only 100ks are usable because of bad space weather (solar activ-ity) during the observations. The limiting fluxes of these

D. Fadda et al.: The AGN contribution to mid-infrared surveys 3
Fig. 1. Relative positions of the mid-IR and X-ray surveys. On the left, on the full-band XMM image of the LockmanHole we superimpose the contours of the area deeply surveyed by ISOCAM and the circle from inside which Hasingeret al. (2001) sources have been extracted. The area considered in the paper results from the intersection of these tworegions. On the right, on the full-band Chandra image of the Hubble Deep Field and flanking fields we draw: the fieldobserved with the Hubble Space Telescope, the field surveyed with ISOCAM (irregular contour) and the Caltech area(square).
observations are 3× 10⁻¹⁶ erg cm−2 s−1 in the 0.5–2 keVband and 1.4×10⁻¹⁵ erg cm−2 s−1 in the 2–10 keV band.
To match X-ray and mid-IR sources we considered X-ray sources detected at the 4σ level inside an off-axis angleof 10 arcminutes (Hasinger et al. 2001).
Due to the different centre of the ISOCAM and XMM–Newton observations, the size of the overlapping region is218 square arcminutes (see Fig. 1), which corresponds to70% of the XMM–Newton region. In this region, a totalof 76 sources was detected in the various X-ray bands ex-cluding clusters and stars (68, 42 and 19 in the 0.5–2 keV,2–10 keV and 5–10 keV energy bands, respectively). Inthe same area, 184 and 65 extragalactic sources were de-tected by ISOCAM at the 3σ level in the LW3 band andat 4σ level in the LW2 band which are centred on 15 µmand 6.75 µm, respectively (Fadda et al. 2002). As shownin Fig. 1, the region centred on the Hubble Deep Fieldobserved by ISOCAM (Rowan-Robinson et al. 1997) hasbeen completely covered by deep 1 Ms Chandra observa-tions (Brandt et al. 2001a). Chandra observations are oneorder of magnitude deeper than the XMM–Newton ob-servations in the 0.5–2 keV band (flux limit of 3 × 10⁻¹⁷
erg cm−2 s−1) and 2–8 keV band (flux limit of 2 × 10⁻¹⁶
erg cm−2 s−1). On the contrary, Chandra is less sensitivethan XMM–Newton in the ultra-hard band (> 5 keV). Inthe X-ray–LW3 common area, Chandra detects a total of59 sources in the full X-ray band (0.5–8 keV) and 50, 40and 23 sources in the 0.5–2 keV, 2–8 keV and 4-8 keV
bands, respectively. Aussel et al. (1999) list a total of 93LW3 sources, 42 of which have a flux greater than 0.1 mJy(completeness flux limit of the survey, Aussel et al. 2001).In the X-ray–LW2 common area (10.4 square arcminuteswith 10 ISOCAM detections), Chandra detects a total of24 sources in the full band and 22, 12 and 7 sources in thesoft, hard and ultra-hard bands, respectively.
Tables 1 and 2 summarise the percentages of X-rayand mid-IR sources which emit in the mid-IR and X-raybands, respectively. It appears clear that a large fractionof X-ray sources have an LW3 counterpart. In particular,in the case of the Lockman Hole, the percentage of X-raysources emitting in the 5–10 keV band with LW3 coun-terpart is greater than 60%. The same does not occur in
XMM LW3 LW2band # X% IR% # X% IR%
Soft 20 29+12
−10 11+3
−3 6 9+6
−5 9+7
−5
Hard 16 38+19
−15 9+6
−4 5 12+10
−7 8+6
−4
U-hard 12 63+42
−32 7+3
−2 5 26+25
−17 8+6
−4
Full 22 29+11
−9 12+7
−5 7 9+6
−4 11+7
−5
Table 1. Number of X-ray sources detected at 15 µm and6.75 µm in the Lockman Hole-centred region and percent-age with one-sigma errors of common detections relativeto the total number of X-ray and mid-IR sources in thedifferent XMM–Newton bands. Poissonian errors are com-puted according to Gehrels et al. (1986).

4 D. Fadda et al.: The AGN contribution to mid-infrared surveys
Names J2000 Coords X-Op IR-Op X-IR Optical X-ray mid-IR
α-10h δ-57o ∆ P ∆ P ∆ P V V-I R R-K’ SX HX Hard. Ratios LX LW2 LW3 αIX z T(1) (2) (3) (4) (5) (6) (7) (8) (9) (10) (11) (12) (13) (14) (15) (16) (17) (18) (19) (20) (21) (22) (23) (24)
1 (32A) 52:39.6 24:32 0.6 0 0.3 0 0.1 0 17.8 0.6 17.5 1.4 58.7 *60.2 .10 -.71 -.46 44.61 0.9+0.3
−0.3 1.3+0.4
−0.3 1.17 1.113 17 (37A) 52:48.3 21:18 1.5 2 2.5 5 2.9 2 20.3 0.9 19.9 2.6 11.2 * 7.7 -.08 -.79 -.44 42.80 0.3+0.3
−0.3 0.6+0.3
−0.3 1.29 0.467 112 (30A) 52:57.2 25:07 1.4 3 2.6 12 2.7 2 21.5 1.2 20.9 2.5 6.1 7.2 .16 -.69 -.62 44.06 <0.3 0.6+0.3
−0.4 1.29 1.527 113(120A) 53:09.5 28:21 1.0 1 1.7 3 2.1 1 20.7 0.9 20.4 2.0 5.4 * 7.5 .20 -.63 -.56 44.08 <0.3 0.8+0.4
−0.2 1.32 1.568 114 (45Z) 53:19.1 18:53 0.5 0 3.6 15 4.0 5 21.3 2.3 21.2 - 4.7 5.2 .44 -.66 -.46 43.07 <0.3 0.6+0.3
−0.4 1.32 0.711 215 (14Z) 52:42.6 31:58 2.0 96 2.1 105 1.0 2 25.2 1.4 25.0 5.6 4.6 *12.8 .96 -.33 -.50 44.51 <0.3 0.7+.35
−0.2 1.26 (1.9) -16 (12A) 51:49.6 32:49 2.5 41 2.8 51 0.9 0 23.2 - 22.9 4.9 4.1 *32.9 .93 .09 -.40 44.22 0.3+0.3
−0.2 0.4+0.3
−0.3 1.14 0.990 221(814A) 52:45.3 21:23 3.8 23 1.0 2 4.0 8 20.9 0.7 20.4 1.5 3.0 2.9 .19 -.66 -.67 44.29 <0.3 0.3+0.2
−0.2 1.32 2.832 132(486A) 52:43.4 27:59 1.0 10 1.6 25 0.8 0 24.7 2.2 24.4 5.6 1.9 * 4.4 .92 -.41 -.39 43.36 <0.3 0.3+0.3
−0.2 1.31 (1.0) -35 51:46.6 30:35 - - - - 4.0 8 - - 25.6 4.0 1.8 - .64 -.79 -.00 - <0.3 0.3+0.2
−0.2 >1.40 - -36 (36F) 52:24.9 22:49 3.2 18 2.3 9 3.0 2 21.7 1.4 22.4 4.4 1.8 - .22 -.56 -.82 <42.63 <0.3 0.7+0.3
−0.2 >1.45 0.807 141 51:28.3 27:40 0.4 1 3.7 120 4.0 8 24.3 1.9 22.8 3.2 1.6 *12.4 1.0 .14 -.54 44.17 <0.3 0.3+0.3
−0.2 1.22 (1.4) -43 52:06.8 29:26 1.1 2 0.7 1 1.9 1 22.6 2.3 21.9 4.5 1.5 * 8.4 .87 -.01 -.68 43.33 <0.3 0.6+0.3
−0.3 1.28 (0.75) -78(438A) 52:55.1 19:52 3.0 59 0.4 1 3.3 0 24.6 2.6 24.2 6.0 0.7 - .67 -.36 -.70 <43.23 0.4+0.3
−0.3 1.4+0.4
−0.3 >1.52 (1.4) -79 (33A) 52:00.6 24:21 2.1 15 3.7 50 4.0 6 22.4 1.3 22.1 2.5 0.7 * 2.0 .77 -.32 -.08 42.99 <0.3 0.5+0.3
−0.4 1.41 0.974 182 51:55.0 24:07 2.0 12 0.4 0 1.9 0 22.7 1.7 22.0 3.3 0.6 - .87 -.27 -.74 <43.80 <0.3 1.0+0.4
−0.2 >1.49 2.4 -95(901A) 52:52.7 29:00 1.2 0 0.2 0 1.3 0 17.8 1.3 18.1 3.9 0.5 * 3.3 -.20 .07 .37 41.60 0.7+0.3
−0.3 2.4+0.5
−0.5 1.50 0.204 298 51:36.9 29:45 3.0 55 1.4 12 4.0 8 23.0 1.1 22.8 - 0.5 - 1.0 -.38 -.77 - <0.3 0.3+0.3
−0.2 >1.41 - -104 53:04.9 30:53 0.1 0 3.0 5 3.0 - 22.2 3.2 21.7 5.9 0.4 - .36 -.96 .84 <42.86 0.3+0.3
−0.2 < 0.7 - (1.0) -105 53:15.8 24:50 0.4 2 2.6 65 3.2 5 25.8 3.3 24.5 5.1 0.4 5.3 .69 .26 -.28 43.20 <0.3 0.3+0.3
−0.2 1.30 (0.8) -109 51:44.6 26:51 2.2 50 2.1 46 1.6 1 24.3 1.7 23.9 4.7 0.4 - .90 -.64 -.82 <42.97 <0.3 0.3+0.2
−0.2 >1.40 (1.1) -113 53:05.6 28:10 1.5 12 1.5 12 1.3 0 23.3 1.6 23.0 4.3 - * 8.8 - .63 -.13 43.55 <0.3 0.7+0.4
−0.2 1.30 (0.9) -115 52:32.1 24:30 1.2 36 3.3 140 3.1 5 26.4 2.6 24.7 5.3 - * 4.9 - .35 -.18 43.51 <0.3 0.3+0.3
−0.2 1.29 (1.1) -121 52:31.4 25:04 3.5 195 3.4 205 0.5 - 25.3 1.9 24.9 5.1 - * 2.3 - .51 .07 43.08 0.3+0.3
−0.2 < 0.5 - (1.0) -
Table 3. List of the XMM-Newton sources with mid-IR counterparts in the Lockman Hole region ordered withdecreasing 0.5–2 keV flux. For each association we report: the XMM number with previous ROSAT name withinbrackets (1); the coordinates of the X-ray source (2,3); the offset between associated sources in arcseconds and theprobability of random association in 10−3 units for X-ray vs. optical (4,5), mid-IR vs. optical (6,7) and X-ray vs.mid-IR (8,9), respectively; the V, I, R and K′ magnitudes based on CFHT and Calar Alto observations (10–13); theX-ray fluxes in the soft (0.5–2 keV) and hard (2–10 keV) X-ray bands in 10−15 cgs units (14,15); the hardness ratios(16–18); the 2–10 keV luminosity (19); the mid-IR fluxes at 6.75 µm (20) and 15 µm in mJy (21); the αIX index(22) described in the text; the measured redshift (23) and the AGN type (24). Zero probability of random associationmeans less than 0.5 × 10⁻³. The hardness ratios, defined as (H − S)/(H + S) (where H and S represent hard andsoft bands, respectively), compare 0.2–0.5 vs. 0.5–2 keV, 0.5–2 vs. 2–4.5 keV and 2–4.5 vs. 4.5–10 keV, respectively. Inthree cases a 15 µm source has been marginally detected (SNR < 4) at 6.75 µm. We report their 6.75 µm fluxes insidebrackets. Detections in the 5–10 keV X-ray bands are marked with an asterisk on the 2–10 keV flux. The 6.75 µm fluxof the source # 95 has been derived by deblending two close sources. Redshifts are taken from Lehmann et al. (2000,2001) except for # 82 (Fadda et al. 2002). Photometric redshifts computed on the basis of V, I, R and K′ magnitudesare reported inside brackets.
Chandra LW3 LW2band # X% IR% # X% IR%
Soft 20 40+18
−15 21+8
−7 5 23+21
−15 50+55
−37
Hard 12 30+17
−13 13+6
−5 2 17+10
−6 20+35
−19
U-hard 7 30+24
−18 8+5
−4 2 29+6
−4 20+35
−19
Full 22 37+15
−13 24+9
−7 5 21+19
−13 50+55
−37
Table 2. Number of X-ray sources detected at 15 µmand 6.75 µm in the Hubble Deep Field-centred region andpercentage with one-sigma errors of common detectionsrelative to the total number of X-ray and mid-IR sourcesin the different Chandra bands. Poissonian errors are com-puted according to Gehrels et al. (1986).
the case of the Chandra deep field, probably because the4–8 keV ultra-hard band of Chandra is not so sensitiveas the similar band of XMM-Newton. On the other hand,only around 10% of the LW3 sources are detected in thevarious X-ray bands except for the soft X-ray band in theHDF, where the extremely deep Chandra observations areable also to detect normal galaxies.
In the case of LW2 observations, we have less detec-tions with respect to LW3 and a similar trend of detectionsas a function of the energy band in the Lockman Hole. Thecase of the Hubble Deep Field is not very interesting be-cause of the bad quality of the LW2 observations (only 10extragalactic sources have been detected).

D. Fadda et al.: The AGN contribution to mid-infrared surveys 5
Names J2000 Coords X-Op IR-Op X-IR Optical X-ray mid-IR
α-12h δ-62o ∆ P ∆ P ∆ P V V-I R R-Ks SX HX LX LW2 LW3 αIX z C T(1) (2) (3) (4) (5) (6) (7) (8) (9)(10) (11) (12) (13) (14) (15) (16) (17) (18) (19) (20) (21) (22)
144 PM3 6 36:36.64 13:46.9 0.4 0 1.5 5 1.9 1 22.1 1.3 20.8 2.7 4.43 * 5.53 44.02 - 0.35+0.04
−0.07 1.260.9570Q 1
171 PM3 20 36:46.35 14:04.8 0.3 0 1.2 3 1.4 3 22.9 2.1 21.7 3.9 2.80*20.10 44.190.19+0.04
−0.09 0.11+0.09
−0.02 1.030.9612 - 1163 PS3 10 36:42.22 15:45.8 0.2 0 1.1 3 1.2 0 23.3 2.4 21.6 4.3 0.84 * 2.48 43.32 - 0.46+0.05
−0.09 1.350.8575 I -198 PS3 24 36:55.46 13:11.4 0.4 1 0.9 4 0.6 1 24.5 2.8 22.9 4.7 0.40 * 0.89 43.53 <0.4 0.02+0.01
−0.01 1.161.3153 A -190 PM3 29 36:51.75 12:21.4 1.3 5 1.9 10 1.4 5 22.6 1.6 21.5 2.9 0.28 * 2.59 42.27 <0.04 0.05+0.03
−0.01 1.140.4010E -
142 PM3 5 36:35.60 14:24.4 0.5 2 0.3 1 0.5 0 23.9 1.2 23.5 4.5 0.28 * 2.82 44.11 - 0.44+0.04
−0.08 1.332.0116 - 2134 PM3 2 36:34.46 12:12.9 0.3 0 0.6 0 1.0 0 21.1 2.0 18.8 2.7 0.23 <0.27<41.63 - 0.45+0.07
−0.06 >1.560.4560I -
176 PS2 3 36:48.05 13:09.1 0.3 0 0.9 1 0.9 2 22.5 2.5 20.4 3.2 0.18 * 0.63 41.950.04+0.06
−0.03 < 0.07 <1.300.4752I -
172 PM3 21 36:46.41 15:29.2 0.2 0 0.6 2 0.7 0 24.6 3.1 23.2 4.2 0.14 * 0.40 42.07 - 0.42+0.09
−0.09 1.51 (0.6) - -160 PM3 12 36:41.80 11:32.0 1.5 2 1.4 1 2.7 5 20.6 0.9 19.4 1.7 0.13 <0.26<39.78 <0.07 0.24+0.06
−0.06 >1.500.0891 EI -136 PM3 3 36:34.51 12:41.6 0.7 4 1.2 11 1.1 0 24.2 2.0 23.2 4.5 0.10 <0.27<42.87 - 0.36+0.08
−0.04 >1.531.2190E -
161 PS3 6e 36:42.11 13:31.6 - - - - 1.3 6 - - >26 >4.6 0.10 <0.21<44.66 <0.07 0.02+0.01
−0.01 >1.294.4244E 1
188 PM3 28 36:51.11 10:30.7 0.3 0 0.4 0 0.5 0 21.9 2.0 20.2 3.6 0.10 <0.26<41.42 - 0.34+0.04
−0.07 >1.530.4101I -
194 PM3 32 36:53.41 11:39.6 0.6 2 2.1 27 1.8 3 23.3 1.4 23.2 4.0 0.09 <0.15<42.67 - 0.18+0.06
−0.04 >1.521.2750EA -
Var PM3 1736:44.20 12:51.0 1.9 6 1.8 6 0.2 0 22.6 2.1 21.4 2.1 0.08 <0.29<41.93 <0.05 0.28+0.06
−0.06 >1.500.5570E 2
155 PM3 11 36:40.00 12:50.2 0.8 2 1.1 4 0.9 1 23.2 2.2 21.5 3.6 0.07 0.27 42.37 <0.06 0.30+0.07
−0.06 1.520.8480 I -175 PS3 14 36:47.95 10:19.9 - - - - 2.3 8 - - - - 0.07 0.89 - - 0.10+0.09
−0.02 1.30 - - -185 PM3 27 36:49.76 13:13.0 2.0 11 0.4 0 2.0 6 23.0 2.0 21.5 3.4 0.07 <0.17<41.410.14+0.07
−0.06 0.16+0.04
−0.04 >1.510.4751I -
178 PM3 24 36:48.38 14:26.2 0.7 0 1.4 1 1.1 1 19.5 1.0 18.7 2.0 0.06 <0.17<40.040.25+0.07
−0.07 0.31+0.06
−0.07 >1.560.1390E -
220 PM3 42 37:02.04 11:22.4 0.3 0 2.0 2 2.0 4 20.3 1.2 18.7 2.2 0.06 <0.18<40.04 - 0.16+0.08
−0.05 >1.500.1362I -
183 PM2 3 36:49.45 13:47.2 0.6 0 0.8 0 1.0 3 19.2 1.5 18.0 2.4 0.05 <0.18<39.620.04+0.07
−0.03 < 0.05 -0.0891 - -148 PM3 7 36:37.01 11:34.9 1.3 1 1.4 1 1.2 1 19.6 1.0 17.7 1.8 0.04 <0.09<39.19 <0.14 0.30+0.06
−0.07 >1.620.0781 I -229 PS3 37 37:04.66 14:29.0 0.2 0 1.4 3 1.5 5 22.7 2.3 21.0 3.2 <0.05 0.29 41.86 - 0.07+0.06
−0.02 1.380.5611 I -149 PS3 6b 36:38.50 13:39.5 0.7 2 1.0 5 1.2 4 23.6 2.0 22.3 3.3 <0.04 0.75 41.57 - 0.05+0.03
−0.01 1.260.3575I -
Table 4. List of the Chandra sources with mid-IR counterparts in the Hubble Deep Field and flanking fields orderedwith decreasing 0.5–2 keV flux. For each association we report: the number of Brandt et al. (2001a) Chandra sourceand the name of the ISOCAM counterpart (Aussel et al., 1999) (1); the J2000 coordinates (2,3) of the Chandra source;the offset between associated sources in arcseconds and the probability of random association in 10−3 units for X-rayvs. optical (4,5), mid-IR vs. optical (6,7) and X-ray vs. mid-IR (8,9), respectively; the V, I magnitudes (10,11) fromBarger et al. (1999), the R and Ks magnitudes (12,13) from Hogg et al. (2000); the X-ray fluxes in the soft (0.5–2keV) and hard (2–8 keV) X-ray bands in 10−15 cgs units (14,15); the 2–10 keV luminosity (16); the mid-IR fluxes at6.75 µm (17) and 15 µm (18) in mJy (from Aussel et al. 1999 and 2001); the αIX index described in the text (19);the measured redshift (20); the spectral classification (21) by Cohen (2000, 2001) and the AGN type (22). A dash incolumn (6) indicates that the source is not in the LW2 field. The source marked with the label “Var” is a variableX-ray source detected by Brandt et al. (2001) and below the detection threshold in more recent observations (Brandtet al. 2001a). Sources detected in the ultra-hard band (4-8 keV) are marked with an asterisk on the hard-band flux. Forthe source #172 we recompute I and V magnitudes on the images of Barger et al. (1999) since the original cataloguelists one source instead of two close sources. We classified the spectra of #178, #190 and #Var according to Cohen(2000) by inspecting the reduced spectra of Barger et al. (1999). Redshifts sources are: (0) Hawaii group, (1) Cohen etal. 1996, (2) Lowental et al. 1997, (3) Hogg et al. 1997, (4) Waddington et al. 1999, (5) Cohen et al. 2000, (6) Dawsonet al. 2001
3. Analysis
3.1. Cross-correlation of X-ray and mid-IR catalogues
In the case of Lockman Hole observations, XMM sourceshave position errors of 1–3′′ (Hasinger et al. 2001), while15 µm and 6.75 µm ISOCAM sources have position errorsof 2–4′′ (depending on the redundancy of mid-IR observa-tion, see Fadda et al. 2002). In practice, we match X-rayand mid-IR sources within a circle of 4′′. In total, we found22 matches with 15 µm sources detected at the 3σ leveland 7 with 6.75 µm sources at the 4σ level. For the sakeof completeness, we list also upper limits of the LW2 and
LW3 fluxes when a source is detected in only one of thetwo ISOCAM filters.
In the case of the Hubble Deep Field image, we have re-processed the ISOCAM data to recompute more accuratecentres of the LW3 sources. We have used the I-band im-age of Barger et al. (1999) available on the Web1 to whichwe added the astrometry according to the catalogue ofHogg et al. (2000). Position errors of the Chandra sourcesare estimated less than 1′′, while ISOCAM sources thanksto the microscan technique of observation have errors lessthan 2′′. Therefore, we match X-ray and mid-IR sourceswithin a circle of 2′′.
1 www.ifa.hawaii.edu/ cowie/hdflank/hdflank.html

6 D. Fadda et al.: The AGN contribution to mid-infrared surveys
Fig. 2. Finding charts of the common X-ray and mid-IR sources in the Lockman Hole region (see Table 3). X-rayand mid-IR isocontours are plotted on optical images (I-band) with grey and black lines, respectively. X-ray contourscome from the 0.5–7 keV image, while mid-IR contours refer to the 15 µm image, except for sources # 104 and # 121which have been detected only in the 6.75 µm image. The size of each image is 25′′ × 25′′.
For each source we have computed the probability ofrandom association of the X-ray source with its mid-IRand optical counterparts, and of the mid-IR source withits optical counterpart. Assuming that the counterpart be-longs to a Poissonian distributed population of sources,
P = 1 − e−n(A)πd2
(1)
gives the probability to have a random association withina distance d (distance between the source and the possiblecounterpart) with a source brighter than A (the flux ofthe possible counterpart). n(A) is the expected number ofsources with flux (magnitude) greater (lower) than thatof the possible counterpart A. It has been evaluated usingthe distribution of mid-IR, X-ray fluxes, and the counts inselected regions of the I-band image whitout bright stars.
Contours of the matched sources are also plotted onoptical images in Figures 2 and 3. In most of the casesthere is a clear correspondence between X-ray and mid-IRsources. Only in a few cases (#149 in the Hubble DeepField and #41, #79 in the Lockman Hole) optical coun-terparts are uncertain and the match relies only on the dis-tance criterion. Three sources correspond to blank fields,at least in these deep I-band images.
Results of these cross-correlations are reported inTables 3 and 4 which contain positions of the X-raysources, distances, and probability of random associationsbetween sources and proposed counterparts, optical mag-nitudes in the V, I, R and K bands, X-ray and mid-IRfluxes, redshifts and AGN types when known, as well asother quantities described in the following.
For the sources without spectroscopic redshifts, wehave estimated photometric redshifts using four opticalmagnitudes (V,I,R and K) under the assumption that theoptical emission is dominated by the host galaxy. We useda library of synthetic SEDs generated with PEGASE2.0(Fioc & Rocca-Volmerange 1997) to fit the distributionof optical magnitudes. The median error on photometricredshifts, derived from a study on the Hubble Deep FieldSouth (Franceschini et al., in prep.), is 0.1.
3.2. Comparison of mid-IR and X-ray common surveys
Up to now, only two ISOCAM surveys have been studiedin the X-ray bands: the Elais-S1 field (Alexander et al.2001) and the HDFN field (Hornschemeier et al. 2001).In this paper we extend the study of mid-IR–X-ray cross-

D. Fadda et al.: The AGN contribution to mid-infrared surveys 7
Fig. 3. Finding charts of the common X-ray and mid-IR sources in the Hubble Deep Field and Flanking Fields (seeTable 4). X-ray and mid-IR isocontours are plotted on optical images (I-band, Barger et al. 1999) with grey and blacklines, respectively. X-ray contours come from the 2–8 keV Chandra image, while mid-IR contours refer to the 15 µmimage except for sources # 176 and # 183 which have been detected only in the 6.75 µm image. The size of eachimage is 15′′ × 15′′. Sources # 161 and # 175 correspond to blank fields in the I-image.
correlation in the HDFN field and flanking fields using thenew observations of Brandt et al. (2001a) and justifyingthe associations between X-ray and mid-IR sources.
Figure 4 compares the mid-IR and X-ray fluxes of thesources detected in these surveys as well as the sensitiv-ity limits of the X-ray observations and the 80% com-pleteness limits of the 15 µm surveys. The survey in theLockman Hole region is intermediate between the Elais-S1 and HDFN surveys. It covers an area of 218 squarearcminutes that is ∼ 30 times smaller than the Elais-S1survey (∼ 6000 square arcminutes) and ∼ 10 times largerthan the HDFN survey (24 square arcminutes). In termsof sensitivity, it is less deep than the HDFN in the softand hard X-ray bands, and it is definitively more sensi-tive than Beppo-SAX. Moreover, the XMM–Newton dataallow us to explore with a good sensitivity the ultra-hardenergy band (4.5–10 keV), which has been pioneered byBeppo-SAX and is not well covered by Chandra. As wehave already seen, this band is very interesting becausemore than 60% of the ultra-hard sources in the LockmanHole have mid-IR counterparts.
Taking into account the limits in sensitivity, the threesurveys are compatible in terms of source density. Within
the sensitivity limits of the Lockman Hole observations(F15µm ≥ 0.4mJy and F0.5−2keV > 0.3 × 10⁻¹⁵ erg cm−2
s−1, F2−10keV > 1.4×10⁻¹⁵ erg cm−2 s−1) we find 13 and11 sources in the soft and hard X-ray bands, respectively.Therefore, we expect to detect in the HDF within the sameflux limits 1.4+0.5
−0.4 and 1.2+0.5−0.4 sources in the soft and hard
band, respectively, while we detect one and two sources.Moreover, in the hard X-ray band within the sensitivitylimits of Elais-S1, we expect to detect 0.2 ± 0.1 sourcesin the Lockman Hole and 0.03 ± 0.01 sources in the HDFwhile no sources have been detected in these two surveys.
In conclusion, the survey in the Lockman Hole is inter-mediate between the surveys in the Elais-S1 and HDFNfields. Due to its large sky coverage, the Elais-S1 surveypicks up very powerful and rare hard-X ray sources. Onthe other hand, the deep X-ray survey in the HDFN al-lows the detection of very faint X-ray sources, and there-fore also normal and starburst galaxies, in a small regionof sky. So far, only the survey in the Lockman Hole regionhas sufficient depth and sky coverage to study a repre-sentative population of AGNs detected in the ISOCAMmid-IR surveys.

8 D. Fadda et al.: The AGN contribution to mid-infrared surveys
Fig. 4. Mid-IR vs. X-ray fluxes for galaxies observed in the Elais-S1 (black), Lockman (grey) and HDF (white) surveys.Diagrams refer to the soft band (0.5–2 keV) on the left and to the hard band (2–10 keV) on the right. The lines delimitthe X-ray sensitivity and the mid-IR (15 µm) 80% completeness limits.
3.3. Properties of the X-ray—mid-IR matched sources
Optical colours, redshifts and spectral classifications areavailable for many of the galaxies emitting in X-ray andmid-IR bands. In the case of the Lockman Hole, the bestknown galaxies are those already detected with ROSAT(see Lehmann et al. 2000, 2001), which constitute approx-imately half of our sample. On the contrary, redshifts areknown for all but two of the galaxies of the HDF sampledue to the great efforts made in this area (e.g. Hogg et al.2000; Cohen et al. 2000), although only few galaxies areclassified as AGNs or starburst galaxies according to theirspectral features.
3.3.1. Optical properties
The HDFN survey, which is the deepest we consider here,allows one also to detect very faint sources and thus star-burst and nearby galaxies (see Hornschemeier et al. 2001;Elbaz et al. 2001). Only a small part of the sources de-tected both in the mid-IR and X-rays are optically classi-fied as AGN (20%). Also the redshift distribution of thesegalaxies reflects this situation. The median redshift of 0.5is typical of the mid-IR galaxy population (see Fadda etal. 2002; Flores et al. 2002), while the median redshift ofthe galaxies classified as AGN is 1. On the contrary, thesources detected in the Elais-S1 survey are almost exclu-sively AGN at high redshift.
Excluding a normal galaxy detected at z = 0.3, allthe other sources lie at z > 0.4 with a median value ofz = 2. Finally, among the sources detected in the Lockman
Hole almost half of the sample is classified as AGN whilethe rest is up to now of unknown type. The median red-shift of the sources is z = 1 and all the sources lie atz > 0.4. Therefore, this population of galaxies differs fromthe bulk of the galaxies detected in the Lockman Hole,which lie at a redshift of 0.6 (see Fadda et al. 2002). Wecan learn something more about the spectrally unclassi-fied galaxies by looking at the optical colour diagrams (seeFigure 5). As expected, the type-1 AGNs cluster in a re-gion of blue colors while the type-2 AGNs are in generalredder and less clustered on the diagram. Many of thegalaxies with unknown type lie in the region occupied bytype-2 AGNs, suggesting that they are highly extinctedobjects and probably most of them are type-2 AGNs.
To aid in the interpretation of the diagrams, we over-lay two galaxy tracks corresponding to elliptical andspiral templates. These models were produced with thePEGASE2.0 code2 (Fioc & Rocca-Volmerange 1997) as-suming a Salpeter initial mass function with standard cut-off (0.1–120 M⊙). For the elliptical track we adopt a starformation timescale of 1 Gyr, observed at 6 Gyr, with-out extinction and nebular emission. For the spiral trackwe consider a star formation timescale of 5 Gyr, observedat 3 Gyr, extinction with disk geometry and no nebu-lar emission. Tracks are labelled with representative red-shifts over the range 0 < z < 3, which corresponds tothe redshift range of the galaxies observed. Few galaxiesappeared clustered around these lines. In particular, fivegalaxies detected in the HDF with low X-ray luminositieshave colours typical of normal galaxies. Most of the galax-
2 http://www.iap.fr/users/fioc/PEGASE.html

D. Fadda et al.: The AGN contribution to mid-infrared surveys 9
Fig. 5. Optical colour diagrams for X-ray-emitting galaxies in the part of HDFN (left) and Lockman Hole fields (right)surveyed in X-ray and mid-IR. Triangles, diamonds and circle refer to type-1 AGNs, type-2 AGNs and unknown typegalaxies, respectively. X-ray sources detected in the mid-IR are marked with full symbols. Dashed and solid lines showcolours of spiral and elliptical galaxies, respectively, as a function of the redshift. The curves are computed using thePEGASE2 code (Fioc & Rocca-Volmerange 1997). Sources with LX < 1041 erg s−1 in the HDF are indicated withsmaller symbols and lie around the lines of normal galaxies.
ies are scattered over the diagram, but there are almostno galaxies which follow the track of the elliptical galaxieswith z > 1.
Finally, we note that our sample of XMM–ISOmatched sources contains five extremely obscured objects(EROs, according to the definition R − K ≥ 5). Objectsof this type are claimed to constitute about 30% of theoptically faint X-ray sources in the deep Chandra surveyof the HDF (Alexander et al. 2001a). On the other hand,Pierre et al. (2001) showed that is possible to select thiskind of objects using mid-IR observations. This sample ofobjects will be studied in more detail by Franceschini etal. (2001). In the Lockman field, another four EROs weredetected by XMM–Newton and not by ISOCAM. As bet-ter explained in Franceschini et al. (2001), the expected15 µm fluxes of these objects fall below the detection limitof the survey (0.3 mJy).
3.3.2. X-ray diagnosis
Thanks to the large energy range which can be exploredwith XMM–Newton it is possible to construct colour–colour X-ray diagrams and to classify sources on the ba-sis of their X-ray spectra alone (Hasinger et al. 2001).Figure 6 shows X-ray spectral diagnostic diagrams basedon the hardness ratios computed using four independentenergy bands. The hardness ratios are obtained with theformula HR = (H − S)/(H + S), where H and S cor-
respond to the counts in the harder and softer energybands, respectively. HR1, HR2 and HR3 compare the 0.2–0.5 vs. 0.5–2 keV, 0.5–2 vs. 2-4.5 keV, and 2–4.5 vs. 4.5–10keV bands, respectively. A grid representing the expectedhardness ratios for power-law models with different val-ues of photon index (Γ) and hydrogen absorption (log NH)computed in the observed frame is superimposed on thedata. The populations of type-1 and type-2 AGNs occupydifferent regions in these diagrams. In particular, AGN-1galaxies populate a limited portion of the diagrams in thesoft range (and a particularly narrow HR2 range) whilethe new XMM–Newton galaxies and known AGN-2 typegalaxies have harder spectra than those of AGN-1 galax-ies and occupy a larger area (see discussion in Hasingeret al. 2001). Also in this case, most of new XMM–Newtongalaxies detected in the mid-IR lie in a clearly separatedregion with respect to the type-1 AGNs.
If we admit that unclassified galaxies are all type-2AGNs, we detect at 15 µm at the 3σ level 7 AGN-1 galax-ies and 15 AGN-2 galaxies (only three of these are clas-sified as AGN-2). This statistics matches the percentagesfound in the CFRS field 1415+52 using a multi-wavelengthmethod to classify the galaxies. In this case, studying asample of 19 ISOCAM sources, Flores et al. (1999) clas-sified two sources as AGN-1 and three as AGN-2. Fortwo other sources the classification as AGN-2 or starburstgalaxies is equally probable.

10 D. Fadda et al.: The AGN contribution to mid-infrared surveys
Fig. 6. X-ray diagnostic diagrams based on hardness ratios (see Hasinger et al. 2001). Triangles, diamonds and circlerefer to type-1 AGNs, type-2 AGNs and unknown-type galaxies, respectively. Galaxies inside the common X-ray andmid-IR area are shown. The cross indicates the median error bar of the points. Only points with error less than 0.1are plotted. The galaxies with mid-IR emission are marked with full symbols. For these galaxies HR1, HR2 and HR3values are reported in columns 16, 17 and 18 of Table 3. The grid gives the expected hardness ratios for power-lawmodels with different values of the photon index Γ and of the neutral hydrogen absorption log NH (in the observedframe).
3.4. Comparison with local templates
Detailed spectral energy distributions (SEDs) have beenobtained in the hard X-ray band (with ASCA and Beppo-SAX) and in mid- to far-IR (with ISO) for few local galax-ies which are representative of the classes of objects foundin our samples.
Before analysing X-ray luminosities and X-ray to mid-IR spectral indices of the galaxies of our samples, we dis-cuss the template galaxies which will be compared withour data.
Type-1 AGNs. Mrk509 and NGC4593 have been cho-sen as typical Seyfert 1 galaxies (data from Clavel et al.2000; Perola et al. 2000; Guainazzi et al. 1999), whilePG1613+658 has been taken as representative of radio-quiet quasars (data from Haas et al. 2000 and Lawson &Turner 1997).
Type-2 AGNs. This class of object is expected to beeasily detected by combined hard X-ray and mid-IR sur-veys, since almost all the UV and soft X-ray emission ofthe nucleus is reprocessed into infrared light. The threetemplates chosen show different behaviours. NGC 1068,the archetypal object for the class of Seyfert 2 galaxies(data from Sturm et al. 2000; Matt et al. 1997), has anextremely absorbed X-ray flux. Due to this fact, it has amid-IR to X-ray flux spectral index which is more typi-cal of starburst galaxies than type-2 AGNs (see Figure 8).We also chose the Circinus galaxy, a Seyfert 2 object with
a reflection-dominated spectrum in the 2–10 keV rangeand a transmitted component above 10 keV (data fromSturm et al. 2000; Matt et al. 1999; Sambruna et al.2001). Finally, we report the Sy2 NGC6240 (data fromCharmandaris et al. 1999; Vignati et al. 1999) whose en-ergy output, according to Vignati et al. (1999) is domi-nated by the AGN and not from star formation, as de-duced by Genzel et al. (1998) on the basis of the ISOspectrum.
Starbursts. M82 and NGC253, two of the nearest star-burst galaxies, are assumed as typical templates for galax-ies with active star formation (data from Sturm et al. 2000;Cappi et al. 1999).
Ultraluminous galaxies. Galaxies of this class, whichemit large parts of their bolometric luminosity in the in-frared, are known to be powered mainly by star formation,although a small fraction of the emission is probably dueto AGN activity (e.g. Lutz et al. 1998; Tran et al. 2001).We chose Arp 220 as an example of an ultraluminous star-burst galaxy (data from Sturm et al. 1996; Charmandariset al. 1999; Iwasawa et al. 2001).
3.4.1. X-ray luminosities
Since we have spectroscopic and photometric redshifts foralmost all the galaxies of our samples, it is possible to

D. Fadda et al.: The AGN contribution to mid-infrared surveys 11
Fig. 7. 2–10 keV X-ray luminosity versus redshift (left) and R − K colour (right) for the X-ray mid-IR matchedsources. Open symbols, grey symbols and crosses refer to the HDF, Lockman and Elais surveys, respectively. Type-1and type-2 AGNs are marked with triangles and squares, respectively, while circles identify unclassified sources. Inthe left figure, the three dashed lines show the sensitivity limits of the three X-ray surveys. The horizontal lines tracethe X-ray luminosity of the template galaxies discussed in the text. The luminosity distance is computed according toCarroll, Press & Turner (1992) assuming a Universe with H0 = 70 km s−1 Mpc−1, Ωλ=0.7 and ΩM=0.3.
compute X-ray luminosities of these galaxies and comparethem with those of local templates.
To compute the luminosity distance we assume anUniverse with H0 = 70 km s−1 Mpc−1, Ωλ=0.7, and ΩM
= 0.3 using the formula in Carroll, Press & Turner (1992).As we can note in Figure 7, the sources in the LockmanHole sample have 2–10 keV luminosities between 1042.5
erg s−1 and 1045 erg s−1, which are typical of luminoustype-2 AGNs and normal type-1 AGNs. Sources detectedin the Elais-S1 have luminosities typical of type-1 AGNs.Finally, among the sources detected by Chandra in HDFN,we find low luminosities sources at low redshift which areprobably starburst galaxies, few galaxies in the luminos-ity range populated by Lockman sources, and a populationof galaxies with intermediate luminosities which could beultraluminous infrared galaxies or low-luminosity type-2AGNs.
In the same Figure 7 we plot also the hard X-ray lu-minosity versus the R − K colour. This allows one clearlyto segregate normal galaxies which are faint X-ray sourcesand R−K ∼ 2 and type-1 AGNs, which populate the leftupper corner of the diagram. It is still difficult to distin-guish type-2 AGNs from ultraluminous galaxies.
3.4.2. Mid-IR to X-ray spectral index
A way to combine the information coming from mid-IRand X-ray fluxes is to compute the mid-IR to X-ray spec-
tral index αIX assuming a power law spectral energy dis-tribution: Fν ∝ ν−αIX . Values reported in Tables 3 and 4are computed using the observer frame flux densities at15 µm and 5 keV. The flux densities at 5 keV have beenderived from the observed 2–10 keV fluxes (2–8 keV in thecase of HDFN Chandra data) and spectral indices.
In Figure 8, which gives αIX as a function of redshift,we report all the sources detected in the Lockman, HDFNand Elais-S1 surveys. We also show the values of αIX asa function of redshift for the aforementioned local tem-plates.
Galaxies dominated by star formation (starburst andultraluminous galaxies) have high values of αIX at any red-shift. On the contrary, type-1 AGNs have quasi-constantvalues between 1 and 1.2. Between these two envelopesof curves we find the templates of type-2 AGN Circinusand NGC 6240. Only NGC 1068, which is known to havean atypical SED having, for example, a flat mid- to far-IR spectra (see Elbaz et al. 2001), lies in a region of thediagram occupied by starburst-dominated galaxies.
Most of the galaxies detected in the Lockman Holesurvey populate the region of the diagram delimited bytype-2 AGNs (Circinus and NGC 6240). The galaxies de-tected in the Elais-S1 surveys lie around the type-1 AGNcurves.
The HDFN survey, due to its high sensitivity, is ableto detect also non-active galaxies with high αIX index. Infact, half of the HDF sources lie just below the curves
12 D. Fadda et al.: The AGN contribution to mid-infrared surveys
of starburst and ultraluminous galaxies, while the otherhalf have α < 1.4. Combined with the information on theX-ray luminosity, we will use this diagram to discrimi-nate between HDF sources whose emission is dominatedby AGN or star formation activity.
It is interesting to remark that a large part of the type-1 AGNs detected in the Lockman area have an αIX in-dex greater than those of the local templates. Except forone case which is an absorbed type-1 AGN, as revealedby the X-ray hardness ratio diagrams (# 79 in Table 3),the most probable explanation is that star formation ofthe host galaxies contribute a large fraction of the mid-IR flux. Hence, their αIX values should differ significantlyfrom those of local templates, for which we can easily dis-criminate between the host galaxy and AGN.
3.5. Contribution to the extragalactic background light
The samples of sources discussed allow us to estimate howmuch of the mid-IR extragalactic light detected in themid-IR surveys is due to AGNs. We can derive this quan-tity in a direct way by simply computing the total of themid-IR fluxes of the sources whose emission is dominatedby AGNs and dividing this by the total of the mid-IRfluxes of the sources in the area. In this case, we can es-timate only the AGN contribution within the sensitivitylimits of the surveys and not to the total extragalacticbackground mid-IR light.
Alternatively, we can use the median αIX for differentclasses of contributors to the X-ray background to esti-mate the total contribution to the mid-IR extragalacticbackground (following Severgnini et al. 2000).
3.5.1. Estimating the AGN contribution to mid-IR
surveys
We can derive the AGN contribution in the case of HDFand Lockman surveys for which we have the complete in-formation on X-ray and mid-IR sources. To do this, wehave to select on the basis of the optical, X-ray and mid-IR properties, the subsamples of sources whose mid-IRemission is dominated by AGNs.
In the case of the Lockman Hole, we have seen thatalmost all the galaxies in the sample have high X-ray lu-minosity and low αIX values. Therefore, we conservativelyassume that the mid-IR emission of all the galaxies in thesample is due to AGNs.
In the case of the HDF, we have seen that Chandra ob-servations are so deep that also the X-ray emission comingfrom starburst galaxies is detected. Thus, in order to esti-mate the AGN contribution to the mid-IR total emissionwe have to select the galaxies whose mid-IR emission isdominated by the AGN. We base our selection on the X-ray luminosity (see Figure 7) and on the shape of the SEDfrom radio to X-ray wavelengths (see Figure 9).
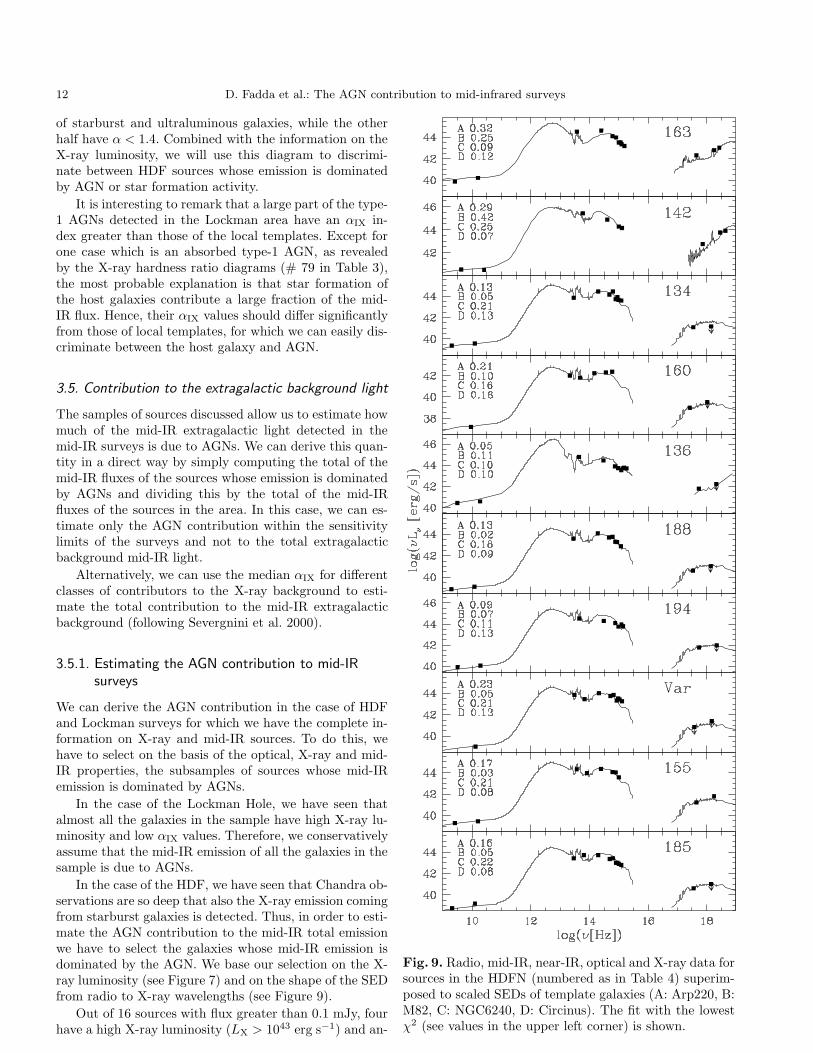
Out of 16 sources with flux greater than 0.1 mJy, fourhave a high X-ray luminosity (LX > 1043 erg s−1) and an-
Fig. 9. Radio, mid-IR, near-IR, optical and X-ray data forsources in the HDFN (numbered as in Table 4) superim-posed to scaled SEDs of template galaxies (A: Arp220, B:M82, C: NGC6240, D: Circinus). The fit with the lowestχ2 (see values in the upper left corner) is shown.

D. Fadda et al.: The AGN contribution to mid-infrared surveys 13
Fig. 8. On the left: distribution of the observed mid-IR to hard X-ray spectral indices αIX as a function of redshift.Open, grey and black symbols refer to objects detected in the HDFN, Elais-S1 and Lockman Hole surveys, respectively.Triangles, diamonds and circles represent type-1 AGNs, type-2 AGNs and unknown types, respectively. HDF galaxieswith LX ≤ 1040 erg s−1 are drawn with small symbols. Templates derived from various types of known active andstarburst galaxies are shown (see the text). The horizontal band shows the αIX of the cosmic background. On theright: αIX versus the 2–10 keV flux. Median values in the flux ranges assumed to compute the AGN contribution tothe mid-IR background are drawn.
other four are faint in the X-ray (LX ≤ 1040 erg s−1). Inthese cases, we assume that the mid-IR emission is dom-inated by AGN and star-formation activity, respectively.Moreover, since the source #172 is detected also in theultra-hard band, we consider that it is dominated by AGNactivity. We classify all the other sources, which have anintermediate X-ray luminosity, by comparing their radio,mid-IR, near-IR, optical and X-ray data with the SEDsof two star formation-dominated and two type-2 AGNs(Arp 220, M82, Circinus and NGC 6240) for which wehave the SED from radio to X-ray frequences. Radio dataat 8.5 GHz come from Richards et al. (1998) and at 1.4GHz from Richards (2000). In the 1.4 Ghz case, we alsoretrieved the image3 to estimate the 1.4 GHz flux of thesource #155. For each galaxy we fitted the data to thetemplate SEDs scaled in luminosity choosing the fit withthe lowest χ2 value. Figure 9 shows the χ2 values for eachSED and the the best fit superimposed to the data. Inthe fit we considered also 5 keV upper limits. This meansthat the χ2 of the NGC6240 and Circinus SEDs are typi-cally underestimated. For comparison, in the same figure,the SED of two bright X-ray sources (#163 and #142)and one faint X-ray source (# 160) are also shown (thebest fit is obtained with the NGC 6240, Circinus and M82SEDs, respectively). The sources with intermediate X-rayluminosity are all well fitted with the M82 SED, except for
3 http://www.cv.nrao.edu/ jkempner/vla-hdf/
# 136 which is fitted by the Arp 220 SED. We note thatalso the variable X-ray source (“Var”) follows the M82SED very well. Therefore, in these cases we assume thatthe mid-IR emission of these sources is not dominated bythe presence of an AGN.
In Fig. 10 we summarise the contribution of AGNs tothe mid-IR extragalactic background as a function of theflux. The bin between 0.1 mJy and 0.5 mJy has been de-fined using the HDF data, since the sources detected inthis field cover this range of fluxes well and the HDF iscomplete for fluxes greater than 0.1 mJy (Aussel et al.1999). Due to its small size, there are no sources in theHDF with fluxes greater than 0.5 mJy. Hence, the con-tribution in the other two bins is based on the LockmanHole data which are more than 80% complete at the fluxof 0.5 mJy (Fadda et al. 2002).
In the HDF there are 42 sources for a total of 9.9 mJyin the 0.1–0.5 mJy bin, five of which are classified by usas AGN-dominated. This implies an AGN contribution inthis flux bin of (17.8 ± 7)%.
The Lockman Hole survey covers well the 0.5–3 mJyflux interval where we find 103 sources for a total of 81.8mJy with 13 sources which are AGN-dominated, lead-ing to a total contribution of (14.6 ± 4.7)%. In Fig. 10,we report the contribution in two bins: 0.5–0.8 mJy((14.3± 6)%) and 0.8–3 mJy ((14.8± 7)%). The contribu-tion in this interval is probably slightly underestimated be-

14 D. Fadda et al.: The AGN contribution to mid-infrared surveys
cause, as is clear from Fig. 7, XMM–Newton observationsmiss a population of fainter X-ray sources which probablycontain highly obscured AGNs. The effect should not bedramatic because, as we have seen in our analysis of theHDF sources, the mid-IR emission of most of these inter-mediate X-ray luminous sources is not dominated by theAGN activity.
From these estimates, we can derive the AGN contri-bution to the fraction of the mid-IR extragalactic back-ground due to the emission of 0.1–3 mJy sources, whichconstitute ∼ 70% of the measured background. The 0.1–0.5 mJy and 0.5–3 mJy sources contribute 48% and 23%of the observed mid-IR background, respectively (Elbaz etal. 2001). Therefore, AGNs contribute (16.8±6.2)% of thefraction of the mid-IR extragalactic background for whichare responsible the sources detected in the 0.1–3 mJy fluxinterval.
3.5.2. Estimating AGN contribution with median
mid-IR to X-ray spectral indices
Following Severgnini et al. (2000), we can estimate themid-IR contribution of the X-ray sources using the meanαIX indices of bright and faint X-ray contributors to theX-ray background with mid-IR emission.
To apply this method we have to know the values ofthe X-ray and mid-IR backgrounds. We compute the 5keV X-ray background using the estimation of the 1–7keV background by Chen et al. (1997), which is in goodagreement with recent Chandra and XMM counts. In par-ticular, the counts by Brandt et al. (2001a) clearly flattenat low fluxes, indicating that almost all the backgroundis resolved in this survey. Assuming the background ofChen et al. (1997), Alexander et al. (2001a) evaluate that∼ 86% of the 2–8 keV background is resolved by Chandraobservations in the HDF region. The recent estimation byVecchi et al. (1999) with Beppo-SAX observations seemsto be too high to agree with recent deep observations ofXMM and Chandra satellites. In the case of 15 µm, the to-tal background has not yet been measured. Observationalvalues are the upper limit of 5 nW m−2 sr−1 establishedby Stanev & Franceschini (1998) measuring the opticaldepth at high energies due to the γ −→ γ interactionwith the background infrared photons and the lower limitof νI(ν)|15µm = 2.4 nW m−2 sr−1 obtained by Elbaz etal. (2001) integrating the flux of all the sources in thedeep ISOCAM surveys down to the flux limit of 0.05 mJy.Franceschini et al. (2001), on the basis of their evolution-ary model, which takes into account counts in the mid-IR,far-IR and sub-mm, and measurement of the far-IR back-ground, expect that the contribution of fainter sourceswould bring the total background to νI(ν)|15µm = 3.3nW m−2 sr−1. This value, which is not far from valuespredicted by other models (Chary & Elbaz 2001, Xu 2000)and from values found by Altieri et al. (1999) using cluster-lensed data, has been adopted in our analysis.
The horizontal band in Fig. 8 represents the αIX of thecosmic background, assuming that most of the flux in thetwo spectral windows comes from sources with a similardistribution of redshifts centred around z = 1. Therefore,this value should correspond to the mid-IR to X-ray indexof the population which dominates the X-ray backgroundif the same population were responsible for the totalityof the mid-IR background. Otherwise, fitting both back-grounds requires a combination of AGN and star forma-tion activity.
The flattening of the 2–8 keV counts in the HDF deepChandra survey (Brandt et al. 2001a) clearly shows thatalmost all the hard X-ray background is resolved at thesensitivity of this survey. Since these counts agree verywell with the counts by Mushotzky et al. (2000), extrapo-lating their result we can say that about 85% of the 2–10keV background is resolved at a flux of 0.5 × 10⁻¹⁵ ergs−1 cm−2 (see also Alexander et al. 2001a). We do notconsider sources with fluxes less than this value becausemost of them have only upper limits on the flux and areprobably starburst galaxies (according to their low X-rayluminosity).
To evaluate the AGN contribution to the mid-IR back-ground we divide the sources in two groups according totheir X-ray fluxes: sources brighter than 10−14 erg s−1
cm−2 and faint sources with 2–10 keV flux in the range0.5 × 10−15—10−14 erg s−1 cm2. In these flux ranges thesources have similar αIX values (see Fig. 8). Using thecounts of Brandt et al. (2001a) and the results of Ueda etal. (1999) and Mushotzky et al. (2000), sources brighterthan 10−14 erg s−1 cm−2 contribute 40 ± 10% of the hardX-ray background, while sources with flux in the range0.5×10−15—10−14 erg s−1 cm2 contribute 45 ± 5% of thehard X-ray background.
We can evaluate the AGN contribution to the mid-IRbackground by means of the median spectral indices ofbright and faint X-ray sources. Bright sources, most ofthem are in the Elais-S1 survey, have a median αIX of1.15, which corresponds to only 6% of the value requiredto fill the mid-IR background. Therefore, bright hard X-ray sources contribute to the mid-IR background (40 ±10)% × 6% = (2.4 ± 0.6)%, i.e. in a negligible way.
The median value of αIX for faint sources is 1.30, whichcorresponds to 33% of the mid-IR background. Hence,faint hard X-ray sources contribute to the mid-IR back-ground (45±5)%×33% = (14.8±1.7)%. Combining theseresults, we conclude that sources making up ∼85% of the2–10 keV background contribute (17.2±2.3)% of the mid-IR background.
4. Summary and conclusions
We have presented the cross-correlation between mid-IRand X-ray observations in the Lockman Hole- and HDFN-centred regions. ISOCAM and XMM–Newton observed acommon region of more than 200 square arcminutes inthe Lockman Hole. A total of 24 galaxies out of 76 XMM–Newton sources in this field show mid-IR emission. In par-

D. Fadda et al.: The AGN contribution to mid-infrared surveys 15
Fig. 10. On the left: histogram of LW3 fluxes in the Lockman and HDF surveys. Sources detected in the X-ray areshaded, while the black histogram shows the sources dominated by AGN emission. On the right: ratio of integrated15 µm flux of AGN-dominated sources to that of all the mid-IR extragalactic sources as a function of limiting flux.The 0.1 mJy points comes from the HDFN survey, while the other points are computed on the basis of the Lockmansurvey. The horizontal band shows the percentage of background light due to AGN emission according to the analysisbased on the αIX index (see the text).
ticular, the percentage of hard X-ray sources with 15 µmemission is around 60%. On the other hand, only around10% of the mid-IR sources show X-ray emission in the dif-ferent XMM–Newton bands. Deep Chandra observations(Brandt et al. 2001a) completely cover the ISOCAM ob-servations of the HDF and flanking fields. In a region of 24square arcminutes, 25% of the mid-IR sources have beendetected in the X-ray for a total of 24 sources. A com-parison of the Lockman Hole, HDFN and Elais-S1 sur-veys (Alexander et al. 2001) shows that these surveys arecompatible in terms of source density taking into accounttheir respective detection limits. While the HDFN surveyis so sensitive to the detection of even normal galaxies andthe Elais-S1 survey detects only very powerful and raretype-1 AGNs, the Lockman Hole survey is able to detecta population of galaxies whose emission is mostly domi-nated by AGNs of types 1 and 2. In particular, thanks tothe increased sensitivity of XMM–Newton with respect toROSAT, nearly half of the sources with mid-IR emissionare new XMM–Newton sources. Most of the sources whichare optically studied are type-1 AGNs. Relying on opticalcolours and X-ray hardness ratio diagrams, we concludethat about 70% of the detected sources are type-2 AGNs.Nevertheless, XMM–Newton observations are not deepenough to detect all the obscured AGNs in the sample asare the Chandra observations in the HDF. Only forthcom-ing observations of the Lockman Hole with XMM–Newtonwill be able to detect the population of faint obscured X-
ray sources visible with Chandra in the HDF. We havestudied how the mid-IR to hard X-ray index (αIX) varieswith redshift, comparing it with the expected behaviourfrom local templates. Most of the Lockman sources de-tected lie in a region of the diagram occupied by type-2 AGN local templates and several are optically classi-fied as type-1 AGN. Since in general these sources donot appear highly extincted using X-ray hardness diag-nostic diagrams, a possible explanation is that emissionfrom the host galaxies contributes a fraction of their IR-optical emission greater than that of local templates.
Finally, we have evaluated how much the integratedemission of AGN contributes to the total extragalacticmid-IR background light using two independent methods.A direct estimation gives a percentage of (15 ± 5)% forthe Lockman survey (0.5 < F15 µm < 3 mJy) and a valueof (18 ± 7)% for the HDFN survey (0.1 < F15 µm < 0.5mJy), hence a contribution of (17± 6)% in the interval offluxes 0.1 < F15 µm < 3 mJy. Considering median mid-IRto X-ray spectral indices for two hard-X flux ranges, weestimate that the population of AGNs making up ∼ 85%of the 2–10 keV X-ray background contribute (17 ± 2)%of the mid-IR extragalactic background.
This fraction could be higher if there exists a popu-lation of AGNs that is highly obscured at X-ray wave-lengths. In particular, since the X-ray background peaksat 30–40 keV while we can now observe only up to 5–10 keV, we expect that deeper X-ray observations (over
16 D. Fadda et al.: The AGN contribution to mid-infrared surveys
a wider spectral range) will unveil more highly extinctedAGNs.
On the basis of the presently available mid-infraredand X rays observations, it appears that the bulk of themid-IR extragalactic emission comes from star formationand that the luminous galaxies seen by ISOCAM in thedeep surveys are essentially starbursts obscured by dust.Nevertheless, this result does not exclude the possibilitythat the majority of the galaxies in the Universe have bothAGN and starforming contributions. Results obtained byElbaz et al. (2001) about the origin of the infrared back-ground light based on a set of observed correlations andby Flores et al. (1999) evaluating the mid-IR part of thestar formation are not significantly affected by the AGNcontribution to the mid-IR extragalactic light.
Acknowledgements. F.D. dedicates this work to the memoryof his professor Giuliano Giuricin, recently deceased, who in-troduced him to the study of AGNs. F.D. acknowledges sup-port from the network ISO SURVEY set up by the EuropeanCommission under contract ERBFNRXCT960068 or its TMRprogram. H.F. was supported by a grant of the “Academie dela science”. We thank the anonymous referee for his carefullyreading of the manuscript, interesting comments, and sugges-tions which greatly improved the paper. We are grateful toH. Aussel for providing us his flux list before publication. Wealso thank M. Arnaud, I. Perez-Fournon and F. La Franca forfruitful discussions and interesting suggestions.
References
Alexander, D., La Franca, F., Fiore, F., et al. 2001, ApJ, 554,18
Alexander, D.M., Brandt, W. N., Hornschemeier, A. E. et al.2001a, AJ in press, (astro-ph/0107450)
Almaini, O., Lawrence, A., & Boyle, B. J. 1999, MNRAS, 305,59
Altieri, B., Metcalfe, L., Kneib, J. P., et al. 1999, A&A, 343,L65
Aussel, H., Cesarsky, C. J, Elbaz, D., & Starck, J. L. 1999,A&A, 342, 313
Aussel, H. et al. 2001, in preparation
Barger, A. L., Cowie, L. L., Trentham, N. et al. 1999, AJ, 117,102
Brandt, W. N., Alexander, D. M., Hornschemeier, A. E. et al.,2001a, AJ, in press,(astro-ph/0108404)
Brandt, W. N., Hornschemeier, A. E., Alexander, D. M. et al.2001, AJ, 122, 1
Cappi, M., Persic, M., Bassani, L., et al. 1999, A&A, 350, 777Carroll S. M. , Press W. H. & Turner E. L. 1992, ARA&A, 30,
499
Charmandaris V., Laurent O., Mirabel I.F. et al. 1999, Ap&SS,266, 99
Chary, R., & Elbaz, D., 2001, ApJ, 556, 562Chen, L.-W., Fabian, A. C. & Gendreau, K. C., 1997, MNRAS,
285, 449Clavel, J., Schulz, B., Altieri, B. et al. 2000, A&A, 357, 839
Cohen, J. G., Cowie, L. L., Hogg, D. W. et al. 1996, ApJ, 471,L5
Cohen, J. G., Hogg D. W., Blandford R. et al. 2000, ApJ, 538,29
Comastri, A., Setti, G., Zamorani, G. & Hasinger, G., 1995,A&A, 296, 1
Dawson, S., Stern D., Bunker, A. J. et al. 2001, AJ, in press(astro-ph/0105043)
Elbaz, D., Cesarsky, C.J., Chanial, P., et al. 2001, A&A, sub-mitted
Elbaz, D., Cesarsky, C.J., Fadda, D., et al., 1999, A&A, 351,L37
Fabian, A. C., & Iwasawa, K., 1999, MNRAS, 303, L34Fadda, D., Elbaz, D., Duc, P.-A., et al., 2000, A&A,Fadda, D. et al., 2002, in preparationFioc,M.& Rocca-Volmerange,B. 1997, A&A, 326, 950Fixen, D.J., Dwek, E., Mather, J.C. et al. 1998, ApJ, 508, 123Flores, H., Hammer, F., Thuan, T. X., et al. 1999, ApJ, 517,
148Flores, H. et al., 2002, in preparationFranceschini, A., Aussel, H., Cesarsky, C. et al. 2001, A&A, in
press (astro-ph/0108292)Franceschini, A., Fadda, D., Flores, H. et al. 2001, ApJL, sub-
mittedGehrels, N. 1986, ApJ, 303, 336Genzel, R., Lutz, D., Sturm, E. et al. 1998, ApJ, 498, 579Guainazzi M., Perola G. C., Matt G. et al. 1999, A&A, 346,
407Haas, M., Muller, S. A. H., Chini, R. et al. 2000, A&A, 354,
453Hasinger, G., Burg, F., Giacconi, R. et al. 1993, A&A, 275, 1Hasinger, G., Burg, F., Giacconi, R. et al. 1998, A&A, 329, 482Hasinger, G., Altieri, B., Arnaud, M. et al. 2001, A&A, 365,
L45Hauser, M.G., Arendt, R. G., Kelsall, T et al. 1998, ApJ, 508,
25Hogg, D.W., Cohen, J. G., Blandford R. et al. 1997, AJ, 115,
1418Hogg, D.W., Pahre, M. A., Adelberger, K. L. et al. 2000, ApJ,
127,1Hornschemeier, A. E., Brandt, W. N., Garminer, G. P. et al.
2001, AJ, 554, 742Iwasawa, K., Matt G., Guainazzi, M., & Fabian, A. C. 2001,
MNRAS, 326, 894Laurent, O., Mirabel, I.F., Charmandaris, V. et al. 2000, A&A,
359, 887Lawson, A. J., & Turner, J. L. 1997, MNRAS, 288, 920Lehmann, I., Hasinger, G., Schmidt, M. et al. 2000, A&A, 354,
35Lehmann, I., Hasinger, G., Schmidt, M. et al. 2001, A&A, 371,
833Lowenthal, J., Koo, D. C., Guzman, R. et al. 1997, ApJ, 481,
673Lutz, D., Spoon, H. W. W., Rigopoulou, D. et al. 1998, ApJ,
505, L103Matt, G., Guainazzi, M., Frontera, F. et al. 1997, A&A, 325,
L13Matt, G., Guainazzi, M., Maiolino, R. et al. 1999, A&A, 39,
L42Mushotzky, R.F., Cowie, L.L., Barger, A.J., Arnaud, K.A.
2000, Nat, 404, 459Perola, G. C., Matt, G., Fiore, F., et al. 2000, A&A, 358, 117Pierre, M., Lidman, C., Hunstead, R. et al. 2001, A&A, 372,
L45Puget, J.-L., Abergel, A., Bernard, J.-P. et al. 1996, A&A, 308,
L5Richards, E. A., Kellermann, K. I., Fomalont, E. B., et al. 1998,
AJ, 116, 1039

D. Fadda et al.: The AGN contribution to mid-infrared surveys 17
Richards, E. A., 2000, ApJ, 533, 611Rowan-Robinson M., Mann R. J., Oliver S. J. et al. 1997,
MNRAS, 289, 490Sambruna, R. M., Netzer, H., Kaspi, S. et al. 2001, ApJ, 546,
L13Severgnini, P., Maiolino, R., Salvati, M. et al. 2000, A&A, 360,
457Siebenmorgen, F., Moorwood, A., Freudling, W., & Kaufl, H.
U., 1997, A&A, 325, 450Starck, J.-L., Aussel,H., Elbaz,D., Fadda,D., &
Cesarsky,C.,1999, A&AS, 138, 365Sturm, E., Lutz, D., Genzel, R. et al. 1996, A&A, 315, 133Sturm, E., Lutz, D., Tran, D. et al. 2000, A&A, 358, 481Stanev, T., & Franceschini, A. 1998, ApJ, 494, L159Tran, Q. D., Lutz, D., Gentzel, R. 2001, ApJ, 522, 527Ueda, Y., Takahashi, T., Ishisaki, Y. et al. 1999, ApJ, 524, L11Vecchi, A., Molendi, S., Guainazzi, M. et al. 1999, A&A, 349,
L73Vignati P., Molendi S., Matt G. et al. 1999, A&A, 349, L57Waddington, I., Windhorst, R. A., Cohen, S. H. et al., 1999,
ApJ, 526, L77Xu, C. 2000, ApJ, 541, 134

This figure "fig1.jpg" is available in "jpg" format from:
http://arxiv.org/ps/astro-ph/0111412v1

This figure "fig2.jpg" is available in "jpg" format from:
http://arxiv.org/ps/astro-ph/0111412v1

This figure "fig3.jpg" is available in "jpg" format from:
http://arxiv.org/ps/astro-ph/0111412v1