Ground and marine magnetic surveys of the lower eastern flank of Etna volcano (Italy
Upload
khangminh22Category
view
0download
0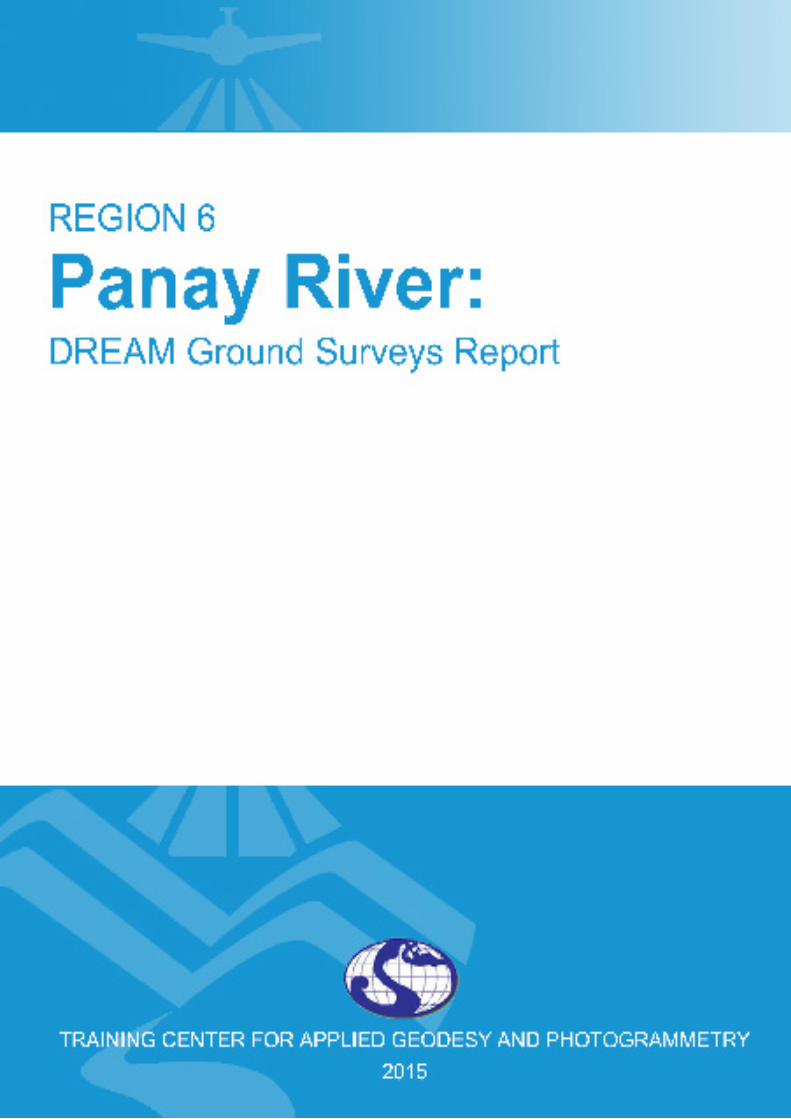


© University of the Philippines and the Department of Science and Technology 2015
Published by the UP Training Center for Applied Geodesy and Photogrammetry (TCAGP)College of EngineeringUniversity of the Philippines DilimanQuezon City1101 PHILIPPINES
This research work is supported by the Department of Science and Technology (DOST) Grants-in-Aid Program and is to be cited as:
UP TCAGP (2015), DREAM Ground Survey for Davao River, Disaster Risk and Exposure Assessment for Mitigation (DREAM) Program, DOST Grants-In-Aid Program, 134 pp.
The text of this information may be copied and distributed for research and educational purposes with proper acknowledgment. While every care is taken to ensure the accuracy of this publication, the UP TCAGP disclaims all responsibility and all liability (including without limitation, liability in negligence) and costs which might incur as a result of the materials in this publication being inaccurate or incomplete in any way and for any reason.
For questions/queries regarding this report, contact:
Engr. Louie P. Balicanta, MAURPProject Leader, Data Validation Component, DREAM ProgramUniversity of the Philippines DilimanQuezon City, Philippines 1101Email: [email protected]
Enrico C. Paringit, Dr. Eng.Program Leader, DREAM ProgramUniversity of the Philippines DilimanQuezon City, Philippines 1101E-mail: [email protected]
National Library of the PhilippinesISBN: 978-971-9695-50-9

1 INTRODUCTION ......................................................................................................... 1.1 DREAM Program Overview .............................................................................. 1.2 Objectives and target outputs .......................................................................... 1.3 General methodological framework ................................................................2 The Panay River Basin .................................................................................................3 DVC Methodology ..................................................................................................... 3.1Pre-fieldPreparation.......................................................................................... 3.1.1 Preparation of Field Plan ........................................................................ 3.1.2 Collection of Reference Points .............................................................. 3.2 Field Surveys ..................................................................................................... 3.2.1 Control Survey ........................................................................................ 3.2.2 Cross-Section Survey .............................................................................. 3.2.3ProfileSurveys........................................................................................ 3.2.4 Bathymetric Survey ................................................................................ 3.2.5 Hydrometric Survey ............................................................................... 3.2.6 Validation Points Acquisition Survey ..................................................... 3.3 Data Processing ................................................................................................ 3.3.1 Collection of Raw Data ........................................................................... 3.3.2 Data Processing ...................................................................................... 3.3.3 Filtering of Data ..................................................................................... 3.3.4 Final Editing ............................................................................................ 3.3.5 Output ....................................................................................................4 Panay River Basin Survey ......................................................................................... 4.1 Control Survey ................................................................................................... 4.2ReconnaissanceofCross-sectionandProfileLines......................................... 4.3 Bathymetric Survey ........................................................................................... 4.4 Hydrometric Survey .......................................................................................... 4.5 Validation Points Acquisition Survey ................................................................
ANNEX A. PROBLEMS ENCOUNTERED AND RESOLUTIONS APPLIED ...............................ANNEX B. LIST OF EQUIPMENT AND INSTRUMENTS .........................................................ANNEX C. THE SURVEY TEAM ..............................................................................................ANNEX D. NAMRIA CERTIFICATION .....................................................................................ANNEX E. RECONNAISSANCE SUMMARY ...........................................................................
Table of Contents
1223 5 9 1111 1112121314 151616181920232323252630303353
5657585961

List of Figures
Figure 1. The General Methodological Framework of the Program ............................Figure 2. Panay River Basin Location Map ...................................................................Figure 3. Panay River Basin Soil Map ...........................................................................Figure 4. Panay River Basin Land Cover Map ...............................................................Figure 5. DVC Main Activities ........................................................................................Figure 6. DVC Field Activities ........................................................................................Figure 7. Flow Chart for Stage-Discharge Correlation Computation ............................Figure 8. Setup for GNSS Surveys .................................................................................Figure 9. DVC Data Processing Methodology ..............................................................Figure 10. Illustration of Echo Sounder and GPS rover set-up ...................................... for Bathymetric survey Figure 11. Location of control points .............................................................................Figure 12. Static GNSS observation at CP-175, a benchmark ......................................... at Barangay Lanot, Roxas City, Capiz Figure 13. GNSS observation at a reference point, ........................................................ CPZ 14 at Pan-ay church, Panay, CapizFigure 14. Established control point at Brgy. Punta Tabuc, Roxas City, Capiz ...................Figure 15. Hindrances along Panay River during the bathymetry survey ...........................Figure 16. Bathymetric survey coverage of Panay River ................................................Figure 17. Rain gauge deployed at Brgy. Agbanban, Panay ..........................................Figure 18. Rain gauge deployed at Brgy. Tabuc Sur, Capiz. ..........................................Figure 19. Deployment of Velocity Meter and Depth Gauge ....................................... (a) Panit-an Bridge, (b) Preparation of the deployment site, (c) buoy tied to the crate, (d) & (e) actual set-up of the depth gauge and velocity meterFigure 20. Relationship between rainfall and water level ((stage) ............................... at Brgy. Agbanban, PanayFigure 21. Relationship between rainfall and water velocity ....................................... at Brgy. Agbanban, PanayFigure 22. Relationship between water velocity and .................................................. water level (stage) at Brgy. Agbanban, PanayFigure 23. Scatter plot of the stage vs. discharge at Brgy. Agbanban, Panay ...................Figure 24. HQ Curve at Panitan Bridge, Brgy. Tabuc Sur, Pinantan, Capiz ......................Figure 25. Relationship between Rainfall and Stage at Panitan Bridge ..............................Figure 26. Relationship between Velocity and Stage at Panitan Bridge ..............................Figure 27. Relationship between Velocity and Rainfall at Panitan Bridge ........................Figure 28. HQ Curve at Dao Bridge Barangay Manhoy, Dao, Capiz ...............................Figure 29. HQ Curve at Sigma Bridge, Brgy. Poblacion Norte, Capiz ..............................Figure 30. Relationship between Rainfall and Stage at Sigma Bridge ..........................Figure 31. Relationship between Water Velcity and Stage at Sigma Bridge ..................Figure 32. Relationship between Water Velocity and Rainfall at Sigma Bridge ................Figure 33. HQ Curve at Maayon Bridge, Brgy. Ma-Ayon, Poblacion Capiz ........................Figure 34. Relationship between Rainfall and Stage at Maayon Bridge .............................Figure 35. Relationship between Water Velocity and Stage at Maayon Bridge ..............Figure 36. Relationship between Water Velocity and Rainfall at Maayon Bridge ...........Figure 37. Possible sites for Automated Water Level Sensor (AWLS) .............................. installation along Panay River SystemFigure 38. AWLS in Panitan Bridge, Brgy. Agkilo, Panitan, Capiz ...................................
3677101216171820
2628
29
293032333434
35
35
36
363737383838393939404040414142
43

List of Figures
Figure 39. AWLS in Dao Bridge, Barangay Manhoy, Dao, Capiz ...................................
Figure 40. AWLS in Jamindan Bridge, Jamindan, Capiz .................................................Figure 41. AWLS in Sigma Bridge, Brgy. Poblacion Norte, Capiz ..................................Figure 42. AWLS in Maayon Bridge, Tabuc, Brgy. Ma-Ayon, Poblacion Capiz .................Figure 43. Flow measurement along Jamindan Bridge, Municipality .......................... of Jamindan, Capiz Cross-Section 25 at New Bataan Survey AreaFigure 44. Flow measurement along Maayon Bridge, ................................................. Brgy. Ma-Ayon, Poblacion Tabuc, CapizFigure 45. Flow measurement along Sigma Bridge, ..................................................... Brgy. Poblacion Norte, CapizFigure 46. AWLS in Panitan Bridge, Brgy. Agkilo, Panitan, Capiz .................................Figure 47. AWLS in Dao Bridge, Barangay Manhoy, Dao, Capiz ...................................Figure 48. AWLS in Sigma Bridge, Brgy. Poblacion Norte, Capiz ..................................Figure 49. AWLS in Jamindan Bridge, Municipality of Jamindan, Capiz .........................Figure 50. AWLS in Maayon Bridge Brgy. Ma-Ayon, ...................................................... Poblacion Tabuc, Capiz Figure 51. LiDAR Validation setup ..................................................................................Figure 52. LiDAR validation coverage for Panay River Basin .........................................Figure 53. Panay River Sensor Locations .......................................................................Figure 54. Location of Installed AWLS in Panay River ...................................................
43
44444446
46
47
4849505152
53535454

Table 1. Control points occupied during Panay River Survey .................................... 27 (Source: NAMRIA; UP-TCAGP)Table 2. Summary of the location, the deployment and retrieval date of the ....... 36 sensors used for collecting the hydrometric properties of Panay RiverTable 3. Possible areas for AWLS installation, the candidates ................................... 42 were chosen on Google™ Earth imagesTable 4. List of additional bridges for AWLS ............................................................. 42Table 5. Summary of reconnaissance ........................................................................ 45
List of Tables

List of Abbreviations
ADCP AcousticDopplerCurrentProfilerAWLS Automated Water Level SensorBM BenchmarkDAC Data Acquisition ComponentDEM Digital Elevation ModelDG Depth GaugeDOST Department of Science and TechnologyDPC Data Processing ComponentDREAM Disaster Risk Exposure and Assessment for MitigationDVC Data Validation ComponentEGM 2008 Earth Gravitation Model 2008FMC Flood Modeling ComponentGCP Ground Control PointGE Geodetic EngineerGIS Geographic Information SystemGNSS Global Navigation Satellite SystemGPS Global Positioning SystemLGUs Local Government UnitsNAMRIA National Mapping and Resource Information AuthorityPCG Philippine Coast GuardPDRRMC Provincial Disaster Risk Reduction Management CouncilPPA Philippine Ports AuthorityPPK Post Processed KinematicRG Rain GaugeTCAGP Training Center for Applied Geodesy and PhotogrammetryUTM Universal Transverse MercatorWGS84 World Geodetic System 1984

1
Introduction

2
Introduction
1.1 DREAM Program Overview The UP training Center for Applied Geodesy and Photogrammetry (UP TCAGP) conducts a research program entitled “Nationwide Disaster Risk and Exposure Assessment for Mitigation” supported by the Department of Science and Technology (DOST) Grant-in-Aide Program. The DREAM Program aims to produce detailed, up-to-date, national elevation datasetfor3Dfloodandhazardmappingtoaddressdisasterriskreductionandmitigationinthe country.
The DREAM Program consists of four components that operationalize the various stages of implementation. The Data Acquisition Component (DAC) conducts aerial surveys to collect LiDAR data and aerial images in major river basins and priority areas. The Data Validation Component (DVC) implements ground surveys to validate acquired LiDAR data, along with bathymetric measurements to gather river discharge data. The Data Processing Component (DPC) processes and compiles all data generated by the DAC and DVC. Finally, the FloodModelingComponent(FMC)utilizescompileddataforfloodmodelingandsimulation.
Overall, the target output is a national elevation dataset suitable for 1:5000 scale mapping, with 50 centimeter horizontal and vertical accuracies, respectively. These accuracies are achieved through the use of state-of-the-art airborne Light Detection and Ranging (LiDAR) Systems collects point cloud data at a rate of 100,000 to 500,000 points per second, and is capable of collecting elevation data at a rate of 300 to 400 square kilometer per day, per sensor.
1.2 Objectives and target outputsThe program aims to achieve the following objectives:
a. Toacquireanationalelevationand resourcedatasetat sufficient resolution toproduceinformationnecessarytosupportthedifferentphasesofdisastermanagement,b. Tooperationalizethedevelopmentoffloodhazardmodelsthatwouldproduceupdatedanddetailedfloodhazardmapsforthemajorriversystemsinthecountry,c. To develop the capacity to process, produce and analyze various proven and potential thematic map layers from the 3D data useful for government agencies,d. To transfer product development technologies to government agencies with geospatial information requirements, and,e. To generate the following outputs
1. floodhazardmap2. digital surface model 3. digital terrain model and4. orthophotograph
3
Introduction
1.3 General methodological framework The methodology employed to accomplish the project’s expected outputs are subdivided into four (4) major components, as shown in Figure 1. Each component is described in detail in the following sections.
Figure 1. The General Methodological Framework of the Program


5
MethodologyThe Panay River Basin
6
The Panay River Basin
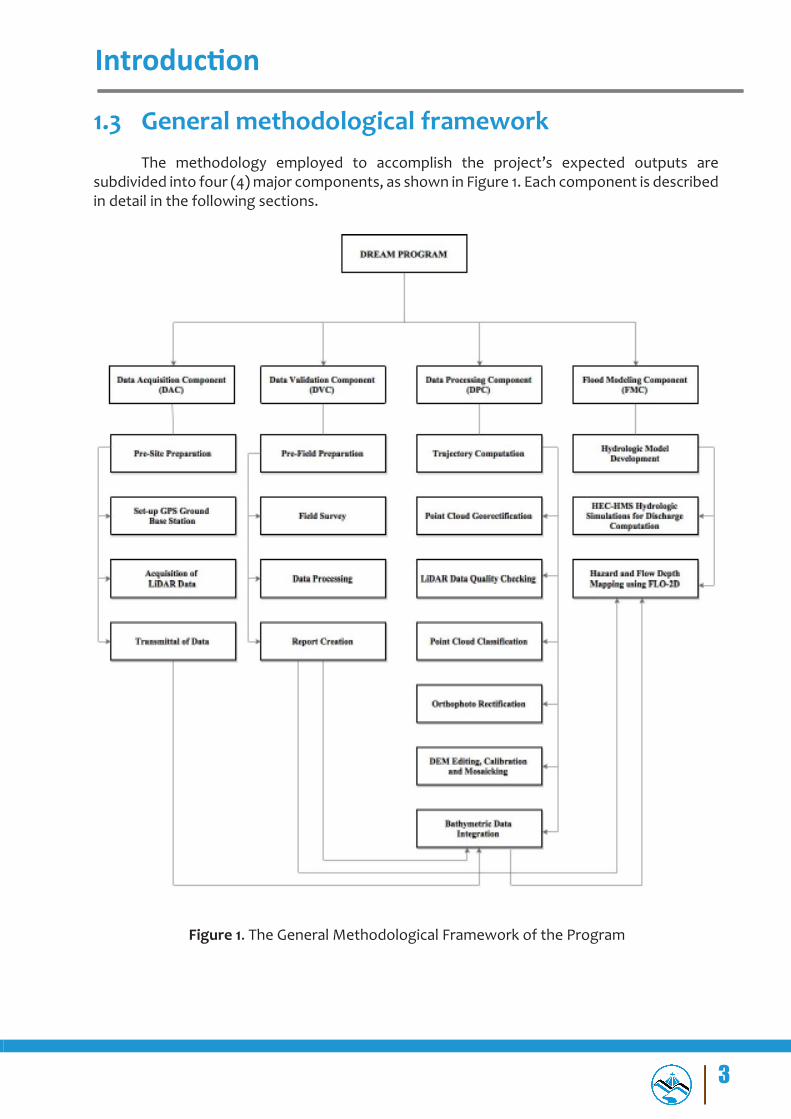
The Panay River Basin located in the north eastern part island of Panay in Western Visayas. The Panay River Basin is considered as the 12th largest river basin in the Philippines. It covers an estimated basin area of 1,843 square kilometers. The location of Panay River Basin is as shown in Figure 2.
Figure 2. Panay River Basin Location Map
This area includes the whole province of Capiz and a part of Iloilo and Aklan.. The upper part of the Panay River Basin consists of the Upper Panay River mainstream basin and three major tributary basins, the Badbaran, Mambusao, and Maayon river basins. It traverses through the Roxas City and the towns of Capiz and Pontevedra and drains the northern portion of the island.
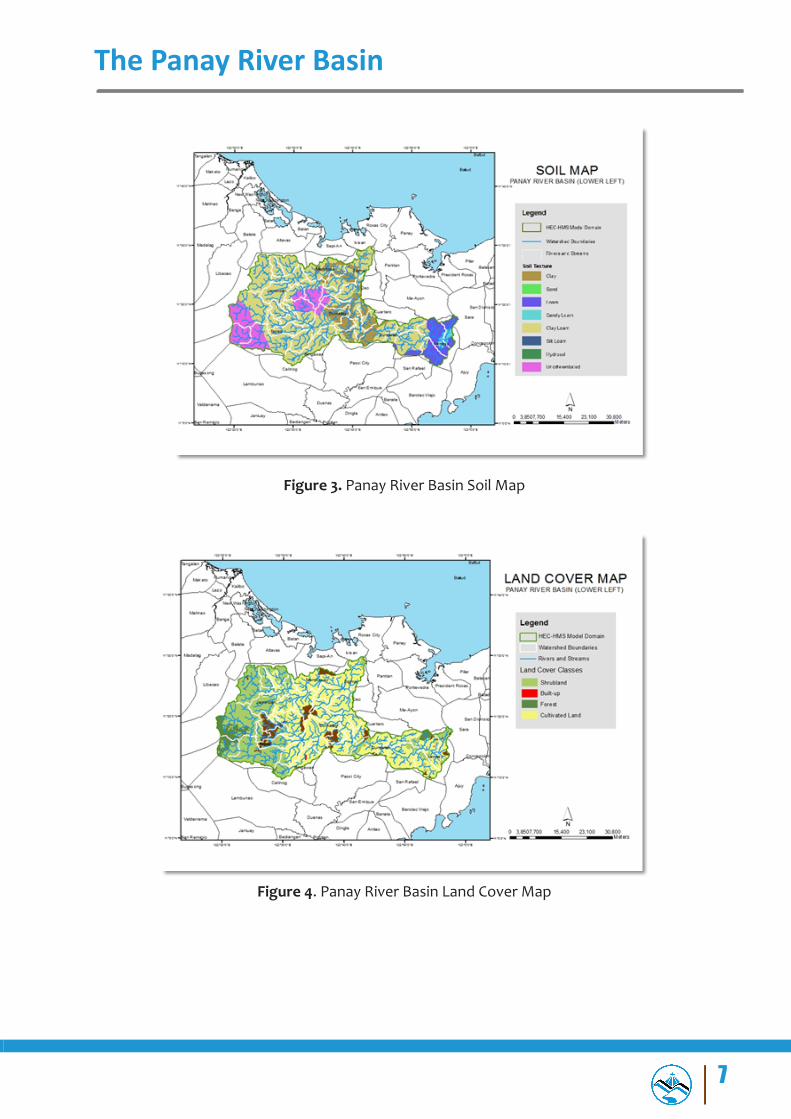
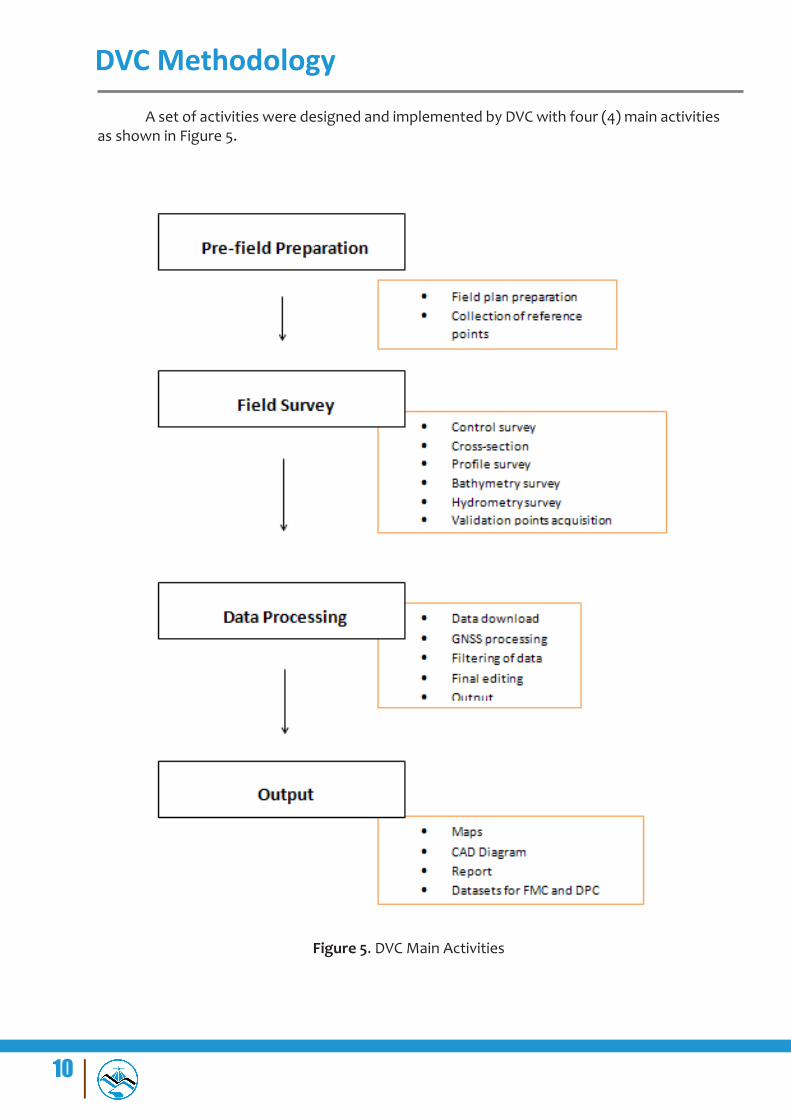
The land and soil characteristics are important parameters used in assigning the roughnesscoefficientfordifferentareaswithintheriverbasin.Theroughnesscoefficient,alsocalledManning’scoefficient,representsthevariableflowofwaterindifferentlandcovers(i.e.rougher,restrictedflowwithinvegetatedareas,smootherflowwithinchannelsandfluvialenvironments).
TheshapefilesofthesoilandlandcoverweretakenfromtheBureauofSoils,whichis under the Department of Environment and Natural Resources Management, and National Mapping and Resource Information Authority (NAMRIA). The soil and land cover of the Panay River Basin are shown in Figure 3 and 4, respectively.
7
The Panay River Basin
Figure 3. Panay River Basin Soil Map
Figure 4. Panay River Basin Land Cover Map


9
DVCMethodology
10
DVC Methodology
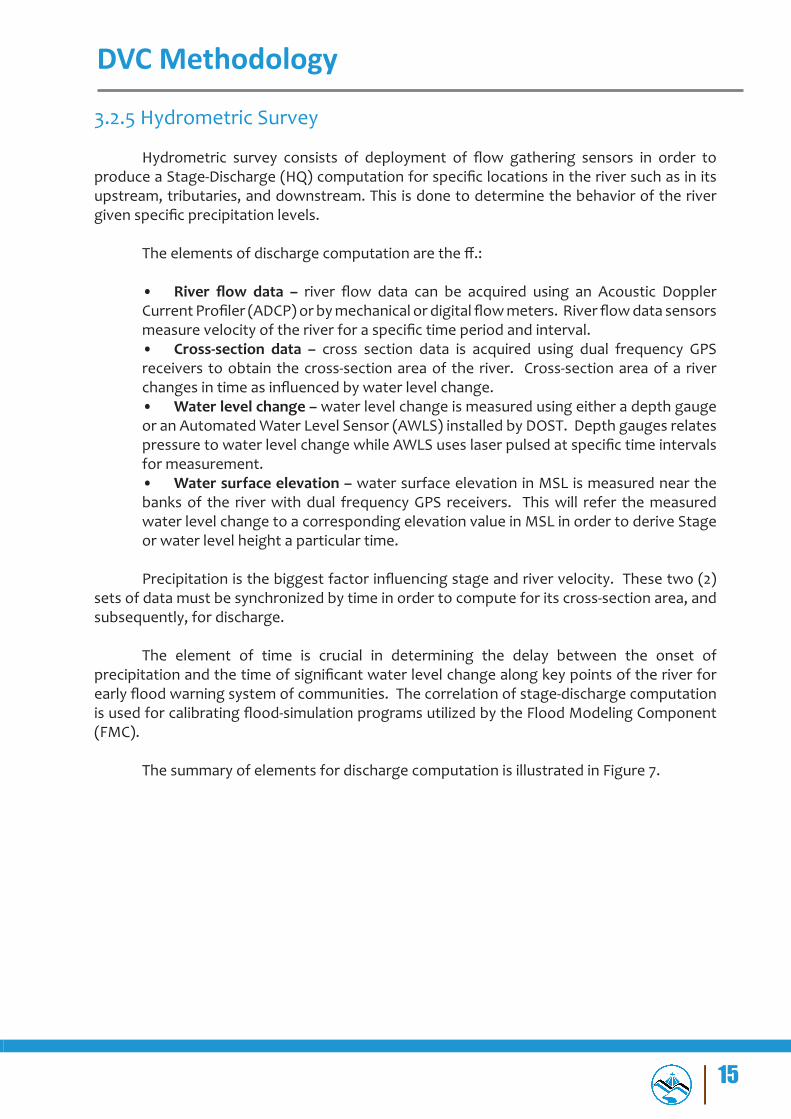
A set of activities were designed and implemented by DVC with four (4) main activities as shown in Figure 5.
Figure 5. DVC Main Activities

11
DVC Methodology
3.1 Pre-fieldPreparation
3.1.1 Preparation of Field Plan
Theplanningforresearchfieldworkconsidersallthenecessarytechnicalandlogisticalconcernsconceptualizedinafieldplan.
This serves as a basis and guide of the survey team in the implementation of the fieldworkactivitiesandincludedthefollowingactivities:
• Delineation of bathymetry lines and determination of the river basin extent using Google Earth® images and available topographic maps;• Listing and preparation of the survey equipment and other materials needed;• DesignationoftaskstoDVCmembersforthefieldsurvey;• Approximation of field duration and cost based on the delineated surveyextent; and• Assessmentoftheinitialfieldplanbytheprogrammanagementforapprovaland implementation.
3.1.2 Collection of Reference Points
Technical data and other relevant information are collected from the National Mapping and Resource Information Authority (NAMRIA) such as locations and descriptions of established horizontal and vertical control points with a minimum of 2nd order accuracy. These ground control points and benchmarks are selected and occupied as primary reference points for the establishment of a GNSS network for the survey.

12
DVC Methodology
3.2 Field Surveys
Figure 6. DVC Field Activities
3.2.1 Control Survey
A GNSS network is established through occupation of reference points with dual frequency GNSS receivers for four (4) hours. Reference points from NAMRIA only bear vertical coordinates (z or elevation value) and horizontal coordinates (x and y values) for benchmarks and ground control points, respectively.
Control survey aims to provide both the horizontal and vertical position for every control point established through network adjustment. Horizontal position is acquired through static survey while establishment of vertical position can be done either using a Total Station (TS) or digital level or through static survey.
For the vertical position control survey using a TS or Level, a double run is carried out connecting the nearest existing NAMRIA benchmarks (BMs) to the control point. A double run consists of a forward run (from BM to GCP) and backward run (from GCP to BM). The accuracyshallbeassessedandacceptedifitiswithinthethirdorderdifferentiallevelingstan-dard.
A benchmark may be used to refer elevation data to Mean Sea Level (MSL) within 20-km radius. Additional benchmarks are located for survey areas exceeding this 20-km radius.

13
DVC Methodology
Establishment of a GNSS network through control survey is pre-requisite for the con-duct of other ground survey activities. Reference and control points occupied for the control survey may serve as base stations throughout the survey area.
3.2.2 Cross-section Survey
Theobjectiveofthisactivityistoderiveasectionalviewofthemainriverandthefloodplain (right and left banks). Cross-sections are surveyed perpendicular to the riverbanks with an average length of 100 meters for each bank. The cross-section line shall follow the path of the nearby road or goat trails with a 10-meter interval for each point measurement. Additional points are obtained to describe apparent change in elevation along the cross-section line. Eachcross-sectionisidentifiedsequentiallyfromupstreamtodownstreamdirection.
Cross-sectionsurveysaredoneusingdualfrequencyGNSSreceiversanddifferentialkinematic GNSS survey technique. The accuracy of the horizontal position and elevation of each individual cross-section surveys is within ±20 cm for horizontal and ±10 cm for vertical position residuals.
Areas where kinematic GNSS survey is not applicable due to the presence of obstructions such as tall structures and canopy of trees, conventional surveying techniques such as total stations and level are used to collect cross-sectional data.

14
DVC Methodology
3.2.3ProfileSurveys
Profilesurveysareconductedtoobtaintheupperandlowerbanksoftheriver.Thisdata is overlaid with LIDAR data to delineate the longitudinal extent of the river.
AprofilesurveyconsistsoftheLeftUpperBank(LUB)andLeftLowerBank(LLB),RightUpperBank(RUB)andRightLowerBank(RLB).Anintervalbetweensuccessiveprofilepointsis approximately 10 meters. Additional points are gathered to describe apparent change in elevationalongtheprofileline
Profile surveys are conducted using dual frequency GNSS receivers and kinematicsurvey technique with a prescribed vertical accuracies of ±20 cm for horizontal and ±10 cm for vertical position, respectively. Conventional surveying techniques such as total stations and levelareusedtocollectprofiledataforareaswherekinematicGNSSsurveyisnotapplicabledue to obstructions such as tall structures and canopy of trees.
3.2.4 Bathymetric Survey
Bathymetric survey is performed using a survey-grade single beam echo sounder capable of logging time-stamped depth value in centimeter and dual frequency GNSS using kinematic survey technique, with prescribed vertical accuracies of ±20 cm for horizontal and ±10 cm for vertical position for rivers navigable by boat. Data acquisition is logged at one second intervals both for GPS positions and elevation and echo sounder depth reading
For portions of the river that is not navigable by boat due to shallow waterless than a meter, riverbed may be acquired using manual bathymetric survey. Manual bathymetric survey means manually acquiring riverbed points without the use of an echo sounder. It can be done using a GPS receiver, Total Station or Level.
15
DVC Methodology
3.2.5 Hydrometric Survey
Hydrometric survey consists of deployment of flow gathering sensors in order toproduceaStage-Discharge(HQ)computationforspecificlocationsintheriversuchasinitsupstream, tributaries, and downstream. This is done to determine the behavior of the river givenspecificprecipitationlevels.
Theelementsofdischargecomputationaretheff.:
• River flow data – river flow data can be acquired using an Acoustic DopplerCurrentProfiler(ADCP)orbymechanicalordigitalflowmeters.Riverflowdatasensorsmeasurevelocityoftheriverforaspecifictimeperiodandinterval.• Cross-section data – cross section data is acquired using dual frequency GPS receivers to obtain the cross-section area of the river. Cross-section area of a river changesintimeasinfluencedbywaterlevelchange.• Waterlevelchange–water level change is measured using either a depth gauge or an Automated Water Level Sensor (AWLS) installed by DOST. Depth gauges relates pressuretowaterlevelchangewhileAWLSuseslaserpulsedatspecifictimeintervalsfor measurement.• Watersurfaceelevation–water surface elevation in MSL is measured near the banks of the river with dual frequency GPS receivers. This will refer the measured water level change to a corresponding elevation value in MSL in order to derive Stage or water level height a particular time.
Precipitationisthebiggestfactorinfluencingstageandrivervelocity.Thesetwo(2)sets of data must be synchronized by time in order to compute for its cross-section area, and subsequently, for discharge.
The element of time is crucial in determining the delay between the onset of precipitationandthetimeofsignificantwaterlevelchangealongkeypointsoftheriverforearlyfloodwarningsystemofcommunities.Thecorrelationofstage-dischargecomputationisusedforcalibratingflood-simulationprogramsutilizedbytheFloodModelingComponent(FMC).
The summary of elements for discharge computation is illustrated in Figure 7.

16
DVC Methodology
Figure 7. Flow Chart for Stage-Discharge Correlation Computation
3.2.6 Validation Points Acquisition Survey
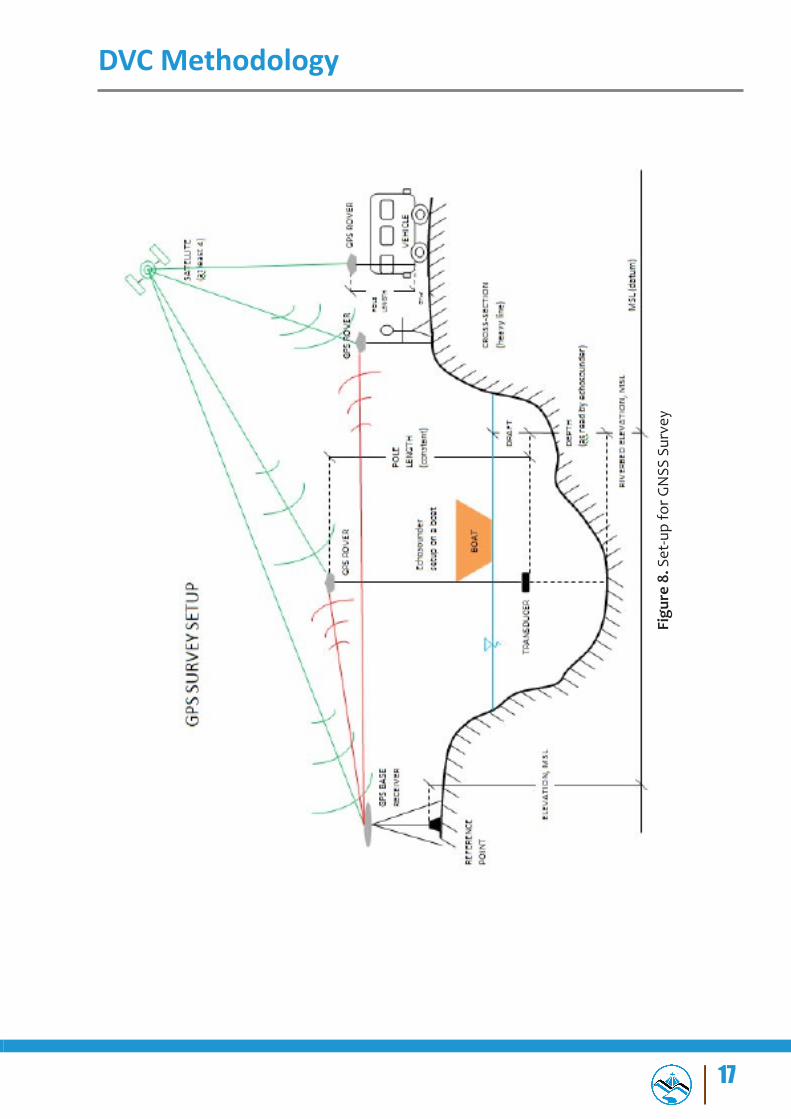
Ground validation survey is conducted for quality checking purpose of the Aerial LiDAR data acquired by the Data Acquisition Component (DAC). A roving GNSS receiver is mounted on a range pole attached to a vehicle to gather points thru continuous topo method in a PPK SurveyTechnique.Pointsaremeasuredalongmajorroadsandhighwayacrosstheflightstripsprovided by DAC.
GNSSsurveyssetupusedtoaccomplishDVC’sfieldsurveyactivitiesareillustratedinFigure 8.
17
DVC Methodology
Figu
re 8
. Set
-up
for G
NSS
Sur
vey

18
DVC Methodology
Figu
re 9
. DVC
Dat
a Pr
oces
sing
Met
hodo
logy
3.3
Dat
a Pr
oces
sing
D
ata
proc
essi
ng p
roce
dure
s us
ed b
y D
VC a
re s
umm
ariz
ed in
Fig
ure
9.

19
DVC Methodology
3.3.1 Collection of Raw Data
GPS Raw data in (*.t02) format are downloaded from Trimble™ GPS receivers used in static, cross-section, LiDAR ground validation, and bathymetric surveys. Depth values in (*.som)filesfrombathymetricsurveysarealsodownloadedfromOHMEX®echosounder.
3.3.2 Data Processing
Processing for GNSS Data
The horizontal and vertical coordinates of the reference point used as base station are heldfixed,basedonitsNAMRIAcertification,fortheestablishmentofaGNSSnetworkforthesurveyarea.Coordinatesofthisfixedpointisusedtogivehorizontalandverticalcoordinatesfor the other reference points occupied and control points established.
Data from GNSS control surveys are processed in Trimble™ Business Center (TBC) software and settings were set to the required accuracy of +/-10cm for vertical and +/-20cm for horizontal controls. The TBC coordinate system parameters were set to Universal Transverse Mercator (UTM) Zone 51 North, World Geodetic System of 1984 (WGS1984), and the geoid model EGM2008 for horizontal and vertical datum, respectively.
AnoffsetisderivedbycomparingtheMSLelevationofthebenchmarkstatedintheNAMRIAcertificationanditselevationvaluethatresultedfromtheprocessedandadjustedcontrol survey.Thisoffset isusedto referallelevation fromothersurveys intoMSL(BM_Ortho).
TheformulasusedforoffsetandBM_OrthocomputationareshowninEquations1-2:
Computationforoffset: Equation 1:
OFFSET = BM - EGM
ComputationforBM_ortho:
Equation 2:
BM_ortho = EGM_ortho ± OFFSET

20
DVC Methodology
where:
OFFSET =difference/offsetbetweenGeoidmodel,EGM2008andMSL datum. Can be a positive or negative valueBM =MSLelevationofverticalcontrolpointcertifiedbyNAMRIAEGM = EGM2008 elevation of the same NAMRIA vertical control point derived from TBC software processingEGM_Ortho = elevation of points referred to geoid model, EGM 2008BM_Ortho = elevation of points referred to MSL
GNSS processing is also done for the other surveys with the coordinates from the occupiedpointsforthecontrolsurveyheldfixed,dependingonwhichbasestationisusedfor the survey.
Processedandadjusteddataareexportedtocommadelimited(*.csv)fileformatwiththeff.columns:PointName,Latitude,Longitude,EllipsoidalHeight,Northing,Easting,andElevation(EGM_Ortho).ThisfileformatcanbeaccessedthroughMicrosoftExcel/Spreadsheetprogram.
Depth Data Processing
Figure 10. Illustration of Echo Sounder and GPS rover set-up for Bathymetric survey
There are two types of echo sounders used for bathymetric surveys – Hi-Target™ single beam echo sounder which is capable of recording depth data of one decimal place and the OHMEX™ single beam echo sounder capable of recording two-decimal places of depth data.
RawdepthdatafromHi-Target™singlebeamechosounderisexportedin(*.txt)fileformatwiththeff.columns:PointNo.,Time,DepthsH,DepthsL,Draft,andSoundVelocity.This(*.txt)fileiscopiedtoaspreadsheet,retainingonlythecolumnsforTimeandDepthsH.

21
DVC Methodology
RawdepthdatafromOHMEX™singlebeamechosounderareexportedin(*.som)fileformat.ItisimportedintoSonarVistathenexportedinto*.csvformatwiththeff.columns:Type,Date/Time,Sec,X/E,Y/N,Z/H,Tide,DepthandQA.SonarVistaisusedasfileconversiontoolonly.The(*.csv)fileopenedusingspreadsheet,makinguseofonlythecolumnsforDate/Time and Depth.
Data Matching for Bathymetric Data
Data matching is done by pairing an individual attribute of a bathymetric point to a depth data acquired using either OHMEX or HI-Target echo sounder. Matching is possible by ensuring that both bathymetric points and depth values acquisition has time stamp capability. These two sets of data are matched using VLOOKUP tool of a spreadsheet program, such that each point will have an accompanying (x,y,z) and depth data.
Below is the formula used for computing the elevation of the riverbed:
Equation 3:RBE (t) = TRE (t) – Depth (t)
where:
RBE(t) = elevation of the riverbed during time t,
TRE(t) = transducer elevation (reckoned from EGM 2008)
Depth(t) = depth recorded by the echo sounder at time t, with the
assumption that depth is measured from the bottom of the
transducer down to the riverbed
TheresultingRBE(t)dataarereferredtoMSL(BM_ortho)byapplyingtheoffsetforthe established network.
Final processed data are imported to Google Earth™ and Geographic Information Systems (GIS) software for viewing and checking horizontal position.
22
DVC Methodology
Hydrometry Data Processing
TheprocessesdoneforHydrometrydataforHQcomputationaredescribedintheff.steps:
1. River Flow Data
a.) ADCP
Data from the ADCP is logged internally and can be downloaded using either SonUtils™ or View Argonaut™ software. River velocity is recorded for a specifiedtimedurationandintervalcanbeexportedina(*.csv)format.
b.) Flow Meter
Acquisitionofrivervelocityusingflowmetersisdonemanually.Measurementsforaspecifiedtimedurationandintervalisrecordedinafieldnotebookandsaved in a spreadsheet program.
2. Cross Section and Water Surface Elevation Data
Cross Section data and water surface elevation data is acquired using GNSS receiversdescribedinsection3.3.4forGNSSdataprocessingwitharesultingfilein (*.xls) format.
3. Water Level Change-Stage
a.) Depth Gauge
Data from depth gauge can be downloaded using HobowarePro™. Water levelinmetersareloggedforaspecifictimeintervalanditcanbeexportedin a (*.csv) format.
b.) AWLS
Data from installed AWLS can be accessed via the internet (http://repo.pscigrid.gov.ph/predict/). Water levels are logged in ten-minute time intervals and can be copied into a spreadsheet program.
4. Discharge Computation
Riverflowdataandwaterlevelchangeissynchronizedbytime.Parameterswerepreset in its respective programs so the deployment of each instrument will begin and end in the same time. All data in (*.csv) and (*.csv) format are combined in asingleworksheetwhereinthecomputationforthecoefficientofdeterminationor R2 are done.
The illustration in Figure 7 shows how each set of data from each instrument can be synchronized.

23
DVC Methodology
3.3.3 Filtering of Data
A processed pointwhich resulted to float or did notmeet the desired accuracy isfilteredout.Resurveysareconducted immediately ifdatagapsarepresentforthegroundsurveys.
3.3.4 Final Editing
Final editing is performed to be able to come up with the desired data format: Point Value, Latitude, Longitude, Ellipsoidal Height, Northing, Easting, EGM_Ortho and BM_Ortho.
Processes discussed are valid for static, cross section, ground validation, and manual bathymetric surveys not employing echo sounders. For bathymetric surveys using a single beam echo sounder, the GPS rover is mounted on top of a 2m pole and a transducer at the bottom (see Figure 10). Figure is valid in both using OHMEX and HI-Target echo sounders. The GPS rover provides horizontal and vertical coordinates whereas the echo sounder transducer measures depth of the river from its bottom down to the riverbed.
3.3.5 Output
Filtered data are furthered processed into desired template using a spreadsheet program.Finaldataaregenerated intomapsandCADplots for cross-section,profile, andriverbed profiles. Cross-section, Profile, Validation Points, and Bathymetric data shall beturned-over to DPC while hydrometric data shall be turned-over to FMC.

25
Panay River Basin Survey

26
Panay River Basin Survey
The Panay River Basin Survey in the Capiz Province was conducted on February 5-23, 2013.Thesurvey includescross-sectionandprofilereconnaissance,bathymetricsurveyandflow measurements in Panay River. Cross-section and profile reconnaissance was donesimultaneously with bathymetric and hydrometric measurements during the survey period. Additional fieldworks were conducted on July 21-22, 2013 and on October 23-29, 2013 toacquiretheLiDARdatavalidationandtogathercrosssectiondataandflowmeasurementatthe installed Automated Water Level Sensors (AWLS) in the Panay River System respectively.
4.1 Control Survey
Three (3) NAMRIA established control points were occupied simultaneously: CP-175, CPZ-14, and an established point near Jumbo Bridge. CPZ-175 is a 1st order NAMRIA benchmark located at Brgy. Lanot, Roxas City, Capiz. CPZ-14 is a 2nd order NAMRIA control point located at Pan-ay Church, Panay, Capiz. And, a temporary point was occupied as base station established near Jumbo Bridge at Brgy. Punta Tabuc, Roxas City, Capiz. The GNSS loop is shown in Figure 11.
Figure 11. Location of control points

27
Panay River Basin Survey
Threehoursof continuousdifferential staticobservationswereconductedat thesethree points to provide reference control points for the ground and bathymetric surveys. The horizontal coordinates and elevations of the three (3) control points were computed using Trimble®BusinessCenterGNSSprocessingsoftware.TheNAMRIAcertifiedhorizontalvaluesandvertical valueofCPZ-14andCP-175 respectivelywerefixedduring theprocessing.Theresult of static survey for the control points are indicated in Table 1.
Table 1. Control points occupied during Panay River Survey (Source: NAMRIA; UP-TCAGP)
Point NameWGS84 UTM Zone 51N Elevation
in MSL (m)Latitude Longitude Ellipsoidal
Height (m)Northing
(m)Easting
(m)CP-175 11°31'05.92471" N 122°45'29.71479" E 65.487 1273301.575 473637.89 6.880CPZ-14 11°33'19.98412" N 122°47'39.56494" E 60.96 1277416.185 477574.199 2.391Jumbo Bridge
11°34'46.19407" N 122°44'53.19336" E 60.645 1280068.194 472537.555 2.320

28
Panay River Basin Survey
The GNSS setup for the four (4) control points are illustrated in Figures 12-16:
SPS 882
Figure 12. Static GNSS observation at CP-175, a benchmark at Barangay Lanot, Roxas City, Capiz

29
Panay River Basin Survey
SPS 852
Figure 13. GNSS observation at a reference point, CPZ 14 at Pan-ay church, Panay, Capiz
Figure 14. Established control point at Brgy. Punta Tabuc, Roxas City, Capiz

30
Panay River Basin Survey
4.2ReconnaissanceofCross-sectionandProfileLines
The objective of theReconnaissance Team (RT) is to inspect the pre-defined crosssectionandprofilelinesalongPanayRiver.TheRTnotedthecharacteristicsofthelocationofthe cross section and took pictures of the area. Garmin Montana™ 650 was used to locate the plannedcrosssectionandprofilelines.
The majority of the cross sections were deemed passable. Most obstructions are caused canopy of trees which makes GNSS surveying not ideal. Using a total station is advised in such cases.
Crosssections1–23aregenerallyricefieldswith linespassingthroughprivateproperties.Cross sections 24 – 35 are within the city proper where the population is dense. Most of these crosssectionlinesfallalongtheroads.CrossSections36–42arelocatedonfishpondswhichfall along the footpath rice paddies or pilapil. More details and summary of the reconnaissance forcross-sectionandprofilecanbefoundinAnnexE.
The bank of the river is rich in vegetation which covers about eighty (80) percent of the survey extent. There are lots of nipa trees in the upstream portion of the river and mangroves near the mouth of the river. The upper and lower banks are covered by thick vegetation and trees.
4.3 Bathymetric Survey
The objective of the bathymetric survey is to obtain the topography and elevation of the river bed since river channel is the main carrier of water from the watershed down to a floodplainarea.Thesedatasetswillbeincorporatedinthefloodmodelling.
Ohmex Sonarmite Echosounder was used for hydrographic survey which measures the depth along certain points on the surface of the river. The elevation and coordinates of thesepointsweremeasuredthroughdifferentialGPSPPKmodeinwhichaPPKbasestationwas set-up on a known control point. The transducer was mounted to a pole placed vertically beside the boat where a cable was connected to the echosounder for a depth measurement. A GPS receiver Trimble® SPS882 was connected above the pole to determine the position of the points which the echo sounder collected. A wireless Trimble® TSC3 GPS controller employed for logging and viewing the gathered GPS points. The elevation of the riverbed is then derived from the GPS-derived elevation minus the antenna-to-echo-sounder length minus the depth recorded by the echo sounder. This survey equipment was installed in a motor boat.
The surveywas conducted fromBrgy. Barra, Roxas City down to the floodplain ofPanay River.
As an observation during the survey, upstream of the river are narrow areas with trees andnipasfromleftandrightbanks.Somepiecesofwoodandnipaarefloatingintheriverthat the motorboat could not pass through. Cross-section seven (7) going downstream of the river were passable. Thee hindrances are shown in Figure 15. Overall bathymetry coverage is illustrated in Figure 16

31
Panay River Basin Survey
Figure 15. Hindrances along Panay River during the bathymetry survey

32
Panay River Basin Survey
Fi
gure
16. B
athy
met
ric s
urve
y co
vera
ge o
f Pan
ay R
iver
.

33
Panay River Basin Survey
4.4 Hydrometric Survey Different sensorsweredeployedon thebanksofPanayRiver toobtain itsphysicalcharacteristics such as cross-section elevation in MSL, velocity, and elevation of water level in MSL at a particular time.
Data collection in Panay using ADCP, Depth Gauge and Rain Gauge deployment started on February 9, 2013 at Panitan Bridge Brgy. Tabuc Sur, Panitan, Capiz and retrieved on February 11, 2013. Then, it was re-deployed at Brgy. Agbanban, Panay on the same day until February 20, 2013. The setups of the deployed sensors are illustrated in Figure 17, 18 and 19 while the summary of the deployment schedule was tabulated in Table 2.
The ADCP was monitored and its data was downloaded every two (2) days while the depth gauge which was installed on the metal frame together with the ADCP and the Rain Gauge installed in Dao, Maayon, Panitan and Sigma Bridge was continued gathering data until its retrieval.
The data gathered from the rain gauge shows the distribution of rainfall within the observation period on February 9-11, 2013. Measurements were recorded every five (5)minutes.
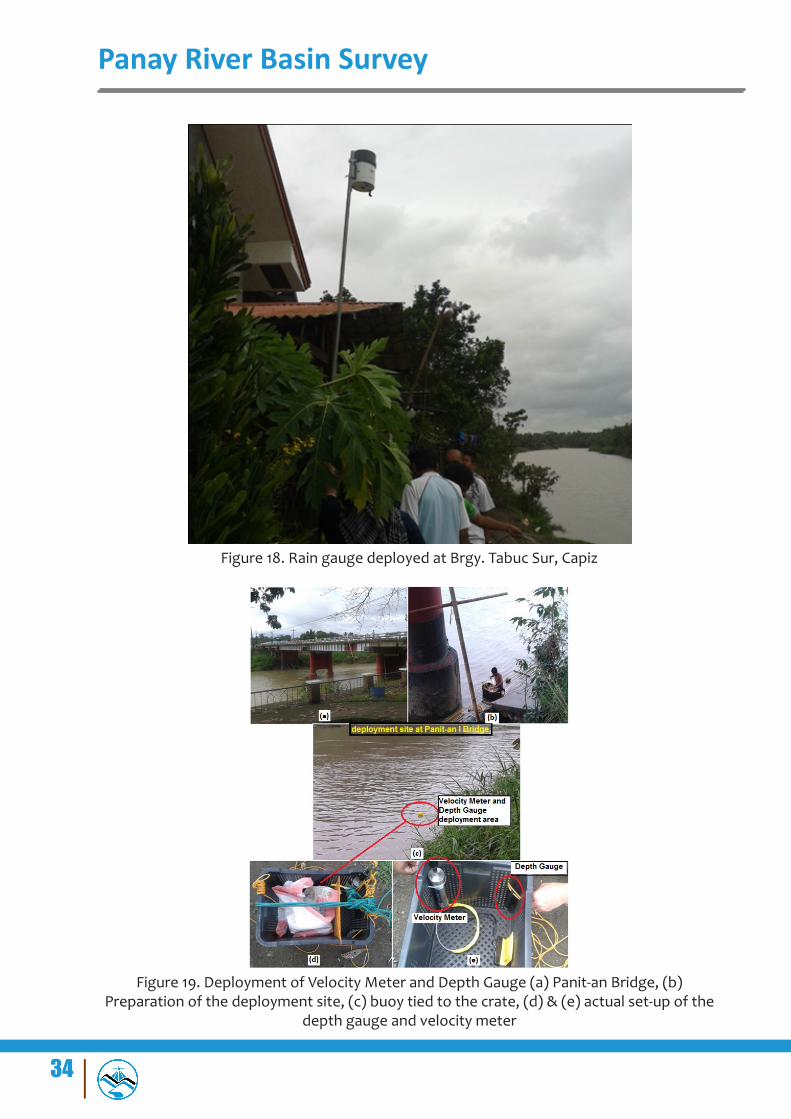
Figure 17. Rain gauge deployed at Brgy. Agbanban, Panay
34
Panay River Basin Survey
Figure 18. Rain gauge deployed at Brgy. Tabuc Sur, Capiz
Figure 19. Deployment of Velocity Meter and Depth Gauge (a) Panit-an Bridge, (b) Preparation of the deployment site, (c) buoy tied to the crate, (d) & (e) actual set-up of the
depth gauge and velocity meter

35
Panay River Basin Survey
Plotting the relationship of hydrometric data gathered by the sensors for rainfall vs water level is shown in Figure 20. This shows that the highest peak of rainfall was observed on February 11, 2013 with an approximately 5.6 mm.
Figure 20. Relationship between rainfall and water level (stage) at Brgy. Agbanban, Panay
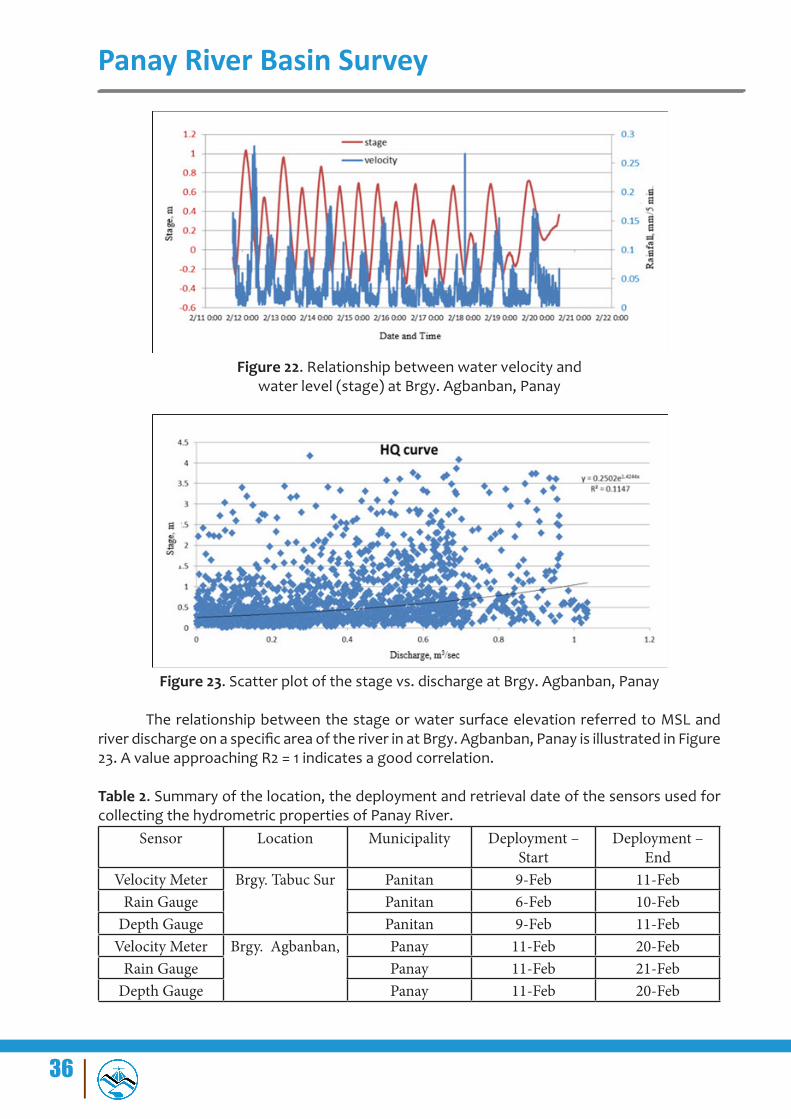
The relationship of hydrometric data gathered by the sensors for rainfall vs water velocity and water velocity vs water level is shown in Figure 21 and Figure 22. In Figure 21, peak rainfall was observed on February 11, 2013 with 5.8 mm which followed by the highest velocity on February 12, 2013 with 0.25 meter per second. While in Figure 22, it was observed that the water level increased simultaneously with water velocity.
Figure 21. Relationship between rainfall and water velocity at Brgy. Agbanban, Panay
36
Panay River Basin Survey
Figure 22. Relationship between water velocity and water level (stage) at Brgy. Agbanban, Panay
Figure 23. Scatter plot of the stage vs. discharge at Brgy. Agbanban, Panay
The relationship between the stage or water surface elevation referred to MSL and riverdischargeonaspecificareaoftheriverinatBrgy.Agbanban,PanayisillustratedinFigure23. A value approaching R2 = 1 indicates a good correlation.
Table 2. Summary of the location, the deployment and retrieval date of the sensors used for collecting the hydrometric properties of Panay River.
Sensor Location Municipality Deployment – Start
Deployment – End
Velocity Meter Brgy. Tabuc Sur Panitan 9-Feb 11-FebRain Gauge Panitan 6-Feb 10-Feb
Depth Gauge Panitan 9-Feb 11-FebVelocity Meter Brgy. Agbanban, Panay 11-Feb 20-Feb
Rain Gauge Panay 11-Feb 21-FebDepth Gauge Panay 11-Feb 20-Feb

37
Panay River Basin Survey
In addition to the acquired hydrometry data in Brgy. Agbanban, water level data were extractedfromrepo.pscigrid.gov.phtoacquirethedischargevsstagepropertyofdifferentautomated water level sensors (AWLS) installed in bridges within the Panay River System. Rainfall data were extracted from Panitan Automated Rain Gauge (ARG) in Panitan Bridge, Tapulang ARG in Maayon Bridge and Dao ARG in Dao Bridge. Sensors data per bridge are shown from Figure 24 to Figure 36.
Figure 24. HQ Curve at Panitan Bridge, Brgy. Tabuc Sur, Pinantan, Capiz.
Figure 25. Relationship between Rainfall and Stage at Panitan Bridge

38
Panay River Basin Survey
Figure 26. Relationship between Velocity and Stage at Panitan Bridge
Figure 27. Relationship between Velocity and Rainfall at Panitan Bridge
Figure 28. HQ Curve at Dao Bridge Barangay Manhoy, Dao, Capiz

39
Panay River Basin Survey
Figure 29. HQ Curve at Sigma Bridge, Brgy. Poblacion Norte, Capiz
Figure 30. Relationship between Rainfall and Stage at Sigma Bridge
Figure 31. Relationship between Water Velcity and Stage at Sigma Bridge

40
Panay River Basin Survey
Figure 32. Relationship between Water Velocity and Rainfall at Sigma Bridge
Figure 33. HQ Curve at Maayon Bridge, Brgy. Ma-Ayon, Poblacion Capiz
Figure 34. Relationship between Rainfall and Stage at Maayon Bridge
41
Panay River Basin Survey
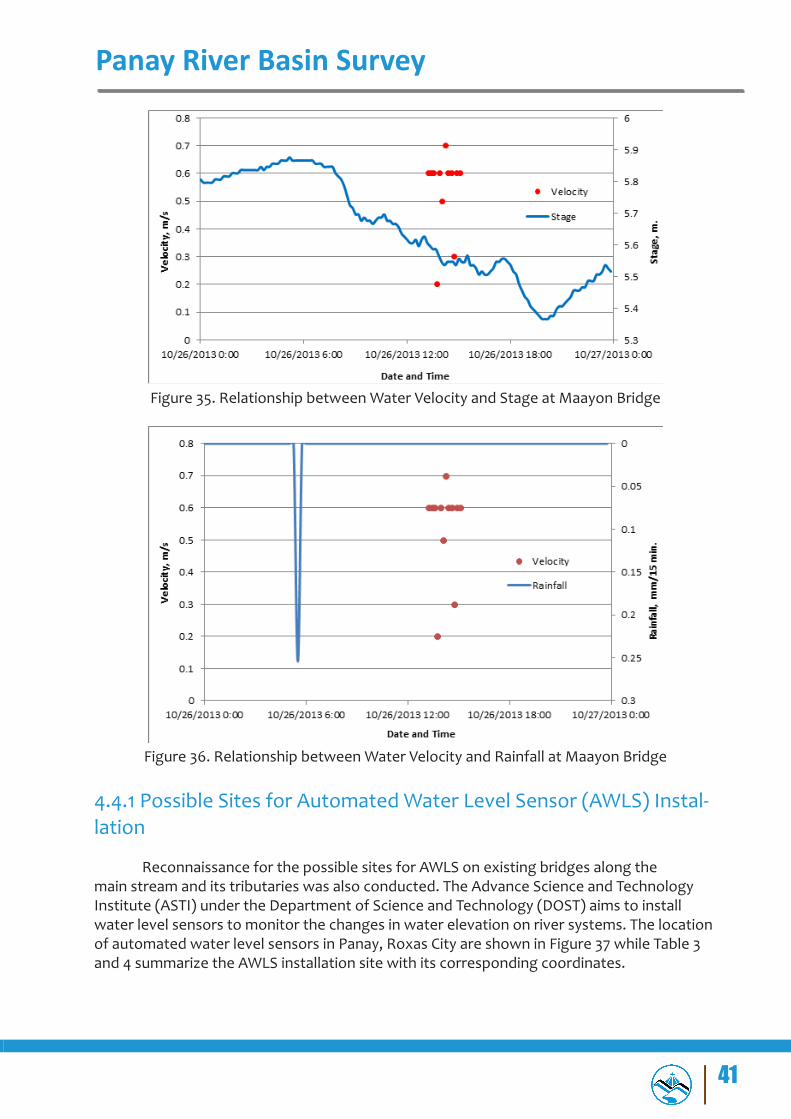
Figure 35. Relationship between Water Velocity and Stage at Maayon Bridge
Figure 36. Relationship between Water Velocity and Rainfall at Maayon Bridge
4.4.1 Possible Sites for Automated Water Level Sensor (AWLS) Instal-lation
Reconnaissance for the possible sites for AWLS on existing bridges along the main stream and its tributaries was also conducted. The Advance Science and Technology Institute (ASTI) under the Department of Science and Technology (DOST) aims to install water level sensors to monitor the changes in water elevation on river systems. The location of automated water level sensors in Panay, Roxas City are shown in Figure 37 while Table 3 and 4 summarize the AWLS installation site with its corresponding coordinates.

42
Panay River Basin Survey
Figure 37. Possible sites for Automated Water Level Sensor (AWLS) installation along Panay River System
Table 3. Possible areas for AWLS installation, the candidates were chosen on Google™ Earth images
Bridge Latitude LongitudeBarangay Manhoy, Dao, Capiz 11°21'00.90" N 122°40'06.74" EBarangay Poblacion Ilaya, Dao,
Capiz 11°22'58.49" N 122°47'12.02" E
Barangay Bago Grande, Roxas City 11°30'41.65" N 122°46'10.75" EBarangay Milibili, Roxas City 11°34'22.71" N 122°46'30.98" E
Barangay Tabuc, Ilaya, Ilawod, Pon-tavedra 11°28'56.65" N 122°49'55.31" E
On actual ground search, the survey team realized that there are existing bridges not seen on Google™ Earth which can also be suitable for sensor installation. Here are the lists of additional bridges for AWLS.
Table 4. List of additional bridges for AWLS.Bridge Latitude Longitude
Panitan Bridge, Panay 11°27'48.8" N 122°46'11.7" EMambusao Bridge, Mambusao 11°25'44.62" N 122°35'54.04" E
Sigma Bridge, Capiz 11°25'13.0" N 122°39'58.9" EMaayon Bridge, Maayon, Capiz 11°23'17.2" N 122°46'53.0" E

43
Panay River Basin Survey
A good sensor deployment site should meet the following criteria.
1. Cellphonereceptionavailabilityinthearea–the sensors will be sending real time data to respective units through sms messages. Area shall be checked for available mobile signal reception.2. Securityofthearea– is the area/bridge isolated or is there a community nearby. A better condition would be a bridge within a community so that there will always be someone to look over the sensors.3. Drainage Area
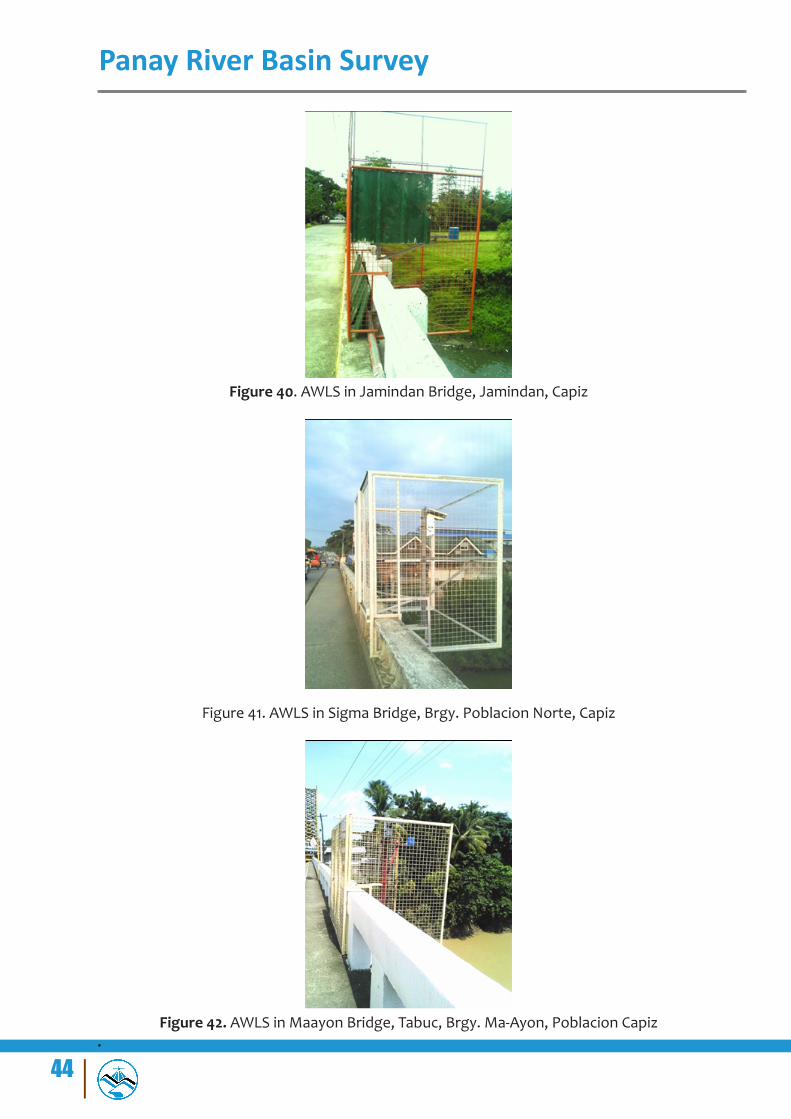
The installed automated water level sensors (AWLS) in the Panay River System are shown in Figure 38 to 42:
Figure 38. AWLS in Panitan Bridge, Brgy. Agkilo, Panitan, Capiz
Figure 39. AWLS in Dao Bridge, Barangay Manhoy, Dao, Capiz
44
Panay River Basin Survey
Figure 40. AWLS in Jamindan Bridge, Jamindan, Capiz
Figure 41. AWLS in Sigma Bridge, Brgy. Poblacion Norte, Capiz
Figure 42. AWLS in Maayon Bridge, Tabuc, Brgy. Ma-Ayon, Poblacion Capiz.

45
Panay River Basin Survey
Tabl
e 5.
Sum
mar
y of
aw
ls re
conn
aiss
ance
resu
lt
BRID
GE
CU
RREN
T ST
ATE
SEC
URI
TYC
ELL
PHO
NE
RE-
CEP
TIO
NA
S TO
LD B
Y TH
E RE
SID
ENTS
REM
ARK
SRE
CO
MM
END
A-TI
ON
1Ba
rang
ay M
an-
hoy,
Dao
, Cap
iz
(Man
hoy
Qua
rte-
ro B
ridge
)
flow
ing
wat
erho
uses
nea
r the
brid
ge;
natio
nal r
oad,
secu
rity
can
be co
nsid
ered
oka
y
has s
tron
g Sm
art a
nd
Glo
be re
cept
ion,
no
Sun
signa
l
durin
g st
orm
qui
nta,
M
anho
y Br
idge
, the
ar
ea w
as fl
oode
d up
to
bel
ow k
nee
leve
l, D
ao M
unic
ipal
Bld
g.
Incl
uded
DO
ST re
gion
VI o
nce
visit
ed th
e ar
ea fo
r in
spec
tion
of se
nsor
de
ploy
men
t las
t Oct
o-be
r 201
2 ac
cord
ing
to
MD
RRM
O
Reco
mm
ende
d sit
e fo
r ins
talla
tion
2Ba
rnga
y Po
bla-
cion
Ilay
a, D
ao,
Cap
iz
flow
ing
wat
erre
siden
ts n
ear t
he b
ridge
; w
ater
leve
l is a
lmos
t at
the
sam
e le
vel a
s the
br
idge
: les
s tha
n 1
met
er
has s
tron
g Sm
art a
nd
Glo
be re
cept
ion,
no
Sun
signa
l
--th
ere
is a
brid
ge n
ear
thisd
site
appr
oxim
ate-
ly 8
00 m
dow
nstr
eam
(M
aayo
n Br
idge
)
Not
reco
mm
ende
d fo
r AW
LS in
stal
la-
tion
due
to v
ery
low
le
vel o
f the
brid
ge3
Bara
ngay
Bag
o G
rand
e, Ro
xas
City
no fl
owin
g w
ater
on
the
river
; riv
er is
al
mos
t dry
hous
es e
xist
s nea
r the
br
idge
has s
tron
g Sm
art a
nd
Glo
be re
cept
ion
wat
er d
oes n
ot ri
se
alon
g th
e ar
ea e
ven
in
the
rain
y se
ason
--N
ot re
com
men
ded
for A
WLS
inst
al-
latio
n du
e to
no
flow
ing
wat
er4
Bara
ngay
Mili
bili,
Ro
xas C
ityw
ater
is
alm
ost s
till
durin
g th
e tim
e of
in-
spec
tion
brid
ge is
isol
ated
to
near
by co
mm
unity
; ro
ad co
nnec
ted;
not
sure
ab
out s
ecur
ity
has s
tron
g Sm
art a
nd
Glo
be re
cept
ion
----
Not
reco
mm
end-
ed d
ue to
secu
rity
reas
ons
5Ba
rang
ay T
abuc
, Ila
ya, I
law
od
Pont
aved
ra
flow
ing
wat
erne
ar h
ouse
s and
est
ab-
lishm
ents
; sec
urity
oka
yha
s str
ong
Smar
t and
G
lobe
rece
ptio
n--
wid
e riv
er; n
ear t
o se
a,
dow
nstr
eam
flow
goe
s to
oth
er a
rea
rath
er
than
Pan
ay R
iver
Not
reco
mm
ende
d be
caus
e it
is ne
ar th
e m
outh
of t
he ri
ver
1Pa
nita
n Br
idge
, Pa
nay
flow
ing
wat
erne
ar h
ouse
s and
est
ab-
lishm
ents
; sec
urity
oka
yha
s str
ong
Smar
t and
G
lobe
rece
ptio
n--
--Re
com
men
ded
site
for i
nsta
llatio
n2
Sigm
a Br
idge
, C
apiz
flow
ing
wat
erne
ar h
ouse
s and
est
ab-
lishm
ents
; sec
urity
oka
yha
s str
ong
Smar
t and
G
lobe
rece
ptio
nkn
own
as th
e ar
ea th
at
is al
way
s floo
ded
--Re
com
men
ded
site
for i
nsta
llatio
n3
Mam
busa
o Br
idge
, Mam
-bu
sao
flow
ing
wat
erne
ar h
ouse
s and
est
ab-
lishm
ents
; sec
urity
oka
yha
s str
ong
Smar
t and
G
lobe
rece
ptio
nne
ar S
igm
a Br
idge
--an
alte
rnat
ive
area
fo
r Sig
ma
brid
ge
4M
aayo
n Br
idge
, M
aayo
n Cp
izflo
win
g w
ater
near
hou
ses a
nd e
stab
-lis
hmen
ts; s
ecur
ity o
kay
has s
tron
g Sm
art a
nd
Glo
be re
cept
ion,
no
Sun
signa
l
----
Reco
mm
ende
d sit
e fo
r ins
talla
tion

46
Panay River Basin Survey
4.4.2 Flow measurement
Flow measurement is necessary to compute the river discharge. The survey team conductedflowmeasurementssimultaneouslyonthebridgeswherethereareinstalledAWLS.The team gathered data for 2 to 3 hours and recorded every ten (10) minutes. Gathering of flowdataof the river at JamindanBridge,MaayonBridgeandSigmaBridgeare shown inFigure 43, 44 and 45 respectively.
Figure 43. Flow measurement along Jamindan Bridge, Municipality of Jamindan, Capiz
Figure 44. Flow measurement along Maayon Bridge, Brgy. Ma-Ayon, Poblacion Tabuc, Capiz

47
Panay River Basin Survey
Figure 45. Flow measurement along Sigma Bridge, Brgy. Poblacion Norte, Capiz
Another survey was performed for the cross-section of the installed AWLS on the bridges located in Panay River. The data gathering weas conducted on October 25 – 27, 2013forthefive(5)installedAWLSonthePanayRivernamely:PanitanandDaobridgesinthemainstream,SigmaandJamindanbridgesinthelefttributaries,andfinallyMaayonbridge in the right tributary. The control point at Jumbo Bridge was occupied as base for the surveying at Brgy. Punta Tabuc, Roxas City, Capiz. The following series of pictures shows the cross-sectionalviewandelevationinMSLofAWLSandwatersurfaceonspecificdateandtime.
Digrams of bridges located in the Panay mainstream are shown in Figure 46 and 47.

48
Panay River Basin Survey
Figure 46. AWLS in Panitan Bridge, Brgy. Agkilo, Panitan, Capiz

49
Panay River Basin Survey
Figure 47. AWLS in Dao Bridge, Barangay Manhoy, Dao, Capiz
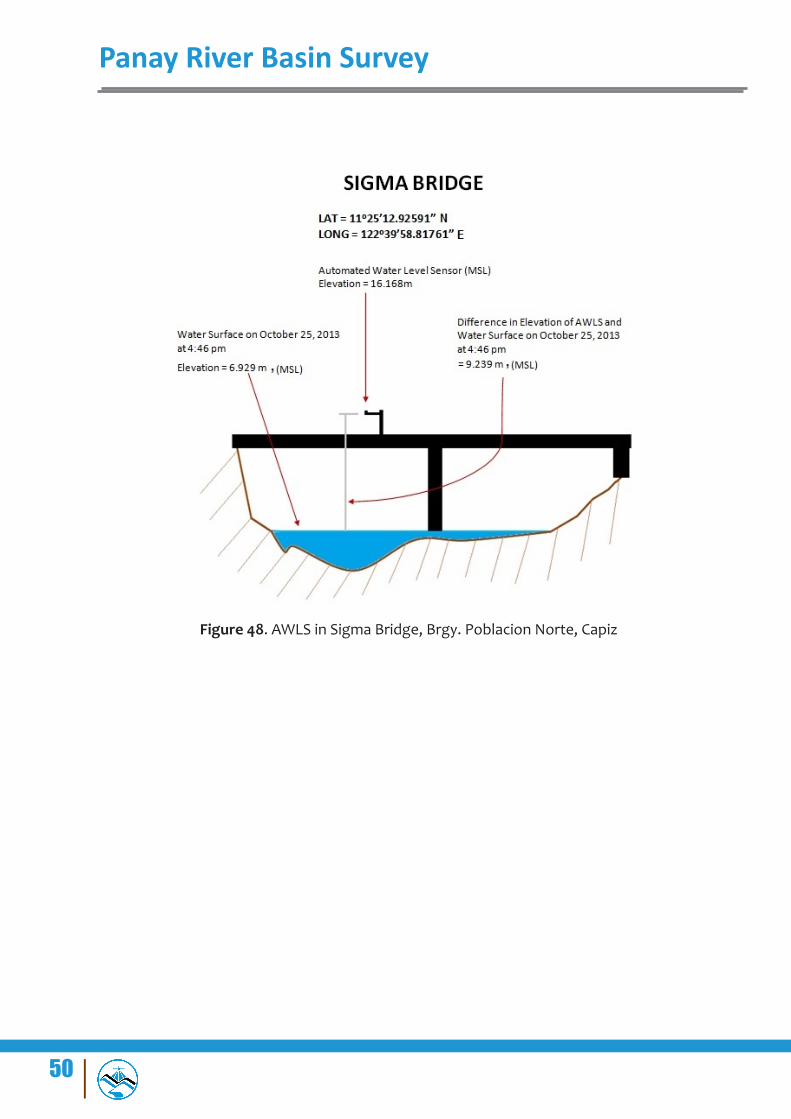
Diagrams of bridges located in the left tributary of the Panay river are illustrated in Figure 48 and 49
50
Panay River Basin Survey
Figure 48. AWLS in Sigma Bridge, Brgy. Poblacion Norte, Capiz

51
Panay River Basin Survey
Figure 49. AWLS in Jamindan Bridge, Municipality of Jamindan, Capiz
The diagram of Maayon Bridge located in the right tributary of the Panay river is displayed in Figure 50.

52
Panay River Basin Survey
Figure 50. AWLS in Maayon Bridge Brgy. Ma-Ayon, Poblacion Tabuc, Capiz

53
Panay River Basin Survey
4.5 Validation Points Acquisition Survey Validation Points Acquisition Survey was conducted on July 21-22, 2013. Data Validation Component was able to recover a horizontal control point, CPZ-20. This recovered control point was occupied as one of the bases for the road validation survey. Panay River validation survey was conducted to serve as accuracy check as well as validation for data acquired from LIDAR.
LiDAR validation set-up is shown in Figure 51 while Figure 52 shows the coverage of the LiDAR validation survey.
Figure 51. LiDAR Validation setup
Figure 52. LiDAR validation coverage for Panay River Basin
54
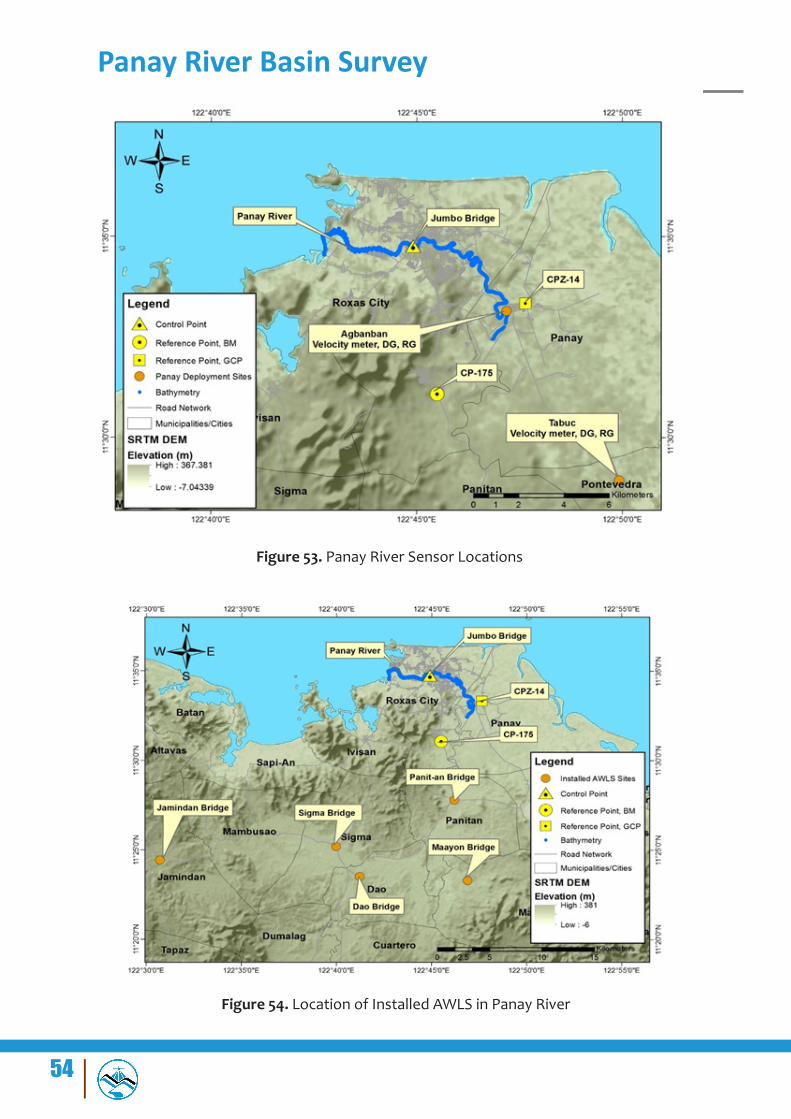
Figure 53. Panay River Sensor Locations
Figure 54. Location of Installed AWLS in Panay River
Panay River Basin Survey

55
Annexes
56
Annexes
ANNEX A. PROBLEMS ENCOUNTERED AND RESOLUTIONS APPLIED
The problems encountered by the team with respective solutions are summarized below:
Limitations/Problems SolutionsThe City Mayor and Provincial Governor is not available for
courtesy callReschedule the courtesy call
Some starting points of the cross-section are not
reachable due to thick vegetation primarily of Nipa.
Used a boat to reach the starting point
Nipa trees block the satellite signals for zigzag sweep
Used portable echo sounder to determine depth and GNSS RTK
mode to get the coordinates.Sensor site at Bato Grande is not possible because there is
noflow.
Find another sensor site, the team deployed the sensors in
Bgy. Agbanban.
The image in Figure 60 and Figure 61 shows the deployment of rain gauge and preparation of the velocity meter and depth gauge in Brgy. Poblacion, Compostela respectively. The cross section stage-discharge data computations of these sensors are shown in Figures 62-64.

57
Annexes
ANNEX B. LIST OF EQUIPMENT AND INSTRUMENTSType Brand Serial Number Owner Quantity
GPS Receiver (Base) Trimble™ SPS852 UP-TCAGP One (1) units
GPS Receiver (Rover)
Trimble™ SPS882 UP-TCAGP Three (3) units
GPS Controller Trimble™ TSC3 UP-TCAGP Three (3) unitsHigh-Gain An-
tenna UP- TCAGP Three (3) units
Single Beam Echosounder
with accessoriesOhmex 2969 UP-TCAGP One (1) unit
Coupler-2a and 2b UP- TCAGP One (1) unit each
Handheld GPS Garmin Oregon™ 550 UP-TCAGP Two (2) units
AA-Battery Char-ger Akari UP-TCAGP Two (2) units
Laptops Dell Laptop UP-TCAGP One (1) unitDell Laptop One (1) unit
Depth Gauge Onset Hobo wares UP-TCAGP One (1) unit
Rain Gauge 1293784 UP- TCAGP One (1) unitEchosounder Ohmex™ 2969 UP-TCAGP One (1) unitRange Pole Trimble™ UP-TCAGP Three (3) units
Tripod Trimble™ UP-TCAGP One (1) unitBipod Trimble™ UP-TCAGP Three (3) units
Tribrach UP-TCAGP One (1) unitLaser Range
Finder Bushnell UP-TCAGP One (1) unit
Toolbox UP-TCAGP One (1) unitQINSy dongle UP-TCAGP One (1) unit

58
Annexes
NNEX C. THE SURVEY TEAM
Data Validation Component
Sub-team Designation Name Agency/Affiliation
Survey Supervisor Senior Science Re-search Specialist
ENGR. BERNARD PAUL D. MARAMOT UP TCAGP
Bathymetric Survey Team
Senior Science Re-search Specialist
ENGR. DEXTER T. LOZANO UP TCAGP
Research Associate MARY GRACE S. JASON UP TCAGP
Profile Survey Team Research Associate MARK LESTER D. ROJAS UP TCAGP

59
Annexes
ANNEX D. NAMRIA CERTIFICATION

60
Annexes

61
Annexes
ANNEX E. RECONNAISSANCE SUMMARYCross-section ReconnaissanceRemarks Left Cross-
sectionRight Remarks
PASS-ABLE
nipa trees at the bank, rice field
1 nipa trees at the bank, private com-pound, open filed
PASS-ABLE
PASS-ABLE
nipa trees at the bank, vegetation, clump trees, open field
2 nipa trees at the bank, private com-pound, open filed
PASS-ABLE
PASS-ABLE
nipa trees at the bank, pri-vate property, open field
3 nipa trees and banana at the bank, open field
PASS-ABLE
PASS-ABLE
rice field 4 nipa trees at the bank, private prop-erty, open field
PASS-ABLE
PASS-ABLE
nipa trees at the bank, rice field
5 trees at the bank, private compound, rice field
PASS-ABLE

62
Annexes
Remarks Left Cross-
sec-tion
Right Re-marks
PASS-ABLE
nipa trees at the bank, rice field
6 nipa trees at the bank, private com-pound, rice field
PASS-ABLE
PASS-ABLE
nipa trees at the bank, rice field
7 vegetation at the bank, ricefield
PASS-ABLE
PASS-ABLE
nipa trees at the bank, private property, openfield
8 nipa trees at the bank, private property, openfield
PASS-ABLE
PASS-ABLE
nipa trees at the bank, rice field
9 nipa trees at the bank, private residence, barangay road
PASS-ABLE
PASS-ABLE
start point at bridge, road, cogon grass
10 start point at bridge, concrete road, rural bank of Panay
PASS-ABLE
PASS-ABLE
nipa trees at the bank, grasses
11 nipa trees at the bank, ricefield
PASS-ABLE
63
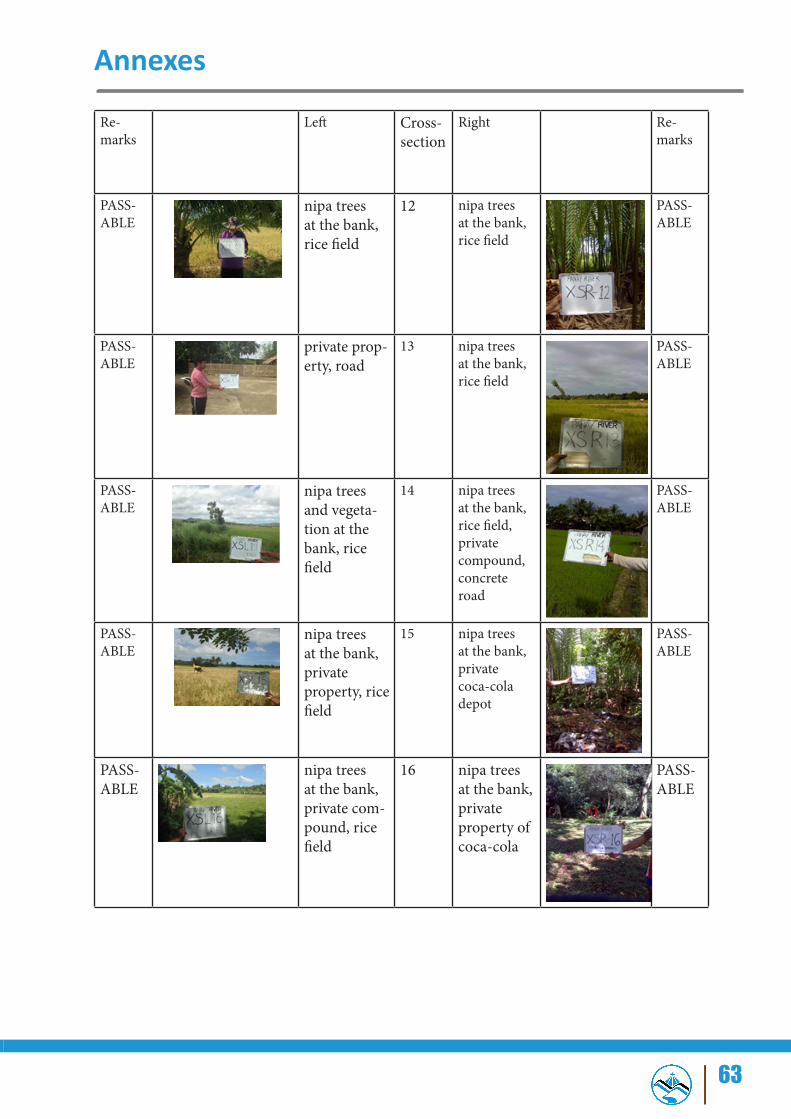
Annexes
Re-marks
Left Cross-section
Right Re-marks
PASS-ABLE
nipa trees at the bank, rice field
12 nipa trees at the bank, rice field
PASS-ABLE
PASS-ABLE
private prop-erty, road
13 nipa trees at the bank, rice field
PASS-ABLE
PASS-ABLE
nipa trees and vegeta-tion at the bank, rice field
14 nipa trees at the bank, rice field, private compound, concrete road
PASS-ABLE
PASS-ABLE
nipa trees at the bank, private property, rice field
15 nipa trees at the bank, private coca-cola depot
PASS-ABLE
PASS-ABLE
nipa trees at the bank, private com-pound, rice field
16 nipa trees at the bank, private property of coca-cola
PASS-ABLE
64
Annexes
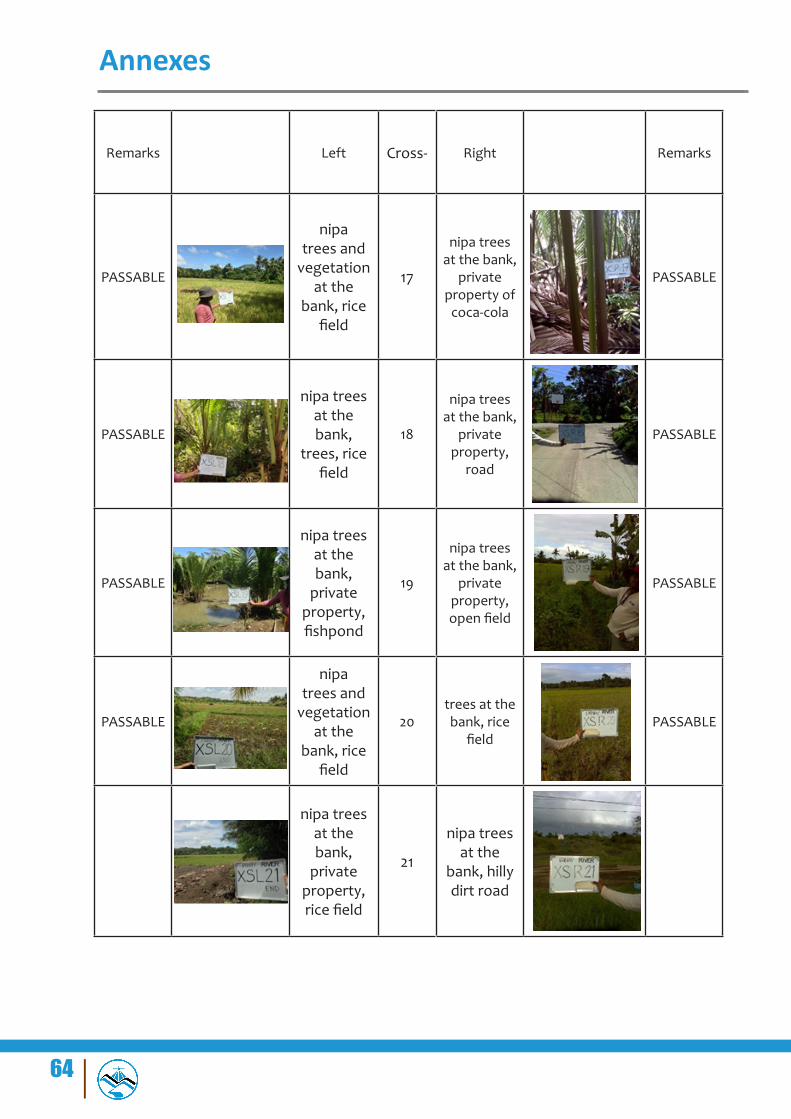
Remarks Left Cross- Right Remarks
PASSABLE
nipa trees and
vegetation at the
bank, rice field
17
nipa trees at the bank,
private property of
coca-cola
PASSABLE
PASSABLE
nipa trees at the bank,
trees, rice field
18
nipa trees at the bank,
private property,
road
PASSABLE
PASSABLE
nipa trees at the bank,
private property, fishpond
19
nipa trees at the bank,
private property, openfield
PASSABLE
PASSABLE
nipa trees and
vegetation at the
bank, rice field
20trees at the bank, rice field
PASSABLE
nipa trees at the bank,
private property, ricefield
21
nipa trees at the
bank, hilly dirt road

65
Annexes
Remarks Left Cross-sec-tion
Right Remarks
PASSABLE nipa trees at the bank reachable by boat, tall cogon
26 nipa trees at the bank, concrete road,
PASSABLE
PASSABLE fishpond,open space, con-crete road
27 nipa trees at the bank, fishpond
PASSABLE
PASSABLE private property, rough road
28 Fishpond and nipa trees at the bank, open field
PASSABLE
PASSABLE private property, concrete road
29 nipa trees at the bank, rough road
PASSABLE

66
Annexes
Remarks Left Cross-section
Right Remarks
PASSABLE starting point at the bridge, road
30 road PASSABLE
PASSABLE starting point at the bridge, concrete road
31 Starting point at the bridge, road, airport runway
Minor revisions are made, original cross section crosses the runway, reroute it to an adjacent road nearby
PASSABLE Starting point at the bridge, road
32 Starting point at the bridge, road, building
Divert it to the nearby road since it crosses buildings.
PASSABLE road 33 vegetation at the bank, private property, open space
67
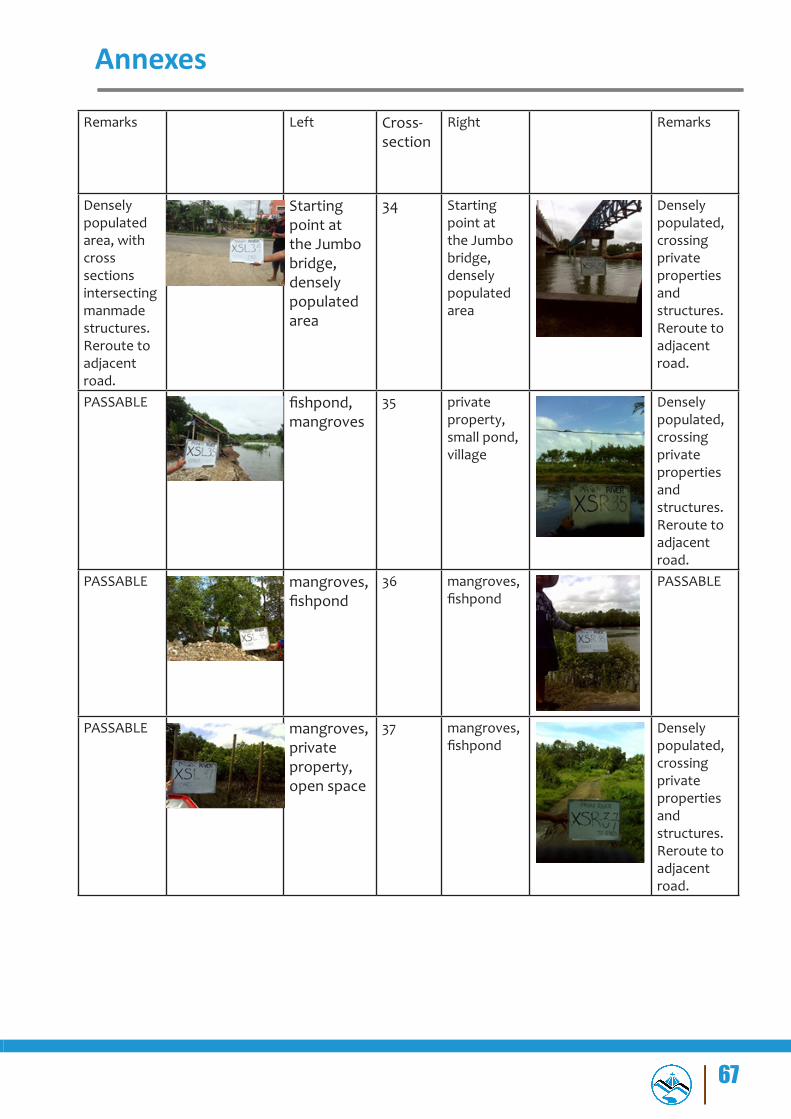
Annexes
Remarks Left Cross-section
Right Remarks
Densely populated area, with cross sections intersecting manmade structures. Reroute to adjacent road.
Starting point at the Jumbo bridge, densely populated area
34 Starting point at the Jumbo bridge, densely populated area
Densely populated, crossing private properties and structures. Reroute to adjacent road.
PASSABLE fishpond,mangroves
35 private property, small pond, village
Densely populated, crossing private properties and structures. Reroute to adjacent road.
PASSABLE mangroves, fishpond
36 mangroves, fishpond
PASSABLE
PASSABLE mangroves, private property, open space
37 mangroves, fishpond
Densely populated, crossing private properties and structures. Reroute to adjacent road.
68
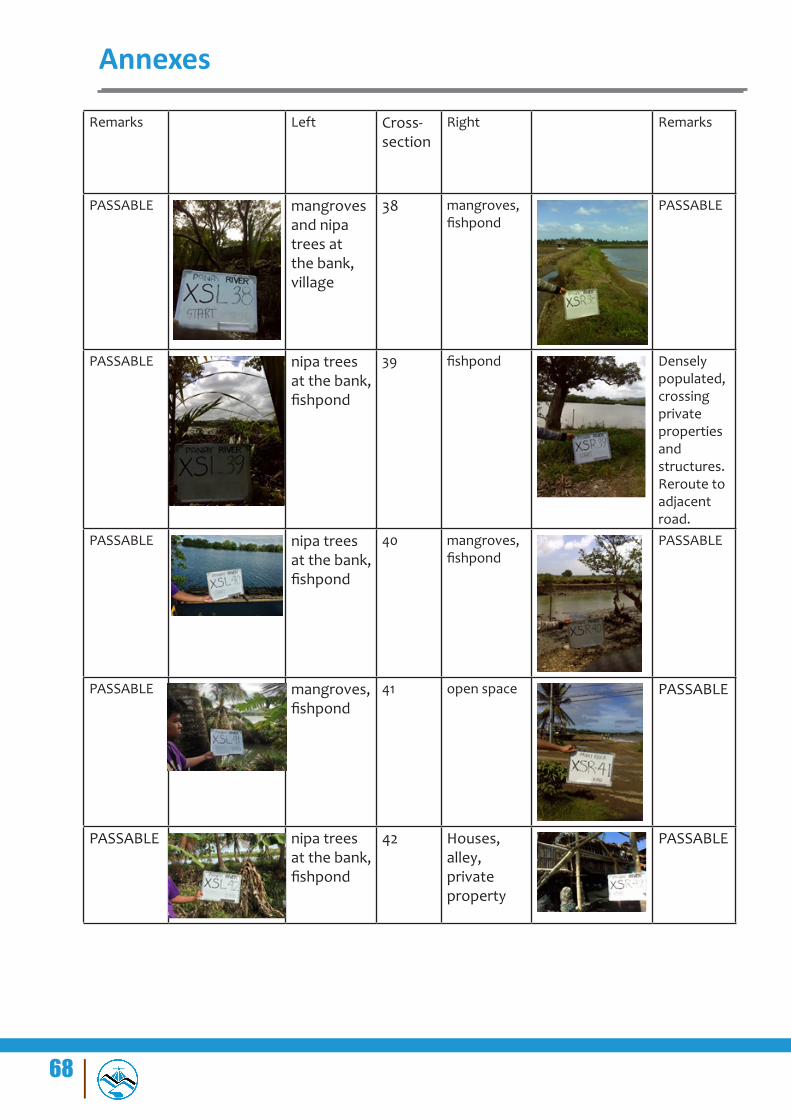
Annexes
Remarks Left Cross-section
Right Remarks
PASSABLE mangroves and nipa trees at the bank, village
38 mangroves, fishpond
PASSABLE
PASSABLE nipa trees at the bank, fishpond
39 fishpond Densely populated, crossing private properties and structures. Reroute to adjacent road.
PASSABLE nipa trees at the bank, fishpond
40 mangroves, fishpond
PASSABLE
PASSABLE mangroves, fishpond
41 open space PASSABLE
PASSABLE nipa trees at the bank, fishpond
42 Houses, alley, private property
PASSABLE

• Panay River Basin Integrated Development Project. (2012, October 11). Retrieved October 29, 2015, from https://niaregion6.wordpress.com/panay-river-basin-integrat-ed-development-project/
Bibliography


71
Copyright © 2022 FDOKUMEN