USING VARIOUS INFRARED TECHNIQUES FOR ...
14
© 2017 WIT Press, www.witpress.com ISSN: 2046-0546 (paper format), ISSN: 2046-0554 (online), http://www.witpress.com/journals DOI: 10.2495/CMEM-V5-N6-858-871 J. Sandak & A. Sandak, Int. J. Comp. Meth. and Exp. Meas., Vol. 5, No. 6 (2017) 858–871 USING VARIOUS INFRARED TECHNIQUES FOR ASSESSING TIMBER STRUCTURES JAKUB SANDAK & ANNA SANDAK CNR-IVALSA Trees and Timber Institute, San Michele All’Adige, Italy. ABSTRACT Infrared is a part of electromagnetic spectrum not visible for the human eye, but contain important information regarding material status. Several scientific methods have been developed during years to acquire, analyse and interpret the infrared radiation in active and passive way. The technology become especially interesting nowadays when infrared measuring instruments become portable and affordable, being reasonably accurate at the same time. This research summarizes some possibilities of implement- ing modern instruments available on the market but also presents prototype solutions developed for the research needs in the laboratory. Near- and mid-infrared spectroscopies as well as hyperspectral and thermal imaging in different configurations are briefly described with a special focus on the specific application in assessment of timber structures. Advantages for implementation but also limiting factors for each technology are listed and discussed. Keywords: hyperspectral imaging, infrared, non-destructive testing, spectroscopy, thermovision, timber structures assessment 1 INTRODUCTION 1.1 Infrared Infrared (IR) is a part of the electromagnetic spectrum not visible for the human eyes since its wavelength is too long to be perceived. It is located between visible light and microwaves and its range is divided into three regions; near (NIR), mid (MIR) and far (FIR) infrareds (Fig. 1). Infrared is linked to the heat as every material with a temperature above absolute zero (0°K) emits infrared radiation. The state-of-the-art sensors are capable for measure this energy (corresponding to the surface temperature) by measuring photons of wavelength in the range between 7 and 14 μm. 1.2 Physical and chemical phenomena of infrared interaction with matter The infrared light emitted to the object is interrelating with its surface in a complex manner. The transformation of the energy depends very strongly on the chemical and physical properties of the material. Constitutive molecules of the matter possessing dipole momentum absorb part of the infrared light energy. Thus, selected functional groups tend to vibrate absorbing light energy at specific parts of the spectra (wavelengths). Such absorbance is very selective and thanks to that it is possible to identify (and to quantify) all the functional groups of polymers involved. This phenomenon can be consequently used for the material characterization by means of the vibrational spectroscopy. On the other hand, the infrared interaction with the surface is also connected to the scatter – physical phenomenon related to the light reflection. Scatter is not directly linked to the chemical composition of molecules, but reveals other properties of material, such as density/porosity, roughness or micromorphology.
-
Upload
khangminh22 -
Category
Documents
-
view
0 -
download
0
Transcript of USING VARIOUS INFRARED TECHNIQUES FOR ...

© 2017 WIT Press, www.witpress.comISSN: 2046-0546 (paper format), ISSN: 2046-0554 (online), http://www.witpress.com/journalsDOI: 10.2495/CMEM-V5-N6-858-871
J. Sandak & A. Sandak, Int. J. Comp. Meth. and Exp. Meas., Vol. 5, No. 6 (2017) 858–871
USING VARIOUS INFRARED TECHNIQUES FOR ASSESSING TIMBER STRUCTURES
JAKUB SANDAK & ANNA SANDAKCNR-IVALSA Trees and Timber Institute, San Michele All’Adige, Italy.
ABSTRACTInfrared is a part of electromagnetic spectrum not visible for the human eye, but contain important information regarding material status. Several scientific methods have been developed during years to acquire, analyse and interpret the infrared radiation in active and passive way. The technology become especially interesting nowadays when infrared measuring instruments become portable and affordable, being reasonably accurate at the same time. This research summarizes some possibilities of implement-ing modern instruments available on the market but also presents prototype solutions developed for the research needs in the laboratory. Near- and mid-infrared spectroscopies as well as hyperspectral and thermal imaging in different configurations are briefly described with a special focus on the specific application in assessment of timber structures. Advantages for implementation but also limiting factors for each technology are listed and discussed.Keywords: hyperspectral imaging, infrared, non-destructive testing, spectroscopy, thermovision, timber structures assessment
1 INTRODUCTION
1.1 Infrared
Infrared (IR) is a part of the electromagnetic spectrum not visible for the human eyes since its wavelength is too long to be perceived. It is located between visible light and microwaves and its range is divided into three regions; near (NIR), mid (MIR) and far (FIR) infrareds (Fig. 1).
Infrared is linked to the heat as every material with a temperature above absolute zero (0°K) emits infrared radiation. The state-of-the-art sensors are capable for measure this energy (corresponding to the surface temperature) by measuring photons of wavelength in the range between 7 and 14 μm.
1.2 Physical and chemical phenomena of infrared interaction with matter
The infrared light emitted to the object is interrelating with its surface in a complex manner. The transformation of the energy depends very strongly on the chemical and physical properties of the material. Constitutive molecules of the matter possessing dipole momentum absorb part of the infrared light energy. Thus, selected functional groups tend to vibrate absorbing light energy at specific parts of the spectra (wavelengths). Such absorbance is very selective and thanks to that it is possible to identify (and to quantify) all the functional groups of polymers involved. This phenomenon can be consequently used for the material characterization by means of the vibrational spectroscopy. On the other hand, the infrared interaction with the surface is also connected to the scatter – physical phenomenon related to the light reflection. Scatter is not directly linked to the chemical composition of molecules, but reveals other properties of material, such as density/porosity, roughness or micromorphology.

J. Sandak & A. Sandak, Int. J. Comp. Meth. and Exp. Meas., Vol. 5, No. 6 (2017) 859
1.3 Instrumentation used for infrared measurements
Recent developments in the field of electronics, optics and metrological sciences allow broader access to some measurement routines up to now limited to few sophisticated applications. Reduction of the sensor cost and simplification of the calibration/operation procedure opened new application areas. For that reason, several types of relatively low-cost sensors can be used to detect the quantity and quality of infrared radiation. The thermal imaging and near infrared spectroscopy, as presented in this report, are perfect examples of that technological progress.
1.3.1 SpectrometersInfrared spectroscopy, in both near and mid ranges, is a technique with a great potential for determination of physical, chemical and mechanical properties of timber. These operate in the range from 4000 to 400 cm-1 (2500–25000 nm) in case of mid infrared and from 12000 to 4000 cm-1 (830–2500 nm) for near infrared. Both techniques are especially useful for quantification and identification of various organic compounds, due to their selective absorption of the infra-red radiation. Chemical functional groups possessing dipole momentum (e.g. -CH, -OH or –NH) are excited to vibration states. The infrared radiation absorbed/reflected from the surface can be used for assessment of the physicochemical properties of the surface. Some modern infrared instruments are equipped with a diffuse reflectance module or fibre optic probes, allowing spec-tral characterization of large objects without the need for transporting samples. Beside well-established laboratory equipment, spectroscopy might be particularly useful during on-site analysis of timber structures [1]. In this configuration there is no need for particular sample preparation or hazardous chemicals for solvation, making it quick and reliable for routine quan-titative and qualitative analysis. An example of the light and fully integrated near infrared spectrophotometer is presented in Figure 2. More details regarding implementation of the infrared spectroscopy toward wood assessment are described in literature [2].
1.3.2 Hyperspectral imaging camerasThe great advantage of hyperspectral imaging systems is the opportunity to acquire spatially resolved spectra. It may be especially useful for assessing areas with wood defects, such as
Figure 1: Position of infrared radiation in electromagnetic spectrum.

860 J. Sandak & A. Sandak, Int. J. Comp. Meth. and Exp. Meas., Vol. 5, No. 6 (2017)
knots, compression wood, for mapping moisture distribution, or for determination of the sap/heart wood boundaries. An interesting alternative to deal with a variability of the measured property over the sample surface is to implement NIR hyperspectral imaging. An array of spatially distributed spectra is obtained as a result and the high number of independent data may be averaged to better represent the surface state and property variation.
1.3.3 ThermocameraThermal imaging cameras detect radiation in the far infrared range and produce map of that radiation distribution (thermograms). The major thermal properties of wood possibly determined within thermographic inspection are: specific heat, thermal conductivity and the thermal diffusivity. It allows detection of material defects, thermal voids, moisture spots among the others. The specific heat of wood is independent of both wood species and density, but varies with moisture content. The thermal conductivity varies with the direction of heat flow with respect to the grain, with density, with defects and moisture content. Thermal diffusivity describes how quickly a material reacts to a change in temperature. It is very useful, as normal wood and most of wood defects are differing due to thermal diffusivity [3].
Two approaches can be distinguished in thermographic inspection:
• passive, in which the features of interest are naturally at a higher or lower temperature than the background
• active, in which an energy source is required to produce a thermal contrast between the feature of interest and the background [3]
Figure 3 presents an accessory of the modern smartphone allowing thermal imaging of var-ious objects. The same camera can be easily used for both passive and active thermovision. In the second case, the infrared emitting electric bulbs may serve as external heat emitters (Fig. 3c).
A brief summary of the infrared techniques suitable for implementation toward timber structures assessment is presented in Table 1. All the presented methods can be considered as supplementary, and can be implemented separately or together. It is important to stress that at the current stage of the development none of these technologies can provide ultimate and autonomous conclusions from the test. For that reason, an expert person, properly trained in the interpretation of infrared assessed results is indispensable. On the other hand, infrared
Figure 2: Miniaturized near infrared spectrometer with integrated light sources and signal processing unit (a) usable for assessing wood properties at construction site (b) or in-field (c).

J. Sandak & A. Sandak, Int. J. Comp. Meth. and Exp. Meas., Vol. 5, No. 6 (2017) 861
Figure 3: New generation low cost thermocamera as an accessory of the smartphone (a); and its use for detecting collapse zones in mechanical tests (b); as well as assessing wood defects in timber structures (c).
Table 1: Summary of limitations, advantages and application fields for diverse measurement infrared-based techniques.
Spectroscopy Hyperspectral imaging Thermal imaging
App
licat
ions
- chemical compositions - physical and anatomical
characterization- mechanical properties - monitoring of wood degra-
dation: decay, weathering, waterlogging
- chemical compositions- physical and anatomi-
cal characterization- mechanical properties- mapping of wood
- moisture- decay- weathering- waterlogging
- detection of hidden struc-tures, connectors and construction failures
- detection of superficial defects
- detection of delamination- detection of decay- moisture mapping- monitoring of building
drying
Adv
anta
ges
- no need special sample prepa-ration
- nondestructive and fast mea-surement
- determination of many com-ponents at once
- direct measurement with very low cost
- portable instruments suitable for on-site measurements
- no need special sample preparation
- nondestructive and fast measurement
- spatially resolved spectra
- portable instruments suitable for on-site measurements
- no need special sample preparation
- nondestructive and fast measurement
- low cost
Lim
itatio
ns
- needs sophisticated statistics methods for data analysis
- overlapping of spectral peaks- local data depending on
sampling
- relative high cost of equipment
- direct illumination of the surface may heat the sample surface
- limited resolution
- measurement related to the surface
- superficial discontinuities deviate heat propagation
- active method limited to cases where the element can be closely heated.

862 J. Sandak & A. Sandak, Int. J. Comp. Meth. and Exp. Meas., Vol. 5, No. 6 (2017)
derived information is highly useful to improve the overall structure characterization and to support the surveyor in a proper decision making.
2 CASE STUDIESThe following series of experiments conducted by authors has been selected for demonstration of infrared usability in different application fields with a special focus on assessment of timber structures and/or wood properties. Most of the examples provided should be considered as a laboratory-based proof of concept rather than matured industrial systems. However, it is expected that similar solutions will become available for in-field application in a close future.
2.1 Detection of wood defects in timber members
A cautious inventory of each timber member, including presence of wood defects affecting its mechanical performance is essential for reliable timber structure assessment. It is very common that the surface of wood changes its appearance along the service life due to ageing, weathering, microorganisms’ growth or simple dirt. On the other hand, several wood defects have not significant colour difference as related to the normal wood. Instead, its thermal properties may vary over the member surface allowing identification of abnormalities, used later for quantification of the material deficiency. An alternative methodology for assisting experts during timber structure analysis highlighting differences in the thermal conductivity would be therefore of a great interest. Active thermography was recognised here as a promising technology.
2.1.1 GoalThe objective of this experiment was to test usability of thermography in detection, localization and interpretation of wood defects present on the wooden beam surface, but not visible for a naked eye.
2.1.2 Infrared sensor usedThermocamera accessory for a smartphone FLIR ONE (FLIR Systems, Inc.), as shown in Figure 3a, was used for acquisition of thermal images. The range of the scene temperatures is between -20°C and 120°C. The camera is equipped with Lepton sensor chip, that has a spatial resolution of 80x60 pixels, made from 17-micron vanadium oxide bars, suspended on silicon supports above the chip surface. Vanadium oxide bars change resistance when heated, and turns into digital image data at 14 bits/pixel with a scanning frequency of 8 frames/second. The system has a resolution of 0.05°C (50 mK).
2.1.3 Measurement methodologyThe measurement approach used here based on the active thermography, where external heat source (infrared emitting electrical bulbs) was used to warm up the analysed surface. The experiment configuration was extremely simple as a single operator was acquiring thermal images and warmed up the zone of interest on the investigated wooden beam (Fig. 3c). Part of the experimental beam was coated with a thin layer of acrylic paint in order to cover the natural colour of wood and obscure wood defects (Fig. 4).
2.1.4 ResultsThe result of the measurement was a series of pictures presenting change of the surface temperature after exposing to infrared radiation. An example of thermal images obtained is

J. Sandak & A. Sandak, Int. J. Comp. Meth. and Exp. Meas., Vol. 5, No. 6 (2017) 863
presented in Figure 4, where pixel colours highlighted presence of wood deficiencies. The system performance was correct on both natural and coated wood areas, indicating measurement independency on the surface colour. It has to be mentioned that the measurement system at this stage of development is not capable of automatic defect classification, but it clearly assists an expert in detecting/localizing defects such as knots, cracks or biological decay.
2.2 Determination of the failure area in compression test
The mechanical resistance of the material is a fundamental property of any member within the erected structure. The methodologies for experimental and numerical determination of the strength are well established and standardized. Even that, the possibility for identification of the failure places within wood samples is extremely difficult due to material anisotropy and heterogeneity. It would be of interest therefore to develop a tool allowing early detection of the failure location, possibly with simple and low cost measurement approach. Passive ther-mography was identified here as a possible methodology for mechanical testing advancement.
2.2.1 GoalThe aim of this experiment was to test usability of thermography in detection, localization and interpretation of the material failure (crack formation) during a standard compression test.
2.2.2 Infrared sensor usedThe sensor used in this experiment was the same thermocamera as described in chapter 2.1.2. The camera was placed on the tripod in order to minimize image vibrations and fix the distance to the sample, as shown in Figure 3b.
2.2.3 Measurement methodologyThe measurement approach used here based on the passive thermography, where the temperature variations on the investigated surface are related to the material/ambient itself, without any
Figure 4: Active thermography as a tool for detection of obscured wood defects not visible by human eye.

864 J. Sandak & A. Sandak, Int. J. Comp. Meth. and Exp. Meas., Vol. 5, No. 6 (2017)
forced infrared irradiation. The increase of the temperature is related therefore to the energetic effects of the deformations in the samples due to excessive stresses applied. The test imple-mented here was semi-static, and the whole duration of the compression from the initial stress to the material collapse was ~15 seconds.
2.2.4 ResultsA series of the wood sample’s thermal images collected during compression test are presented in Figure 5. The standard size block (20x20x50 mm3) was compressed in the mechanical testing machine along the fibre direction, and first signs of the temperature raise were evident already after 5 seconds. The elevated temperature appeared exactly in the zone when the further crack/failure was developed. An evident sign of the collapsed fibres was noticed in seventh second of the test. Afterward, the surface temperature consequently increased as well as the fibre collapse zone expanded.
2.3 Monitoring of mechanical stresses in tension test (mid infrared spectroscopy)
Mechanical stress as well as forces are fundamental physical phenomena that are not directly measurable. It is only possible to asses an effect of the force action, such as defor-mation or velocity. However, every material resists against stresses preventing the structure to collapse. The physical–chemical mechanisms behind this material property are very complex and can be described at different material scales. Infrared (vibrational) spectros-copy is a technique measuring material properties on the molecular (functional groups) level. It would be therefore of a greatest interest to better understand reaction of the woody polymers to mechanical stresses and to identify mechanism of the resistance at the molec-ular level.
2.3.1 GoalThe aim of this experiment was to test usability of mid infrared spectroscopy for detection and interpretation of the material response to the mechanical stresses. The tension of wood in the elastic and plastic ranges is investigated here.
Figure 5: Passive thermovision used for detection of the wood failure zone in compression test.

J. Sandak & A. Sandak, Int. J. Comp. Meth. and Exp. Meas., Vol. 5, No. 6 (2017) 865
2.3.2 Infrared sensor usedThe instrument used for acquiring spectra during tension test was Fourier transform attenuated total reflectance mid infrared (FT-ATR-MIR) spectrophotometer Alpha-E produced by Bruker Optics GmbH. The spectral range was from 4000 cm-1 to 600 cm-1 (2500 to 16666 nm) with a spectral resolution of 4 cm-1. Averaging of 50 successive measurements is recommended to maximize signal-to-noise ratio.
2.3.3 Measurement methodologyLarch (Larix sp.) wooden blocks 10x10x340 mm3 were used as experimental samples. The wood density was 450 kg/m3 and moisture content was 9%. The sample was installed in the laboratory mechanical testing machine in tension configuration, as shown in Figure 6a. The tension force changed from 0 N to 5750 N (the limit of the load cell) with a step of 250 N.
According to the principle of FT-ATR-MIR measurement, the sample has to be in a close contact with the crystal surface during the spectra acquisition. It was possible therefore to measure the spectra from the same area of the sample during the whole test, minimizing variation of data due to wood anisotropy and/or heterogeneity.
Figure 6: Monitoring of the mechanical stresses with mid infrared spectroscopy: experimental setup (a); raw spectra acquired during the tension test (b); identification of the changes to the IR spectra due to presence of mechanical stresses (c); and PLS prediction model of the mechanical stress on the base of IR spectra (d).

866 J. Sandak & A. Sandak, Int. J. Comp. Meth. and Exp. Meas., Vol. 5, No. 6 (2017)
2.3.4 ResultsFT-MIR-ATR spectra of the wooden sample under tension test changed along the progress of the experiment (Fig. 6b). However, the change was appearing to be different as noticed in diverse functional groups within the infrared fingerprint region, as shown in Figure 6c. The peak shift (), increase/decrease () or even appearance of a new peak () on the spectra, was observed. It was also possible to develop a chemometric model for predicting the mechanical stress level on the base of the spectra, as presented in Figure 6d.
2.4 Automatic discrimination of wood features for measuring and chemical mapping
Information included in the infrared spectrum, even if not directly interpretable, is highly useful for analysis of the chemical-physical properties of materials. The limitation of spectroscopy when applied on wood is that one spectra corresponds to a very limited area of the sample and therefore it is not fully representative. A solution can be repetition of infrared measurements in various places along the investigated surface. It is time consuming and still does not guarantee that the whole variability is represented in the data set. Alternative approach is to use novel hyperspectral imaging systems capable of surface pictures acquisition at different wavelengths. A state-of-the-art instruments allow measurement in very wide spectral range including also infrared.
2.4.1 GoalThe objective of this experiment was to test usability of the near infrared hyperspectral imaging camera for automatic detection and classification of wood features by means of near infrared spectra and suitable chemometric techniques.
2.4.2 Infrared sensor usedA prototype BurgerMetrics HyperPro 2.2 VNIR hyperspectral camera was used at the laboratory of CNR-IVALSA for scanning wood samples. The extended InGaAs sensor array resolution was 320x256 pixels, corresponding to the spatial resolution of 175 μm/pixel. The spectral range of spectrograph was from 950 to 1650 nm, with 256 wavelength channels, correspond-ing to the spectral resolution of ~3.5 nm. Tungsten halogen light sources were used as the illumination.
2.4.3 Measurement methodologyA pushbroom linescan camera system was employed with the linear translation stage adopted for moving samples under the camera. Ten images were acquired at each linescan step and were averaged to improve the signal-to-noise ratio. Diverse configurations of samples were tested in order to determine technical limits of the hyperspectral system. Only single piece of wood containing different chemical features was selected in this report to illustrate prospective of this technology.
2.4.4 ResultsThe RGB colour image of the experimental block is presented in Figure 7a. The following analysis of the hyperspectral images allowed classification of each pixel on the image to one of classes. The grey images in Figure 7a correspond to the class probability, with a higher intensity of pixel indicating high probability.

J. Sandak & A. Sandak, Int. J. Comp. Meth. and Exp. Meas., Vol. 5, No. 6 (2017) 867
2.5 Assisting expert to the in-field timber structure assessment with near infrared spectroscopy
The above mentioned case studies (chapters 2.1 to 2.4) demonstrate various application fields for infrared technology when applied for timber structures assessment. However, most of these are developed to the laboratory stage level or only preliminary in-field tests were performed so far. On the other hand, near infrared spectroscopy is a matured technology, implemented with a great success in several industries, such as agriculture, food or pharmaceutical. The number of researchers, publications and scientific projects related to trees/wood and near infrared is increasing year by year, what indicates great interest of the wood community in infrared tech-nology. The following chapter is a trial for a very brief summary of some successful studies when near infrared was effectively used for determination of the certain wood properties.
2.5.1 GoalThe goal of this chapter is to briefly summarize the state of near infrared spectroscopy develop-ment providing evidences of successful assessment of selected properties considered important during in-field survey of timber structures. In the time of increasing environmental concise-ness of the modern society, near infrared spectroscopy may be also perfectly suitable for the waste residues sorting at the end of the building service life.
2.5.2 Sensors suitable for near infrared spectra acquisition in-fieldSeveral sensors available on the market are suitable for acquisition of the near infrared spectra on timber. It is important however to take in to consideration specific requirements, case
Figure 7: Discriminant analysis of NIR hyperspectral images and identification of different wood features on the base of spectra (a); and classification map of different clusters (b).
868 J. Sandak & A. Sandak, Int. J. Comp. Meth. and Exp. Meas., Vol. 5, No. 6 (2017)
dependant, such as place of measurement, sample form and expected accuracy. Some more details on the sensor selection can be found in the literature [2].
2.5.3 Measurement methodologyThe proper near infrared spectra acquisition is critical for any further processing of that data. The measurement procedure has to be developed case by case, considering particular details of the sample, environment or sensing technology selected.
In most circumstances just a raw spectrum is not enough for the proper evaluation, and post processing of signals is required to derive meaningful information. Several chemometric methods and dedicated software tools are available for near infrared spectroscopy allowing qualitative and quantitative evaluation of spectra. Anyhow, preparation of numerical models is necessary, where high number of reference replicas is of a great advantage.
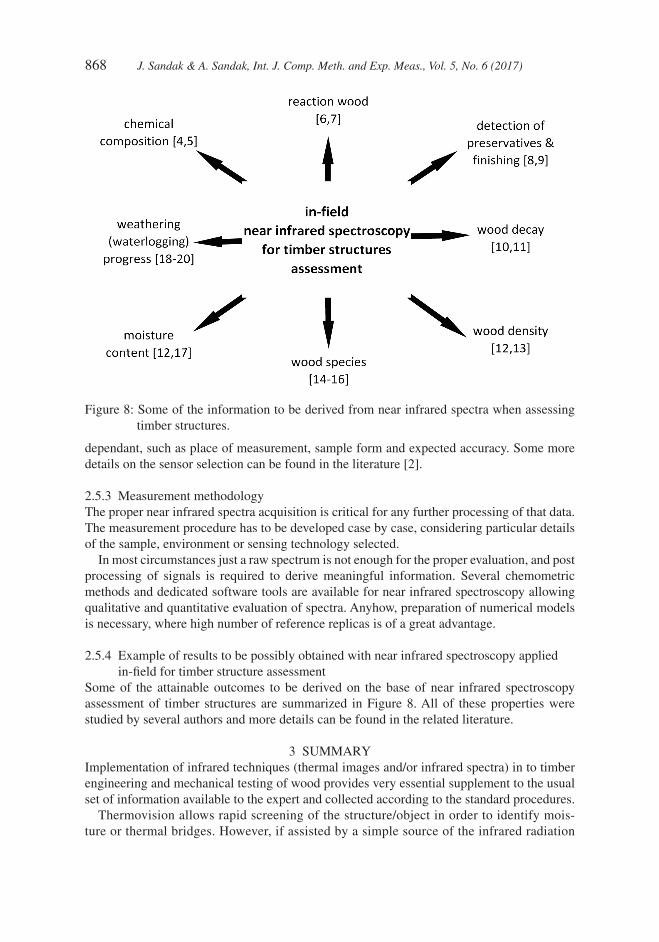
2.5.4 Example of results to be possibly obtained with near infrared spectroscopy applied in-field for timber structure assessment
Some of the attainable outcomes to be derived on the base of near infrared spectroscopy assessment of timber structures are summarized in Figure 8. All of these properties were studied by several authors and more details can be found in the related literature.
3 SUMMARYImplementation of infrared techniques (thermal images and/or infrared spectra) in to timber engineering and mechanical testing of wood provides very essential supplement to the usual set of information available to the expert and collected according to the standard procedures.
Thermovision allows rapid screening of the structure/object in order to identify mois-ture or thermal bridges. However, if assisted by a simple source of the infrared radiation
Figure 8: Some of the information to be derived from near infrared spectra when assessing timber structures.
J. Sandak & A. Sandak, Int. J. Comp. Meth. and Exp. Meas., Vol. 5, No. 6 (2017) 869
it can become active thermovision suitable for detecting any abnormalities of wood appearing on its surface.
Both, near and mid infrared spectroscopies can be used for qualitative and quantitative measurements of diverse material characteristics. If properly implemented it can also serve as an indicator of mechanical stresses applied to the wood member.
Integration of hyperspectral imaging, combined with other emerging technologies (such as drones) opens completely new possibilities for diagnosing and surveying timber structures. The of-the-shelf solutions are not available yet (or too much costly) but it is expected that in a short time all of these will become more accessible.
Possibility for quantification of the decay/weathering/waterlogging progress is an important advantage, even if sufficiently large reference data set is indispensable for generation of reliable chemometric models.
A simple and accurate method for detection of preservatives is of great interest for all recycling industries. It seems that near infrared spectroscopy can be successfully implemented in this task.
Continuous development of the ‘infrared industry’ provides novel sensory solutions of refined accuracies and minimized costs. The challenge is to properly identify suitable application fields and to let the technology be accepted by practitioners. Anyway, it is crystal clear that infrared extends the human perception into something we cannot see – until now.
ACKNOWLEDGMENTSPart of the work was conducted during BIO4ever project (RBSI14Y7Y4) funded within a call SIR by MIUR.
REFERENCES [1] Sandak, A., Sandak, J. & Riggio, M., Estimation of physical and mechanical properties of
timber members in service by means of infrared spectroscopy. Construction and Building Materials, 101(2), pp. 1197–1205, 2015.https://doi.org/10.1016/j.conbuildmat.2015.06.063
[2] Sandak, A., Sandak, J. & Meder, R., Assessing trees, wood and derived products with near infrared spectroscopy: hints and tips. Journal of Near Infrared Spectroscopy, 24(6), pp. 485–505, 2016.https://doi.org/10.1255/jnirs.1255
[3] Bocur, V., Nondestructive Characterization and Imaging of Wood, Springer-Verlag: Berlin Heidelberg, pp. 75–123, 2003.https://doi.org/ 10.1007/978-3-662-08986-6_3
[4] Via, B.K., Zhou C., Acquah, G., Jiang W. & Eckhardt, L., Near infrared spectroscopy calibration for wood chemistry: Which chemometric technique is best for prediction and interpretation? Sensors, 14, pp. 13532–13547, 2014.https://doi.org/10.3390/s140813532
[5] Kelley, S.S., Rials, T.G., Snell, R., Groom, L.H. & Sluiter, A., Use of near infrared spectroscopy to measure the chemical and mechanical properties of solid wood. Wood Science and Technology, 38(4), pp 257–276, 2004.https://doi.org/10.1007/s00226-003-0213-5
[6] McLean, J.P., Jin, G., Brennan, M., Nieuwoudt, M.K. & Harris, P.J., Using NIR and ATR-FTIR spectroscopy to rapidly detect compression wood in Pinus radiata. Canadian Journal of Forest Research, 44(7), pp. 820–830, 2014.https://doi.org/10.1139/cjfr-2013-0329

870 J. Sandak & A. Sandak, Int. J. Comp. Meth. and Exp. Meas., Vol. 5, No. 6 (2017)
[7] Meder, R. & Meglen, R.R., Near infrared spectroscopic and hyperspectral imaging of compression wood in Pinus radiata D. Don. Journal of Near Infrared Spectroscopy, 20(5), pp. 583–589, 2012.https://doi.org/10.1255/jnirs.1001
[8] Mauruschat, D., Plinke, B., Aderhold, J., Gunschera, J., Meinlschmidt, P. & Salthammer, T., Application of near-infrared spectroscopy for the fast detection and sorting of wood–plastic composites and waste wood treated with wood preservatives. Wood Science and Technology, 50(2), pp. 313–331, 2016.https://doi.org/10.1255/jnirs.1001
[9] Sandak, A., Rozanska, A., Sandak, J. & Riggio, M. Near infrared spectroscopic studies on coatings of 19th century wooden parquets from manor houses in South-Eastern Poland. Journal of Cultural Heritage, 16(4), pp. 508–517, 2015.https://doi.org/10.1016/j.culher.2014.09.009
[10] Fackler, K., & Schwanninger, M., How spectroscopy and microspectroscopy of degraded wood contribute to understand fungal wood decay. Applied Microbiology and Biotechnology, 96(3), pp. 587–599, 2012.https://doi.org/10.1007/s00253-012-4369-5
[11] Sandak A., Ferrari, S., Sandak, J., Allegretti, O., Terziev, N. & Riggio, M., Monitoring of wood decay by near infrared spectroscopy. Advanced Material Research, 778, pp. 802–809, 2013.https://doi.org/10.4028/www.scientific.net/AMR.778.802
[12] Leblon, B., Adedipe, O., Hans, G., Haddadi, A., Tsuchikawa, S., Burger, J., Stirling, R., Pirouz, Z., Groves, K., Nader, J. & LaRocque. A., A review of near-infrared spectroscopy for monitoring moisture content and density of solid wood. The Forestry Chronicle. 89(5), pp. 595–606, 2013.https://doi.org/10.5558/tfc2013-111
[13] Sandak, A., Sandak, J. & Riggio, M., Estimation of physical and mechanical properties of timber members in service by means of infrared spectroscopy. Construction and Building Materials, 101(2), pp. 1197–1205, 2015.https://doi.org/10.1016/j.conbuildmat.2015.06.063
[14] Lazarescu, C., Hart, F., Pirouz, Z., Panagiotidis, K., Mansfield, S.D., Barrett, J.D. & Avramidis, S., Wood species identification by near-infrared spectroscopy. International Wood Products Journal, 8(1), pp. 32–35, 2017.https://doi.org/10.1080/20426445.2016.1242270
[15] Brunner, M., Eugster, R., Trenka, E. & Bergamin-Strotz, L., FT-NIR Spectroscopy and Wood Identification. Holozforshung, 50(2), pp. 130–134, 1996.https://doi.org/10.1515/hfsg.1996.50.2.130
[16] Sandak, A., Sandak, J. & Riggio, M., Non destructive characterization of wooden members using near infrared spectroscopy. Advanced Materials Research, 778, pp. 328–334, 2013. https://doi.org/10.4028/www.scientific.net/AMR.778.328
[17] Dahlbacka J. & Lillhonga, T., Moisture measurement in timber utilising a multi-layer partial least squares calibration approach Journal of Near Infrared Spectroscopy. 18(6), pp. 425–433, 2010.https://doi.org/10.1255/jnirs.906
[18] Zanetti, M., Rials, T. & Rammer, D., NIR-monitoring of in-service wood structures, Proceedings of Structures Congress. American Society of Civil Engineers, pp. 10. 2005.

J. Sandak & A. Sandak, Int. J. Comp. Meth. and Exp. Meas., Vol. 5, No. 6 (2017) 871
[19] Sandak, A., Sandak, J., Burud, I. & Gobakken, L.R., Weathering Kinetics of Thin Wood Veneers Assessed with near Infrared Spectroscopy. Journal of Near Infrared Spectroscopy, 24(6), pp. 549–553, 2016.https://doi.org/10.1255/jnirs.1230
[20] Sandak, J., Sandak, A. & Riggio, M., Characterization and monitoring of surface weathering on exposed timber structures with a multi-sensor approach. International Journal of Archi-tectural Heritage, 9(6), pp. 674–688, 2015.https://doi.org/ 10.1080/15583058.2015.1041190