Review of the various analytical techniques and algorithms for detection and quantification of TATP
10
Review of the Various Analytical Techniques and Algorithms for Detection and Quantification of TATP Leonardo Pacheco-Londoño 1 , Oliva M Primera 1 , Michael Ramírez 2 , Orlando Ruiz 2 , and Samuel Hernandez-Rivera *, 1 1 Center for Chemical Sensors Development / Chemical Imaging Center MURI – DoD – UPRM Department of Chemistry, University of Puerto Rico-Mayagüez PO Box 9019, Mayagüez, PR 00681 2 Hewlett Packard, Aguadilla, Puerto Rico ABSTRACT The objective of this research is to design and develop a multi-sensor capable of fast detection and of recognition optimization of the techniques for used for quantification of TATP by Pattern Recognition. In particular, the long range goal of the research is to use sensor fusion and sensor “talking” modalities to couple Stand Off detectors with Chemical Point detectors for detection of airborne chemical agents and detection of Improvised Explosive Devices (IEDs). Vibrational spectroscopy techniques are very fast and can be used for real time detection. Good results have been obtained with various target molecular (chemical) systems such as TATP, TNT and DNT. Samples of TATP were detected and quantified in air, in solution and in solid phase on surfaces by different techniques. FTIR Spectroscopy and GS-MS were used to generate new analytical procedures for detection and analysis of the organic peroxide. These procedures were compared and taken to their limits by optimization with Chemometrics, Partial Least Squares (PLS), and Discriminant Analysis (DA). Keywords: TATP, Chemometrics, PLS, DA. 1. INTRODUCTION Triacetone Triproxide (TATP) is an organic peroxide that has a relatively high detonation power. The amount of gaseous products evolved (CO 2 , CO, H 2 O) per mole of peroxide is low compared to RDX or PETN. Peroxides are very hazardous, however, because of the extreme sensitivity of certain types to shock, spark, and other forms of accidental ignition. 1 TATP can be chemically destroyed by adding of SnCl 2 -2H 2 O dissolved in methylated spirit or in benzene at 100°C in the presence of aqueous H 2 SO 4 . 2 Thermal destruction o TATP is achieved by heating under in toluene reflux during 280 h. 2, 3 TATP is also degraded by light, molecular oxygen as degradation product can be produced. Measurement of evolved oxygen of this is reaction can be achieved with reaction with colored compound product and this can be quantified by UV-VIS absortion. 4 Also, irradiation of TATP solution of at 254 nm produces hydrogen peroxide which can be quantified by reaction with hydrogen peroxide peroxidase and 2, 2,-A-azo-bis (3- thylbenzothiazoline)-6-sulfonate by UV-VIS spectrophotometry. 5 This method can also be implemented for gas analysis of TATP in air. Flow of TATP in air can be sampled in acetonitrile solution and irradiated with UV light at 254 nm and detected by method described before or by HPLC analysis. 6,7 TATP also can be detected directly by LC/MS and HPLC/MS. Studies have shown that LC/MS is a suitable technique for the identification and quantification of TATP, with detection limits in the low nanogram per 100 ml range. 8 Other studies based on HPLC- APCI-MS(/MS) method have detected hexamethylenetriperoxidediamine (HMTD) and triacetone triperoxide. TATP molecular ion [TATP-H] + has been observed in an HPLC-MS/MS analysis. The limit of detection TATP was 3.3 ng on column by HPLC-APCI-MS and 0.8 ng by HPLC-APCI-MS/MS. 9 The cyclic triperoxide was analyzed by ion ∗ Author for correspondence: [email protected] , [email protected] Sensors, and C3I Technologies for Homeland Security and Homeland Defense IV, edited by Edward M. Carapezza, Proceedings of SPIE Vol. 5778 (SPIE, Bellingham, WA, 2005) · 0277-786X/05/$15 · doi: 10.1117/12.603073 317
-
Upload
independent -
Category
Documents
-
view
2 -
download
0
Transcript of Review of the various analytical techniques and algorithms for detection and quantification of TATP
Review of the Various Analytical Techniques and Algorithms for Detection and Quantification of TATP
Leonardo Pacheco-Londoño1, Oliva M Primera1, Michael Ramírez2, Orlando Ruiz2,
and Samuel Hernandez-Rivera*, 1
1 Center for Chemical Sensors Development / Chemical Imaging Center MURI – DoD – UPRM
Department of Chemistry, University of Puerto Rico-Mayagüez PO Box 9019, Mayagüez, PR 00681
2 Hewlett Packard, Aguadilla, Puerto Rico
ABSTRACT
The objective of this research is to design and develop a multi-sensor capable of fast detection and of recognition optimization of the techniques for used for quantification of TATP by Pattern Recognition. In particular, the long range goal of the research is to use sensor fusion and sensor “talking” modalities to couple Stand Off detectors with Chemical Point detectors for detection of airborne chemical agents and detection of Improvised Explosive Devices (IEDs). Vibrational spectroscopy techniques are very fast and can be used for real time detection. Good results have been obtained with various target molecular (chemical) systems such as TATP, TNT and DNT. Samples of TATP were detected and quantified in air, in solution and in solid phase on surfaces by different techniques. FTIR Spectroscopy and GS-MS were used to generate new analytical procedures for detection and analysis of the organic peroxide. These procedures were compared and taken to their limits by optimization with Chemometrics, Partial Least Squares (PLS), and Discriminant Analysis (DA). Keywords: TATP, Chemometrics, PLS, DA.
1. INTRODUCTION Triacetone Triproxide (TATP) is an organic peroxide that has a relatively high detonation power. The amount of gaseous products evolved (CO2, CO, H2O) per mole of peroxide is low compared to RDX or PETN. Peroxides are very hazardous, however, because of the extreme sensitivity of certain types to shock, spark, and other forms of accidental ignition.1 TATP can be chemically destroyed by adding of SnCl2-2H2O dissolved in methylated spirit or in benzene at 100°C in the presence of aqueous H2SO4.
2 Thermal destruction o TATP is achieved by heating under in toluene reflux during 280 h.2, 3 TATP is also degraded by light, molecular oxygen as degradation product can be produced. Measurement of evolved oxygen of this is reaction can be achieved with reaction with colored compound product and this can be quantified by UV-VIS absortion.4 Also, irradiation of TATP solution of at 254 nm produces hydrogen peroxide which can be quantified by reaction with hydrogen peroxide peroxidase and 2, 2,-A-azo-bis (3-thylbenzothiazoline)-6-sulfonate by UV-VIS spectrophotometry.5 This method can also be implemented for gas analysis of TATP in air. Flow of TATP in air can be sampled in acetonitrile solution and irradiated with UV light at 254 nm and detected by method described before or by HPLC analysis.6,7 TATP also can be detected directly by LC/MS and HPLC/MS. Studies have shown that LC/MS is a suitable technique for the identification and quantification of TATP, with detection limits in the low nanogram per 100 ml range.8 Other studies based on HPLC-APCI-MS(/MS) method have detected hexamethylenetriperoxidediamine (HMTD) and triacetone triperoxide. TATP molecular ion [TATP-H] + has been observed in an HPLC-MS/MS analysis. The limit of detection TATP was 3.3 ng on column by HPLC-APCI-MS and 0.8 ng by HPLC-APCI-MS/MS.9 The cyclic triperoxide was analyzed by ion
∗ Author for correspondence: [email protected], [email protected]
Sensors, and C3I Technologies for Homeland Security and HomelandDefense IV, edited by Edward M. Carapezza, Proceedings of SPIE Vol. 5778(SPIE, Bellingham, WA, 2005) · 0277-786X/05/$15 · doi: 10.1117/12.603073
317
mobility spectrometry by Buttigieg et al, where a dramatic increase in peak intensity was observed. The identity of the species detected by IMS was authenticated by mass spectrometry and was also detected by IMS in positive ion mode.10 One possible form to detect TATP is complexes with ions metallic and detected those ions by colorimetric, computational evidences exist TATP is energetically favored complexes with Zn+2 and Cu+ .11
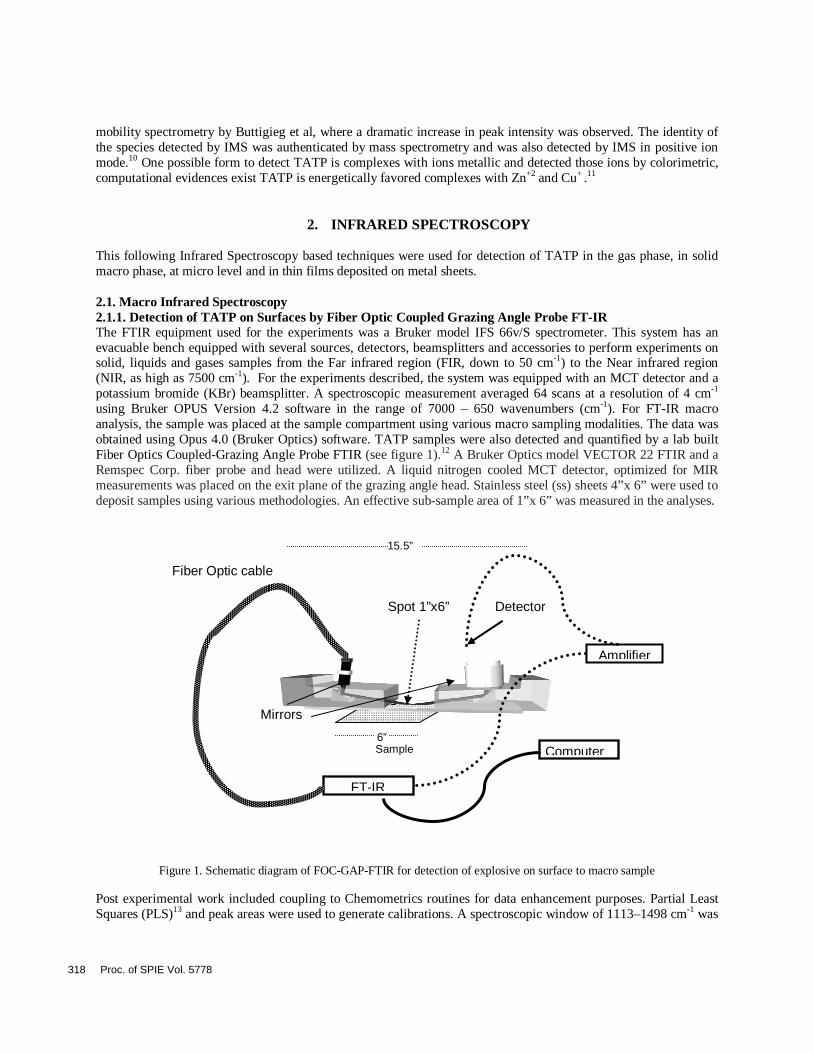
2. INFRARED SPECTROSCOPY This following Infrared Spectroscopy based techniques were used for detection of TATP in the gas phase, in solid macro phase, at micro level and in thin films deposited on metal sheets. 2.1. Macro Infrared Spectroscopy 2.1.1. Detection of TATP on Surfaces by Fiber Optic Coupled Grazing Angle Probe FT-IR The FTIR equipment used for the experiments was a Bruker model IFS 66v/S spectrometer. This system has an evacuable bench equipped with several sources, detectors, beamsplitters and accessories to perform experiments on solid, liquids and gases samples from the Far infrared region (FIR, down to 50 cm-1) to the Near infrared region (NIR, as high as 7500 cm-1). For the experiments described, the system was equipped with an MCT detector and a potassium bromide (KBr) beamsplitter. A spectroscopic measurement averaged 64 scans at a resolution of 4 cm-1 using Bruker OPUS Version 4.2 software in the range of 7000 – 650 wavenumbers (cm-1). For FT-IR macro analysis, the sample was placed at the sample compartment using various macro sampling modalities. The data was obtained using Opus 4.0 (Bruker Optics) software. TATP samples were also detected and quantified by a lab built Fiber Optics Coupled-Grazing Angle Probe FTIR (see figure 1).12 A Bruker Optics model VECTOR 22 FTIR and a Remspec Corp. fiber probe and head were utilized. A liquid nitrogen cooled MCT detector, optimized for MIR measurements was placed on the exit plane of the grazing angle head. Stainless steel (ss) sheets 4”x 6” were used to deposit samples using various methodologies. An effective sub-sample area of 1”x 6” was measured in the analyses.
Figure 1. Schematic diagram of FOC-GAP-FTIR for detection of explosive on surface to macro sample
Post experimental work included coupling to Chemometrics routines for data enhancement purposes. Partial Least Squares (PLS)13 and peak areas were used to generate calibrations. A spectroscopic window of 1113–1498 cm-1 was
6”
Amplifier
FT-IR
15.5”
Detector
Mirrors
Sample
Spot 1”x6”
Computer
Fiber Optic cable
318 Proc. of SPIE Vol. 5778
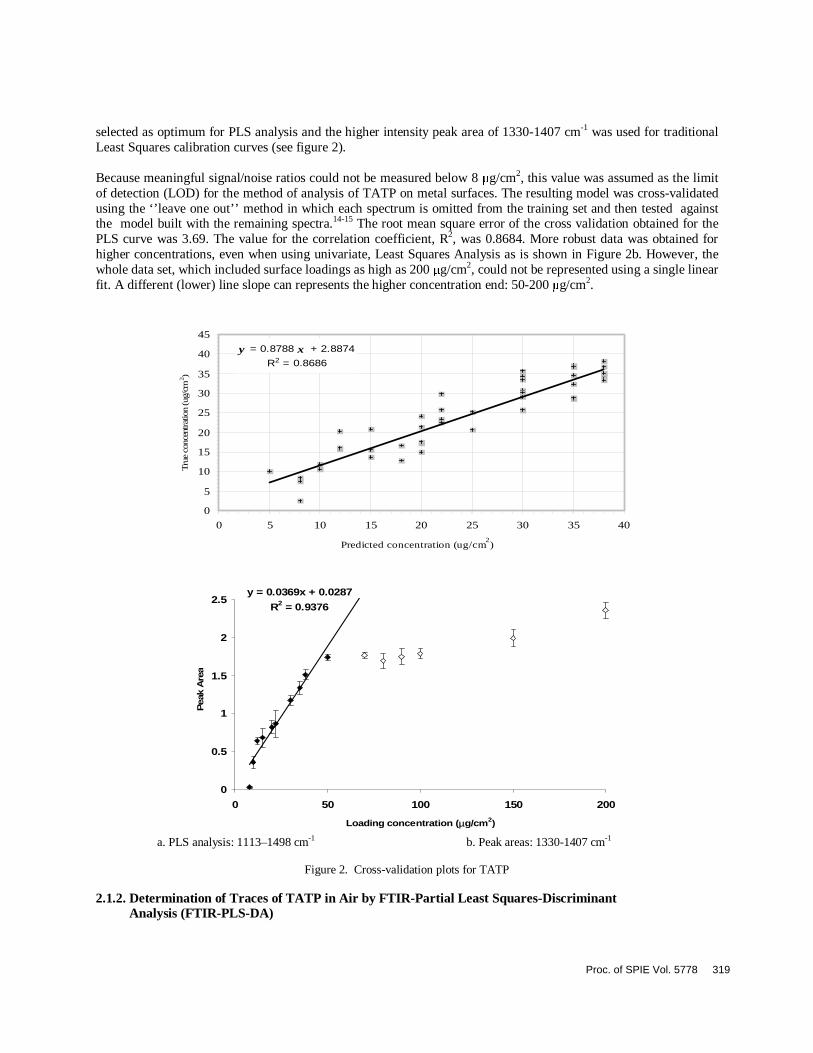
selected as optimum for PLS analysis and the higher intensity peak area of 1330-1407 cm-1 was used for traditional Least Squares calibration curves (see figure 2). Because meaningful signal/noise ratios could not be measured below 8 µg/cm2, this value was assumed as the limit of detection (LOD) for the method of analysis of TATP on metal surfaces. The resulting model was cross-validated using the ‘’leave one out’’ method in which each spectrum is omitted from the training set and then tested against the model built with the remaining spectra.14-15 The root mean square error of the cross validation obtained for the PLS curve was 3.69. The value for the correlation coefficient, R2, was 0.8684. More robust data was obtained for higher concentrations, even when using univariate, Least Squares Analysis as is shown in Figure 2b. However, the whole data set, which included surface loadings as high as 200 µg/cm2, could not be represented using a single linear fit. A different (lower) line slope can represents the higher concentration end: 50-200 µg/cm2.
y = 0.8788 x + 2.8874
R2 = 0.8686
0
5
10
15
20
25
30
35
40
45
0 5 10 15 20 25 30 35 40
Predicted concentration (ug/cm2)
Tru
e co
ncen
trat
ion
(ug/
cm2 )
y = 0.0369x + 0.0287
R2 = 0.9376
0
0.5
1
1.5
2
2.5
0 50 100 150 200
Loading concentration (µg/cm2)
Pea
k A
rea
a. PLS analysis: 1113–1498 cm-1 b. Peak areas: 1330-1407 cm-1
Figure 2. Cross-validation plots for TATP
2.1.2. Determination of Traces of TATP in Air by FTIR-Partial Least Squares-Discriminant Analysis (FTIR-PLS-DA)
Proc. of SPIE Vol. 5778 319
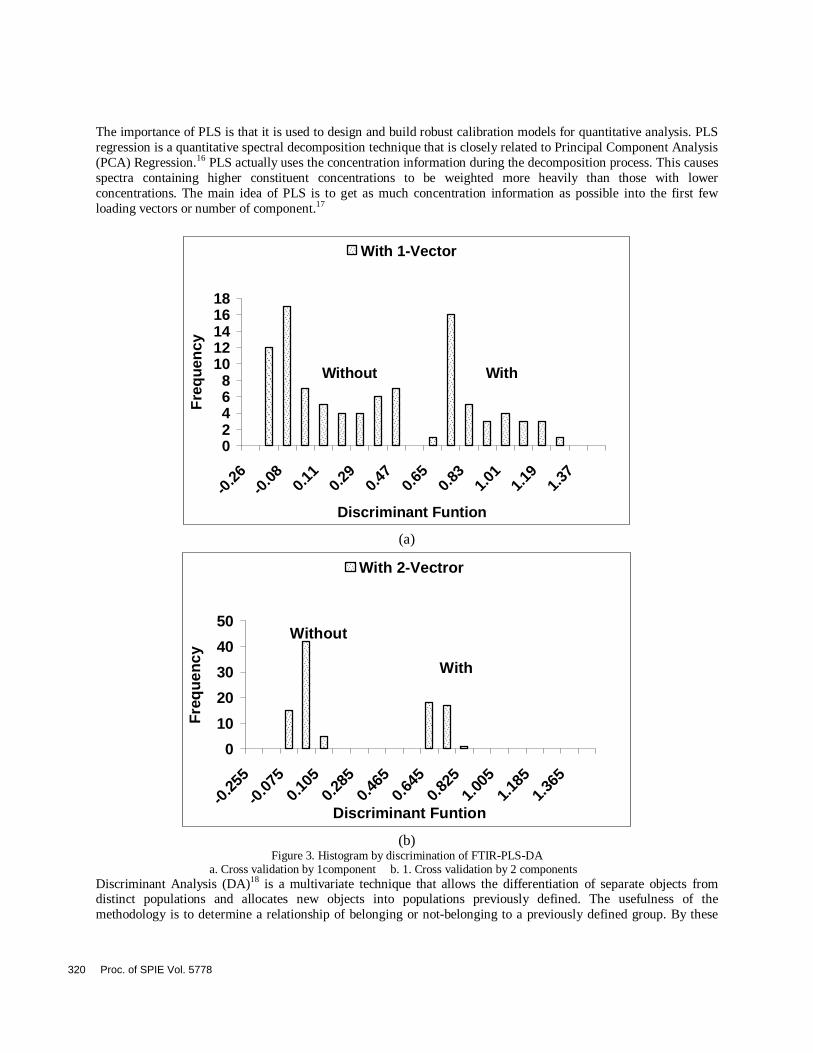
The importance of PLS is that it is used to design and build robust calibration models for quantitative analysis. PLS regression is a quantitative spectral decomposition technique that is closely related to Principal Component Analysis (PCA) Regression.16 PLS actually uses the concentration information during the decomposition process. This causes spectra containing higher constituent concentrations to be weighted more heavily than those with lower concentrations. The main idea of PLS is to get as much concentration information as possible into the first few loading vectors or number of component.17
With 1-Vector
02468
1012141618
-0.26
-0.08 0.
110.
290.
470.
650.
831.
011.
191.
37
Discriminant Funtion
Fre
qu
ency
With 1-Vector
Without With
(a)
With 2-Vectror
0
10
20
30
40
50
-0.25
5
-0.07
50.
105
0.28
50.
465
0.64
50.
825
1.00
51.
185
1.36
5
Discriminant Funtion
Fre
qu
ency
With 2-Vectror
With
Without
(b)
Figure 3. Histogram by discrimination of FTIR-PLS-DA a. Cross validation by 1component b. 1. Cross validation by 2 components
Discriminant Analysis (DA)18 is a multivariate technique that allows the differentiation of separate objects from distinct populations and allocates new objects into populations previously defined. The usefulness of the methodology is to determine a relationship of belonging or not-belonging to a previously defined group. By these
320 Proc. of SPIE Vol. 5778
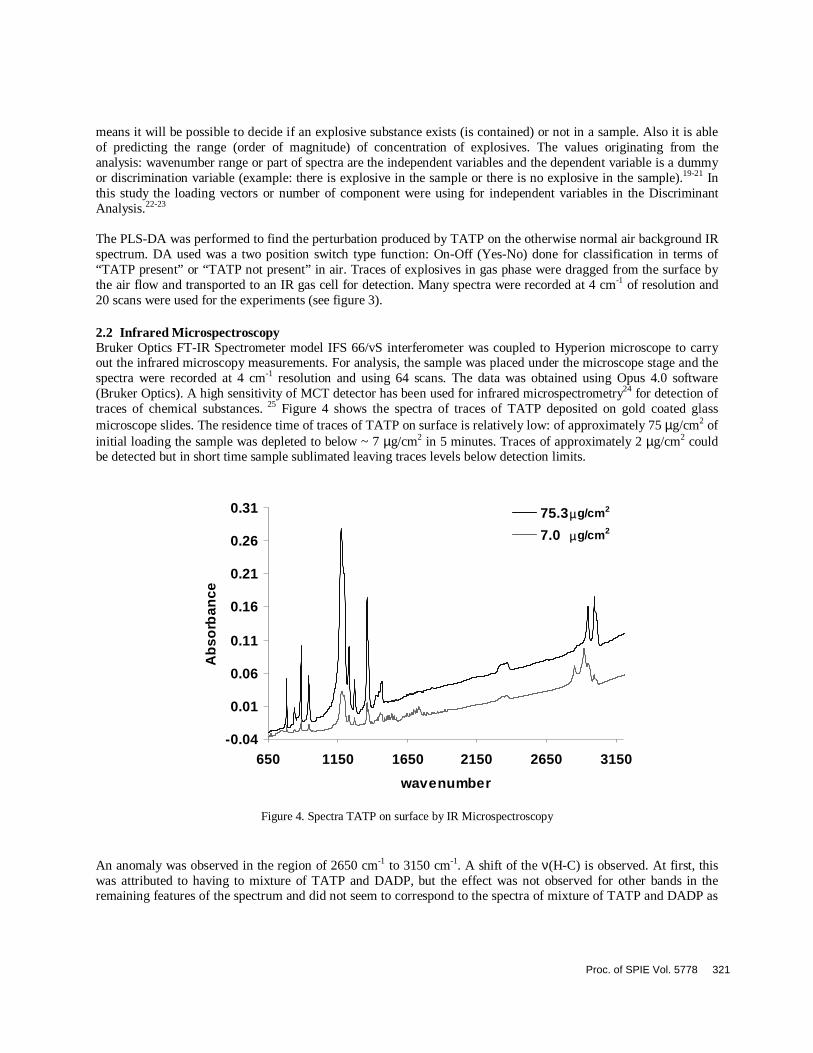
means it will be possible to decide if an explosive substance exists (is contained) or not in a sample. Also it is able of predicting the range (order of magnitude) of concentration of explosives. The values originating from the analysis: wavenumber range or part of spectra are the independent variables and the dependent variable is a dummy or discrimination variable (example: there is explosive in the sample or there is no explosive in the sample).19-21 In this study the loading vectors or number of component were using for independent variables in the Discriminant Analysis.22-23 The PLS-DA was performed to find the perturbation produced by TATP on the otherwise normal air background IR spectrum. DA used was a two position switch type function: On-Off (Yes-No) done for classification in terms of “TATP present” or “TATP not present” in air. Traces of explosives in gas phase were dragged from the surface by the air flow and transported to an IR gas cell for detection. Many spectra were recorded at 4 cm-1 of resolution and 20 scans were used for the experiments (see figure 3). 2.2 Infrared Microspectroscopy Bruker Optics FT-IR Spectrometer model IFS 66/vS interferometer was coupled to Hyperion microscope to carry out the infrared microscopy measurements. For analysis, the sample was placed under the microscope stage and the spectra were recorded at 4 cm-1 resolution and using 64 scans. The data was obtained using Opus 4.0 software (Bruker Optics). A high sensitivity of MCT detector has been used for infrared microspectrometry24 for detection of traces of chemical substances. 25 Figure 4 shows the spectra of traces of TATP deposited on gold coated glass microscope slides. The residence time of traces of TATP on surface is relatively low: of approximately 75 µg/cm2 of initial loading the sample was depleted to below ~ 7 µg/cm2 in 5 minutes. Traces of approximately 2 µg/cm2 could be detected but in short time sample sublimated leaving traces levels below detection limits.
-0.04
0.01
0.06
0.11
0.16
0.21
0.26
0.31
650 1150 1650 2150 2650 3150
wavenumber
Ab
sorb
ance
75.3
7.0
µg/cm2
µg/cm2
Figure 4. Spectra TATP on surface by IR Microspectroscopy
An anomaly was observed in the region of 2650 cm-1 to 3150 cm-1. A shift of the ν(H-C) is observed. At first, this was attributed to having to mixture of TATP and DADP, but the effect was not observed for other bands in the remaining features of the spectrum and did not seem to correspond to the spectra of mixture of TATP and DADP as
Proc. of SPIE Vol. 5778 321
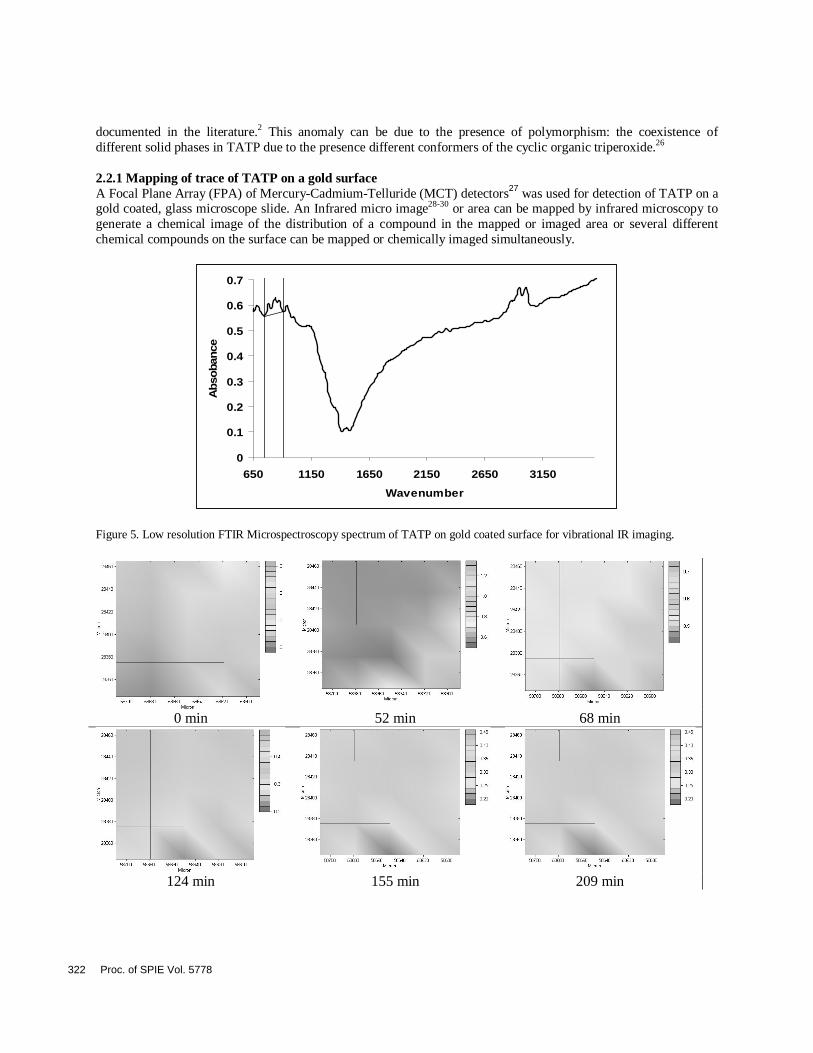
documented in the literature.2 This anomaly can be due to the presence of polymorphism: the coexistence of different solid phases in TATP due to the presence different conformers of the cyclic organic triperoxide.26 2.2.1 Mapping of trace of TATP on a gold surface A Focal Plane Array (FPA) of Mercury-Cadmium-Telluride (MCT) detectors27 was used for detection of TATP on a gold coated, glass microscope slide. An Infrared micro image28-30 or area can be mapped by infrared microscopy to generate a chemical image of the distribution of a compound in the mapped or imaged area or several different chemical compounds on the surface can be mapped or chemically imaged simultaneously.
0
0.1
0.2
0.3
0.4
0.5
0.6
0.7
650 1150 1650 2150 2650 3150
Wavenumber
Ab
soba
nce
Figure 5. Low resolution FTIR Microspectroscopy spectrum of TATP on gold coated surface for vibrational IR imaging.
0 min 52 min 68 min
124 min 155 min 209 min
322 Proc. of SPIE Vol. 5778
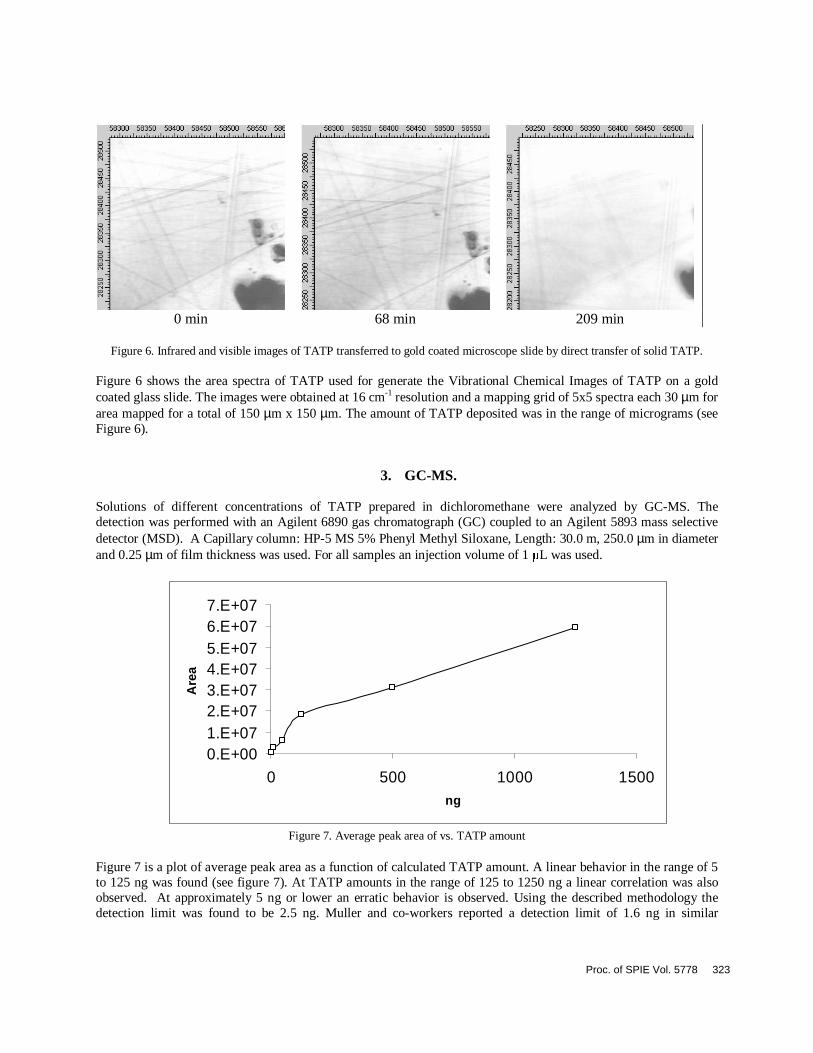
0 min 68 min 209 min
Figure 6. Infrared and visible images of TATP transferred to gold coated microscope slide by direct transfer of solid TATP.
Figure 6 shows the area spectra of TATP used for generate the Vibrational Chemical Images of TATP on a gold coated glass slide. The images were obtained at 16 cm-1 resolution and a mapping grid of 5x5 spectra each 30 µm for area mapped for a total of 150 µm x 150 µm. The amount of TATP deposited was in the range of micrograms (see Figure 6).
3. GC-MS. Solutions of different concentrations of TATP prepared in dichloromethane were analyzed by GC-MS. The detection was performed with an Agilent 6890 gas chromatograph (GC) coupled to an Agilent 5893 mass selective detector (MSD). A Capillary column: HP-5 MS 5% Phenyl Methyl Siloxane, Length: 30.0 m, 250.0 µm in diameter and 0.25 µm of film thickness was used. For all samples an injection volume of 1 µL was used.
0.E+001.E+072.E+073.E+074.E+075.E+076.E+077.E+07
0 500 1000 1500ng
Are
a
Figure 7. Average peak area of vs. TATP amount
Figure 7 is a plot of average peak area as a function of calculated TATP amount. A linear behavior in the range of 5 to 125 ng was found (see figure 7). At TATP amounts in the range of 125 to 1250 ng a linear correlation was also observed. At approximately 5 ng or lower an erratic behavior is observed. Using the described methodology the detection limit was found to be 2.5 ng. Muller and co-workers reported a detection limit of 1.6 ng in similar
Proc. of SPIE Vol. 5778 323
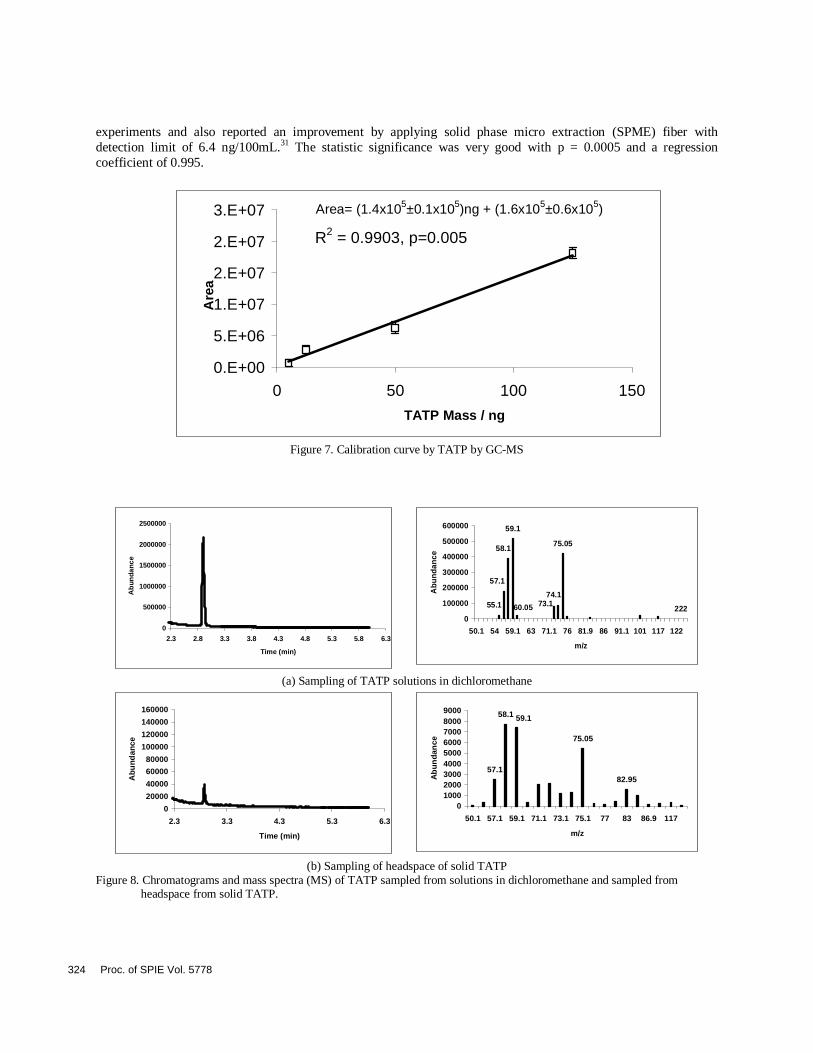
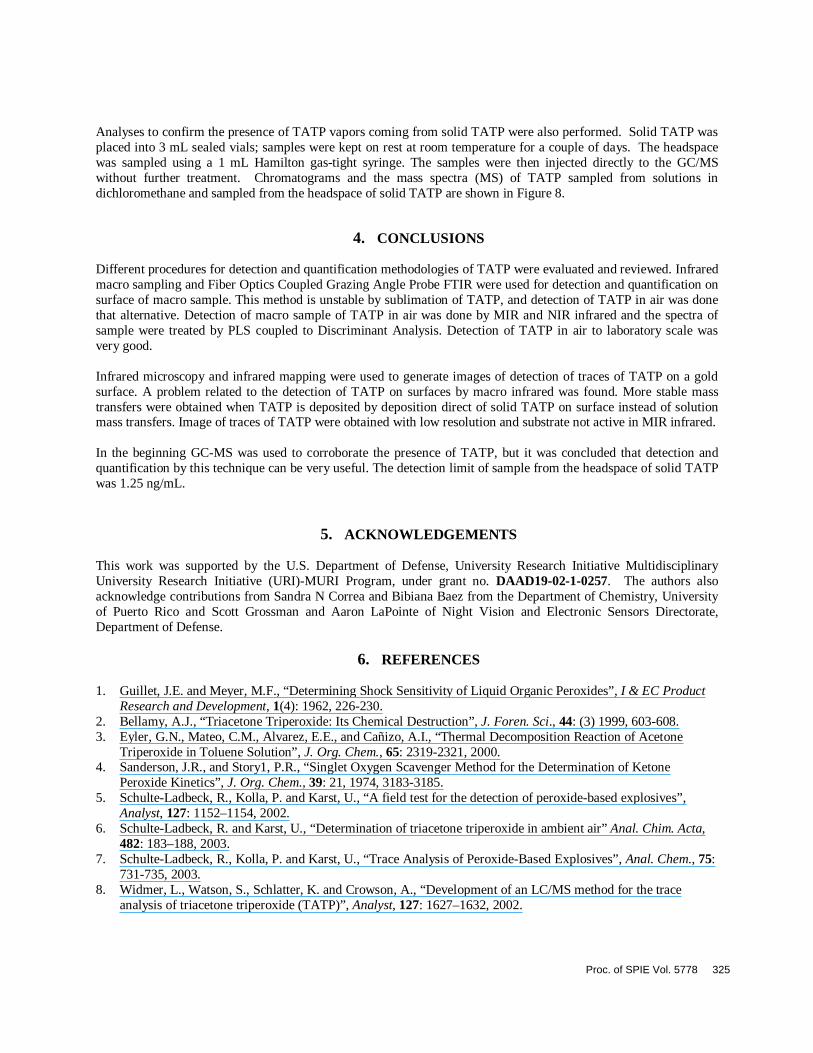
experiments and also reported an improvement by applying solid phase micro extraction (SPME) fiber with detection limit of 6.4 ng/100mL.31 The statistic significance was very good with p = 0.0005 and a regression coefficient of 0.995.
R2 = 0.9903, p=0.005
0.E+00
5.E+06
1.E+07
2.E+07
2.E+07
3.E+07
0 50 100 150
TATP Mass / ng
Are
aArea= (1.4x10⁵±0.1x10⁵)ng + (1.6x10⁵±0.6x10⁵)
Figure 7. Calibration curve by TATP by GC-MS
0
500000
1000000
1500000
2000000
2500000
2.3 2.8 3.3 3.8 4.3 4.8 5.3 5.8 6.3
Time (min)
Ab
unda
nce
59.1
58.1
57.1
55.1 60.05
75.05
74.173.1
2220
100000
200000
300000
400000
500000
600000
50.1 54 59.1 63 71.1 76 81.9 86 91.1 101 117 122
m/z
Ab
un
dan
ce
(a) Sampling of TATP solutions in dichloromethane
0
20000
40000
60000
80000
100000
120000
140000
160000
2.3 3.3 4.3 5.3 6.3
Time (min)
Ab
un
dan
ce
82.95
75.05
59.158.1
57.1
0100020003000400050006000700080009000
50.1 57.1 59.1 71.1 73.1 75.1 77 83 86.9 117
m/z
Ab
un
dan
ce
(b) Sampling of headspace of solid TATP
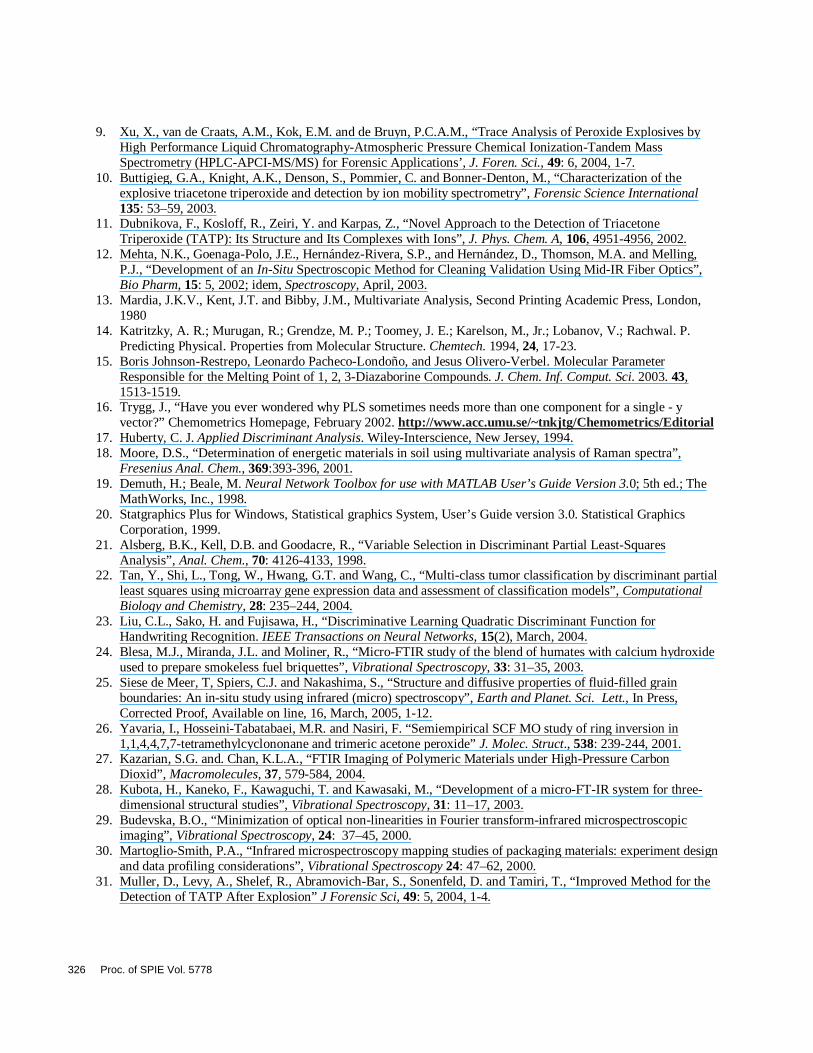
Figure 8. Chromatograms and mass spectra (MS) of TATP sampled from solutions in dichloromethane and sampled from headspace from solid TATP.
324 Proc. of SPIE Vol. 5778
Analyses to confirm the presence of TATP vapors coming from solid TATP were also performed. Solid TATP was placed into 3 mL sealed vials; samples were kept on rest at room temperature for a couple of days. The headspace was sampled using a 1 mL Hamilton gas-tight syringe. The samples were then injected directly to the GC/MS without further treatment. Chromatograms and the mass spectra (MS) of TATP sampled from solutions in dichloromethane and sampled from the headspace of solid TATP are shown in Figure 8.
4. CONCLUSIONS Different procedures for detection and quantification methodologies of TATP were evaluated and reviewed. Infrared macro sampling and Fiber Optics Coupled Grazing Angle Probe FTIR were used for detection and quantification on surface of macro sample. This method is unstable by sublimation of TATP, and detection of TATP in air was done that alternative. Detection of macro sample of TATP in air was done by MIR and NIR infrared and the spectra of sample were treated by PLS coupled to Discriminant Analysis. Detection of TATP in air to laboratory scale was very good. Infrared microscopy and infrared mapping were used to generate images of detection of traces of TATP on a gold surface. A problem related to the detection of TATP on surfaces by macro infrared was found. More stable mass transfers were obtained when TATP is deposited by deposition direct of solid TATP on surface instead of solution mass transfers. Image of traces of TATP were obtained with low resolution and substrate not active in MIR infrared. In the beginning GC-MS was used to corroborate the presence of TATP, but it was concluded that detection and quantification by this technique can be very useful. The detection limit of sample from the headspace of solid TATP was 1.25 ng/mL.
5. ACKNOWLEDGEMENTS
This work was supported by the U.S. Department of Defense, University Research Initiative Multidisciplinary University Research Initiative (URI)-MURI Program, under grant no. DAAD19-02-1-0257. The authors also acknowledge contributions from Sandra N Correa and Bibiana Baez from the Department of Chemistry, University of Puerto Rico and Scott Grossman and Aaron LaPointe of Night Vision and Electronic Sensors Directorate, Department of Defense.
6. REFERENCES 1. Guillet, J.E. and Meyer, M.F., “Determining Shock Sensitivity of Liquid Organic Peroxides”, I & EC Product
Research and Development, 1(4): 1962, 226-230. 2. Bellamy, A.J., “Triacetone Triperoxide: Its Chemical Destruction”, J. Foren. Sci., 44: (3) 1999, 603-608. 3. Eyler, G.N., Mateo, C.M., Alvarez, E.E., and Cañizo, A.I., “Thermal Decomposition Reaction of Acetone
Triperoxide in Toluene Solution”, J. Org. Chem., 65: 2319-2321, 2000. 4. Sanderson, J.R., and Story1, P.R., “Singlet Oxygen Scavenger Method for the Determination of Ketone
Peroxide Kinetics”, J. Org. Chem., 39: 21, 1974, 3183-3185. 5. Schulte-Ladbeck, R., Kolla, P. and Karst, U., “A field test for the detection of peroxide-based explosives”,
Analyst, 127: 1152–1154, 2002. 6. Schulte-Ladbeck, R. and Karst, U., “Determination of triacetone triperoxide in ambient air” Anal. Chim. Acta,
482: 183–188, 2003. 7. Schulte-Ladbeck, R., Kolla, P. and Karst, U., “Trace Analysis of Peroxide-Based Explosives”, Anal. Chem., 75:
731-735, 2003. 8. Widmer, L., Watson, S., Schlatter, K. and Crowson, A., “Development of an LC/MS method for the trace
analysis of triacetone triperoxide (TATP)”, Analyst, 127: 1627–1632, 2002.
Proc. of SPIE Vol. 5778 325
9. Xu, X., van de Craats, A.M., Kok, E.M. and de Bruyn, P.C.A.M., “Trace Analysis of Peroxide Explosives by High Performance Liquid Chromatography-Atmospheric Pressure Chemical Ionization-Tandem Mass Spectrometry (HPLC-APCI-MS/MS) for Forensic Applications’, J. Foren. Sci., 49: 6, 2004, 1-7.
10. Buttigieg, G.A., Knight, A.K., Denson, S., Pommier, C. and Bonner-Denton, M., “Characterization of the explosive triacetone triperoxide and detection by ion mobility spectrometry”, Forensic Science International 135: 53–59, 2003.
11. Dubnikova, F., Kosloff, R., Zeiri, Y. and Karpas, Z., “Novel Approach to the Detection of Triacetone Triperoxide (TATP): Its Structure and Its Complexes with Ions”, J. Phys. Chem. A, 106, 4951-4956, 2002.
12. Mehta, N.K., Goenaga-Polo, J.E., Hernández-Rivera, S.P., and Hernández, D., Thomson, M.A. and Melling, P.J., “Development of an In-Situ Spectroscopic Method for Cleaning Validation Using Mid-IR Fiber Optics”, Bio Pharm, 15: 5, 2002; idem, Spectroscopy, April, 2003.
13. Mardia, J.K.V., Kent, J.T. and Bibby, J.M., Multivariate Analysis, Second Printing Academic Press, London, 1980
14. Katritzky, A. R.; Murugan, R.; Grendze, M. P.; Toomey, J. E.; Karelson, M., Jr.; Lobanov, V.; Rachwal. P. Predicting Physical. Properties from Molecular Structure. Chemtech. 1994, 24, 17-23.
15. Boris Johnson-Restrepo, Leonardo Pacheco-Londoño, and Jesus Olivero-Verbel. Molecular Parameter Responsible for the Melting Point of 1, 2, 3-Diazaborine Compounds. J. Chem. Inf. Comput. Sci. 2003. 43, 1513-1519.
16. Trygg, J., “Have you ever wondered why PLS sometimes needs more than one component for a single - y vector?” Chemometrics Homepage, February 2002. http://www.acc.umu.se/~tnkjtg/Chemometrics/Editorial
17. Huberty, C. J. Applied Discriminant Analysis. Wiley-Interscience, New Jersey, 1994. 18. Moore, D.S., “Determination of energetic materials in soil using multivariate analysis of Raman spectra”,
Fresenius Anal. Chem., 369:393-396, 2001. 19. Demuth, H.; Beale, M. Neural Network Toolbox for use with MATLAB User’s Guide Version 3.0; 5th ed.; The
MathWorks, Inc., 1998. 20. Statgraphics Plus for Windows, Statistical graphics System, User’s Guide version 3.0. Statistical Graphics
Corporation, 1999. 21. Alsberg, B.K., Kell, D.B. and Goodacre, R., “Variable Selection in Discriminant Partial Least-Squares
Analysis”, Anal. Chem., 70: 4126-4133, 1998. 22. Tan, Y., Shi, L., Tong, W., Hwang, G.T. and Wang, C., “Multi-class tumor classification by discriminant partial
least squares using microarray gene expression data and assessment of classification models”, Computational Biology and Chemistry, 28: 235–244, 2004.
23. Liu, C.L., Sako, H. and Fujisawa, H., “Discriminative Learning Quadratic Discriminant Function for Handwriting Recognition. IEEE Transactions on Neural Networks, 15(2), March, 2004.
24. Blesa, M.J., Miranda, J.L. and Moliner, R., “Micro-FTIR study of the blend of humates with calcium hydroxide used to prepare smokeless fuel briquettes”, Vibrational Spectroscopy, 33: 31–35, 2003.
25. Siese de Meer, T, Spiers, C.J. and Nakashima, S., “Structure and diffusive properties of fluid-filled grain boundaries: An in-situ study using infrared (micro) spectroscopy”, Earth and Planet. Sci. Lett., In Press, Corrected Proof, Available on line, 16, March, 2005, 1-12.
26. Yavaria, I., Hosseini-Tabatabaei, M.R. and Nasiri, F. “Semiempirical SCF MO study of ring inversion in 1,1,4,4,7,7-tetramethylcyclononane and trimeric acetone peroxide” J. Molec. Struct., 538: 239-244, 2001.
27. Kazarian, S.G. and. Chan, K.L.A., “FTIR Imaging of Polymeric Materials under High-Pressure Carbon Dioxid”, Macromolecules, 37, 579-584, 2004.
28. Kubota, H., Kaneko, F., Kawaguchi, T. and Kawasaki, M., “Development of a micro-FT-IR system for three-dimensional structural studies”, Vibrational Spectroscopy, 31: 11–17, 2003.
29. Budevska, B.O., “Minimization of optical non-linearities in Fourier transform-infrared microspectroscopic imaging”, Vibrational Spectroscopy, 24: 37–45, 2000.
30. Martoglio-Smith, P.A., “Infrared microspectroscopy mapping studies of packaging materials: experiment design and data profiling considerations”, Vibrational Spectroscopy 24: 47–62, 2000.
31. Muller, D., Levy, A., Shelef, R., Abramovich-Bar, S., Sonenfeld, D. and Tamiri, T., “Improved Method for the Detection of TATP After Explosion” J Forensic Sci, 49: 5, 2004, 1-4.
326 Proc. of SPIE Vol. 5778