CHAPTER FOUR - Quantification of Nucleic Acids
13
CHAPTER FOUR 90 CHAPTER FOUR Quantification of Nucleic Acids Methods for Determining DNA Yield and Purity It's so important to quantify the concentration the specimen of the nucleic acid since the efficiency of downstream reactions (PCR, sequencing, restriction digestion, ligation, and bacterial transformation) rely on the concentration of these nucleus acids. Usually, DNA can be quantified from several types of specimens such as genomic DNA, PCR product, plasmid DNA. Whatever the technique used in DNA extraction, there are two main methods and two special methods by which the extracted DNA amount can be determined. So, DNA yield can be assessed using four different methods: absorbance (optical density), agarose gel electrophoresis, fluorescent DNA- binding dyes and a luciferase-pyrophosphorylation-coupled quantitation system. While all methods are useful, each has caveats to consider when choosing a quantitation system. 1. (UV – Visible ) Spectrophotometric based method After isolating DNA, it's necessary to figure out how much DNA, or RNA it has, and how much this genetic material is pure. This is done classically by UV-visible spectrophotometer. The most common technique to determine DNA yield and purity is also the easiest method—absorbance. All that is needed for measurement is a spectrophotometer equipped with a UV lamp, UV-transparent cuvettes (depending on the instrument) and a solution of purified DNA (figure 4.1). Absorbance readings are performed at 260nm (A260) where DNA absorbs light most strongly, and the number generated allows one to estimate the concentration of the solution. However, DNA is not the only molecule that can absorb UV light at 260nm. Since RNA also has a great absorbance at 260nm, and the aromatic amino acids present in protein absorb at 280nm, both contaminants, if present in the DNA solution, will contribute to the total measurement at 260nm. Additionally, the presence of guanidine will lead to higher 260nm absorbance. This means that if the A260 number is used for calculation of yield, the DNA quantity may be overestimated. The most common purity calculation is determining the ratio of the absorbance at 260nm divided by the reading at 280nm. Good-quality DNA will have an A260/A280 ratio of 1.7–2.0. A reading of 1.6 does not render the DNA unsuitable for any application, but lower ratios indicate more contaminants are present. However, the best test of DNA quality is functionality in the application of interest (e.g., real-time PCR).
-
Upload
khangminh22 -
Category
Documents
-
view
2 -
download
0
Transcript of CHAPTER FOUR - Quantification of Nucleic Acids

CHAPTER FOUR
90
CHAPTER FOUR Quantification of Nucleic Acids
Methods for Determining DNA Yield and Purity
It's so important to quantify the concentration the specimen of the nucleic acid since the efficiency of downstream reactions (PCR, sequencing, restriction digestion, ligation, and bacterial transformation) rely on the concentration of these nucleus acids. Usually, DNA can be quantified from several types of specimens such as genomic DNA, PCR product, plasmid DNA. Whatever the technique used in DNA extraction, there are two main methods and two special methods by which the extracted DNA amount can be determined. So, DNA yield can be assessed using four different methods: absorbance (optical density), agarose gel electrophoresis, fluorescent DNA-binding dyes and a luciferase-pyrophosphorylation-coupled quantitation system. While all methods are useful, each has caveats to consider when choosing a quantitation system.
1. (UV – Visible ) Spectrophotometric based method
After isolating DNA, it's necessary to figure out how much DNA, or
RNA it has, and how much this genetic material is pure. This is done classically by UV-visible spectrophotometer. The most common technique to determine DNA yield and purity is also the easiest method—absorbance. All that is needed for measurement is a spectrophotometer equipped with a UV lamp, UV-transparent cuvettes (depending on the instrument) and a solution of purified DNA (figure 4.1). Absorbance readings are performed at 260nm (A260) where DNA absorbs light most strongly, and the number generated allows one to estimate the concentration of the solution. However, DNA is not the only molecule that can absorb UV light at 260nm. Since RNA also has a great absorbance at 260nm, and the aromatic amino acids present in protein absorb at 280nm, both contaminants, if present in the DNA solution, will contribute to the total measurement at 260nm. Additionally, the presence of guanidine will lead to higher 260nm absorbance. This means that if the A260 number is used for calculation of yield, the DNA quantity may be overestimated.
The most common purity calculation is determining the ratio of the
absorbance at 260nm divided by the reading at 280nm. Good-quality DNA will have an A260/A280 ratio of 1.7–2.0. A reading of 1.6 does not render the DNA unsuitable for any application, but lower ratios indicate more contaminants are present. However, the best test of DNA quality is functionality in the application of interest (e.g., real-time PCR).

CHAPTER FOUR
91
For pure solutions of DNA, the most common method of quantitation is reading the absorbance at 260 nm where an OD (optical density) in a 1 cm path length = 50 µg/ml for double-stranded DNA, 40 µg/ml for single-stranded DNA and RNA and 20-33 µg/ml for oligonucleotides. An absorbance ratio of 260 nm and 280 nm gives an estimate of the purity of the solution. Pure DNA and RNA solutions have OD 260/OD 280 values of 1.8 and 2.0, respectively.
Figure (4.1). UV-visible spectrophotometer,
190-1100 nm from PhyWe – Germany (Product No: 35655-93), which has the following specifications (Benefits: The UV-VIS spectral photometer is characterized by its compact design and due to its wide range of possible uses. Operation is via a clearly set out overlay keyboard on the screen dialogue. Current wavelengths and measured values can be displayed in large format. Alternatively, all measured values can also be presented graphically or in table format on the LCD screen with background lighting. Strong light, high performance optics enable absorption and transmission measurements to be taken in the whole wavelength range of 200 to 1100 nm with automatic switching between the two light sources. A high speed scanner minimizes the susceptibility to errors during a wavelength changeover and thus enables very precise measurement. Storage of measurement parameters, data, calibration curves, spectra, etc.- Spectral scanning of samples with freely selectable wavelength range, automatic baseline correction and band/trough identification Production of a calibration curve with up to 10 concentration standards, details of the straight line formula, automatic correction against the zero solution. The device can be connected to a printer or computer with a serial port via an installed Centronix or RS232interface. Equipment and technical data: Light sources: 1 Halogen lamp1 Deuterium lamp, Wavelength range: 190-1100 nm. Wavelength accuracy: ± 1 nm, Wavelength repeatability: ± 0.3 nm, Spectral bandwidth: 5 nm, Photometric range: - 0.3 to 3 Abs0.0 to 200% Transmittance , Long-term stability: ± 0.005 Abs/h , Cuvette holder: for square cuvettes with external dimensions 12 mm × 12 mm , Outputs: serial RS232C, parallel Centronix , Dimensions (WxDxH): 420 x 380 x 275 mm , Mains: 230 V~
After the determination the purity of the extracted DNA by dividing of the
reading result at 280nm on the reading result of the same specimen at 260nm, if the result is around 1.8, the extracted DNA enjoys with a high degree of purity. While, if it's lower, the extracted DNA is usually contaminated with proteins, and if it's higher, the extracted DNA is usually contaminated with RNA. However, this classical method has several disadvantages; the most important

CHAPTER FOUR
92
one is that this method is time consuming. The measurement is more boring in case anyone wants to know the purity of the isolated specimen. Moreover, this method is not useful for small quantities of DNA or RNA (<1 µ g/ml).
Though nucleic acids quantification measurements were traditionally taken with standard spectrophotometers, but we now use a tabletop spec called a Nanodrop that requires only 2 µl of a sample for quantification. The principle of action is the same, but the practical usage is much easier. Nanodrop technologies are developed in order to solve the problems faced with spectrophotometer. Thus, several advantage are provided by this modern techniques such as Small sample size: these patented sample retention system allows the researcher to analyze samples as small as 0.5 µl quickly and easily, fast and easy sample processing: Fast—measure a sample in less than 5 seconds, easy—simply pipette a sample onto the pedestal and measure, then wipe the pedestal and move to the next sample, versatile measurement options: the researcher can now measure a micro-volume sample directly on a pedestal or use a cuvette when needed—all within the same instrument, small footprint in order to maximize space in a laboratory, these instruments are ultra-compact, no dilutions: even high concentration samples can be measured without dilutions, and innovative software since these instruments are both powerful and easy to use (figure 4.2).
Figure (4.2); Thermo Scientific NanoDrop 2000c
Spectrophotometer. The Best of Both Worlds in One Spectrophotometer The Thermo Scientific NanoDrop 2000c does everything the NanoDrop™ 2000 does, plus more. With its unique, patentpending technology, the NanoDrop™ 2000c combines microvolume pedestal technology and cuvette capability in a single instrument. This innovative technology allows you the flexibility to choose the best measuring technique for your samples: • Innovative technology that makes this the only UV-Vis spectrophotometer your lab will ever need • Expanded measurement options for all types of samples— you choose the measuring option right for your sample: cuvette or pedestal • Broader concentration range for measuring very low concentrations and very high concentrations • Cuvette capability allows for kinetics (time or time/temperature studies) and cell culture (OD 600) measurements.
With its unique, patent pending technology, the NanoDrop™ 2000c combines microvolume pedestal technology and cuvette capability in a single instrument. This innovative technology allows us the flexibility to choose the best measuring technique for our samples (figure 4.3).
We have to know that all equipments required in Nanodrop
measurements in addition to Nanodrop are; Sample to be measured, (1 – 10) µl micropipette with tips, Lint-free lab wipes, Purified water, Blanking solution (H2O, TE, Tris, or other depending on your sample).

CHAPTER FOUR
93
Figure (4.3). The multifunctionality of Thermo Scientific NanoDrop 2000c Spectrophotometer. it device has innovative technology that makes this the only UV-Vis spectrophotometer our lab will ever need. This nanodrop has expanded measurement options for all types of samples— we choose the measuring option right for our sample: cuvette or pedestal. Broader concentration range for measuring very low concentrations and very high concentrations. And cuvette capability allows for kinetics (time or time/temperature studies) and cell culture (OD 600) measurements.
Procedure for DNA quantification by Nanodrop technique 1. Open and turn on the computer attached to the NanoDrop. 2. Wash the NanoDrop pedestal.
a. There should be a lab wipe in the pedestal from the previous user. Lift the upper arm of the NanoDrop and remove the wipe.
b. Add 4‐5 µl of purified water to the lower pedestal, then lower the arm. c. Wait 30‐60 seconds. d. Lift the upper arm and use the wipe to vigorously scrub both the upper and lower pedestals.
3. Open the NanoDrop software on the computer by double‐clicking the “ND‐1000” icon that looks a bit like an hourglass. 4. Initialize the NanoDrop (figure 4.4).
a. Click on the “Nucleic Acid” button in the NanoDrop software. This will bring up a dialog box. DO NOT click “Okay” until you’ve added water.

CHAPTER FOUR
94
Figure (4.4). The main procedure for operating a nanodrop (ND1000), in which after turn on PC, open Nanodrop program, and select "nucleic acid" from the menu.
b. Add 1-2 µl of purified water to the lower pedestal, then lower the upper arm (figure 4.5). c. Click “Okay” on the computer and wait ~20 seconds while the NanoDrop initializes. d. When it’s done, lift the upper arm and dry the pedestal with a wipe.
Figure (4.5). the main procedure for operating a nanodrop (ND1000), in which 1-2µl of water is added to pedestal to initialize the instrument.
5. Blank the NanoDrop. a. Add 1-2 µl of the buffer your sample is in. If you resuspended a DNA pellet using TE, for example, blank now with TE. b. Lower the upper arm of the NanoDrop and click the “Blank” button on the software. c. Wait ~20 seconds for the blank measurement to be made (figure 4.6). d. When it’s done, lift the upper arm and dry the pedestal with a wipe.

CHAPTER FOUR
95
Figure (4.6). The main procedure for operating a nanodrop (ND1000), in which the instrument is blanked by adding 1-2µl of water or elution buffer to pedestal. After wiping with a lab wipe, 1-2µl of DNA sample is placed on pedestal.
6. Measure your sample. a. Add 2 µl of your sample to the lower pedestal, then lower the upper arm. b. In the “Sample ID” box, type in the name of your sample. c. Click the “Measure” button on the software and wait ~20 seconds for measurement (figure 4.7). d. When it’s done, lift the upper arm and dry the pedestal OR lift the upper arm and carefully pipet up as much of the sample as you can to retain it for further use (see final Helpful Tip, above).
Figure (4.7). The main procedure for operating a nanodrop (ND1000), in which the Nanodrop data screen is shown. Once the nucleic acid sample is placed a "measure" button is clicked.
7. Collect your data. a. Write down any measurements you’re interested in. You can move the cursor to check the absorbance number at various wavelengths. b. Click the “Print Screen” button to print the complete spectrum, if desired. c. When finished making all measurements, click “Print Report” to get a table of all data.
8. Clean the pedestal. a. Add 4‐5 µl of purified water to the lower pedestal, then lower the arm. b. Wait 30‐60 seconds. c. Lift the upper arm and use a wipe to vigorously scrub both the upper and lower pedestals. d. Place a new folded lab wipe on the lower pedestal and close the upper arm.
9. Shut down and close the computer.

CHAPTER FOUR
96
2. Electrophoresis based method. This method works better than the spec method for dirtier DNA
samples. When DNA stained with ethidium bromide is exposed to UV light at 590 nm, the fluorescence intensity is proportional to the mass of DNA in the samples. DNA concentration can be estimated visually by comparing fluorescence intensity of unknown and know DNA masses.
It is important to compare to a fragment of similar molecular weight to the one you are quantifying (i.e. to quantify a 300 bp band, don't compare it to a 6 kb band). Ethidium bromide or SYBR Green fluorescence during electrophoresis. The amount of DNA in a solution is proportional to the fluorescence emitted by ethidium bromide in that solution. Dilutions of an unknown DNA in the presence of 2 µg/ml ethidium bromide are compared to dilutions of a known amount of a standard DNA solutions spotted on an agarose gel electrophoresis (figure 4.8). Note that Molecular weight markers are DNA fragments of known size, Comparison of sample bands to markers allows; 1) Visible confirmation of desired product, and 2) Quantification of sample DNA.
Agarose gel electrophoresis of the purified DNA eliminates the issues
associated with absorbance readings. To use this method, a horizontal gel electrophoresis tank with an external power supply, analytical-grade agarose, an appropriate running buffer (e.g., 1X TAE) and an intercalating DNA dye along with appropriately sized DNA standards are needed for quantitation. A sample of the isolated DNA is loaded into a well of the agarose gel and then exposed to an electric field. The negatively charged DNA backbone migrates toward the anode (see chapter five).
Figure (4.8). gWizGFP vector integration into the sperm cells after incubation for 1 hour at room temperature. Lane 1: 20µl DNA size marker (Invitrogen – USA) Lane 2: 10µl of 364 bp PCR tested amplified fragment Lane 3: 364 bp PCR amplified fragment from 1µl sperm genomic DNA isolated after incubation with gWizGFP – lipofectAMINE- BamH I Lane 4: 364 bp PCR amplified fragment from 0.51µl sperm genomic DNA isolated after incubation with gWizGFP – DMSO- BamH I Lane 5: 364 bp PCR amplified fragment from 0.51µl sperm genomic DNA isolated after incubation with gWizGFP – lipofectAMINE Lane 6: 364 bp PCR amplified fragment from 0.41µl sperm genomic DNA isolated after incubation with gWizGFP - DMSO. Lane 7: 364 bp PCR amplified fragment from

CHAPTER FOUR
97
0.31µl sperm genomic DNA isolated after incubation with gWizGFP only. Electrophoresis conditions: agarose concentration 1.5%, power applied: 100V (5.5 V / cm), time of run: 1.15 hr.
Any RNA, nucleotides and protein in the sample migrate at different
rates compared to the DNA so the band(s) containing the DNA will be distinct. Concentration and yield can be determined after gel eletrophoresis is completed by comparing the sample DNA intensity to that of a DNA quantitation standard. For example, if a 2µl sample of undiluted DNA loaded on the gel has the same approximate intensity as the 100ng standard, then the solution concentration is 50ng/µl (100ng divided by 2µl). Standards used for quantitation should be labeled as such and be the same size as the sample DNA being analyzed. In order to visualize the DNA in the agarose gel, staining with an intercalating dye such as ethidium bromide or SYBR® Green is required. Because ethidium bromide is a known mutagen, precautions need to be taken for its proper use and disposal (Adams, 2003). However, there are two additional techniques for determination of DNA concentration, which are discussed below.
As for the size of the extracted DNA, agarose gel electrophoresis is
usually used to identify its size (see chapter five). It's also possible to use this technique for some experts to estimate the purity, amount and size of the electrophoresed DNA. In agarose gel electrophoresis technique, the huge molecules are separated according to their size, heavy molecules move slowly while light molecules move rapidly, and the size of these molecules can be determined in the gel by a suitable ladder for this purpose (figure 4.9).
Figure (4.9). Hind III digested lambda phage DNA
CHAPTER FOUR
98
There is a modification of this method that is known as spot method, in which if you need to quantify DNA and can't use the spectrophotometer method, and don't want to take the time to run a gel, you can use the spot method. In this method a series of known concentrations of DNA is made up. The standards, along with the DNA you want to quantify, are spotted on an agarose plate containing ethidium bromide (0.5 µg/ml) and photographed under 590 nm light. The unknown’s concentration is the same as the standard whose spot has the same fluorescence intensity.
3. Flourometer based method
Hoechst bisbenzimidazole dyes or PicoGreen® selectively bind double-
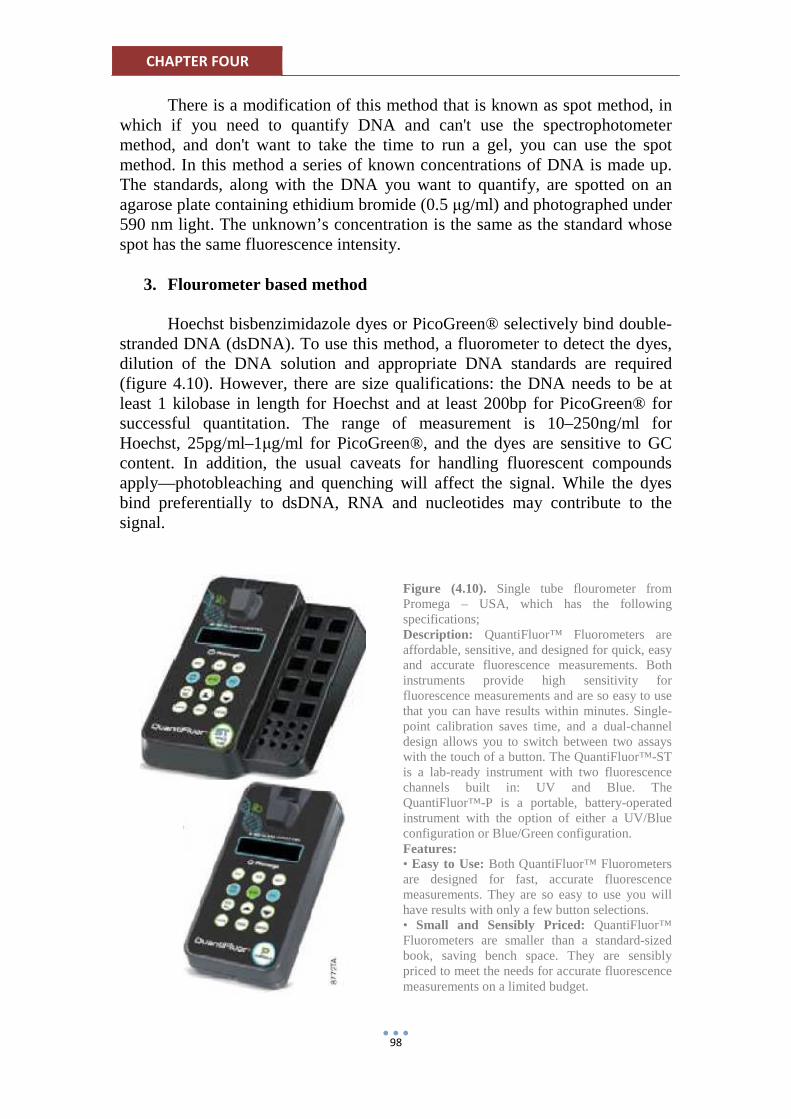
stranded DNA (dsDNA). To use this method, a fluorometer to detect the dyes, dilution of the DNA solution and appropriate DNA standards are required (figure 4.10). However, there are size qualifications: the DNA needs to be at least 1 kilobase in length for Hoechst and at least 200bp for PicoGreen® for successful quantitation. The range of measurement is 10–250ng/ml for Hoechst, 25pg/ml–1µg/ml for PicoGreen®, and the dyes are sensitive to GC content. In addition, the usual caveats for handling fluorescent compounds apply—photobleaching and quenching will affect the signal. While the dyes bind preferentially to dsDNA, RNA and nucleotides may contribute to the signal.
Figure (4.10). Single tube flourometer from Promega – USA, which has the following specifications; Description: QuantiFluor™ Fluorometers are affordable, sensitive, and designed for quick, easy and accurate fluorescence measurements. Both instruments provide high sensitivity for fluorescence measurements and are so easy to use that you can have results within minutes. Single-point calibration saves time, and a dual-channel design allows you to switch between two assays with the touch of a button. The QuantiFluor™-ST is a lab-ready instrument with two fluorescence channels built in: UV and Blue. The QuantiFluor™-P is a portable, battery-operated instrument with the option of either a UV/Blue configuration or Blue/Green configuration. Features: • Easy to Use: Both QuantiFluor™ Fluorometers are designed for fast, accurate fluorescence measurements. They are so easy to use you will have results with only a few button selections. • Small and Sensibly Priced: QuantiFluor™ Fluorometers are smaller than a standard-sized book, saving bench space. They are sensibly priced to meet the needs for accurate fluorescence measurements on a limited budget.

CHAPTER FOUR
99
4. Luminometer based method
The fourth method is a Promega product called the DNA Quantitation
System. To measure DNA mass, a luminometer is required for light detection (figure 4.11). When using the DNA Quantitation System, a light signal is produced in proportion to the amount of linear dsDNA present in a sample. The number of Relative Light Units (RLU) produced is compared to a standard curve each time a sample or samples are measured, giving the mass of DNA as the final calculation.
The detection/quantitation of DNA using the DNA Quantitation System
requires: 1) the activity of coupled enzymatic reactions to produce an amount of ATP proportional to the amount of DNA present followed by; 2) the
generation of a light signal proportional to the amount of ATP using the ENLITEN® L/L Reagent. The first set of coupled reactions consists of a pyrophosphorylation and transphosphorylation (pyro/transphosphorylation) reaction. The pyrophosphorylation reaction is the reverse of the DNA polymerization reaction (see Deutscher and Kornberg, 1969) and is catalyzed by T4 DNA Polymerase. In the presence of pyrophosphate and dsDNA, deoxynucleotide triphosphates (dNTPs) are released from the 3´ termini of the DNA strands. The transphosphorylation reaction is catalyzed by the enzyme Nucleoside Diphosphate Kinase (NDPK). In this reaction, the terminal phosphate of the dNTP is transferred to ADP to form ATP. Thus, the ATP formed is proportional to the amount of dsDNA added to the reaction. In order to generate light, the ENLITEN® L/L Reagent requires ATP. Thus, the amount of ATP determines the brightness of the light signal, which in turn indicates how much DNA was present in the sample.
While the DNA Quantitation System method is sensitive (i.e., able to
detect picogram amounts of DNA) and more accurate than spectrophotometry and agarose gel analyses, the DNA analyzed can only be linear and double-stranded with fragments in the range of 20–6,000bp. Therefore, chromosomal DNA will need to be digested by restriction enzymes prior to quantitation. The total amount of DNA used for analysis must be between 10–500pg/µl and no more than 2µl DNA sample used for detection. If the DNA concentration is greater, the sample must be diluted. The linear range of the DNA Quantitation System is 20pg to 1ng. Single-stranded DNA, if present, does not generate a signal unless a dimer or hairpin structure is formed. Since the assay is based on the amount of ATP present, care should be taken with the DNA samples. They should not contain dNTPs or NTPs, which can help form ATP, nor ATPase activity, which can decrease the light signal and cause a false low reading. Unlike absorbance methods, the DNA Quantitation System is not affected by protein contamination.

CHAPTER FOUR
100
Figure (4.11). Luminometer (GloMax® 96 Microplate Luminometer) from Promega – USA, which has the following describtions (The GloMax® 96 Microplate Luminometer combines instrumentation and software in a complete solution that includes bioluminescent assays, protocols and support. The GloMax® 96 is a state-of-the-art microplate luminometer that meets the need for high sensitivity and broad dynamic range for all luminescence applications. Available with up to two reagent injectors, the GloMax® 96 Microplate Luminometer is a versatile system designed to perform both flash- and glow-type luminescence assays. The GloMax® 96 Microplate Luminometer also includes a power cable, data cable, Quick Protocol card, 5 white 96-well microplates, and software required to operate the instrument. This instrument requires the use of a computer with Microsoft® Excel®. The GloMax® 96 Microplate Luminometer provides superior sensitivity and precision for all luminescent assays. Proprietary circuitry and an advanced photon-counting photomultiplier tube (PMT) provide unmatched signal-to-noise ratios. The option of an intelligently designed internal auto-injection system is an added convenience. Connections, priming and flushing are greatly simplified because up to two reagent injectors are designed to fit next to the plate detection module. This arrangement minimizes dispensing problems, simplifies maintenance and reduces service calls. The dispensing design also includes features that help the user save valuable time and reagents, including an open architecture that enables the user to inspect all tubing and tips during operation.
Choosing which quantitation method to use is based on many factors
including access to equipment or reagents, reliability and consistency of the concentration calculations. Use caution when comparing yields between methods as the level of potential contaminants may cause variable determinations among the different methods.
Quantification of RNA
RNA is accurately quantified by measuring its absorbance in a spectrophotometer. The OD of RNA is measured at its maximum absorbance wavelength of 260 nm. One OD unit is equivalent to 40 ug/ml of RNA. Typically, a small aliquot of a RNA sample is used for quantification and then discarded. Use a dilution of the RNA sample which will give an OD value of between 0.1 and 0.5 (2-10 ug in a 0.5-ml cuvette). In cases where only small amounts of RNA are being assessed, it may be more appropriate to save the RNA after OD determination. In this case, set aside a cuvette which will only be used for nucleic acid (preferably only RNA) quantification. Before use, fill

CHAPTER FOUR
101
the cuvette with freshly prepared 0.1% DEPC in water and incubate at least 10 min at 37°C, followed by three rinses with ribonuclease-free water.
Contamination of RNA preparations with substantial amounts of protein is demonstrated by measuring the OD at a wavelength of 280 nm, as proteins typically have a maximum absorbance at this wavelength. A 260-280 nm absorbance ratio of 1.8-2.0 is appropriate for pure RNA. Contaminating protein will result in lower values of the ratio (values below 1.6 indicate serious protein contamination). Significant quantities of DNA are rarely present in RNA preparations made by the methods described in this chapter. However, if DNA contamination is suspected (for example, if the sample is extremely viscous and 'stringy') this can be assessed by electrophoresing the sample on a denaturing agarose gel and staining with ethidium bromide, as described in Chapter 4. DNA cannot be distinguished from RNA by spectrophotometry since both exhibit a maximum absorbance at a wavelength of 260 nm. Once the DNA specimen is pure enough for molecular biological purposes, it's now suitable possible to undertake further molecular experiments on this specimen. Further readings
Al-Shuhaib M, Al-Saady A., Mahanem N. Study of rabbits transgenesis efficiency by sperm mediated gene transfer technique. PhD thesis presented to college of science, university of Babylon, 2011. Bradford , M.M. 1976. A rapid and sensitive method for the quantitation of microgram quantities of protein utilizing the principle of protein-dye binding. Anal. Biochem. 72:248-254. Cesarone, C.F., Bolognesi, C., and Santi, L. 1979. Improved microfluorometric DNA determination in biological material using 33258 Hoechst. Anal. Biochem. 100:188-197. Daxhelet, G.A., Coene, M.M., Hoet, P.P., and Cocito, C.G. 1989. Spectrofluorometry of dyes with DNAs of different base composition and conformation. Anal. Biochem. 179:401-403. Gallagher, S.R. and Desjardins, P.R. 2006. Quantitation of DNA and RNA with absorption and fluorescence spectroscopy. Curr. Protoc. Mol. Biol. 76:A.3D.1-A.3D.21. Grimsley, G.R. and Pace, C.N. 2003. Spectrophotometric determination of protein concentration. Curr. Protoc. Protein Sci. 33:3.1.1-3.1.9. Groves,W.E., Davis, F.C., Jr., and Sells, B.H. 1968. Spectrophotometric determination of microgram quantities of protein without nucleic acid interference. Anal. Biochem. 22:195-210. Jones, L.J., Haugland, R.P., and Singer, V.L. 2003. Development and characterization of the NanoOrange protein quantitation assay: A fluorescence-based assay of proteins in solution. BioTechniques 34:850-858. Labarca, C. and Paigen, K. 1980. A simple, rapid, and sensitive DNA assay procedure. Anal. Biochem. 102:344-352. Layne, E. 1957. Spectrophotometric and turbidimetric methods for measuring proteins. Methods Enzymol. 3:447-454. Le Pecq, J.-B. 1971. Use of ethidium bromide for separation and determination of nucleic acids of various conformational forms and measurement of their associated enzymes. In Methods of Biochemical Analysis, Vol. 20 (D. Glick, ed.) pp. 41-86. John Wiley & Sons, New York. Marmur , J. and Doty, P. 1962. Determination of the base composition of deoxyribonucleic acid from its thermal denaturation temperature. J. Molec. Biol. 5:109-118. Micklos D. A., and Freyer G. A. DNA Science: A First Course in Recombinant DNA Technology. Cold Spring Harbor Laboratory Press. 1990. Neidle, S. DNA minor-groove recognition by small molecules. 2001. Nat. Prod. Rep. 18:291-309. Olson, B.J.S.C. and Markwell, J. 2007. Assays for determination of protein concentration. Curr. Protoc. Protein Sci. 48:3.4.1-3.4.29.

CHAPTER FOUR
102
Olson, B.J., and Klenk, D.C. 1985. Measurement of protein using bicinchoninic acid. Anal. Biochem. 150:76-85. Peterson, G.L. 1977. A simplification of the protein assay method of Lowry et al. which is more generally applicable. Anal. Biochem. 83:346-356. Peterson, G.L. 1983. Determination of total protein. Methods Enzymol. 91:95-119. Portugal, J. andWaring, M.J. 1988. Assignment ofDNAbinding sites for 4_,6-diamidine-2-phenylindole and bisbenzimide (Hoechst 33258): A comparative footprinting study. Biochem. Biophys. Acta 949:158-168. Samuels, A.C., DeLucia, F.C., Jr., McNesby, K.L., and Miziolek, A.J. 2003. Laser-induced breakdown spectroscopy of bacterial spores, molds, pollens, and protein: Initial studies of discrimination potential. Applied Optics 42:6205-6209. Sapan, C.V., Lundblad, R.L., and Price, N.C. 1999. Colorimetric protein assay techniques. Biotechnol. Appl. Biochem. 29:99-108. Scopes, R.K. 1974. Measurement of protein by spectrophotometry at 205 nm. Anal. Biochem. 59:277-282. Smith, P.K., Krohn, R.I., Hermanson, G.T.,Mallia, A.K., Gartner, F.H., Provenzano, M.D., Fujimoto, E.K., Goeke, N.M., Stoscheck, C.M. 1990. Quantitation of protein. Methods Enzymol. 182:50-68. Stout, D.L. and Becker, F.F. 1982. Fluorometric quantitation of single-stranded DNA: A method applicable to the technique of alkaline elution. Anal. Biochem. 127:302-307. Struhl , K. 1993. Reagents and radioisotopes used to manipulate nucleic acids. Curr. Protoc. Mol. Biol. 9:3.4.1-3.4.11. Van Lancker, M. and Gheyssens, L.C. 1986. A comparison of four frequently used assays for quantitative determination of DNA. Anal. Lett. 19:615-623. Voet, D., Gratzer, W.B., Cox, R.A., and Doty, P. 1963. Absorption spectra of nucleotides, polynucleotides, and nucleic acids in the far ultraviolet. Biopolymers 1:193–208. Wallace, R.B. and Miyada, C.G. 1987. Oligonucleotide probes for the screening of recombinant DNA libraries. In Methods of Enzymology, Vol. 152: Guide to Molecular Cloning Techniques (S.L. Berger and A.R. Kimmel, eds.) pp. 432-442. Academic Press, San Diego. Warburg , O. and Christian, W. 1941. Biochem. Z. 310-384. Wilfinger , W.W., Mackey, K., and Chomczynski, P. 1997. Effect of pH and ionic strength on the spectrophotometric assessment of nucleic acid purity. Biotechniques 22:474-476.