Experimental and Analytical - CORE
90
NASA Technical Paper 1953 December 1981 Experimental and Analytical Investigation of Axisymmetri Supersonic Cruise Nozzle Geometry at Mach Numbers . . . NASA TP i 1953 I 1 From 0.60 to 1.30 George T. Carson, Jr., and Edwin E. Lee, Jr. https://ntrs.nasa.gov/search.jsp?R=19820006179 2020-03-21T10:11:07+00:00Z
-
Upload
khangminh22 -
Category
Documents
-
view
1 -
download
0
Transcript of Experimental and Analytical - CORE

NASA Technical Paper 1953
December 1981
Experimental and Analytical Investigation of Axisymmetri Supersonic Cruise Nozzle Geometry at Mach Numbers
. . .
NASA TP i 1953 I
1
From 0.60 to 1.30
George T. Carson, Jr., and Edwin E. Lee, Jr.
https://ntrs.nasa.gov/search.jsp?R=19820006179 2020-03-21T10:11:07+00:00Z

I
NASA Technical Paper 1953
1981
Natlonal Aeronautlcs and Space Adrnlnlstration
Scientific and Technical Information Branch
TECH LIBRARY KAFB, NM
00b7b43
Experimental and Analytical Investigation of Axisymmetric Supersonic Cruise Nozzle Geometry at Mach Numbers From 0.60 to 1.30
George T. Carson, Jr., and Edwin E. Lee, Jr. Langley Research Center Hampton, Virginia

SUMMARY
A n experimental investigation has been conducted which provides quantitative pressure and force data for five axisymmetric boattail nozzle configurations. These configurations simulate the variable-geometry feature of a single nozzle design oper- ating over a range of engine operating conditions. This investigation was performed at an angle of attack of Oo in the Langley l6-~oot Transonic Tunnel at Mach numbers from 0.60 to 1.30. The experimental data and theoretical predictions, provided by computational fluid-dynamics programs, were compared and found to be in generally good agreement.
INTRODUCTION
A supersonic cruise aircraft must be capable of operation over a wide altitude- velocity flight envelope, which includes such diversities as subsonic take-off and landing, subsonic cruise, climb and loiter, and supersonic cruise. In addition, maneuver requirements may be added for military aircraft. Obviously, current engine concepts cannot be optimized over such a broad range of requirements. One proposed solution for these diverse requirements is the variable-cycle engine (VCE) which incorporates a variable-engine geometry and combustion arrangement in order to oper- ate as a turbofan, an afterburning turbojet, a duct-burning turbofan, or an inter- mediate hybrid combination as required by any particular mission segment. Mission requirements, development concepts, and preliminary designs of the VCE may be found in references 1 to 8.
The purpose of the current investigation was to provide quantitative pressure and force data for an axisymmetric variable-geometry nozzle which is applicable for use in the design of the engine for a supersonic cruise aircraft. This was accom- plished by testing five nozzles in the Langley 16-Foot Transonic Tunnel, which represent the variable-geometry feature of a single, convergent-divergent nozzle design over a range of engine operating conditions. Tests were conducted at nozzle pressure ratios from jet off to about 10 at free-stream Mach numbers from 0.60 to 1.30. The experimental data were compared with theoretical predictions in order to help verify several existing computational fluid-dynamics programs.
SYMBOLS
AC
%l
At % A
B
increment of model cross-sectional area at metric break station 67.31 cm, m2
nozzle exit area, m 2
maximum cross-sectional area of model, 182.4 15 cm2
nozzle geometric throat area, m 2
surface wetted area, m
increment of axially projected boattail area, m 2
2

'D,f
C
b o a t t a i l f r i c t i o n - d r a g c o e f f i c i e n t (see s e c t i o n e n t i t l e d "Data Reduction")
boa t ta i l p ressure-drag coef f ic ien t (see s e c t i o n e n t i t l e d "Data Reduction") D, B
'F,i aerodynamic i d e a l t h r u s t c o e f f i c i e n t , Fi/qmAm
C PB - Pm
q m PI B b o a t t a i l p r e s s u r e c o e f f i c i e n t ,
Df , cy1 f r i c t ion d rag on cy l ind r i ca l po r t ion of model between s t a t i o n s 67.31 c m and 137.16 cm, N
Dn
de nozzle-exit diameter, c m
nozzle total drag, N
4n model maximum diameter, 15.240 c m
dt nozzle geometric throat diameter, cm
F t h r u s t , N
FA,mom axial-momentum t a re fo rce , N
Fba 1 ax ia l fo rce measured by balance, posit ive forward, N
Fi idea l i s en t rop ic gross t h r u s t , N
g ros s t h rus t , mV, + (pe - pm)A,, N F j
1 axia l l ength of b o a t t a i l , cm
IC axia l l ength of nozzle convergent section, c m
I D
MCn free-stream Mach number
ax ia l l ength of nozzle divergent section, cm
m nozzle measured mass-flow rate, kg/sec
mi nozzle ideal mass-flow rate, kg/sec
NRe Reynolds number
P l o c a l s t a t i c p r e s s u r e , Pa
PC loca l s t a t i c p re s su re i n t he me t r i c b reak , Pa
Pe average s ta t ic p ressure in the nozz le-ex i t p lane , Pa
Pt, j je t t o t a l p r e s s u r e , Pa
2

(P t , j / p m ) d e s design nozzle pressure ra t io for ideal ly expanded exhaust flow
l o c a l s t a t i c p r e s s u r e on t h e b o a t t a i l , Pa
f r ee - s t r eam s t a t i c p re s su re , Pa
free-stream dynamic pressure, Pa
gas cons tan t for a i r , 287.3 J/kg-K
l o c a l r a d i a l d i s t a n c e from model center l ine , cm
model maximum radius , 7.62 cm
j e t total temperature , K
average ax ia l ve loc i ty in nozz le-ex i t p lane , m/sec
ax ia l coord ina te wi th o r ig in one model diameter upstream of the nozzle exit (posit ive downstream), cm
nozzle boat ta i l angle , deg
r a t i o of s p e c i f i c h e a t s , 1.3997 f o r a i r
nozzle divergence angle (downstream of throa t ) , deg
nozzle convergence angle (upstream of th roa t ) , deg
Abbreviations:
A/B af te rburn ing
J/O je t -off condi t ion
APPARATUS AND PROCEDURE
Wind Tunnel
The experimental invest igat ion was conducted i n t h e Langley 16-Foot Transonic Tunnel. This f a c i l i t y is a single-return, continuous-flow, exchange-air-cooled, atmospheric wind tunnel with an octagonal s lot ted- throat tes t sec t ion . It has a con- t inuous ly var iab le Mach number range from 0.20 t o 1.30. A detailed descr ip t ion of t h i s wind tunnel is given in reference 9.
Models
A set of f ive nozzle models w a s used to s imula te the range of geometric s e t t i n g s of a variable-geometry axisymmetric nozzle applicable for supersonic cruise a i r c r a f t . A photograph of nozzle configuration 5 i n s t a l l e d i n t h e test sec t ion of t he Langley 16-Foot Transonic Tunnel is shown i n f i g u r e 1. Figure 2 dep ic t s t he general arrangement of t he i so l a t ed nace l l e model and support system. The f i v e
3

nozzle conf igura t ions t es ted are shown i n t h e photograph i n f i g u r e 3. The simulated f l i g h t segment, simulated power se t t ing , des ign nozz le p ressure ra t io , and design dimensions are presented in f igure 4.
Jet-Exhaust Simulation
For jet-exhaust simulation, an external high-pressure a i r system provided a continuous flow of clean, dry air a t a maximum pressure of 724 kPa and a cont ro l led temperature of nominally 300 K ahead of the nozz le th roa t . As shown i n f i g u r e 2 , th is high-pressure a i r w a s brought through the support st ing and s t r u t i n t o a high- pressure plenum and w a s then introduced, through eight sonic nozzles, radially into the met r ic por t ion of t h e model t o e l i m i n a t e incoming a x i a l momentum. Two f l e x i b l e metal bellows provided an a i r s e a l between the metric and nonmetric portions of the nacel le . Final ly , the a i r traveled through f low-smoothing screens into a s tagnat ion chamber and expanded through the nozzle configuration being tested.
Instrumentation
Metric model forces and moments (exc luding ro l l ing moment) were measured by a five-component strain-gage balance. J e t t o t a l pressure and total temperature were measured by probes mounted i n t h e m e t r i c t a i l p i p e as shown i n f i g u r e 2. A l s o , there w a s a row of i n t e r n a l s t a t i c - p r e s s u r e o r i f i c e s from the nozzle entrance t o t h e e x i t plane, and there was a row of ex te rna l s t a t i c -p res su re o r i f i ce s s t a r t i ng j u s t fo rward of the nozz le boa t ta i l to the ex i t p lane . The loca t ions of t h e i n t e r n a l and ex terna l p r e s s u r e o r i f i c e s are given i n t a b l e I. The pressure and temperature of t h e i n t e r n a l a i r f low were a l s o measured in the high-pressure plenum loca ted i n t he model forebody. (See f ig . 2 . ) S t a t i c p r e s s u r e s i n t h e gap a t the met r ic b reak ( s ta t ion 67.31 c m ) were obtained from 10 o r i f i c e s d i s t r i b u t e d o v e r t h e model c ross -sec t iona l area.
Tests
In accordance wi th the c r i te r ia of references 10 and 11, a boundary-layer tran- s i t i o n s t r i p , 0.25 c m w i d e cons is t ing of No. 100 s i l i c o n c a r b i d e g r i t s p a r s e l y d i s - t r i b u t e d i n a lacquer f i lm, w a s appl ied 2.54 cm downstream of t he nose. Angle of a t t ack w a s h e l d a t z e r o f o r a l l t e s t s . Each nozzle configuration was tested a t Mach numbers of 0.60, 0.80, 0.90, 0.94, 1.20, and nominally 1.30. The average Reynolds number per meter varied from 10.43 X 1 O6 a t a Mach number of 0.60 t o 13.20 X 1 O6 a t a Mach number of 1.30. Nozzle pressure ratio w a s var ied from jet off to approximately 10 depending on t h e f ree-stream Mach number.
Data Reduction
All data for both the model and wind-tunnel f a c i l i t y were recorded simulta- neously on magnetic tape. The recorded data were used t o compute standard force and pressure coef f ic ien ts . A l l f o r c e c o e f f i c i e n t s i n t h i s r e p o r t a r e r e f e r e n c e d t o t h e model maximum cross-sect ional area.
Nozzle boattail pressure drag was obta ined dur ing th i s test from pressures measured along the top of t he boa t t a i l ( s ee t ab l e I) by assigning an incremental , ax i a l ly p ro j ec t ed area t o each or i f ice and using the s tepwise summation equation
4

where n is the number of o r i f i c e s i n t h e e x t e r n a l row. To check these r e su l t s , a number of cont inuous dis t r ibut ions of with (r/rmI2 w e r e manually in t eg ra t ed by planimeter and gave essentially the same drag values as equation (1). Pressure forces on the small base a t the nozz le ex i t are considered negligible and are not i nc luded i n t he boattail drag computation.
cP, B
Aerodynamic sk in- f r ic t ion d rag coef f ic ien ts were computed from t h e f l a t - plate formula for turbulent , compressible boundary layer given in reference 12.
A t each test poin t , CD, was ca l cu la t ed fo r Reynolds number NRe and wetted areas
(1) nose t o e x i t , (2) nose t o t h e upstream end of the b o a t t a i l a t s t a t i o n 137.16 cm, and (3) nose t o metric-break station 67.31 cm. The di f fe rence between ca l cu la t ions (1) and (2) provided the es t imated skin-fr ic t ion drag of t h e b o a t t a i l s ; and the dif- ference between ca l cu la t ions (2) and (3) was used t o o b t a i n t h e f r i c t i o n d r a g f o r c e on t h e c y l i n d r i c a l p a r t of t he metric afterbody Df,cyl. A s shown l a t e r , Df,cyl w a s used to cor rec t the ba lance da ta .
corresponding t o th ree d i f f e ren t cha rac t e r i s t i c l eng ths on t h e m o d e l ( f i g . 2):
Actual mass-flow rates use6 t o compute d ischarge coef f ic ien ts &/& and ideal t h r u s t f o r t h e test nozzles w e r e measured by the system of e ight rad ia l nozz les supplying a i r t o t h e metric afterbody. This required a p r e t e s t c a l i b r a t i o n of t h e internal-flow system which w i l l be discussed subsequently. The i d e a l mass-flow rates f o r t h e test conf igura t ions were computed from stagnat ion pressure and temperatures measured i n t h e t a i l p i p e by us ing the choked-flow equation
i
I d e a l t h r u s t , d e f i n e d as the product of measured mass flow and the ideal isen- t rop ic ve loc i ty , was obtained from t h e r e l a t i o n

Since the model strain-gage balance (fig. 2 ) measures the sum of pressure and viscous forces on the en t i r e me t r i c a f t e rbody (model p o r t i o n s a f t of s t a t i o n 67.31 c m ) , a number of cor rec t ions must be applied t o t h e raw-balance data i n order t o i s o l a t e t h e sum of ex te rna l and i n t e r n a l f o r c e s on the nozzle alone. Nozzle gross thrust-minus-drag performance w a s computed from the r e l a t ionsh ip
1 0
In equat ion (5 ) t h e term Fbal r ep resen t s t he raw-balance output corrected for i n t e rac t ions and model weight tares. The pressure-area term c o r r e c t s f o r t h e f o r c e on the f ron t f ace of the metric afterbody caused by d i f fe rences between the cav i ty pressure pc in the metr ic break and free-s t ream pressure pco. Even though experi- ence with this model has shown c a v i t y p r e s s u r e s t o be extremely uniform, 10 o r i f i c e s were used i n t h e s e tests t o determine this balance-correction term. A s ind ica ted previously, the term Df,cyl is t h e f r i c t i o n d r a g on t h e c y l i n d r i c a l s e c t i o n of the metric afterbody, which must be r e s to red t o t he ba l ance r ead ing s ince t h i s fo rce is not associated with the nozzle. The t e r m FA,mOm c o r r e c t s f o r a x i a l momentum and bellows tare forces caused by the high-pressure a i r flowing from the nonmetric high- pressure plenum in to t he me t r i c tai lpipe through the eight small inject ion nozzles . (See f i g . 2 . ) Although t h e a i r is i n j e c t e d r a d i a l l y and t h e f l e x i b l e s e a l s (metal bellows) are p l aced i n tandem i n an e f f o r t t o eliminate such tares, small forces do a r i s e i n p r a c t i c e and must be taken into account . In the present invest igat ion these forces were general ly less than 2 percent of ideal t h r u s t .
Axial-momentum t a r e s were evaluated by s t a t i c a l l y (Ma = 0) t e s t i n g s e v e r a l "standard" exhaust nozzles over the range of supply pressures, mass-flow r a t e s , and th roa t areas required by t h e f i v e test nozzles. The "standard" nozzles were i n t e r - nally convergent, with a c i r c u l a r - a r c l o n g i t u d i n a l p r o f i l e t a n g e n t t o t h e a x i a l d i r ec t ion a t t h e e x i t , and had a p r o f i l e a r c r a d i u s e q u a l t o twice t h e e x i t diameter. (See re f . 13.) The cor rec t va lues of F./Fi and A/Ai as funct ions of nozz le p re s su re r a t io have been wel l es tabl ished for these "s tandard" nozzles from previous tests and were used t o p r e d i c t g r o s s t h r u s t f o r comparison with the balance measurements. Any force d i f fe rence , o r momentum tare, w a s computed from equation ( 5 ) , which f o r s t a t i c c o n d i t i o n s became simply
I
F = F - F ( 6 ) A,mom b a l j
Resul t ing tare forces were co r re l a t ed as a funct ion of pressure measured i n t h e high- pressure plenum i n t h e model nose, thus providing a c a l i b r a t i o n from which t a r e s were computed for the tes t -nozzle data .
Internal-flow measurements taken during the aforementioned tare calibrations were a l so used to compute d ischarge coef f ic ien ts for the sys tem of e igh t radial nozzles supplying a i r t o t h e tailpipe. The a c t u a l mass-flow rates were those measured by the "s tandard" nozzles instal led a t the rear of t he model. e ight a i r -supply nozzles w e r e choked a t a l l t e s t cond i t ions , t he i dea l r a t e s were computed from equat ion (3) , by u s i n g t h e t o t a l t h r o a t area, high-pressure plenum measurements as s tagnat ion condi t ions . Resul t ing coe f f i c i en t s were then plotted aga ins t plenum pressure, thus providing
Since the mass-f low and from t h e discharge a c a l i b r a t i o n
6
of the air-supply system as a sonic flow meter. This calibration, and measurements taken in the high-pressure plenum, were later used to measure airflow when investi- gating the five test nozzle configurations.
Following the aforementioned calibrations, the five test nozzles were investi- gated at static (M, = 0) conditions, and equation (6) was used to compute gross thrust. Wind-on gross thrust was also computed by using the wind-tunnel data and combining results of equations ( 1 ) , (2) , ( 4 ) , and (5) in the equation
where CF,i is the aerodynamic ideal thrust coefficient, Fi/qJ+,,=
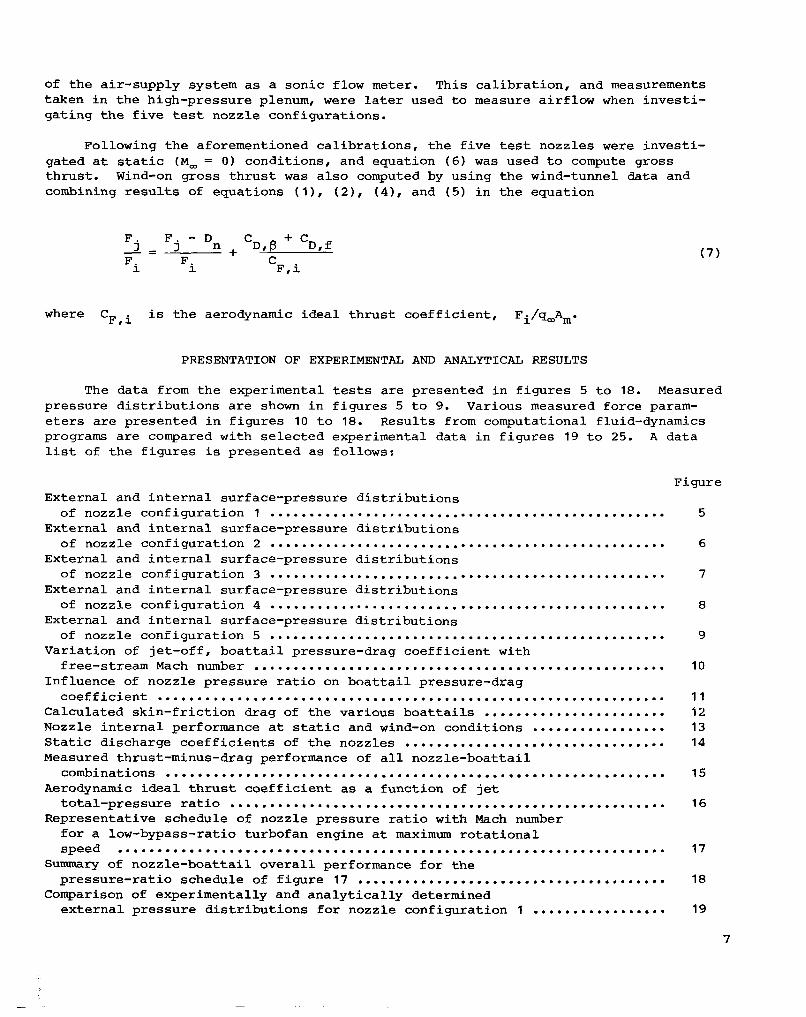
PRESENTATION OF EXPERIMENTAL! AND ANALYTICAL RESULTS
The data from the experimental tests are presented in figures 5 to 18. Measured pressure distributions are shown in figures 5 to 9. Various measured force param- eters are presented in figures 10 to 18. Results from computational fluid-dynamics programs are compared with selected experimental data in figures 19 to 25. A data list of the figures is presented as follows:
Figure External and internal surface-pressure distributions
External and internal surface-pressure distributions
External and internal surface-pressure distributions of nozzle configuration 3 .................................................. 7
External and internal surface-pressure distributions of nozzle configuration 4 .................................................. 8
External and internal surface-pressure distributions of nozzle configuration 5 .................................................. 9
Variation of jet-off, boattail pressure-drag coefficient with free-stream Mach number .................................................... 10
Influence of nozzle pressure ratio on boattail pressure-drag coefficient ................................................................ 11
Calculated skin-friction drag of the various boattails ....................... 52 Nozzle internal performance at static and wind-on conditions ................. 13 Static discharge coefficients of the nozzles ................................. 54 Measured thrust-minus-drag performance of all nozzle-boattail combinations ............................................................... 15
Aerodynamic ideal thrust coefficient as a function of jet total-pressure ratio ....................................................... 16
Representative schedule of nozzle pressure ratio with Mach number for a low-bypass-ratio turbofan engine at maximum rotational speed ..................................................................... 17
of nozzle configuration 1 .................................................. 5
of nozzle configuration 2 .................................................. 6
Summary of nozzle-boattail overall performance for the
Comparison of experimentally and analytically determined pressure-ratio schedule of figure 17 ....................................... 18
external pressure distributions €or nozzle configuration 1 ................. 19
7

Figure Comparison of experimentally and analytically determined external
Comparison of experimentally and analytically determined
Comparison of experimentally and analytically determined external
Comparison of experimentally and analytically determined external
Comparison of experimental ly and analyt ical ly determined internal
Comparison of experimental ly and analyt ical ly determined var ia t ion
pressure d i s t r ibu t ions for nozz le conf igura t ion 2 ......................... 20
externa l p ressure d i s t r ibu t ions for nozz le conf igura t ion 3 ................. 2 1
pressure d i s t r ibu t ions for nozz le conf igura t ion 4 ......................... 22
pressure d i s t r ibu t ions for nozz le conf igura t ion 5 ......................... 23
pres su re d i s t r ibu t ions .................................................... 24
of s t a t i c t h rus t coe f f i c i en t w i th nozz le p re s su re ra t io .................... 25
DISCUSSION OF EXPERIMENTAL RESULTS
Pressure Measurements
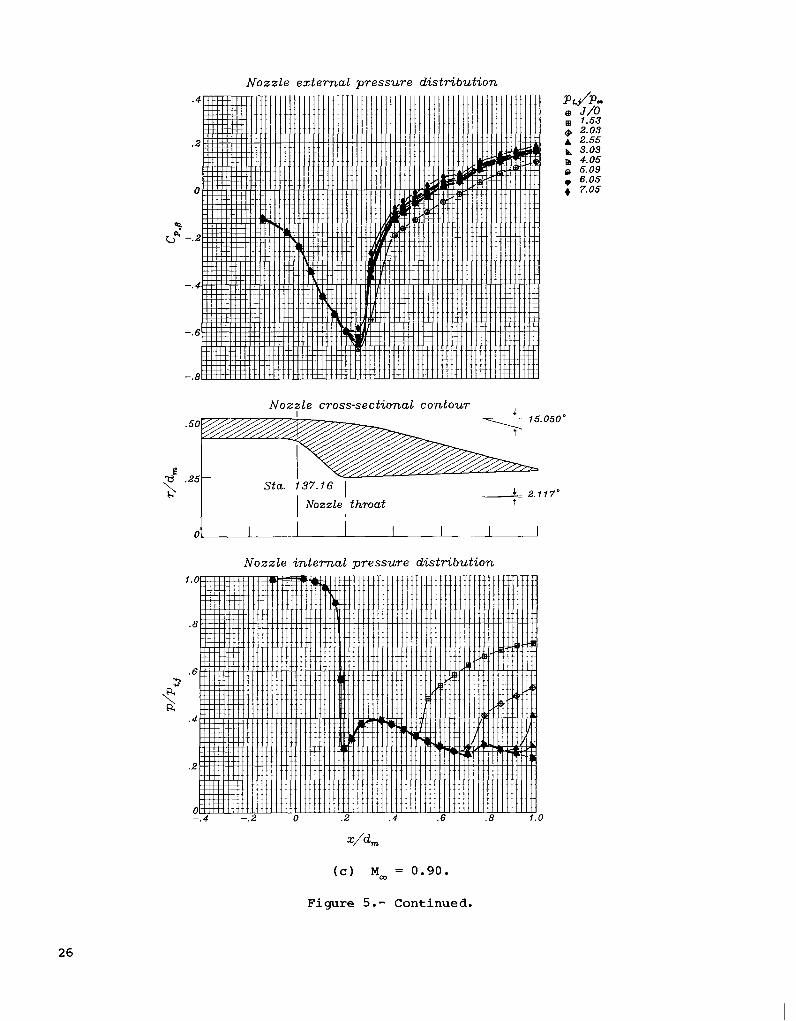
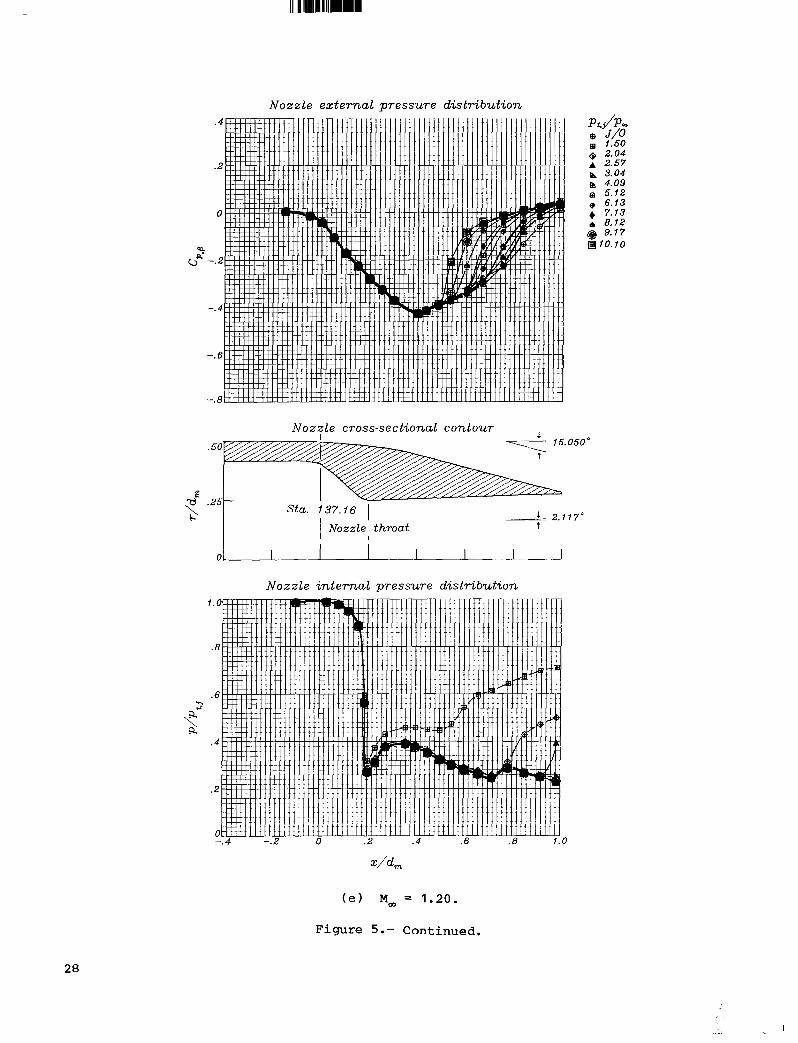
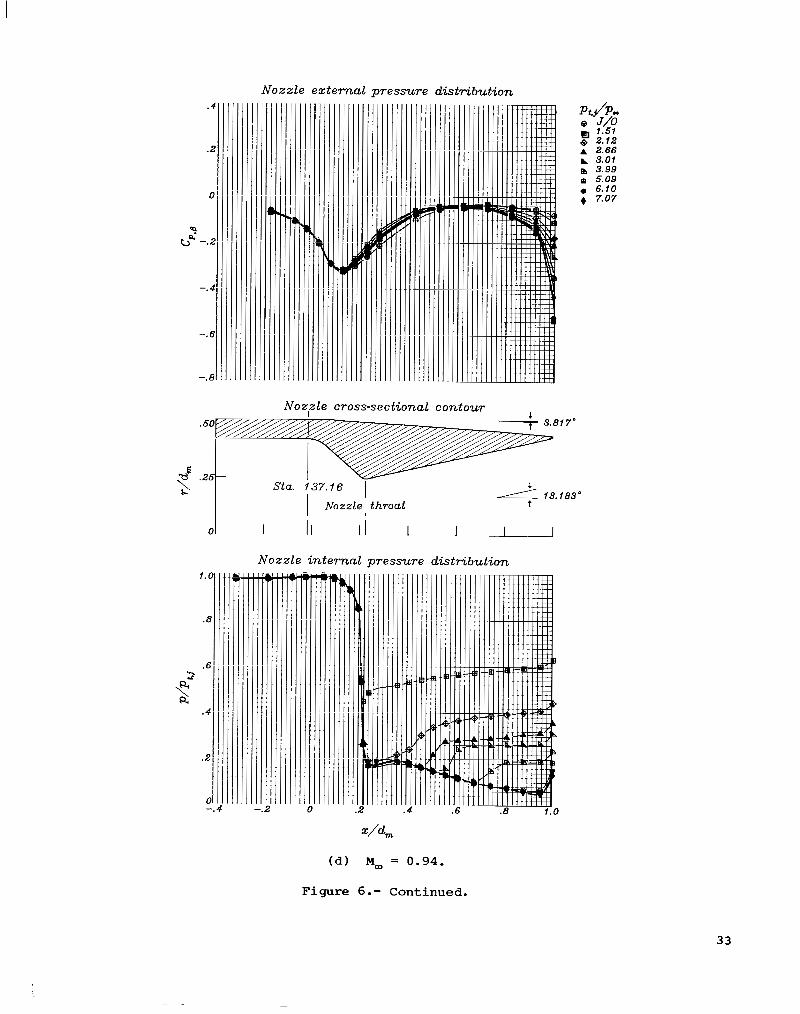
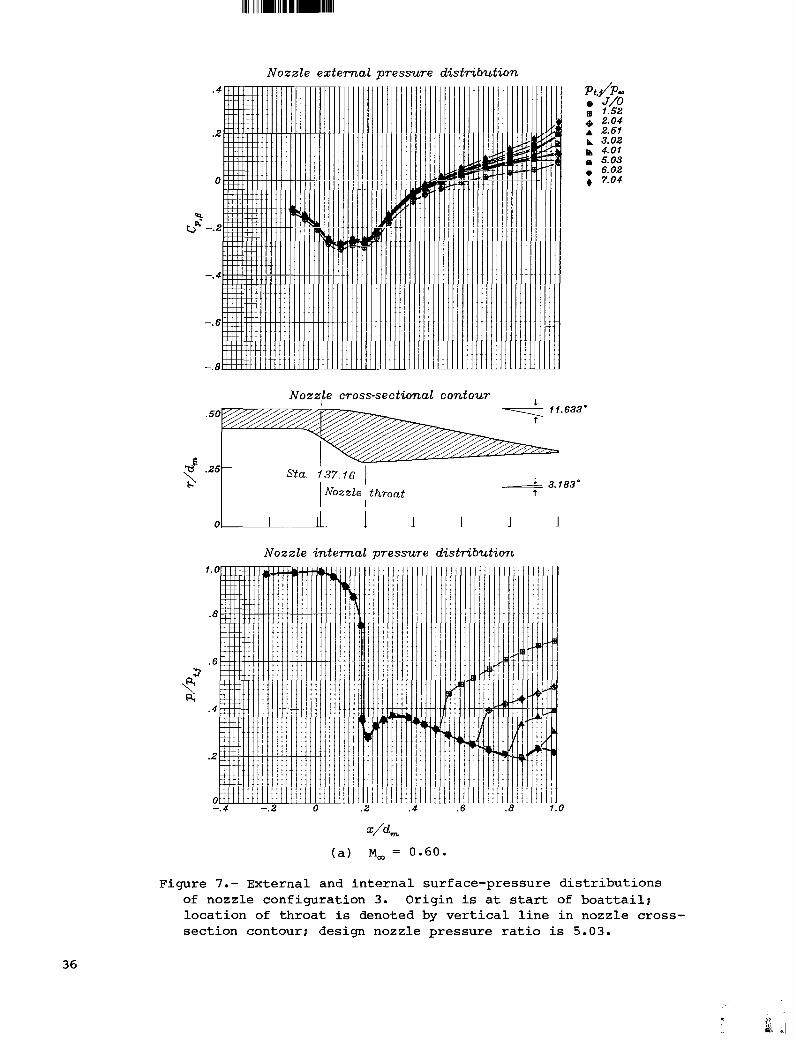
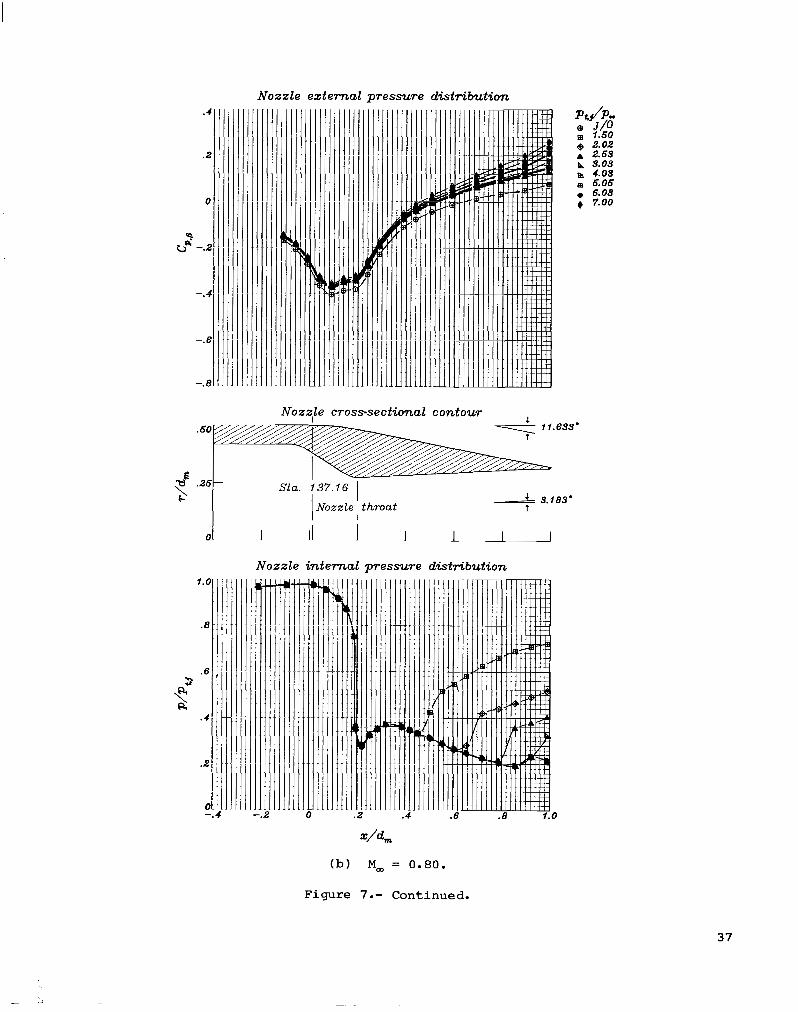
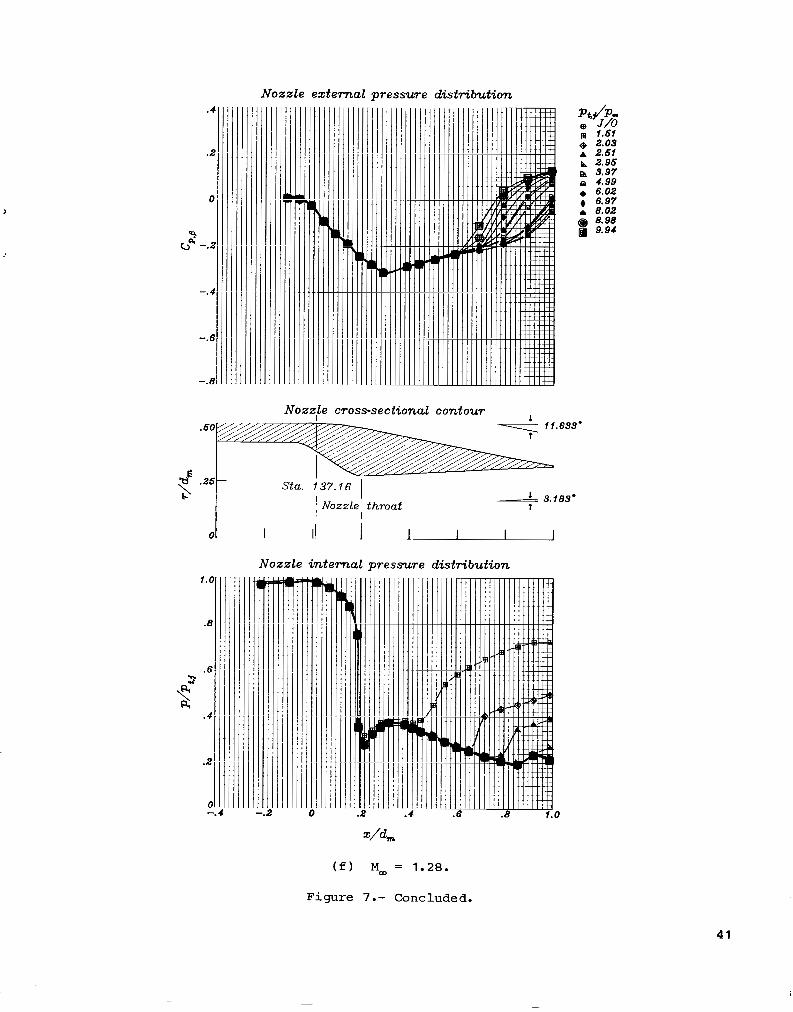
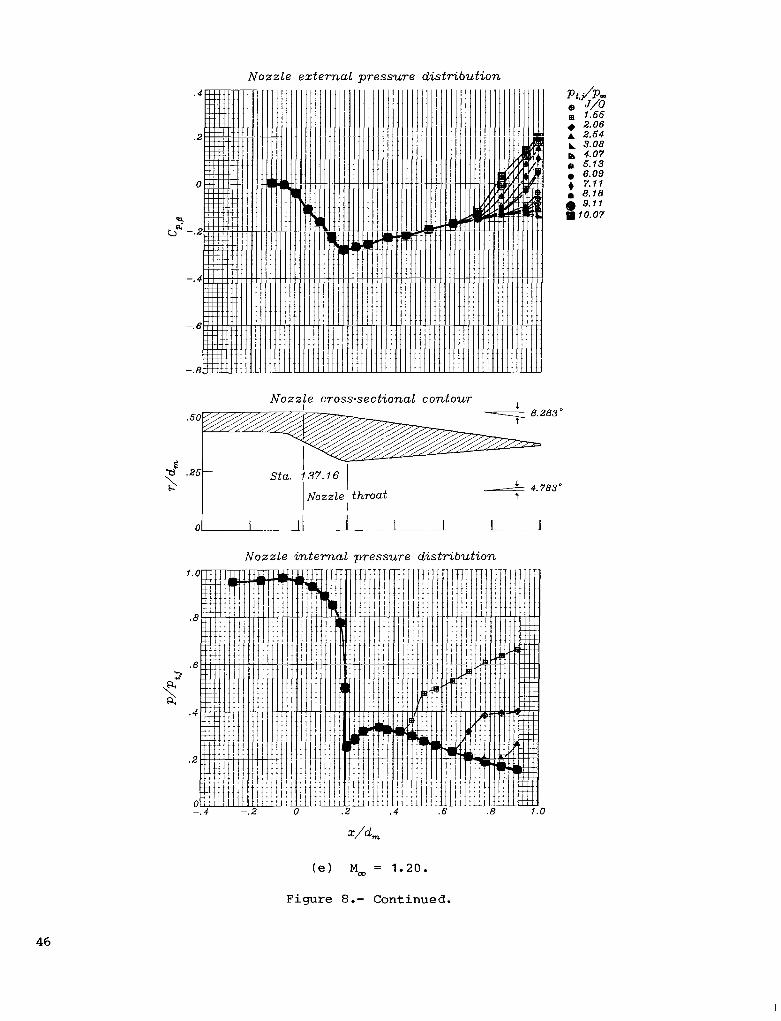
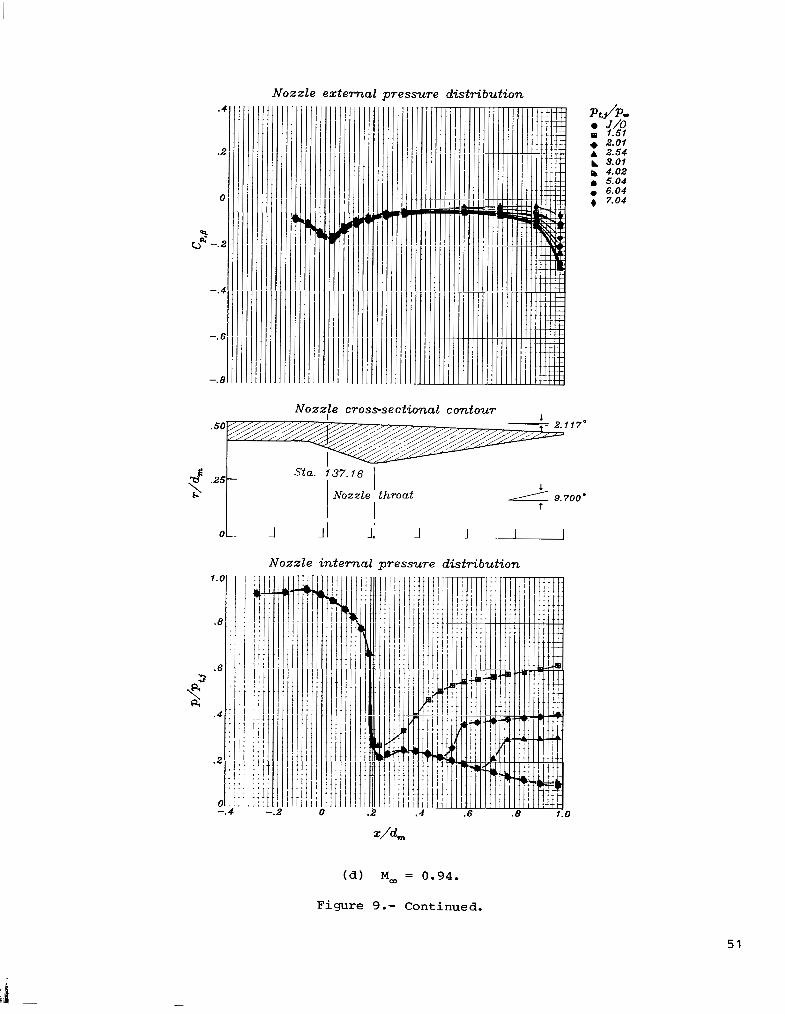
The ex te rna l and internal surface-pressure dis t r ibut ions are given for each of the f ive nozz le conf igura t ions in f igures 5 t o 9. The nozzle longi tudinal cross- section contour has been inc luded in each f igure to show t h e s t a r t i n g p o i n t ( s t a t i o n 137.16 cm) and angle of t h e boattail fo r t he ex t e rna l p re s su re d i s t r ibu t ions and t o show the t h roa t l oca t ion and divergence angle for the internal pressure dis t r ibu- t ions . The symbol J / O in the keys of f igu res 5 t o 9 denotes the jet-off condition and per ta ins to ex te rna l p ressures on ly .
External pressure ~- dis t r ibu t ions . - - . .~~ Je t opera t ion genera l ly had a f avorab le e f f ec t on the ex te rna l p ressure coef f ic ien ts for the nozz les wi th low expansion ra t ios (Ae/At = 1.25 t o 1.50) and large boat ta i l angles from 8O t o 15O (conf igura t ions 1, 3, and 4 ) . Resul t s for these conf igura t ions a t M, = 0.90 and 0.94 ( f o r example, s e e f i g . 5 ( c ) ) a l s o i n d i c a t e a s tanding shock wave loca ted between x/dm = 0.2 and 0.3, depending on configurat ion, M,, and P t , /Pa- Increasing pt ./pa t e n d s t o push the shock wave upstream, and external-flow separation occurs downstream of the shock wave for these conf igura t ions . A t supersonic speeds (see f ig . 5 (e ) 1, a t ra i l ing-edge shock occurs on the nozzle near the exi t . A s Pt, j/P, is increased, the t ra i l ing-edge shock is pushed upstream and large je t i n t e r f e r e n c e e f f e c t s are observed behind the shock. Jet ope ra t ion had l i t t l e o r no e f f e c t on the forward port ion of t he boa t t a i l p re s su re d i s t r ibu t ions a t supe r son ic speeds, because the downstream dis turbances can only feed forward through the subsonic boundary layer.
1 3
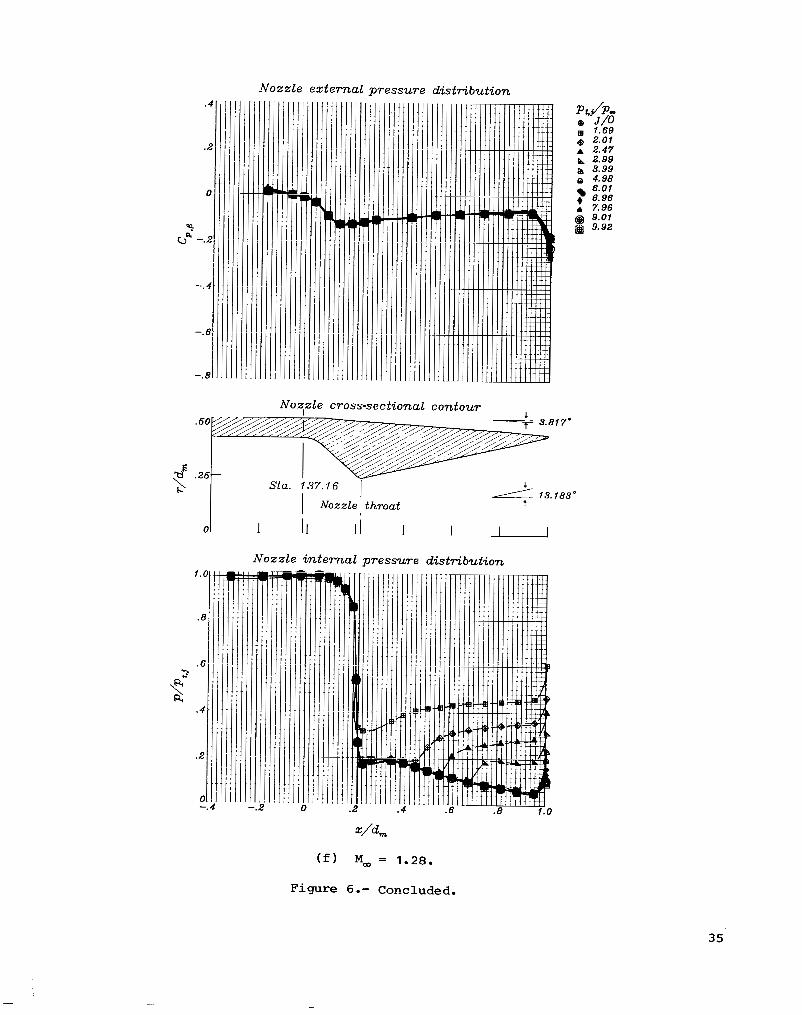
Separation of the external f low is shown t o be primarily dependent upon b o a t t a i l angle, because the data for configurations 2 and 5 with $ < 4 O showed no evidence of shock formation or flow separation a t any test condition. With increas ing pt j/p,, the boat ta i l surface pressures decrease general ly , indicat ing unfavorable jeg effects . This is at t r ibuted to s t rong turbulent mixing and entrainment in the v i c i n i t y of t h e e x i t r e s u l t i n g from overexpansion and separation of t h e j e t flow in te rna l ly . Je t - in te r fe rence e f fec ts ex tended w e l l forward on t h e b o a t t a i l s of con- f igu ra t ions 2 and 5 a t subsonic speeds, but they were confined t o t h e last pressure o r i f i c e j u s t ahead of t h e e x i t a t M, = 1.20 and 1.28. Thus, the expansion occurring along the rear of t h e b o a t t a i l a t subsonic speeds gradual ly concentrates into an expansion fan centered on the.nozzle-exi t l i p a t s u p e r s o n i c Mach numbers.
In t e rna l p re s su re d i s t r ibu t ions . - The r a t i o of s ta t ic p r e s s u r e t o t o t a l pres- s u r e m e a s u r e d a l o n g t h e i n s i d e s u r f a c e of the nozz les is shown a t t h e bottom of
8

f igu res 5 t o 9. Corresponding values for uniform, one-dimensional flow were computed from the t he gas t ab l e s of reference 14 fo r t he i n t e rna l l oca l - to - son ic area r a t i o s of configuration 1. These r e s u l t s a r e compared with the experimental data i n f i g - ure 5(a) and show that the axisymmetric flow overexpands noticeably a t t h e t h r o a t (x/% = 0 .2 ) . This is gene ra l ly cha rac t e r i s t i c of nozz les wi th re la t ive ly s teep convergent sections and "sharp" throats (small p ro f i l e r ad ius ) . P rev ious ana ly t i ca l studies, such as reference 15, have shown t h a t t h e flow tends t o "overturn" when passing around the throat prof i le . Therefore , the local f low angles re la t ive to the nozzle axis exceed the wall divergence angle in the region behind the throat near the w a l l . Compressive turn ing is then required t o match flow and w a l l angles , thus resu l t ing in the pos i t ive p ressure g rad ien t behind the th roa t ev ident in much of t he experimental data. Compression waves from th i s r eg ion coa le sce i n t he v i c in i ty of the nozz le ax is and tend to form an i n t e r n a l shock s u r f a c e t h a t e i t h e r i n t e r s e c t s t h e w a l l f u r the r downstream o r passes through the exit opening, depending on nozzle geometry. Evidence of the dis turbance reaching the w a l l can be seen i n f i g u r e 5 a t x/% = 0.7 and i n f i g u r e 7 a t "/dm = 0 85 (configurat ions 1 and 3, respec- t i v e l y ) . Notice t h a t t h e small pressure rise a t each of these locat ions appears only when the in te rna l f low is loca l ly a t tached; it is not , therefore , re la ted to separa- t i o n from overexpansion.
As the divergence angle increases, thereby increasing the f low area more rap id ly behind the throat , the w a l l s a r e b e t t e r a b l e t o accommodate the "overturning" of t h e flow. The w a l l pressure gradient leaving the throat decreases correspondingly, and the tendency of t h i s r e g i o n t o form internal shocks disappears. (For example, compare f ig s . 5 and 6. )
The i n t e r n a l p r e s s u r e d i s t r i b u t i o n s show shock-induced flow in t he d ive rgen t sec t ion of the nozz le for nozz le p ressure ra t ios s ign i f icant ly less than the design value. Increasing the divergence angle 6 of the nozzle not only increases the ax ia l ly p ro j ec t ed a r ea of the divergent sect ion but a lso moves the s epa ra t ion Loca- t ion forward a t a given M, and nozzle pressure ratio. The l a t t e r w a s pa r t i c - u l a r l y n o t i c e a b l e a s 6 var ied from 4.80 t o 13.2O (conf igura t ions 4, 5, and 2 ) , and t h i s e f f e c t may be seen by comparing corresponding parts of f i gu res 8, 9, and 6, i n t h a t o r d e r . Thus, increased divergence and extensive separation combine t o expose increas ing amounts of i n t e rna l su r f ace a r ea t o l oca l p re s su res su r round ing t he ex i t . This , in turn, causes the external f low to have s t ronge r e f f ec t s on the p ressure forces generated by the divergent sect ion.
The l a r g e s t e f f e c t s of M, on internal pressures occurred with configura- t i o n s 2 and 5, which w e r e t h e most extensively separated nozzles. Figures 6 and 9 show t h a t i n c r e a s i n g M, a t f ixed nozz le p ressure ra t io reduced the p ressure l eve l in the separa ted reg ion and tended t o move the separat ion locat ion rearward. Also, t h e most no t iceable p ressure reduct ion in the separa ted reg ion occur red as M, increased from 0.94 t o 1.20 and the ex te rna l f low began t o undergo supersonic expan- s ion a t t h e e x i t l i p . Consequently, increasing M, can be expected t o i n c r e a s e t h e overexpansion and drag associated with the divergent section a t low nozzle pressure r a t i o s .
Obviously, as nozzle pressure ra t io is increased by increas ing the jet stag- na t ion pressure p t l j , t he s epa ra t ion moves t o t h e e x i t and disappears. Once t h e e x i t flow is fu l ly supe r son ic , t he i n t e rna l p re s su re d i s t r ibu t ion becomes independent of external condi t ions. For the p resent conf igura t ions , the minimum nozzle pressure r a t i o r e q u i r e d t o el iminate separat ion ranged from approximately 3 t o 7 for cor re- sponding design values of 4.25 t o 21.23 and for expansion ratios of 1.25 t o 3.00, respec t ive ly .
9
,
b

External Performance
The variation of jet-of€, boattail pressure-drag coefficient with free-stream Mach number is shown in figure 10. Jet-off boattail pressure drag generally increases with increasing nozzle boattail angle. As the Mach number approached unity, the steepest drag rise occurred for nozzles with fl = 8 O to 150, starting at M, = 0.80. As might be expected, the shallow boattails of configurations 2 and 5 exhibit a m c h smaller drag rise, which started at M, = 0.90 or slightly greater. In the supersonic-speed range, boattail pressure-drag coefficient is almost directly proportional to nozzle boattail angle.
Figure 1 1 presents the influence of nozzle pressure ratio on boattail pressure- drag coefficient for all configurations and test Mach numbers. In general, these curves are shaped by two opposing effects: the growth in jet diameter, or pluming effect, which pressurizes the boattail surface and thus reduces drag; and jet entrainment, which tends to accelerate the flow on the boattail, thereby increasing the drag. Therefore, where the slopes of the curves are negative, the pluming effect predominates, and where positive, the influence of jet entrainment predominates. On any given curve, a drag level less than the initial jet-off value (pt /pa = 1 1 indicates a favorable jet effect. Furthermore, all subsequent comments regarding jet effects on boattail drag refer to the portion of the drag curves between ptlj/pm = 3 and the maximum test value, since this is the range of practical interest for the Mach numbers of this test.
Jet operation had a favorable effect on the boattail drag of nozzle configura- tions 1, 3, and 4 at all test Mach numbers. At subsonic conditions the jet effects on drag are caused by modest increases in pressure which extend over all or most of the boattail length at a given nozzle pressure ratio. Among configurations 1, 3 , and 4, the jet effects at M, = 0.60 and 0.80 are seen to increase with increas- ing boattail angle (projected area) such that the drag levels are nearly equal for @ = 8O to 15O. As M, becomes supersonic, the influence of the jet on boattail pressures becomes limited to the rear half or less of the boattail length. However, as the nozzle pressure ratio increases, the pluming jet pushes the trailing shock forward, thus substantially increasing the pressure and the area affected behind the shock. Consequently, the effect of the jet on the drag coefficients of configura- tions 1, 3, and 4 is still strongly favorable at supersonic speeds as reflected in figure 1 1 (c).
The shallow boattails of configurations 2 and 5 exhibit much smaller variations in pressure-drag coefficients with nozzle pressure ratio than the other configura- tions. At subsonic speeds, jet effects on the drag of configurations 2 and 5 are unfavorable. The increase in boattail drag with jet operation is attributed to the dominance of jet entrainment when the nozzles are operating highly overexpanded
effect. At supersonic speeds the boattail pressure data for configurations 2 and 5 showed no shock formation or separation, and jet effects were confined to a very small area just ahead of the exit. Figure ll(c) confirms that jet effects on drag at M, = 1.20 and 1.28 are negligible.
(Pt , 3 ./p, << Design value) and, therefore, produce little, if any, beneficial pluming
Internal Performance
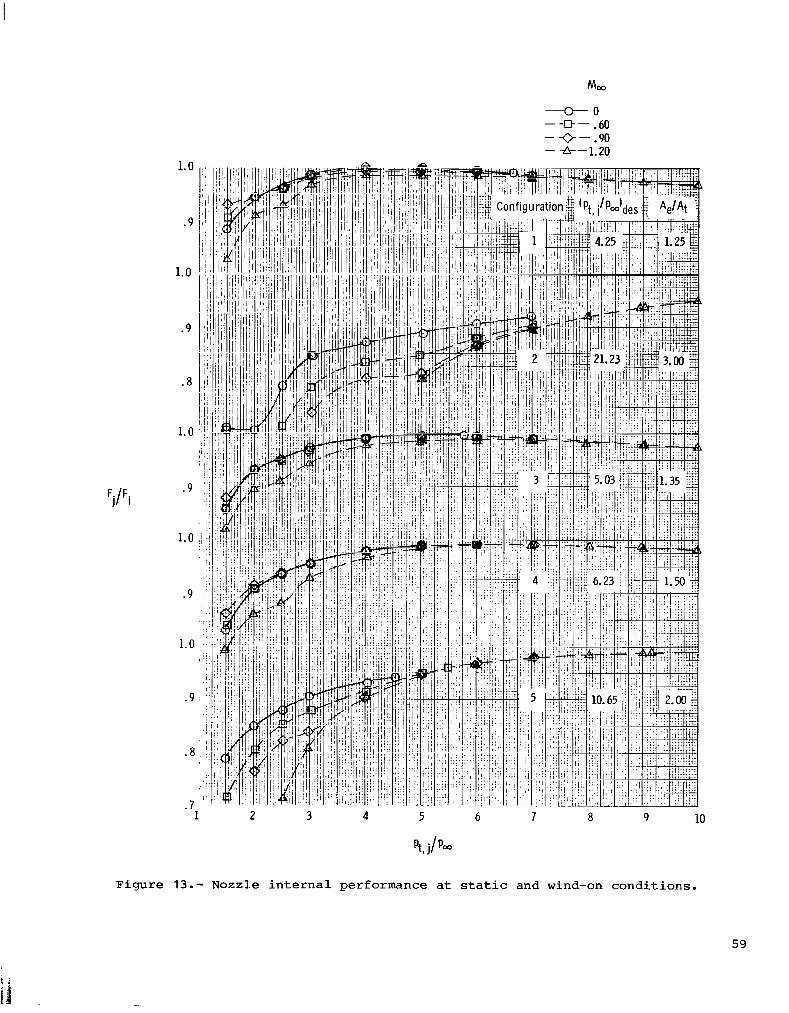
Nozzle internal thrust performance Fj/Fi was determined by equation ( 7 ) . Thrust was obtained by combining the boattail pressure drag of figure 11 and boat- tail skin-friction drag shown in figure 12 with the thrust-minus-drag measurements
10

from t h e model balance. The r e s u l t i n g v a r i a t i o n s of th rus t ra t io wi th nozz le pres- s u r e r a t i o are i n d i c a t e d i n f i g u r e 13, and the d i scharge coef f ic ien ts are shown i n f i g u r e 14. The internal performance of t h e test configurat ions may be summarized as follows :
( 1 ) Nozzle configurations 1, 3, 4, and 5 achieved an average peak thrust per- formance of F./Fi = 0.99 a t values of nozz le p re s su re r a t io a t or near design value (optimum expansion). 3
( 2 ) Experimental nozzle pressure ratios for nozzle configuration 2 w e r e SubStan- t i a l l y lower than the design value; therefore, this configuration suffered overexpan- s ion losses throughout the range of nozzle pressure ratios shown. However, it is noted that Fj/Fi 0.95 a t 50 percent of design nozzle pressure ratio, which is c h a r a c t e r i s t i c of a l l configurat ions when f r e e of external-f low effects . (See con- f igu ra t ions 1, 3, 4, and 5 a t M, = 0. ) Theref ore, the peak performance of conf igu- r a t i o n 2 would a l s o be expected t o reach Fj/Fi = 0.99 a t the design point.
( 3 ) When the i n t e rna l f l aw w a s considerably overexpanded and separated, the presence of external flow tended to reduce the thrust performance of the nozzles r e l a t i v e t o t h e wind-off case (MOD = O), p a r t i c u l a r l y a t supersonic speeds. A t a given nozzle pressure ratio, this addi t ional overexpansion loss increased with increasing divergence angle and free-stream Mach number a s i nd ica t ed by t h e i n t e r n a l pressure data discussed previously.
( 4 ) A t nozzle pressure ra t ios high enouqh to e l imina te in te rna l separa t ion , the t h r u s t r a t i o s f o r a l l Mach numbers converged t o one curve. This indicated ful ly supersonic e x i t flow with internal performance independent of external condi t ions. Reference 16 shows s i m i l a r e f f e c t s of in te rna l - f low separa t ion for another group of axisymmetric, convergent-divergent nozzles.
(5) Figure 14 shows tha t t he d i scha rge coe f f i c i en t s of a l l n o z z l e s a r e e s s e n t i - ally independent of noqzle pressure ra t io (and throat Reynolds number) when operat ing choked. Values of ;/mi ranged from 0.964 ( conf igu ra t ion 1 ) t o 0.976 (configura- t i o n 5 ) , the average l eve l be ing ra ther typ ica l of nozzles with re la t ively "sharp" th roa t s . The improvement in d i scha rge coe f f i c i en t between configurat ions 1 t o 5 is a t t r i b u t e d t o more uniform flow entering the throat as the convergence angle decreased and also to the boundary layer thinning as the pressure gradient behind the throat decreased with increasing divergence angle.
Overall Performance
The ra t io of nozz le t h rus t minus drag t o idea l t h rus t p lo t t ed aga ins t nozz le p r e s s u r e r a t i o f o r a l l configurations and test Mach numbers is shown i n f i g u r e 15. The shape of these curves is determined primarily by t h r u s t c h a r a c t e r i s t i c s , and the maximum overal l force ra t io approaches the internal performance F./Fi as Fi becomes l a rge r e l a t ive t o d rag a t h igh p re s su re ratios. A t subsonlc speeds, the r e l a t i v e l e v e l s of t he da t a r e f l ec t t he nea r ly equa l d rag cha rac t e r i s t i c s of configu- r a t i o n s 1, 3, and 4 ( f i g . l l ( a ) ) as w e l l as the large overexpansion losses of config- u ra t ions 2 and 5 (f ig . 13) , both c i ted previously. As t h e f r e e stream becomes super- sonic , h igher drag losses and the inverse var ia t ion of overall performance with boa t t a i l ang le become increasingly evident .
3
Aerodynamic idea l - th rus t coe f f i c i en t of a l l nozzle configurat ions tes ted is p l o t t e d i n f i g u r e 16 as a funct ion of nozzle pressure ra t io fo r t he va r ious tes t Mach
11

numbers. Since configurat ions 1 and 2 have i d e n t i c a l t h r o a t areas and t h e i r s ta t ic d i scha rge coe f f i c i en t s a r e nea r ly t he same (see f i g . 1 4 ) , t h e i r ideal t h r u s t c o e f f i - c ien ts , wi th in the g raphica l accuracy of f i g u r e 16, appear as one plot . (See fig. 16 (a) . These graphs provide the means of converting aerodynamic coeffi-
Figure 17 presents a representative schedule of nozz le p ressure ra t io wi th Mach number f o r a low bypass-ratio turbofan engine operating a t maximum ro ta t iona l speed (climb and accelerat ion condi t ions) . This schedule w a s obtained from unpublished industry sources used in performance studies of advanced supersonic aircraft . Fig- u r e 18 shows the overal l performance ( f ig . 16) for the nozzle configurat ions appropr i a t e t o t he test speed range a t t yp ica l ope ra t ing p re s su re ratios and Mach numbers of the schedule ( f ig . 17) . For convenient reference, the corresponding value of nozzle pressure ra t io from the schedule is repeated with each Mach number a t t he bottom of f i g u r e 18. Also indicated are t h e optimum expansion ratios obtained from reference 14 for the schedule p ressure ra t ios a t each end of the subsonic and supersonic Mach number segments. The s o l i d symbols denote internal performance for configurat ion 5 and show the rate a t which the t h rus t op t imizes fo r Ae/At = 2.0 as schedule conditions increase toward the design point (pt . /pa = 10.64) which is reached near M, = 1.6. (See fig. 17.) By us ing f i gu re 18, the overall performance can be summarized f o r a variable-geometry nozzle operating a t optimum expansion (Fj/Fi = 0.99) along the assumed f l igh t schedule of f i g u r e 17.
r 3
A t M, = 0.60 t o 0.80, configurat ion 1 is o p e r a t i n g a t optimum i n t e r n a l expan- s ion (Fj/Fi = 0.99), which can be seen i n f i g u r e 13 a t schedule pressure ratios. I f t he ex i t a r eas of configurations 3, 4, and 5 were ad jus t ed t o p rov ide t he same in t e rna l cond i t ions , it can be shown t h a t t h e r e s u l t i n g b o a t t a i l a n g l e s of a l l configurations then range from approximately 8 O t o 15O. It w a s shown previously ( f i g . l l ( a ) ) t h a t b o a t t a i l s i n t h i s a n g l e r a n g e have near ly equal drag values a t
M, = 0.60 and 0.80. Therefore, a l l optimized configurations would be expected t o have the same performance loss due t o b o a t t a i l d r a g as t h a t shown by the da t a fo r configurat ion 1. A s a r e s u l t , t h e o v e r a l l f o r c e r a t i o f o r optimum expansion a t a l l power s e t t i n g s is approximately 0.98 as shown for conf igura t ion 1 between M, = 0.60 and 0.80.
A t Mach numbers between 0.80 and 0.94, t e s t con f igu ra t ions 1, 3, and 4 are a l l operat ing a t or near optimum expansion. (See fig. 13.) Therefore, the experimental data curves show o v e r a l l f o r c e r a t i o s f o r t h i s c o n d i t i o n d i r e c t l y , as w e l l a s t h e performance loss from boat ta i l drag a lone as each configuration enters the drag r i s e . It can be shown from the nozzle geometry and drag data tha t op t imiz ing the e x i t area of configurat ion 5 f o r t h i s Mach number segment r e s u l t s i n a b o a t t a i l angle and overall performance very similar t o t h a t of configurat ion 4. The flagged symbol a t M, = 0.90 denotes a representat ive subsonic cruise point a t reduced power (i .e. , not associated with the schedule). The c r u i s e p r e s s u r e r a t i o assumed w a s
/p, = 4, which is an average of values generally associated with advanced :t$iters and t ranspor t s . A t M, = 0.90, o v e r a l l f o r c e r a t i o s are shown t o range approximately from 0.95 a t reduced-power c r u i s e t o 0.975 for a f te rburn ing condi t ions .
A t supersonic speeds, the overall performance for optimum expansion w a s esti- mated from t h e t e s t d a t a . For each Mach number and th roa t a r ea , boa t t a i l ang le s were determined from the nozzle geometry f o r t h e optimum-expansion r a t i o s of 1.58 and 1.69 required by the schedule. From cross plots of d rag aga ins t boa t t a i l ang le , the values of b o a t t a i l d r a g f o r optimum-expansion s e t t i n g s were selected. These values of boa t t a i l d rag were converted t o D, /F~ by d iv id ing them by the appropriate
12

Va~UeS of CF (fig. 16) and then subtracting the result from F./Fi = 0.99. The results, labeled "Optimum expansion" in figure 18, are identified ;?y line code with the corresponding throat area of the test configurations with fixed-expansion ratio.
For At/Am = 0.42, the experimentally measured overall performance for Ae/At = 2.00 1s seen to equal that estimated for optimum-expansion ratios of the schedule. This indicates that the rates of change of thrust and drag with expansion ratio have equalized at these speeds. Consequently, if the exit area is increased somewhat beyond the optimum value, the resulting internal overexpansion loss is off- set by an equal reduction in boattail drag. Moreover, the calculations verify that this is true for all three throat areas. At M, = 1.3 it can be seen that the over- all force ratio for optimally expanded settings from maximum dry power to maximum afterburning should range from 0.96 to 0.98, respectively. Based on the experimental data at M, = 1.3, configuration 5 should provide an overall force ratio of approxi- mately 0.985 when the schedule and design pressure ratios match in the vicinity of M, = 1.6. (See fig. 17. ) This is verified-in reference 16 by performance data for similar convergent-divergent nozzles tested at higher supersonic Mach numbers. In conclusion, figure 18 shows the general importance of maintaining optimum expansion in flight and the high performance that results over a wide range of power settings.
ANALYTICAL INVESTIGATION
The following computer programs were used to provide theoretical comparisons with the experimental data:
DONBOL (Douglas-Neumann/Boundary Layer): This program, described in refer- ence 17, was used to calculate external surface-pressure distributions over the axi- symmetric boattail nozzles in the subsonic-speed regime (M, = 0.60 and 0 . 8 0 ) . The DONBOL program couples a Neumann solution for inviscid external flow, a modified Reshotko-Tucker integral boundary-layer technique, the control-volume method of Presz for calculating flow in the separated region, and an inviscid one-dimensional solu- tion for the jet-exhaust flow. The viscous and inviscid flows are solved iteratively until convergence is obtained. This method is limited to subsonic free-stream Mach numbers below that for which the flow over the body of revolution becomes sonic; also, this method does not include the effects of jet entrainment. Specifying the separation location is not necessary; however, the start and end of the region searched for separation must be specified.
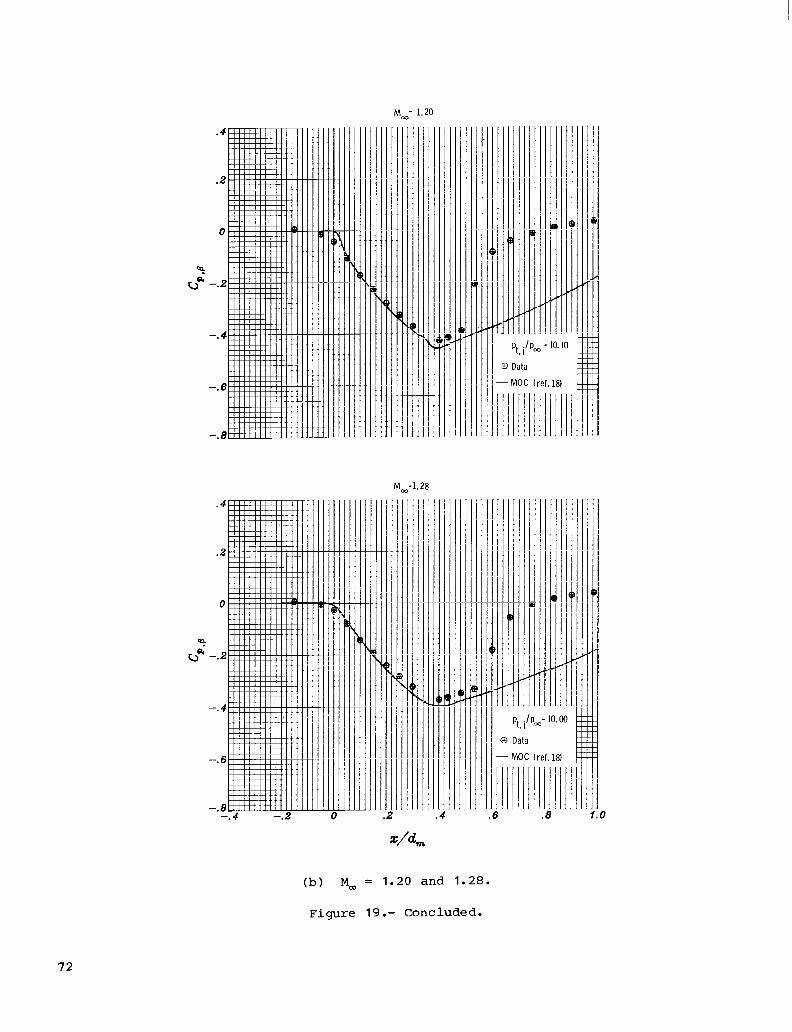
MOC (Method of Characteristics): This program was used to calculate the after- body surface-pressure distribution in the supersonic-speed regime (M, = 1.2 and 1.28) . The MOC program performs an axisymmetric method-of-characteristics solution for supersonic flow over boattailed afterbodies and is restricted to axi- symmetric, inviscid, irrotational flow. Since a description of this program, which was developed by Lawrence E. Putnam, Bobby L. Berrier, and Richard G. Wilmoth of the Langley Research Center, has not been published, reference 18 is given as a descrip- tion of the theoretical development of the axisymmetric method of characteristics.
NAP (Nozzle Analysis Program): This program, described in reference 19, was used to calculate the nozzle internal pressure distribution and gross internal thrust. The NAP is capable of calculating time-dependent, perfect gas, inviscid, steady, and unsteady flow in two-dimensional and axisymmetric nozzles by using the nonconservative form of the two-dimensional equations of motion for a geometric computational grid which spans the flow area. Interior mesh points are calculated by using a MacCormack finite-difference method (a two-step predictor-corrector method
13

described in ref. 20); a characteristics method is used to compute the boundary mesh points; and shock waves are modeled by using a shock-smearing technique which incor- porates an explicit artificial viscosity term with numerical smoothing described in reference 21. Gross thrust is obtained by integrating the momentum flux and dif- ference between exit and ambient pressures over the exit area. The NAP becomes increasingly inaccurate below design nozzle pressure ratio since limitations in the code prevent the flow velocity from returning to subsonic levels once it has become supersonic. This investigation is an example of NAP being applied to the analysis of an axisymmetric converging-diverging nozzle. Reference 22 gives an example of NAP being applied to the analysis of a nonaxisymmetric converging-diverging wedge nozzle.
DISCUSSION OF ANALYTICAL RESULTS
External Pressure Distribution
A comparison of experimentally and analytically determined external pressure distributions is given in figures 19 to 23 which present data for nozzle configu- rations 1 to 5, respectively. For part (a) of each figure which presents free-stream Mach numbers of 0.60 and 0.80, the theoretical prediction was computed by the DONBOL program of reference 17. Reasonable agreement with the experimental data trends was obtained for nozzle configurations with the larger boattail angles ( 0 > 8 O ) . The DONBOL program generally underpredicted the strength of the nozzle shoulder expansion and the compression near the nozzle exit. Poor agreement between theory and experiment was obtained for the two nozzles with very small boattail angles ( @ < 4O). This discrepancy between the predictions of the DONBOL code and experiment for the small boattail-angle nozzles (configurations 2 and 5).is associated primarily with the analytical modeling of the jet-exhaust plume. The simple one-dimensional- solution technique for the jet-exhaust plume used in the DONBOL code is not adequate for the highly overexpanded nozzle cases of the present investigation. Also, the neglect of jet-entrainment effects by the DONBOL code is a factor in the observed discrepancies especially near the nozzle exit. Part (b) of figures 19 to 23 presents a comparison of theory and experiment for free-stream Mach numbers of 1.20 and 1.28 for configurations 1 to 3 (1.20 and 1.27 for configurations 4 and 5).
Good agreement was obtained for configurations with small boattail angles (con- figurations 2 and 5) except near the nozzle exit. For configurations with large boattail angles (configurations 1, 3, and 4) , good agreement of theory and experiment was obtained until a shock wave and/or separated region was encountered on the nozzle external surface. Large discrepancies were noted in these regions. It is noted that the MOC computer code utilized is an isentropic, inviscid method-of-characteristics program. Therefore, although this program can reasonably predict the surface- pressure distribution of configurations with small boattail angles, it cannot predict surface pressures behind shock waves or in separated-flow regions associated with nozzle configurations having large boattail angles.
Internal Pressure Distribution
A comparison of experimentally and analytically determined internal pressure distribution for each nozzle configuration is given in figure 24. The experimental data shown were a l l taken at a free-stream Mach number of 0.60. However, internal pressure distributions are independent of free-stream Mach number at and above design nozzle pressure ratio. Below design nozzle pressure ratio, the experimental data may show effects of flow separation which cannot be predicted by the inviscid NAP of
14
" I

reference 19. Good agreement is shown in figure 24 between experiment and theory, except in the converging section just upstream of the throat of each nozzle. In this section of the nozzle, the analytical predictions are consistently low. For configuration 2 which has a design nozzle pressure ratio of 21.23, the agreement between experiment and theory was remarkably better than expected, since the experi- mental nozzle pressure ratio of 6.97 was significantly lower than the design value. However, the nozzle was flowing full up to approximately "/dm = 0.95, thereby making the effects of separation minimal.
Static Thrust Coefficient
Figure 25 shows a comparison of experimentally and analytically determined vari- ation of static thrust coefficient with nozzle pressure ratio for each nozzle con- figuration. The solid line shown as theory represents the internal gross thrust computed by the NAP of reference 19. The dashed line depicted as ideal thrust was calculated by the equation for optimum thrust coefficient
Y+ 1 r 1'2
As expected, the experimental and theoretical values were less than the ideal value for all configurations. Excellent agreement between theory and experiment was obtained for nozzle configurations with low expansion ratios (configurations 1, 3, and 4). However, it is noted that for configurations 2 and 5 (high expansion ratios), the experimental values significantly exceeded the theoretical values at the lower nozzle pressure ratios tested. This may appear at first as a data anomaly when considering that the NAP does not consider viscous losses. The anomaly is best understood by considering that the maximum nozzle pressure ratio tested for these configurations is far below the design values of 21.23 and 10.69 for configurations 2 and 5, respectively.
Examination of the experimental internal pressure distribution for these two nozzle configurations (figs. 6 and 9 for configurations 2 and 5, respectively) readily shows the large amount of separation present. Large shock-induced separated- flow regions are indicated for these configurations at nozzle pressure ratios below 7.0 for configuration 2 and below 4.0 for configuration 5 . Since the NAP is limited to inviscid flow, and flow velocities cannot return to subsonic levels once super- sonic, NAP obviously cannot provide accurate results when large separated regions exist. However, the trends shown in figure 25 do indicate that NAP is capable of providing accurate results for these nozzle configurations at higher nozzle pressure ratios. Also, reasonable predictions far below design nozzle pressure ratio are pos- sible. This justifies using the code over a wide range of nozzle pressure ratios during preliminary design and development of new nozzles.
CONCLUSIONS
An experimental investigation has been conducted which provides quantitative pressure and force data for five axisymmetric convergent-divergent nozzles with dif-
15

ferent internal and external geometry. These nozzles simulate the variable-geometry nozzle operating over a range of engine operating conditions. This investigation was conducted at an angle of attack of O o in the Langley 16-Foot Transonic Tunnel at free-stream Mach numbers M, from 0.60 to 1.30. Nozzle pressure ratio was varied from jet off to 10, depending on configuration and Mach number. The experimental data were also compared with computational theoretical predictions €or internal pres- sure distribution, gross internal thrust, and external pressure distribution at sub- sonic and supersonic free-stream Mach numbers.
The results of this experimental and analytical investigation indicated the following conclusions:
1. Jet-off, boattail pressure-drag coefficient was generally proportional to the nozzle boattail angle.
2. The amount in external-flow separation on the nozzle generally increased with increasing boattail angle, free-stream Mach number, and nozzle pressure ratio.
3. Configurations which have very low boattail angles show only minor variation of pressure drag with nozzle pressure ratio, especially at supersonic speeds.
4. Separation of internal flow was directly proportional to divergence angle and inversely proportional to nozzle pressure ratio.
5. The ratio of thrust minus drag to ideal thrust for optimum expansion at M, = 0.90 was 0.95 for subsonic cruise and 0.975 for afterburning throat settings. At M, = 1.3, the overall force ratio for optimum expansion varied from 0.96 to 0.98 for throat areas from maximum dry power to maximum afterburning, respectively.
6. At subsonic speeds, theoretical external pressure distributions predicted by the DONBOL (Douglas-Neiunann/Boundary Layer) program were in reasonable agreement with the experimental data for configurations which had boattail angles greater than 8 O
but were in poor agreement with experimental data for highly overexpanded nozzle configurations with boattail angles less than 4O.
7. At supersonic speeds, theoretical external pressure distributions predicted by the MOC (Method of Characteristics) program were in good agreement with the experimental data until a shock wave and/or separated region was encountered on the nozzle external surface.
8 . Theoretical internal pressure distributions predicted by the NAP (Nozzle Analysis Program) were in good agreement with the experimental data except in the converging section (upstream of throat) of each nozzle. In this section of the nozzle, the analytical predictions are consistently low.
9. The theoretical static thrust coefficient, predicted by the NAP, was in excellent agreement with the experimental data except at nozzle pressure ratios which produce large internal-flow-separation regions. The nozzle pressure ratios which produce internal-flow separation were found to be well below the design nozzle pres- sure ratio.
Langley Research Center National Aeronautics and Space Administration Hampton, VA 23665 October 28, 1981
16
mFERENCES
1. Willis, Edward: Variable-Cycle Engines for Supersonic C r u i s e Ai rcraf t . NASA T M X-73463, 1976.
2. Howlett, Robert A.: Variable Stream Control Engine Concept for Advanced Supersonic Aircraft - Features and Benefits. Proceedings of t h e SCAR Conference - Par t 1, NASA CP-001, [19771, pp. 341-352.
3. Krebs, J. N.: Advanced Supersonic Technology Study - Engine Program Summary: Supersonic Propulsion - 1971 t o 1976. Proceedings of the SCAR Conference - P a r t 1, NASA CP-00 1, [ 19771, pp. 353-370.
4. Powers, Albert G.; Whitlow, John B.; and S t i t t , Leonard E.: Component Test Program for Variable-Cycle Engines. Proceedings of t he SCAR Conference - P a r t 1, NASA CP-001, [19771, pp. 371-385.
5. Allan, R. D.; and Johnson, J. E. : Supersonic Cruise Research Propulsion System Studies - Slide Presentation. Supersonic Cruise Research '79 - P a r t 1, NASA CP-2108, 1980, pp. 339-345.
7. Hunt, Richard B.; and Howlett, Robert A.: Variable Stream Control Engine for Advanced Supersonic Aircraft Design Update. Supersonic Cruise Research '79 - P a r t 1, NASA CP-2108, 1980, pp. 357-370.
8. Westmoreland, John S. : Progress With va r i ab le Cycle Engines. Supersonic Cruise Research '79 - Part 1, NASA CP-2108, 1980, pp. 371-390.
9. Corson, Blake W . , Jr.; Runckel, Jack F.; and Igoe, W i l l i a m B.: Calibrat ion of t h e Langley 16-Foot Transonic Tunnel With Test Sect ion A i r Removal. NASA TR R-423, 1974.
10. Braslow, Albert L.; and Knox, Eugene C.: Simplif ied Method for Determination of Cri t ical Height of Distributed Roughness P a r t i c l e s f o r Boundary-Layer T r a n s i t i o n a t Mach Numbers From 0 t o 5. NACA T N 4363, 1958.
1 1. Braslow, Albert L. ; Hicks, Raymond M.; and Harris, Roy V., Jr. : U s e of Grit-Type Boundary-Layer-Transition Trips on Wind-Tunnel Models. NASA TN D-3579, 1966.
12. Shapiro, Ascher H.: The Dynamics and Thermodynamics of Compressible Fluid Flow. Vol. 11. Ronald Press Co., c.1954, p. 1110.
13. S t r a t fo rd , B. S.: The Calculat ion of the Discharge Coefficient of P ro f i l ed Choked Nozzles and the optimum Prof i le for Absolu te A i r Flow Measurement. J. R. Aeronaut. SOC., vol. 68, no. 640, A p r . 1964, pp. 237-245.
14. Ames Research Staff: Equations, Tables, and Charts for Compressible Flow. NACA Rep. 1135, 1953. (Supersedes NACA TN 1428.)
15. Migdal, D.; and Kosson, R.: Shock Predictions in Conical Nozzles. A I M J. (Tech. Notes), vol. 3, no. 8, Aug. 1965, pp. 1554-1556.
17

16. Berrier, Bobby L.; and Re, Richard J.: Investigation of Convergent-Divergent Nozzles Applicable to Reduced-Power Supersonic Cruise Aircraft. NASA "-1766, 1980.
17. Putnam, Lawrence E.: DONBOL: A Computer Program for Predicting Axisymmetric Nozzle Afterbody Pressure Distributions and Drag at Subsonic Speeds. NASA TM-78779, 1979.
18. Liepmann, H. W.; and Roshko, A.: Elements of Gasdynamics. John Wiley f Sons, Inc., c. 1957.
19. Cline, Michael C.: NAP: A Computer Program for the Computation of Two- Dimensional, Time-Dependent, Inviscid Nozzle Flow. LA-5984 (Contract W-7405-ENG. 36), Los Alamos Sci. Lab., Univ. of California, Jan. 1977.
20. MacCormack, Robert W.: The Effect o f Viscosity in Hypervelocity Impact Cratering. AIAA Paper No. 69-354, Apr.-May 1969.
2 1. Richtmyer, Robert D. ; and Morton, K. W. : Difference Methods for Initial-Value Problems, Second ed. Interscience Publ., c.1967, Chapters 12 and 13.
22. Carson, George T., Jr.; and Mason, Mary L.: Experimental and Analtical Investigation of a Nonaxisymmetric Wedge Nozzle at Static Conditions. NASA TP-1188, 1978.
18

TABLE I. - NOZZLE PRESSURE-ORIFICE LOCATIONS~
-0.150 -. 050 .ooo 050
.loo 150 .200 250 e300 .400 .433 .483 .533 600 .667 750 e833 .goo e980
-0.100 028 a077 e 1 1 8 160 187 .200 232 e273 .357 398 .448 e500 548 .600 658 e715 782 .850 -917 e983
-0.180 -. 080 030
b. 020 .070 .120 .170 .220 e270 e420 .520 e620 .720 820 920 .995
-0.313 -. 180 -.080 -.023 .052 .095 .128 .162 .195 .210 .220 242 e275 .360 .410 460 e510 .562 .613 680 .748 .815 .883 .953
1.000
-0.110 "060
b-.O1O ,040 ,
.090
.140
.190
.240 e290 .390 .440 .507 .590 690 790 .890 .990
-0.210 "093 .020 .072 .122 155 .188 195 .220 253 .287 .322 .388 .422 .455 .505 e605 655 .722 .788 .857 923 .990
-0.120 -. 070 b-. 020
030 .080 130 .180 e230 .280 .363 .438 .530 e630 .730 a830 e930 .980
-0 270 153
-.063 007 062 .112 .145 .178 .200 208 .242 275 e342 .375 e427 .477 a527 .577 643 -712 .778 847 a913 980
-0.120 -. 070 b-. 020
030 e 080 130 180 .255 e330 .580 .730 880 e980
-0.270 153
-5063 005 045 095 .128 .162 .195 .213 .240 li .273 340 390 442 492 .542 .592 643 ,713 772 840 .907 .980
aSingle external-orifice row is located along top center line of nozzle afterbody. Single
bSubtract these values from external and internal coordinates to locate orifice from start of internal-orifice row is located 45O clockwise from top of nozzle, looking upstream.
boattail (station 137.16 cm).

N 0
L-78-5575
Figure 1.- Photograph showing i n s t a l l a t i o n of nozzle configuration 5 i n t es t sect ion of t he Langley l6-~oot Transonic Tunnel.

30. 0 30. 15.24 Sto. 67.31
Sto. 137.16
5-percent thickness rotlo parallel to model center line; 50.80 chord
55.80
\2.54 rod
Figure 2.- General arrangement of the nacelle model and support system. A l l l i nea r dimensions are in cent imeters .

Figure 3. - Photograph showing the f ive nozzle configurat ions tes ted.

Sta. 137.16
1.303 4 1 -
dm =
A
15. I !Q 1 2.86:
Y
C
E I I t
22.'860 Rad.
I \ / r 1.270 Rad. 6
2 1 Supersonic cruise
3
Supersonic accel. 5
Transonic accel. 4
Subsonic accel.
-
Power setting
OV
D V
Max. dry
Partial A l e
Max. A /%
r . 0 7 6 (base thickness)
1-
1
-
6.23 -1 1.Hw)
10.64 I 2.m
Design dimensions
Figure 4.- Geometric details of the test nozzle configurations. linear dimensions are in centimeters.
Absolute
23

essure d i s t r i b u t i o n
Nozzle cross-sect ional contour < 15.050"
0 1 . 1 1
N o z z l e i n t e r n a l p r e s s u r e d i s t r i b u t i o n 1.0
-. 4 -. 2 %'dm
( a ) M, = 0.60.
2.50 3.02 4.03
a 5.03 6.02
4 7.03
- 2.01
. . 1
7.0
Figure 5.- Externa l and in te rna l sur face-pressure d i s t r ibu t ions of nozzle configuration 1. Origin is a t s t a r t of b o a t t a i l ; loca t ion of t h r o a t is denoted by ver t i ca l l i ne i n nozz le c ros s - sect ion contour; design nozzle pressure ra t io is 4.25.
24

Nozzle ex t e rna l p res sure d i s t r ibu t ion .4
.z
0
T t, - . B e.
-. 4
-. 6
-.a
Noz$le cross-sect ional contour .50
Sta. 137.16 I 1 Nozzle throat
1 1 I 1 1 u N o z z l e i n t e r n a l p r e s s u r e d i s t r i b u t i o n
v A 2.51 - k, 3.09
5.05 4.02
6.05 6 7.05
.4
./dm
(b) M, = 0.80.
Figure 5 .- Continued.
25
Nozz le ex t e rna l p res sure d i s t r ibu t ion
Y
2.03 2.55
4.05 3.03
p 5.09 e 6.05 + 7.05
Nozzle cross-sect ional contour .50
I
s d 2.117"
t
0
N o z z l e i n t e r n a l p r e s s u r e d i s t r i b u t i o n
(c) Ma = 0.90.
Figure 5. - Continued.
26

Nozz le ex t e rna l p res sure d i s t r ibu t ion . 4
.z
0
Ql
0 - . I a'
-. 4
-. 6
-. K
1 n m m Nozzle cross-sect ional contour
.50 I
Sta. 137.16 2 2.117" 1 Nozzle 1 throat t
I J 1 I I I
b 4.04 L 3.02
6.01 p 5.09
6 7.10
N o z z l e i n t e r n a l p r e s s u r e d i s t r i b u t i o n
- . Q ~ .2
Figure
Ma = 0.94.
5 .- Continued.
27
N o z z l e e x t e r n a l p r e s s u r e d i s t r i b u t i o n
Noz:le cross-sectional contour L
0
N o z z l e i n t e r n a l p r e s s u r e d i s t r i b u t i o n
-. 4 -.2 0 .2 . 4 .6 .8 1.0
X/dm
(e) Mm = 1.20.
Pt,JP- e J/o A 2.04
1.50
x 2.57 B 4.09 a 3.04 Q 5.12
6.13 7.13 ! 8.12
I
9.17 t 10.10
Figure 5. - Continued.
28

N o z z l ( tl e e x ?7 -nul p r e s sure d i s t r ibu t ion
Nozzle cross-sect ional contour .50
I
0 - 1
Sta. 137. I 6 I 2 2.117" 1 Nozzle, throat t
I I . I I 1 -u N o z z l e i n t e r n a l p r e s s u r e d i s t r i b u t i o n
2 2.53 3.00
p 4.98 4.05
e 5.96 + 6.98 & 7.98
8.98 t r o . 0 0
I' O1
-.* ? mii .2 t~ .4
(f) M, = 1.28.
Figure 5 .- Concluded.
29

Nozz le ex t e rna l p res sure d i s t r ibu t ion
Nozzle cross-sect ional contour I c
17"
Sta. 137.16 7 1 I d 19.189'
Nozzle throat t I
0 I II I I I I
N o z z l e i n t e r n a l p r e s s u r e d i s t r i b u t i o n
h
f
-.4 -.2 0
./dm
M, = 0.60.
PIJP- 8 J /O s i.54
2.01 ? 2.53 - 3.09
B 4.06 p 5.06
6.07 + 6.97
Figure 6.- External and internal surface-pressure distributions of nozzle configuration 2. Origin is at start of boattail; location of throat is denoted by vertical line in nozzle cross- section contour; design nozzle pressure ratio is 21.23.
30

Nozz le ex t e rna l p res sure d i s t r ibu t ion
Noz,zle cross-sectional contour I
.50 17'
0 I 1.0-
.8 -
.6 - 3 .
.4 -
. ' o - .4 0
Sta. 137.16 I 1 Nozzle throat 2 13.183"
t
N o z z l e i n t e r n a l p r e s s u r e d i s t r i b u t i o n
Figure 6.- Continued.
31

Nozz le ex t e rna l p res sure d i s t r ibu t ion
Noz,zle cross-sectional contour
1 Nozzle: throat t
0 I I1 I I 1 - A I
N o z z l e i n t e r n a l p r e s s u r e d i s t r i b u t i o n
t
(c) M, = 0.90.
Pt,/Pm 8 J / O
7.56 2.03 2 2.49
a 3.01 b 4.07 a 5.09 . 6.08 4 7.08
Figure 6. - Continued.
32
Nozz le ex t e rna l p res sure d i s t r ibu t ion
Noz,z le cross-sect ional contour .50
-. 1
Sta. 137.16 T I I Nozzle throat
1 I I I I 1
N o z z l e i n t e r n a l p r e s s u r e
1 7 3.817"
/ 13.183" I
t
1 -
d i s t r ibu t ion
Pt,/P- o J /O
1.51 Q 2.12 A 2.66
3.99 L 3.01 . 6.10 5.09
+ 7.07
Figure 6.- Continued.
33

Nozz le ex ternal pressurc 3 d i s t r ibu t ion
Nozzle cross-sect ional contour I
.50
I
N o z z l e i n t e r n a l p r e s s u r e d i s t r i b u t i o n
; 2.02 A 2.61 a 9.09 B 4.00 m 5.21 + 6.10
8.15 + 7.13
9.09 gro.oe
-. 4 -.2
./dm
(e) Mm = 1.20.
Figure 6.- Continued.
34
N o z z l e t ? s t e r n a l p r e s s u r e d i s t r ibu t ion
P t J P -
f 2.47
o J/o 1.69 2.01
& 3.99 a 2.99
6.01 p 4.98
A 7.96 + 6.96
0 9.01 9.92 I li m
I"
-d I! Noyzle cross-sect ional contour
.50 -7 1 3.817'
N o z z l e i n t e r n a l p r e s s u r e d i s t r i b u t i o n
-.1 ? 5
Figure 6 .- Concluded. 35
1l1111llllllll11l11111l11l1 IIIm1111
Nozz le ex t e rna l p res sure d i s t r ibu t ion .4
.2
0
p+ t, -2 (5
-. 4
-. 6
-. 8
Nozz,le cross-sectional contour .50
2 3.183' t
0 I 11 1 1 1 1 1
N o z z l e i n t e r n a l p r e s s u r e d i s t r i b u t i o n
h g-
-. 4 -.2 0
./dm
( a ) M, = 0.60.
PbJP- e J/O
1.52 2.04 2 2.51
L 3.02
0 5.03 . 6.02 e 7.04
4.01
Figure 7.- Externa l and in te rna l sur face-pressure d i s t r ibu t ions of nozzle configuration 3. Origin is a t s t a r t of b o a t t a i l ; loca t ion of t h r o a t is denoted by ve r t i ca l l i ne i n nozz le c ros s - sect ion contour; design nozzle pressure ra t io is 5.03.
36
N o z z l e e x t e r n a l p r e s s u r e d i s t r i b u t i o n
Nozz l e c ross - sec t iona l con tour I
.50
2.63
4.03 a 3.03
rn 6.06
01
Sta. 137. I6
I d 1 1
N o z z l e i n t e r n a l p r e s s u r e 1.1
.a
.6 3
.I
.2
L
L- d i s t r i b u t i o n
Figure
37
7 .- Continued.

N o z z l e e x t e r n a l p r e S. d i s t r i b u t i o n
Nozz, le cross-sect ional contour .50
L
e 4.03 e 6.04
6.03 6 7.03
-. 4 -
! I
1 1 1 1 1 1
N o z z l e i n t e r n a l p r e s s u r e d i s t r i b u t i o n
I 2
3.183'
I
Figure 7 .- Continued. 38

N o z z l e e x t e r n a l p r e 'e c l i s t r ibu t ion
Nozz le cross-sec t ional contour I
.60
PdP- 8 J/O *, 2.69
2.08
4.08 e 6.06
6.06 6 7.08
L 3.08
01
N o z z l e i n t e r n a l p r e s s u r e d i s t r i b u t i o n
(dl M, = 0.94.
Figure 7.- Continued.
39

N o z z l e e x t e r n a l p r e s s u r e d i s t r i b u t i o n
1l!lllll
."t 3.183' t
e 2.03 A 2.64
b 4.09 & 3.03
6.13 e 6.06
7.08 8.10
f I:.::
0 1 1 1
N o z z l e i n t e r n a l p r e s s u r e d i s t r i b u t i o n
.2 .4
J
( e ) M, = 1.20.
Figure 7 .- Continued.
40
N o z z l e e x t e r n a l p r e s s u r e d i s t r i b u t i o n
PC&- 0 J/O
2.0s 1.61
A 2.61 b 2.96 a 9.97 e 4.99 0 6.02 A 6.97
8.02 J
Nozz le cross-sec t ional contour .60
I
Sta. 137. I6 I Nozzle! throat 2 3.183' t
I I I ! I 0
N o z z l e i n t e r n a l p r e s s u r e d i s t r i b u t i o n 1.t
.B
.6 3
.4
.2
c -
1 IMR mm .4
/ j l l l 1 1 1 1 : I! I 2 : I l l
-.4
1.28.
Figure 7.- Concluded.
41

Nozz le ex t e rna l p res sure d i s t r ibu t ion Pt,JP- e J/O
1.52 0 2.06
4.04 3.04
5.07
6 7.03
A 2.55
6.08
0" '9
Nozz!e cross-sectional G O c _z_i_ 8.283" .50
e
2 4.783" t
I I
d i s t r ibu t ion
J
1.0
N o z z l e i n t e r n a l p r e s s u r e
i
.- g
-. 4 -.2
a I
0 .2
Figure 8.- Externa l and in te rna l sur face-pressure d i s t r ibu t ions of nozzle configuration 4. Origin is a t s t a r t of b o a t t a i l ; loca t ion of t h r o a t is denoted by ve r t i ca l l i ne i n nozz le c ros s - section contour; design nozz le p ressure ra t io is 6.23.
42

No22 :1 e ex t e rna l p r ' d i s t r ibu t ion 'essure PtJP- a, J/O re 1.53
2.05 f 2.51 3.05 4.04
p 5.10 6.06
4 7.01
I !
//
~
!I 0 -2 a'
-. 4
-. 6
-. 6
Nozzle cross-sect ional contour I
1 I I 1 N o z z l e i n t e r n a l p
I I ~U
essure d i s t r ibu t ion r
- 1
(b) M, = 0.80.
Figure 8.- Continued.
43

Nozz le ex t e rna l p res sure d i s t r ibu t ion
Nozz!e cross-sect ional contour 1
t 8.283" .50
E __f_ 4.783"
t
N o z z l e i n t e r n a l p r e s s u r e d i s t r i b u t i o n 1 .o
8
.6 .-
.4
.2
0
c
.2
P*,/P-
: 2.54 0 J/O
1.50 2.02
4.05 a 3.05
e 6.07 a 5.04
+ 7.06
(c) Mm = 0.90.
Figure 8.- Continued.
44

N o z z l e e s t e r mal pres sure d i s t r ibu t ion
Nozz fe cross-sec t ional contour .50
% '25 7 0.
1 .1
.a
.6 "a
.4
.2
I
I Sta. 137. I 6 I Nozz le ! throat A 4.783"
t
I I I L N o z z l e i n t e r n a l p r e s s u r e d i s t r i b u t i o n
-. 2 0
m
.6
Pt.JP- e J/O 81 1.55
2.04 2.57
e 4.04 L 3.04 . 6.05 p 5.05
+ 7.05
(d) Mm = 0.94.
Figure 8 .- Continued. 45
t
ernal pres sure Nozzle ext j I d i s t r ibu t ion
Nozzle cross-sect ional contour .50
A 4.783" t
N o z z l e i n t e r n a l p r e s s u r e d i s t r i b u t i o n
-. 4 .2 . 4
L 3.08 b 4.07
6.09 0 5.13
8.18 # 7.11
( e ) Mm = 1.20.
Figure 8.- Continued.
46

Nozz le ex terno !I! pressure d i s t r ibu t ion
i . I ! !
! ! Nozzle cross-sect ional contour
Sta. 137. I 6 1 Nozzle j throat __f_ 4.783" t
1 I I 1 1 1 I
N o z z l e i n t e r n a l p r e s s u r e d i s t r i b u t i o n
T
I T
i .4 .6 .8 1.0
Pt..JP- :
2.52 1.99
3.01 & 3.99
5.99 + 7.01
0 4.99
8.01
Figure 8.- Concluded.
47

Nozz le ex t e rna l p res sure d i s t r ibu t ion
Nozzle cross-sect ional contour I I
.50 117"
-=rI!? 9.700" t
0 1" " - 1 -
N o z z l e i n t e r n a l p r e s s u r e d i s t r i b u t i o n
-. 4 -.2 0
( a ) M, = 0.60.
J
1.0
2.02 2 2.51 h 4.03
3.02
h 5.02 5.58
Figure 9.- Externa l and in te rna l sur face-pressure d i s t r ibu t ions of nozzle configuration 5. Origin i s a t s t a r t of b o a t t a i l ; loca t ion of t h r o a t is denoted by ver t i ca l l i ne i n nozz le c ros s - section contour; design nozz le p ressure ra t io is 10.64.
48

N o z z l e e x t e mal p r e s s u r e d i s t r i b u t i o n !
~
I ! I ! // ! I
Nozz le cross-sec t ional contour .50
I c 117'
O!
1 1 /1
I! ! I I1
N o z z l e i n t e r n a l p r e s s u r e d i s t r i b u t i o n
i f I
I
1
i
i I
f
1 G
44%
(b) M, = 0.80.
Figure 9.- Continued.
P,JP- : ;.c 2 2.51 2.02
L 3.02
4.53 4.02
5.04
6.41 4 6.04
49

N o z z l e e x t e r n a l p r e s s u r e d i s t r i b u t i o n .4
.2
0
B ba -.2
-. 4
-. 6
-.8
NozzFe cross-sec t ional contour .50
Sta. i 37. f 6
-LEI? 9.700' t
0 I I I II I
N o z z l e i n t e r n a l p r e s s u r e d i s t r i b u t i o n
.2 .4 .6 .8
Pt.JP- e J/O
1.53 2.01 f 2.51
b 3.02 4.03
6.03 5.03
+ 6.94
(c) M, = 0.90.
Figure 9 .- Continued.
50
N o z z l e e x t e r n a l p r e s s u r e d i s t r i b u t i o n
I ! 1 1 I ! 1 I !
PdP- e "J/O
1.51 2.01 ? 2.54
Nozz le cross-sec t ional contour I
f . (
.6
.6 3
.4
.z
(
i I I
1 t
I
I
?
i
I Nozzle throat
N o z z l e i n t e r n a l p r e s s u r e d i s t r i b u t i o n
( d ) M, = 0.94.
Figure 9.- Continued.
5 1

Nozz le ex ternal .4
.2
0
-2
-.4
-. 6
I I I I I I
-.a I I i I I I t lillilll
S sure d r !! 1
'istri bu t ion Pt,JPca
f 2.54
(B J/O 1.54 2.03
L 3.09 4.08
I 6.09 a 5.07
9.11 8 9.51
Nozzle cross-sect ional contour I
.50 17"
Sta. 137.16 I I Nozzle throat
0 1 1 1
N o z z l e i n t e r n a l p r e s s u r e d i s t r i b u t i o n
Mm = 1.20.
I
II iii 1.0
Figure 9.- Continued.
52

Nozz le ex t e rna l p res sure d i s t r ibu t ion
Nozzle cross-sect ional contour I
.50
Ol
I I Nozzle, throat 2 9.700' I II II I I
Nozz le i n t e rna l p res sure d i i s t r ibu t ion
M .2
I l l
i I11
1.27.
e 2.03 A 2.51 a 3.03 0 5.05
6.01
6 7.99 7.04
1.53
@ 4.00
Figure 9.- Conc lude d.
53

C ‘D ,P
.20
.18
.16
.14
. 12
.10
.08
.06
.04
.02
0
Figure 10.- Variation of je t -off , boat ta i l pressure-drag coeff ic ient with free-stream Mach number.
54

M, - 0.60 A 3 0 2 3. w
11.63 3. E2
2.12 a 28
(a) Ma = 0.60 and 0.80.
Figure 11.- Influence of nozzle pressure ratio on boattail pressure-drag coefficient.
55
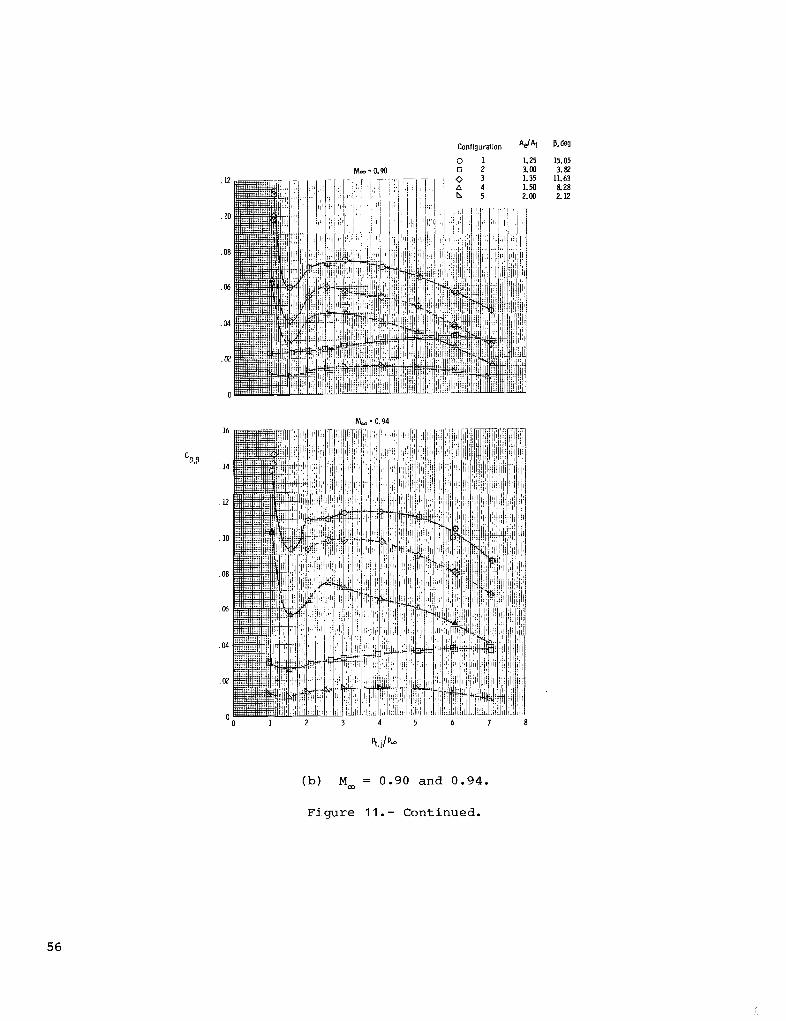
Configuration 'd't Badeg
0 1 1.25 15.05
0 3 0 2 3.00 3.82
1.35 11.63
5 2.00 2.12 1.50 8 2 8
M, - 0.94
Pt.j/P-
(b) Ma = 0.90 and 0.94.
Figure 11. - Continued.
56

.20
.18
. 16
.14
.lz
.10
.08
. 0 6
. M
.m
0
.l8
.16
. 14
.lz
10
.08
.06
.M
.a
0 0
M- - 1.28
8. deg 15.05
11.63 3.82
2.12 a 28
8 9 10 11
i
( c ) M, = 1.20 and 1.28.
Figure 11. - Concluded.
57

CD, f
. 010
.008
. 010
.008
.OlO
.008
. 010
.008
.010
.008
Figure 12.- Calculated skin-fr ic t ion drag of the var ious boa t ta i l s from s t a t i o n 137.16 cm t o t h e e x i t .
MW
u o - 0- .60 - Q- .90 - *-1.20
1.0
.9
1.0
.9
.8
1.0
.9
1.0
.9
1.0
.9
. 8
.7 1 2 3 4 5 6 7 8 9 10
Pt, j/P-
Figure 13.- Nozzle internal performance a t s t a t i c and wind-on conditions.
59

Configuration
m
1.00
.96
1.00
.96
1.00
.96
1.00
.96
1.00
-96 1 2 3 4 5 6 7 8
Figure 14.- Sta t ic d i scharge coef f ic ien ts of the nozzles.
60

Moo = 0.60
Configuration (pt, i/poo),,, A,/At
1. 1 M, - 0.80
1.0
. 9
.8
.7
. 6
.5 1 2 3 4 5 6 7 8 9
Pt,j/P-
(a) Mm = 0.60 and 0.80.
Figure 15.- Measured thrust-minus-drag performance of all nozzle-boattail combinations.
61

1.0 M, = 0.90
. 9
.a
.7
.6
.5
. 4
1 2 3 4 5 6 7 a 9
Pt. j lpm
(b) M, = 0.90 and 0.94.
Figure 15. - Continued.
62

1. I
1. a
.9
.8
.?
. 6 Fi - D, -
Fi .5
. 4
. 3
.2
.1
0
Ma - 1.20
1 2 3 4 5 6 7 8 9 10 11
Pt,j/P-
(c) M, = 1.20.
Figure 15. - Continued.
63

1.1
1.0
. 9
.8
. 7
.6
.5
.4
. 3
. 2
. 1
n Y
1 2 3 4 5
M, = 1.30
onfiguration
0 1 0 2 0 3 A 4 b 5
'pt, {'W'des
4.25 21.23 5.03 6.23
10.65
V A t
1.25 3.00 1.35 1.50 2.00
!3, deg
15.05 3.82
11.63 8.28 2.12
(d) Ma = 1.30.
F igure 15. - Concluded.
64

9
8
7
6
5
4
3
2
1
0 1 2 3 4 5 6 7 8 9 10 11
Pt, j/P-
(a) Configurations 1 and 2. At/% = 0.25.
Figure 16.- Aerodynamic ideal thrust coefficient as a function of jet total-pressure ratio.
65

‘F,i
1 2 3 4 5 6 7 8 9 10 11
Pt,j/Pm
(b) Configuration 3. At/Am = 0.30.
Figure 16.- Continued.
66

(c) Configuration 4. At/Am = 0.35.
Figure 16.- Continued.
67
c

10
9
6
'F,i
4
"
1 2 3 4 5 6 7 8 9 10 11
Pt, j/P-
(d) Configurat ion 5. At/Am = 0.42.
Figure 16.- Concluded.
68

_. . .
Figure 17.- Representative schedule of nozzle pressure ratio with Mach number for an advanced low-bypass-ratio turbofan engine at maximum rotational speed.

4 0
F j - Dn
Fi
1 .oo
.98
.96
.94
Conf igura t ion
- 1 -"- 3 --+- 4
5
Ae/At
Dry Maximum Dry P a r t i a1 A/B Maximum A / B
4.25 1.25 0.25 5.03 1.35 .30 6.23 1.50 .35
10.64 2.00 .42
15.05 11.63
8.28 2.12
. 5 .6 .7 .8 .9 1 .o 1.1 1.2 1.3 1.4
Figure 18.- Summary of nozzle-boattail overall performance for the pressure-ratio schedule of figure 17. Solid symbols indicate internal gross-to-ideal thrust ratios; flagged symbol denotes assumed subsonic cruise point at Mw = 0.90; pt,j/pw = 4.0.

Mw= 0.60
-. 81
I
Ma, = 0.60 and 0.80.
P t j p W = 7.03 a
pt, i/p, = 7.05
Figure 19.- Comparison of experimentally and ana ly t i ca l ly determined external pressure dis t r ibut ions for nozzle configurat ion 1. Boat ta i l angle is 15.05O; design nozzle p re s su re r a t io is 4.25.
71
.4
.2
0
9 ua -.2
-. 4
-. 6
-. 8
.4
.2
0
-.2
-. 4
-. 6
-. 8 -. 4 -.2
M, =
M,=L 28
1.20 and
1 1 3 Data
/ [ - MOC (ref. 18)
1.28.
p /p,= 1o.m t. i
Data MOC (ref. 18)
Figure 19 .- Concluded.
7 2

Ma= 0. €4
a
-..I -. 6 I -. 81
. I
.2
0
9 ua -.6
-. 4
-. 6
-. 6
I
"= 0.80
T
.4 .6
( a ) Mm = 0.60 and 0.80.
Figure 20.- Comparison of experimentally and a n a l y t i c a l l y determined external pressure dis t r ibut ions for nozzle configurat ion 2. Boat ta i l angle is 3.82O; design nozzle p r e s s u r e r a t i o is 21.23.
73
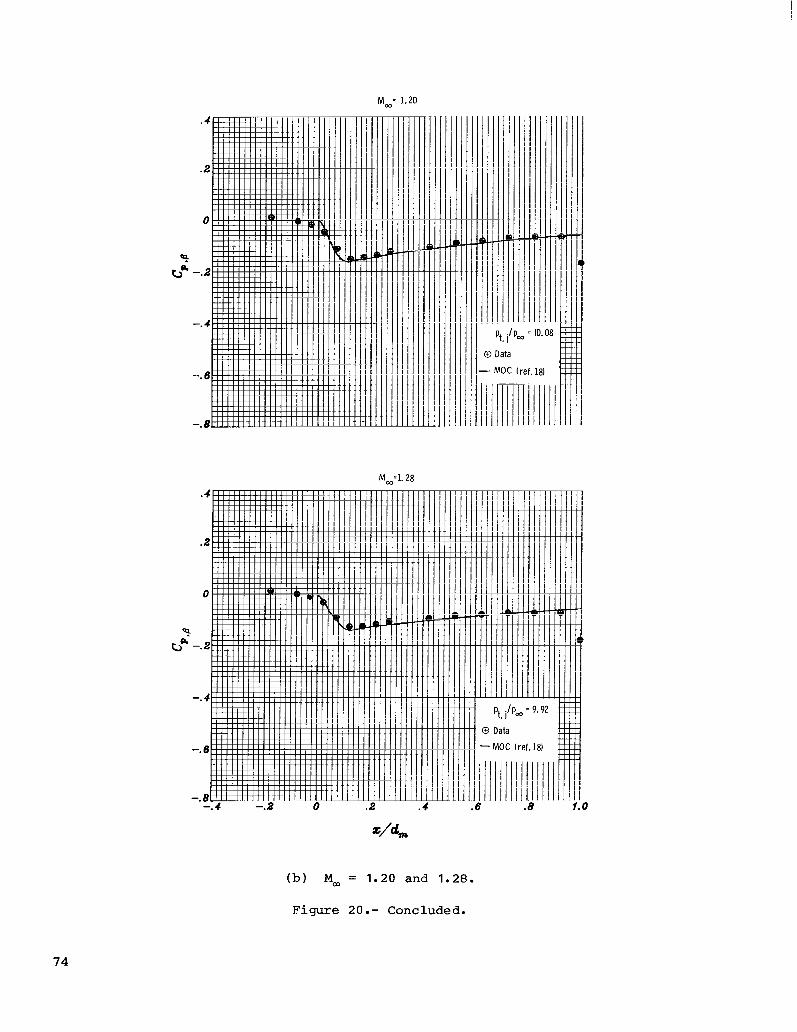
Mm= 1.20
.4
.2
0
-.2
-. 4
-. 6
-. 8
Mm=l. 28
T-
I ll I
I
I /
I
li
pt, jp, = IO. 08
0 Data
- MOC (ref.18)
1 0 Data
1 - MOC (ref. 18) I
4 pt, i/pm = 9.92 i .6 .8
74
(b) M, = 1.20 and 1.28.
Figure 20 .- Concluded .
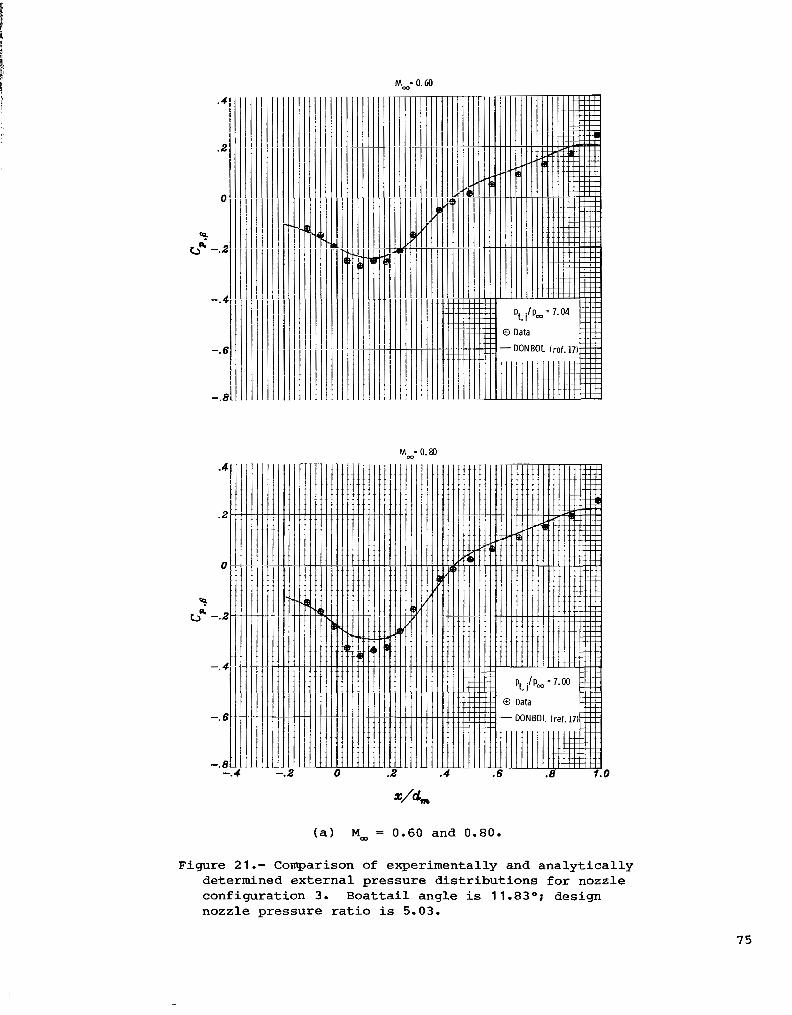
.1
Mm- 0.60
Mm= 0. t
Ma = 0.60 and 0.80.
Figure 21.- Comparison of experimentally and analytically determined external pressure distributions for nozzle configuration 3. Boattail angle is 11.83O; design nozzle pressure ratio is 5.03.
75

"= 1. 20
M;l. 28
/ I
pt, i/p, = IO. 13
0 Data
- MOC (ref. 18)
-. 4 -. 2 0 .e .I .8 .8 1.0
4 %
(b) M, = 1.20 and 1.28.
Figure 2 1 .- Concluded.
76

M,' 0.60.
% bR "2'
-. 4
-. 6
-.8
.4
.2
0
-. 4
-.6
-.8 - .. 4 -.2 I
.z
m i
M; 0.80.
pt, { p, = 7.03 a
m
-DONBOL (ref.17)
( a ) M, = 0.60 and 0.80.
Figure 22.- Comparison of experimental ly and analyt ical ly de te rmined ex terna l p ressure d i s t r ibu t ions for nozz le configurat ion 4. Boat ta i l angle is 8.28O; design nozzle p r e s s u r e r a t i o is 6.23.
77
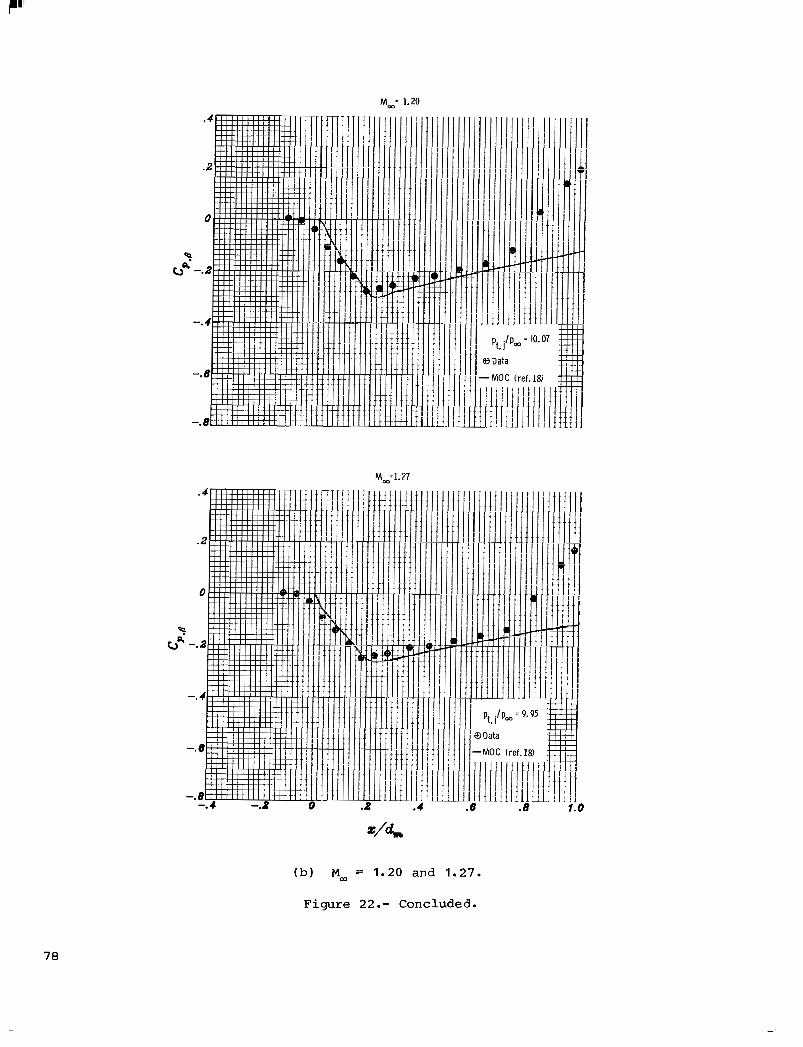
-. 4 -. 2 0
M,=l. 27
Data
MOC (ref. 181
= 9.95
Data
.MOC (ref. 18)
(b) M, = 1.20 and 1 .27.
Figure 22 .- Concluded.
78
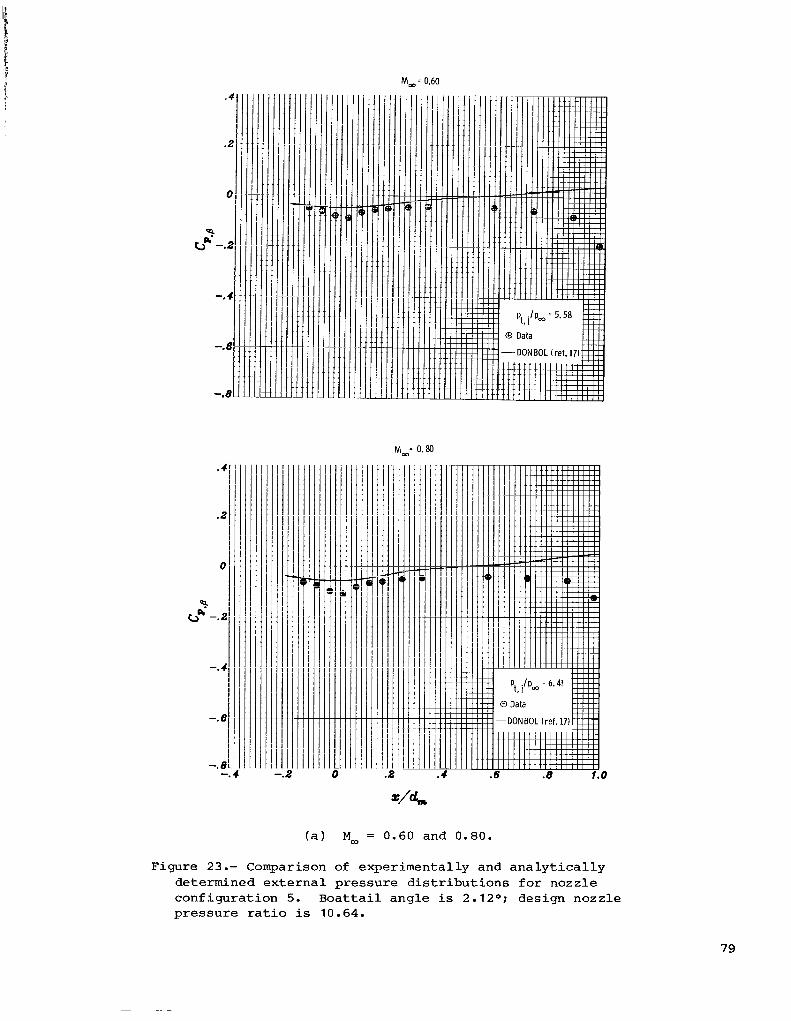
M, = 0.60
.2 I
O1
-.8 1
Figure 23 .- Comparison determined external
M,= 0.80
M, = 0.60 and
= 5.58
. (ref. 17)
0 . 8 0 .
of experimental ly and analyt ical ly pressure d i s t r ibu t ions for nozz le
configurat ion 5. Boat ta i l angle is 2.12O; design nozzle pressure ratio is I O . 64.
79
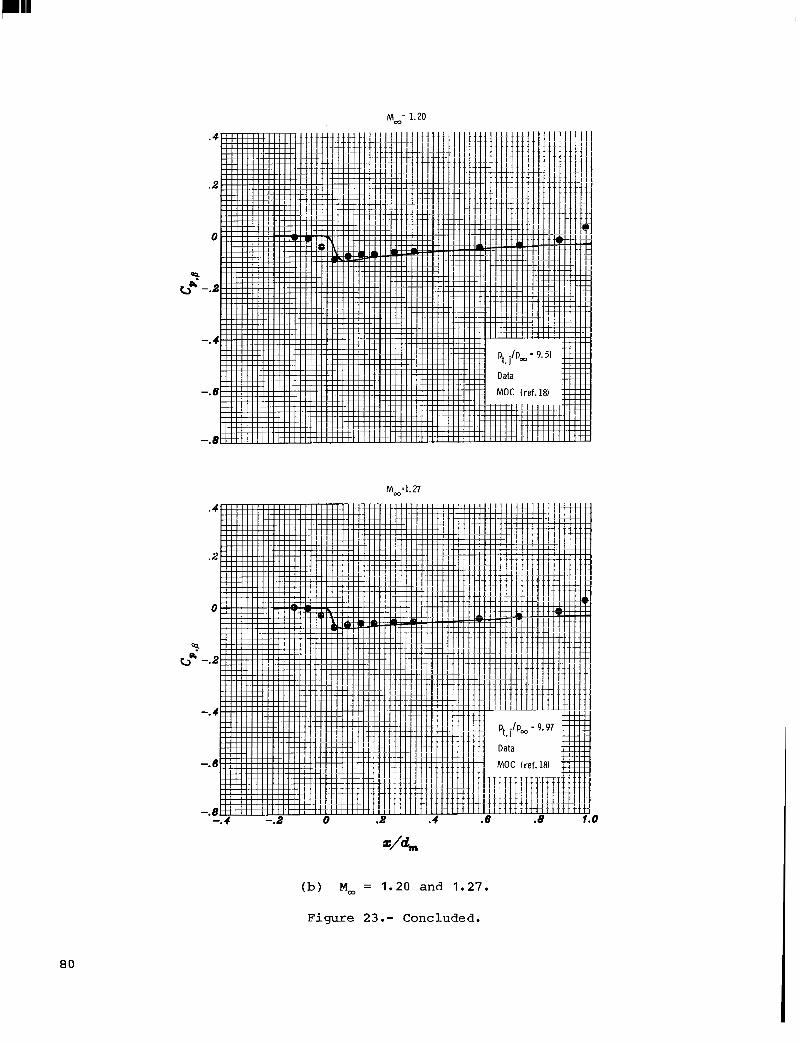
Mm= 1.20
Mm=l. 27
(b) M, = 1.20 and 1.27.
Figure 23 .- Concluded.
80

Conf i gu ra t i on I Desiqn nozzle pressure rat io i s 4.25.
1.0
.8
.4
.2
Figure 24.-
Conf igurat ion 2. Design nozz le pressure ra t io is 21.23.
Configurations 1 and 2.
Comparison of experimentally and analytically de te rmined in te rna l p ressure d i s t r ibu t ions a t a free-stream Mach number of 0.60.
8 1

Conf igu ra t i on 4. Design nozz le pressure ra t io is 6.23.
0 Data
- N A P (I
i I
I i 1
i 1
t
I I I
+ef. 19) 1
(b) Configurations 3 and 4.
Figure 24.- Continued.
82

I! i
.8
3 .6
.I
.a
Configuration 5. Design nozzle pressure ratio is 10.64.
(c) Configuration 5.
Figure 24.- Concluded.
83
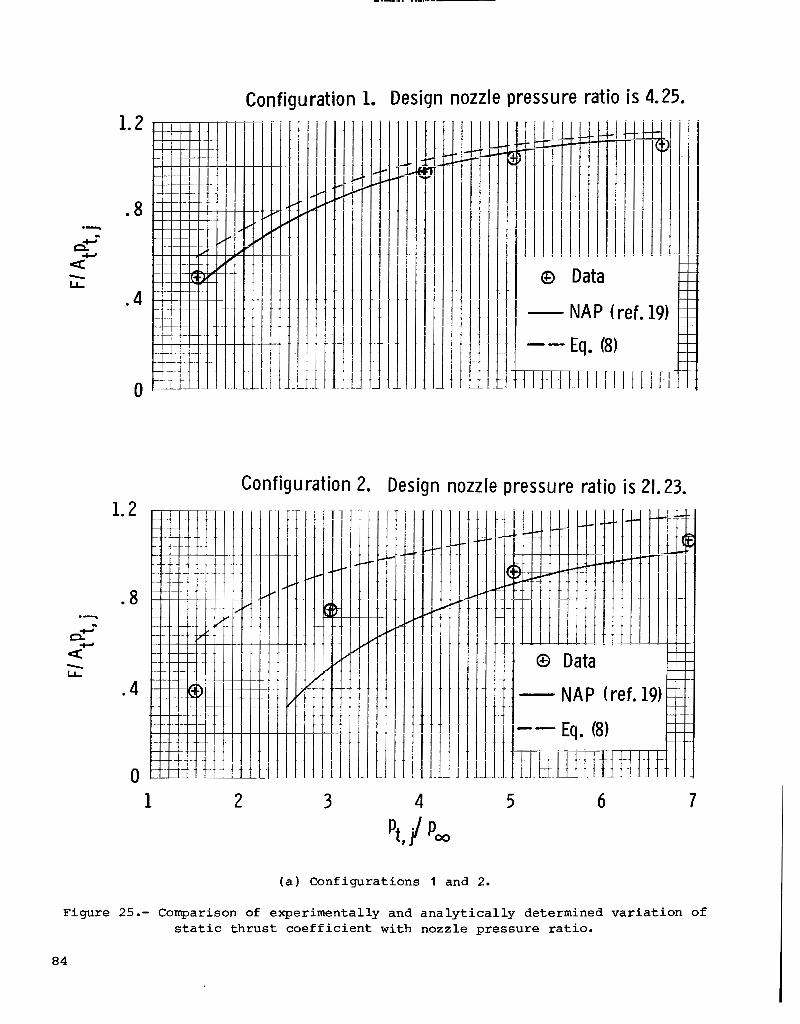
a - L
1.2
.8
.4
0
1.2
.8
.4
0
Conf igurat ion 1. Design nozzle pressure ratio is 4.25.
- NAP (ref. 19
-- Eq. (8) K H T H T I I I I IT ! I -
)
I '
Configuration 2. Design nozzle pressure ratio is 21.23.
1 2 3
1 0 Data
- NAP (ref. 19)
I -- Eq. (8)
m i t i i-2 tt I t
Configurations 1 and 2.
5 7
Figure 25.- Comparison of experimentally and analytically determined variation of s t a t i c t h rus t coe f f i c i en t w i th nozz le p re s su re r a t io .
84

+
a -s LL
Conf igurat ion 3. Design nozzle pressure rat io is 5.03.
pressure rat io i s 6.23.
2
I
3
I i L 1 1
i 4
(b) Configurations 3 and 4.
Figure 25.- Continued.
0 Data #ti - NAP (ref. 19) I
I" "_ 1" Eq. (8) _"
I 1 r I ! ! ! ! ! ! ! ! ! ! ! ! . ! t t t . . .
I "_ "_
5 6 7
85

1.2
.8
. 4
0
Conf igurat ion 5. Design nozzle pressure ratio is 10.64.
1 2 3 4 5 6 7
( c ) Configuration 5.
Figure 25. - Concluded.
06

1. Report No. . . . . .
- 1 2. Government Accession No. . ".
NASA TP- 1953 4. Title and Subtitle
. " - . . ""
EXPERIMENTAL AND ANALYTICAL INVESTIGATION OF AXISYMMETRIC SUPERSONIC CRUISE NOZZLE GEOMETRY AT MACH NUMBERS FROM 0.60 TO 1.30
7. Author(s1 - . - " - . - . . . - -
George T. Carson, Jr., and Edwin E. Lee, Jr.
"" . . ~ - _ _ _ _ . . -._ .
9. Performing Organization Name and Address ~-
NASA Langley Research Center Hampton, VA 23665
~ ~.
12. Sponsoring Agency Name and Address "
National Aeronautics and Space Administration Washington, DC 20546
. , - - - . . . . - . -. ". - -. 15. Supplementary Notes
- "
3. Recipient's C a t a l o g No.
5. Report Date December 198 1
6. Performing Organization Code 505-32-13-01
. . "
8. Performing Organization Report No.
L- 1466 1 . . . -
10. Work Unit No.
11. Contract or Grant No, . -
13. Type of Report and Period Covered . .. ~. - .
Technical Paper ~ . . - ~"
14. Sponsoring Agency Code
". "" "- ." -~ -
16. Abstract . . . - " . "
An experimental investigation has been conducted which provides quantitative pres- sure and force data for five axisymmetric boattail nozzle configurations. These configurations simulate the variable-geometry feature of a single nozzle design operating over a range of engine operating conditions. This investigation was performed in the Langley l6-~oot Transonic Tunnel at Mach numbers from 0.60 to 1.30. The experimental data were also compared with theoretical predictions.
- ~ . . . . " " . - . . . . . . - . " . . "- " - " . . - . . . .
7. Key Words (Suggested by Authoris)) 18. Distribution Statement . - . A ~
Variable-geometry nozzle
Axisymmetric boattail nozzle Variable-cycle engine
Unclassified - Unlimited
Supersonic cruise aircraft
- Subject Category 02
Security Classif. (of this page) 21. No. of Pages 22. Price Unclassified Unclassified 1 A04
" .. - "
For Sale by the National Technical Information Service, Springfield, Virginia 22161
NASA-Langley, 1981

I I I I Il l1 I1111I 1ll11111 II I 1
National aeronautics and Space Administration
,Washington, D.C. 20546 Official Business
Penalty for Private Use, $300 ' .
. . I .
. . .
. . - ,
. ,
THIRD-CLASS BULK RATE Postage' and Fees Paid
. Space Administration National Aeronautics and
NASA451 , .
. . ' .
, . 1 , '
. . . ,
/
. I If Undeliverable (Section 158 ' ' . _ PoSTM'ASTER'. Postal Manual) Do N o t R e t y n ,
. .
. . ; , . .
, - ~
~.
. . / .