Titanium dioxide/amine hybrid nanotubes. Optical properties and behavior as lithium–ion electrode
Upload
khangminh22Category
view
0download
0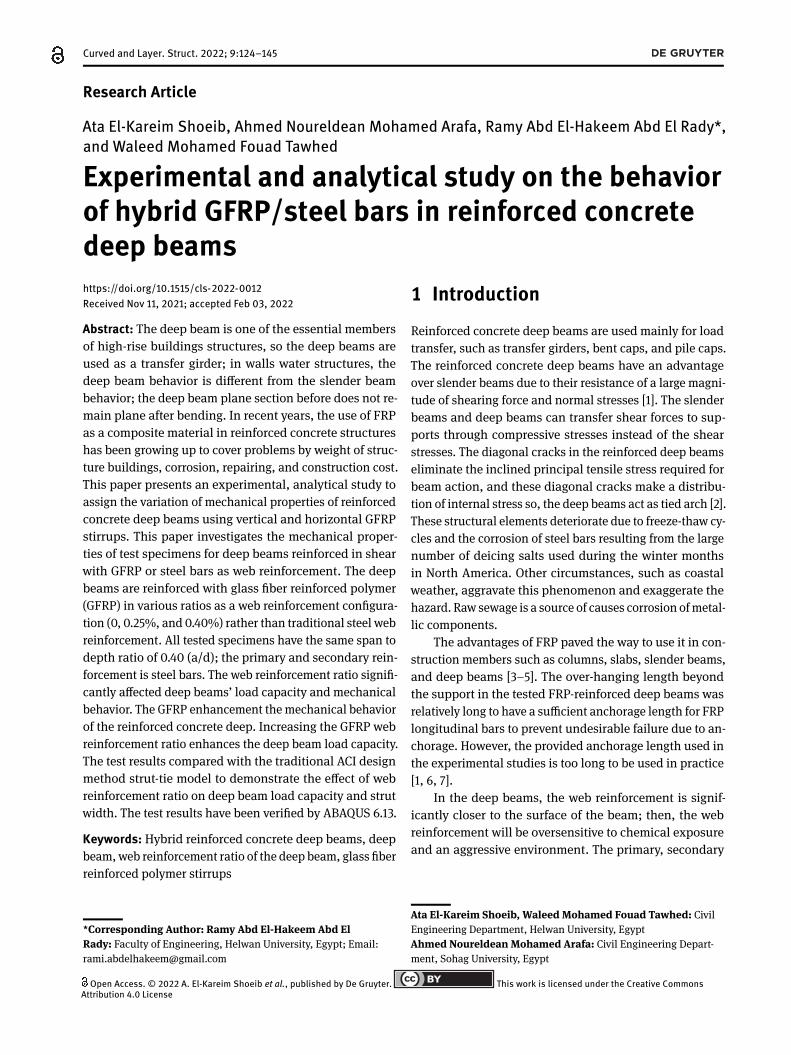
Open Access.© 2022 A. El-Kareim Shoeib et al., published by De Gruyter. This work is licensed under the Creative CommonsAttribution 4.0 License
Curved and Layer. Struct. 2022; 9:124–145
Research Article
Ata El-Kareim Shoeib, Ahmed Noureldean Mohamed Arafa, Ramy Abd El-Hakeem Abd El Rady*,and Waleed Mohamed Fouad Tawhed
Experimental and analytical study on the behaviorof hybrid GFRP/steel bars in reinforced concretedeep beamshttps://doi.org/10.1515/cls-2022-0012Received Nov 11, 2021; accepted Feb 03, 2022
Abstract: The deep beam is one of the essential membersof high-rise buildings structures, so the deep beams areused as a transfer girder; in walls water structures, thedeep beam behavior is different from the slender beambehavior; the deep beam plane section before does not re-main plane after bending. In recent years, the use of FRPas a composite material in reinforced concrete structureshas been growing up to cover problems by weight of struc-ture buildings, corrosion, repairing, and construction cost.This paper presents an experimental, analytical study toassign the variation of mechanical properties of reinforcedconcrete deep beams using vertical and horizontal GFRPstirrups. This paper investigates the mechanical proper-ties of test specimens for deep beams reinforced in shearwith GFRP or steel bars as web reinforcement. The deepbeams are reinforced with glass fiber reinforced polymer(GFRP) in various ratios as a web reinforcement configura-tion (0, 0.25%, and 0.40%) rather than traditional steel webreinforcement. All tested specimens have the same span todepth ratio of 0.40 (a/d); the primary and secondary rein-forcement is steel bars. The web reinforcement ratio signifi-cantly affected deep beams’ load capacity and mechanicalbehavior. The GFRP enhancement the mechanical behaviorof the reinforced concrete deep. Increasing the GFRP webreinforcement ratio enhances the deep beam load capacity.The test results compared with the traditional ACI designmethod strut-tie model to demonstrate the effect of webreinforcement ratio on deep beam load capacity and strutwidth. The test results have been verified by ABAQUS 6.13.
Keywords: Hybrid reinforced concrete deep beams, deepbeam,web reinforcement ratio of the deep beam, glass fiberreinforced polymer stirrups
*Corresponding Author: Ramy Abd El-Hakeem Abd ElRady: Faculty of Engineering, Helwan University, Egypt; Email:[email protected]
1 IntroductionReinforced concrete deep beams are used mainly for loadtransfer, such as transfer girders, bent caps, and pile caps.The reinforced concrete deep beams have an advantageover slender beams due to their resistance of a large magni-tude of shearing force and normal stresses [1]. The slenderbeams and deep beams can transfer shear forces to sup-ports through compressive stresses instead of the shearstresses. The diagonal cracks in the reinforced deep beamseliminate the inclined principal tensile stress required forbeam action, and these diagonal cracks make a distribu-tion of internal stress so, the deep beams act as tied arch [2].These structural elements deteriorate due to freeze-thaw cy-cles and the corrosion of steel bars resulting from the largenumber of deicing salts used during the winter monthsin North America. Other circumstances, such as coastalweather, aggravate this phenomenon and exaggerate thehazard. Raw sewage is a source of causes corrosion ofmetal-lic components.
The advantages of FRP paved the way to use it in con-struction members such as columns, slabs, slender beams,and deep beams [3–5]. The over-hanging length beyondthe support in the tested FRP-reinforced deep beams wasrelatively long to have a sufficient anchorage length for FRPlongitudinal bars to prevent undesirable failure due to an-chorage. However, the provided anchorage length used inthe experimental studies is too long to be used in practice[1, 6, 7].
In the deep beams, the web reinforcement is signif-icantly closer to the surface of the beam; then, the webreinforcement will be oversensitive to chemical exposureand an aggressive environment. The primary, secondary
Ata El-Kareim Shoeib, Waleed Mohamed Fouad Tawhed: CivilEngineering Department, Helwan University, EgyptAhmed Noureldean Mohamed Arafa: Civil Engineering Depart-ment, Sohag University, Egypt

Experimental and analytical study on the behavior of hybrid GFRP/steel bars | 125
reinforcement is not hypersensitive as web reinforcementto chlorides and chemical exposure. In addition to that, theFRP can control crack width to avoid chloride migration tothe inner reinforcement [8–10]. Thus, the present researchproposal investigates incorporating FRP bars as web rein-forcement mats in deep beams while maintaining the mainreinforcement bars. This technique reduced maintenancecosts because only the maintenance will be for primaryreinforcement, facilitating repairing processes.
As previous research indicates, the steel web reinforce-ment in reinforced concrete deep is considered essentialfor crack control [11]. Nevertheless, there are odds betweencodes prevision and researchers about the effect of steelweb reinforcement on the strength of reinforced concretedeep beams. For instance, other researchers reported thatthe steel web reinforcement improved the strength of the in-clined strut and the shear strength of concrete deep beams[12]. Birrcher et al. 2013 [13] indicate that the strength ofreinforced concrete deep beams is not affected by the webreinforcement. Moreover, providing theminimum steel webreinforcement in a reinforced concrete deep beam designedaccording to ACI 318 (2014) [14] would increase the capacityby 1.67 over the load capacity of a deep beam without steelweb reinforcement.
2 MethodologyThe methodology used in this study is experimental withtheoretical validation. The experimental program usedglass fiber reinforced polymer as web reinforcement ratherthan steel web reinforcement. Experiments were conductedon seven reinforced concrete beams to understand betterthe behavior of deep concrete beams reinforced with glassfiber reinforced polymer as web reinforcement and longi-tudinal steel bars. Finally, the verification of experimentalresults was varied using theoretical analyses based on ACI318-19 [15], ACI 440.1R-03 [16], and ABAQUS.
3 Experimental program
3.1 Description of test specimens
Seven reinforced concrete beams were cast with rectangu-lar cross-sections, sized 120 mm (width) × 800 mm (height)× 1170 mm length; Figure 1 shows the details of tested spec-imens. Figure 1 shows the reinforcement used in all spec-imens: two bars of 16 mm diameter, four bars of 12 mm
2
reinforcement. Moreover, providing the minimum steel web reinforcement in a reinforced concrete deep beam designed
according to ACI 318 (2014) [14] would increase the capacity by 1.67 over the load capacity of a deep beam without
steel web reinforcement.
2 Methodology
The methodology used in this study is experimental with theoretical validation. The experimental program used glass
fiber reinforced polymer as web reinforcement rather than steel web reinforcement. Experiments were conducted on
seven reinforced concrete beams to understand better the behavior of deep concrete beams reinforced with glass fiber
reinforced polymer as web reinforcement and longitudinal steel bars. Finally, the verification of experimental results was
varied using theoretical analyses based on ACI 318-19 [15], ACI 440.1R-03 [16], and ABAQUS.
3 Experimental program
3.1 Description of test specimens Seven reinforced concrete beams were cast with rectangular cross-sections, sized 120 mm (width) x 800 mm (height) x
1170 mm length; Figure 1 shows the details of tested specimens. Figure 1 shows the reinforcement used in all specimens:
two bars of 16 mm diameter, four bars of 12 mm diameter in the bottom reinforcement, and two bars of 12 mm diameter
in the top reinforcement. The laboratory saw the casting of two groups of reinforced concrete deep beams. The exception
is the control beam, which has no web reinforcement. The first group consists of three beams with varying steel web
reinforcement ratios, except the control beam. Second, this group has four beams, each with a different glass fiber-
reinforced polymer web reinforcement. Table 1 below contains information about the tested specimens (1).
Group Specimen ID Web
reinforcement Sh Sv ρh % ρv %
A
BS1
Steel
0 0 0 0
BS2 188 188 0.25 0.25
BS3 118 118 0.40 0.40
B
BG1
GFRP
0 118 0.00 0.40
BG2 118 0 0.40 0.00
BG3 118 118 0.40 0.40
BG4 188 188 0.25 0.25
Table 1: Specimen’s reinforcement details.
1170
135 900 135
800
PP
435435 300
A
2 T 12
4 T 12
+
2 T 16
SEC. A-A
800
120
20
20
20
20
A
Sv
Sh
Figure 1: Details of a typical specimen
126 | A. El-Kareim Shoeib et al.
Table 1: Specimen’s reinforcement details
Group Specimen ID Web reinforcement Sh Sv ρh % ρv %
ABS1
Steel0 0 0 0
BS2 188 188 0.25 0.25BS3 118 118 0.40 0.40
B
BG1
GFRP
0 118 0.00 0.40BG2 118 0 0.40 0.00BG3 118 118 0.40 0.40BG4 188 188 0.25 0.25
diameter in the bottom reinforcement, and two bars of 12mm diameter in the top reinforcement. The laboratory sawthe casting of two groups of reinforced concrete deepbeams.The exception is the control beam, which has no web re-inforcement. The first group consists of three beams withvarying steel web reinforcement ratios, except the controlbeam. Second, this group has four beams, each with a dif-ferent glass fiber-reinforced polymer web reinforcement.Table 1 below contains information about the tested speci-mens (1).
3.2 Material properties and mix preparations
For all tested R.C beams, concrete compressive strengthwas equal to 25 Mpa consisting of Portland cement, equiva-lent to ASTM C150/C150M-15, natural aggregates, and natu-ral water. The mixing of the concrete component, such asdolomite, sand, and cement, was performed using a drummixer with a capacity of 0.125 m3 in a dray mix; then, thewater was added gradually to the mix; while mixing stayedwith concrete became homogeneous. The cast of speci-mens were in slabs formworks. All specimens were curedfor seven days and then removed from the formwork andstored until testing. For each mix, three cubes with dimen-sions 150×150×150 mm and three cylinders with 150×300mm dimensions were taken during the cast of deep beamsto specify the concrete strength. The cubes and cylinderswere tested after 7 and 28 days to specify the concrete com-pressive strength. Table 2 illustrates the mixed proportionsof the concrete. The yielding and ultimate stress for thesteel was 360, 520 Mpa, respectively; Table 3 illustrates theproperties of the GFRP.
Table 2: Concrete mix proportions (unit: kg/m3)
Component Concrete mixCement 350Sand 630
Dolomite 1260Water 175
Table 3: GFRP reinforcement bar properties
Bar diameter(mm)
Area(mm2)
Tensile strength(Mpa)
Elasticmodulus(GPa)
6 28.26 510 45
4 Instrumentation and testingprocedure
4.1 Experimental setup and testing
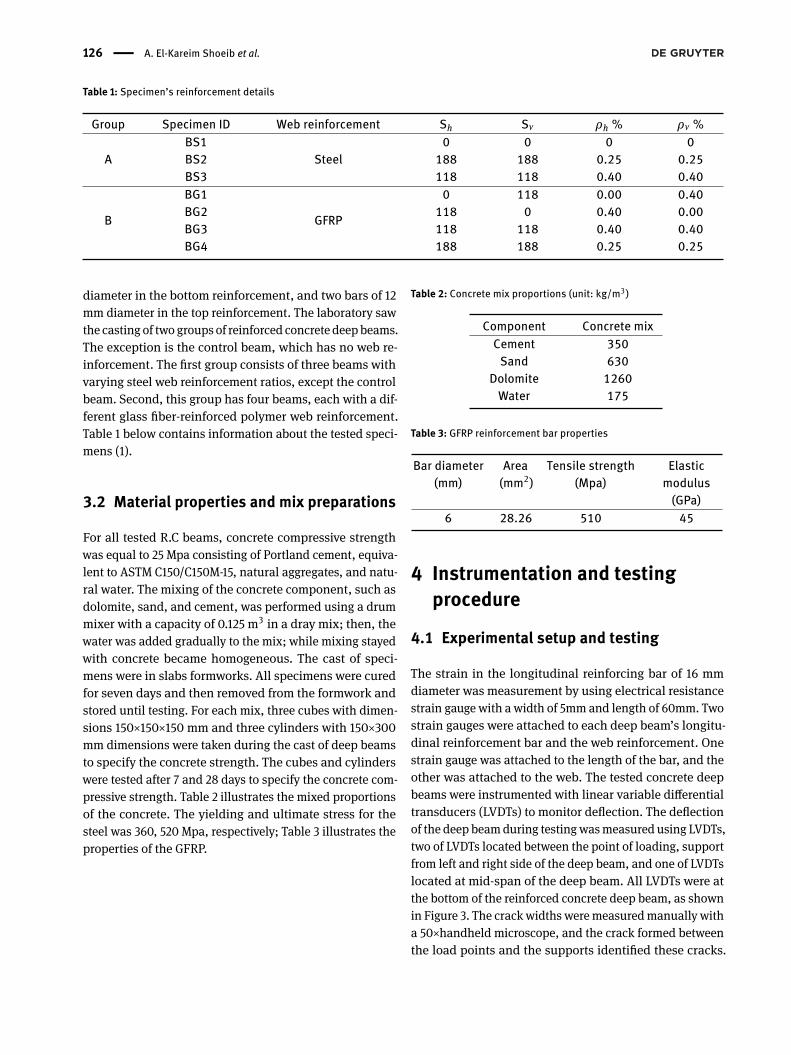
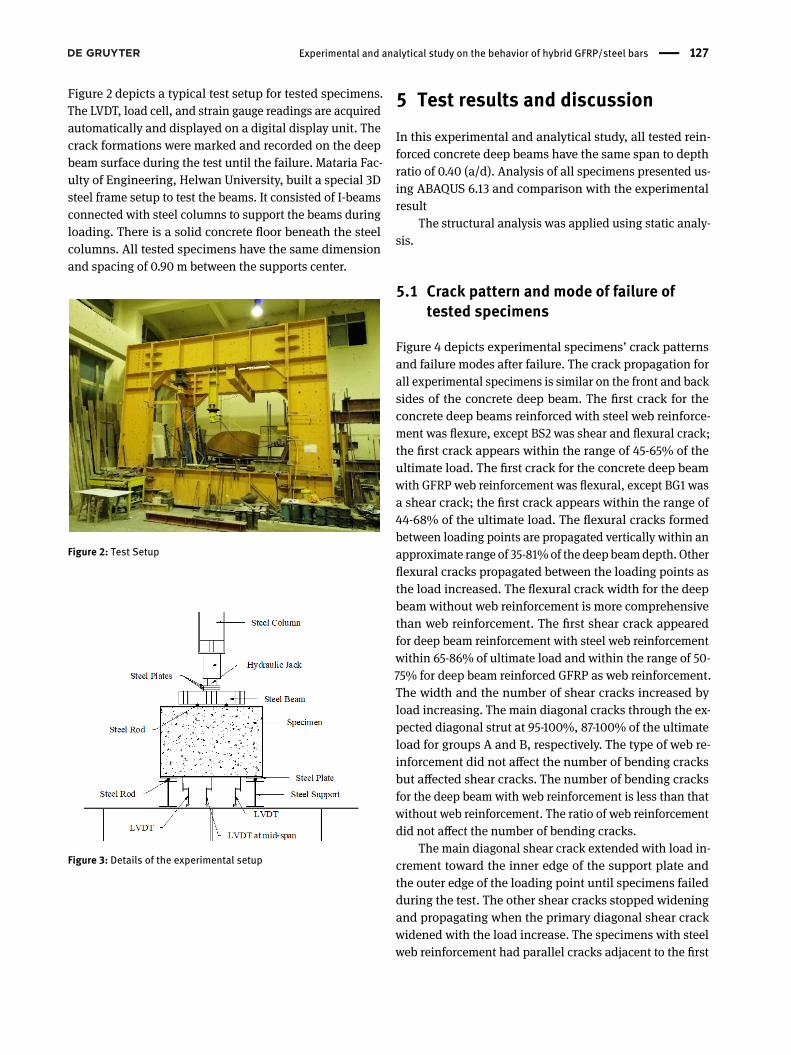
The strain in the longitudinal reinforcing bar of 16 mmdiameter was measurement by using electrical resistancestrain gauge with a width of 5mm and length of 60mm. Twostrain gauges were attached to each deep beam’s longitu-dinal reinforcement bar and the web reinforcement. Onestrain gauge was attached to the length of the bar, and theother was attached to the web. The tested concrete deepbeams were instrumented with linear variable differentialtransducers (LVDTs) to monitor deflection. The deflectionof the deep beamduring testingwasmeasured using LVDTs,two of LVDTs located between the point of loading, supportfrom left and right side of the deep beam, and one of LVDTslocated at mid-span of the deep beam. All LVDTs were atthe bottom of the reinforced concrete deep beam, as shownin Figure 3. The crack widths weremeasuredmanually witha 50×handheld microscope, and the crack formed betweenthe load points and the supports identified these cracks.
Experimental and analytical study on the behavior of hybrid GFRP/steel bars | 127
Figure 2 depicts a typical test setup for tested specimens.The LVDT, load cell, and strain gauge readings are acquiredautomatically and displayed on a digital display unit. Thecrack formations were marked and recorded on the deepbeam surface during the test until the failure. Mataria Fac-ulty of Engineering, Helwan University, built a special 3Dsteel frame setup to test the beams. It consisted of I-beamsconnected with steel columns to support the beams duringloading. There is a solid concrete floor beneath the steelcolumns. All tested specimens have the same dimensionand spacing of 0.90 m between the supports center.
Figure 2: Test Setup
Figure 3: Details of the experimental setup
5 Test results and discussionIn this experimental and analytical study, all tested rein-forced concrete deep beams have the same span to depthratio of 0.40 (a/d). Analysis of all specimens presented us-ing ABAQUS 6.13 and comparison with the experimentalresult
The structural analysis was applied using static analy-sis.
5.1 Crack pattern and mode of failure oftested specimens
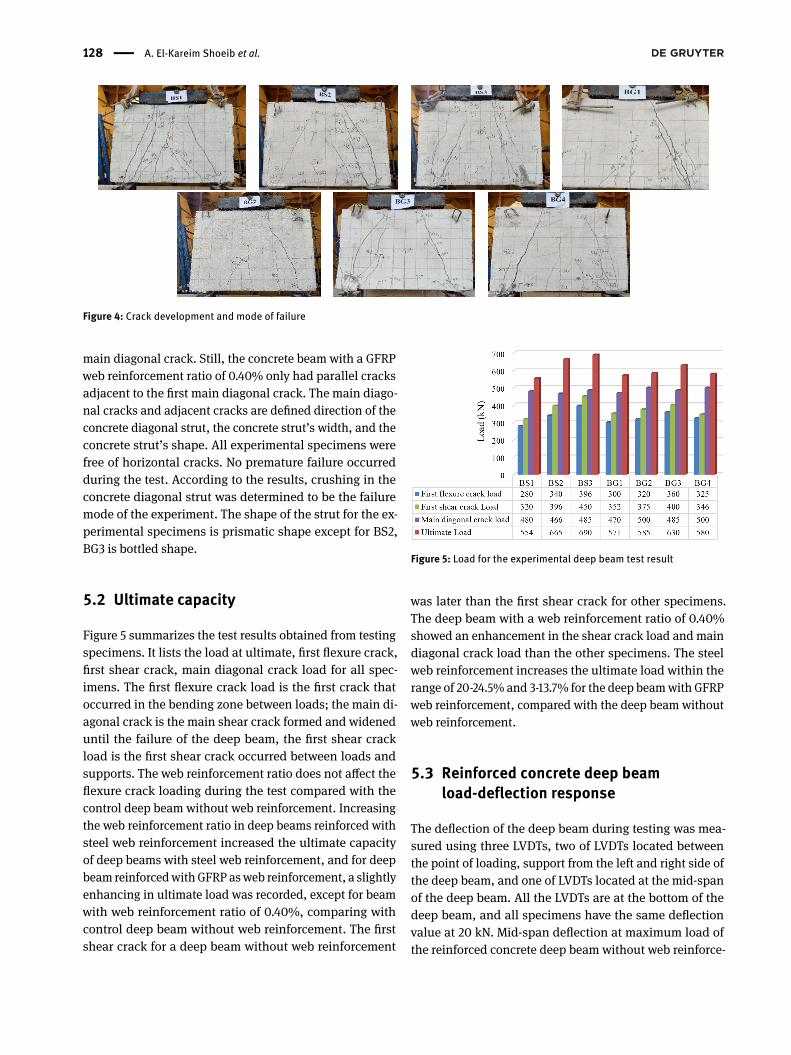
Figure 4 depicts experimental specimens’ crack patternsand failure modes after failure. The crack propagation forall experimental specimens is similar on the front and backsides of the concrete deep beam. The first crack for theconcrete deep beams reinforced with steel web reinforce-ment was flexure, except BS2 was shear and flexural crack;the first crack appears within the range of 45-65% of theultimate load. The first crack for the concrete deep beamwith GFRP web reinforcement was flexural, except BG1 wasa shear crack; the first crack appears within the range of44-68% of the ultimate load. The flexural cracks formedbetween loading points are propagated vertically within anapproximate range of 35-81%of the deep beamdepth. Otherflexural cracks propagated between the loading points asthe load increased. The flexural crack width for the deepbeam without web reinforcement is more comprehensivethan web reinforcement. The first shear crack appearedfor deep beam reinforcement with steel web reinforcementwithin 65-86% of ultimate load and within the range of 50-75% for deep beam reinforced GFRP as web reinforcement.The width and the number of shear cracks increased byload increasing. The main diagonal cracks through the ex-pected diagonal strut at 95-100%, 87-100% of the ultimateload for groups A and B, respectively. The type of web re-inforcement did not affect the number of bending cracksbut affected shear cracks. The number of bending cracksfor the deep beam with web reinforcement is less than thatwithout web reinforcement. The ratio of web reinforcementdid not affect the number of bending cracks.
The main diagonal shear crack extended with load in-crement toward the inner edge of the support plate andthe outer edge of the loading point until specimens failedduring the test. The other shear cracks stopped wideningand propagating when the primary diagonal shear crackwidened with the load increase. The specimens with steelweb reinforcement had parallel cracks adjacent to the first
128 | A. El-Kareim Shoeib et al.
Figure 4: Crack development and mode of failure
main diagonal crack. Still, the concrete beam with a GFRPweb reinforcement ratio of 0.40% only had parallel cracksadjacent to the first main diagonal crack. The main diago-nal cracks and adjacent cracks are defined direction of theconcrete diagonal strut, the concrete strut’s width, and theconcrete strut’s shape. All experimental specimens werefree of horizontal cracks. No premature failure occurredduring the test. According to the results, crushing in theconcrete diagonal strut was determined to be the failuremode of the experiment. The shape of the strut for the ex-perimental specimens is prismatic shape except for BS2,BG3 is bottled shape.
5.2 Ultimate capacity
Figure 5 summarizes the test results obtained from testingspecimens. It lists the load at ultimate, first flexure crack,first shear crack, main diagonal crack load for all spec-imens. The first flexure crack load is the first crack thatoccurred in the bending zone between loads; the main di-agonal crack is the main shear crack formed and wideneduntil the failure of the deep beam, the first shear crackload is the first shear crack occurred between loads andsupports. The web reinforcement ratio does not affect theflexure crack loading during the test compared with thecontrol deep beam without web reinforcement. Increasingthe web reinforcement ratio in deep beams reinforced withsteel web reinforcement increased the ultimate capacityof deep beams with steel web reinforcement, and for deepbeam reinforcedwith GFRP asweb reinforcement, a slightlyenhancing in ultimate load was recorded, except for beamwith web reinforcement ratio of 0.40%, comparing withcontrol deep beam without web reinforcement. The firstshear crack for a deep beam without web reinforcement
Figure 5: Load for the experimental deep beam test result
was later than the first shear crack for other specimens.The deep beam with a web reinforcement ratio of 0.40%showed an enhancement in the shear crack load and maindiagonal crack load than the other specimens. The steelweb reinforcement increases the ultimate load within therange of 20-24.5% and 3-13.7% for the deep beamwith GFRPweb reinforcement, compared with the deep beam withoutweb reinforcement.
5.3 Reinforced concrete deep beamload-deflection response
The deflection of the deep beam during testing was mea-sured using three LVDTs, two of LVDTs located betweenthe point of loading, support from the left and right side ofthe deep beam, and one of LVDTs located at the mid-spanof the deep beam. All the LVDTs are at the bottom of thedeep beam, and all specimens have the same deflectionvalue at 20 kN. Mid-span deflection at maximum load ofthe reinforced concrete deep beam without web reinforce-
Experimental and analytical study on the behavior of hybrid GFRP/steel bars | 129
Table 4: Deflection of deep beams
Group Specimen ID ρh % ρv % ∆at max . ∆at failure
ABS1 0 0 3.609 7.640BS2 0.25 0.25 3.398 3.982BS3 0.40 0.40 2.284 3.027
B
BG1 0.00 0.40 2.826 7.707BG2 0.40 0.00 3.451 5.606BG3 0.40 0.40 3.000 3.339BG4 0.25 0.25 3.108 5.297
Figure 6: Load-deflection curve for deep beams
ment was 3.60 mm, while it was 2.39, 2.28 mm for the deepbeam with steel web reinforcement ratio of 0.25, 0.40%;respectively, with the difference of 50% about the deflec-tion for control deep beam without web reinforcement asshown in Figure 6. By increasing the steel web reinforce-ment ratio by 0.15%, the mid-span deflection was reducedby 17%. The deflection for deep beam reinforced with verti-cal, horizontal GFRP web reinforcement only decreased by33, 10%; respectively, and 45, 50% for GFRP web reinforce-ment ratio 0.25, 0.40%; respectively, comparedwith controldeep beam. With the increase of GFRP web reinforcementratio of 0.15%, the total deflection at mid-span decreasesby 21.5%, at maximum load. The increasing deflection forthe deep beam with GFRP web reinforcement 0.25, 0.40%about 48, 58%; respectively, compared with the same deepbeam reinforced with steel web reinforcement at the sameratio and load. All specimens exhibited a nearly bilinearup to failure.
5.4 Deformability factor and ductility energyindex
Previous researchmentionedmany expressions to put a for-mula tomeasure the ductility from the energy absorption ofthe hybrid reinforced concrete deep beam. The area underthe load-deflection curve is the energy absorption. The duc-tility energy ratio µE of hybrid GFRP reinforced concretedeep can be calculated from the following equation:
µE =Etotal
Where µE, Etotal, [email protected]: are the ductility index, totalenergy absorption up to the failure load, and up to 75% ofthe maximum load, respectively. The displacement ratiofrom ultimate to maximum load defines the deformabilityfactor (λ). In this paper, the ultimate load will equal 85%of the maximum load on the decreasing part of the load-deflection curve. The formula for the equation is as follows:
λ =∆f∆max
(2)
In a concrete component, the transfer from mechanical en-ergy to the inherent possible energy is referred to by theabsorbed energy. The absorbed energy of concrete partsinvolves various composite processes, comprising plastic
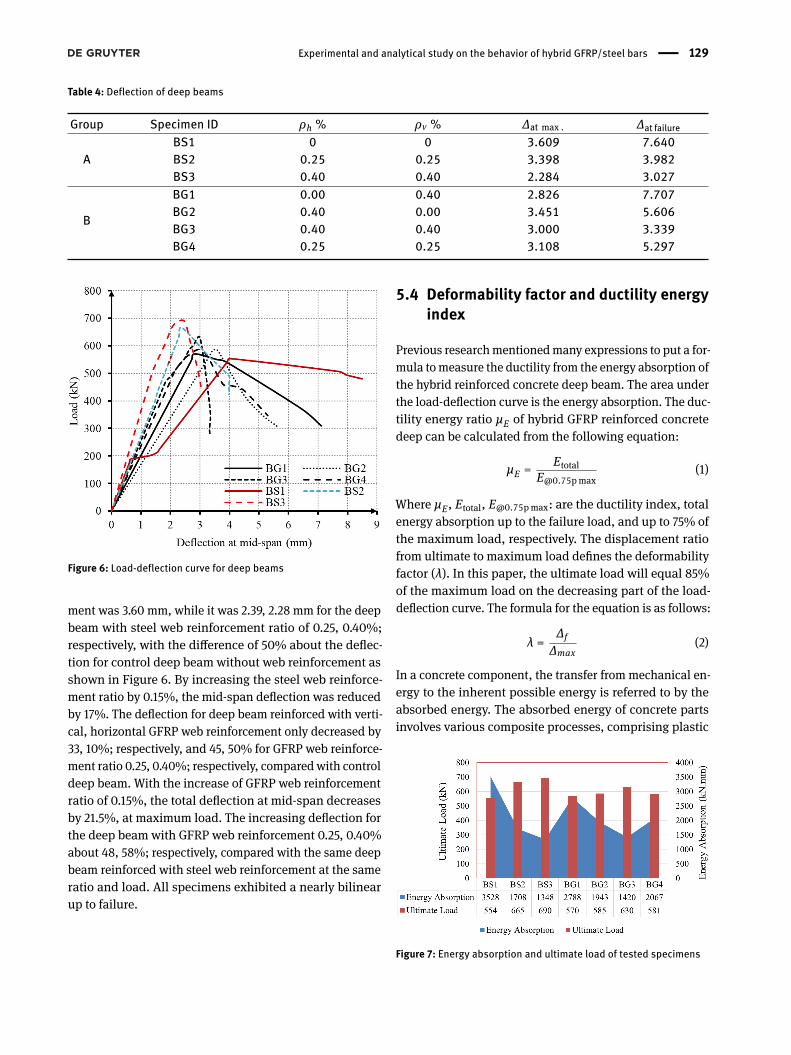
Figure 7: Energy absorption and ultimate load of tested specimens
130 | A. El-Kareim Shoeib et al.
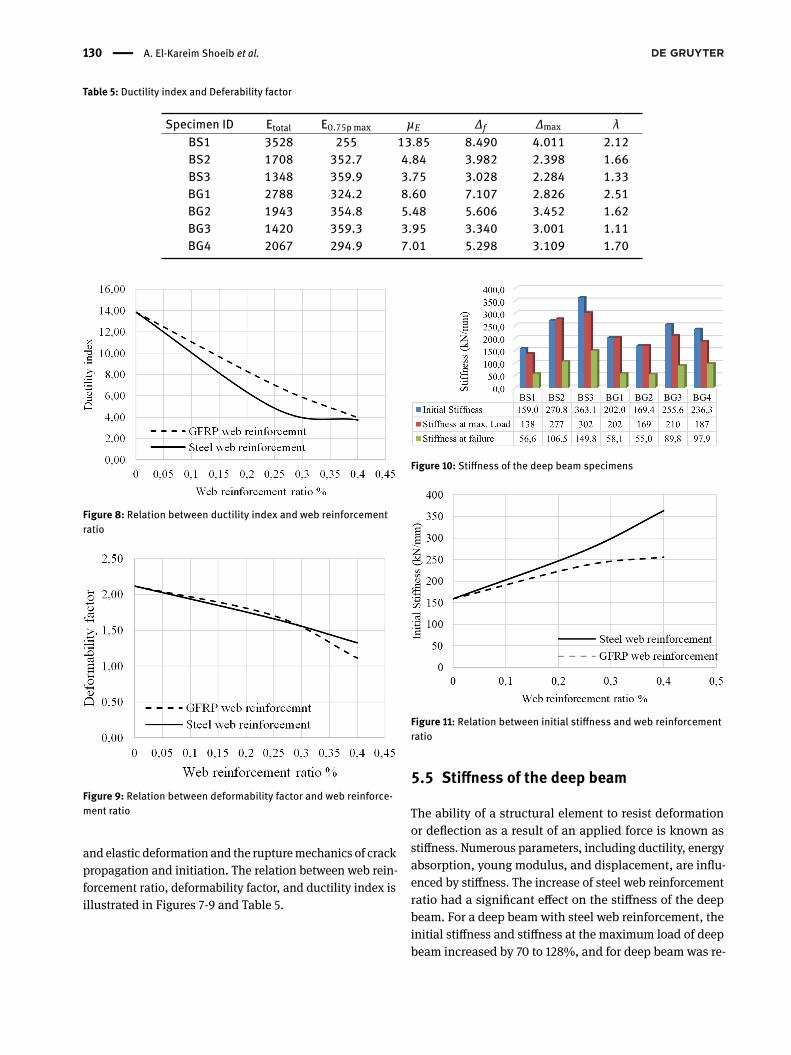
Table 5: Ductility index and Deferability factor
Specimen ID Etotal E0.75pmax µE ∆f ∆max λBS1 3528 255 13.85 8.490 4.011 2.12BS2 1708 352.7 4.84 3.982 2.398 1.66BS3 1348 359.9 3.75 3.028 2.284 1.33BG1 2788 324.2 8.60 7.107 2.826 2.51BG2 1943 354.8 5.48 5.606 3.452 1.62BG3 1420 359.3 3.95 3.340 3.001 1.11BG4 2067 294.9 7.01 5.298 3.109 1.70
Figure 8: Relation between ductility index and web reinforcementratio
Figure 9: Relation between deformability factor and web reinforce-ment ratio
and elastic deformation and the rupturemechanics of crackpropagation and initiation. The relation between web rein-forcement ratio, deformability factor, and ductility index isillustrated in Figures 7-9 and Table 5.
Figure 10: Stiffness of the deep beam specimens
Figure 11: Relation between initial stiffness and web reinforcementratio
5.5 Stiffness of the deep beam
The ability of a structural element to resist deformationor deflection as a result of an applied force is known asstiffness. Numerous parameters, including ductility, energyabsorption, young modulus, and displacement, are influ-enced by stiffness. The increase of steel web reinforcementratio had a significant effect on the stiffness of the deepbeam. For a deep beam with steel web reinforcement, theinitial stiffness and stiffness at the maximum load of deepbeam increased by 70 to 128%, and for deep beam was re-
Experimental and analytical study on the behavior of hybrid GFRP/steel bars | 131
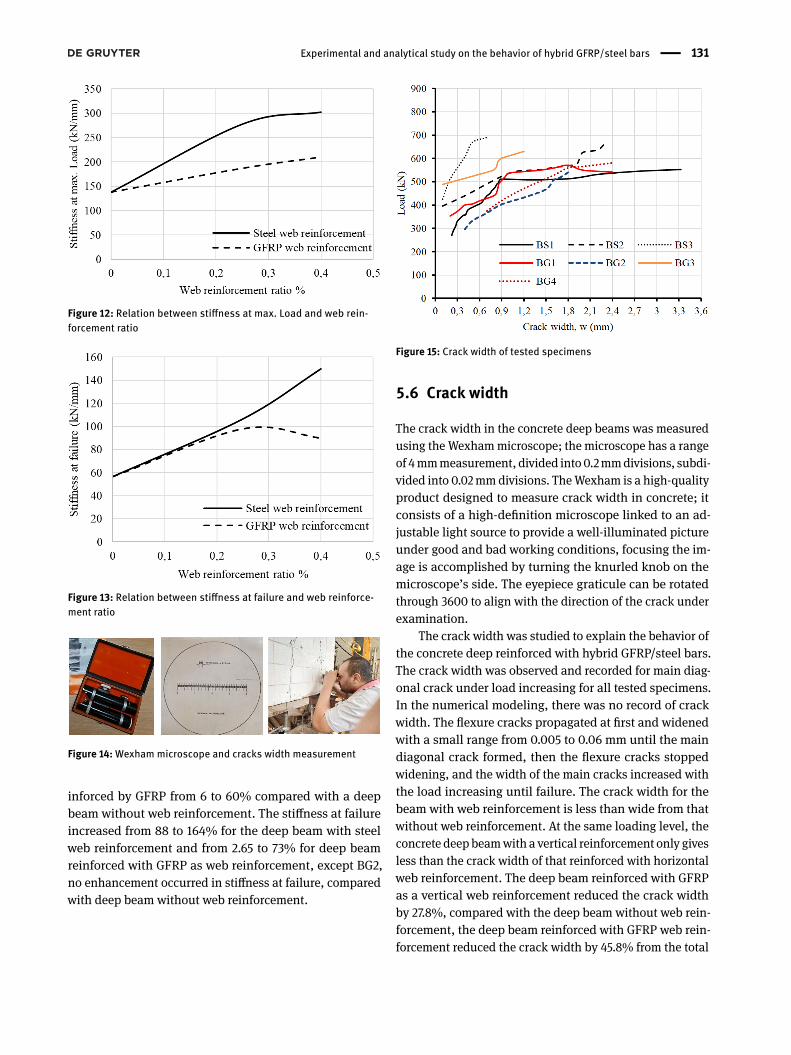
Figure 12: Relation between stiffness at max. Load and web rein-forcement ratio
Figure 13: Relation between stiffness at failure and web reinforce-ment ratio
Figure 14:Wexham microscope and cracks width measurement
inforced by GFRP from 6 to 60% compared with a deepbeam without web reinforcement. The stiffness at failureincreased from 88 to 164% for the deep beam with steelweb reinforcement and from 2.65 to 73% for deep beamreinforced with GFRP as web reinforcement, except BG2,no enhancement occurred in stiffness at failure, comparedwith deep beam without web reinforcement.
Figure 15: Crack width of tested specimens
5.6 Crack width
The crack width in the concrete deep beams was measuredusing the Wexhammicroscope; the microscope has a rangeof 4mmmeasurement, divided into 0.2mmdivisions, subdi-vided into 0.02mmdivisions. TheWexham is a high-qualityproduct designed to measure crack width in concrete; itconsists of a high-definition microscope linked to an ad-justable light source to provide a well-illuminated pictureunder good and bad working conditions, focusing the im-age is accomplished by turning the knurled knob on themicroscope’s side. The eyepiece graticule can be rotatedthrough 3600 to align with the direction of the crack underexamination.
The crack width was studied to explain the behavior ofthe concrete deep reinforced with hybrid GFRP/steel bars.The crack width was observed and recorded for main diag-onal crack under load increasing for all tested specimens.In the numerical modeling, there was no record of crackwidth. The flexure cracks propagated at first and widenedwith a small range from 0.005 to 0.06 mm until the maindiagonal crack formed, then the flexure cracks stoppedwidening, and the width of the main cracks increased withthe load increasing until failure. The crack width for thebeam with web reinforcement is less than wide from thatwithout web reinforcement. At the same loading level, theconcrete deep beamwith a vertical reinforcement only givesless than the crack width of that reinforced with horizontalweb reinforcement. The deep beam reinforced with GFRPas a vertical web reinforcement reduced the crack widthby 27.8%, compared with the deep beam without web rein-forcement, the deep beam reinforced with GFRP web rein-forcement reduced the crack width by 45.8% from the total

132 | A. El-Kareim Shoeib et al.
10
Fir
st f
lexu
re c
rack
BS1P=360 kN
W=0.41 mm
BS2P=369 kN
W=0.05 mm
BS3P=310 kN
W=0.04 mm
Fir
st s
hea
r cr
ack
BS1
W
P=480 kN
W=0.82 mm
BS2P=396 kN
W=0.10 mm
BS3P=450 kN
W=0.16 mm
W
Mai
n d
iag
on
al c
rack
BS1
W
P=530 kN
W=2.21 mm
BS2P=665 kN
W=2.30 mm
W
BS3P=670 kN
W=0.50 mm
W
Fai
lure
of
bea
m BS1
W
Pu=554 kN
W=3.32 mm
BS2Pu=665 kN
W=2.30 mm
W
BS3Pu=690 kN
W=0.70 mm
W
Figure 16: Crack development and mode of failure for the deep beam with steel web reinforcement.
Figure 16: Crack development and mode of failure for the deep beam with steel web reinforcement
11
Fir
st f
lexu
re c
rack
BG1P=352 kN
W=0.21 mm
W
BG2P=330 kN
W=0.50 mm
BG3P=360 kN
W=0.07 mm
BG4P=312 kN
W=0.25 mm
Fir
st s
hea
r cr
ack
BG1P=352 kN
W=0.21 mm
W
BG2P=375 kN
W=0.80 mm
W
BG3P=400 kN
W=0.09 mm
W
BG4P=346 kN
W=0.40 mm
W
Mai
n d
iag
on
al c
rack
BG1P=535 kN
W=1.00 mm
W
BG2P=585 kN
W=2.70 mm
W
BG3P=465 kN
W=0.10 mm
W
BG4P=537 kN
W=1.70 mm
W
Fai
lure
of
bea
m
BG1
W
Pu=571 kN
W=1.80 mm
BG2Pu=585 kN
W=2.70 mm
W
BG3Pu=630 kN
W=1.20 mm
W
BG4P=580 kN
W=2.40 mm
W
Figure 17: Crack development and mode of failure for the deep beam with GFRP web reinforcement.
5.8 Strains in longitudinal main reinforcement (tie) Figure 18 shows the relation between strain and load in the main reinforcement bar with a diameter of 16 mm. The main
bar has a strain gauge in the middle of it. For experimental deep beams, the relation was linear until the first flexure
crack. The relation transformed to bilinear; no anchorage sign occurred during the specimens test. The specimens with
GFRP web reinforcement take the same strain behavior for deep beams with steel web reinforcement until the maximum
load point. The main reinforcement bars did not reach the point of yielding for all specimens. For a web reinforcement
ratio of 0.40%, the main reinforcement bar has almost the same strain.
5.9 Effect of hybrid bars on the strain of web reinforcement Figure 19 illustrates the load-strain relationship for experimental deep beams. The deep beams with vertical web
reinforcement only exhibited almost similar or slightly higher stiffness than the deep beam without web reinforcement;
this is similar in stiffness, causing the experimental and numerical modeling to fail at nearly similar ultimate loads. In
most cases, due to compression force in the concrete strut area, the stain in vertical web reinforcement exposed to be
compression strain, and no degradation occurred in the concrete strut. In most cases, the higher strain in vertical web
reinforcement was in the concrete diagonal. The vertical web reinforcement due to low strain compared with the deep
beams that have horizontal web reinforcement only, the strength in the diagonal strut area did not increase, causing the
same failure load of the concrete deep beam without web reinforcement. The increase of GFRP web reinforcement by
0.15% decreased the strain in deep beams reinforced with only vertical web reinforcement by 91%, by 45% for deep
beam reinforced with vertical and horizontal web reinforcement, 72% for deep beams with deep beams steel web
reinforcement. The vertical web reinforcement did not reach the point of yielding for all specimens.
Figure 17: Crack development and mode of failure for the deep beam with GFRP web reinforcement
Experimental and analytical study on the behavior of hybrid GFRP/steel bars | 133
crack width of the deep beam without web reinforcement.The deep with horizontal and vertical steel web reinforce-ment, reduce the crack width within 30.7%, 78.9% for webreinforcement ratio 0.25%, 0.40%; respectively, reductionwithin 27.71%, 63.9% for deep beam reinforced with GFRPweb reinforcement with ratio 0.25%, 0.40%; respectively.The GFRP web reinforcement plays a significant role in con-trolling the crack width, almost as steel web reinforcementis significant. Figures 16 and 17 illustrate the location of themeasurement crack width.
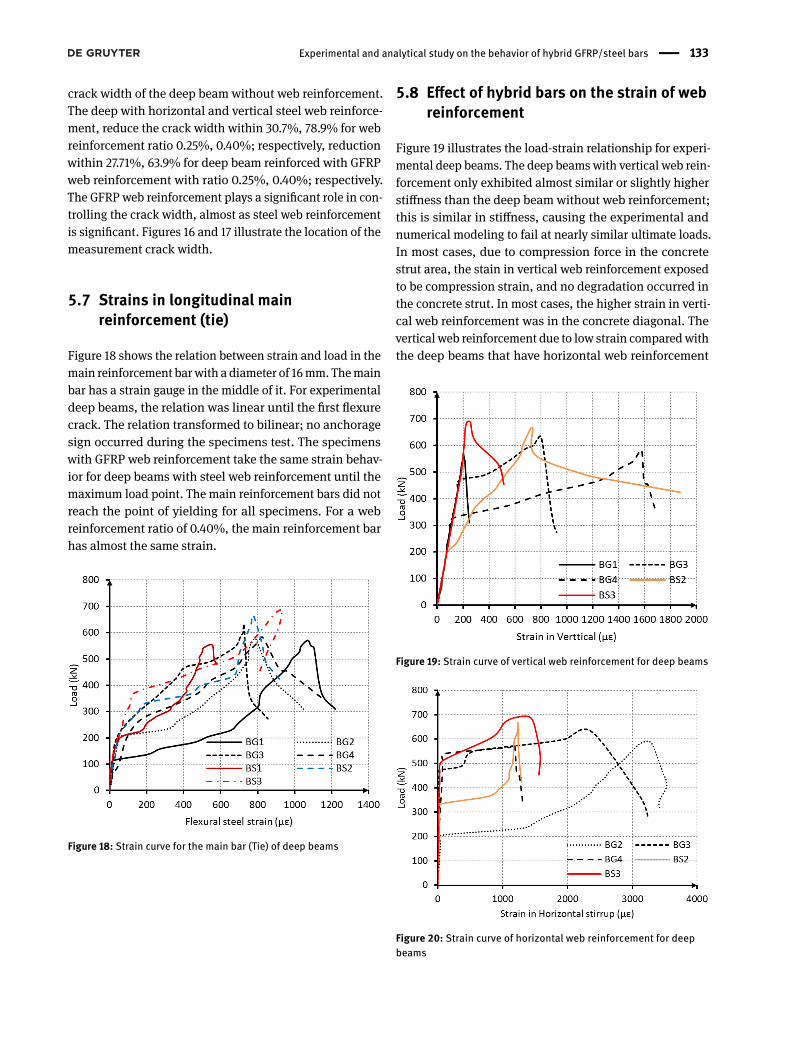
5.7 Strains in longitudinal mainreinforcement (tie)
Figure 18 shows the relation between strain and load in themain reinforcement barwith a diameter of 16mm. Themainbar has a strain gauge in the middle of it. For experimentaldeep beams, the relation was linear until the first flexurecrack. The relation transformed to bilinear; no anchoragesign occurred during the specimens test. The specimenswith GFRP web reinforcement take the same strain behav-ior for deep beams with steel web reinforcement until themaximum load point. The main reinforcement bars did notreach the point of yielding for all specimens. For a webreinforcement ratio of 0.40%, the main reinforcement barhas almost the same strain.
Figure 18: Strain curve for the main bar (Tie) of deep beams
5.8 Effect of hybrid bars on the strain of webreinforcement
Figure 19 illustrates the load-strain relationship for experi-mental deep beams. The deep beams with vertical web rein-forcement only exhibited almost similar or slightly higherstiffness than the deep beam without web reinforcement;this is similar in stiffness, causing the experimental andnumerical modeling to fail at nearly similar ultimate loads.In most cases, due to compression force in the concretestrut area, the stain in vertical web reinforcement exposedto be compression strain, and no degradation occurred inthe concrete strut. In most cases, the higher strain in verti-cal web reinforcement was in the concrete diagonal. Thevertical web reinforcement due to low strain comparedwiththe deep beams that have horizontal web reinforcement
Figure 19: Strain curve of vertical web reinforcement for deep beams
Figure 20: Strain curve of horizontal web reinforcement for deepbeams
134 | A. El-Kareim Shoeib et al.
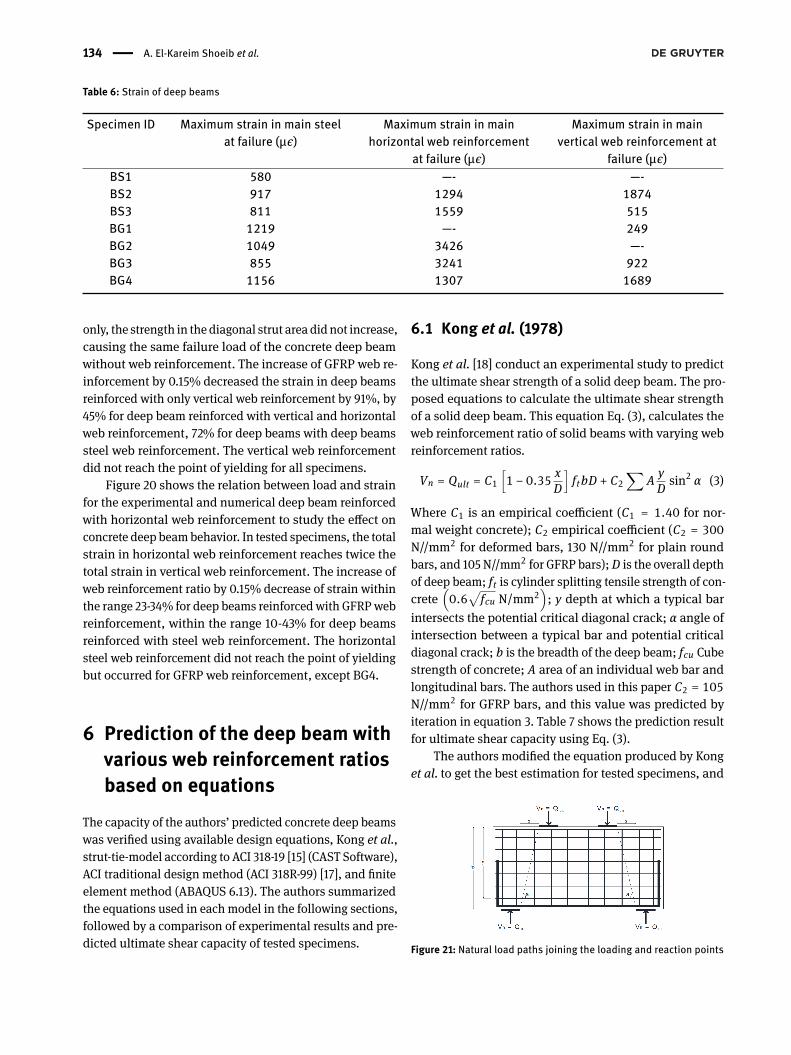
Table 6: Strain of deep beams
Specimen ID Maximum strain in main steelat failure (µϵ)
Maximum strain in mainhorizontal web reinforcement
at failure (µϵ)
Maximum strain in mainvertical web reinforcement at
failure (µϵ)BS1 580 —- —-BS2 917 1294 1874BS3 811 1559 515BG1 1219 —- 249BG2 1049 3426 —-BG3 855 3241 922BG4 1156 1307 1689
only, the strength in the diagonal strut area did not increase,causing the same failure load of the concrete deep beamwithout web reinforcement. The increase of GFRP web re-inforcement by 0.15% decreased the strain in deep beamsreinforced with only vertical web reinforcement by 91%, by45% for deep beam reinforced with vertical and horizontalweb reinforcement, 72% for deep beams with deep beamssteel web reinforcement. The vertical web reinforcementdid not reach the point of yielding for all specimens.
Figure 20 shows the relation between load and strainfor the experimental and numerical deep beam reinforcedwith horizontal web reinforcement to study the effect onconcrete deep beambehavior. In tested specimens, the totalstrain in horizontal web reinforcement reaches twice thetotal strain in vertical web reinforcement. The increase ofweb reinforcement ratio by 0.15% decrease of strain withinthe range 23-34% for deep beams reinforced with GFRPwebreinforcement, within the range 10-43% for deep beamsreinforced with steel web reinforcement. The horizontalsteel web reinforcement did not reach the point of yieldingbut occurred for GFRP web reinforcement, except BG4.
6 Prediction of the deep beam withvarious web reinforcement ratiosbased on equations
The capacity of the authors’ predicted concrete deep beamswas verified using available design equations, Kong et al.,strut-tie-model according to ACI 318-19 [15] (CAST Software),ACI traditional design method (ACI 318R-99) [17], and finiteelement method (ABAQUS 6.13). The authors summarizedthe equations used in each model in the following sections,followed by a comparison of experimental results and pre-dicted ultimate shear capacity of tested specimens.
6.1 Kong et al. (1978)
Kong et al. [18] conduct an experimental study to predictthe ultimate shear strength of a solid deep beam. The pro-posed equations to calculate the ultimate shear strengthof a solid deep beam. This equation Eq. (3), calculates theweb reinforcement ratio of solid beams with varying webreinforcement ratios.
Vn = Qult = C1[︁1 − 0.35 xD
]︁ftbD + C2
∑︁A yD sin2 α (3)
Where C1 is an empirical coefficient (C1 = 1.40 for nor-mal weight concrete); C2 empirical coefficient (C2 = 300N//mm2 for deformed bars, 130 N//mm2 for plain roundbars, and 105 N//mm2 for GFRP bars); D is the overall depthof deep beam; ft is cylinder splitting tensile strength of con-crete
(︁0.6
√︀fcu N/mm2
)︁; y depth at which a typical bar
intersects the potential critical diagonal crack; α angle ofintersection between a typical bar and potential criticaldiagonal crack; b is the breadth of the deep beam; fcu Cubestrength of concrete; A area of an individual web bar andlongitudinal bars. The authors used in this paper C2 = 105N//mm2 for GFRP bars, and this value was predicted byiteration in equation 3. Table 7 shows the prediction resultfor ultimate shear capacity using Eq. (3).
The authors modified the equation produced by Konget al. to get the best estimation for tested specimens, and
Figure 21: Natural load paths joining the loading and reaction points
Experimental and analytical study on the behavior of hybrid GFRP/steel bars | 135
Table 7:Measured and computed ultimate load deep beams
Specimens ID C1 [1-0.35(x/D)] ft b D(kN)
C2 Σ A (y/D) sin2 α(kN)
Vn(kN)
Vu equ.(kN)
Vu exp.(kN)
Vu exp./Vu equ.%
BS1 377 106 482 964 554 0.57BS2 377 126 503 1006 665 0.66BS3 377 140 517 1034 690 0.67BG1 377 91 467 935 571 0.61BG2 377 127 503 1007 585 0.58BG3 377 113 490 980 630 0.64BG4 377 102 479 957 580 0.61
Note: C2 = 130 N//mm2 for steel bars, C2 = 105 N//mm2 for GFRP bars
Table 8:Measured and computed ultimate load deep beams by using modified equation by authors
Specimens ID 110
[︀1 − 0.35 x
D]︀f ′cbD
(kN)C2 Σ A (y/D) sin2 α
(kN)Vn(kN)
Vu equ.(kN)
Vu exp.(kN)
Vu exp./Vu equ.%
BS1 179 106 285 570 554 0.97BS2 179 126 306 611 665 1.09BS3 179 140 319 639 690 1.08BG1 179 91 270 540 571 1.06BG2 179 127 306 612 585 0.96BG3 179 113 292 585 630 1.08BG4 179 102 281 563 580 1.03
Note: C2 = 130 N//mm2 for steel bars, C2 = 105 N//mm2 for GFRP bars
Table 8 shows the predicted result for ultimate shear ca-pacity. Furthermore, the modified equation is as follows:
Vn =110
[︁1 − 0.35 xD
]︁f ′cbD + C2
∑︁A yD sin2 α (4)
6.2 Strut-tie model
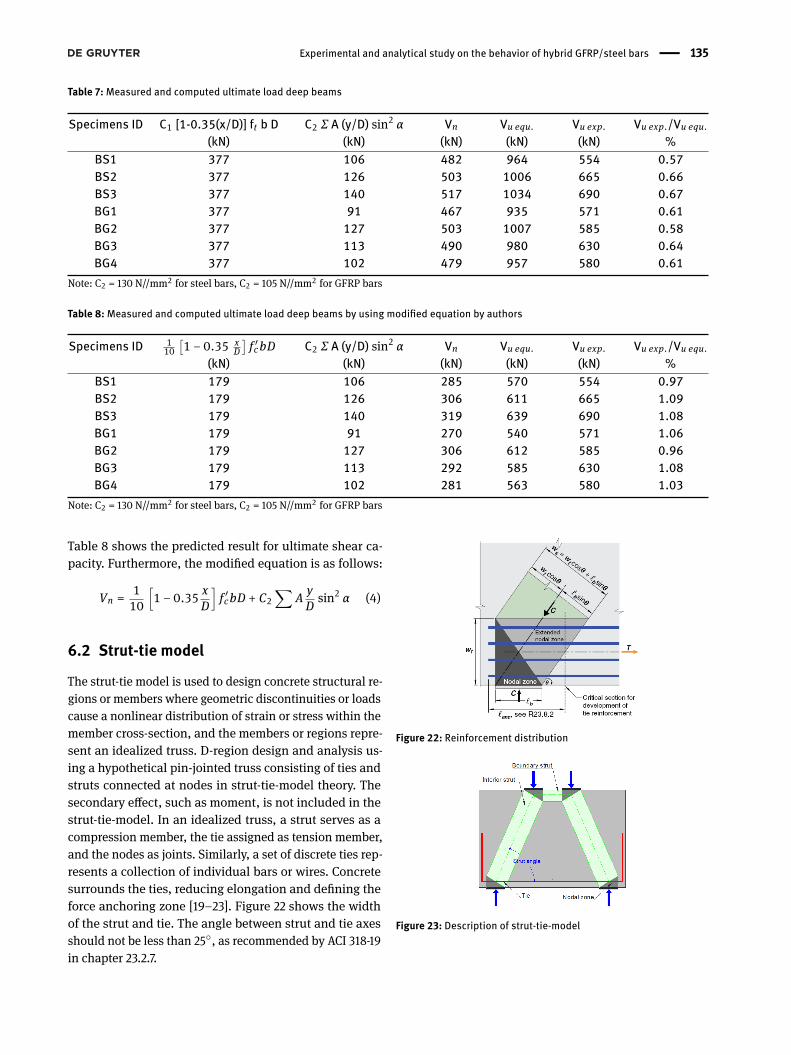
The strut-tie model is used to design concrete structural re-gions or members where geometric discontinuities or loadscause a nonlinear distribution of strain or stress within themember cross-section, and the members or regions repre-sent an idealized truss. D-region design and analysis us-ing a hypothetical pin-jointed truss consisting of ties andstruts connected at nodes in strut-tie-model theory. Thesecondary effect, such as moment, is not included in thestrut-tie-model. In an idealized truss, a strut serves as acompression member, the tie assigned as tension member,and the nodes as joints. Similarly, a set of discrete ties rep-resents a collection of individual bars or wires. Concretesurrounds the ties, reducing elongation and defining theforce anchoring zone [19–23]. Figure 22 shows the widthof the strut and tie. The angle between strut and tie axesshould not be less than 25∘, as recommended by ACI 318-19in chapter 23.2.7.
Figure 22: Reinforcement distribution
Figure 23: Description of strut-tie-model
136 | A. El-Kareim Shoeib et al.
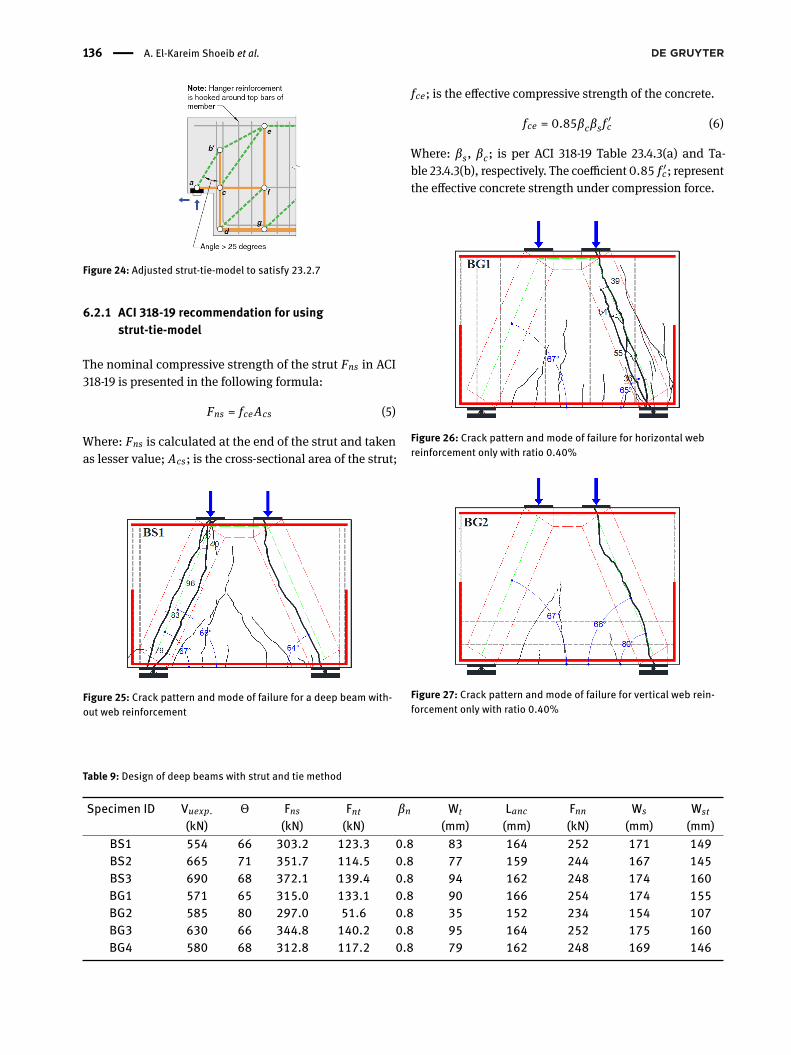
Figure 24: Adjusted strut-tie-model to satisfy 23.2.7
6.2.1 ACI 318-19 recommendation for usingstrut-tie-model
The nominal compressive strength of the strut Fns in ACI318-19 is presented in the following formula:
Fns = fceAcs (5)
Where: Fns is calculated at the end of the strut and takenas lesser value; Acs; is the cross-sectional area of the strut;
Figure 25: Crack pattern and mode of failure for a deep beam with-out web reinforcement
fce; is the effective compressive strength of the concrete.
fce = 0.85βcβs f′c (6)
Where: βs, βc; is per ACI 318-19 Table 23.4.3(a) and Ta-ble 23.4.3(b), respectively. The coefficient 0.85 f ′c; representthe effective concrete strength under compression force.
Figure 26: Crack pattern and mode of failure for horizontal webreinforcement only with ratio 0.40%
Figure 27: Crack pattern and mode of failure for vertical web rein-forcement only with ratio 0.40%
Table 9: Design of deep beams with strut and tie method
Specimen ID Vuexp.(kN)
Θ Fns(kN)
Fnt(kN)
βn Wt(mm)
Lanc(mm)
Fnn(kN)
Ws(mm)
Wst(mm)
BS1 554 66 303.2 123.3 0.8 83 164 252 171 149BS2 665 71 351.7 114.5 0.8 77 159 244 167 145BS3 690 68 372.1 139.4 0.8 94 162 248 174 160BG1 571 65 315.0 133.1 0.8 90 166 254 174 155BG2 585 80 297.0 51.6 0.8 35 152 234 154 107BG3 630 66 344.8 140.2 0.8 95 164 252 175 160BG4 580 68 312.8 117.2 0.8 79 162 248 169 146
Experimental and analytical study on the behavior of hybrid GFRP/steel bars | 137
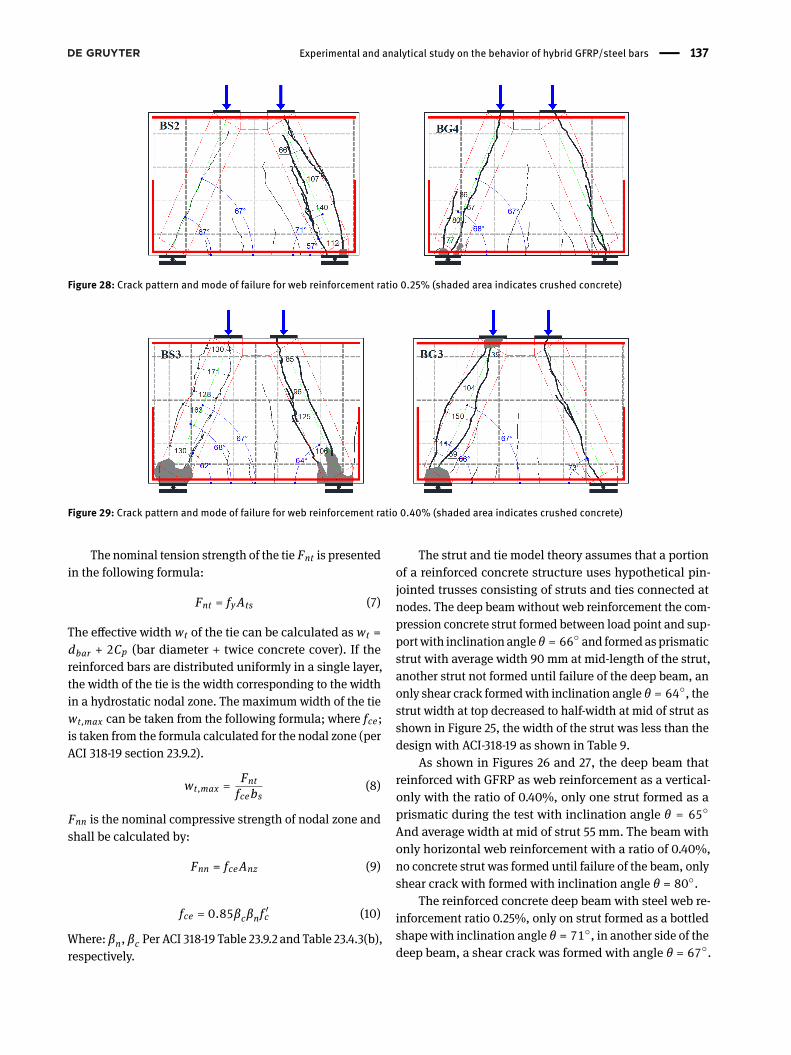
Figure 28: Crack pattern and mode of failure for web reinforcement ratio 0.25% (shaded area indicates crushed concrete)
Figure 29: Crack pattern and mode of failure for web reinforcement ratio 0.40% (shaded area indicates crushed concrete)
The nominal tension strength of the tie Fnt is presentedin the following formula:
Fnt = fyAts (7)
The effective width wt of the tie can be calculated as wt =dbar + 2Cp (bar diameter + twice concrete cover). If thereinforced bars are distributed uniformly in a single layer,the width of the tie is the width corresponding to the widthin a hydrostatic nodal zone. The maximum width of the tiewt,max can be taken from the following formula; where fce;is taken from the formula calculated for the nodal zone (perACI 318-19 section 23.9.2).
wt,max =Fntfcebs
(8)
Fnn is the nominal compressive strength of nodal zone andshall be calculated by:
Fnn = fceAnz (9)
fce = 0.85βcβn f′c (10)
Where: βn, βc Per ACI 318-19 Table 23.9.2 and Table 23.4.3(b),respectively.
The strut and tie model theory assumes that a portionof a reinforced concrete structure uses hypothetical pin-jointed trusses consisting of struts and ties connected atnodes. The deep beam without web reinforcement the com-pression concrete strut formed between load point and sup-portwith inclination angle θ = 66∘ and formed as prismaticstrut with average width 90 mm at mid-length of the strut,another strut not formed until failure of the deep beam, anonly shear crack formedwith inclination angle θ = 64∘, thestrut width at top decreased to half-width at mid of strut asshown in Figure 25, the width of the strut was less than thedesign with ACI-318-19 as shown in Table 9.
As shown in Figures 26 and 27, the deep beam thatreinforced with GFRP as web reinforcement as a vertical-only with the ratio of 0.40%, only one strut formed as aprismatic during the test with inclination angle θ = 65∘
And average width at mid of strut 55 mm. The beam withonly horizontal web reinforcement with a ratio of 0.40%,no concrete strut was formed until failure of the beam, onlyshear crack with formed with inclination angle θ = 80∘.
The reinforced concrete deep beam with steel web re-inforcement ratio 0.25%, only on strut formed as a bottledshape with inclination angle θ = 71∘, in another side of thedeep beam, a shear crack was formed with angle θ = 67∘.
138 | A. El-Kareim Shoeib et al.
Furthermore, minor crashing in the bottom nodal zone,the width of the strut was 140 mm at mid of strut, 66, 112mm at top and bottom of the strut; respectively. The deepbeamwith GFRPweb reinforcement ratio 0.25%, a crashinghas occurred in the bottom nodal zone, only one strut asprismatic strut with inclination angle θ = 68∘. The strut’saverage width was approximately 85 mm, and on anotherside of the deep beam, a shear crack formed until it failedduring the test. The GFRP did not affect the crack angle ofthe deep beam, as illustrated in Figure 28.
Figure 29 shows the deep beam reinforced with a steelweb reinforcement ratio of 0.40%, no crushing occurredbeneath the loading in the top nodal zone, but a crushingoccurred in both struts at the bottom nodal zone; the two
struts as prismatic strut formed during the test with differ-entwidths at themiddle, top, andbottomof both struts. Thedeep beamwas reinforced with GFRP as web reinforcementwith a ratio of 0.40%, only one strut formed, the other sideof the deep beamwas a shear crack, and crushing occurredin the bottom nodal zone of the strut.
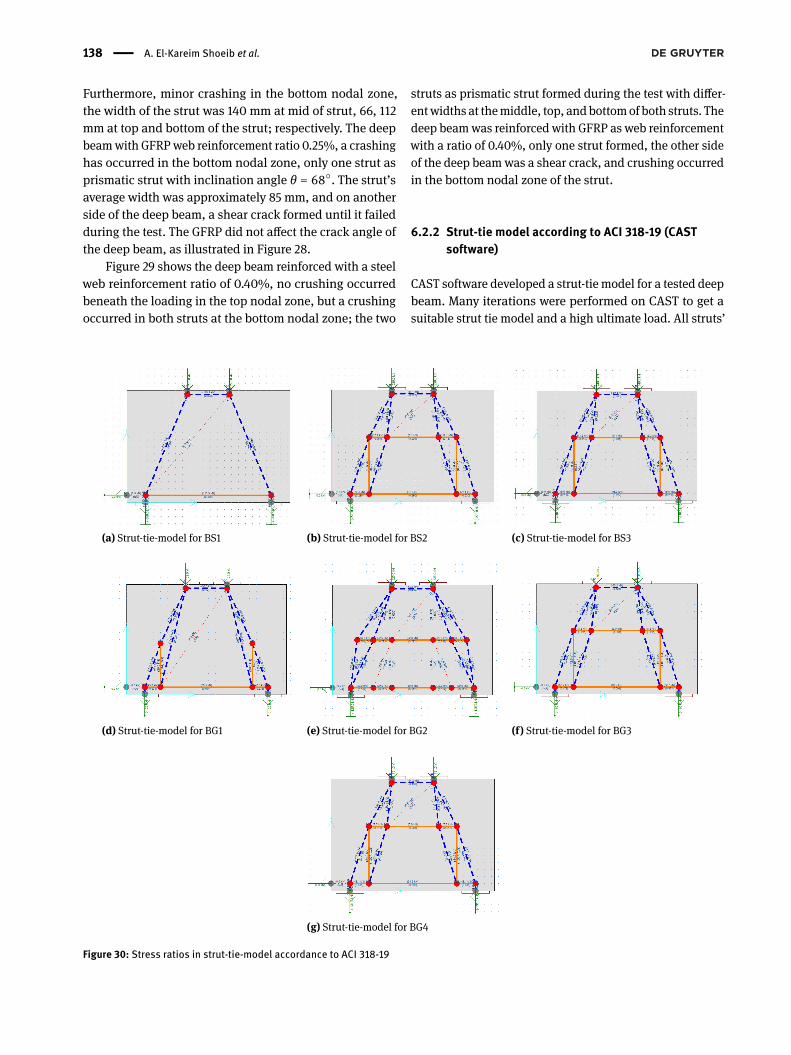
6.2.2 Strut-tie model according to ACI 318-19 (CASTsoftware)
CAST software developed a strut-tie model for a tested deepbeam. Many iterations were performed on CAST to get asuitable strut tie model and a high ultimate load. All struts’
(a) Strut-tie-model for BS1 (b) Strut-tie-model for BS2 (c) Strut-tie-model for BS3
(d) Strut-tie-model for BG1 (e) Strut-tie-model for BG2 (f) Strut-tie-model for BG3
(g) Strut-tie-model for BG4
Figure 30: Stress ratios in strut-tie-model accordance to ACI 318-19
Experimental and analytical study on the behavior of hybrid GFRP/steel bars | 139
Table 10: Cast ultimate capacity according to ACI 318-19
Specimen Maximum stress ratio Failure location Vn pre. Vn exp. Vn exp.Vn pre.
ID Tie Strut Node Horizontalweb
Verticalweb
kN kN
BS1 0.36 1.00 0.93 — — Concrete Strut 560 554 0.98BS2 0.29 0.75 0.92 0.16 1.00 Vertical Tie 445 665 1.49BS3 0.32 0.80 1.00 0.15 0.66 Node-CTT 480 690 1.43BG1 0.15 0.41 0.39 — 1.00 Vertical Tie 245 571 2.33BG2 0.13 0.25 0.37 1.00 — Horizontal Tie 250 585 2.34BG3 0.22 0.54 0.67 0.21 1.00 Vertical Tie 320 630 1.96BG4 0.18 0.44 0.55 0.21 1.00 Vertical Tie 262 580 2.21
Vexp. = experimental ultimate shear strength, Vpre. = predicted ultimate shear capacity.
Table 11: Design of deep beams with traditional ACI design method (ACI 318R-99) [17]
SpecimenID
Web Reinf.Type
ρh% ρv% Vs Vc Vn max Vu Vn pre. Vn exp. Vn exp.Vn pre.
BS1Steel
0 0 0 67.7 262.46 262.46 524.9 554 1.06BS2 0.25 0.25 80.028 67.7 262.46 342.488 685.0 665 0.97BS3 0.40 0.40 128.04 67.7 262.46 390.5 781.0 690 0.88BG1
GFRP
0 0.40 5.67 67.7 262.46 268.13 536.3 571 1.06BG2 0.40 0 26.66 67.7 262.46 289.12 578.2 585 1.01BG3 0.40 0.40 31.95 67.7 262.46 294.41 588.8 630 1.07BG4 0.25 0.25 20.06 67.7 262.46 282.52 565.0 580 1.03
Vexp. = experimental ultimate shear strength (kN), Vpre. = predicted ultimate shear capacity (kN), Reinf.= reinforcement
angles are more than 25∘, some members in the strut-tie-model used as stabilizermembers. GFRPweb reinforcementdesign calculations have been performed per ACI 440.1R-03 using the equations shown below. Figure 30 shows thestress ratio in strut-tie-model members, and Table 10 showsthe ultimate shear capacity result.
ffb =(︂0.05 rbdb
+ 0.3)︂ffu ≤ ffu (11)
ffv = 0.002Ef ≤ ffb (12)
Where ffb; is the design tensile strength of the bend of GFRPbar, Mpa; rb is the radius of the bend, mm.; db the diameterof reinforcing bar, mm.; and ffu the design tensile strengthof GFRP, considering reductions for service environment,Mpa; ffv the design stress for GFRP web reinforcement andit used equal 90 Mpa; Ef ; is the guaranteed modulus ofelasticity of GFRP.
6.3 ACI traditional design method (ACI318R-99)
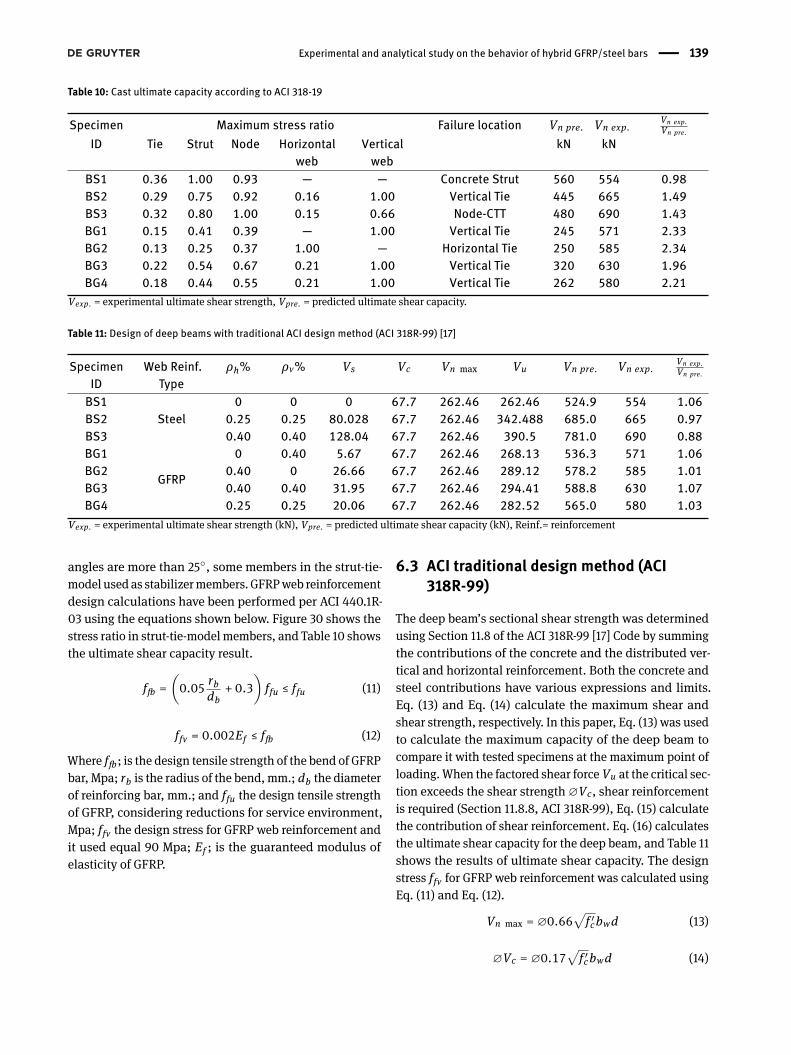
The deep beam’s sectional shear strength was determinedusing Section 11.8 of the ACI 318R-99 [17] Code by summingthe contributions of the concrete and the distributed ver-tical and horizontal reinforcement. Both the concrete andsteel contributions have various expressions and limits.Eq. (13) and Eq. (14) calculate the maximum shear andshear strength, respectively. In this paper, Eq. (13) was usedto calculate the maximum capacity of the deep beam tocompare it with tested specimens at the maximum point ofloading.When the factored shear force Vu at the critical sec-tion exceeds the shear strength∅Vc, shear reinforcementis required (Section 11.8.8, ACI 318R-99), Eq. (15) calculatethe contribution of shear reinforcement. Eq. (16) calculatesthe ultimate shear capacity for the deep beam, and Table 11shows the results of ultimate shear capacity. The designstress ffv for GFRP web reinforcement was calculated usingEq. (11) and Eq. (12).
Vn max = ∅0.66√︀f ′cbwd (13)
∅Vc = ∅0.17√︀f ′cbwd (14)
140 | A. El-Kareim Shoeib et al.
Vs =[︂AvSv
(︂1 + ln/d
12
)︂+ AhSh
(︂11 − ln/d
12
)︂]︂fyd (15)
Vu = Vn max + Vs (16)Where: Vn max; maximum nominal concrete shear strength(Mpa), f ′c; specified concrete compressive strength (Mpa),bw; cross-section width of deep beam (mm), d; cross-section depth of deep beam (mm),∅Vc; factored nominalconcrete shear strength (Mpa), Vs; nominal shear strengthprovided by shear reinforcement Mpa, Av; area of verticalshear reinforcement (mm2) with a distance Sv (mm), Ah;area of horizontal shear reinforcement (mm2) with a dis-tance Sh (mm), ln; clear span between supports (mm), Vu;ultimate shear capacity (Mpa).∅; reduction factor.
6.4 Numerical model
The nonlinear finite element technique (F.E) was utilizedin this work to predict the behavior of simply supported re-inforced concrete deep structures using the ABAQUS 6.13.1software, the deep beamwas reinforcement with glass fiberreinforced polymer (GFRP) as web reinforcement with dif-ferent ratios, and the main reinforcement were steel bars.The load was applied as a concentrated load in the middleof the steel plate as P/2. One support prevents the move-ment in X, Z direction and prevents the translation in the Ydirection to act as pin support; the second support preventsthe movement in the X direction and prevents translationin the Y direction to act as roller support.
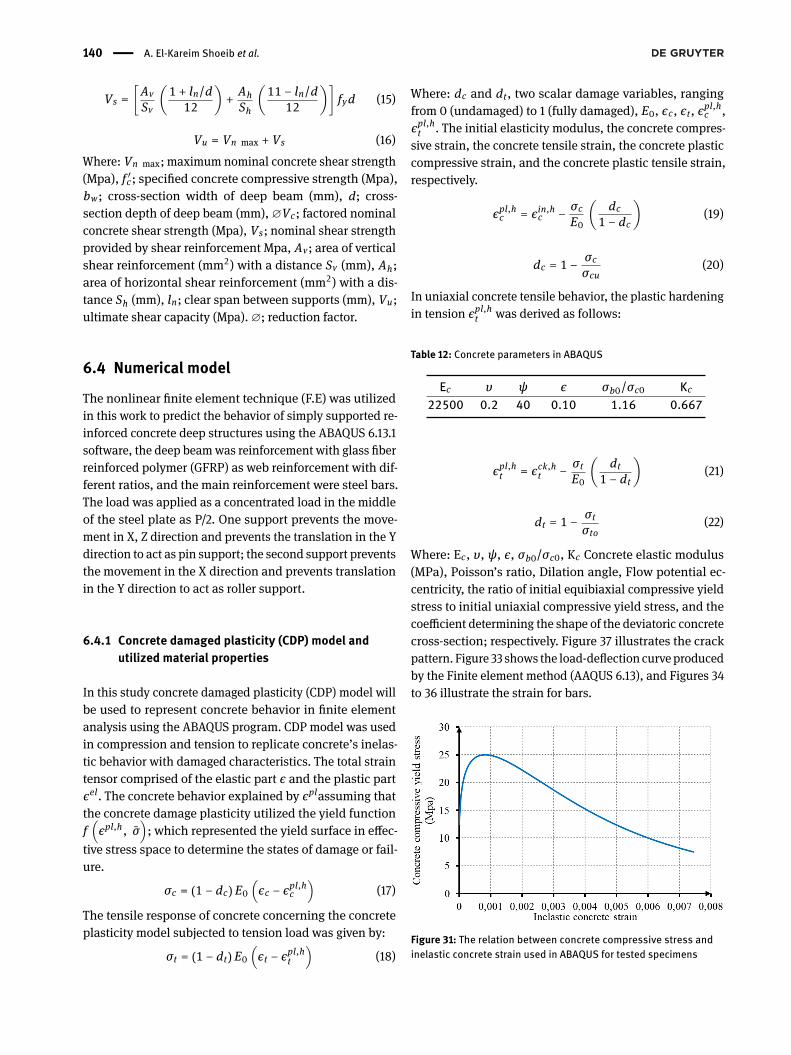
6.4.1 Concrete damaged plasticity (CDP) model andutilized material properties
In this study concrete damaged plasticity (CDP) model willbe used to represent concrete behavior in finite elementanalysis using the ABAQUS program. CDP model was usedin compression and tension to replicate concrete’s inelas-tic behavior with damaged characteristics. The total straintensor comprised of the elastic part ϵ and the plastic partϵel. The concrete behavior explained by ϵplassuming thatthe concrete damage plasticity utilized the yield functionf(︁ϵpl,h , σ̄
)︁; which represented the yield surface in effec-
tive stress space to determine the states of damage or fail-ure.
σc = (1 − dc) E0(︁ϵc − ϵpl,hc
)︁(17)
The tensile response of concrete concerning the concreteplasticity model subjected to tension load was given by:
σt = (1 − dt) E0(︁ϵt − ϵpl,ht
)︁(18)
Where: dc and dt, two scalar damage variables, rangingfrom 0 (undamaged) to 1 (fully damaged), E0, ϵc, ϵt, ϵpl,hc ,ϵpl,ht . The initial elasticity modulus, the concrete compres-sive strain, the concrete tensile strain, the concrete plasticcompressive strain, and the concrete plastic tensile strain,respectively.
ϵpl,hc = ϵin,hc − σcE0
(︂dc
1 − dc
)︂(19)
dc = 1 − σcσcu
(20)
In uniaxial concrete tensile behavior, the plastic hardeningin tension ϵpl,ht was derived as follows:
Table 12: Concrete parameters in ABAQUS
Ec υ ψ ϵ σb0/σc0 Kc22500 0.2 40 0.10 1.16 0.667
ϵpl,ht = ϵck,ht − σtE0
(︂dt
1 − dt
)︂(21)
dt = 1 − σtσto
(22)
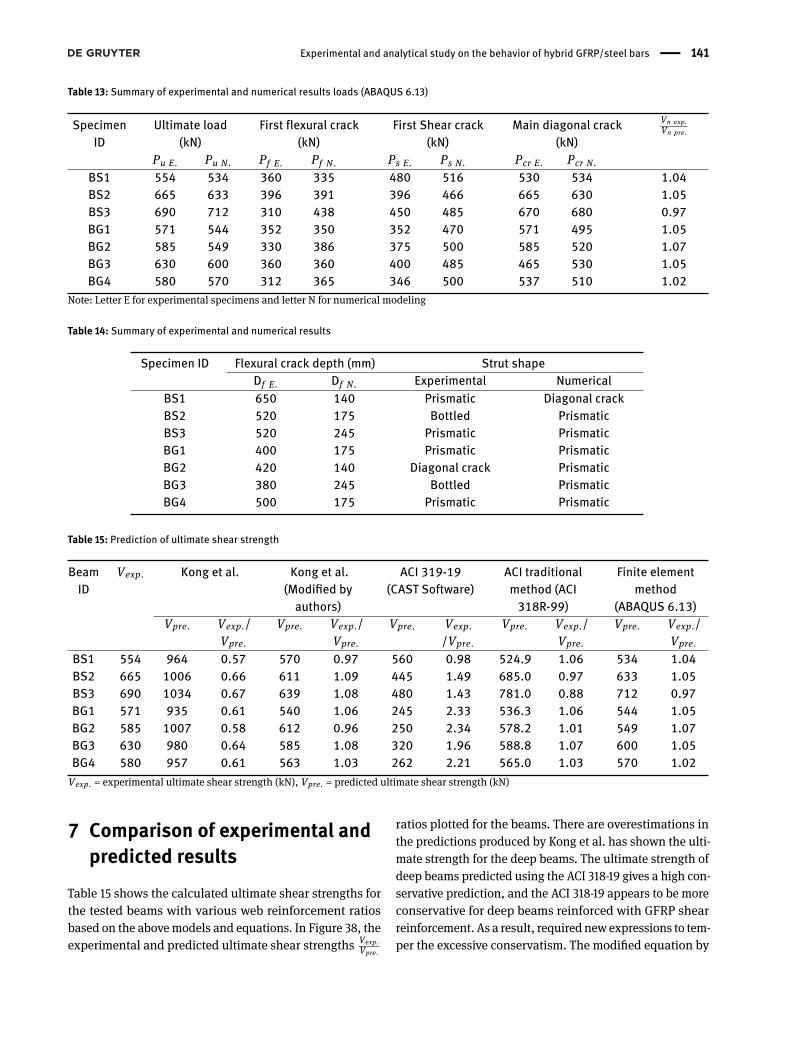
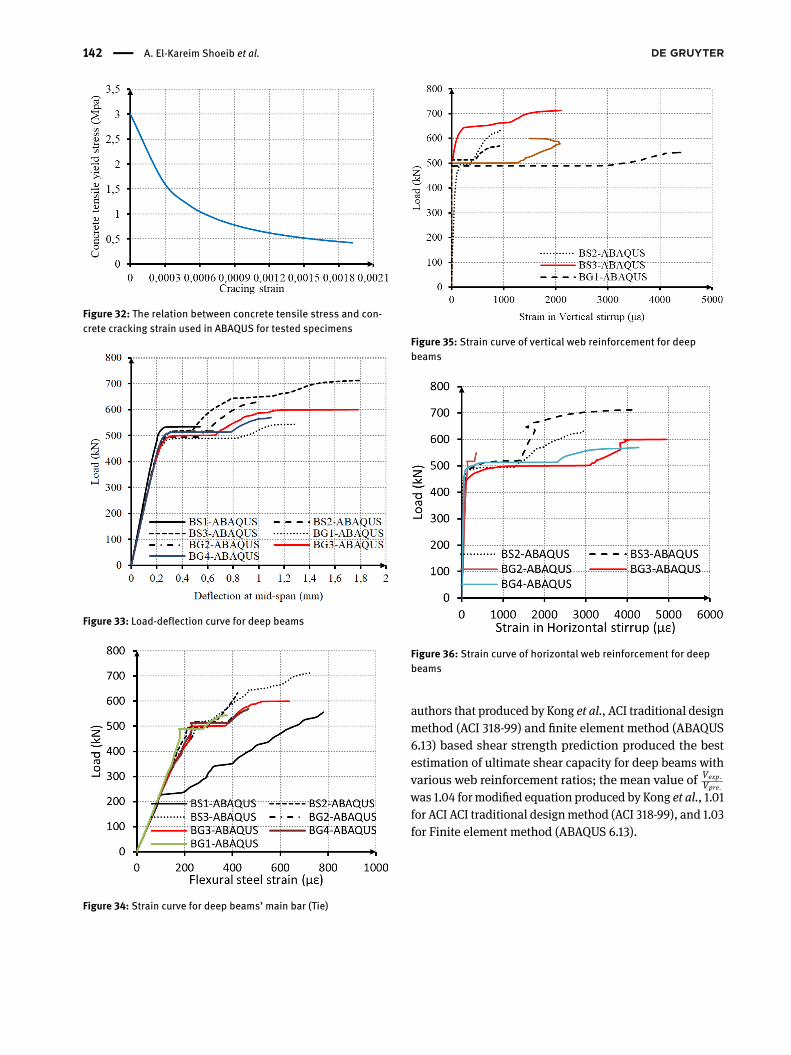
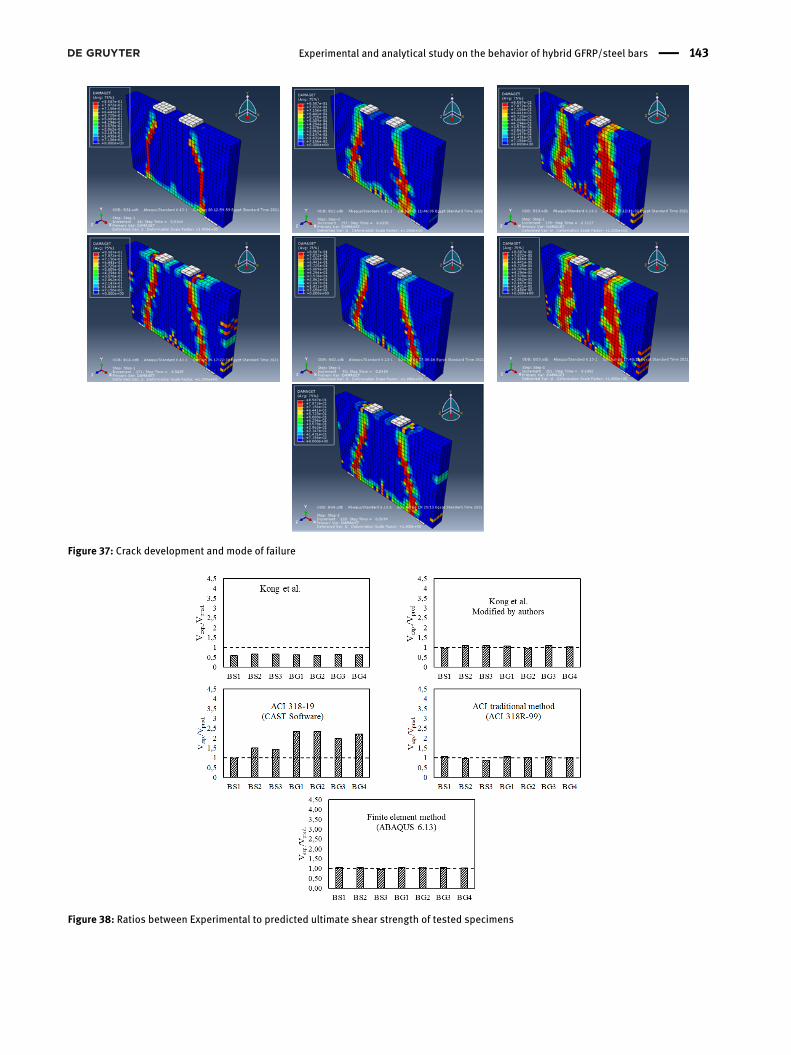
Where: Ec, υ, ψ, ϵ, σb0/σc0, Kc Concrete elastic modulus(MPa), Poisson’s ratio, Dilation angle, Flow potential ec-centricity, the ratio of initial equibiaxial compressive yieldstress to initial uniaxial compressive yield stress, and thecoefficient determining the shape of the deviatoric concretecross-section; respectively. Figure 37 illustrates the crackpattern. Figure 33 shows the load-deflection curveproducedby the Finite element method (AAQUS 6.13), and Figures 34to 36 illustrate the strain for bars.
Figure 31: The relation between concrete compressive stress andinelastic concrete strain used in ABAQUS for tested specimens
Experimental and analytical study on the behavior of hybrid GFRP/steel bars | 141
Table 13: Summary of experimental and numerical results loads (ABAQUS 6.13)
SpecimenID
Ultimate load(kN)
First flexural crack(kN)
First Shear crack(kN)
Main diagonal crack(kN)
Vn exp.Vn pre.
Pu E. Pu N . Pf E. Pf N . Ps E. Ps N . Pcr E. Pcr N .BS1 554 534 360 335 480 516 530 534 1.04BS2 665 633 396 391 396 466 665 630 1.05BS3 690 712 310 438 450 485 670 680 0.97BG1 571 544 352 350 352 470 571 495 1.05BG2 585 549 330 386 375 500 585 520 1.07BG3 630 600 360 360 400 485 465 530 1.05BG4 580 570 312 365 346 500 537 510 1.02
Note: Letter E for experimental specimens and letter N for numerical modeling
Table 14: Summary of experimental and numerical results
Specimen ID Flexural crack depth (mm) Strut shapeDf E. Df N . Experimental Numerical
BS1 650 140 Prismatic Diagonal crackBS2 520 175 Bottled PrismaticBS3 520 245 Prismatic PrismaticBG1 400 175 Prismatic PrismaticBG2 420 140 Diagonal crack PrismaticBG3 380 245 Bottled PrismaticBG4 500 175 Prismatic Prismatic
Table 15: Prediction of ultimate shear strength
BeamID
Vexp. Kong et al. Kong et al.(Modified byauthors)
ACI 319-19(CAST Software)
ACI traditionalmethod (ACI318R-99)
Finite elementmethod
(ABAQUS 6.13)Vpre. Vexp./
Vpre.Vpre. Vexp./
Vpre.Vpre. Vexp.
/Vpre.Vpre. Vexp./
Vpre.Vpre. Vexp./
Vpre.BS1 554 964 0.57 570 0.97 560 0.98 524.9 1.06 534 1.04BS2 665 1006 0.66 611 1.09 445 1.49 685.0 0.97 633 1.05BS3 690 1034 0.67 639 1.08 480 1.43 781.0 0.88 712 0.97BG1 571 935 0.61 540 1.06 245 2.33 536.3 1.06 544 1.05BG2 585 1007 0.58 612 0.96 250 2.34 578.2 1.01 549 1.07BG3 630 980 0.64 585 1.08 320 1.96 588.8 1.07 600 1.05BG4 580 957 0.61 563 1.03 262 2.21 565.0 1.03 570 1.02Vexp. = experimental ultimate shear strength (kN), Vpre. = predicted ultimate shear strength (kN)
7 Comparison of experimental andpredicted results
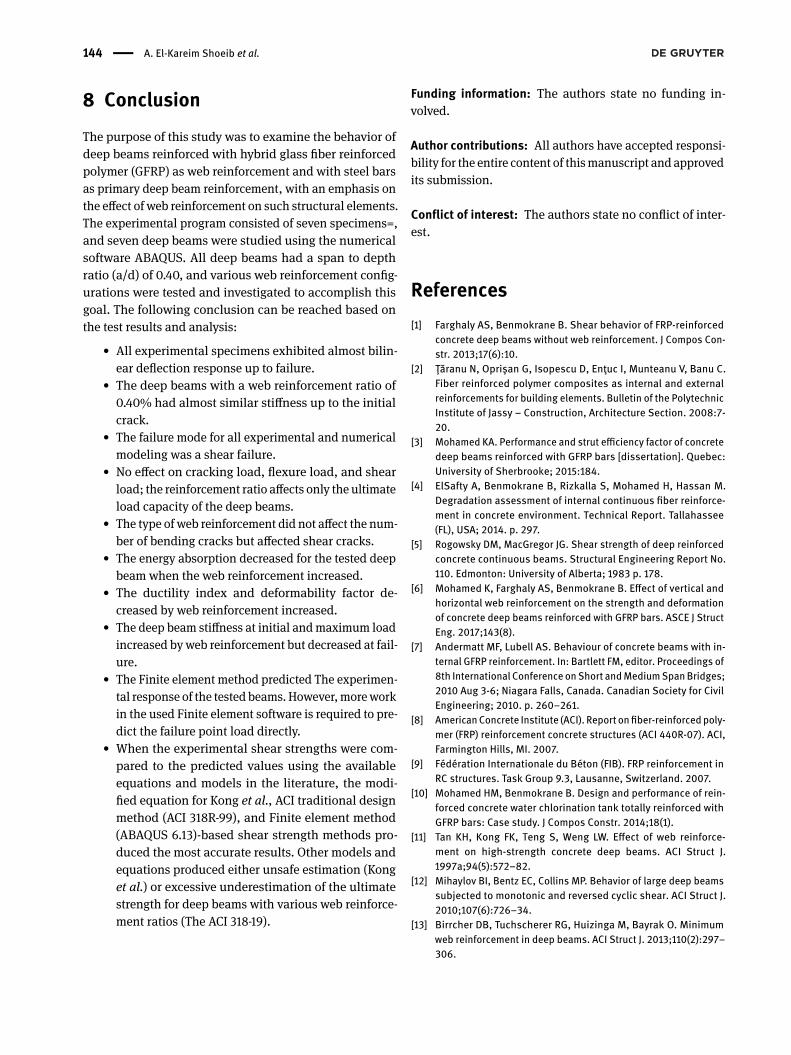
Table 15 shows the calculated ultimate shear strengths forthe tested beams with various web reinforcement ratiosbased on the abovemodels and equations. In Figure 38, theexperimental and predicted ultimate shear strengths Vexp.
Vpre.
ratios plotted for the beams. There are overestimations inthe predictions produced by Kong et al. has shown the ulti-mate strength for the deep beams. The ultimate strength ofdeep beams predicted using the ACI 318-19 gives a high con-servative prediction, and the ACI 318-19 appears to be moreconservative for deep beams reinforced with GFRP shearreinforcement. As a result, required new expressions to tem-per the excessive conservatism. The modified equation by
142 | A. El-Kareim Shoeib et al.
Figure 32: The relation between concrete tensile stress and con-crete cracking strain used in ABAQUS for tested specimens
Figure 33: Load-deflection curve for deep beams
Figure 34: Strain curve for deep beams’ main bar (Tie)
Figure 35: Strain curve of vertical web reinforcement for deepbeams
Figure 36: Strain curve of horizontal web reinforcement for deepbeams
authors that produced by Kong et al., ACI traditional designmethod (ACI 318-99) and finite element method (ABAQUS6.13) based shear strength prediction produced the bestestimation of ultimate shear capacity for deep beams withvarious web reinforcement ratios; the mean value of Vexp.Vpre.was 1.04 formodified equation produced by Kong et al., 1.01for ACI ACI traditional designmethod (ACI 318-99), and 1.03for Finite element method (ABAQUS 6.13).
Experimental and analytical study on the behavior of hybrid GFRP/steel bars | 143
Figure 37: Crack development and mode of failure
Figure 38: Ratios between Experimental to predicted ultimate shear strength of tested specimens
144 | A. El-Kareim Shoeib et al.
8 ConclusionThe purpose of this study was to examine the behavior ofdeep beams reinforced with hybrid glass fiber reinforcedpolymer (GFRP) as web reinforcement and with steel barsas primary deep beam reinforcement, with an emphasis onthe effect of web reinforcement on such structural elements.The experimental program consisted of seven specimens=,and seven deep beams were studied using the numericalsoftware ABAQUS. All deep beams had a span to depthratio (a/d) of 0.40, and various web reinforcement config-urations were tested and investigated to accomplish thisgoal. The following conclusion can be reached based onthe test results and analysis:
• All experimental specimens exhibited almost bilin-ear deflection response up to failure.
• The deep beams with a web reinforcement ratio of0.40% had almost similar stiffness up to the initialcrack.
• The failure mode for all experimental and numericalmodeling was a shear failure.
• No effect on cracking load, flexure load, and shearload; the reinforcement ratio affects only the ultimateload capacity of the deep beams.
• The type of web reinforcement did not affect the num-ber of bending cracks but affected shear cracks.
• The energy absorption decreased for the tested deepbeam when the web reinforcement increased.
• The ductility index and deformability factor de-creased by web reinforcement increased.
• The deep beam stiffness at initial andmaximum loadincreased by web reinforcement but decreased at fail-ure.
• The Finite element method predicted The experimen-tal response of the tested beams. However,moreworkin the used Finite element software is required to pre-dict the failure point load directly.
• When the experimental shear strengths were com-pared to the predicted values using the availableequations and models in the literature, the modi-fied equation for Kong et al., ACI traditional designmethod (ACI 318R-99), and Finite element method(ABAQUS 6.13)-based shear strength methods pro-duced the most accurate results. Other models andequations produced either unsafe estimation (Konget al.) or excessive underestimation of the ultimatestrength for deep beams with various web reinforce-ment ratios (The ACI 318-19).
Funding information: The authors state no funding in-volved.
Author contributions: All authors have accepted responsi-bility for the entire content of thismanuscript and approvedits submission.
Conflict of interest: The authors state no conflict of inter-est.
References[1] Farghaly AS, Benmokrane B. Shear behavior of FRP-reinforced
concrete deep beams without web reinforcement. J Compos Con-str. 2013;17(6):10.
[2] Țăranu N, Oprişan G, Isopescu D, Ențuc I, Munteanu V, Banu C.Fiber reinforced polymer composites as internal and externalreinforcements for building elements. Bulletin of the PolytechnicInstitute of Jassy – Construction, Architecture Section. 2008:7-20.
[3] Mohamed KA. Performance and strut eflciency factor of concretedeep beams reinforced with GFRP bars [dissertation]. Quebec:University of Sherbrooke; 2015:184.
[4] ElSafty A, Benmokrane B, Rizkalla S, Mohamed H, Hassan M.Degradation assessment of internal continuous fiber reinforce-ment in concrete environment. Technical Report. Tallahassee(FL), USA; 2014. p. 297.
[5] Rogowsky DM, MacGregor JG. Shear strength of deep reinforcedconcrete continuous beams. Structural Engineering Report No.110. Edmonton: University of Alberta; 1983 p. 178.
[6] Mohamed K, Farghaly AS, Benmokrane B. Effect of vertical andhorizontal web reinforcement on the strength and deformationof concrete deep beams reinforced with GFRP bars. ASCE J StructEng. 2017;143(8).
[7] Andermatt MF, Lubell AS. Behaviour of concrete beams with in-ternal GFRP reinforcement. In: Bartlett FM, editor. Proceedings of8th International Conference onShort andMediumSpanBridges;2010 Aug 3-6; Niagara Falls, Canada. Canadian Society for CivilEngineering; 2010. p. 260–261.
[8] AmericanConcrete Institute (ACI). Report onfiber-reinforcedpoly-mer (FRP) reinforcement concrete structures (ACI 440R-07). ACI,Farmington Hills, MI. 2007.
[9] Fédération Internationale du Béton (FIB). FRP reinforcement inRC structures. Task Group 9.3, Lausanne, Switzerland. 2007.
[10] Mohamed HM, Benmokrane B. Design and performance of rein-forced concrete water chlorination tank totally reinforced withGFRP bars: Case study. J Compos Constr. 2014;18(1).
[11] Tan KH, Kong FK, Teng S, Weng LW. Effect of web reinforce-ment on high-strength concrete deep beams. ACI Struct J.1997a;94(5):572–82.
[12] Mihaylov BI, Bentz EC, Collins MP. Behavior of large deep beamssubjected to monotonic and reversed cyclic shear. ACI Struct J.2010;107(6):726–34.
[13] Birrcher DB, Tuchscherer RG, Huizinga M, Bayrak O. Minimumweb reinforcement in deep beams. ACI Struct J. 2013;110(2):297–306.

Experimental and analytical study on the behavior of hybrid GFRP/steel bars | 145
[14] American Concrete Institute (ACI). Building code requirementsfor structural concrete (ACI 318-14). ACI, Farmington Hills, MI.2014.
[15] AmericanConcrete Institute (ACI). Building code requirements forstructural concrete (ACI 318-19 and ACI 318R-19). ACI, FarmingtonHills, MI. 2019:628.
[16] American Concrete Institute (ACI). Guide for the design and con-struction of concrete reinforced with FRP bars (ACI 440.1R-03).ACI, Farmington Hills, MI. 2003:42.
[17] American Concrete Institute (ACI). Specifications for structuralconcrete (ACI 301-99). ACI, Farmington Hills, MI.1999:49.
[18] Kong FK, Sharp GR, Appleton SC, Beaumont CJ, Kubik LA. Struc-tural idealization for deep beams with web openings: Furtherevidence. Magazine Concr Res. 1978;30(103):89–95.
[19] Ghoneim M, El Mihilmy M. Design of reinforced concrete struc-tures. 1st ed. Oxford University Press. 2008. p. 817.
[20] Schlaich J, Schäfer K. Design and detailing of structural concreteusing strut-and-tie models. Struct Eng. 1991;69(6):113–25.
[21] Mitchell D, Collins MP, Bhide SB, Rabbat BG. AASHTO LRFD Strut-and-Tie Model Design Examples. 1st ed. Skokie (IL): PortlandCement Association; 2004. p. 60.
[22] Brown MD, Bayrak O. Minimum Transverse Reinforcement forBottle-Shaped Struts. ACI Struct J. 2006;103(6):813–21.
[23] ACI Committee 440. Guide for the Design and Construction ofConcrete Reinforced with FRP Bars (ACI 440.1R-06). ACI, Farm-ington Hills, MI. 2006: 44.
Copyright © 2022 FDOKUMEN