Resonance Raman spectroscopy of red blood cells using near-infrared laser excitation

Online edition for students of organic chemistry lab courses at the University of Colorado, Boulder, Dept of Chem and Biochem. (2002)
uChapter 15
Infrared Spectroscopy: Theory
An important tool of the organic chemist is Infrared Spectroscopy, or IR. IR spectraare acquired on a special instrument, called an IR spectrometer. IR is used both togather information about the structure of a compound and as an analytical tool toassess the purity of a compound. IR spectra are quick and easy to run, and since theteaching labs are fortunate enough to have three of these instruments, students areencouraged to acquire spectra of compounds made in the laboratory throughout thefirst and second semesters of the lab course.
15.1 The Electromagnetic SpectrumInfrared refers to that part of the electromagnetic spectrum between the visible andmicrowave regions. Electromagnetic spectrum refers to the seemingly diverse col-lection of radiant energy, from cosmic rays to X-rays to visible light to microwaves,each of which can be considered as a wave or particle traveling at the speed of light.These waves differ from each other in the length and frequency, as illustrated inFigure 15.1.
Frequency, ν (nu), is the number of wave cycles that pass through a point in one sec-ond. It is measured in Hz, where 1 Hz = 1 cycle/sec. Wavelength, λ (lambda), is thelength of one complete wave cycle. It is often measured in cm (centimeters). Wave-length and frequency are inversely related:
and
where c is the speed of light, 3 x 1010 cm/sec
Energy is related to wavelength and frequency by the following for-mulas:
where h = Planck’s constant, 6.6 x 10⁻³⁴ joules-sec
Note that energy is directly proportional to frequency and inversely proportional towavelength.
The IR region is divided into three regions: the near, mid, and far IR (seeFigure 15.2). The mid IR region is of greatest practical use to the organic chemist.This is the region of wavelengths between 3 x 10⁻⁴ and 3 x 10⁻³ cm. Chemists preferto work with numbers which are easy to write; therefore IR spectra are sometimesreported in µm, although another unit, ν (nu bar or wavenumber), is currently pre-ferred.
Eq. 1ν cλ---= λ c
ν---=
Eq. 2
E hν hcλ------= =
The Electromagnetic Spectrum15 Infrared Spectroscopy: Theory 155

Online edition for students of organic chemistry lab courses at the University of Colorado, Boulder, Dept of Chem and Biochem. (2002)
A wavenumber is the inverse of the wavelength in cm:
where ν is in units of cm–1, λ is in units of cm
and now:
In wavenumbers, the mid IR range is 4000–400 cm–1. An increase inwavenumber corresponds to an increase in energy. As you will learn later, this is aconvenient relationship for the organic chemist.
Infrared radiation is absorbed by organic molecules and converted into energy ofmolecular vibration. In IR spectroscopy, an organic molecule is exposed to infraredradiation. When the radiant energy matches the energy of a specific molecular vibra-tion, absorption occurs. A typical IR spectrum is shown below. The wavenumber,plotted on the X-axis, is proportional to energy; therefore, the highest energy vibra-tions are on the left. The percent transmittance (%T) is plotted on the Y-axis. Anabsorption of radiant energy is therefore represented by a “trough” in the curve: zerotransmittance corresponds to 100% absorption of light at that wavelength.
Figure 15.1 The electromagnetic spectrum.
purplebluegreenred
cosmic rays, 10-12 to 10-10cm
gamma rays, 10-10 to 10-8cm
X-rays, 10-8 to 10-6cm
far ultraviolet, 10-6 to 2x10⁻⁵cmultraviolet, 2x10⁻⁵ to 3.8x10⁻⁵cmvisible, 3.8x10⁻⁵ to 7.8x10⁻⁵cm
infrared, 7.8x10⁻⁵ to 3x10⁻²cm
microwave, 3x10⁻² to 102cm
radiofrequency, .6x102 to 5x102cm
10-12
10-10
10-8
10-6
10-2
102
103
0
wav
elen
gth
energy
λ
Eq. 3ν 1λ---=
Eq. 4E hcν=
The Electromagnetic Spectrum15 Infrared Spectroscopy: Theory 156

Online edition for students of organic chemistry lab courses at the University of Colorado, Boulder, Dept of Chem and Biochem. (2001)
Band intensities can also be expressed as absorbance (A). Absorbance is the loga-rithm, to the base 10, of the reciprocal of the transmittance:
A = log10 (1/T)
Note how the same spectrum appears when plotted as T and when plotted as A(Figure 15.3).
As illustrated in the spectrum of octane, even simple organic molecules give rise tocomplex IR spectra. Both the complexity and the wavenumbers of the peaks in thespectra give the chemist information about the molecule. The complexity is useful tomatch an experimental spectrum with that of a known compound with a peak-by-peak correlation. To facilitate this analysis, compilations of IR spectra are available,most well-known of which are those by Sadtler and Aldrich. While in the past thesecompilations were available only in printed form, they are now available in CD
Figure 15.2 The IR regions of the electromagnetic spectrum.
visible
infrared
microwave
7.8x10⁻⁵ to 3x10⁻⁴
(.000078-.0003)
3x10⁻⁴ to 3x10⁻³
(.0003-.003)
3x10⁻³ to 3x10⁻²
(.003-.03)
0.78 to 3
3 to 30
30-300
12820 to 4000
4000 to 400
400 to 33
MID
NEAR
FAR
λ, cm λ, µmλ, cm-1
(wavenumber)
recall: cm = 10-2 m mm = 10-3 m µm = 10-6 m
10-37 Kcal/mole
1-10 Kcal/mole
0.1-1 Kcal/mole
energy (E)
Figure 15.3 The IR spectrum of octane, plotted as transmission (left) and absorbance (right).
The Electromagnetic Spectrum15 Infrared Spectroscopy: Theory 157
Online edition for students of organic chemistry lab courses at the University of Colorado, Boulder, Dept of Chem and Biochem. (2002)
ROM format for computer analysis. These “libraries” are quite expensive and arenot available in our teaching laboratories, although we do have several smallerlibraries which you will be able to search to match spectra which you run on our IRinstruments.
The wavenumbers (sometimes referred to as frequencies) at which an organic mole-cule absorbs radiation give information on functional groups present in the mole-cule. Certain groups of atoms absorb energy and therefore, give rise to bands atapproximately the same frequencies. The chemist analyzes a spectrum with the helpof tables which correlate frequencies with functional groups. The theory behind thisrelationship is discussed in the next section on molecular vibrations.
15.2 Molecular VibrationsThere are two types of molecular vibrations, stretching and bending. As a student ofchemistry, you may have come to think of a molecule as having rigid bond lengthsand bond angles, as when you work with your molecular model sets. This is not theactual case, since bond lengths and angles represent the average positions aboutwhich atoms vibrate.
A molecule consisting of n atoms has a total of 3 n degrees of freedom, correspond-ing to the Cartesian coordinates of each atom in the molecule. In a nonlinear mole-cule, 3 of these degrees are rotational and 3 are translational and the remainingcorrespond to fundamental vibrations; in a linear molecule, 2 degrees are rotationaland 3 are translational. The net number of fundamental vibrations for nonlinear andlinear molecules is therefore:
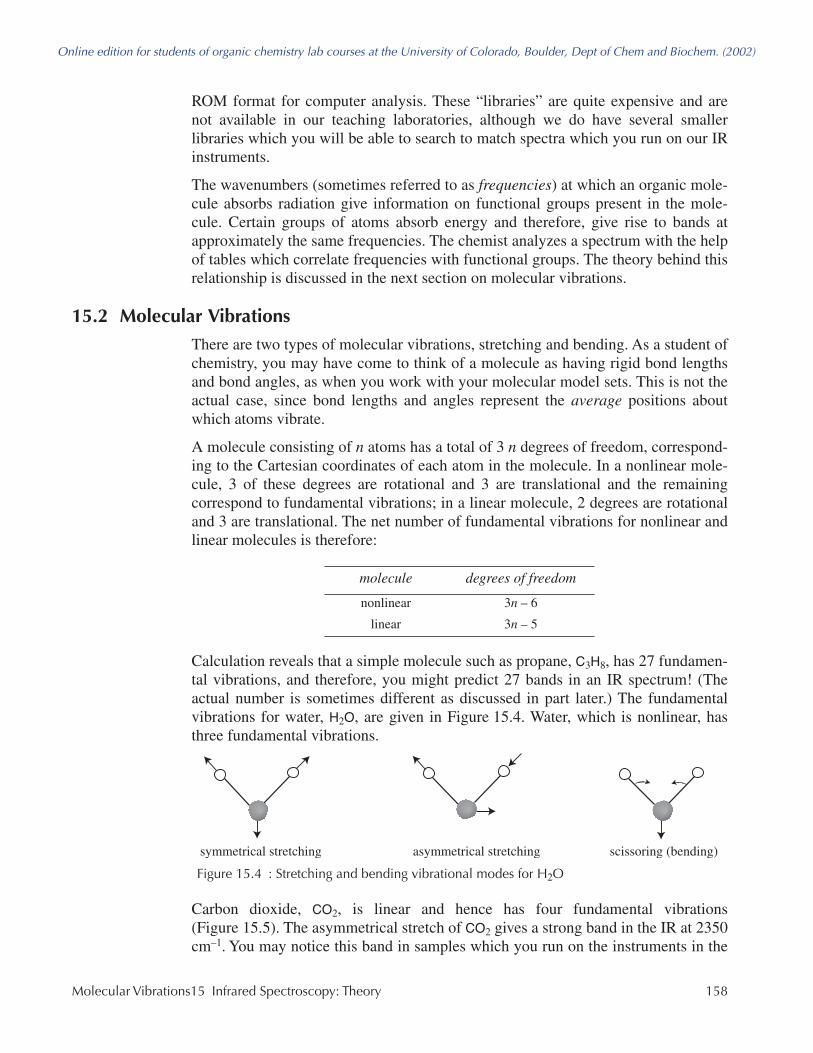
Calculation reveals that a simple molecule such as propane, C3H8, has 27 fundamen-tal vibrations, and therefore, you might predict 27 bands in an IR spectrum! (Theactual number is sometimes different as discussed in part later.) The fundamentalvibrations for water, H2O, are given in Figure 15.4. Water, which is nonlinear, hasthree fundamental vibrations.
Carbon dioxide, CO2, is linear and hence has four fundamental vibrations(Figure 15.5). The asymmetrical stretch of CO2 gives a strong band in the IR at 2350cm–1. You may notice this band in samples which you run on the instruments in the
molecule degrees of freedom
nonlinear 3n – 6
linear 3n – 5
Figure 15.4 : Stretching and bending vibrational modes for H2O
symmetrical stretching asymmetrical stretching scissoring (bending)
Molecular Vibrations15 Infrared Spectroscopy: Theory 158

Online edition for students of organic chemistry lab courses at the University of Colorado, Boulder, Dept of Chem and Biochem. (2001)
teaching labs, since CO2 is present in the atmosphere. The two scissoring or bendingvibrations are equivalent and therefore, have the same frequency and are said to bedegenerate, appearing in an IR spectrum at 666 cm–1.
The symmetrical stretch of CO2 is inactive in the IR because this vibration producesno change in the dipole moment of the molecule. In order to be IR active, a vibrationmust cause a change in the dipole moment of the molecule.* (The reason for thisinvolves the mechanism by which the photon transfers its energy to the molecule,which is beyond the scope of this discussion.) Of the following linear molecules,carbon monoxide and iodine chloride absorb IR radiation, while hydrogen, nitrogen,and chlorine do not. In general, the larger the dipole change, the stronger the inten-sity of the band in an IR spectrum.
C≡O I—Cl H2 N2 Cl2absorb in IR do not absorb in IR
Only two IR bands (2350 and 666 cm–1) are seen for carbon dioxide, instead of fourcorresponding to the four fundamental vibrations. Carbon dioxide is an example ofwhy one does not always see as many bands as implied by our simple calculation. Inthe case of CO2, two bands are degenerate, and one vibration does not cause achange in dipole moment. Other reasons why fewer than the theoretical number ofIR bands are seen include: an absorption is not in the 4000–400 cm–1 range; anabsorption is too weak to be observed; absorptions are too close to each other to beresolved on the instrument. Additional weak bands which are overtones or combina-tions of fundamental vibrations are observed.
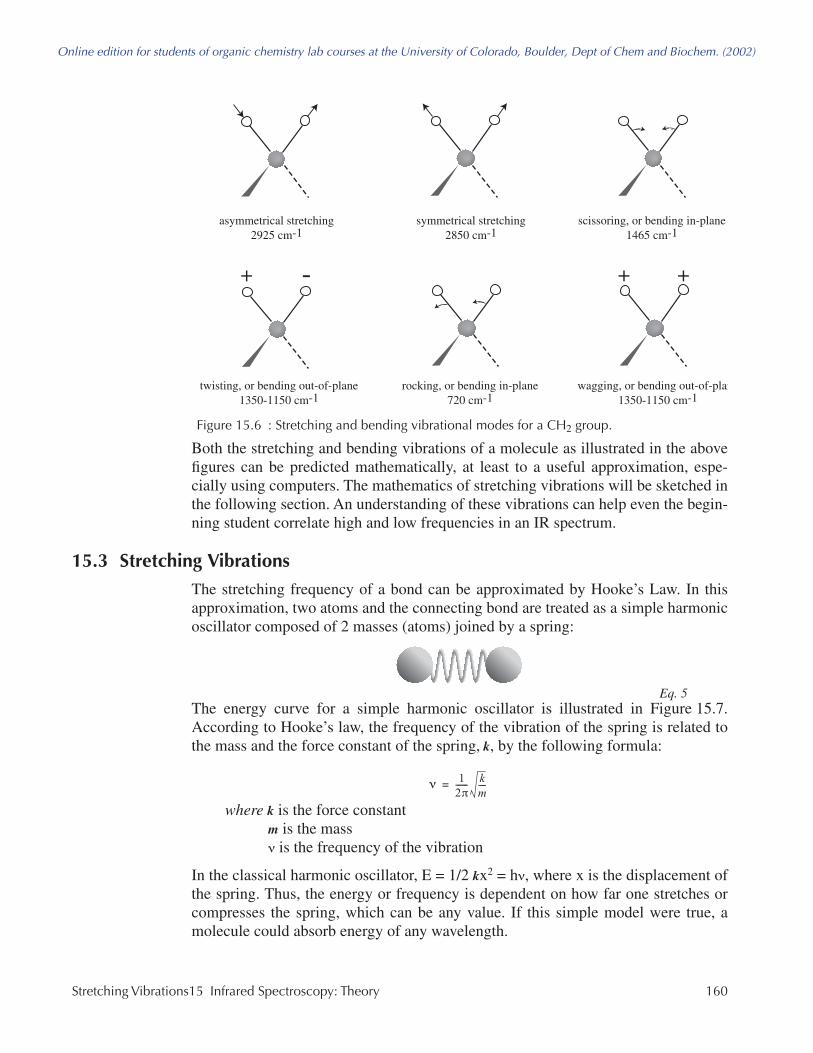
The stretching and bending vibrations for the important organic group, –CH2, areillustrated in Figure 15.6. (The 3n–6 rule does not apply since the –CH2 group repre-sents only a portion of a molecule.) Note that bending vibrations occur at lower fre-quencies than corresponding stretching vibrations.
* Recall that the dipole moment is defined as the product of the charge and the distance of sepa-ration. The distance has direction, therefore, dipole moments are vectors.
Figure 15.5 : Stretching and bending vibrational modes for CO2
- -+
symmetrical stretching
asymmetrical stretching scissoring (bending in and out of the plane of the paper)
scissoring (bending in the plane of the paper)
Molecular Vibrations15 Infrared Spectroscopy: Theory 159
Online edition for students of organic chemistry lab courses at the University of Colorado, Boulder, Dept of Chem and Biochem. (2002)
Both the stretching and bending vibrations of a molecule as illustrated in the abovefigures can be predicted mathematically, at least to a useful approximation, espe-cially using computers. The mathematics of stretching vibrations will be sketched inthe following section. An understanding of these vibrations can help even the begin-ning student correlate high and low frequencies in an IR spectrum.
15.3 Stretching VibrationsThe stretching frequency of a bond can be approximated by Hooke’s Law. In thisapproximation, two atoms and the connecting bond are treated as a simple harmonicoscillator composed of 2 masses (atoms) joined by a spring:
The energy curve for a simple harmonic oscillator is illustrated in Figure 15.7.According to Hooke’s law, the frequency of the vibration of the spring is related tothe mass and the force constant of the spring, k, by the following formula:
where k is the force constantm is the massν is the frequency of the vibration
In the classical harmonic oscillator, E = 1/2 kx2 = hν, where x is the displacement ofthe spring. Thus, the energy or frequency is dependent on how far one stretches orcompresses the spring, which can be any value. If this simple model were true, amolecule could absorb energy of any wavelength.
Figure 15.6 : Stretching and bending vibrational modes for a CH2 group.
asymmetrical stretching2925 cm-1
symmetrical stretching2850 cm-1
scissoring, or bending in-plane1465 cm-1
- ++ +
wagging, or bending out-of-plan1350-1150 cm-1
twisting, or bending out-of-plane1350-1150 cm-1
rocking, or bending in-plane720 cm-1
ν 12π------ k
m----=
Eq. 5
Stretching Vibrations15 Infrared Spectroscopy: Theory 160

Online edition for students of organic chemistry lab courses at the University of Colorado, Boulder, Dept of Chem and Biochem. (2001)
However, vibrational motion is quantized: it must follow the rules of quantummechanics, and the only transitions which are allowed fit the following formula:
E = (n + 1/2)hν Eq. 6
where ν is the frequency of the vibrationn is the quantum number (0, 1, 2, 3, . . . )
The lowest energy level is E0 = 1/2 hν, the next highest is E1 = 3/2 hν. According tothe selection rule, only transitions to the next energy level are allowed; thereforemolecules will absorb an amount of energy equal to 3/2 – 1/2 hν or hν. This rule isnot inflexible, and occasionally transitions of 2 hν, 3 hν, or higher are observed.These correspond to bands called overtones in an IR spectrum. They are of lowerintensity than the fundamental vibration bands.
A molecule is not just two atoms joined on a spring, of course. A bond can comeapart, and it cannot be compressed beyond a certain point. A molecule is actually ananharmonic oscillator. As the interatomic distance increases, the energy reaches amaximum, as seen in Figure 15.8. Note how the energy levels become more closelyspaced with increasing interatomic distance in the anharmonic oscillator. Theallowed transitions, hν, become smaller in energy. Therefore, overtones can be lowerin energy than predicted by the harmonic oscillator theory.
The following formula has been derived from Hooke’s law. For the case of adiatomicmolecule, (ν has been substituted for ν, recall that ν = cν from equations 1 and 3):
where ν is the vibrational frequency (cm–1)m1 and m2 are the mass of atoms 1 and 2, respectively, in gc is the velocity of light (cm/s)
Figure 15.7 : Energy curve for a vibrating spring (left) and energy constrained to quantum mechanical model (right).
hν po
tent
ial e
nerg
y
pote
ntia
l ene
rgy
displacement (x)
1/2 kx21/2 kx2
E0 = 1/2 hν
ν 12πc---------
f m1 m2+( )
m1m2
---------------------------=Eq. 7
Stretching Vibrations15 Infrared Spectroscopy: Theory 161

Online edition for students of organic chemistry lab courses at the University of Colorado, Boulder, Dept of Chem and Biochem. (2002)
f is the force constant of the bond (dyne/cm)
Equation 7 shows the relationship of bond strength and atomic mass to the wave-number at which a molecule will absorb IR radiation. As the force constantincreases, the vibrational frequency (wavenumber) also increases. The force con-stants for bonds are:
As the mass of the atoms increases, the vibration frequency decreases. Using the fol-lowing mass values:
ν for a C–H bond is calculated to be 3032 cm–1. (Try this calculation!) The actualrange for C–H absorptions is 2850–3000 cm–1. The region of an IR spectrum wherebond stretching vibrations are seen depends primarily on whether the bonds are sin-gle, double, or triple or bonds to hydrogen. The following table shows where absorp-tion by single, double, and triple bonds are observed in an IR spectrum. You shouldtry calculating a few of these values to convince yourself that the Hooke’s lawapproximation is a useful one.
single bond 5 x 10⁵ dyne/cm
double bond 10 x 105 dyne/cm
triple bond 15 x 105 dyne/cm
C, carbon 12/6.02 x 1023
H, hydrogen 1/6.02 x 1023
bond absorption region, cm–1
C–C, C–O, C–N 800–1300
Figure 15.8 : Energy curve for an anharmonic oscillator (showing the vibrational levels for a vibrating bond).
“bond length”
hν
E bond dissociationenergy
interatomic distance
0
1
23
4
Stretching Vibrations15 Infrared Spectroscopy: Theory 162

Online edition for students of organic chemistry lab courses at the University of Colorado, Boulder, Dept of Chem and Biochem. (2001)
Although a useful approximation, the motion of two atoms in a large molecule can-not be isolated from the motion of the rest of the atoms in the molecule. In a mole-cule, two oscillating bonds can share a common atom. When this happens, thevibrations of the two bonds are coupled. As one bond contracts, the other bond caneither contract or expand, as in asymmetrical and symmetrical stretching. In general,when coupling occurs, bands at different frequencies are observed, instead of super-imposed (or degenerate) bands as you might expect from two identical atoms in abond vibrating with an identical force constant. In the case of the –CH2 group inFigure 15.6, you note there are two bands in the region for C—H bonds: 2926 cm–1
and 2853 cm–1.
C=C, C=O, C=N, N=O 1500–1900C≡C, C≡N 2000–2300
C–H, N–H, O–H 2700–3800
Stretching Vibrations15 Infrared Spectroscopy: Theory 163

Online edition for students of organic chemistry lab courses at the University of Colorado, Boulder, Dept of Chem and Biochem. (2002)
Stretching Vibrations15 Infrared Spectroscopy: Theory 164
Copyright © 2022 FDOKUMEN