Specific functional asymmetries of the human visual cortex revealed by functional Near-Infrared...
7
Research Report Specific functional asymmetries of the human visual cortex revealed by functional near-infrared spectroscopy Danielle Bastien a, b , Anne Gallagher a, b, c , Julie Tremblay a , Phetsamone Vannasing a , Martin Thériault a, b , Maryse Lassonde a, b , Franco Lepore a, b, ⁎ a Centre de Recherche, Centre Hospitalier Universitaire Sainte-Justine, 3175 Chemin de la Côte Sainte-Catherine, Montréal, Canada H3T 1C5 b Centre de Recherche en Neuropsychologie et Cognition, Département de Psychologie, Université de Montréal, C.P. 6128, Succursale Centre-Ville, Montréal, Québec, Canada H3C 3J7 c Harvard Medical School; Martinos Center for Biomedical Imaging, Department of Neurology, Massachusetts General Hospital, 75 Cambridge Street, Suite 340, Boston, MA 02114, USA ARTICLE INFO ABSTRACT Article history: Accepted 3 November 2011 Based on multiple invasive reports and neuroimaging studies, it is well established that the cytoarchitecture of the visual cortex is related to its functional organization, namely, its retinotopy. The present study aimed to further investigate retinotopic mapping as well as specific vertical and horizontal functional asymmetries within the human visual cortex using functional near-infrared spectroscopy (fNIRS). Black and white wedge checkerboard stimuli were randomly presented to the four visual field (VF) quadrants of eight healthy adults in order to quantify and compare the localization and the amplitude of hemodynamic cortical responses to each VF quadrant. Results showed the expected activation in the contralateral hemisphere, with respect to the side of the stimulated quadrant. We also measured signifi- cantly stronger activations in the upper visual cortex when low hemifield stimuli were presented compared to activations in the lower visual cortex when upper hemifield stimuli were shown, especially when the stimulation was presented in the right visual field. These findings confirm the vertical asymmetry of the visual cortex previously reported by neuroim- aging and behavioral studies. More importantly, the present work confirms the reliability of the fNIRS technique for functional mapping of the human brain. © 2011 Elsevier B.V. All rights reserved. Keywords: Retinotopic mapping Visual cortex asymmetries Vertical asymmetry fNIRS Optical imaging 1. Introduction It is well established that the cytoarchitecture of the human visual cortex, also called retinotopy, is related to its functional organization with a point-to-point inversed projection from retina to cortex (Aine et al., 1996; Blasdel and Campbell, 2001; DeYoe et al., 1996; Grill-Spector and Malach, 2004; Tootell et al., 1988). For instance, right inferior visual field (VF) stimula- tion principally recruits neurons in the left superior visual cortex. In past decades, this retinotopic organization has been demonstrated using several neuroimaging techniques, such as functional magnetic resonance imaging (fMRI), magnetoen- cephalography (MEG), transcranial magnetic stimulation (TMS), and H 2 15 O positron emission tomography (PET). In addition to the retinotopy, these techniques have also shown vertical and horizontal functional asymmetries. For BRAIN RESEARCH XX (2011) XXX – XXX ⁎ Corresponding author at: Canada Research Chair in Cognitive Neurosciences, Département de Psychologie, Université de Montréal, C.P. 6128, Succursale Centre-Ville, Montréal, Québec, Canada H3C 3J7. Fax: +1 514 343 2285. E-mail address: [email protected] (F. Lepore). BRES-41889; No. of pages: 7; 4C: 2, 3, 4 0006-8993/$ – see front matter © 2011 Elsevier B.V. All rights reserved. doi:10.1016/j.brainres.2011.11.008 Available online at www.sciencedirect.com www.elsevier.com/locate/brainres Please cite this article as: Bastien, D., et al., Specific functional asymmetries of the human visual cortex revealed by functional near-infrared spectroscopy, Brain Res. (2011), doi:10.1016/j.brainres.2011.11.008
-
Upload
independent -
Category
Documents
-
view
0 -
download
0
Transcript of Specific functional asymmetries of the human visual cortex revealed by functional Near-Infrared...
B R A I N R E S E A R C H X X ( 2 0 1 1 ) X X X – X X X
BRES-41889; No. of pages: 7; 4C: 2, 3, 4
Ava i l ab l e on l i ne a t www.sc i enced i r ec t . com
www.e l sev i e r . com/ loca te /b ra i n res
Research Report
Specific functional asymmetries of the human visual cortexrevealed by functional near-infrared spectroscopy
Danielle Bastiena, b, Anne Gallaghera, b, c, Julie Tremblaya, Phetsamone Vannasinga,Martin Thériaulta, b, Maryse Lassondea, b, Franco Leporea, b,⁎aCentre de Recherche, Centre Hospitalier Universitaire Sainte-Justine, 3175 Chemin de la Côte Sainte-Catherine, Montréal, Canada H3T 1C5bCentre de Recherche en Neuropsychologie et Cognition, Département de Psychologie, Université de Montréal, C.P. 6128, Succursale Centre-Ville,Montréal, Québec, Canada H3C 3J7cHarvard Medical School; Martinos Center for Biomedical Imaging, Department of Neurology, Massachusetts General Hospital, 75 CambridgeStreet, Suite 340, Boston, MA 02114, USA
A R T I C L E I N F O
⁎ Corresponding author at:CanadaResearch ChSuccursale Centre-Ville, Montréal, Québec, Ca
E-mail address: franco.lepore@umontreal
0006-8993/$ – see front matter © 2011 Elseviedoi:10.1016/j.brainres.2011.11.008
Please cite this article as: Bastien, D., et anear-infrared spectroscopy, Brain Res. (2
A B S T R A C T
Article history:Accepted 3 November 2011
Based on multiple invasive reports and neuroimaging studies, it is well established that thecytoarchitecture of the visual cortex is related to its functional organization, namely, itsretinotopy. The present study aimed to further investigate retinotopic mapping as well asspecific vertical and horizontal functional asymmetries within the human visual cortexusing functional near-infrared spectroscopy (fNIRS). Black and white wedge checkerboardstimuli were randomly presented to the four visual field (VF) quadrants of eight healthy adultsin order to quantify and compare the localization and the amplitude of hemodynamic corticalresponses to each VF quadrant. Results showed the expected activation in the contralateralhemisphere, with respect to the side of the stimulated quadrant. We also measured signifi-cantly stronger activations in the upper visual cortex when low hemifield stimuli werepresented compared to activations in the lower visual cortex when upper hemifield stimuliwere shown, especially when the stimulation was presented in the right visual field. Thesefindings confirm the vertical asymmetry of the visual cortex previously reported by neuroim-aging and behavioral studies. More importantly, the present work confirms the reliability ofthe fNIRS technique for functional mapping of the human brain.
© 2011 Elsevier B.V. All rights reserved.
Keywords:Retinotopic mappingVisual cortex asymmetriesVertical asymmetryfNIRSOptical imaging
1. Introduction
It is well established that the cytoarchitecture of the humanvisual cortex, also called retinotopy, is related to its functionalorganization with a point-to-point inversed projection fromretina to cortex (Aine et al., 1996; Blasdel and Campbell, 2001;DeYoe et al., 1996; Grill-Spector and Malach, 2004; Tootellet al., 1988). For instance, right inferior visual field (VF) stimula-
air in CognitiveNeuroscienada H3C 3J7. Fax: +1 514.ca (F. Lepore).
r B.V. All rights reserved.
l., Specific functional as011), doi:10.1016/j.brain
tion principally recruits neurons in the left superior visualcortex. In past decades, this retinotopic organization has beendemonstrated using several neuroimaging techniques, such asfunctional magnetic resonance imaging (fMRI), magnetoen-cephalography (MEG), transcranial magnetic stimulation(TMS), and H2
15O positron emission tomography (PET).In addition to the retinotopy, these techniques have also
shown vertical and horizontal functional asymmetries. For
nces, Département de Psychologie, Université deMontréal, C.P. 6128,343 2285.
ymmetries of the human visual cortex revealed by functionalres.2011.11.008
2 B R A I N R E S E A R C H X X ( 2 0 1 1 ) X X X – X X X
instance, Portin et al. (1999) presented a black and white check-erboard to a group of healthy adults during MEG recordings.Theyused a single equivalent current dipole in the contralateraloccipital cortex to show that dipoles are twice stronger inresponse to stimuli presented within the lower VF than for
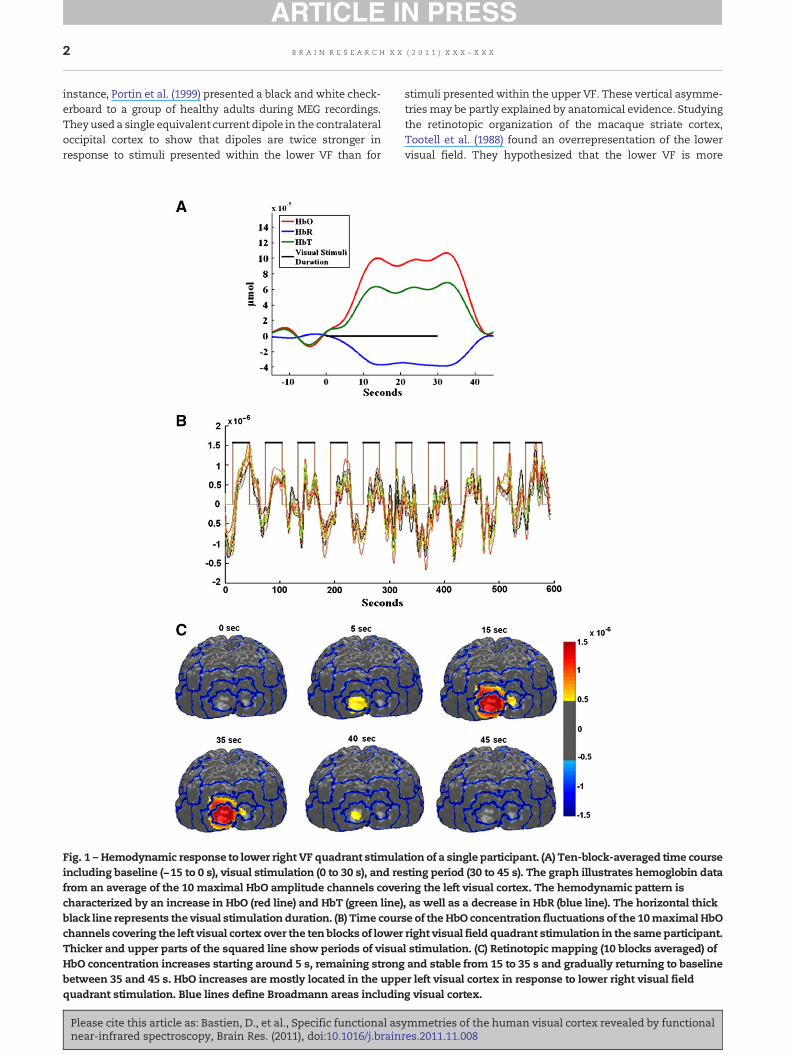
Fig. 1 – Hemodynamic response to lower right VF quadrant stimulaincluding baseline (−15 to 0 s), visual stimulation (0 to 30 s), and refrom an average of the 10 maximal HbO amplitude channels covercharacterized by an increase in HbO (red line) and HbT (green line)black line represents the visual stimulation duration. (B) Time courchannels covering the left visual cortex over the ten blocks of lowerThicker and upper parts of the squared line show periods of visuaHbO concentration increases starting around 5 s, remaining strongbetween 35 and 45 s. HbO increases are mostly located in the uppquadrant stimulation. Blue lines define Broadmann areas includin
Please cite this article as: Bastien, D., et al., Specific functional asnear-infrared spectroscopy, Brain Res. (2011), doi:10.1016/j.brain
stimuli presented within the upper VF. These vertical asymme-triesmay be partly explained by anatomical evidence. Studyingthe retinotopic organization of the macaque striate cortex,Tootell et al. (1988) found an overrepresentation of the lowervisual field. They hypothesized that the lower VF is more
tion of a single participant. (A) Ten-block-averaged time coursesting period (30 to 45 s). The graph illustrates hemoglobin dataing the left visual cortex. The hemodynamic pattern is, as well as a decrease in HbR (blue line). The horizontal thickse of theHbO concentration fluctuations of the 10maximal HbOright visual field quadrant stimulation in the same participant.l stimulation. (C) Retinotopic mapping (10 blocks averaged) ofand stable from 15 to 35 s and gradually returning to baseline
er left visual cortex in response to lower right visual fieldg visual cortex.
ymmetries of the human visual cortex revealed by functionalres.2011.11.008
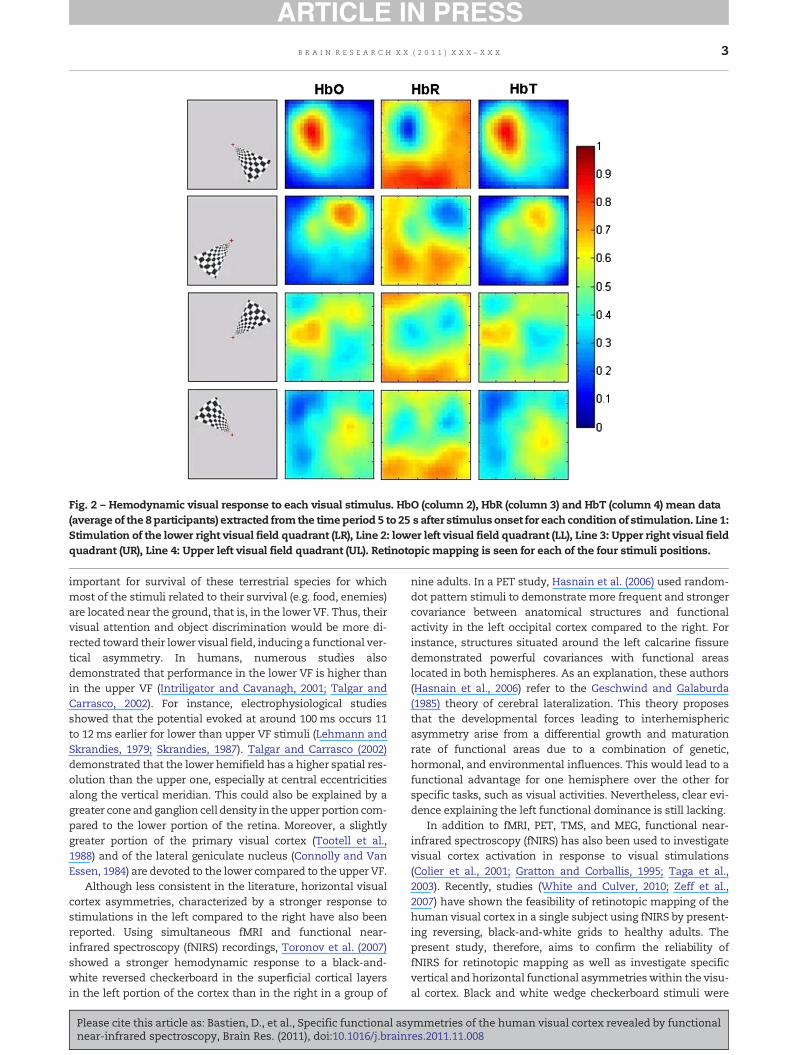
Fig. 2 – Hemodynamic visual response to each visual stimulus. HbO (column 2), HbR (column 3) and HbT (column 4) mean data(average of the 8 participants) extracted from the time period 5 to 25 s after stimulus onset for each condition of stimulation. Line 1:Stimulation of the lower right visual field quadrant (LR), Line 2: lower left visual field quadrant (LL), Line 3: Upper right visual fieldquadrant (UR), Line 4: Upper left visual field quadrant (UL). Retinotopic mapping is seen for each of the four stimuli positions.
3B R A I N R E S E A R C H X X ( 2 0 1 1 ) X X X – X X X
important for survival of these terrestrial species for whichmost of the stimuli related to their survival (e.g. food, enemies)are located near the ground, that is, in the lower VF. Thus, theirvisual attention and object discrimination would be more di-rected toward their lower visual field, inducing a functional ver-tical asymmetry. In humans, numerous studies alsodemonstrated that performance in the lower VF is higher thanin the upper VF (Intriligator and Cavanagh, 2001; Talgar andCarrasco, 2002). For instance, electrophysiological studiesshowed that the potential evoked at around 100 ms occurs 11to 12ms earlier for lower than upper VF stimuli (Lehmann andSkrandies, 1979; Skrandies, 1987). Talgar and Carrasco (2002)demonstrated that the lower hemifield has a higher spatial res-olution than the upper one, especially at central eccentricitiesalong the vertical meridian. This could also be explained by agreater cone andganglion cell density in the upper portion com-pared to the lower portion of the retina. Moreover, a slightlygreater portion of the primary visual cortex (Tootell et al.,1988) and of the lateral geniculate nucleus (Connolly and VanEssen, 1984) are devoted to the lower compared to the upper VF.
Although less consistent in the literature, horizontal visualcortex asymmetries, characterized by a stronger response tostimulations in the left compared to the right have also beenreported. Using simultaneous fMRI and functional near-infrared spectroscopy (fNIRS) recordings, Toronov et al. (2007)showed a stronger hemodynamic response to a black-and-white reversed checkerboard in the superficial cortical layersin the left portion of the cortex than in the right in a group of
Please cite this article as: Bastien, D., et al., Specific functional asnear-infrared spectroscopy, Brain Res. (2011), doi:10.1016/j.brain
nine adults. In a PET study, Hasnain et al. (2006) used random-dot pattern stimuli to demonstrate more frequent and strongercovariance between anatomical structures and functionalactivity in the left occipital cortex compared to the right. Forinstance, structures situated around the left calcarine fissuredemonstrated powerful covariances with functional areaslocated in both hemispheres. As an explanation, these authors(Hasnain et al., 2006) refer to the Geschwind and Galaburda(1985) theory of cerebral lateralization. This theory proposesthat the developmental forces leading to interhemisphericasymmetry arise from a differential growth and maturationrate of functional areas due to a combination of genetic,hormonal, and environmental influences. This would lead to afunctional advantage for one hemisphere over the other forspecific tasks, such as visual activities. Nevertheless, clear evi-dence explaining the left functional dominance is still lacking.
In addition to fMRI, PET, TMS, and MEG, functional near-infrared spectroscopy (fNIRS) has also been used to investigatevisual cortex activation in response to visual stimulations(Colier et al., 2001; Gratton and Corballis, 1995; Taga et al.,2003). Recently, studies (White and Culver, 2010; Zeff et al.,2007) have shown the feasibility of retinotopic mapping of thehuman visual cortex in a single subject using fNIRS by present-ing reversing, black-and-white grids to healthy adults. Thepresent study, therefore, aims to confirm the reliability offNIRS for retinotopic mapping as well as investigate specificvertical and horizontal functional asymmetrieswithin the visu-al cortex. Black and white wedge checkerboard stimuli were
ymmetries of the human visual cortex revealed by functionalres.2011.11.008

Fig. 3 – Stimuli and fNIRS fibers montage. (A) Black and white wedge reversed-checkerboard stimuli presented to one of the fourvisual field quadrants. I: Upper left (UL). II: Upper right (UR). III: Lower left (LL). IV: Lower right (LR). (B) Localization of optical sources(in red, both the 690 and830 nmoptical stimulation fibers areheld in the sameposition) anddetectors (in green) over the visual cortexof one participant.
4 B R A I N R E S E A R C H X X ( 2 0 1 1 ) X X X – X X X
presented individually to the four VF quadrants of healthyadults in order to quantify and compare the localization andthe amplitude of hemodynamic responses to each stimulatedVF quadrant.
2. Results
Strong and systematic cerebral activations were measured inthe visual cortex in response to stimulation presented in eachof the four visual field quadrants. As seen on Fig. 1A, cerebralactivations in a single subjectwere characterized by an increaseof HbO and HbT and a decrease of HbR concentrations startingwith stimulus onset, peaking around 12 s after stimulus onset,with a relatively constant activation until 35 s, and a return tobaseline at 40 s, which is 10 s after stimulus offset. An increaseof HbO could be associated to each block of stimulation in allchannels (Fig. 1B). As expected, cerebral activations wereconsistently stronger in the contralateral hemisphere inverselyto the upper/lower visual field stimulated. This reflects theretinotopic organization of the visual cortex (Figs. 1C and 2).Thus, our fNIRS data show an upper left visual cortex activationin response to a lower rightVF stimulation, anupper right visualcortex activation in response to a lower left VF stimulation, alower left visual cortex activation in response to an upperright VF stimulation, and a lower right visual cortex activationin response to an upper left VF stimulation. Individual datashowed that all participants, including the left-handed subject,had similar cerebral activations in response to each of the fourvisual stimulations.
Statistical analyses confirm results seen on topographicalmaps and reveal significant differences in visual cortex activa-tions depending on the VF stimulated. The rANOVA 2×2×2showed main effects of Hemispheres (F(1,7)=63; p<0.0001), andVertical Asymmetry (F(1,7)=8199; p=0.024). There was a higherHbO concentration in the hemisphere contralateral to the
Please cite this article as: Bastien, D., et al., Specific functional asnear-infrared spectroscopy, Brain Res. (2011), doi:10.1016/j.brain
stimulation in each condition compared to thehemisphere ipsi-lateral to the stimulation (Hemisphere effect). Moreover, stimu-lation of the lower VF induced stronger activation thanstimulation of the upper VF (Vertical Asymmetry effect). NoHorizontal Asymmetry effect was found (F(1,7)=0853; p=0.387).The triple interaction Hemisphere×Vertical Asymmetry×Hori-zontal Asymmetry was also significant (F(1,7)=8622; p=0.022).The rANOVA 2×2 including contralateral data only showed amain effect of Vertical Asymmetry (F(1,7)=7310; p=0.030) andan interaction Horizontal Asymmetry×Vertical Asymmetry(F(1,7)=8760; p=0.021). Paired t-tests showed a strong VerticalAsymmetry in response to a right visual field stimulation(t(1,7)=7919; p<0.0001) and an Horizontal Asymmetry (t(1,7)=3143; p<0.02) in response to a lower visual field stimulation.No Vertical asymmetry in response to a left visual field stimula-tion (p>0.05), or Horizontal Asymmetry (p>0.05) in response toa lower visual field stimulation was found. These results reflecta stronger upper cerebral activation in response to a lower visu-al field stimulation compared to the lower cerebral activation inresponse to an upper visual field stimulation, especially if thestimulation was presented in the right visual field (left visualcortex activation) compared to the left visual field (right visualcortex activation). No factor or interaction was significant forthe rANOVA 2×2 carried out on ipsilateral data. This result isclearly seen in Fig. 2, where activation of the lower right quad-rant of the VF (Fig. 2, line 1) appears stronger than the activationof the lower left quadrant of the VF (Fig. 2, line 2).
3. Discussion
The present study corroborates results reported by Zeff et al.(2007), showing that fNIRS is a powerful imaging techniquethat allows retinotopic mapping of the human visual cortex ina single subject. We used individual MRI and a stereotaxicsystem in order to ensure a precise alignment of the optical
ymmetries of the human visual cortex revealed by functionalres.2011.11.008

5B R A I N R E S E A R C H X X ( 2 0 1 1 ) X X X – X X X
fibers over the visual cortex and a robust co-registration be-tween anatomical and functional data. The present work con-firms that fNIRS is a reliable and practical tool for functionalmapping, such as retinotopic mapping in individual subjects.Its spatial resolution and signal-to-noise ratio also allow mea-suring functional retinotopic asymmetries in the visual cortex.
fNIRS has several advantages over other imaging methods.First, fNIRS offers better temporal resolution than fMRI, so thatsubtle hemodynamic phenomena can be measured. MoreoverfNIRS allows the quantification of independent concentrationchanges in oxygenated hemoglobin (HbO), deoxygenatedhemoglobin (HbR), and total hemoglobin (HbT) (Gratton et al.,2003; Obrig and Villringer, 1997), compared to fMRI bloodoxygen-level dependent (BOLD) signal, which is mainly basedon HbR concentration variations (Kleinschmidt et al., 1996;Mehagnoul-Schipper et al., 2002; Norris, 2006; Obata et al.,2004). The possibility of measuring independently the concen-trations of HbO and HbR provides a more complete picture ofbrain function (Villringer and Chance, 1997). Another advan-tages of fNIRS is that the equipment is portable (Hintz et al.,2001; Liebert et al., 2005), and is much less costly than fMRI,MEG or PET. Finally, there are no major restrictions on move-ments during recording, which renders the technique suitablefor studies in various populations (Gallagher et al., 2007;Wilcox et al., 2005).
The main disadvantage of fNIRS is the shallow photon pen-etration (only a few centimeters), especially in individualswith a dense skull or thick, dark hair. This impedes reliabledata recording of subcortical structure. However, the limitedpenetration depth does not have a major impact on studiesinvestigating cortical areas, such as the visual cortex. In thepresent study, this difficulty applied to only one of the nineparticipants who had dense and dark hair.
The second objective of the current study was to investigatefor specific vertical and horizontal functional asymmetrieswithin the human visual cortex. Our results show higher HbOconcentration in the contralateral hemisphere to the stimula-tion in each condition compared to the ipsilateral hemisphere.Interestingly, we also obtain significant vertical asymmetriesof the visual cortex using fNIRS, replicating previous studiesusing well-established neuroimaging techniques, such as fMRIand MEG (e.g. Portin et al., 1999). In previous studies, twicestronger (Portin et al., 1999) and earlier (Lehmann andSkrandies, 1979; Skrandies, 1987) cerebral activations werefound in response to stimuli presented within the lower VFthan for stimuli presentedwithin the upper VF, showing the ad-vantage of the lower visual field on the upper VF. The presentstudy is the first work to show functional asymmetries in thevisual cortex using fNIRS. Moreover, this vertical asymmetry isstronger when the stimulation is presented in the right visualfield (left visual cortex activation) compared to the left visualfield (right visual cortex activation). Only few studies reportedhorizontal asymmetries in the visual cortex (Hasnain et al.,2006; Toronov et al., 2007) and someauthors refer to the cerebrallateralization theory (Geschwind and Galaburda, 1985) as a pos-sible explanation. This theory proposes that the developmentalforces leading to interhemispheric asymmetry arise from a dif-ferential growth andmaturation rate of functional areas due toa combination of genetic, hormonal, and environmental influ-ences. This would lead to a functional advantage for one
Please cite this article as: Bastien, D., et al., Specific functional asnear-infrared spectroscopy, Brain Res. (2011), doi:10.1016/j.brain
hemisphere over the other for specific tasks, such as languageand visual activities. Based on the cerebral lateralization theory,Hasnain et al. (2006) hypothesized that the left calcarine fissureconstitutes a developmental anchor for functional visual areas,which could lead to a functional advantage of the left over theright primary visual cortex. In the present study, the horizontalasymmetry supports the advantage of the left over the right ce-rebral visual cortex. From our point of view, functional asym-metries within the visual cortex found in the current studyconstitutes the most interesting finding. In a further study, itwould be of great interest to investigate possible correlationsbetween language and visual hemispheric dominance usingfNIRS language mapping and visual mapping of the sameparticipant.
In conclusion, fNIRS is a reliable neuro-imaging tool thatcould further be used to explore the visual cortex of individualspresenting different degrees of blindness or study visual cortexreorganization induced by various visual system pathologies.This flexible imaging technique could also be used in variousyoung pathologically affected populations for whom otherimaging techniques are inaccessible either because of theiryoung age or the presence of important intellectual limitations,in order to generate individual functional map surrounding acerebral lesion or investigate development of different brainfunctions prior to a treatment such as a neurosurgery. fNIRSconstitutes, therefore, a powerful and practical neuro-imagingtool for functional brain mapping.
4. Experimental procedure
4.1. Subjects
Eight right-handed and one left-handed healthy participants(5 females, age 20 to 49) with normal or corrected-to-normalvision were recruited. One male subject was excluded due tohigh noise, probably due to dark and dense hair, for a totalsample size of 8 participants.
The present study was approved by the Ethics Committee ofthe CHU Sainte-Justine, and informed written consent wasobtained from all participants after the nature of the experi-ment had been fully explained. This study has been performedin accordance with the ethical standards laid down in the 1964Declaration of Helsinki.
4.2. Stimuli and procedure
Visual cortex activationwas generated using visual stimuli pre-sented in the four quadrants of the visual field: upper left (UL),upper right (UR), lower left (LL), and lower right (LR). These stim-uli consist of a high contrast black and white wedge checker-board (length: 10°; maximal width: 8°) presented binoculary ata reversal rate of 1 Hz (Fig. 3A). These stimuli are known togreatly activate the visual cortex and have been used in numer-ous fMRI studies to map the human visual cortex (1998; DeYoeet al., 1996; Engel et al., 1997; Sereno et al., 1995; Slotnick andYantis, 2003; Tootell et al., 1997;Wohlschläger et al., 2005). Stim-uli had a luminance of 40 cd/m2 and were generated by a DellGX 150 PC using MatLab 6.5 software (Matworks, Natick, MA,USA) and a Tucker-Davis System (RP2.1; Real-time Processor).
ymmetries of the human visual cortex revealed by functionalres.2011.11.008

6 B R A I N R E S E A R C H X X ( 2 0 1 1 ) X X X – X X X
Forty blocks, comprised of ten blocks for each of the four condi-tions (UL, UR, LL, and LR), were presented randomly to thesubjects who were comfortably seated in a height-adjustablechair at a distance of 75 cm from a screen. Each block consistedof a 15-second baseline, followed by a 30-second reversing-checkerboard stimulus located in one of the four positions andending by a 15-second period of rest. Participantswere instructedto fix a cross located in the center of the screen throughout theduration of the block (60 s), and to remain as still as possible.Resting periods were allowed as needed between blocks, andmovements of the head and body were allowed during theseperiods.
4.3. Optical imaging acquisition
The fNIRS recordings were performed using a frequency-domain time-resolved multichannel Imagent Tissue Oxymeter(ISS Inc., Champaign, IL, USA). Light sources were laser diodes(~1 mW) modulated at a frequency of 110 MHz, and connectedto the head by 0.4 mm fibers. Detectors were photomultipliertubes connected to the head by 3mm fiber bundles. Opticalintensity (DC), modulation amplitude (AC), and phase datawere sampled at 39.0625 Hz and acquired in a block designparadigm.
During the experiment, the participants wore a specially-designed rigid and lightweight helmet holding 16 sources(eight 690 nm sources and eight 830 nm sources, both placedwithin the sameholder), aswell as 8 detectors (Fig. 3B). All fiberswere vertically placed on the scalp of the participant and did notrestrict headmovements. MRI images of each participant previ-ously acquired were used to ensure that the optical fibers werelocalized over the visual cortex. To this end, V1 was definedon individual MRI as the region of interest (ROI). Then, a stereo-taxic system (Brainsight Frameless 39, Rogue Research, Cana-da), which allowed the transfer of the ROI onto the helmet,was used. Source-detector distances were held constantbetween 2.5 and 5 cm. For a precise coregistration of fNIRS andMRI data, locations of four fiducial points (left and right preori-cular points, nasion and nose tip) and all optical fibers weredigitized and recorded.
4.4. fNIRS data analysis
The HomER package from PhotonMigration Imaging laboratory(PMI Lab,Martinos Center for Biomedical Imaging, Charlestown,MA; see Huppert et al., 2009) was used for fNIRS data analyses.Data were normalized by dividing each value by the meanvalue across time points for each block and channel. A lowpass filter of 0.1 Hz and a high pass filter of 0.001 Hz were ap-plied to DC data to reduce physiological noise and long-termdrift. Hemodynamic concentrations were estimated using themodified Beer Lambert Law based on changes of optical densityand absorption coefficient (Hiraoka et al., 1993). A differentialpath length factor correction was applied as a function of theage of each participant (for more details, see Duncan et al.,1996). Each detector could capture the response generatedfrom the eight sources at each of the two wavelengths.Channels with a normalized DC amplitude standard deviationexceeding 20% were discarded. The 10 channels showing themaximal HbO amplitude, located in each contralateral and
Please cite this article as: Bastien, D., et al., Specific functional asnear-infrared spectroscopy, Brain Res. (2011), doi:10.1016/j.brain
ipsilateral hemisphere to the VF stimulated, were averagedfrom 5 to 25 s during stimulation for each subject and each con-dition of stimulation. Topographical mappings were createdwith PMI toolbox that use a slab medium geometry and a regu-lar back projection method for reconstruction on a 2D23×23 pixels image covering the occipital cortex. A min–maxnormalization was done on each subject's image to eliminatehemodynamic concentration variations induced by individualphysical differences, such as the density and darkness of thehair.
The statistical package SPSS (version 17.0) was used tocompute a 2×2×2 analysis of variance for repeated measures(rANOVA) with Hemispheres (contralateral versus ipsilateralto the visual field stimulated), Vertical Asymmetry (upper ver-sus lower visual fields), and Horizontal Asymmetry (left ver-sus right visual fields) as factors. Since stronger activationsin controlateral hemisphere compared to the ipsilateral hemi-sphere are highly expected based on literature and numerousprevious studies, a 2×2 rANOVA with Vertical Asymmetry(upper versus lower visual fields), and Horizontal Asymmetry(left versus right visual fields) as factors and including exclu-sively controlateral data was also perform. The rANOVAswere computed using the highest activation point on HbO to-pographical map of each contralateral and ipsilateral hemi-sphere to the VF stimulated. HbO values were used becauseprevious studies showed a higher signal-to-noise ratio forHbO than HbR (Meek et al., 1995; Siegel et al., 2003). T-testswere performed as post-hoc analyses.
Acknowledgments
We are grateful to Dave Saint-Amour for providing advice andinformation regarding statistical analysis and for fruitfuldiscussions related to data interpretation. We also wish tothank the engineering and orthotic prosthesis team of Sainte-JustineHospital for their technical support related to the opticalimaging helmet.
This work was supported by the Canada Research Chair inCognitive Neurosciences held by Franco Lepore, Ph.D., theCanada Research Chair in Developmental Neuropsychologyheld by Maryse Lassonde, Ph.D. as well as scholarships by theCanadian Institutes of Health Research (CIHR) awarded toAnne Gallagher, Ph.D.
R E F E R E N C E S
Aine, C.J., Supek, S., George, J.S., Ranken, D., Lewine, J., Sanders, J.,Best, E., Tiee, W., Flynn, E.R., Wood, C.C., 1996. Retinotopicorganization of human visual cortex: departures from theclassical model. Cereb. Cortex 6, 354–361.
Blasdel, G., Campbell, D., 2001. Functional retinotopy of monkeyvisual cortex. J. Neurosci. 21 (20), 8266–8301.
Colier, W.N.J.M., Quaresima, V., Wenzel, R., van der Sluijs, M.C.,Oeseburg, B., Ferrari, M., Villringer, A., 2001. Simultaneousnear-infrared spectroscopymonitoring of left and right occipitalareas reveals contra-lateral hemodynamic changes uponhemi-field paradigm. Vision Res. 41, 97–102.
Connolly, M., Van Essen, D., 1984. The representation of the visualfield in parvocellular and magnocellular layers of the lateral
ymmetries of the human visual cortex revealed by functionalres.2011.11.008
7B R A I N R E S E A R C H X X ( 2 0 1 1 ) X X X – X X X
geniculate nucleus in the macaque monkey. J. Comp. Neurol.266, 544–564.
DeYoe, E.A., Carman, G.J., Bandettini, P., Glickman, S., Wieser, J.,Cox, R., Miller, D., Neitz, J., 1996. Mapping striate andextrastriate visual areas in human cerebral cortex. Proc. Natl.Acad. Sci. U.S.A. 93, 2382–2386.
Duncan, A., Meek, J.H., Clemence, M., Elwell, C.E., Fallon, P.,Tyszczuk, L., Cope, M., Delpy, D.T., 1996. Measurement of cranialoptical path length as a function of age using phase resolvednear infrared spectroscopy. Pediatr. Res. 39 (5), 889–894.
Engel, S.A., Glover, G.H., Wandell, B.A., 1997. Retinotopicorganization in human visual cortex and the spatial precisionof functional MRI. Cereb. Cortex 7, 181–192.
Gallagher, A., Thériault, M., Maclin, E., Low, K., Gratton, G., Fabiani,M., Gagnon, L., Vallois, K., Rouleau, I., Sauerwein, H.C., Carmant,L., Nguyen, D.K., Lortie, A., Lepore, F., Béland, R., Lassonde, M.,2007. Language mapping using near-infrared spectroscopy(NIRS) in young epileptic patients. Epileptic Disord. 9, 241–255.
Geschwind, N., Galaburda, A.M., 1985. Cerebral lateralization:biological mechanisms, associations, and pathology. I. Ahypothesis and a program for research. Arch. Neurol. 42,428–459.
Gratton, G., Corballis, P.M., 1995. Removing the heart from thebrain: compensation for the pulse artefact in the photonmigration signal. Psychophysiology 32, 292–299.
Gratton, G., Fabiani, M., Elbert, T., Rockstroh, B., 2003. Seeing rightthrough you: applications of optical imaging to the study of thehuman brain. Psychophysiology 40, 487–491.
Grill-Spector, K., Malach, R., 2004. The human visual cortex. Annu.Rev. Neurosci. 27, 649–677.
Hasnain, M.K., Fox, P.T., Woldorff, M.G., 2006. Hemisphericasymmetry of sulcus-function correspondence: quantizationand developmental implications. Hum. Brain Mapp. 27, 277–287.
Hintz, S.R., Benaron, D.A., Siegel, A.M., Zourabian, A., Stevenson,D.K., Boas, D.A., 2001. Bedside functional imaging of thepremature infant brain during passive motor activation.J. Prenat. Med. 29, 335–343.
Hiraoka, M., Firbank, M., Essenpreis, M., Cope, M., Arridge, S.R., vander Zee, P., Delpy, D.T., 1993. A Monte Carlo investigation ofoptical pathlenght in inhomogeneous tissue and its applicationto near-infrared spectroscopy. Phys. Med. Biol. 38, 1859–1876.
Huppert, T.J., Diamond, S.G., Fransceschini, M.A., Boas, D.A., 2009.HomER: a review of time-series analysis methods for near-infrared spectroscopy of the brain. Appl. Opt. 48 (10), D280–D298.
Intriligator, J., Cavanagh, P., 2001. The spatial resolution of visualattention. Cogn. Psychol. 43, 171–216.
Kleinschmidt, A., Obrig, H., Requardt, M., Merboldt, K.D., Dirnagl,U., Villringer, A., Frahm, J., 1996. Simultaneous recording ofcerebral blood oxygenation changes during human brainactivation by magnetic resonance imaging and near-infraredspectroscopy. J. Cereb. Blood Flow Metab. 16, 817–826.
Lehmann, D., Skrandies, W., 1979. Multichannel evoked potentialfields show different properties of human upper and lowerhemi-retina systems. Exp. Brain Res. 35, 151–159.
Liebert, A., Wabnitz, H., Steinbrink, J., Moller, M., MacDonald, R.,Rinneberg, H., et al., 2005. Bed-side assessment of cerebralperfusion in stroke patients based on opticalmonitoring of a dyebolus by time-resolved diffuse reflectance. Neuroimage 24,426–435.
Meek, J.H., Elwell, C.E., Khan, M.J., Romaya, J., Wyatt, J.S., Delpy,D.T., Zeki, S., 1995. Regional changes in cerebralhaemodynamics as a result of a visual stimulus measured bynear infrared spectroscopy. Proc. Biol. Sci. 261 (1362), 351–356.
Mehagnoul-Schipper, D.J., van der Kallen, B.F.W., Colier, W.N.J.M.,van der Sluijs, M.C., van Erning, L.J., Th, O., Thijssen, H.O.M.,Oeseburg, B., Hoefnagels, W.H.L., Jansen, R.W.M.M., 2002.Simultaneous measurements of cerebral oxygenation changesduring brain activation by near-infrared spectroscopy and
Please cite this article as: Bastien, D., et al., Specific functional asnear-infrared spectroscopy, Brain Res. (2011), doi:10.1016/j.brain
functional magnetic resonance imaging in healthy young andelderly subjects. Hum. Brain Mapp. 16 (14), 14–23.
Norris, D.G., 2006. Principles of magnetic resonance assessment ofbrain function. J. Magn. Reson. Imaging 23, 794–807.
Obata, T., Liu, T.T., Miller, K.L., Luh, W.M., Wong, E.C., Frank, L.R.,Buxton, R.B., 2004. Discrepancies between BOLD and flowdynamics in primary and supplementary motor areas:application of the balloon model to the interpretation of BOLDtransients. Neuroimage 21, 144–153.
Obrig, H., Villringer, A., 1997. Near-infrared spectroscopy infunctional activation studies. Can NIRS demonstrate corticalactivation? Adv. Exp. Med. Biol. 413, 113–127.
Portin, K., Vanni, S., Virsu, V., Hari, R., 1999. Stronger occipitalcortical activation to lower than upper visual field stimuli. Exp.Brain Res. 124, 287–294.
Sereno, M.I., Dale, A.M., Reppas, J.B., Kwong, K.K., Belliveau, J.W.,Brady, T.J., Rosen, B.R., Tootell, R.B.H., 1995. Borders of multiplevisual areas in humans revealed by functional magneticresonance imaging. Science 268, 889–893.
Siegel, A.M., Culver, J.P., Mandeville, J.B., Boas, D.A., 2003.Temporal comparison of functional brain imaging with diffuseoptical tomography and fMRI during rat forepaw stimulation.Phys. Med. Biol. 48, 1391–1403.
Skrandies, W., 1987. The upper and lower visual field of man:electrophysiological and functional differences. In: Ottoson, D.(Ed.), Progress in Sensory Physiology. Springer, BerlinHeidelberg New York, pp. 1–93.
Slotnick, S.D., Yantis, S., 2003. Efficient acquisition of humanretinotopic maps. Hum. Brain Mapp. 18, 22–29.
Taga, G., Asakawa, K., Maki, A., Konishi, Y., Koizumi, H., 2003. Brainimaging in awake infants by near-infrared optical topography.Proc. Natl. Acad. Sci. U.S.A. 100, 10722–10727.
Talgar, C.P., Carrasco, M., 2002. Vertical meridian asymmetry inspatial resolution: visual and attentional factors. Psychon.Bull. Rev. 9, 714–722.
Tootell, R.B.H., Switkes, E., Silverman, M.S., Hamilton, S.L., 1988.Functional anatomy of macaque striate cortex. II. Retinotopicorganization. J. Neurosci. 8 (5), 1531–1568.
Tootell, R.B.H., Mendola, J.D., Hadjikhani, N.K., Ledden, P.J., Liu,A.K., Reppas, J.B., Sereno, M.I., Dale, A.M., 1997. Functionalanalysis of V3A and related areas in human visual cortex.J. Neurosci. 17 (18), 7060–7078.
Tootell, R.B.H., Hadjikhani, N.K., Vanduffel, W., Liu, A.K., Mendola,J.D., Sereno, M.I., Dale, A.M., 1998. Functional analysis ofprimary visual cortex (V1) in humans. Proc. Natl. Acad. Sci.U.S.A. 95, 811–817.
Toronov, V.Y., Zhang, X., Webb, A.G., 2007. A spatial and temporalcomparison of hemodynamic signals measured using opticaland functionalmagnetic resonance imaging during activation inthe human primary visual cortex. Neuroimage 34, 1136–1148.
Villringer, A., Chance, B., 1997. Non-invasive optical spectroscopyand imaging of human brain function. Trends Neurosci. 20,435–442.
White, B.R., Culver, J.P., 2010. Phase-encoded retinotopy as anevaluation of diffuse optical neuroimaging. Neuroimage 49 (1),568–577.
Wilcox, T., Bortfeld, H., Woods, R., Wruck, E., Boas, D.A., 2005.Using near-infrared spectroscopy to assess neural activationduring object processing in infants. J. Biomed. Opt. 10, 11010.
Wohlschläger, A.M., Specht, K., Lie, C., Mohlberg, H., Wohlschläger,A., Bente, K., Pietrzyk, U., Stöcker, T., Zilles, K., Amunts, K., Fink,G.R., 2005. Linking retinotopic fMRI mapping and anatomicalprobability maps of human occipital areas V1 and V2.Neuroimage 26, 73–82.
Zeff, B.W., White, B.R., Dehghani, H., Schlaggar, B.L., Culver, J.P.,2007. Retinotopic mapping of adult human visual cortex withhigh-density diffuse optical tomography. Proc. Natl. Acad. Sci.U.S.A. 104 (29), 12169–12174.
ymmetries of the human visual cortex revealed by functionalres.2011.11.008