Human Interactions with Free-Ranging and Captive Bottlenose Dolphins

Chapter
NEUROCRANIUM ASYMMETRIES IN THE
BOTTLENOSE DOLPHIN, TURSIOPS
TRUNCATUS (MONTAGU, 1821)
P. M. Parés-Casanova1,
and R. Bravi2,†
1Departmrnt of Animal Production, University
of Lleida, Lleida, Catalunya, Spain 2Department of Science; University
of Roma Tre, Rome, Italy
ABSTRACT
External evolutionary novelties of odontocete skulls (toothed whales,
including dolphins and porpoises) include a “telescoped” morphology,
which involves the posterior repositioning of anterior cranial bones and
postero-dorsal positioning of the nares to form the “blowhole”. Internal
cetacean skull architecture is also asymmetrical and shows the effects of
telescoping, too. The Bottlenose dolphin (Tursiops truncatus) is one of
this odontocete species. In this study we focused the attention on the skull
of Tursiops truncatus and assessed both size and shape asymmetry by
geometric morphometric method. Due to the difficulties related to data
collection and records in the field, the museum collections represented
P. M. Parés-Casanova: Department of Animal Production, University of Lleida, Av. Alcalde
Rovira Roure, 191, 25198 Lleida, Catalunya, Spain. E-mail: [email protected]. †
R. Bravi. Department of Science; University of Roma Tre, Viale Marconi, 446, 00146 Rome, Italy. E-mail: [email protected].
P. M. Parés-Casanova and R. Bravi 2
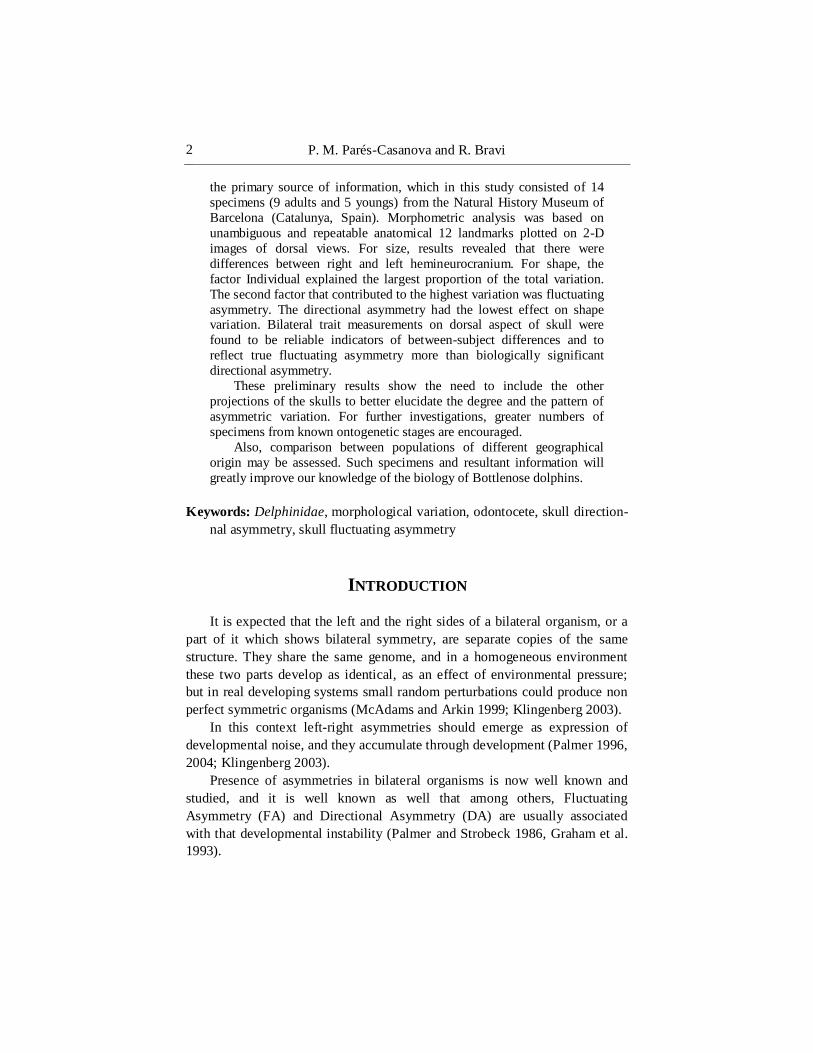
the primary source of information, which in this study consisted of 14
specimens (9 adults and 5 youngs) from the Natural History Museum of
Barcelona (Catalunya, Spain). Morphometric analysis was based on
unambiguous and repeatable anatomical 12 landmarks plotted on 2-D
images of dorsal views. For size, results revealed that there were
differences between right and left hemineurocranium. For shape, the
factor Individual explained the largest proportion of the total variation.
The second factor that contributed to the highest variation was fluctuating
asymmetry. The directional asymmetry had the lowest effect on shape variation. Bilateral trait measurements on dorsal aspect of skull were
found to be reliable indicators of between-subject differences and to
reflect true fluctuating asymmetry more than biologically significant
directional asymmetry.
These preliminary results show the need to include the other
projections of the skulls to better elucidate the degree and the pattern of
asymmetric variation. For further investigations, greater numbers of
specimens from known ontogenetic stages are encouraged.
Also, comparison between populations of different geographical
origin may be assessed. Such specimens and resultant information will
greatly improve our knowledge of the biology of Bottlenose dolphins.
Keywords: Delphinidae, morphological variation, odontocete, skull direction-
nal asymmetry, skull fluctuating asymmetry
INTRODUCTION
It is expected that the left and the right sides of a bilateral organism, or a
part of it which shows bilateral symmetry, are separate copies of the same
structure. They share the same genome, and in a homogeneous environment
these two parts develop as identical, as an effect of environmental pressure;
but in real developing systems small random perturbations could produce non
perfect symmetric organisms (McAdams and Arkin 1999; Klingenberg 2003).
In this context left-right asymmetries should emerge as expression of
developmental noise, and they accumulate through development (Palmer 1996,
2004; Klingenberg 2003).
Presence of asymmetries in bilateral organisms is now well known and
studied, and it is well known as well that among others, Fluctuating
Asymmetry (FA) and Directional Asymmetry (DA) are usually associated
with that developmental instability (Palmer and Strobeck 1986, Graham et al.
1993).
Neurocranium Asymmetries in the Bottlenose Dolphin … 3
FA is referred to non-directional deviation from perfect symmetry, and it
is expressed as individual differences between left and right sides. DA
outcomes every time there is a greater development of one side on the plane of
symmetry than the other; it is hypothesized that a proportion of DA has
genetic bases (Van Valen 1962, Carter et al. 2009).
Skulls are routinely studied as part of investigations of mammalian
biology. Both qualitative and quantitative features are examined to discern the
presence and degree of sexual dimorphism, ontogenetic and individual
variation, as well as geographic or oceanographic variation within and among
populations (Perrin 1975). Such data contribute substantially towards the
answers of taxonomic, ecological and evolutionary questions. Because these
characters typically change during growth, an adult skull with relatively fixed
characteristics is preferred for non-developmental aspects of these examina-
tions (Perrin and Heyning 1993). Geometric morphometrics (GM) has been
used to distinguish between confusing cases of living species or subspecies of
Delphinidae (Monteiro-Filho et al. 2002; Paola 2010) and a previous study
assessing the presence of symmetries has been done in Bottle-nose (Parés and
Fabre 2013).
Odontocete skulls are drastically modified relative to the general mamma-
lian condition (Colbert et al. 2005). External evolutionary novelties of
odontocetes include a ‘telescoped’ morphology (Miller 1923), which involves
the posterior repositioning of anterior cranial bones and postero-dorsal
positioning of the nares to form the ‘blowhole’, and bilateral asymmetry. The
relationship between these cranial modifications and evolution of an aquatic
life history has been widely discussed (e.g. Moore 1981; Novacek 1993;
Fordyce and de Muizon 2001). Internal cetacean skull architecture is also
asymmetrical and shows the effects of telescoping. Additionally, internal
osteology reflects their large brain size and provides evidence of evolutionary
transformations in relative importance of the different peripheral sensory
inputs (Breathnach 1960; Morgane and Jacobs 1972; Morgane et al. 1980;
Ridgway 1990). The taxonomic Order Cetacea includes three suborders: the
Mysticeti, or baleen whales; the Odontoceti, or toothed whales; and the
Archaeoceti, the now extinct ancestral forms of some modern whales and
dolphins. Tursiops truncatus (Montagu, 1821), the Bottlenose dolphin, is a
toothed whale of the Family Delphinidae, which includes approximately 30
species of dolphins, pilot whales, killer whales and false killer whales. The
Bottlenose dolphin is the most common dolphin species held in marine parks
worldwide, and it has been bred successfully in captivity (Amundin 1986;
Yoshioka et al. 1986; Cornell et al. 1987).

P. M. Parés-Casanova and R. Bravi 4
The Bottlenose dolphin is around 2.5 m long and weighs between 200 and
300 kg. It has a worldwide distribution, ranging from the Mediterranean Sea to
the Atlantic and Pacific Oceans. This wide-ranging distribution, together with
high levels of polymorphism and clinal variation, has made the taxonomic
status of Tursiops difficult to resolve.
Moreover, skulls held in museum collections frequently lack accompa-
nying vital data of body size, reproductive status and other age-related infor-
mation.
In the present study skull asymmetries in T. truncatus are analysed with
the technique of geometric morphometrics with the aim to depict and quantify
asymmetries, and moreover to relate them with telescoping and echoimaging
capabilities.
MATERIALS AND METHODS
A total of 14 skulls (9 adults and 5 youngs) belonging to Tursiops
truncatus were examined. Skulls were deposited in the Natural History
Museum of Barcelona (Table 1). Sex was available only for one specimen. All
pieces showed no gross pathological appearance that might lead to errors in
measurement.
Image capture was performed with a Nikon® D70 digital camera (image
resolution of 2,240 x 1,488 pixels) equipped with a Nikon AF Nikkor® 28-200
mm telephoto lens and using a standard procedure to avoid the effects of
distortion. The focal axis of the camera was parallel to the horizontal plane of
reference and centred on the dorsal view of each skull.
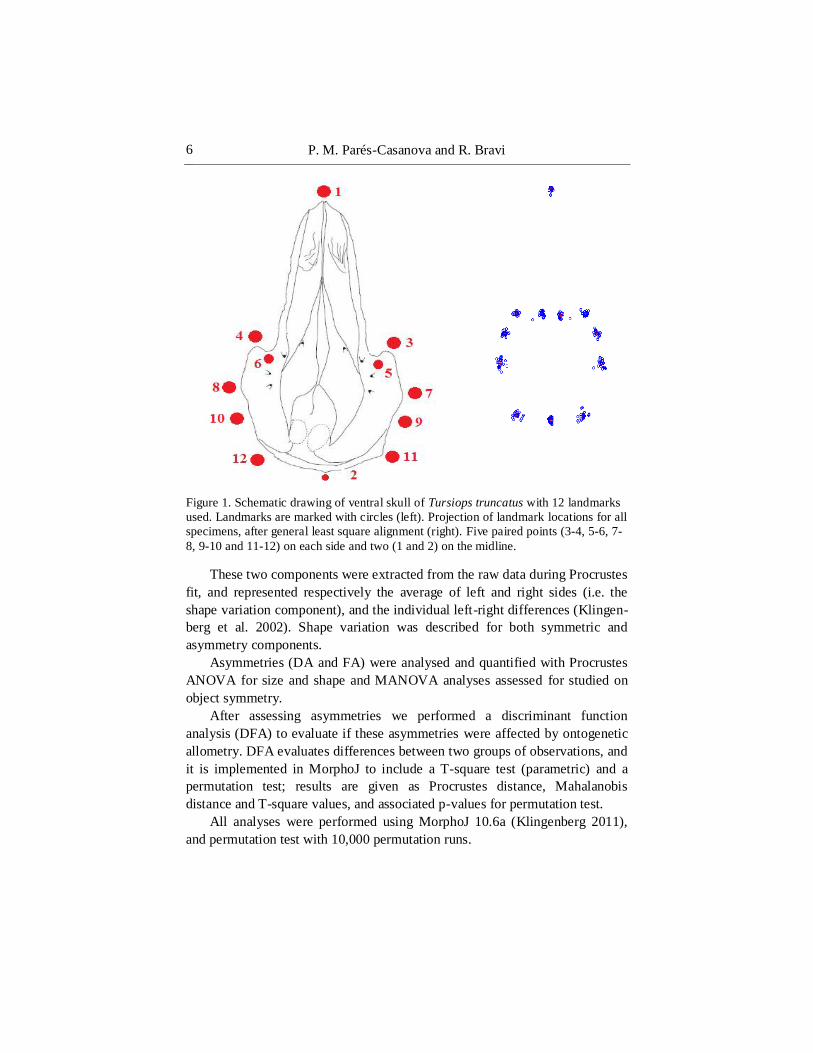
A ruler was used in this process (scale: 100 mm). 12 homologous and
topologically equivalent landmarks (LMs) were plotted on the dorsal skull (to
obtain the Cartesian x and y coordinates), including 5 paired points (3-4, 5-6,
7-8, 9-10 and 11-12) on each side and two on the midline (Figure 1).
All these LMs are considered to encompass elements of neurocranium.
Landmarks were digitized twice using tpsDig 2.16 (Rohlf 2010) by the same
person (PMPC) on two different days in the same order, for assessing
measurement error.
In order to compare Procrustes to tangent space distances between
individuals, a Generalized Procrustes Analysis superimposition (equivalent to
generalized least squares) procedure of Rohlf and Slice (1990) was performed
on each data set using TPS-Small 1.20 (Rohlf 2003). The approximation of
shape space by tangent space presented a high correlation (0.999).

Neurocranium Asymmetries in the Bottlenose Dolphin … 5
Table 1. References of studied specimens (n=14)
Code Element Sex Age Site
MZB 82-7967 Skull Unknown Adult Unknown
MZB 82-7968 Skull Unknown Adult Alacant (Spain)
MZB 82-7969 Disarticulated
skeleton Unknown Adult Unknown
MZB 82-7982 Skull Male Adult Oropesa (Spain)
MZB 82-8007 Skull Unknown Young Unknown
MZB 82-8011 Skull Unknown Young Tarragona (Spain)
MZB 82-8016 Skull Unknown Adult Unknown
MZB 82-8019 Skull Unknown Young Unknown
MZA 91-0440 Skull Unknown Young Unknown
MBZ 93-0254 Skull Unknown Adult Unknown
MZB 93-0280 Skull Unknown Young Unknown
MZB 93-0311 Skull Unknown Adult Unknown
MZB 93-0334 Skull Unknown Adult Unknown
MZB 94-0416 Disarticulated
skeleton Unknown Adult Zoo
This high degree of approximation of shapes in the sample (=shape space)
by the reference shape (=tangent space) allowed an accurate capturing of the
nature and extent of shape deformations in subsequent statistical analyses.
So, once obtained the Cartesian x-y coordinates for all points, the shape
information was extracted from the coordinate data by using a full Procrustes
fit, which removes information on location orientation and rotation, and
standardizes each specimen to unit centroid size (CS -that is, the square root of
the summed squared Euclidean distances from each landmark to the specimen
centroid that provides an estimate of the size of the studied structure- Rohlf
and Slice 1990; Dryden and Mardia 1998). CS was used as a measure of size,
while shape information was extracted from Procrustes superimposition. Due
to the object symmetry in the dataset reflection is removed by including the
original and mirror image of all configurations in the analysis, and superimpo-
sing all of them simultaneously (Klingenberg et al. 2002).
Variation of shape in the whole dataset was analysed with principal
component analysis (PCA), based on the covariance matrix of symmetric and
asymmetric components of shape variation.
P. M. Parés-Casanova and R. Bravi 6
Figure 1. Schematic drawing of ventral skull of Tursiops truncatus with 12 landmarks
used. Landmarks are marked with circles (left). Projection of landmark locations for all
specimens, after general least square alignment (right). Five paired points (3-4, 5-6, 7-
8, 9-10 and 11-12) on each side and two (1 and 2) on the midline.
These two components were extracted from the raw data during Procrustes
fit, and represented respectively the average of left and right sides (i.e. the
shape variation component), and the individual left-right differences (Klingen-
berg et al. 2002). Shape variation was described for both symmetric and
asymmetry components.
Asymmetries (DA and FA) were analysed and quantified with Procrustes
ANOVA for size and shape and MANOVA analyses assessed for studied on
object symmetry.
After assessing asymmetries we performed a discriminant function
analysis (DFA) to evaluate if these asymmetries were affected by ontogenetic
allometry. DFA evaluates differences between two groups of observations, and
it is implemented in MorphoJ to include a T-square test (parametric) and a
permutation test; results are given as Procrustes distance, Mahalanobis
distance and T-square values, and associated p-values for permutation test.
All analyses were performed using MorphoJ 10.6a (Klingenberg 2011),
and permutation test with 10,000 permutation runs.
Neurocranium Asymmetries in the Bottlenose Dolphin … 7
RESULTS
Firstly the LM at the tip of the rostrum (L1) was removed because
introducing some noise in data interpretation, as we were interested mostly in
depicting asymmetries in the neurocranium, not in the entire skull.
After that we inferred measurement error with Procrustes ANOVA, and it
resulted reasonably lesser than individual variation and fluctuating asymmetry
(Table 2). Consequently it didn’t affect the estimation of asymmetries in the
data set, and we could proceed with subsequent analyses. The entire dataset
was then averaged by individual, to remove every possible (even subtle) noise
due to replica repetition.
Assessing asymmetries was the next step. The dataset resulted affected by
both DA and FA (see Table 3) that even subtle were both highly significative
(see Table 1 for details), and partially confirmed by MANOVA (DA for
asymmetric component didn’t result significative) (Table 3).
Shape variation was then assessed by a PCA, and because we were
interested in describing the asymmetries, we considered the asymmetric
component of variation, and left the symmetry component for describing the
whole shape variation only.
On the whole, for symmetric component of shape variation, the first two
PCs (88.0% of the total observed variation) were sufficient to describe the
majority of variation, but the higher contribute to shape variation was due to
first component only (59.0% of the total observed variation).
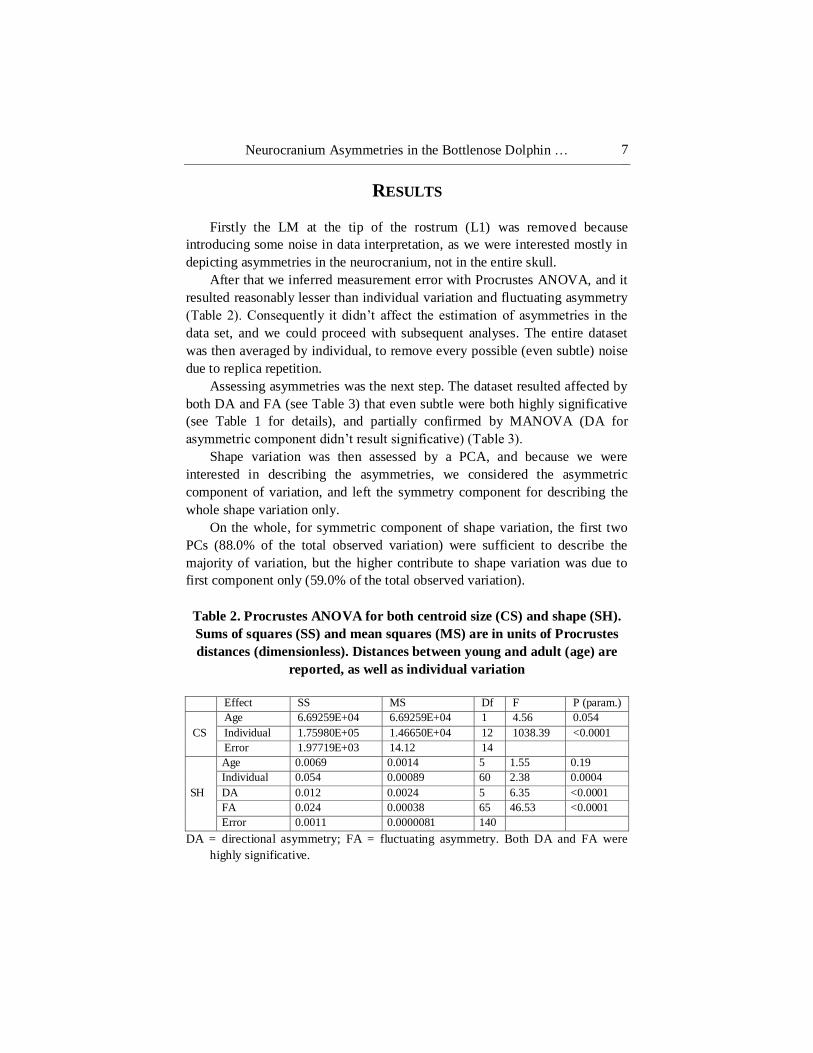
Table 2. Procrustes ANOVA for both centroid size (CS) and shape (SH).
Sums of squares (SS) and mean squares (MS) are in units of Procrustes
distances (dimensionless). Distances between young and adult (age) are
reported, as well as individual variation
Effect SS MS Df F P (param.)
CS
Age 6.69259E+04 6.69259E+04 1 4.56 0.054
Individual 1.75980E+05 1.46650E+04 12 1038.39 <0.0001
Error 1.97719E+03 14.12 14
SH
Age 0.0069 0.0014 5 1.55 0.19
Individual 0.054 0.00089 60 2.38 0.0004
DA 0.012 0.0024 5 6.35 <0.0001
FA 0.024 0.00038 65 46.53 <0.0001
Error 0.0011 0.0000081 140
DA = directional asymmetry; FA = fluctuating asymmetry. Both DA and FA were
highly significative.
P. M. Parés-Casanova and R. Bravi 8
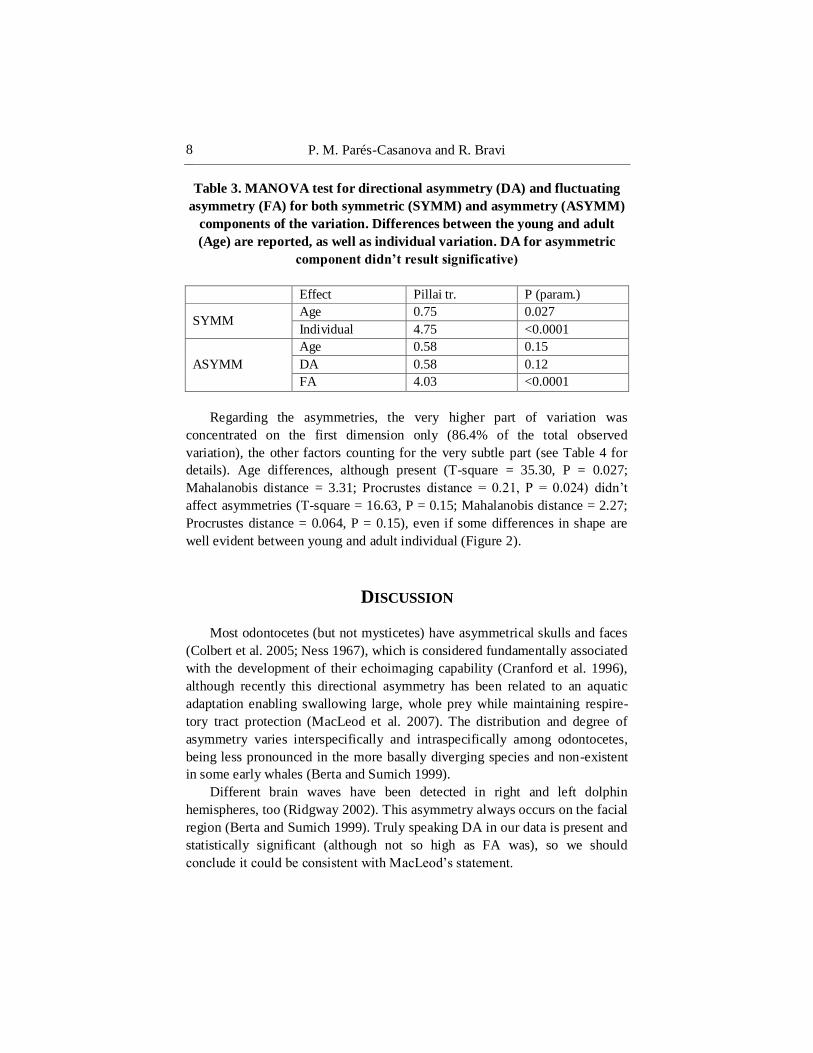
Table 3. MANOVA test for directional asymmetry (DA) and fluctuating
asymmetry (FA) for both symmetric (SYMM) and asymmetry (ASYMM)
components of the variation. Differences between the young and adult
(Age) are reported, as well as individual variation. DA for asymmetric
component didn’t result significative)
Effect Pillai tr. P (param.)
SYMM Age 0.75 0.027
Individual 4.75 <0.0001
ASYMM
Age 0.58 0.15
DA 0.58 0.12
FA 4.03 <0.0001
Regarding the asymmetries, the very higher part of variation was
concentrated on the first dimension only (86.4% of the total observed
variation), the other factors counting for the very subtle part (see Table 4 for
details). Age differences, although present (T-square = 35.30, P = 0.027;
Mahalanobis distance = 3.31; Procrustes distance = 0.21, P = 0.024) didn’t
affect asymmetries (T-square = 16.63, P = 0.15; Mahalanobis distance = 2.27;
Procrustes distance = 0.064, P = 0.15), even if some differences in shape are
well evident between young and adult individual (Figure 2).
DISCUSSION
Most odontocetes (but not mysticetes) have asymmetrical skulls and faces
(Colbert et al. 2005; Ness 1967), which is considered fundamentally associated
with the development of their echoimaging capability (Cranford et al. 1996),
although recently this directional asymmetry has been related to an aquatic
adaptation enabling swallowing large, whole prey while maintaining respire-
tory tract protection (MacLeod et al. 2007). The distribution and degree of
asymmetry varies interspecifically and intraspecifically among odontocetes,
being less pronounced in the more basally diverging species and non-existent
in some early whales (Berta and Sumich 1999).
Different brain waves have been detected in right and left dolphin
hemispheres, too (Ridgway 2002). This asymmetry always occurs on the facial
region (Berta and Sumich 1999). Truly speaking DA in our data is present and
statistically significant (although not so high as FA was), so we should
conclude it could be consistent with MacLeod’s statement.
Neurocranium Asymmetries in the Bottlenose Dolphin … 9
a
b
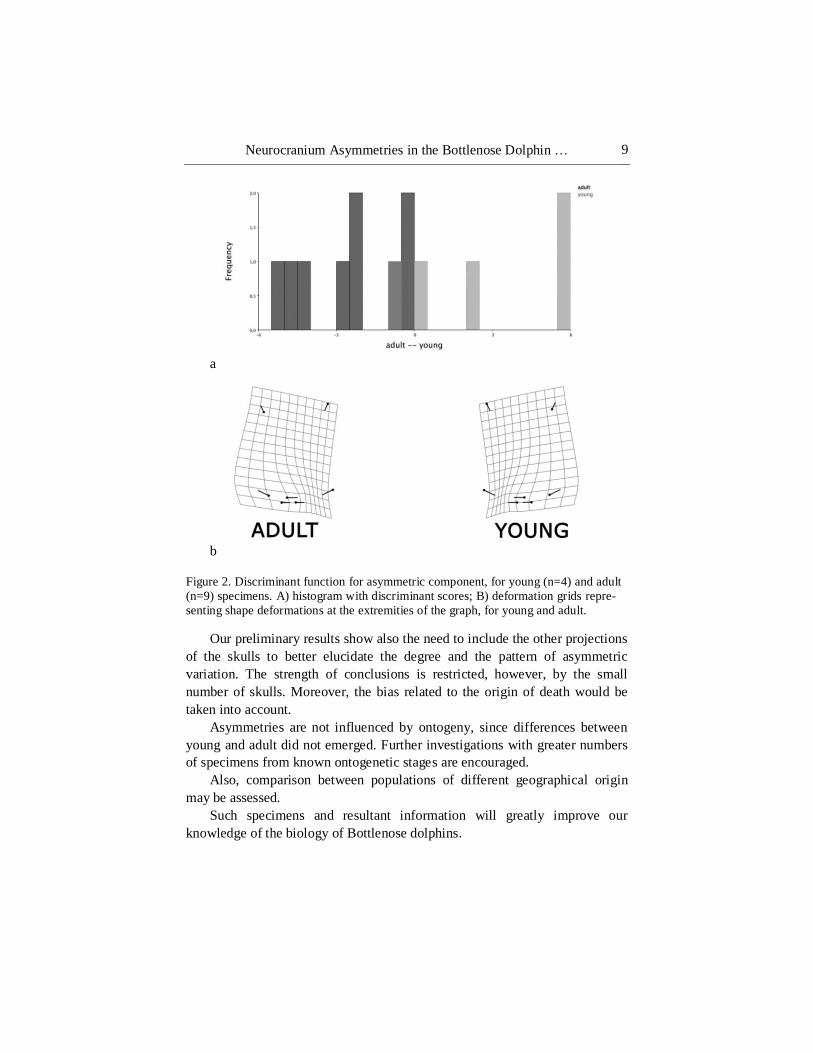
Figure 2. Discriminant function for asymmetric component, for young (n=4) and adult
(n=9) specimens. A) histogram with discriminant scores; B) deformation grids repre-
senting shape deformations at the extremities of the graph, for young and adult.
Our preliminary results show also the need to include the other projections
of the skulls to better elucidate the degree and the pattern of asymmetric
variation. The strength of conclusions is restricted, however, by the small
number of skulls. Moreover, the bias related to the origin of death would be
taken into account.
Asymmetries are not influenced by ontogeny, since differences between
young and adult did not emerged. Further investigations with greater numbers
of specimens from known ontogenetic stages are encouraged.
Also, comparison between populations of different geographical origin
may be assessed.
Such specimens and resultant information will greatly improve our
knowledge of the biology of Bottlenose dolphins.

P. M. Parés-Casanova and R. Bravi 10
ACKNOWLEDGMENTS
Thanks to Natural History Museum of Barcelona, especially its mammals
curator Dr Javier Quesada for loaning the specimens and the associated
information.
Letícia Fabre and Lluís Alonso helped to photograph the specimens.
REFERENCES
Amundin, M., 1986. Breeding the bottle-nose dolphin Tursiops truncatus at the
Kolmarden Dolphinarium. Int. Zoo Yb. 24/25: 263-271.
Berta, A., Sumich, J., 1999. Marine Mammals Evolutionary Biology. San
Diego, CA, US: Academic Press.
Breathnach, A. S., 1960. The cetacean central nervous system. Biol. Rev.
Camb. Philos. Soc. 35: 187-230.
Carter, A. J. R., Osborne, E., Houle, D., 2009. Heritability of directional asy-
mmetry in Drosophila melanogaster. Int. J. Evol. Biol. http://dx.doi.org/
10.4061/2009/759159. ID 759159.
Colbert, M. W., Racicot, R., Racicot, T., 2005. Anatomy of the cranial
endocast of the bottlenose dolphin, Tursiops truncatus, based on HRXCT.
J. Mamm. Evol. 12: 195-207.
Cornell, L. H., Asper, E. D., Antrim, J. E., Searles, S. S., Goff, W. G., 1987.
Progress report: results of a long-range captive breeding program for the
bottle-nose dolphin Tursiops truncates and Tursiops truncatus-gilli. Zoo
Biol. 6: 41-54.
Cranford, T. W., Amundin, M., Norris, K., 1996. Functional morphology and
homology in the odontocete nasal complex: implications for sound
generation. J. Morphol. 228: 223-285.
Fordyce, R. E., Muizon, C. de, 2001. Evolutionary history of cetaceans: a
review. In: Secondary Adaptations of Tetrapods to Life in Water. (J.-M.
Mazin and V. de Buffrenil, eds). München, Germany: Verlag Dr.
Friedrich Pfeil. pp. 16-233.
Graham, J. H., Freeman, D. C., Emlen, J. M., 1993. Antisymmetry, directional
asymmetry, and dynamic morphogenesis. Genetica 89, 121e187.
Klingenberg, C. P., 2003. A developmental perspective on developmental
instability: theory, models and mechanisms. In: Developmental instability:

Neurocranium Asymmetries in the Bottlenose Dolphin … 11
causes and consequences. Edited by: Polak M. New York. Oxford
University Press. pp 14-34.
Klingenberg, C. P., 2011. MORPHOJ: an integrated software package for
geometric morphometrics. Molecular Ecology Resources 11: 353-357.
Klingenberg, C. P., Barluenga, M., Meyer, A., 2002. Shape analysis of
symmetric structures: quantifying variation among individuals and
asymmetry. Evolution 56: 1909-1920.
Miller, G. S., 1923: The telescoping of the cetacean skull. Smithsonian Misc.
Coll. 76: 1-71.
MacLeod, C. D., Reidenberg, J. S., Weller, M., Santos, M. B. N., Herman, J.
Goold, J., Pierce, G. J. 2007. Breaking symmetry: the marine environ-
ment, prey size, and the evolution of asymmetry in cetacean skulls. Anat.
Rec. 290: 539-545.
Mc Adams, H. H., Arkin, A., 1999. It’s a noisy business! Genetic regulation at
the nanomolar scale. Trends in genetics. 15 (1): 65-69.
Monteiro-Filho, E. L. A., Monteiro, L. R., Reis, S. F., 2002. Skull shape and
size divergence in dolphins of the genus Sotalia: a tridimensional
morphometric analysis. J. Mamm. 83: 125-134.
Moore, W. J., 1981. The Mammalian Skull. Cambridge, UK: Cambridge
University Press.
Morgane, P. J., Jacobs, M. S., 1972. Comparative anatomy of the cetacean
nervous system. In: Functional Anatomy of Marine Mammals, vol. 1. (R.
J. Harrison, ed.). New York: Academic Press. pp. 117-244.
Morgane, P. J., Jacobs, M. S., McFarland, W. L., 1980. The anatomy of the
brain of the bottlenose dolphin (Tursiops truncatus). Surface configure-
tions of the telencephalon of the bottlenose dolphin with comparative
anatomical observations in four other cetacean species. Brain Res. Bull. 5:
1-108.
Ness, A. R., 1967. A measure of asymmetry of the skulls of odontocete
whales. J. Zool. 153: 209-221.
Novacek, M. J., 1993. Patterns of diversity on the mammalian skull. In: The
Skull, vol. 2. (J. Hanken and B. K. Hall, eds). Chicago, IL, US: University
of Chicago Press. pp. 438-545.
Palmer, R. A., 1996. Waltzing with asymmetry. Is fluctuating asymmetry a
powerful new tool for biologists or just an alluring new dance step? Bio-
Sci. 46 (7): 518-532.
Palmer, R. A., 2004. Symmetry breaking and evolution of development. Sci.
306 (5697): 828-833.
P. M. Parés-Casanova and R. Bravi 12
Palmer, A. R., Strobeck, C., 1986. Fluctuating asymmetry: measurement,
analysis, patterns. Annu. Rev. Ecol. Syst. 17, 391e421.
Paola, A. L., 2010. Landmark based morphometric variation in Common
dolphin (Delphinus delphis L., 1758). In: Tools for Identifying Bio-
diversity: Progress and Problems. (P. L. Nimis and R. Vignes Lebbe,
eds). Proceedings of the International Congress Paris. Museum national
d’Histoire naturelle. pp. 263-268.
Parés-Casanova, P. M., Fabre, L. 2013. Size and Shape Variability in the Skull
of the Bottlenose Dolphin, Tursiops truncatus (Montagu, 1821). Anat.
Histol. Embryol. 42 (5): 379-383.
Perrin, W. F., 1975. Variation of spotted and spinner porpoise (Genus
Stenella) in the eastern Pacific and Hawaii. Bull. Scripps Inst. Oceanogr.
21: 1-206.
Perrin, W. F., Heyning, J. E., 1993. Rostral fusion as a criterion of cranial
maturity in the common dolphin, Delphinus delphis. Mar. Mamm. Sci. 9:
195-197.
Ridgway, S. H., 1990. The central nervous system of the bottlenose dolphin.
In: The Bottlenose Dolphin. (S. Leatherwood and R. R. Reeves, eds). San
Diego, CA, US: Academic Press. pp. 69-97.
Ridgway, S. H., 2002. Asymmetry and symmetry in brain waves from dolphin
left and right hemispheres: Some observations after anesthesia, during
quiescent hanging behavior, and during visual obstruction. Brain Behav.
Evol. 60 (5 ): 265-274.
Rohlf, F. J., 2003. TPS Small, ver. 1.20. Department of Ecology and Evolu-
tion, State University of New York at Stony Brook, Stony Brook.
Rohlf, F. J., 2010. TpsDig Ver. 2.16. Digitalized Landmarks and Outlines.
Stony Book, Department of Ecology and Evolution, State University of
New York: Stony Book.
Rohlf, F. J., Slice, D., 1990. Extension of the Procrustes method for the
optimal superimposition of landmarks. Syst. Zool. 39: 40-59.
Van Valen, L., 1962. A study of fluctuating asymmetry. Evol. 16, 125e142.
Yoshioka, M., Mohri, E., Tobayama, T., Aida, K., Hanyu, I., 1986. Annual
changes in serum reproductive hormone levels in captive female bottle-
nosed dolphins. Bull. Jap. Soc. Sci. Fish. 52: 1939-1946.
N.G.
Copyright © 2022 FDOKUMEN