Bottlenose dolphin Tursiops truncatus at São Tomé Island (São Tomé and Príncipe) — relative...
11
This article was downloaded by: [b-on: Biblioteca do conhecimento online UL] On: 26 December 2013, At: 02:33 Publisher: Taylor & Francis Informa Ltd Registered in England and Wales Registered Number: 1072954 Registered office: Mortimer House, 37-41 Mortimer Street, London W1T 3JH, UK African Journal of Marine Science Publication details, including instructions for authors and subscription information: http://www.tandfonline.com/loi/tams20 Bottlenose dolphin Tursiops truncatus at São Tomé Island (São Tomé and Príncipe) — relative abundance, site fidelity and social structure A Pereira a , F Martinho a , C Brito ab & I Carvalho ac a Escola de Mar, Edifício ICAT - Campus da FCUL, Campo Grande 1749-016 Lisboa, Portugal b Centro de História de Além-Mar, Faculdade de Ciências Sociais e Humanas, Universidade Nova de Lisboa, Avenida de Berna, 26 C, 1069-061 Lisboa, Portugal c Associação Para as Ciências do Mar, Edifício ICAT - Campus da FCUL, Campo Grande 1749-016 Lisboa, Portugal Published online: 19 Dec 2013. To cite this article: A Pereira, F Martinho, C Brito & I Carvalho (2013) Bottlenose dolphin Tursiops truncatus at São Tomé Island (São Tomé and Príncipe) — relative abundance, site fidelity and social structure, African Journal of Marine Science, 35:4, 501-510 To link to this article: http://dx.doi.org/10.2989/1814232X.2013.850444 PLEASE SCROLL DOWN FOR ARTICLE Taylor & Francis makes every effort to ensure the accuracy of all the information (the “Content”) contained in the publications on our platform. However, Taylor & Francis, our agents, and our licensors make no representations or warranties whatsoever as to the accuracy, completeness, or suitability for any purpose of the Content. Any opinions and views expressed in this publication are the opinions and views of the authors, and are not the views of or endorsed by Taylor & Francis. The accuracy of the Content should not be relied upon and should be independently verified with primary sources of information. Taylor and Francis shall not be liable for any losses, actions, claims, proceedings, demands, costs, expenses, damages, and other liabilities whatsoever or howsoever caused arising directly or indirectly in connection with, in relation to or arising out of the use of the Content. This article may be used for research, teaching, and private study purposes. Any substantial or systematic reproduction, redistribution, reselling, loan, sub-licensing, systematic supply, or distribution in any form to anyone is expressly forbidden. Terms & Conditions of access and use can be found at http:// www.tandfonline.com/page/terms-and-conditions
Transcript of Bottlenose dolphin Tursiops truncatus at São Tomé Island (São Tomé and Príncipe) — relative...

This article was downloaded by: [b-on: Biblioteca do conhecimento online UL]On: 26 December 2013, At: 02:33Publisher: Taylor & FrancisInforma Ltd Registered in England and Wales Registered Number: 1072954 Registered office: MortimerHouse, 37-41 Mortimer Street, London W1T 3JH, UK
African Journal of Marine SciencePublication details, including instructions for authors and subscription information:http://www.tandfonline.com/loi/tams20
Bottlenose dolphin Tursiops truncatus at São ToméIsland (São Tomé and Príncipe) — relative abundance,site fidelity and social structureA Pereiraa, F Martinhoa, C Britoab & I Carvalhoac
a Escola de Mar, Edifício ICAT - Campus da FCUL, Campo Grande 1749-016 Lisboa, Portugalb Centro de História de Além-Mar, Faculdade de Ciências Sociais e Humanas, UniversidadeNova de Lisboa, Avenida de Berna, 26 C, 1069-061 Lisboa, Portugalc Associação Para as Ciências do Mar, Edifício ICAT - Campus da FCUL, Campo Grande1749-016 Lisboa, PortugalPublished online: 19 Dec 2013.
To cite this article: A Pereira, F Martinho, C Brito & I Carvalho (2013) Bottlenose dolphin Tursiops truncatus at São ToméIsland (São Tomé and Príncipe) — relative abundance, site fidelity and social structure, African Journal of Marine Science,35:4, 501-510
To link to this article: http://dx.doi.org/10.2989/1814232X.2013.850444
PLEASE SCROLL DOWN FOR ARTICLE
Taylor & Francis makes every effort to ensure the accuracy of all the information (the “Content”) containedin the publications on our platform. However, Taylor & Francis, our agents, and our licensors make norepresentations or warranties whatsoever as to the accuracy, completeness, or suitability for any purpose ofthe Content. Any opinions and views expressed in this publication are the opinions and views of the authors,and are not the views of or endorsed by Taylor & Francis. The accuracy of the Content should not be reliedupon and should be independently verified with primary sources of information. Taylor and Francis shall not beliable for any losses, actions, claims, proceedings, demands, costs, expenses, damages, and other liabilitieswhatsoever or howsoever caused arising directly or indirectly in connection with, in relation to or arising out ofthe use of the Content.
This article may be used for research, teaching, and private study purposes. Any substantial or systematicreproduction, redistribution, reselling, loan, sub-licensing, systematic supply, or distribution in anyform to anyone is expressly forbidden. Terms & Conditions of access and use can be found at http://www.tandfonline.com/page/terms-and-conditions

African Journal of Marine Science 2013, 35(4): 501–510Printed in South Africa — All rights reserved
Copyright © NISC (Pty) LtdAFRICAN JOURNAL OF
MARINE SCIENCEISSN 1814-232X EISSN 1814-2338
http://dx.doi.org/10.2989/1814232X.2013.850444
African Journal of Marine Science is co-published by NISC (Pty) Ltd and Taylor & Francis
The Gulf of Guinea is known to have a diverse cetacean fauna, which includes at least 24 species (Jefferson et al. 1997, Van Waerebeek et al. 2009, Weir 2010). In the 19th and 20th centuries, there was extensive whaling along the west coast of Africa, primarily in the waters of northern Namibia, Angola, Gabon and Congo (e.g. Budker 1951, 1953, Best 1994, Best et al. 1999). However, the Gulf of Guinea is an area that has been poorly studied, especially with regard to small odontocetes. In most countries along Africa’s west coast, information on small cetacean species is gained from opportunistic strandings, captures and sightings, few of which are recent (Weir 2010). In a comprehensive review of cetacean research in the eastern tropical Atlantic, Weir and Pierce (2012) identified certain human activities that impact on some cetaceans. These include directed take (whales and small cetaceans), bycatch or entanglement in fishing gear, the tuna purse-seine fishery, overfishing, habitat loss and degradation, vessel strikes, marine ecotourism, and live captures for display. Hydrocarbon exploration is a major human activity which occurs in the Gulf of Guinea and which has considerable impact on cetaceans, either affecting the animals directly or affecting their habitats (Geraci 1990, Reeves et al. 2003). In the early 1990s, oil and natural gas reserves were discovered in the Gulf of Guinea offshore of São Tomé and Príncipe, and commercial production is expected to begin within a few years (Youngblood-Coleman 2013). Given that the main priorities of the countries of the Gulf of Guinea are economic development and the feeding of growing human populations, environmental considerations
are sometimes given low priority and environmental threats are likely to increase (Juste and Fa 1994, Brashares et al. 2004). With the lack of monitoring programmes and scarcity of scientific information on abundance and distributional patterns, as well as the impacts that human threats have on cetacean populations, the conservation status of small cetaceans in the Gulf of Guinea remains poorly known (Weir and Pierce 2012).
The common bottlenose dolphin Tursiops truncatus (hereafter referred to as the bottlenose dolphin) is a cosmo-politan species with a worldwide distribution in tropical and temperate regions (Reynolds et al. 2000). In the Gulf of Guinea, the bottlenose dolphin has been observed off Côte d’Ivoire (Cadenat and Lassarat 1959), Ghana (Van Waerebeek and Ofori-Danson 1999), Benin (Van Waerebeek et al. 2002), Gabon (Collins et al. 2004), and São Tomé and Príncipe (Picanço et al. 2009). Bottlenose dolphins have been sighted in shelf and coastal waters (Cadenat and Lassarat 1959, Collins et al. 2004) and around volcanic islands (Picanço et al. 2009), and bycatch records suggest that they occur in pelagic waters (Van Waerebeek et al. 2009). Although the conservation status of bottlenose dolphins is currently considered to be ‘Least Concern’ (Hammond et al. 2012), direct catches and bycatch in gillnet fisheries in the Gulf of Guinea may be a serious threat to populations in the region (Ofori-Danson et al. 2003).
In São Tomé and Príncipe, the bottlenose dolphin is the most-sighted small cetacean and it seems to occur
Bottlenose dolphin Tursiops truncatus at São Tomé Island (São Tomé and Príncipe) — relative abundance, site fidelity and social structure
A Pereira1*, F Martinho1, C Brito1,2 and I Carvalho1,3
1 Escola de Mar, Edifício ICAT – Campus da FCUL, Campo Grande 1749-016 Lisboa, Portugal 2 Centro de História de Além-Mar, Faculdade de Ciências Sociais e Humanas, Universidade Nova de Lisboa, Avenida de Berna, 26 C, 1069-061 Lisboa, Portugal3 Associação Para as Ciências do Mar, Edifício ICAT – Campus da FCUL, Campo Grande 1749-016 Lisboa, Portugal * Corresponding author, e-mail: [email protected]
Although the bottlenose dolphin Tursiops truncatus is one of the most common cetacean species around São Tomé Island, Gulf of Guinea, little research has focused on this species in this region. This study investigated the popula-tion of bottlenose dolphins around São Tomé Island by estimating the minimum population size, site fidelity and social structure. During a total of 226 surveys between 2002 and 2006, and in 2012, 51 sightings were recorded but only 33 had photographic data suitable for rigorous analysis. The minimum annual total population size, based on permanently marked dolphins, was 37 individuals, and the discovery curve indicated that a large part of the popula-tion remained undiscovered. The annual sighting rate for 76 highly distinctive adult animals ranged from 0.20 (seen in one year only) to 1.0 (seen every year of the study period). Resighted individuals demonstrated low association values; the dolphins seemed to form a single group with a fluid structure.
Keywords: Africa, conservation, group composition, Gulf of Guinea, photo-identification, population size, social association, South Atlantic
Introduction
Dow
nloa
ded
by [
b-on
: Bib
liote
ca d
o co
nhec
imen
to o
nlin
e U
L]
at 0
2:33
26
Dec
embe
r 20
13

Pereira, Martinho, Brito and Carvalho502
regularly (Brito et al. 2010). Commercial whaling activi-ties ceased in 1986 as a result of a moratorium imposed by the International Whaling Commission (IWC 1983), but bycatch, direct hunting and recent hydrocarbon exploration constitute major threats for small cetaceans in this country. Other than the ban on whaling, cetaceans in the waters of São Tomé and Príncipe have no specific legal protection, although there are laws pertaining to general aspects of environmental protection (Brito et al. 2010). With the lack of scientific information on small cetaceans and increasing anthropogenic pressure, it is necessary to start a scientific assessment of the status of these species. The aims of this study were to provide an estimate of the minimum popula-tion size of bottlenose dolphins around São Tomé Island, and to describe their social structure and site fidelity.
Material and methods
Study areaThe Democratic Republic of São Tomé and Príncipe, located off the west coast of Africa in the equatorial region (between 1°44' N and 0°01' S), is the second smallest African country. It is composed of two main islands and several islets (Figure 1). This archipelago of volcanic origin has a land area of 1 000 km2 and a continental shelf area (<200 m depth) of 1 455 km2. São Tomé Island is the largest island with an area of 860 km2 and a narrow continental shelf of 435 km2. It has high relief and sea floor depths of up to 2 000 m (Instituto Hidrográfico 1966).
Data collectionNon-systematic boat surveys were conducted between 2002 and 2006, and in 2012. Surveys between 2002 and 2006 were part of a larger research programme that was focused mainly on humpback whale Megaptera novae angliae occurrence during their breeding season (Carvalho et al. 2011), but additional baseline distribu-tion data of other species were also collected. During 2012, data were collected mainly opportunistically during whale-watching activities. Surveys were conducted using various fibreglass boats 6–8 m long, powered by engines ranging from 25 hp to 200 hp. Sampling was conducted in sea states of ≤ Beaufort 4. Observations were made with the naked eye, using continuous scanning methods (Mann 1999). When bottlenose dolphins were sighted, search effort (time spent searching for animals) was switched to encounter effort (time with the animals) and several parameters were recorded, such as GPS position, time, group size and composition. A group was defined as any number of animals observed in apparent association, moving in the same direction and engaging in the same activity (Shane 1990). Group size was estimated based on a minimum count of animals observed at the surface at one time, and was defined post hoc as small (<30), medium (31–60) and large (>60), based on the distribution of the data. Group composi-tion was determined by counting the minimum number of adults, juveniles and calves present (following the definitions of age classes of Bearzi et al. 1997). Photographs were taken with 35 mm cameras with 75–300 mm zoom lenses, either using ISO 100 or 400 colour slide film (2002–2004), or digital technology (2005, 2006 and 2012), and were used for
photo-identification analysis, confirmation of group size and determination of group composition.
Data analysisIndividual animals were identified based on the number, size and location of nicks and scars on the dorsal fins and on the back directly posterior to the dorsal fin (Würsig and Würsig 1977, Würsig and Jefferson 1990). Photographs were classified with a quality rating of ‘good’, ‘fair’ or ‘poor’, depending on the focus, angle, and size of the fin within the image. Good-quality photographs were in focus and well exposed, with the whole dorsal fin visible, oriented parallel to the photographer and occupying most of the frame. The photo-identification catalogue was constructed primarily with photographs graded ‘good’ or ‘fair’. However, when a highly distinctive individual (e.g. with deep nicks and cuts and damaged fins; see below) could be recognised, such photographs were used even if graded ‘poor’. Only individuals with permanent markings (e.g. nicks, notches, damaged fins or diagnostic fin shape) were included in the photo-identification catalogue and were used in the analysis. Calves and individuals bearing marks that were judged to be only temporary (e.g. depigmentation, skin lesions, scars, scratches and tooth-rake scratches) were not considered in the analysis, to avoid the likelihood of false positives that could occur due to the large intervals
AFRICA
ATLANTICOCEAN São Tomé
Príncipe
Nigeria
Cameroon
Gabon
ATLANTICOCEAN
SÃO TOMÉ
São Tomé City
RolasIsland
6°40 E
0°
0°20 N
0°
0°20 N
0°40 N
0 5 10 km
2 500 m
2 000 m
1 500
m
1 00
0 m
500
m
200
m
Figure 1: Geographical location of São Tomé and Príncipe, showing the survey effort around São Tomé Island between 2002 and 2006, and in 2012
Dow
nloa
ded
by [
b-on
: Bib
liote
ca d
o co
nhec
imen
to o
nlin
e U
L]
at 0
2:33
26
Dec
embe
r 20
13

African Journal of Marine Science 2013, 35(4): 501–510 503
between surveys. Each dorsal fin in the catalogue was graded with a ‘distinctiveness value’ (DV), varying from 1 (subtle or small notches) to 3 (more than five notches, damaged fins or deep nicks and cuts, which were evident even in poor-quality images). Photographic records of highly distinctive individuals were used in the analysis and termed ‘photo-identification sightings’. Although there was a sighting of bottlenose dolphins in 2006, photographs were not collected during that year.
Dolphin sightings for each year were expressed as sightings per hour of search effort. To account for spatial variation in search effort, we created a grid with a cell size of 1 1 nautical miles (3.43 km2), using ESRI® ArcMap 9.2 (ESRI 2006), which was overlaid onto the survey area. This cell size was considered to best represent the observational range from the research vessels, in that two observers were looking for cetaceans, one on each side of the boat. Search effort was calculated as the total number of kilometres travelled in each cell.
Minimum population sizeThe designation ‘population’ is used here to describe bottle-nose dolphins occupying the study area during the sampling period and does not refer to a condition of reproductive isolation (Krebs 1994). Mark-recapture methods could not be applied to the data to determine population size as there was a high probability of violation of several assumptions. The seven-year gap between sampling periods (2002–2005 and 2012), the lack of good photographic data in the early years and the opportunistic nature of the recent data (some of the 2012 data were collected during whale-watching activities) could result in biased population estimates. A minimum population size (Weir et al. 2008) was calculated instead, using all individuals with permanent markings. A discovery curve was plotted to assess the growth rate of the photo-identification catalogue over time and to investigate whether the population could be considered as ‘closed’ or ‘open’ (Schwarz and Seber 1999).
Site fidelitySite fidelity can be described as the tendency of an individual to return to an area previously occupied or to remain in an area over an extended period (White and Garrot 1990). Potential fidelity to the study area was investi-gated by means of the annual sighting rate (ASR), using sighting histories of individuals with DV of 2 and 3 in order to ensure more reliable results and to avoid false positives/
negatives. The ASR was calculated as the number of years a particular dolphin was photographed as a proportion of the total number of years surveyed (Parra et al. 2006). A dolphin observed in only one year would have an ASR of 0.20, whereas a dolphin photographed at least once in each of the five years surveyed would have an ASR of 1.00. Only animals first photographed prior to 2012 (n 76) were used in the analysis because of the zero probability of recapture of animals first identified in 2012. The change of survey effort from the southern (2002–2003) to the northern (2004 onwards) section of São Tomé Island could influence the recapture of some individuals that may use only a section of the island as their home range. The most-recaptured individuals were spatially mapped in order to assess the range of their movements within the surveyed area.
Group dynamics and social structureA chi-square test (2) was performed to determine if group size was independent of group composition. Data on social structure between individuals with DV2 and DV3 that were resighted at least twice was analysed using SOCPROG 2.4 (Whitehead 2009). Coefficient of association values range from 0 (two individuals never seen together) to 1 (individ-uals always seen together) and were classified as low (0.01–0.20), medium–low (0.21–0.40), medium (0.41–0.60), medium–high (0.61–0.80) and high (0.81–1) (Quintana-Rizzo and Wells 2001). The level of population clustering was given by the modularity value (a value >0.3 is consid-ered a good indicator of clustering; Newman 2006).
Results
Survey and photo-identification effort A total of 226 surveys was conducted, comprising 627 hours of search effort (Table 1). Survey effort differed between years due to changes in location of the team base. In 2002 and 2003 most of the survey effort was concen-trated in the waters south of São Tomé Island and from 2004 onwards most of the survey effort occurred on the north and east coasts (Figure 2). Of the 51 sightings, only 33 were classified as photo-identification sightings and were used in the analysis.
A total of 2 011 photographs was taken, of which 1 058 were suitable for photo-identification methods because of their quality and the distinctiveness of individuals. Of these, 677 photographs included all the identified individuals used in the subsequent analysis. Overall, 140 individuals
YearSampling effort Sightings
Months surveyed
Number of surveys
Search effort (h)
Number of sightings
Mean group size ± SD
Sightings per unit effort (sightings h–1)
2002 Jul–Dec 87 173 22 44.1 ± 44.1 0.132003 Jan, Aug–Oct 61 137 12 45.3 ± 36.3 0.092004 Oct–Nov 22 106 3 58.3 ± 28.9 0.032005 Aug–Oct 33 130 6 66.7 ± 25.8 0.052006 Sep 7 29 1 25.0 0.042012 Feb–Jun 16 52 7 23.9 ± 10.9 0.13Total 226 627 51 44.7 ± 36.9 0.08
Table 1: Number of bottlenose dolphin sightings, sightings per unit effort and search effort for each year off São Tomé Island
Dow
nloa
ded
by [
b-on
: Bib
liote
ca d
o co
nhec
imen
to o
nlin
e U
L]
at 0
2:33
26
Dec
embe
r 20
13

Pereira, Martinho, Brito and Carvalho504
exhibited permanent markings and most were identified from good and fair photographs. Only one individual with a highly distinctive dorsal fin was identified using a poor photograph. In all, 25 dolphins were classified as DV1, 36 as DV2 and 79 as DV3. Of the 140 individuals, most (65.71%) were sighted only once during the entire study period, but others were observed between two and six times, with an average resighting frequency of 2.92 (median 2, SD 1.33) (Figure 3).
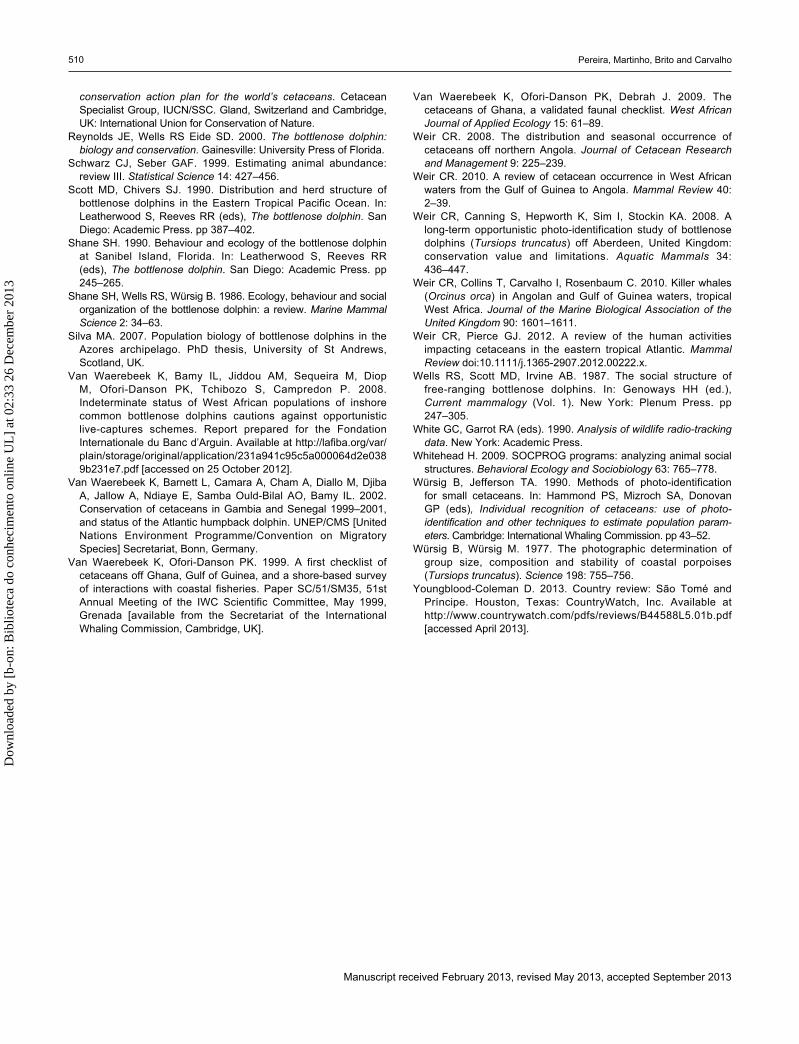
Minimum population sizeThe discovery curve showed a steady increase from 2002 (Figure 4), with most individuals being first identified in the last two years (2005 and 2012). The resighting curve was always below the discovery curve and only the last sighting in 2005 was composed mostly of resighted individuals.
The minimum annual total population size of bottlenose dolphins at São Tomé Island, based on photo-identification analysis, varied between eight and 37 individuals (Table 2). There was no correlation between the number of photographs used for photo-identification analysis and the mini mum
SÃO TOMÉ
São Tomé City
RolasIsland
6°40 E
0°
0°20 N
0°40 N
0 4 8 km Survey effort (km)
1–15
15–3
939
–76
76–1
18
118–
171
171–
267
267–
456
456–
793
Figure 2: Sightings (white dots) of bottlenose dolphins off São Tomé Island between 2002 and 2006, and in 2012. The grid shows the survey effort (km) during the same study period
DV3DV2DV1
1 42 3 5 6NUMBER OF SIGHTINGS
20
60
40
80
NU
MB
ER
OF
IDE
NTI
FIE
DIN
DIV
IDU
ALS
Figure 3: Sighting frequencies of bottlenose dolphins identified off São Tomé Island between 2002 and 2005, and in 2012 (n = 140)
New individuals
Resightings
2
35
70
105
140
1 3 4 5 6 7 8 9 10 11 12 13 14 15 16 17 18 19 20 21 22 23 24 25 26 27 28 29 30 31 32 33
CO
UN
T
PHOTO-IDENTIFICATION SIGHTINGS
2002 2003 2004 2005 2012
Figure 4: Cumulative frequency of identification of new individuals and resightings over time off São Tomé Island between 2002 and 2005, and in 2012
Dow
nloa
ded
by [
b-on
: Bib
liote
ca d
o co
nhec
imen
to o
nlin
e U
L]
at 0
2:33
26
Dec
embe
r 20
13

African Journal of Marine Science 2013, 35(4): 501–510 505
number of animals identified in each year (Spearman’s rank order correlation: rs 0.7, n 5, p 0.188).
Site fidelityOf the 115 individuals of DV2 or DV3, a total of 76 was first identified prior to 2012 and used in the analysis of site fidelity (Table 3). These animals were photographed during between one and five of the five surveyed years (Table 4). Only eight individuals (DV2 2 individuals, DV3 6 individ-uals) from the period 2002–2005 were resighted in 2012.
Annual sighting rate was low (0.32, SD 0.17), with individual animals being photographed during an average of 1.6 of the available five years (Table 3). Although dolphins of DV3 had a higher ASR than dolphins of DV2 (Table 3), the differences were not significant (Mann-Whitney U-test, p 0.123).
The spatial mappings of the four individuals that were sighted the greatest number of times (sighted six times each) showed no clear preference for one specific portion of the surveyed area (Figure 5). Six individuals sighted between 2002 and 2003 only, in the southern region of
Parameter 2002 2003 2004 2005 2012Number of photo-identification
sightings 11 9 3 5 5
Photos used for photo-identification 184 168 45 163 498Photos with recognised individuals 74 70 29 110 394Minimum population size 21 25 8 28 37
Table 2: Photographic effort and minimum population size of bottlenose dolphins identified off São Tomé Island between 2002 and 2005, and in 2012
ParameterSighting rate
n Range Mean SDOverall 76 0.20–1.00 0.32 0.17DV2 28 0.20–0.40 0.25 0.09DV3 48 0.20–1.00 0.37 0.19
Table 3: Annual (2002–2005 and 2012) sighting rates for bottlenose dolphins of DV2 and DV3 off São Tomé Island
ID2002 2003 2004 2005 2012
Aug Sep Oct Nov Jan Sep Oct Oct Nov Sep Oct Feb MayPresence and resightings of individuals with DV2
STPTT047STPTT059 0 0 0 0 0 0 0 0 0 2 0 0STPTT062STPTT068STPTT074STPTT082STPTT085STPTT087STPTT092 0 0 0 1 0 0STPTT093STPTT106STPTT109STPTT110STPTT111STPTT121STPTT125STPTT127STPTT129STPTT135STPTT137STPTT148STPTT155STPTT168STPTT174STPTT178STPTT182STPTT189STPTT190
Presence and resightings of individuals with DV3STPTT002STPTT006STPTT012STPTT014STPTT043
Table 4: Sighting histories of 76 bottlenose dolphins off São Tomé Island between 2002 and 2005, and in 2012; all these animals were first identified before 2012. Shaded cells indicate presence and the numbers within the black cells represent the number of resightings
Dow
nloa
ded
by [
b-on
: Bib
liote
ca d
o co
nhec
imen
to o
nlin
e U
L]
at 0
2:33
26
Dec
embe
r 20
13

Pereira, Martinho, Brito and Carvalho506
ID2002 2003 2004 2005 2012
Aug Sep Oct Nov Jan Sep Oct Oct Nov Sep Oct Feb MayPresence and resightings of individuals with DV3 (cont.)
STPTT058STPTT060 1STPTT063STPTT064STPTT069STPTT070STPTT071 1 0 0 0 0 0 1 0 0STPTT073 1 0 0STPTT076 1 0 0STPTT079 0 0STPTT081 0 0 1 0 0STPTT083 0 0 0 0 0STPTT084 1 0 0STPTT086 1 0 0STPTT090 1 0 0STPTT091 1 0 0STPTT098 1 0 0STPTT100STPTT101 0 0 0 0 0 0 0 0 0 0 1 0 0STPTT102 1STPTT103 0 0 0 0 0 0 0 0 0 0 0STPTT104 2 0 0STPTT105STPTT107STPTT124STPTT131STPTT133 1 0 0 0 0 0STPTT134STPTT136STPTT139 0 0 0 0 1 0 0 0 0 0 0 0 0STPTT140STPTT141STPTT142 0 0 0 0 1 0 0 0 0 0 0 0 0STPTT145STPTT149STPTT153STPTT154STPTT159STPTT170STPTT173STPTT183STPTT185STPTT194
Table 4: (cont.)
the island, may have low ASR values because their home range may cover only that region.
Group dynamics and social structureGroup size of bottlenose dolphins ranged from 3 to 200, with a mean of 44.7 individuals (median 35, SD 36.9) (Figure 6). Groups composed of adults, juveniles and calves were the most frequently observed (Figure 7). There appeared to be an association between the frequency of certain group sizes and group composition (² 17.44, df 6, p 0.0078), with the smallest groups usually consisting of adults only and the largest groups usually including calves.
Coefficients of association among individuals with DV2 and DV3 had an average of 0.17 (SD 0.09). Cluster
analysis showed that group division was not possible given the modularity of 0.20.
Discussion
Value and limitations of the datasetsAs a coastal species, the bottlenose dolphin is subject to anthropogenic pressure in the Gulf of Guinea. This study provides information on a previously unstudied population of bottlenose dolphins and contributes to overall knowledge on cetaceans in the Gulf of Guinea. Our study confirms that bottlenose dolphins occur year-round in the region and that a group of individuals shows some level of site fidelity and seems to range all around São Tomé Island.
Dow
nloa
ded
by [
b-on
: Bib
liote
ca d
o co
nhec
imen
to o
nlin
e U
L]
at 0
2:33
26
Dec
embe
r 20
13

African Journal of Marine Science 2013, 35(4): 501–510 507
The main limitations identified in the datasets were: (1) surveys were not directly focused on the collection of data on bottlenose dolphins, (2) survey effort varied in time and space over the study period, and (3) the collection of photographic data was influenced by sea conditions. During the period 2002–2006, surveys were conducted mostly between June and October, the dry season, when sea conditions (mainly off the south coast of São Tomé Island) are worst. This made the collection of good photographic data difficult, especially in 2002 and 2003. Sometimes sea conditions changed very rapidly during a field survey (e.g. from Beaufort 3 to Beaufort 4), which influenced the detection of animals and the collection of photographic data. Fortunately, such circumstances were rare. The change of study site in 2004, from the south to the north coast of São Tomé Island, added further heterogeneity to the data. These limitations were demonstrated by the low minimum popula-tion size, resighting frequency and site fidelity, and this pattern was indicated by the discovery curve. Undersampling was clearly demonstrated when comparing the group size and the minimum population size. With such a high mean
ATLANTICOCEAN
SÃO TOMÉ
RolasIsland
0 5 10 km
2 500 m
2 000 m
1 500 m
1 00
0 m
500 m
200 m
STPTT063 STPTT071 STPTT086 STPTT102
Figure 5: Geographical location of the sightings (n = 6) of the most-resighted bottlenose dolphins between 2002 and 2005, and in 2012, off São Tomé Island
2
4
6
8
3 5 6 7 13 15 17 20 25 30 35 40 50 75 90 100 200
CO
UN
T
ESTIMATED GROUP SIZE
Figure 6: Frequencies of estimated group sizes of bottlenose dolphins based on minimum field counts off São Tomé Island between 2002 and 2006, and in 2012 (n = 51). Only those group sizes that were observed are included on the horizontal axis
10
20
30
40
50
Adults Adults,juveniles
Adults,calves
Adults,juveniles,
calves
1–30 31–60 >60
FRE
QU
EN
CY
(%)
GROUP TYPE
Group size
Figure 7: Frequency of group type per group size of bottlenose dolphins off São Tomé Island between 2002 and 2006, and in 2012 (n = 51)
Dow
nloa
ded
by [
b-on
: Bib
liote
ca d
o co
nhec
imen
to o
nlin
e U
L]
at 0
2:33
26
Dec
embe
r 20
13

Pereira, Martinho, Brito and Carvalho508
group size, the resighting frequency or the number of ‘marked’ individuals should be higher than was observed. However, the change of study site from the south to the north coast of the island may not introduce a major bias as we did not find a clear preference for either region of the study area, with the most-resighted individuals, which may be represent-ative of a larger group, using the full extent of the island.
Status of bottlenose dolphins at São Tomé Island Of the 140 individuals, the majority (n 115) had a DV of 2 or 3, which suggests a strong probability of recapture. A total of 76 of these individuals were identified in 2012 only and their annual sighting rate could not be calculated, so their site fidelity remains unknown. Although the sampling effort was low, some individuals first sighted in 2002–2005 were observed in 2012 and one was observed in every survey year. The most-resighted individuals utilised the entire east coast of São Tomé Island but it is possible that a subpopulation of dolphins that was not resighted after the change in study site used only the waters south of São Tomé Island, which include Rolas Island. A subpopulation of this nature would be unexpected, however, because the waters around oceanic islands are less productive habitats than continental coastal waters (Defran at al. 1999), and hence the home ranges of bottlenose dolphins around São Tomé Island would be expected to be large.
The mean group size of 44.7 individuals at São Tomé Island is higher than that estimated for the inshore region of West Africa (Van Waerebeek et al. 2008) and is the second highest observed around oceanic islands (Baird et al. 2001, Silva 2007), after those of the Eastern Pacific Ocean (Scott and Chivers 1990). These findings support the notion that larger groups of bottlenose dolphins tend to occur in more open and pelagic waters that have patchy food resources, where schooling fish become the main food resource and larger groups may benefit from cooperative feeding (Shane et al. 1986). At São Tomé Island, pelagic schooling fish, such as the flying-fish Cheilopogon melanurus, little tunny Euthynnus alletteratus and balao halfbeak Hemiramphus balao (Afonso et al. 1999), may serve as a food resource for bottlenose dolphins.
Certain shark species and killer whales Orcinus orca are potential predators of bottlenose dolphins, and in their presence the group size could increase as an avoidance tactic (Herzing and Johnson 1997, Norris and Dohl 1980). Anecdotal information and fishermen reports suggest that sharks of unrecorded species are observed frequently in São Tomé waters but the scars on identified individual dolphins were not consistent with those inflicted by sharks. Killer whales seem to have a seasonal occurrence at São Tomé (Weir et al. 2010) and are found within the distribu-tional range of bottlenose dolphins in the south, near to Rolas Island. Only one bottlenose dolphin was observed to have marks in the dorsal fin that could suggest an orca attack.
Larger dolphin groups tended to include juveniles and calves. The influence of calves on group size of bottle-nose dolphins has been reported from the waters of the Marlborough Sounds, New Zealand (Merriman 2007), the Adriatic Sea (Bearzi et al. 1997) and Sarasota Bay, Florida (Wells et al. 1987). In addition to being a defence strategy,
larger groups allow for reduced maternal investment because of the assistance of the young by other members (Bearzi et al. 1997).
Bottlenose dolphins at São Tomé Island demonstrated low to moderate association values, with an average of 0.18 (SD 0.10). Cluster analysis did not show a division of resighted individuals into units, indicating that they form a single group with a fluid structure. Association coefficients with low values are characteristic of the fission-fusion society of bottlenose dolphins, with highly fluid groups varying membership within a very small time frame (Connor et al. 2000). Also, the large group sizes observed at São Tomé Island allow for a wide range of potential associations between individuals, thereby influencing coefficients of association.
Conclusion
This study provided a first step in assessing the status of bottlenose dolphins at São Tomé Island, but there were limitations in the study that should be addressed in future research. A sampling programme focused on the collec-tion of photographic data is needed and it should be more consistent over time and with a homogenous coverage of the survey area. Extension of the survey area to include Príncipe Island may provide important information about the level of structuring and ranging movements of bottlenose dolphins between the islands. A dataset of this nature would facili-tate the use of mark-recapture methods to better estimate population size and residency period and to better evaluate the social structure between individuals. Longer-term monitoring would assist the promotion and implementation of conservation of small cetaceans in the Gulf of Guinea.
Most sightings of bottlenose dolphins occurred where there are active fishing operations. The local artisanal fishery provides an important food supply for the island’s human population, with fish providing 60–70% of the animal protein consumed (D’Almeida et al. 1996). Anecdotal evidence suggests that fishers from São Tomé Island sometimes target small cetaceans, which are also taken as bycatch, for use as a food resource (AP unpublished data). Incidental entanglement and/or deliberate targeting, the use of explosives, illegal fishing, disturbance and alteration or loss of critical areas could all contribute to a decrease in bottlenose dolphin abundance, especially in groups with high site fidelity. There has been a marked decrease in fish catches by the artisanal fishery of São Tomé and Príncipe, especially in coastal zones (B Loloum, Marapa, pers. comm.). Fishing effort is likely to increase to compen-sate for this, and hence the potential for conflicts between humans and cetaceans will increase. A greater conserva-tion effort is required in São Tomé and Príncipe through more consistent and focused scientific research, the implementation of monitoring plans for small cetaceans, and the establishment of environmental awareness and educational plans.
Acknowledgements — The following people and institutions are acknowledged: the President, Fradique de Menezes, and the Government of São Tomé and Príncipe, especially the environ-mental director, Dr Arlindo Carvalho, for permission to conduct this study; the Portuguese Embassy in São Tomé and Príncipe for logistical support; Tim Collins from the Wildlife Conservation
Dow
nloa
ded
by [
b-on
: Bib
liote
ca d
o co
nhec
imen
to o
nlin
e U
L]
at 0
2:33
26
Dec
embe
r 20
13

African Journal of Marine Science 2013, 35(4): 501–510 509
Society and Jan Hartman and Henrique Costa from Eco São Tomé for all the help and contacts; Herbert Maia, Cristina Picanço, Maria Pimentel, Carlos Carvalho, João Mendes and Edmilson for their valuable help in the field; Projecto Delfim and Rolas Island Resort for logistical and financial support in 2002 and 2003; and Bastien Loloum and the rest of the Marapa team for conducting surveys during 2012. The 2004 and 2005 field seasons were funded by the Conservation et utilisation rationnelle des Ecosystèmes Forestiers en Afrique Centrale (ECOFAC), project Espèces Phares and Paulo Pimentel, and the 2006 field season was funded by the Wildlife Conservation Society. The 2012 field season was funded by the International Union for Conservation of Nature (IUCN) and the Central African Regional Program for the Environment (CARPE), through the collaboration of the local non-governmental organisa-tion, Marapa. We also thank all the crowd-funding supporters who provided the funds for the 2012 study. IC’s doctoral grant was funded by the Portuguese Foundation for Science and Technology (Fundação para a Ciência e Tecnologia; SFRH/BD/18049/2004). Our thanks to the two anonymous reviewers and the editor who helped to improve the manuscript.
References
Afonso P, Porteiro FM, Santos RS, Barreiros JP, Worms J, Wirtz P. 1999. Coastal marine fishes of São Tomé Island (Gulf of Guinea). Arquipélago Life and Marine Sciences 17: 65–92.
Baird RW, Gorgone AM, Ligon AD, Hooker SK. 2001. Mark-recapture abundance estimate of bottlenose dolphins (Tursiops truncatus) around Maui and Lana’i, Hawai’i, during the winter of 2000/2001. Unpublished report 40JGNF0-00262, Southwest Fisheries Science Center. La Jolla: National Marine Fisheries Service.
Bearzi G, Notarbartolo-di-Sciara G, Politi E. 1997. Social ecology of bottlenose dolphins in the Kvarneri (Northern Adriatic Sea). Marine Mammal Science 13: 650–668.
Best PB. 1994. A review of the catch statistics for modern whaling in southern Africa, 1908–1930. Reports of the International Whaling Commission 44: 467–485.
Best PB, Reeb D, Morais M, Baird A. 1999. A preliminary investi-gation of humpback whales off northern Angola. Document SC/51/CAWS33 presented to the Scientific Committee of the International Whaling Commission, Grenada, 24–28 May 1999.
Brashares JS, Arcese P, Sam MK, Coppolillo PB, Sinclair AR, Balmford A. 2004. Bushmeat hunting, wildlife declines, and fish supply in West Africa. Science 306: 1180–1183.
Brito C, Picanço C, Carvalho I. 2010. Small cetaceans off São Tomé (São Tomé and Príncipe, Gulf of Guinea, West Africa): species, sightings and abundance, local human activities and conservation. Document SC/62/SM8 presented to the Scientific Committee of the International Whaling Commission, Morocco, 30 May–11 June 2010.
Budker P. 1951. L’industrie baleinière au Gabon. Bulletin de la Société zoologique de France 76: 271–276.
Budker P. 1953. Les campagnes baleinières 1949–1952 au Gabon (Note préliminaire). Mammalia 17: 129–148.
Cadenat J, Lassarat A. 1959. Notes sur les Delphinidés oust-africains, III. Note complémentaire sur Tursiops truncatus en Côte d’Ivoire. Bulletin De l’Institut Francais D’Afrique Noire 21: 416–419.
Carvalho I, Brito C, dos Santos ME, Rosenbaum HC. 2011. The waters of São Tomé: a calving ground for West African humpback whales? African Journal of Marine Science 33: 91–97.
Collins T, Ngouessono S, Rosenbaum HC. 2004. A note on recent surveys for Atlantic humpback dolphins, Sousa teuszii (Kükenthal, 1892) in the coastal waters of Gabon. Paper SC/56/SM23, presented at the 56th Annual Meeting of the IWC Scientific Committee, July 2004, Italy [available from the Secretariat of the International Whaling Commission, Cambridge, UK].
Connor RC, Wells RS, Mann J, Read AJ. 2000. The bottlenose
dolphin: social relationships in a fission-fusion society. In: Mann J, Connor RC, Tyack PL, Whitehead H (eds), Cetacean societies: field studies of dolphins and whales. Chicago and London: The University of Chicago Press. pp 91–126.
D’Almeida A, Aníbal O, Bandeira AB, Costa G, Teixeira M, Worms J. 1996. La pêche artisanale à São Tomé. Résultats de trois années de recherche. 1993–1995. PERH [Project d’évaluation des ressources halieutiques] rapport scientifique.
Defran RH, Weller DW, Kelly DL, Espinosa MA. 1999. Range characteristics of Pacific coast bottlenose dolphins (Tursiops truncatus) in the Southern California Bight. Marine Mammal Science 15: 381–393.
Geraci JR. 1990. Physiologic and toxic effects on cetaceans. In: Geraci JR, St. Aubin DJ (eds), Sea mammals and oil: confronting the risks. San Diego: Academic Press. pp 167–197.
Hammond PS, Bearzi G, Bjørge A, Forney KA, Karkzmarski L, Kasuya T, Perrin WF, Scott MD, Wang JY, Wells RS, Wilson B. 2012. Tursiops truncatus. In: 2013 IUCN Red List of threatened species, version 2013.1. Available at www.iucnredlist.org [accessed April 2013].
Herzing DL, Johnson CM. 1997. Interspecific interactions between Atlantic spotted dolphins (Stenella frontalis) and bottlenose dolphins (Tursiops truncatus) in the Bahamas, 1985–1995. Aquatic Mammals 23: 85–99.
Instituto Hidrográfico. 1967. Carta hidrográfica do Arquipélago de São Tomé e Príncipe (1966), 1:250.000, No. 321 (1st edn). Lisbon: Ministérios da Marinha, Instituto Hidrográfico.
IWC (International Whaling Commission). 1983. Chairman’s Report of the Thirty-Fourth Annual Meeting. Report of the International Whaling Commission 33: 20–42.
Jefferson TA, Curry BE, Leatherwood S, Powell JA. 1997. Dolphins and porpoises of West Africa: a review of records (Cetacea: Delphinidae, Phocoenidae). Mammalia 61: 87–108.
Juste J, Fa JE. 1994. Biodiversity conservation in the Gulf of Guinea islands: taking stock and preparing action. Biodiversity and Conservation 3: 759–771.
Krebs CJ. 1994. Ecology: the experimental analysis of distribution and abundance (4th edn). New York: Harper Collins College Publishers.
Mann J. 1999. Behavioral sampling methods for cetaceans: a review and critique. Marine Mammal Science 15: 102–122.
Merriman MG. 2007. Abundance and behavioural ecology of bottlenose dolphins (Tursiops truncatus) in the Marlborough Sounds, New Zealand. MSc thesis, Massey University, New Zealand.
Newman MJ. 2006. Modularity and community structure in networks. Proceedings of the National Academy of Sciences of the United States of America 103: 8577–8582.
Norris KS, Dohl TP. 1980. The structure and function of cetacean schools. In: Herman LM (ed.), Cetacean behaviour: mechanisms and functions. New York: John Wiley & Sons. pp 211–261.
Ofori-Danson PK, Van Waerebeek K, Debrah S. 2003. A survey for the conservation of dolphins in Ghanaian coastal waters. The Journal of the Ghana Science Association 5: 45–54.
Parra GJ, Corkeron PJ, Marsh H. 2006. Population sizes, site fidelity and residence patterns of Australian snubfin and Indo-Pacific humpback dolphins: implications for conservation. Biological Conservation 129: 167–180.
Picanço C, Carvalho I, Brito C. 2009. Occurrence and distribution of cetaceans in São Tomé and Príncipe tropical archipelago and their relation to environmental variables. Journal of the Marine Biological Association of the United Kingdom 89: 1071–1076.
Quintana-Rizzo E, Wells RS. 2001. Resighting and association patterns of bottlenose dolphins (Tursiops truncatus) in the Cedar Keys, Florida: insights into social organization. Canadian Journal of Zoology 79: 447–456.
Reeves RR, Smith BD, Crespo EA, Notarbartolo di Sciara G (compilers). 2003. Dolphins, whales and porpoises: 2002–2010
Dow
nloa
ded
by [
b-on
: Bib
liote
ca d
o co
nhec
imen
to o
nlin
e U
L]
at 0
2:33
26
Dec
embe
r 20
13
Pereira, Martinho, Brito and Carvalho510
conservation action plan for the world’s cetaceans. Cetacean Specialist Group, IUCN/SSC. Gland, Switzerland and Cambridge, UK: International Union for Conservation of Nature.
Reynolds JE, Wells RS Eide SD. 2000. The bottlenose dolphin: biology and conservation. Gainesville: University Press of Florida.
Schwarz CJ, Seber GAF. 1999. Estimating animal abundance: review III. Statistical Science 14: 427–456.
Scott MD, Chivers SJ. 1990. Distribution and herd structure of bottlenose dolphins in the Eastern Tropical Pacific Ocean. In: Leatherwood S, Reeves RR (eds), The bottlenose dolphin. San Diego: Academic Press. pp 387–402.
Shane SH. 1990. Behaviour and ecology of the bottlenose dolphin at Sanibel Island, Florida. In: Leatherwood S, Reeves RR (eds), The bottlenose dolphin. San Diego: Academic Press. pp 245–265.
Shane SH, Wells RS, Würsig B. 1986. Ecology, behaviour and social organization of the bottlenose dolphin: a review. Marine Mammal Science 2: 34–63.
Silva MA. 2007. Population biology of bottlenose dolphins in the Azores archipelago. PhD thesis, University of St Andrews, Scotland, UK.
Van Waerebeek K, Bamy IL, Jiddou AM, Sequeira M, Diop M, Ofori-Danson PK, Tchibozo S, Campredon P. 2008. Indeterminate status of West African populations of inshore common bottlenose dolphins cautions against opportunistic live-captures schemes. Report prepared for the Fondation Internationale du Banc d’Arguin. Available at http://lafiba.org/var/plain/storage/original/application/231a941c95c5a000064d2e0389b231e7.pdf [accessed on 25 October 2012].
Van Waerebeek K, Barnett L, Camara A, Cham A, Diallo M, Djiba A, Jallow A, Ndiaye E, Samba Ould-Bilal AO, Bamy IL. 2002. Conservation of cetaceans in Gambia and Senegal 1999–2001, and status of the Atlantic humpback dolphin. UNEP/CMS [United Nations Environment Programme/Convention on Migratory Species] Secretariat, Bonn, Germany.
Van Waerebeek K, Ofori-Danson PK. 1999. A first checklist of cetaceans off Ghana, Gulf of Guinea, and a shore-based survey of interactions with coastal fisheries. Paper SC/51/SM35, 51st Annual Meeting of the IWC Scientific Committee, May 1999, Grenada [available from the Secretariat of the International Whaling Commission, Cambridge, UK].
Van Waerebeek K, Ofori-Danson PK, Debrah J. 2009. The cetaceans of Ghana, a validated faunal checklist. West African Journal of Applied Ecology 15: 61–89.
Weir CR. 2008. The distribution and seasonal occurrence of cetaceans off northern Angola. Journal of Cetacean Research and Management 9: 225–239.
Weir CR. 2010. A review of cetacean occurrence in West African waters from the Gulf of Guinea to Angola. Mammal Review 40: 2–39.
Weir CR, Canning S, Hepworth K, Sim I, Stockin KA. 2008. A long-term opportunistic photo-identification study of bottlenose dolphins (Tursiops truncatus) off Aberdeen, United Kingdom: conservation value and limitations. Aquatic Mammals 34: 436–447.
Weir CR, Collins T, Carvalho I, Rosenbaum C. 2010. Killer whales (Orcinus orca) in Angolan and Gulf of Guinea waters, tropical West Africa. Journal of the Marine Biological Association of the United Kingdom 90: 1601–1611.
Weir CR, Pierce GJ. 2012. A review of the human activities impacting cetaceans in the eastern tropical Atlantic. Mammal Review doi:10.1111/j.1365-2907.2012.00222.x.
Wells RS, Scott MD, Irvine AB. 1987. The social structure of free-ranging bottlenose dolphins. In: Genoways HH (ed.), Current mammalogy (Vol. 1). New York: Plenum Press. pp 247–305.
White GC, Garrot RA (eds). 1990. Analysis of wildlife radio-tracking data. New York: Academic Press.
Whitehead H. 2009. SOCPROG programs: analyzing animal social structures. Behavioral Ecology and Sociobiology 63: 765–778.
Würsig B, Jefferson TA. 1990. Methods of photo-identification for small cetaceans. In: Hammond PS, Mizroch SA, Donovan GP (eds), Individual rec ognition of cetaceans: use of photo-identification and other techniques to estimate population param- eters. Cambridge: International Whaling Commission. pp 43–52.
Würsig B, Würsig M. 1977. The photographic determination of group size, composition and stability of coastal porpoises (Tursiops truncatus). Science 198: 755–756.
Youngblood-Coleman D. 2013. Country review: São Tomé and Príncipe. Houston, Texas: CountryWatch, Inc. Available at http://www.countrywatch.com/pdfs/reviews/B44588L5.01b.pdf [accessed April 2013].
Manuscript received February 2013, revised May 2013, accepted September 2013
Dow
nloa
ded
by [
b-on
: Bib
liote
ca d
o co
nhec
imen
to o
nlin
e U
L]
at 0
2:33
26
Dec
embe
r 20
13