Human Interactions with Free-Ranging and Captive Bottlenose Dolphins
Upload
independentCategory
view
0download
0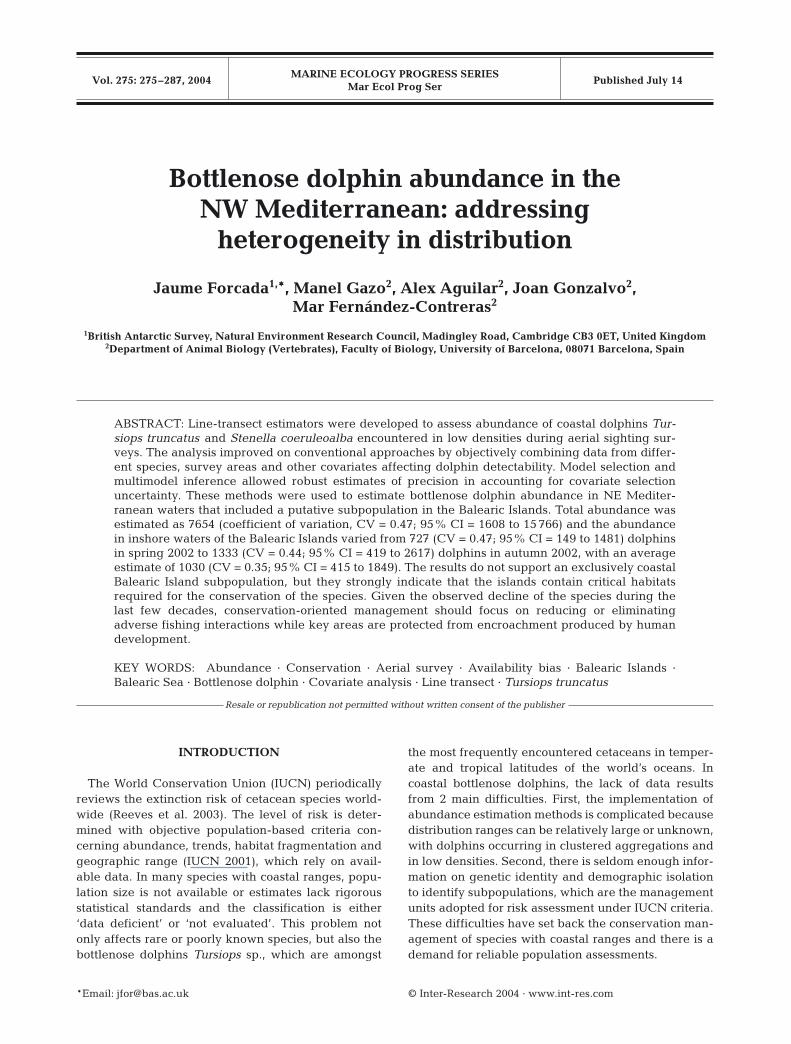
MARINE ECOLOGY PROGRESS SERIESMar Ecol Prog Ser
Vol. 275: 275–287, 2004 Published July 14
INTRODUCTION
The World Conservation Union (IUCN) periodicallyreviews the extinction risk of cetacean species world-wide (Reeves et al. 2003). The level of risk is deter-mined with objective population-based criteria con-cerning abundance, trends, habitat fragmentation andgeographic range (IUCN 2001), which rely on avail-able data. In many species with coastal ranges, popu-lation size is not available or estimates lack rigorousstatistical standards and the classification is either‘data deficient’ or ‘not evaluated’. This problem notonly affects rare or poorly known species, but also thebottlenose dolphins Tursiops sp., which are amongst
the most frequently encountered cetaceans in temper-ate and tropical latitudes of the world’s oceans. Incoastal bottlenose dolphins, the lack of data resultsfrom 2 main difficulties. First, the implementation ofabundance estimation methods is complicated becausedistribution ranges can be relatively large or unknown,with dolphins occurring in clustered aggregations andin low densities. Second, there is seldom enough infor-mation on genetic identity and demographic isolationto identify subpopulations, which are the managementunits adopted for risk assessment under IUCN criteria.These difficulties have set back the conservation man-agement of species with coastal ranges and there is ademand for reliable population assessments.
© Inter-Research 2004 · www.int-res.com*Email: [email protected]
Bottlenose dolphin abundance in the NW Mediterranean: addressing
heterogeneity in distribution
Jaume Forcada1,*, Manel Gazo2, Alex Aguilar2, Joan Gonzalvo2, Mar Fernández-Contreras2
1British Antarctic Survey, Natural Environment Research Council, Madingley Road, Cambridge CB3 0ET, United Kingdom2Department of Animal Biology (Vertebrates), Faculty of Biology, University of Barcelona, 08071 Barcelona, Spain
ABSTRACT: Line-transect estimators were developed to assess abundance of coastal dolphins Tur-siops truncatus and Stenella coeruleoalba encountered in low densities during aerial sighting sur-veys. The analysis improved on conventional approaches by objectively combining data from differ-ent species, survey areas and other covariates affecting dolphin detectability. Model selection andmultimodel inference allowed robust estimates of precision in accounting for covariate selectionuncertainty. These methods were used to estimate bottlenose dolphin abundance in NE Mediter-ranean waters that included a putative subpopulation in the Balearic Islands. Total abundance wasestimated as 7654 (coefficient of variation, CV = 0.47; 95% CI = 1608 to 15 766) and the abundancein inshore waters of the Balearic Islands varied from 727 (CV = 0.47; 95% CI = 149 to 1481) dolphinsin spring 2002 to 1333 (CV = 0.44; 95% CI = 419 to 2617) dolphins in autumn 2002, with an averageestimate of 1030 (CV = 0.35; 95% CI = 415 to 1849). The results do not support an exclusively coastalBalearic Island subpopulation, but they strongly indicate that the islands contain critical habitatsrequired for the conservation of the species. Given the observed decline of the species during thelast few decades, conservation-oriented management should focus on reducing or eliminatingadverse fishing interactions while key areas are protected from encroachment produced by humandevelopment.
KEY WORDS: Abundance · Conservation · Aerial survey · Availability bias · Balearic Islands ·Balearic Sea · Bottlenose dolphin · Covariate analysis · Line transect · Tursiops truncatus
Resale or republication not permitted without written consent of the publisher

Mar Ecol Prog Ser 275: 275–287, 2004
The common bottlenose dolphin Tursiops truncatusoccurs in populations that range in far offshore watersand others that are mostly or exclusively coastal, alongthe continents and around islands. In coastal popula-tions, bottlenose dolphins live in a variety of habitatsincluding bays, lagoons, estuaries and lower reaches ofrivers (Wells & Scott 2002). Because of this proximity toland, many population assessments are based on amark–recapture analysis of photo-identification data(e.g. Wells & Scott 1990, Williams et al. 1993, Wilson etal. 1999). However, those assessments only refer tophoto-identified populations, which may not be sub-populations in the IUCN sense (e.g. Hansen & Defran1990, Carretta et al. 1998, Fortuna et al. 2000). Coastalbottlenose dolphins have seasonal migrations, year-around home ranges, periodic residency and acombination of occasional long-range movements andrepeated local residency (cf. Wells & Scott 2002).
Line-transect methods (Buckland et al. 2001) via aer-ial sighting surveys provide a way of efficiently sam-pling coastal cetaceans. A small aircraft can be used tosample the coastal ranges where a subpopulation ofinterest is known to occur, and also sample peripheralareas buffering the subpopulation during seasonalmovements. However, when subpopulations are smalland distributions are clustered, aerial sighting surveysmay only encounter a few groups. In this situation,conventional methods may not produce accurate andprecise abundance estimates.
This article describes the implementation of line-transect estimators for aerial survey data that can com-bine in a flexible and objective way sightings of multi-ple species, geographic areas, seasons and sightingconditions to estimate abundance when sample size issmall. These estimators were applied to the study ofthe bottlenose dolphin in the Balearic Islands, a puta-tive subpopulation with seasonal movements and aprobable exchange of individuals with a larger popula-tion in the Balearic Sea, NW Mediterranean. We de-scribe the large-to-local scale survey design requiredto effectively account for the distribution range andseasonal changes of this subpopulation.
The analysis was motivated by the increasing expo-sure of bottlenose dolphins to human impact in theMediterranean Sea. During the last few decades,adverse interactions with fisheries, prey depletion andpollution have severely reduced the size and geo-graphical range of populations (Notarbartolo di Sciaraet al. 2002). As a consequence, the species is currentlyconsidered as deserving ‘special interest for conserva-tion’ under the European Union’s habitats directive.Moreover, the current IUCN conservation action planfor cetaceans has strongly recommended the estima-tion of bottlenose dolphin subpopulation sizes in theMediterranean Sea (Reeves et al. 2003). The present
paper responds to this recommendation with the firstcomprehensive assessment of the distribution andabundance of bottlenose dolphins in the BalearicIslands and adjacent waters, a putative subpopulationconsidered to be among those best preserved in theSpanish Mediterranean (Blanco & González 1992). Inaddition, it provides new analytical tools to enable sim-ilar exercises in other regions and species.
MATERIALS AND METHODS
Study area and allocation of survey effort. The studyarea was delimited by the Spanish/French border in thenorth, the offshore waters of the Gulf of Valencia in thesouth, the waters off eastern Minorca in the east and themainland in the west. The study was on 2 differentscales: a larger scale comprising the whole area (Fig. 1),and a smaller scale in regions where previous informa-tion suggested that local bottlenose dolphin subpopula-tions exist: the Balearic Islands and Cape Creus.
276
-1 0 1 2 3 4 5
38
39
40
41
42
43
C
A1 A2
B1B4
B2B3
Gulf ofValencia
Balearic Sea
Cape of Creus
Balearic Islands
Vale
ncia
Catalonia
Mediterranean Sea
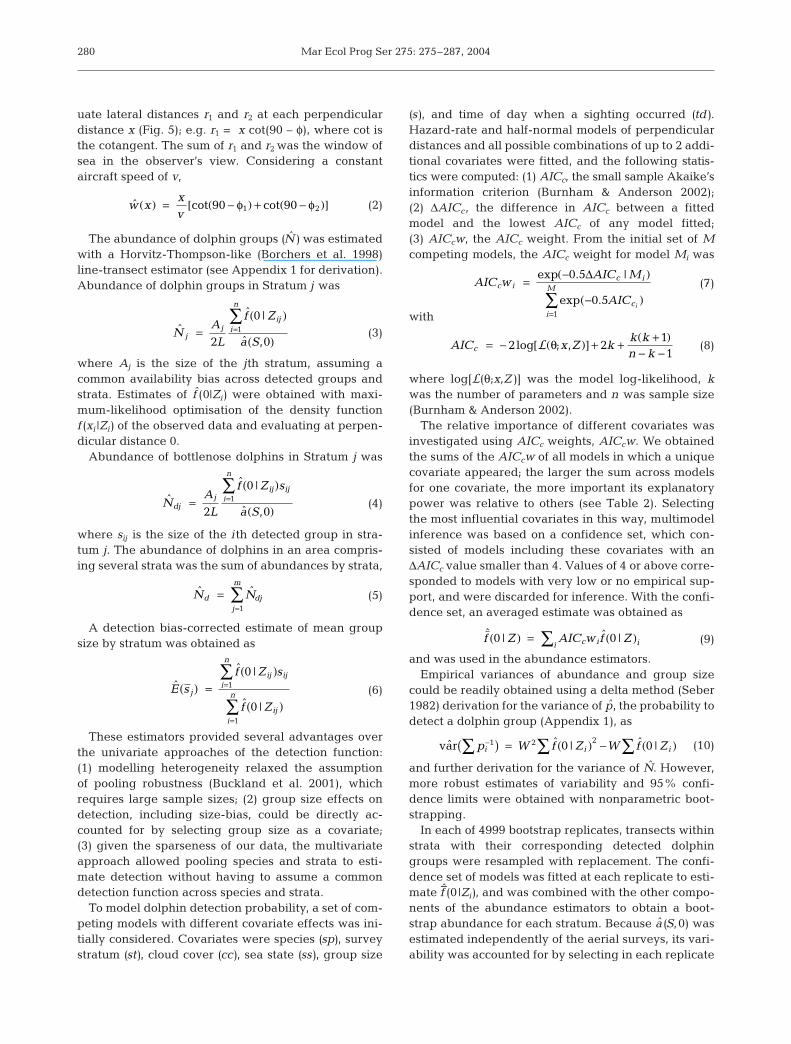
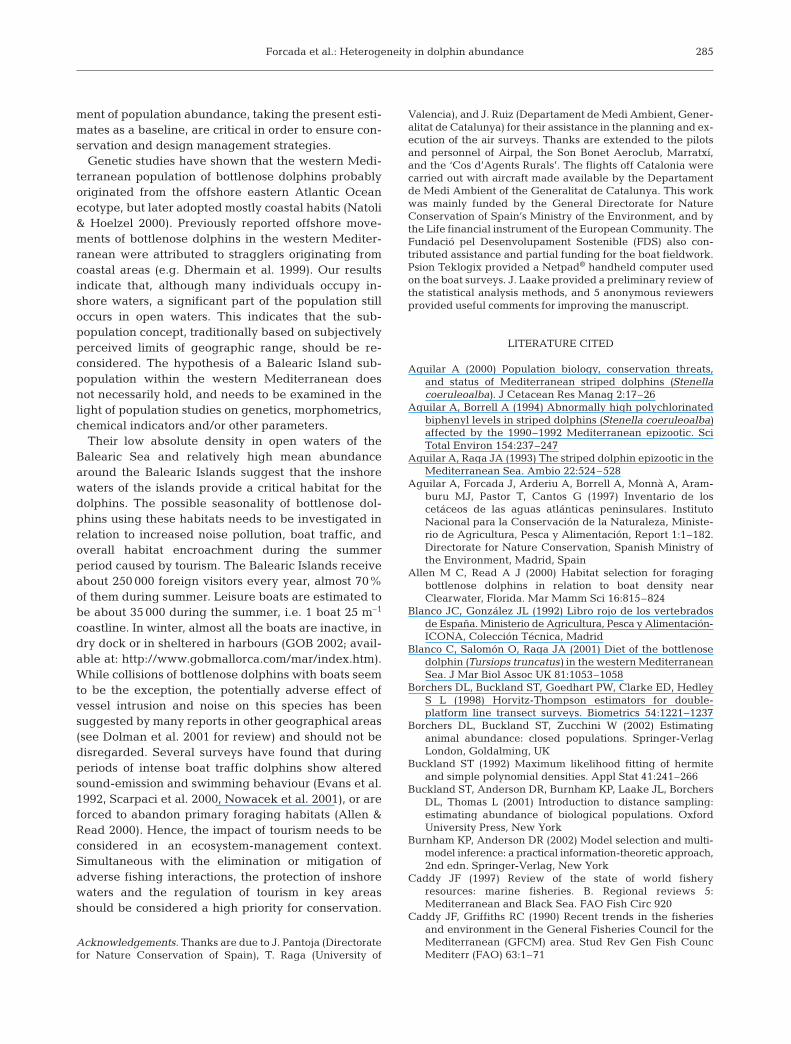
Fig. 1. Area surveyed, showing geographic strata delimitedby continuous lines. Horizontal and vertical axes are degreesand minutes of latitude and longitude respectively. Positivelatitudes are North, positive longitudes are East. A1: coastalCatalonia; A2: offshore Balearic Islands; B1 to B3: inshoreBalearic Islands; B4: deep waters between 2 Balearic islands
(details in ‘Materials and methods’)
Forcada et al.: Heterogeneity in dolphin abundance
The larger area surveyed was divided into 2 strata,one comprising the coastal waters of Catalonia (Fig. 1:A1), the other the offshore waters of the BalearicIslands (Fig. 1: A2). At a local scale, Cape Creus wastreated as a single stratum, centered at the cape(Fig. 1: C) and extending 25 km into offshore waters.The inshore waters of the Balearic Islands weredivided into 4 strata: B1 comprising the islands of
Eivissa and Formentera, and small neighbouring islets;B2 comprising Majorca and Cabrera, and small islets;B3 comprising Minorca and small islets; B4 comprisingdeep waters between Eivissa and Majorca. The arealsize of each stratum is given in Table 1.
The distribution of transect lines varied with strataaccording to previous knowledge on bottlenose dol-phin density (University of Barcelona unpubl. data).Density was expected to be comparatively low in AreasA1 and A2, and thus low effort relative to area size wasallocated there, in agreement with recommendationson survey design allocation in Buckland et al. (2001). Inour case, including more effort in the large areas withlower density would probably not have resulted inmany more sightings, but in many more logistic con-straints. In contrast, the use of the covariate analysishelped to reduce the heterogeneity arising from differ-ences in detection between geographical strata (seeanalysis methods). Stratum A1 was surveyed twice andStratum A2 once (Fig. 2). Given the anticipated higherconcentration of dolphins in Cape Creus and theinshore waters of the Balearic Islands, effort allocatedwas high relative to area size (Table 1). Surveys ofStrata A1 and A2 were carried out in October 2001.Cape Creus stratum (C: Fig. 3) was surveyed twice, on29 January and 12 February 2002. Strata B1, B2 and B3(Fig. 4) of the Balearic Islands were surveyed twice, inMarch and September 2002.
277
Table 1. Geographic strata, showing effective survey effortas a function of survey replicate. Areas labelled as in Fig. 1;
–: replicates not surveyed
Area Area size Effective effort (km)(km2) Replicate 1 Replicate 2 Mean
A1 24 243.2 0660.3 0650.8 0655.5A2 62 170.7 1329.0 – 1329.0Total A 86 413.9 1989.3 – 1984.6
B1 2903.4 0397.6 0390.9 0394.3B2 6935.7 0762.3 0767.1 0764.7B3 2238.7 0448.0 0440.9 0444.5B4 6580.8 – 0337.6 0337.6Total B 16 658.6 1607.9 1936.5 1772.2
C 1993.5 0303.7 0331.5 0317.6
-1 0 1 2 3 4 538
39
40
41
42
43
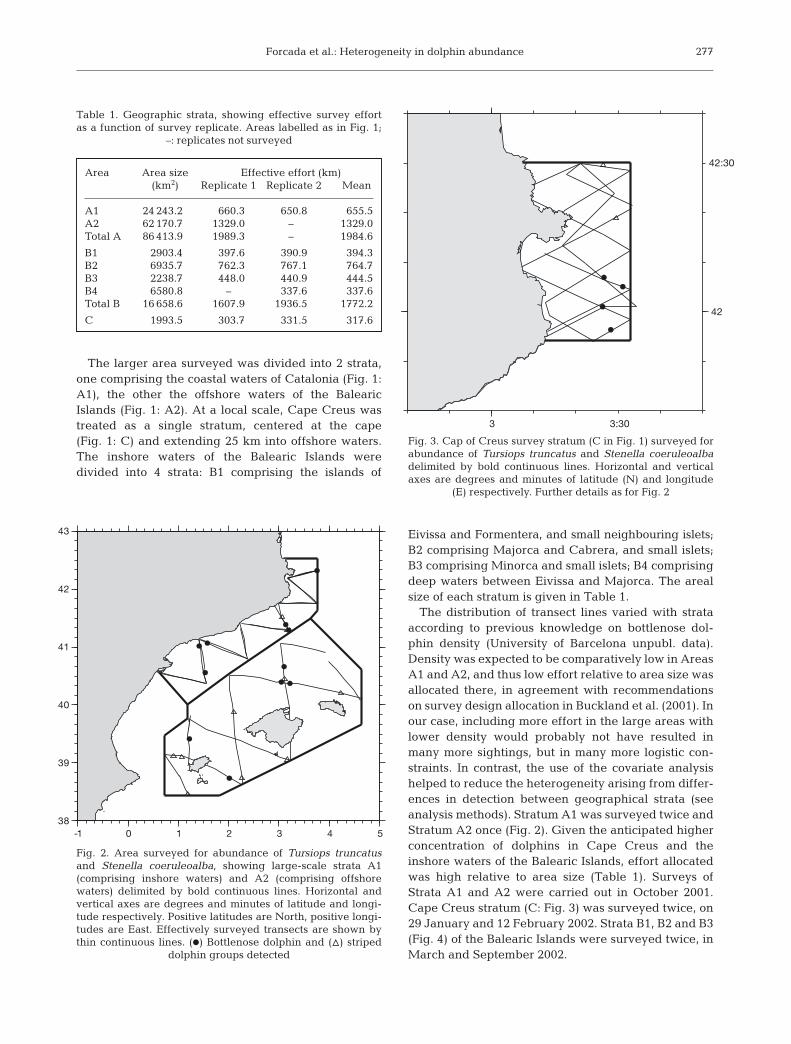
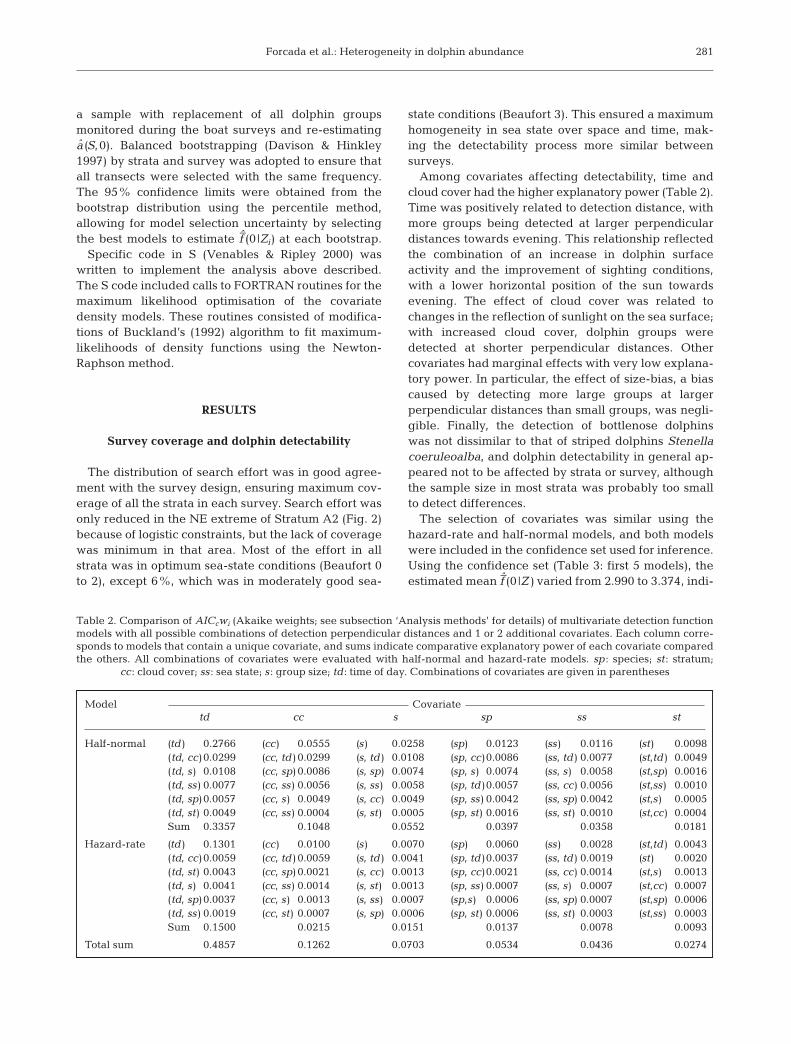
Fig. 2. Area surveyed for abundance of Tursiops truncatusand Stenella coeruleoalba, showing large-scale strata A1(comprising inshore waters) and A2 (comprising offshorewaters) delimited by bold continuous lines. Horizontal andvertical axes are degrees and minutes of latitude and longi-tude respectively. Positive latitudes are North, positive longi-tudes are East. Effectively surveyed transects are shown bythin continuous lines. (d) Bottlenose dolphin and (n) striped
dolphin groups detected
3 3:30
42
42:30
Fig. 3. Cap of Creus survey stratum (C in Fig. 1) surveyed forabundance of Tursiops truncatus and Stenella coeruleoalbadelimited by bold continuous lines. Horizontal and verticalaxes are degrees and minutes of latitude (N) and longitude
(E) respectively. Further details as for Fig. 2
Mar Ecol Prog Ser 275: 275–287, 2004
Aerial survey procedures. The survey platform wasa single-engine high-wing aircraft (Cessna-172). Sur-veys were flown at 150 m altitude and an averagespeed of 150 km h–1, and 2 observers (the samethroughout the survey) searched for dolphins from theright and left rear windows. The observers had a max-imum down-angle from the head position of 75° belowthe horizontal. This produced a blind spot beneath theaircraft of 40 m on each side of the transect line. Themeasured maximum horizontal scan field was from40 to 145°, with 0° being dead ahead and 90° perpen-dicular to the transect line. The observers’ view was acircular sector defined by this horizontal scan field anda maximum perpendicular distance, x (Fig. 5).
Navigation data (speed, altitude and GPS position)and observation conditions (cloud coverage, and seastate measured by Beaufort scale) were recorded every10 min. Surveys were limited to optimum sea condi-
tions, never exceeding Sea State 3, with atotal distribution of effort of 65% in Beau-fort 0 to 1, 29% at Beaufort 2, and 6% atBeaufort 3. At each sighting of a dolphingroup, the time, GPS position and obser-vation conditions were noted, and the per-pendicular distance (x) from the transectline to the encountered group was mea-sured. Perpendicular distance was cal-culated from the aircraft altitude (H) andthe angle (ϕ) to each dolphin group asx = H tan(90 – ϕ); ϕ was measured with aclinometer (Suunto® PM-5/360PC) whenthe group was abeam of the aircraft. Afternoting perpendicular distance, the aircraftcircled around the group to confirm spe-cies and estimate group size, and thenreturned immediately to the transect line.
Small-boat procedures. Aerial surveysare affected by visibility bias, caused byundercounting animals missed becausethey are diving (availability bias), and byfactors affecting perception (perceptionbias), such as cloud cover, sea state orobserver fatigue (Laake et al. 1997 andreferences therein). To address availabil-ity bias, data on dive and surface timeswere collected during boat surveys tostudy bottlenose dolphin distribution andmovements around the Balearic Islands, inJune 2003. Surveys were conducted by 3researchers from a 6.8 m long inflatableboat with a fibreglass hull (SACS-Ghost)equipped with a Yamaha 4-stroke 115 HPoutboard engine. The data collectedconsisted of surface interval, ventilationfrequency, and dive time of different
individuals from 12 different groups. According to thedefinition of detectability of groups (see following
278
39
40
1 2 3 4 5
39
40
A
B
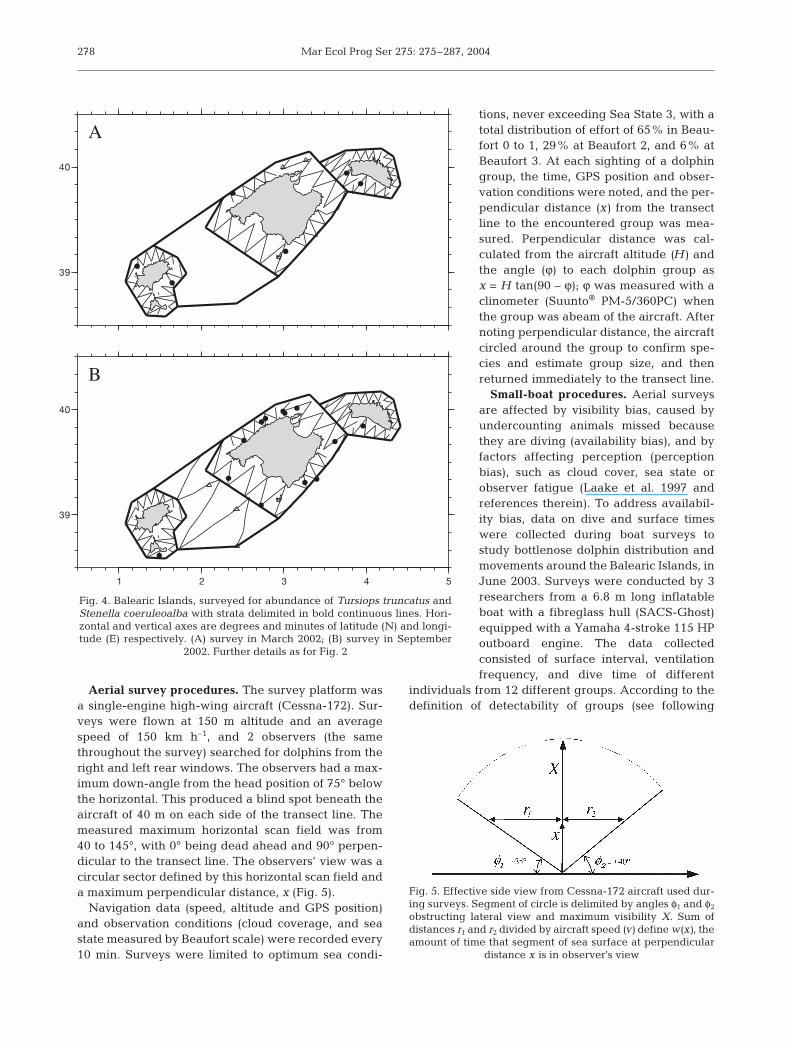
Fig. 4. Balearic Islands, surveyed for abundance of Tursiops truncatus andStenella coeruleoalba with strata delimited in bold continuous lines. Hori-zontal and vertical axes are degrees and minutes of latitude (N) and longi-tude (E) respectively. (A) survey in March 2002; (B) survey in September
2002. Further details as for Fig. 2
Fig. 5. Effective side view from Cessna-172 aircraft used dur-ing surveys. Segment of circle is delimited by angles φ1 and φ2
obstructing lateral view and maximum visibility X. Sum ofdistances r1 and r2 divided by aircraft speed (v) define w(x), theamount of time that segment of sea surface at perpendicular
distance x is in observer’s view

Forcada et al.: Heterogeneity in dolphin abundance
subsection), a group was detected when 1 or moredolphins in the group were at the surface. Therefore,in agreement with Laake et al. (1997), the length oftime the dolphin groups were at or near the surfacewas measured by combining all intervals with surfac-ings of 1 or more dolphins less than 30 s apart as a sur-face interval, and longer intervals, with all dolphinsunderwater, as dives. To determine these periods, thegroups were closely followed for periods lasting 30 minto nearly 4 h. Total observation time was 18 h 05 min.
Analysis methods. Imperfect (obstructed) verticalvisibility invalidated the assumption of perfect detec-tion of non-diving groups on the transect line, i.e.g (0) = 1; g (0) is the probability of detecting a group onthe transect line. To solve this problem, univariatedetection-function models were fitted to the perpen-dicular distances of all dolphin groups detected. A haz-ard-rate and a half-normal model of the perpendiculardistance probability density, f (x), showed a consider-able shoulder for the frequency counts of small dis-tances after subtracting values below 100 m (Fig. 6). Asensitivity analysis of the estimated density functionindicated that this was an appropriate left-truncationdistance, and it was thus adopted in further analyses(see Buckland et al. 2001 for details on left-truncation).
The lack of 2 different teams of aerial observers sur-veying simultaneously but independently precludedany experiment to estimate g(0) as affected by percep-tion bias. This led to the additional assumption of per-
fect detection of available (non-diving)dolphin groups at a left-truncationdistance of 100 m. Under this assump-tion, heterogeneity due to perceptionwas investigated with multivariatemodels of the observed detection dis-tances and additional covariates.
Following Laake et al. (1997), atan observed perpendicular distancex, dolphin detection was defined bythe function g(x |S,Z), conditional onthe event S that was the occurrence of1 or more dolphins in a group at ornear the surface, and additional per-ception covariates Z (see below). Dol-phin availability, a(S,x), was definedas the probability that a dolphingroup at perpendicular distance xwas at the surface and within theobserver’s field of view. From this for-mulation, it follows that detectionprobability at perpendicular distancex, given a vector of covariates Z, isg(x |Z) = g(x |S,Z)a(S,x). Appendix 1gives the derivation applied to ouraerial surveys and estimations.
Availability was modelled following Laake et al.(1997), with a(S,x) depending on bottlenose dolphinsurfacing behaviour and on the amount of time that theregion of sea visible from the aircraft window at eachperpendicular distance x was in the observer’s view,w(x). The model described the surfacing and divingbehaviour of bottlenose dolphins as a 2-state continu-ous-time Markov process. A surfacing interval was thelength of time that 1 or more dolphins in a group wereat or near the surface, and was followed by a divinginterval, in which dolphins were below the surface andremained undetectable. The model described a sur-face-dive interval with the sum of 2 independent expo-nential random variables, λ and κ, that were the rateparameters of the length of dive and length of surfac-ing distribution respectively. We used the most generalform of Laake et al.’s (1997) model,
(1)
where E(sf)�[E(sf) + E(d)] was evaluated with a ratioestimator of length of time at the surface and total timeobserved, and [E(sf) + E(d)] was the total time ob-served divided by the number of monitored surface-diving cycles.
The term w (x) was estimated in consideration of theside view from the Cessna-172 used during the survey,which was described by the measured lateral obstruc-tion angles φ1 and φ2. These angles were used to eval-
ˆ ,
ˆ ˆ .a S x
E sfE sf E d
w x w x E dE s E d
( ) =( )
( ) + ( )+
( ) − ( ) ( )( ) + ( )
−2 10 5
279
Fig. 6. Tursiops truncatus and Stenella coeruleoalba. Fit of univariate hazard-rateand half-normal models of detection function to histogram of perpendicular dis-tances at which dolphin groups were detected. Distances, in hundreds of meters,were left-truncated at 100 m and right-truncated at 500 m. Data comprise allbottlenose and striped dolphin group sightings detected during the differentsurveys. Frequency group counts above histograms correspond to all species
together, with counts for bottlenose dolphins in parentheses
Mar Ecol Prog Ser 275: 275–287, 2004
uate lateral distances r1 and r2 at each perpendiculardistance x (Fig. 5); e.g. r1 = x cot(90 – φ), where cot isthe cotangent. The sum of r1 and r2 was the window ofsea in the observer’s view. Considering a constantaircraft speed of v,
(2)
The abundance of dolphin groups (N) was estimatedwith a Horvitz-Thompson-like (Borchers et al. 1998)line-transect estimator (see Appendix 1 for derivation).Abundance of dolphin groups in Stratum j was
(3)
where Aj is the size of the jth stratum, assuming acommon availability bias across detected groups andstrata. Estimates of f (0|Zi) were obtained with maxi-mum-likelihood optimisation of the density functionf (xi |Zi) of the observed data and evaluating at perpen-dicular distance 0.
Abundance of bottlenose dolphins in Stratum j was
(4)
where sij is the size of the i th detected group in stra-tum j. The abundance of dolphins in an area compris-ing several strata was the sum of abundances by strata,
(5)
A detection bias-corrected estimate of mean groupsize by stratum was obtained as
(6)
These estimators provided several advantages overthe univariate approaches of the detection function:(1) modelling heterogeneity relaxed the assumptionof pooling robustness (Buckland et al. 2001), whichrequires large sample sizes; (2) group size effects ondetection, including size-bias, could be directly ac-counted for by selecting group size as a covariate;(3) given the sparseness of our data, the multivariateapproach allowed pooling species and strata to esti-mate detection without having to assume a commondetection function across species and strata.
To model dolphin detection probability, a set of com-peting models with different covariate effects was ini-tially considered. Covariates were species (sp), surveystratum (st), cloud cover (cc), sea state (ss), group size
(s), and time of day when a sighting occurred (td).Hazard-rate and half-normal models of perpendiculardistances and all possible combinations of up to 2 addi-tional covariates were fitted, and the following statis-tics were computed: (1) AICc, the small sample Akaike’sinformation criterion (Burnham & Anderson 2002);(2) ∆AICc, the difference in AICc between a fittedmodel and the lowest AICc of any model fitted;(3) AICcw, the AICc weight. From the initial set of Mcompeting models, the AICc weight for model Mi was
(7)
with
(8)
where log[L(θ;x,Z)] was the model log-likelihood, kwas the number of parameters and n was sample size(Burnham & Anderson 2002).
The relative importance of different covariates wasinvestigated using AICc weights, AICcw. We obtainedthe sums of the AICcw of all models in which a uniquecovariate appeared; the larger the sum across modelsfor one covariate, the more important its explanatorypower was relative to others (see Table 2). Selectingthe most influential covariates in this way, multimodelinference was based on a confidence set, which con-sisted of models including these covariates with an∆AICc value smaller than 4. Values of 4 or above corre-sponded to models with very low or no empirical sup-port, and were discarded for inference. With the confi-dence set, an averaged estimate was obtained as
(9)
and was used in the abundance estimators.Empirical variances of abundance and group size
could be readily obtained using a delta method (Seber1982) derivation for the variance of p, the probability todetect a dolphin group (Appendix 1), as
(10)
and further derivation for the variance of N. However,more robust estimates of variability and 95% confi-dence limits were obtained with nonparametric boot-strapping.
In each of 4999 bootstrap replicates, transects withinstrata with their corresponding detected dolphingroups were resampled with replacement. The confi-dence set of models was fitted at each replicate to esti-mate f–(0 |Zi), and was combined with the other compo-nents of the abundance estimators to obtain a boot-strap abundance for each stratum. Because a (S,0) wasestimated independently of the aerial surveys, its vari-ability was accounted for by selecting in each replicate
var ˆ | ˆ |p W f Z W f Zi i i−∑ ∑ ∑( ) = ( ) − ( )1 2 20 0
ˆ | ˆ |f Z AIC w f Zc i ii
0 0( ) = ( )∑
AIC x Z k
k kn kc = − ( )[ ] + +
+( )− −
2 211
log ; ,L θ
AIC wAIC M
AICc i
c i
ci
M
i
=−( )
−( )=∑
exp . |
exp .
0 5
0 51
∆
ˆ
ˆ |
ˆ |
E s
f Z s
f Zj
ij iji
n
iji
n( ) =
( )
( )
=
=
∑
∑
0
0
1
1
ˆ ˆN Nd djj
m
==∑
1
ˆ
ˆ |
ˆ ,N
A
L
f Z s
a Sdj
jij ij
i
n
=( )
( )=∑
2
0
01
ˆ
ˆ |
ˆ ,N
A
L
f Z
a Sj
jij
i
n
=( )
( )=∑
2
0
01
ˆ cot cotw x
xv
( ) = −( ) + −( )[ ]90 901 2φ φ
280
Forcada et al.: Heterogeneity in dolphin abundance
a sample with replacement of all dolphin groupsmonitored during the boat surveys and re-estimatinga (S,0). Balanced bootstrapping (Davison & Hinkley1997) by strata and survey was adopted to ensure thatall transects were selected with the same frequency.The 95% confidence limits were obtained from thebootstrap distribution using the percentile method,allowing for model selection uncertainty by selectingthe best models to estimate f–(0 |Zi) at each bootstrap.
Specific code in S (Venables & Ripley 2000) waswritten to implement the analysis above described.The S code included calls to FORTRAN routines for themaximum likelihood optimisation of the covariatedensity models. These routines consisted of modifica-tions of Buckland’s (1992) algorithm to fit maximum-likelihoods of density functions using the Newton-Raphson method.
RESULTS
Survey coverage and dolphin detectability
The distribution of search effort was in good agree-ment with the survey design, ensuring maximum cov-erage of all the strata in each survey. Search effort wasonly reduced in the NE extreme of Stratum A2 (Fig. 2)because of logistic constraints, but the lack of coveragewas minimum in that area. Most of the effort in allstrata was in optimum sea-state conditions (Beaufort 0to 2), except 6%, which was in moderately good sea-
state conditions (Beaufort 3). This ensured a maximumhomogeneity in sea state over space and time, mak-ing the detectability process more similar betweensurveys.
Among covariates affecting detectability, time andcloud cover had the higher explanatory power (Table 2).Time was positively related to detection distance, withmore groups being detected at larger perpendiculardistances towards evening. This relationship reflectedthe combination of an increase in dolphin surfaceactivity and the improvement of sighting conditions,with a lower horizontal position of the sun towardsevening. The effect of cloud cover was related tochanges in the reflection of sunlight on the sea surface;with increased cloud cover, dolphin groups weredetected at shorter perpendicular distances. Othercovariates had marginal effects with very low explana-tory power. In particular, the effect of size-bias, a biascaused by detecting more large groups at largerperpendicular distances than small groups, was negli-gible. Finally, the detection of bottlenose dolphinswas not dissimilar to that of striped dolphins Stenellacoeruleoalba, and dolphin detectability in general ap-peared not to be affected by strata or survey, althoughthe sample size in most strata was probably too smallto detect differences.
The selection of covariates was similar using thehazard-rate and half-normal models, and both modelswere included in the confidence set used for inference.Using the confidence set (Table 3: first 5 models), theestimated mean f–(0 |Z) varied from 2.990 to 3.374, indi-
281
Table 2. Comparison of AICcwi (Akaike weights; see subsection ‘Analysis methods’ for details) of multivariate detection functionmodels with all possible combinations of detection perpendicular distances and 1 or 2 additional covariates. Each column corre-sponds to models that contain a unique covariate, and sums indicate comparative explanatory power of each covariate comparedthe others. All combinations of covariates were evaluated with half-normal and hazard-rate models. sp: species; st : stratum;
cc : cloud cover; ss: sea state; s : group size; td : time of day. Combinations of covariates are given in parentheses
Model Covariatetd cc s sp ss st
Half-normal (td) 0.2766 (cc) 0.0555 (s) 0.0258 (sp) 0.0123 (ss) 0.0116 (st) 0.0098 (td, cc) 0.0299 (cc, td) 0.0299 (s, td) 0.0108 (sp, cc)0.0086 (ss, td) 0.0077 (st,td) 0.0049 (td, s) 0.0108 (cc, sp) 0.0086 (s, sp) 0.0074 (sp, s) 0.0074 (ss, s) 0.0058 (st,sp) 0.0016 (td, ss) 0.0077 (cc, ss) 0.0056 (s, ss) 0.0058 (sp, td)0.0057 (ss, cc) 0.0056 (st,ss) 0.0010 (td, sp) 0.0057 (cc, s) 0.0049 (s, cc) 0.0049 (sp, ss) 0.0042 (ss, sp) 0.0042 (st,s) 0.0005 (td, st) 0.0049 (cc, ss) 0.0004 (s, st) 0.0005 (sp, st) 0.0016 (ss, st) 0.0010 (st,cc) 0.0004 Sum 0.3357 0.1048 0.0552 0.0397 0.0358 0.0181
Hazard-rate (td) 0.1301 (cc) 0.0100 (s) 0.0070 (sp) 0.0060 (ss) 0.0028 (st,td) 0.0043 (td, cc) 0.0059 (cc, td) 0.0059 (s, td) 0.0041 (sp, td)0.0037 (ss, td) 0.0019 (st) 0.0020 (td, st) 0.0043 (cc, sp) 0.0021 (s, cc) 0.0013 (sp, cc)0.0021 (ss, cc) 0.0014 (st,s) 0.0013 (td, s) 0.0041 (cc, ss) 0.0014 (s, st) 0.0013 (sp, ss) 0.0007 (ss, s) 0.0007 (st,cc) 0.0007 (td, sp) 0.0037 (cc, s) 0.0013 (s, ss) 0.0007 (sp,s) 0.0006 (ss, sp) 0.0007 (st,sp) 0.0006 (td, ss) 0.0019 (cc, st) 0.0007 (s, sp) 0.0006 (sp, st) 0.0006 (ss, st) 0.0003 (st,ss) 0.0003Sum 0.1500 0.0215 0.0151 0.0137 0.0078 0.0093
Total sum 0.4857 0.1262 0.0703 0.0534 0.0436 0.0274

Mar Ecol Prog Ser 275: 275–287, 2004
cating variability due to covariate effects, and espe-cially due to time. The mean unconditional f–(0 |Z) forbottlenose dolphins was estimated as 3.877 (CV = 0.19;95% CI = 2.333 – 5.219), which corresponded to aneffective strip half-width of 260 m. The mean condi-tional (using only the best model) f (0 |Z) was estimatedas 3.386 (CV = 0.08; 95% CI = 2.704 – 3.787), and wasnot very different from the unconditional estimate. Incontrast, high differences in variability indicated alarge uncertainty due to model selection, mostly drivenby covariate effects but also by the selection ofcompeting parametric models.
The mean proportion of time spent by any bottlenosedolphin group at the surface E(sf)�[E(sf) + E(d)] (Eq. 1)was estimated as 0.77 (SE = 0.10). The average surfaceinterval was 231.3 s (SE = 29.4), and the average diveinterval was 68.7 s (SE = 8.7). The availability bias atperfect detection distance a(S,0) was estimated as0.7784 (CV = 0.04; 95% CI = 0.721 – 0.825), and com-prised a very small component of the variability in theabundance estimate. This estimate indicated that, onaverage, more than 22% of the bottlenose dolphingroups were diving and remained undetected while theaircraft flew over.
Distribution of detected dolphin groups and group-size estimates
Bottlenose and striped dolphins were the mostcommonly encountered species and were presentthroughout the surveyed area. Neither of the 2species was abundant, and their distributionsoverlapped in offshore waters (Fig. 2).
The surveys of Cape Creus (Stratum C) onlyresulted in 3 sightings of bottlenose dolphingroups and an additional sighting of unidentifieddelphinids, which were likely to be bottlenosedolphins (Fig. 3).
The surveys in the inshore waters of the BalearicIslands (Strata B1, B2 and B3) produced very differ-ent results in the various seasons. In March 2002,the number of confirmed sightings was only 6, i.e.half the number in September 2002, when 13 weresighted. The homogeneity in sighting conditionsand the fact that the same observers and platformswere used in both surveys suggested seasonalsighting patterns. The differences in sighting num-bers between seasons could reflect animal move-ment around the Balearic Islands, and a likely in-shore–offshore movement pattern. Finally, theabsence of bottlenose dolphin sightings for StratumB4 confirmed its low density in deep offshore waterswhere striped dolphins, an offshore species in theMediterranean (Forcada et al. 1994, Aguilar 2000),were more likely to occur (Fig. 4B).
Bottlenose dolphins were detected mostly ingroups of 1 to 10 individuals, and all groups weresmaller than 15, except for 1 group of 29 dolphins.Mean group size was 7, and the lack of detectabilitybias made the mean very similar to the bias-correctedmean group size, estimated as 6.90 (CV = 0.15;95% CI = 5.11 – 9.37) for offshore waters of the BalearicSea (Stratum A2), and 6.36 (CV = 0.20; 95% CI =4.14 – 9.11) for the inshore Balearic Islands (Strata B1,B2 and B3). In contrast, group sizes of striped dolphinsranged from 1 to 60, with most groups comprising 5 to20 dolphins, a mean of 16.11, and a bias-correctedmean group size estimate of 16.32 (CV = 0.23;95% CI = 9.98 – 24.99) for Strata A.
Abundance estimates
Bottlenose dolphin abundance estimates were basedon confirmed sightings, which were scarce in all sur-veys and strata, regardless of their areal size. Pointestimates, coefficients of variation and 95% confidencelimits are summarised in Table 4. On the Catalan coast(Stratum A1) and in the offshore Balearic Sea (StratumA2) mean density was 0.88 (0.19 – 1.82) bottlenose dol-
282
Table 3. Summary of detection-function model fits with AICc,∆AICc and AICcw (see subsection ‘Analysis methods’ for Akaikestatistic definitions), and estimated mean f– (0|Zi). For brevity, onlymodels with AICcw above 0.005 are shown, although all possiblemodels with combinations of perpendicular distances and up to 2additional covariates were considered (Table 2). Each possiblecombination of covariates was fitted with the half-normal and haz-ard-rate models. Multimodel inference was based on a confidenceset consisting of models with ∆AICc values <4. sp: species; st: stra-tum; cc: cloud cove; ss: sea state; s: group size; td: time of day;
x: perpendicular distance
Model AICc ∆AICc AICcw f–(0|Zi)
Half-normal (x, td) 116.7387 0 0.2766 3.3743Half-normal (x) 116.9686 0.2299 0.2466 3.1712Hazard-rate (x, td) 118.2482 1.5094 0.1301 3.3739Hazard-rate (x) 119.3391 2.6004 0.0754 3.1572Half-normal (x, cc) 119.9526 3.2140 0.0555 2.9902Half-normal (x, td, cc) 121.1853 4.4466 0.0299 3.2717Half-normal (x, s) 121.4824 4.7437 0.0258 3.0353Half-normal (x, sp) 122.9645 6.2258 0.0123 3.0012Half-normal (x, ss) 123.0876 6.3489 0.0116 2.8176Half-normal (x, td, s) 123.2253 6.4866 0.0108 3.2682Hazard-rate (x, cc) 123.3839 6.6453 0.0010 2.4701Half-normal (x, st) 123.4158 6.6771 0.0098 3.0014Half-normal (x, cc, s) 123.6866 6.9479 0.0086 3.2199Half-normal (x, td, ss) 123.9037 7.1650 0.0077 3.0313Half-normal (x, s, sp) 123.9727 7.2340 0.0074 2.9585Hazard-rate (x, s) 124.0800 7.3413 0.0070 3.1476Hazard-rate (x, sp) 124.4174 7.6787 0.0060 2.7499Hazard-rate (x, td, cc) 124.4275 7.6888 0.0059 2.9580Half-normal (x, s, ss) 124.4613 7.7226 0.0058 2.8531Half-normal (x, td, sp) 124.5138 7.7751 0.0057 3.2196Half-normal (x, cc, ss) 124.5432 7.8044 0.0056 2.9935
Forcada et al.: Heterogeneity in dolphin abundance
phins every 10 km2. For the Balearic Islands (B1, B2,B3), density was 0.60 (0.12 – 1.23) individuals in spring,and 1.10 (0.35 – 2.17) in autumn, and mean density was0.85 (0.34 – 1.53). The abundance of bottlenose dol-phins in the whole the area surveyed, including theinshore waters of the Balearic Islands, was estimatedas 7654 (CV = 0.47; 95% CI = 1608 – 15766). Theirabundance in inshore waters of the Balearic Islandsvaried from 727 (CV = 0.47; 95% CI = 149 – 1481) dol-phins in spring 2002 to 1333 (CV = 0.44; 95% CI =419 – 2617) dolphins in autumn 2002.
DISCUSSION
Methodological considerations
The use of an aircraft was essential for efficientlysurveying the study area in the shortest possible time.This avoided repeat sightings of the same individuals,which could move between small strata during the sur-vey. The aircraft had limitations in vertical detection,but left-truncation was an effective method of dealingwith the problem of obstructed view, given the largeshoulder in the detection function. However, manysightings were likely to have been missed along thetransect line, reducing the encounter rate and samplesize, and future surveys would greatly benefit froman unobstructed view.
Aerial surveys of cetaceans in other regions haveused visibility (combining availability and perception)correction factors for delphinids, including bottlenosedolphins. Aerial surveys specific for bottlenose dol-phins in tandem aircraft (Carretta et al. 1998) esti-mated a range of visibility bias of 0.446 to 0.735 forgroups of between 1 and 10 bottlenose dolphins, and
between 0.781 and 0.990 for largergroups. For these ranges, the bestestimates were considered to be 0.735for small groups and 0.990 for largegroups. For small groups, like themajority of groups encountered in oursurveys, the availability estimates ofCaretta et al. (1998) were in very goodagreement with those found by us(0.735 versus 0.778), assuming that thecomponent due to perception bias wassmall, i.e. 0.95 to 0.99. If this was thecase, as we assume it was, the bias dueto perception in our estimates waslikely to be very small.
These results highlight the rele-vance of estimating availability bias inaerial sighting surveys of bottlenosedolphins. However, because availabil-
ity is an inverse multiplier in the line-transect abun-dance estimator, resulting abundance estimates aresensitive to this quantity and future analyses will ben-efit from further testing. An ideal test would be the useof alternative approaches such as surveys with aircraftflying in tandem (Carretta et al. 1998, Hiby & Lovell1998), although these methods require large samplesizes for estimation, which would be difficult to obtainin sparse populations such as that in the present study.An alternative could be the use of combined aerial andland-based experiments (Laake et al. 1997), if suchexperiments are feasible in the study areas.
The covariate analysis provided substantial improve-ment by its ability to reduce the heterogeneity associ-ated with the detection process. It helped to avoid theassumption of a common detection function across spe-cies and other factors, which is sometimes required instudies with reduced sample sizes. Other studies oftenconsider post-stratification (Buckland et al. 2001), butare limited by the minimum sample-size requirementsto fit independent detection-function models to datafor different stratification levels. An additional advan-tage of covariate analysis is the possibility of modelselection and multimodel inference of covariate ef-fects, which in our case enabled a robust estimationapproach. Unconditional abundance estimates betterreflected the uncertainty arising from the modellingand the covariate selection processes, and model selec-tion uncertainty was taken into account in the esti-mates of precision. Uncertainty is high when there aremany competing models of very different structurebut good empirical support. Competing models canequally contribute to inference and, as seen in thisstudy, multimodel inference avoids overestimates ofprecision, which may be misleading in future com-parisons or in risk-assessment studies.
283
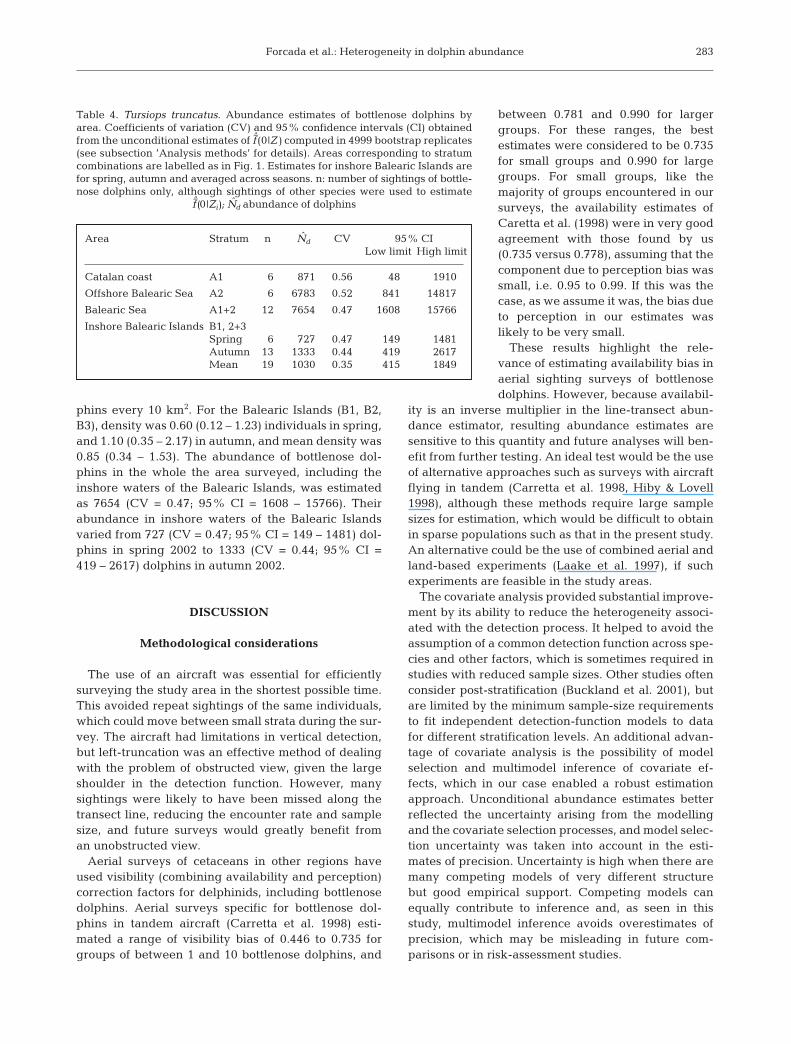
Table 4. Tursiops truncatus. Abundance estimates of bottlenose dolphins byarea. Coefficients of variation (CV) and 95% confidence intervals (CI) obtainedfrom the unconditional estimates of f–(0|Z) computed in 4999 bootstrap replicates(see subsection ’Analysis methods’ for details). Areas corresponding to stratumcombinations are labelled as in Fig. 1. Estimates for inshore Balearic Islands arefor spring, autumn and averaged across seasons. n: number of sightings of bottle-nose dolphins only, although sightings of other species were used to estimate
f–(0|Zi); Nd abundance of dolphins
Area Stratum n Nd CV 95% CILow limit High limit
Catalan coast A1 06 0871 0.56 0048 01910
Offshore Balearic Sea A2 06 6783 0.52 0841 14817
Balearic Sea A1+2 12 7654 0.47 1608 15766
Inshore Balearic Islands B1, 2+3Spring 06 0727 0.47 0149 01481Autumn 13 1333 0.44 0419 02617Mean 19 1030 0.35 0415 01849
Mar Ecol Prog Ser 275: 275–287, 2004
The use of a covariate analysis also has limitationsthat must be considered. Among them are the sam-ple size requirements of covariate effects when theseare defined as multiple levels of a factor. Each levelis an additional parameter to fit in the model optimi-sation and requires more data than a continuouscovariate, which is described by just 1 parameter. Inthis regard, covariate models will benefit fromfurther research in optimisation facilities, but alsofrom larger sample sizes, if at all possible. Anotherlimitation is imposed by the experimental design andthe collection of relevant covariates. A preliminaryassessment of covariate effects is a good way toavoid spurious effects, which may be unwanted forinference. Such an assessment may be useful inselecting the most appropriate covariates to measureduring future surveys.
Bottlenose dolphin abundance estimates
This analysis has produced the first absoluteabundance estimate of bottlenose dolphins in NWMediterranean waters, and constitutes a baselineupon which to assess future changes in their abun-dance around the Balearic Islands. The surveys sug-gested seasonal changes in abundance in coastalwaters of the Balearic Islands, but the seasonal abun-dance estimates were not significantly different.While the number of sightings was low, the highallocation of effort and consistency in observersand good sighting conditions made both surveyshighly comparable. Thus, between-survey differ-ences in abundance were likely to be real, and notjust extremes within the mean range of variability.Because the analysis of the detection function ruledout differences in detection probability between sur-veys, seasonality was the most likely explanationfor such differences. Thus, seasonal fluctuationsshould be further investigated and not initially dis-carded in future studies.
Previous line-transect surveys of the western Medi-terranean (Forcada et al. 1994, 1995, Forcada & Ham-mond 1998) rarely found bottlenose dolphins in pelagicwaters. Most groups occurred in coastal areas of themain insular systems, the Balearic Islands, Corsica,Sardinia, and around small islands near the continent.As in the present surveys, the encounter rate of bot-tlenose dolphin groups was then very low, but surveyeffort was allocated to provide results at a larger scaleand aimed at detecting striped dolphin groups in abasin-wide survey. Although the results betweensurveys are thus difficult to compare, the overall lowdensity of bottlenose dolphins was a common charac-teristic.
Conservation and management implications
Despite the obvious advantages of the use of covari-ate analysis, dolphin groups were rare and the surveysprovided imprecise abundance estimates. This lack ofprecision may hamper the detection of populationtrends in surveys conducted across time. The numberand frequency of future surveys required to detectpopulation trends in the future could be evaluatedwith a power analysis (e.g. Wilson et al. 1999, Forcada2000). However, the limitations imposed by smallsample sizes will remain, regardless of the method.Thus, a precautionary approach for conservationmanagement (e.g. Taylor & Gerrodette 1993) wouldbe most appropriate until the categorisation of riskcan be supported by data on fluctuations, habitatfragmentation and geographic range.
Surveys on fishing interactions suggest that in theBalearic Islands about 30 dolphins are killed everyyear, either by incidental entanglements in fishing netsor by deliberate kills to avoid damage to gear or com-petition for fishing resources (Silvani et al. 1992).When related to the inshore subpopulation, here esti-mated at 727 to 1333 individuals, these figures mayexceed the usual safety limits of acceptable removals,which for dolphin populations are commonly set atabout 1% (International Whaling Commission 1995).However, conflict with fisheries is not the only threat tothe conservation of these species. In 1990–1991, thesympatric population of striped dolphins suffered amorbillivirus epizootic (Aguilar & Raga 1993) that wasclaimed to have been triggered by immunosuppressiveeffects of high levels of organochlorine pollutants, par-ticularly polychlorinated biphenyls, present in theirtissues (Kannan et al. 1993, Aguilar & Borrell 1994).Organochlorine levels in the western Mediterraneanbottlenose dolphins are as high as those in stripeddolphins (Corsolini et al. 1995), and probably abovethreshold levels associated with adverse effects; there-fore potential adverse xenobiotic impacts on pop-ulations cannot be ruled out. Moreover, in the NWMediterranean, bottlenose dolphins base their diet onprey such as hake Merluccius merluccius, conger Con-ger conger and octopus Octopus vulgaris (Blanco etal. 2001) that are commercially exploited or overex-ploited. Fishing is intense throughout the region, andin the last few decades the abundance of several maintarget species have been severely reduced (Caddy &Griffiths 1990, Caddy 1997). The availability of criticaldiet elements is therefore likely to have decreased at acomparable rate. Whatever the role of the differenthuman-related pressures on bottlenose dolphin popu-lations, its significance is unclear. The species hasclearly suffered a sharp decline in the last decades(Aguilar et al. 1997). Monitoring and periodic assess-
284
Forcada et al.: Heterogeneity in dolphin abundance
ment of population abundance, taking the present esti-mates as a baseline, are critical in order to ensure con-servation and design management strategies.
Genetic studies have shown that the western Medi-terranean population of bottlenose dolphins probablyoriginated from the offshore eastern Atlantic Oceanecotype, but later adopted mostly coastal habits (Natoli& Hoelzel 2000). Previously reported offshore move-ments of bottlenose dolphins in the western Mediter-ranean were attributed to stragglers originating fromcoastal areas (e.g. Dhermain et al. 1999). Our resultsindicate that, although many individuals occupy in-shore waters, a significant part of the population stilloccurs in open waters. This indicates that the sub-population concept, traditionally based on subjectivelyperceived limits of geographic range, should be re-considered. The hypothesis of a Balearic Island sub-population within the western Mediterranean doesnot necessarily hold, and needs to be examined in thelight of population studies on genetics, morphometrics,chemical indicators and/or other parameters.
Their low absolute density in open waters of theBalearic Sea and relatively high mean abundancearound the Balearic Islands suggest that the inshorewaters of the islands provide a critical habitat for thedolphins. The possible seasonality of bottlenose dol-phins using these habitats needs to be investigated inrelation to increased noise pollution, boat traffic, andoverall habitat encroachment during the summerperiod caused by tourism. The Balearic Islands receiveabout 250 000 foreign visitors every year, almost 70%of them during summer. Leisure boats are estimated tobe about 35 000 during the summer, i.e. 1 boat 25 m–1
coastline. In winter, almost all the boats are inactive, indry dock or in sheltered in harbours (GOB 2002; avail-able at: http://www.gobmallorca.com/mar/index.htm).While collisions of bottlenose dolphins with boats seemto be the exception, the potentially adverse effect ofvessel intrusion and noise on this species has beensuggested by many reports in other geographical areas(see Dolman et al. 2001 for review) and should not bedisregarded. Several surveys have found that duringperiods of intense boat traffic dolphins show alteredsound-emission and swimming behaviour (Evans et al.1992, Scarpaci et al. 2000, Nowacek et al. 2001), or areforced to abandon primary foraging habitats (Allen &Read 2000). Hence, the impact of tourism needs to beconsidered in an ecosystem-management context.Simultaneous with the elimination or mitigation ofadverse fishing interactions, the protection of inshorewaters and the regulation of tourism in key areasshould be considered a high priority for conservation.
Acknowledgements. Thanks are due to J. Pantoja (Directoratefor Nature Conservation of Spain), T. Raga (University of
Valencia), and J. Ruiz (Departament de Medi Ambient, Gener-alitat de Catalunya) for their assistance in the planning and ex-ecution of the air surveys. Thanks are extended to the pilotsand personnel of Airpal, the Son Bonet Aeroclub, Marratxí,and the ‘Cos d’Agents Rurals’. The flights off Catalonia werecarried out with aircraft made available by the Departamentde Medi Ambient of the Generalitat de Catalunya. This workwas mainly funded by the General Directorate for NatureConservation of Spain’s Ministry of the Environment, and bythe Life financial instrument of the European Community. TheFundació pel Desenvolupament Sostenible (FDS) also con-tributed assistance and partial funding for the boat fieldwork.Psion Teklogix provided a Netpad® handheld computer usedon the boat surveys. J. Laake provided a preliminary review ofthe statistical analysis methods, and 5 anonymous reviewersprovided useful comments for improving the manuscript.
LITERATURE CITED
Aguilar A (2000) Population biology, conservation threats,and status of Mediterranean striped dolphins (Stenellacoeruleoalba). J Cetacean Res Manag 2:17–26
Aguilar A, Borrell A (1994) Abnormally high polychlorinatedbiphenyl levels in striped dolphins (Stenella coeruleoalba)affected by the 1990–1992 Mediterranean epizootic. SciTotal Environ 154:237–247
Aguilar A, Raga JA (1993) The striped dolphin epizootic in theMediterranean Sea. Ambio 22:524–528
Aguilar A, Forcada J, Arderiu A, Borrell A, Monnà A, Aram-buru MJ, Pastor T, Cantos G (1997) Inventario de loscetáceos de las aguas atlánticas peninsulares. InstitutoNacional para la Conservación de la Naturaleza, Ministe-rio de Agricultura, Pesca y Alimentación, Report 1:1–182.Directorate for Nature Conservation, Spanish Ministry ofthe Environment, Madrid, Spain
Allen M C, Read A J (2000) Habitat selection for foragingbottlenose dolphins in relation to boat density nearClearwater, Florida. Mar Mamm Sci 16:815–824
Blanco JC, González JL (1992) Libro rojo de los vertebradosde España. Ministerio de Agricultura, Pesca y Alimentación-ICONA, Colección Técnica, Madrid
Blanco C, Salomón O, Raga JA (2001) Diet of the bottlenosedolphin (Tursiops truncatus) in the western MediterraneanSea. J Mar Biol Assoc UK 81:1053–1058
Borchers DL, Buckland ST, Goedhart PW, Clarke ED, HedleyS L (1998) Horvitz-Thompson estimators for double-platform line transect surveys. Biometrics 54:1221–1237
Borchers DL, Buckland ST, Zucchini W (2002) Estimatinganimal abundance: closed populations. Springer-VerlagLondon, Goldalming, UK
Buckland ST (1992) Maximum likelihood fitting of hermiteand simple polynomial densities. Appl Stat 41:241–266
Buckland ST, Anderson DR, Burnham KP, Laake JL, BorchersDL, Thomas L (2001) Introduction to distance sampling:estimating abundance of biological populations. OxfordUniversity Press, New York
Burnham KP, Anderson DR (2002) Model selection and multi-model inference: a practical information-theoretic approach,2nd edn. Springer-Verlag, New York
Caddy JF (1997) Review of the state of world fisheryresources: marine fisheries. B. Regional reviews 5:Mediterranean and Black Sea. FAO Fish Circ 920
Caddy JF, Griffiths RC (1990) Recent trends in the fisheriesand environment in the General Fisheries Council for theMediterranean (GFCM) area. Stud Rev Gen Fish CouncMediterr (FAO) 63:1–71
285
Mar Ecol Prog Ser 275: 275–287, 2004
Carretta JV, Forney KA, Laake JL (1998) Abundance of south-ern California coastal bottlenose dolphins estimated fromtandem aerial surveys. Mar Mamm Sci 14:655–675
Corsolini S, Focardi S, Kannan K, Tanabe S, Borrell A, Tat-sukawa R (1995) Congener profile and toxicity assessmentof polychlorinated biphenyls in dolphins, sharks and tunacollected from Italian coastal waters. Mar Environ Res 40:33–53
Davison AC, Hinkley DV (1997) Bootstrap methods and theirapplication. Cambridge University Press, Cambridge
Dhermain F, Ripoll T, Bompar JM, David L, Di Méglio N(1999). First evidence of the movement of a bottle-noseddolphin Tursiops truncates, between Corsica and Hyeresarchipelago, south-eastern France. Europ Res Cetaceans13:306
Dolman SJ, Parsons ECM, Simmonds MP (2001) Noise sourcesin the cetacean environment. International WhalingCommission doc SC/54/E7. International Whaling Com-mission, Impington, Cambridge
Evans PGH, Canwell PJ, Lewis E (1992) An experimentalstudy of the effects of pleasure craft noise upon bottle-nosed dolphins in Cardigan Bay, West Wales. Europ ResCetaceans 6:43–46
Forcada J (2000) Can population surveys show if the Mediter-ranean monk seal colony at Cap Blanc is declining inabundance? J Appl Ecol 37:171–181
Forcada J (2002) Multivariate methods for size-dependentdetection in conventional line transect sampling. Adminis-trative Report LJ-02-02, National Marine Fisheries Service,Southwest Fisheries Science Center, La Jolla, CA
Forcada J, Hammond PS (1998) Geographical variation inabundance of striped and common dolphins of the westernMediterranean. J Sea Res 39:313–325
Forcada J, Aguilar A, Hammond PS, Pastor X, Aguilar R(1994) Distribution and numbers of striped dolphins in thewestern Mediterranean Sea after the 1990 epizootic out-break. Mar Mamm Sci 10:137–150
Forcada J, Notarbartolo di Sciara G, Fabbri F (1995) Abun-dance of fin whales and striped dolphins summering in theCorso-Ligurian Basin. Mammalia 59:127–140
Fortuna CM, Wilson B, Wiemann A, Matesic M, Oehen S,Pribanic S, Riva L (2000) How many dolphins are westudying and is our study area big enough? Europ ResCetaceans 14:370–373
Hansen LJ, Defran RH (1990) A comparison of photo-identifi-cation studies of California coastal bottlenose dolphins.Rep Int Whal Comm Spec Issue 12:101–104
Hayes RJ, Buckland ST (1983) Radial-distance models for theline-transect method. Biometrics 39:29–42
Hiby L, Lovell P (1998) Using aircraft in tandem formation toestimate abundance of harbour porpoise. Biometrics 54:1280–1289
International Whaling Commission (1995) Report of the sub-committee on management procedures. Rep Int WhalComm 45:104–119
IUCN (International Union for Conservation of Nature andNatural Resources) (2001) Red list categories. IUCN,Gland, Switzerland
Kannan K, Tanabe S, Borrell A, Aguilar A, Focardi S, Tat-
sukawa R (1993) Isomer-specific analysis and toxic evalu-ation of polychlorinated biphenyls in striped dolphinsaffected by an epizootic in the western MediterraneanSea. Arch Environ Contam Toxicol 25:227–233
Laake J L, Calambokidis J, Osmek S D, Rugh D J (1997) Prob-ability of detecting harbor porpoise from aerial surveys:estimating g(0). J Wildl Manag 61:63–75
Marques FFC (2001) Estimating wildlife distribution andabundance from line transect surveys conducted fromplatforms of opportunity. PhD thesis, University of St.Andrews, St. Andrews, Scotland
Natoli A, Hoelzel A R (2000) Genetic diversity in a Mediter-ranean population of the bottlenose dolphin in a context ofworld-wide phylogeography. Europ Res Cetaceans 14:343
Notarbartolo di Sciara G, Aguilar A, Bearzi G, Birkun A,Frantzis A (2002) Overview of known or presumed im-pacts on the different species of cetaceans in the Medi-terranean and Black Seas. In: Notarbartolo di Sciara G(ed) Cetaceans of the Mediterranean and Black Seas.ACCOBAMS, Monaco, p 194–196
Nowacek SM, Wells RS, Solow AR (2001) Short-term effectsof boat traffic on bottlenose dolphins, Tursiops truncatus,in Sarasota Bay, Florida. Mar Mamm Sci 17:673–688
Quinn TJ, Gallucci VF (1980) Parametric models for linetransect estimators of abundance. Ecology 61:292–302
Ramsey FL, Wildman V, Engbring J (1987) Covariate adjust-ments to effective area in variable-area wildlife surveys.Biometrics 43:1–11
Reeves RR, Smith BD, Crespo EA, Notarbartolo di Sciara G(2003) Dolphins, whales and porpoises: 2002–2010 conser-vation action plan for the world’s cetaceans. IUCN, Gland,Switzerland
Seber GAF (1982) The estimation of animal abundance.2nd edn. Charles Griffin, London
Scarpaci C, Bigger SW, Corkeron PJ, Nugegoda D (2000)Bottlenose dolphins, Tursiops truncatus, increase whistlingin the presence of ‘swim-with-dolphin’ tour operations.J Cetacean Res Manag 2:183–185
Silvani L, Raich J, Aguilar A (1992) Bottlenose dolphins, Tur-siops truncatus, interacting with fisheries in the BalearicIslands, Spain. Europ Res Cetaceans 6:32–34
Taylor BL, Gerrodette T (1993) The uses of statistical power inconservation biology: the vaquita and northern spottedowl. Conserv Biol 7:489–500
Venables WN, Ripley BD (2000) S programming. Springer-Verlag, New York
Wells RS, Scott MD (1990) Estimating bottlenose dolphinpopulation parameters from individual identification andcapture–release techniques. Rep Int Whal Comm SpecIssue 12:407–415
Wells RS, Scott MD (2002) Bottlenose dolphins. In: Perrin WF,Würsig B, Thewissen JGM (eds) Encyclopedia of marinemammals. Academic Press, San Diego, p 122–128
Williams JA, Dawson SM, Slooten E (1993) The abundance anddistribution of bottlenosed dolphins (Tursiops truncatus) inDoubtful Sound, New Zealand. Can J Zool 71:2080–2088
Wilson B, Hammond PS, Thompson PM (1999) Estimating sizeand assessing trends in a coastal bottlenose dolphin popu-lation. Ecol Appl 9:288–300
286
Forcada et al.: Heterogeneity in dolphin abundance 287
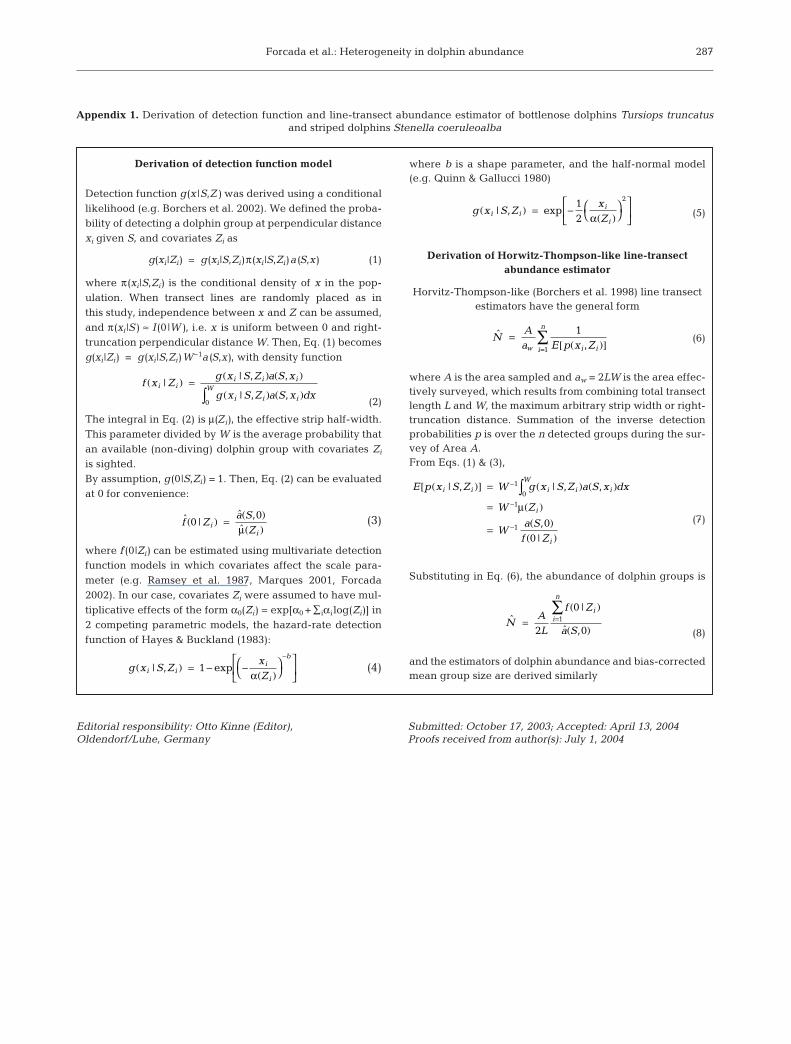
Derivation of detection function model
Detection function g(x |S,Z) was derived using a conditionallikelihood (e.g. Borchers et al. 2002). We defined the proba-bility of detecting a dolphin group at perpendicular distancexi given S, and covariates Zi as
g(xi |Zi) = g(xi |S,Zi)π(xi |S,Zi)a (S,x) (1)
where π(xi |S,Zi) is the conditional density of x in the pop-ulation. When transect lines are randomly placed as inthis study, independence between x and Z can be assumed,and π(xi |S) ≈ I (0 |W), i.e. x is uniform between 0 and right-truncation perpendicular distance W. Then, Eq. (1) becomesg(xi |Zi) = g(xi |S,Zi)W–1a(S,x), with density function
(2)
The integral in Eq. (2) is µ(Zi), the effective strip half-width.This parameter divided by W is the average probability thatan available (non-diving) dolphin group with covariates Zi
is sighted.By assumption, g(0|S,Zi) = 1. Then, Eq. (2) can be evaluatedat 0 for convenience:
(3)
where f (0|Zi) can be estimated using multivariate detectionfunction models in which covariates affect the scale para-meter (e.g. Ramsey et al. 1987, Marques 2001, Forcada2002). In our case, covariates Zi were assumed to have mul-tiplicative effects of the form α0(Zi) = exp[α0 + ∑iαi log(Zi)] in2 competing parametric models, the hazard-rate detectionfunction of Hayes & Buckland (1983):
(4) g x S Z
xZ
i ii
i
b
| , exp( ) = − −( )
−
1α
ˆ |ˆ ,ˆ
f Za S
Zi
i0
0( ) =( )( )µ
f x Zg x S Z a S x
g x S Z a S x dxi i
i i i
i i iW
|| , ,
| , ,( ) =
( ) ( )
( ) ( )∫0
Editorial responsibility: Otto Kinne (Editor), Oldendorf/Luhe, Germany
Submitted: October 17, 2003; Accepted: April 13, 2004Proofs received from author(s): July 1, 2004
Appendix 1. Derivation of detection function and line-transect abundance estimator of bottlenose dolphins Tursiops truncatusand striped dolphins Stenella coeruleoalba
where b is a shape parameter, and the half-normal model(e.g. Quinn & Gallucci 1980)
(5)
Derivation of Horwitz-Thompson-like line-transect abundance estimator
Horvitz-Thompson-like (Borchers et al. 1998) line transectestimators have the general form
(6)
where A is the area sampled and aw = 2LW is the area effec-tively surveyed, which results from combining total transectlength L and W, the maximum arbitrary strip width or right-truncation distance. Summation of the inverse detectionprobabilities p is over the n detected groups during the sur-vey of Area A.From Eqs. (1) & (3),
(7)
Substituting in Eq. (6), the abundance of dolphin groups is
(8)
and the estimators of dolphin abundance and bias-correctedmean group size are derived similarly
ˆ
|
ˆ ,N
AL
f Z
a S
ii
n
=( )
( )=∑
2
0
01
E p x S Z W g x S Z a S x dx
W Z
Wa Sf Z
i i i i iW
i
i
| , | , ,
,|
( )[ ] = ( ) ( )
= ( )
=( )
( )
−
−
−
∫1
0
1
1 00
µ
ˆ,
NAa E p x Zw i ii
n
=( )[ ]=
∑ 1
1
g x S Z
xZ
i ii
i| , exp( ) = −
( )
12
2
α
Copyright © 2022 FDOKUMEN