Multi-gene evidence for a new bottlenose dolphin species in southern Australia
8
Short Communication Multi-gene evidence for a new bottlenose dolphin species in southern Australia Luciana M. Möller a,b, * , Kerstin Bilgmann a,b , Kate Charlton-Robb c , Luciano Beheregaray b a Marine Mammal Research Group, Graduate School of the Environment, Macquarie University, Sydney, NSW 2109, Australia b Molecular Ecology Lab, Department of Biological Sciences, Macquarie University, Sydney, NSW 2109, Australia c Centre for Environmental Stress and Adaptation Research (CESAR) and Australian Centre for Biodiversity: Analysis, Policy and Management, School of Biological Sciences, Monash University, VIC. 3800, Australia article info Article history: Received 18 April 2008 Accepted 20 August 2008 Available online 26 August 2008 1. Introduction Molecular genetic studies can be very powerful for investigat- ing species relationships and resolving taxonomic uncertainties. This is particularly true for cryptic or sibling species, which are discrete species that are difficult or sometimes impossible to dis- tinguish morphologically (Knowlton, 1993). One group that has benefited from such studies is the Cetacea. For example, two new species have been recently proposed based on molecular data, the North Pacific right whale, Eubalaena japonica (Rosen- baum et al., 2000), and the Costero, Sotalia guianensis (Caballero et al., 2007). The family Delphinidae is the largest family of cetaceans, com- prising approximately 36 species of dolphins and small toothed whales (Rice, 1998), which appear to have diverged relatively re- cently (11 mya, Barnes et al., 1985). Due to its recent radiation there has been apparently little time for the development of diag- nostic characters, making taxonomic classification within the fam- ily generally difficult (e.g. Pichler et al., 2001). Taxonomic affinities within one of its sub-families, the Delphininae, have been espe- cially problematic to assess since there are no clear morphological characters that can be used to distinguish genera and a number of species in this sub-family (Perrin et al., 1981). In Delphininae, the taxonomy of bottlenose dolphins, genus Tursiops, has been among the most controversial (e.g. Ross and Cockcroft, 1990; Wang et al., 1999; Natoli et al., 2004). Several species were originally described in this genus but most were later considered as synonyms of the common bottlenose dolphin, T. truncatus (Rice, 1998). In addition to T. truncatus, the only other species that presently retains its spe- cific status is the Indian Ocean or Indo-Pacific bottlenose dolphin, T. aduncus (Rice, 1998). In South Africa the two species were distin- guished based on differences in snout length, ventral spotting and size, among other characters (Ross, 1977). However, the classifica- tion of T. aduncus as a separate species from T. truncatus was later retreated when latitudinal variation on size and morphological characters was found in Australian bottlenose dolphins (Ross and Cockcroft, 1990). It was not until a comprehensive cytochrome b phylogeny of the family Delphinidae was conducted that T. aduncus was re-considered as a valid species (LeDuc et al., 1999). This study showed that the genus Tursiops was polyphyletic, and that the Indo-Pacific bottlenose dolphin T. aduncus had closer affinities with some species of the genus Stenella (S. frontalis, S. coeruleoalba and S. clymene) and common dolphins Delphinus spp. than to the common bottlenose dolphin T. truncatus. The authors recommended that until a full taxonomy revision of the sub-family Delphininae is car- ried out, generic names should be maintained, while accepting T. aduncus as a valid species. Genetic evidence for taxonomic status of T. aduncus was then confirmed by a mtDNA control region phy- logeny of sympatric truncatus and aduncus-type dolphins from Chinese waters (Wang et al., 1999), a finding corroborated by mor- phological and osteological studies (Wang et al., 2000a,b). After T. aduncus was re-considered as a valid species, its pres- ence in Australian waters was proposed based on both morpholog- ical (Hale et al., 2000; Kemper, 2004) and genetic studies (Möller and Beheregaray, 2001), although Hale et al. (2000) refers to T. cf. aduncus. Tursiop cf. aduncus was found in estuarine and near-coast- al oceanic waters of eastern and northern Australia (Hale et al., 2000). Tursiops aduncus was proposed for coastal waters of New South Wales based on genetic data (Möller and Beheregaray, 2001) and for the state of South Australia based on osteological characters (Kemper, 2004). Further advances and dispute revolving genetic affinities and the taxonomy of bottlenose dolphins nonetheless continued to emerge with additional phylogenetic studies of the mtDNA control region which included animals from other regions. Recently, re- sults from a geographically broad phylogenetic study suggested that aduncus-type dolphins from South Africa may represent a 1055-7903/$ - see front matter Ó 2008 Elsevier Inc. All rights reserved. doi:10.1016/j.ympev.2008.08.011 * Corresponding author. Address: Marine Mammal Research Group, Graduate School of the Environment, Macquarie University, Sydney, NSW 2109, Australia. Fax: +61 2 9850 7972. E-mail address: [email protected] (L.M. Möller). Molecular Phylogenetics and Evolution 49 (2008) 674–681 Contents lists available at ScienceDirect Molecular Phylogenetics and Evolution journal homepage: www.elsevier.com/locate/ympev
Transcript of Multi-gene evidence for a new bottlenose dolphin species in southern Australia

Molecular Phylogenetics and Evolution 49 (2008) 674–681
Contents lists available at ScienceDirect
Molecular Phylogenetics and Evolution
journal homepage: www.elsevier .com/locate /ympev
Short Communication
Multi-gene evidence for a new bottlenose dolphin species in southern Australia
Luciana M. Möller a,b,*, Kerstin Bilgmann a,b, Kate Charlton-Robb c, Luciano Beheregaray b
a Marine Mammal Research Group, Graduate School of the Environment, Macquarie University, Sydney, NSW 2109, Australiab Molecular Ecology Lab, Department of Biological Sciences, Macquarie University, Sydney, NSW 2109, Australiac Centre for Environmental Stress and Adaptation Research (CESAR) and Australian Centre for Biodiversity: Analysis, Policy and Management,School of Biological Sciences, Monash University, VIC. 3800, Australia
a r t i c l e i n f o
Article history:Received 18 April 2008Accepted 20 August 2008Available online 26 August 2008
1055-7903/$ - see front matter � 2008 Elsevier Inc. Adoi:10.1016/j.ympev.2008.08.011
* Corresponding author. Address: Marine MammaSchool of the Environment, Macquarie University, SFax: +61 2 9850 7972.
E-mail address: [email protected] (L.M
1. Introduction
Molecular genetic studies can be very powerful for investigat-ing species relationships and resolving taxonomic uncertainties.This is particularly true for cryptic or sibling species, which arediscrete species that are difficult or sometimes impossible to dis-tinguish morphologically (Knowlton, 1993). One group that hasbenefited from such studies is the Cetacea. For example, twonew species have been recently proposed based on moleculardata, the North Pacific right whale, Eubalaena japonica (Rosen-baum et al., 2000), and the Costero, Sotalia guianensis (Caballeroet al., 2007).
The family Delphinidae is the largest family of cetaceans, com-prising approximately 36 species of dolphins and small toothedwhales (Rice, 1998), which appear to have diverged relatively re-cently (11 mya, Barnes et al., 1985). Due to its recent radiationthere has been apparently little time for the development of diag-nostic characters, making taxonomic classification within the fam-ily generally difficult (e.g. Pichler et al., 2001). Taxonomic affinitieswithin one of its sub-families, the Delphininae, have been espe-cially problematic to assess since there are no clear morphologicalcharacters that can be used to distinguish genera and a number ofspecies in this sub-family (Perrin et al., 1981). In Delphininae, thetaxonomy of bottlenose dolphins, genus Tursiops, has been amongthe most controversial (e.g. Ross and Cockcroft, 1990; Wang et al.,1999; Natoli et al., 2004). Several species were originally describedin this genus but most were later considered as synonyms of thecommon bottlenose dolphin, T. truncatus (Rice, 1998). In additionto T. truncatus, the only other species that presently retains its spe-cific status is the Indian Ocean or Indo-Pacific bottlenose dolphin,T. aduncus (Rice, 1998). In South Africa the two species were distin-
ll rights reserved.
l Research Group, Graduateydney, NSW 2109, Australia.
. Möller).
guished based on differences in snout length, ventral spotting andsize, among other characters (Ross, 1977). However, the classifica-tion of T. aduncus as a separate species from T. truncatus was laterretreated when latitudinal variation on size and morphologicalcharacters was found in Australian bottlenose dolphins (Ross andCockcroft, 1990). It was not until a comprehensive cytochrome bphylogeny of the family Delphinidae was conducted that T. aduncuswas re-considered as a valid species (LeDuc et al., 1999). This studyshowed that the genus Tursiops was polyphyletic, and that theIndo-Pacific bottlenose dolphin T. aduncus had closer affinities withsome species of the genus Stenella (S. frontalis, S. coeruleoalba and S.clymene) and common dolphins Delphinus spp. than to the commonbottlenose dolphin T. truncatus. The authors recommended thatuntil a full taxonomy revision of the sub-family Delphininae is car-ried out, generic names should be maintained, while accepting T.aduncus as a valid species. Genetic evidence for taxonomic statusof T. aduncus was then confirmed by a mtDNA control region phy-logeny of sympatric truncatus and aduncus-type dolphins fromChinese waters (Wang et al., 1999), a finding corroborated by mor-phological and osteological studies (Wang et al., 2000a,b).
After T. aduncus was re-considered as a valid species, its pres-ence in Australian waters was proposed based on both morpholog-ical (Hale et al., 2000; Kemper, 2004) and genetic studies (Möllerand Beheregaray, 2001), although Hale et al. (2000) refers to T. cf.aduncus. Tursiop cf. aduncus was found in estuarine and near-coast-al oceanic waters of eastern and northern Australia (Hale et al.,2000). Tursiops aduncus was proposed for coastal waters of NewSouth Wales based on genetic data (Möller and Beheregaray,2001) and for the state of South Australia based on osteologicalcharacters (Kemper, 2004).
Further advances and dispute revolving genetic affinities andthe taxonomy of bottlenose dolphins nonetheless continued toemerge with additional phylogenetic studies of the mtDNA controlregion which included animals from other regions. Recently, re-sults from a geographically broad phylogenetic study suggestedthat aduncus-type dolphins from South Africa may represent a

L.M. Möller et al. / Molecular Phylogenetics and Evolution 49 (2008) 674–681 675
different species from T. truncatus and aduncus-type Chinese dol-phins (Natoli et al., 2004). Similarly to the findings of Natoli et al.(2004), a mtDNA study of bottlenose dolphins from the state ofVictoria, southern Australia, has suggested that animals in this areamay represent an undescribed taxon, which appeared to be morerelated to T. truncatus than T. aduncus (Charlton et al., 2006). How-ever, the mtDNA control region phylogeny in this study was recon-structed based solely on a few species of Delphininae, makinguncertain the genetic affinities of this taxon to other members ofthis sub-family.
In this study we aim to further clarify the taxonomic status ofsouthern Australian bottlenose dolphins based on a multi-gene ap-proach and a much larger dataset in number of species, geographicrange and population samples to investigate their phylogeneticrelationships within the sub-family Delphininae. To achieve thisaim we used mtDNA data to investigate phylogenetic relationshipsof these dolphins within the sub-family Delphininae and also usedinformation from nuclear DNA to test for reproductive isolation be-tween bottlenose dolphins found in southeastern and southernAustralia.
2. Material and methods
2.1. Samples
A total of 182 samples of bottlenose dolphins were obtained insoutheastern and southern Australia from the states of New SouthWales (NSW), Tasmania (TAS), Victoria (VIC) and South Australia(SA) (Appendix Fig. S1). We used biopsy techniques (Krützenet al., 2002; Bilgmann et al., 2007) to sample coastal animals (de-fined as animals sampled up to 0.5 km from shore) in Jervis Bayand Twofold Bay/Merimbula, NSW (n = 42), Port Phillip Bay, VIC(n = 3) and in Southeast Spencer Gulf, North Spencer Gulf, CoffinBay, Southwest Spencer Gulf and around St. Francis Island, SA(n = 84). We also biopsy sampled offshore animals (defined as ani-mals biopsied >0.5 km from shore) off Byron Bay, Yamba, Forsterand Sydney, NSW (n = 22) (Appendix Table S1). Coastal bottlenosedolphins from Jervis Bay were previously identified through amolecular phylogeny of the mtDNA control region to belong tothe Indo-Pacific species, T. aduncus (Möller and Beheregaray,2001). Samples of bottlenose dolphins were also collected fromstranded individuals or animals entangled in nets in several loca-tions in VIC (n = 13) and TAS (n = 18) (Appendix Table S1). In addi-tion, samples of a closely related Delphininae species which occursin the same geographic area—short-beaked common dolphins (Del-phinus delphis) (n = 52) biopsied in the Great Australian Bight andSpencer Gulf Region in SA (Appendix Table S1)—were includedfor a comparison of levels of divergence and gene flow.
2.2. Genetic methods
DNA was extracted from samples using a salting-out protocol(Sunnucks and Hales, 1996). Samples from VIC and TAS were ex-tracted using Gentra Systems, Puregene Tissue kit following man-ufacturer’s instructions. Amplification of ca. 400-bp of the mtDNAcontrol region was obtained following methods in Möller andBeheregaray (2001). Amplified fragments were then screened forsequence variation by the single-stranded conformation polymor-phism (SSCP) analysis (Sunnucks et al., 2000), with the exception ofsamples from VIC and TAS, which were all sequenced. Representa-tives of all identified SSCP phenotypes were then sequenced in anABI 377 DNA sequencing system according to manufacturer’sinstructions. All individuals with rare phenotypes were sequenced,whereas at least 15% of individuals with common phenotypes weresequenced. All different phenotypes confirmed as different
sequences (i.e. haplotypes) and individuals with the same pheno-type always had identical sequences.
In addition, sequence data of ca. 1000-bp of the mtDNA cyto-chrome b region of selected samples (see mtDNA data analysis be-low for explanation) was obtained through PCR using a primerlocated on the tRNA glutamine and a primer located on the tRNAthreonine, as reported in LeDuc et al. (1999). PCR conditions con-sisted of an initial denaturation at 92�/10 min, followed by 40 cy-cles with 92 �C/1 min denaturation, 51 �C/1 min annealing and72 �C/1 min extension, and a final extension at 72 �C/10 min. PCRproducts were separated by electrophoresis on 1% agarose gels, ex-cised and purified with UltraClean 15 DNA purification kit (MOBIO, USA). PCR conditions for the VIC and TAS samples consistedof an initial denaturation at 94�/4 min, followed by 3 cycles with40 cycles with 94 �C/45 s denaturation, 50 �C/1 min annealingand 72 �C/1 min extension, followed by 32 cycles of 94 �C/20 sdenaturation, 50 �C/1 min annealing and 72 �C/1 min extension,and a final extension at 72 �C/3 min. Sequencing was done directlyfrom the purified PCR. Both strands of the cytochrome b were se-quenced in an ABI 377 DNA sequencing system according to themanufacturer’s instructions, using the primers above.
Six nuclear markers (microsatellite loci EV1, EV37, Valsecchiand Amos, 1996; KW12, Hoelzel et al., 1998; MK5, MK6, MK8,Krützen et al., 2001) were also PCR-amplified for all samples as de-scribed in Möller and Beheregaray (2004). VIC and TAS samplesamplified with an initial denaturation at 95�/2 min, followed by a15-cycle ‘touchdown’ (94 �C for 30 s, 58–50 �C for 30 s and 72 �Cfor 30 s) and 22 cycles of 94 �C/30 s, 50 �C/30 s and 72 �C/30 s,and a final extension at 72 �C/2 min; except EV37 and KW12 con-sisting of an initial denaturation at 94�/2 min, followed by 35 cy-cles of 94 �C/30 s, 55 �C/30 s, 72 �C/30 s and a final extension at72 �C/2 min.
2.3. Molecular phylogenetics analysis based on mitochondrial DNAgenes
Mitochondrial DNA control region and cytochrome b sequenceswere edited and aligned using Sequencher 4.1.2 (Gene Codes Cor-poration, MI). Mitochondrial DNA control region data were used toestimate gene genealogies based on the statistical parsimonymethod (Templeton et al., 1992) implemented in TCS 1.06 (Clem-ent et al., 2000). Gaps were used as a fifth character state for thisanalysis.
From the mtDNA control region network we selected samplesrepresenting abundant and/or divergent control region haplotypesfor the cytochrome b sequence analysis (n = 20, see Appendix TableS1). Sequence divergence of the cytochrome b haplotypes was cal-culated and their phylogenetic relationships within the sub-familyDelphininae were inferred by Neighbour-Joining (NJ) and Maxi-mum Parsimony (MP) methods implemented in PAUP* 4.0b10(Swofford, 2003). For these analyses, in addition to our samples,we used between one to four representative sequences of each ofthe species of the sub-family Delphininae deposited in GenBankby LeDuc et al. (1999) (n = 25, Appendix Table S2). We used theAkaike information criterion (AIC) implemented in ModelTest3.04 (Posada and Crandall, 1998) to determine the model of nucle-otide substitution that best fitted the data. The NJ tree was thenestimated with the selected Tamura-Nei model (Tamura and Nei,1993) taking into account the proportion of invariable sites(Pinv = 0.3876) and gamma correction (shape = 0.5732). Un-weighted MP trees were obtained with the heuristic search with100 random sequence-addition replicates and tree-bisection-reconnection branch swapping. Statistical support of tree nodesfor NJ and MP phylogenies was assessed by bootstrap analysis (Fel-senstein, 1985) with 1000 replicates. Values equal or higher than70% were assumed to indicate strong support for a clade (e.g. Hillis

676 L.M. Möller et al. / Molecular Phylogenetics and Evolution 49 (2008) 674–681
and Bull, 1993). Two delphinid species (Orcinus orca, GenBank#AF084061; Lagenorhynchus acutus, GenBank #AF084061; LeDucet al., 1999) were used as outgroups for the analyses.
2.4. Species assignment and gene flow analysis based onmicrosatellites
Genetic variation was estimated by calculating number ofalleles, and expected (He) and observed (Ho) heterozygosities inGenepop 3.4 (Raymond and Rousset, 1995). Tests for Hardy-Wein-berg equilibrium (HWE), using an exact test and based on 1000iterations, and tests for linkage disequilibrium were also conductedin Genepop, with the significance level Bonferroni-corrected (Rice,1989).
We used a Bayesian clustering method implemented inStructure 2.1 (Pritchard et al., 2000) to test the assignment of indi-vidual samples to genetic clusters. The number of clusters (K) wasinferred from the posterior probability distribution Pr (K/X)calculated from the posterior probability of the data Log Pr (X/K).For this analysis we used a burn in period of 100,000 iterations,runs of 106, values of K between 1 and 4, series of 5 independentruns for each value of K, with the admixture and correlatedfrequency models.
In addition, a factorial correspondence analysis implemented inGenetix 4.0, which graphically projects individuals on the factorspace defined by the similarity of their allelic states, was used todetect the degree of similarity between bottlenose and commondolphin samples.
Rates of recent migration were estimated using a Bayesianapproach implemented in BayesAss 1.3 (Wilson and Rannala,2003), which accounts for unequal migration rates and do not re-quire populations to be in migration-drift or Hardy-Weinbergequilibrium. To infer posterior probability distributions a burn inperiod of 100,000 iterations and runs of 3 � 106 were carried out,with a thinning interval of 2000 iterations.
3. Results
3.1. Cytochrome b phylogeny and sequence divergence
We unambiguously obtained cytochrome b sequences of 971 bpfor 18 bottlenose dolphin samples, including coastal and offshoreindividuals from NSW, coastal and stranded animals from VIC,stranded dolphins from TAS and coastal individuals from SA(Appendix Table S1). Among these samples a total of 17 haplo-types were identified (Appendix Table S3). In addition, we also ob-tained equivalent sequence data for two common dolphins, fromwhich two haplotypes were identified (Appendix Table S3). Therewere 81 polymorphic sites in our Australian bottlenose dolphincytochrome b sequences, 95 sites including the two common dol-phin sequences, and 233 variable sites when all sequences used toreconstruct the phylogeny were considered (Appendix Table S3).From these 152 characters were parsimony informative. The Del-phininae phylogenetic relationships reconstructed in this study(Fig. 1) were concordant with those presented by LeDuc et al.(1999). However, three instead of two monophyletic clades of bot-tlenose dolphins were identified in this phylogeny (Fig. 1). The firstone is represented by LeDuc et al.’s reference sequences of com-mon bottlenose dolphins, T. truncatus, and some sequences of Aus-tralian bottlenose dolphins stranded in TAS and VIC, and biopsiedoffshore in NSW, and is hereafter considered the T. truncatus-cytbclade. The second clade is represented by reference sequences ofIndo-Pacific bottlenose dolphins, T. aduncus, and the two se-quences of coastal bottlenose dolphin from NSW, and is hereafterconsidered the T. aduncus-cytb clade. The third clade, not presentin LeDuc et al.’s (1999) phylogeny, comprised of sequences of
coastal bottlenose dolphins biopsy sampled in SA and VIC, andsome individuals stranded in VIC and TAS. All three bottlenose dol-phin clades were supported by very high bootstrap values (NJ andMP, 100%; Fig. 1). The novel bottlenose dolphin clade showed a sis-ter relationship to reference sequences of Fraser’s dolphins,Lagenodelphis hosei. This relationship also showed high bootstrapsupport in the tree (NJ, 80%; MP, 80%; Fig. 1). In addition, se-quences of the two common dolphins from SA clustered with ref-erence sequences of short-beaked common dolphins D. delphis(Fig. 2).
Corrected sequence divergence between T. truncatus and T.aduncus haplotypes ranged between 3.2% and 5.8%. Sequencedivergence between these two recognized Tursiops species andthe novel bottlenose dolphin clade was higher, ranging from 5.5%to 7.7% between the novel clade and T. truncatus, and 4.8% to6.4% between the new clade and T. aduncus. By comparison, the no-vel clade showed sequence divergence between 3.8% and 4.7% toits putative sister taxon, L. hosei.
The novel bottlenose dolphin clade also showed three diagnos-tic nucleotide substitutions at positions #589, #661 and #910 rel-ative to all other members of the sub-family Delphininae and thetwo outgroup species (Appendix Table S3). This novel clade is con-sidered hereafter as the Southern Australian bottlenose dolphin(SABD) cytb clade.
3.2. Control region gene genealogies
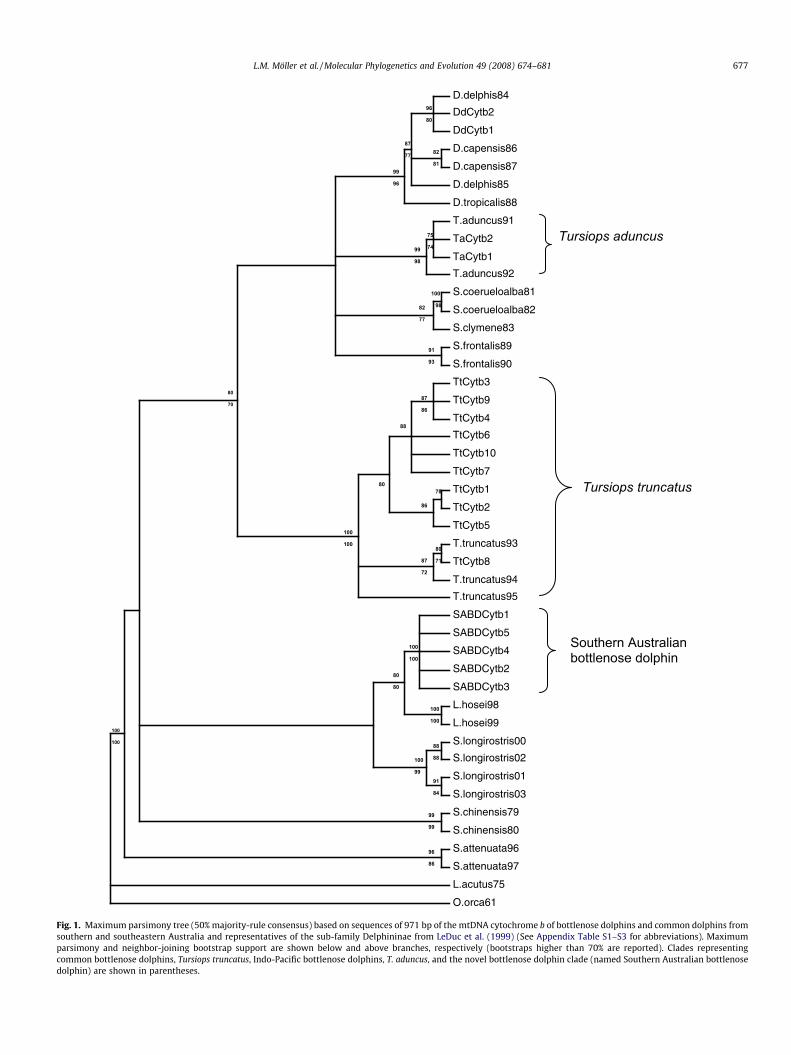
We resolved the control region haplotypes for all bottlenosedolphin samples (Appendix Table 1S). Among these sequences 45unique haplotypes were identified. In addition, we also resolvedthe haplotypes for all common dolphin samples, with 22 haplo-types recognized. Four haplogroups not linked to each other werereconstructed in the haplotype network (Fig. 2). These haplo-groups were not linked because their probability of linkage was re-jected at the 5% level (Templeton et al., 1992). The first haplogroupis represented by T. truncatus-cytb clade samples and all sequencesof animals biopsied offshore in NSW, most individuals stranded inTAS (13 of 18), and two stranded in VIC. This haplogroup is consid-ered the T. truncatus control region (cr) haplogroup. The secondhaplogroup is represented by T. aduncus-cytb clade samples andincludes all coastal dolphins biopsied in NSW, and is referred toas the T. aduncus cr haplogroup. The third haplogroup is repre-sented by the SABD-cytb clade samples and includes all coastaldolphins biopsied in SA and VIC, most individuals stranded inVIC (11 of 13) and five of the animals stranded in TAS, and it isconsidered the SABD cr haplogroup. The fourth haplogroup is rep-resented by the D. delphis-cytb clade samples and all other com-mon dolphins sampled in SA, and it is referred to as the D.delphis cr haplogroup.
3.3. Microsatellite genetic structure and migration rates
Number of alleles, expected and observed heterozygosities aswell as results of tests for Hardy-Weinberg equilibrium is pre-sented in Table 1. The Bayesian clustering method implementedin Structure showed that all individuals belonging to the fourmtDNA cr haplogroups had very high probability of membershipto its own group based on nuclear DNA data (Fig. 3a). When deter-mining the most likely number of distinct groups in the data set,the highest probability was obtained when K = 4 groups [P(K/X) = 1 for K = 4 groups and P(K/X) = �0 for K = 1, 2 and 3 groups].When we tested for the existence of additional groups in the data-set (K > 4) further genetic subdivision was suggested within thefour groups (data not shown, but see Bilgmann et al., 2007 for anexample of population-level structure in Southern Australian bot-tlenose dolphins).
D.delphis84
DdCytb2
DdCytb1
D.capensis86
D.capensis87
D.delphis85
D.tropicalis88
T.aduncus91
TaCytb2
TaCytb1
T.aduncus92
S.coerueloalba81
S.coerueloalba82
S.clymene83
S.frontalis89
S.frontalis90
TtCytb3
TtCytb9
TtCytb4
TtCytb6
TtCytb10
TtCytb7
TtCytb1
TtCytb2
TtCytb5
T.truncatus93
TtCytb8
T.truncatus94
T.truncatus95
SABDCytb1
SABDCytb5
SABDCytb4
SABDCytb2
SABDCytb3
L.hosei98
L.hosei99
S.longirostris00
S.longirostris02
S.longirostris01
S.longirostris03
S.chinensis79
S.chinensis80
S.attenuata96
S.attenuata97
L.acutus75
O.orca61
80
7187
72
78
86
87
86
88
80
100
100
75
7499
98
96
80
82
81
87
77
99
96
100
9882
77
91
93
80
70
100
100
100
100
80
80
88
88
91
84
100
99
96
86
99
99
100
100
Tursiops aduncus
Tursiops truncatus
Southern Australian bottlenose dolphin
Fig. 1. Maximum parsimony tree (50% majority-rule consensus) based on sequences of 971 bp of the mtDNA cytochrome b of bottlenose dolphins and common dolphins fromsouthern and southeastern Australia and representatives of the sub-family Delphininae from LeDuc et al. (1999) (See Appendix Table S1–S3 for abbreviations). Maximumparsimony and neighbor-joining bootstrap support are shown below and above branches, respectively (bootstraps higher than 70% are reported). Clades representingcommon bottlenose dolphins, Tursiops truncatus, Indo-Pacific bottlenose dolphins, T. aduncus, and the novel bottlenose dolphin clade (named Southern Australian bottlenosedolphin) are shown in parentheses.
L.M. Möller et al. / Molecular Phylogenetics and Evolution 49 (2008) 674–681 677
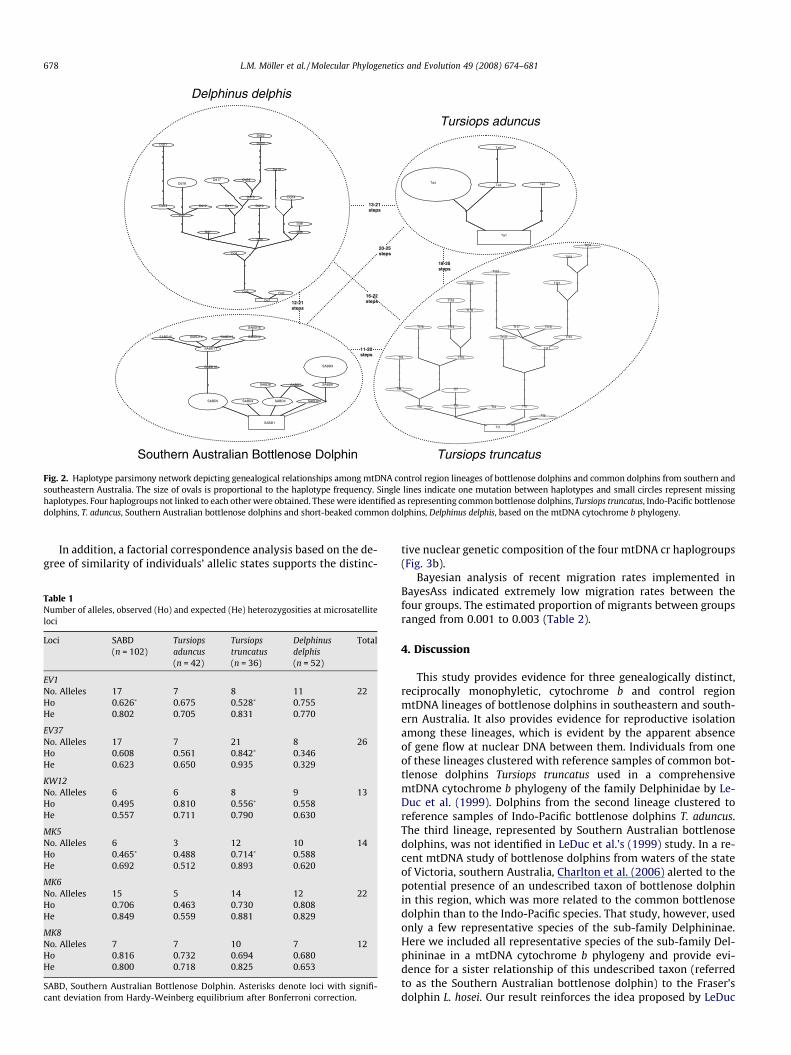
Fig. 2. Haplotype parsimony network depicting genealogical relationships among mtDNA control region lineages of bottlenose dolphins and common dolphins from southern andsoutheastern Australia. The size of ovals is proportional to the haplotype frequency. Single lines indicate one mutation between haplotypes and small circles represent missinghaplotypes. Four haplogroups not linked to each other were obtained. These were identified as representing common bottlenose dolphins, Tursiops truncatus, Indo-Pacific bottlenosedolphins, T. aduncus, Southern Australian bottlenose dolphins and short-beaked common dolphins, Delphinus delphis, based on the mtDNA cytochrome b phylogeny.
678 L.M. Möller et al. / Molecular Phylogenetics and Evolution 49 (2008) 674–681
In addition, a factorial correspondence analysis based on the de-gree of similarity of individuals’ allelic states supports the distinc-
Table 1Number of alleles, observed (Ho) and expected (He) heterozygosities at microsatelliteloci
Loci SABD(n = 102)
Tursiopsaduncus(n = 42)
Tursiopstruncatus(n = 36)
Delphinusdelphis(n = 52)
Total
EV1No. Alleles 17 7 8 11 22Ho 0.626* 0.675 0.528* 0.755He 0.802 0.705 0.831 0.770
EV37No. Alleles 17 7 21 8 26Ho 0.608 0.561 0.842* 0.346He 0.623 0.650 0.935 0.329
KW12No. Alleles 6 6 8 9 13Ho 0.495 0.810 0.556* 0.558He 0.557 0.711 0.790 0.630
MK5No. Alleles 6 3 12 10 14Ho 0.465* 0.488 0.714* 0.588He 0.692 0.512 0.893 0.620
MK6No. Alleles 15 5 14 12 22Ho 0.706 0.463 0.730 0.808He 0.849 0.559 0.881 0.829
MK8No. Alleles 7 7 10 7 12Ho 0.816 0.732 0.694 0.680He 0.800 0.718 0.825 0.653
SABD, Southern Australian Bottlenose Dolphin. Asterisks denote loci with signifi-cant deviation from Hardy-Weinberg equilibrium after Bonferroni correction.
tive nuclear genetic composition of the four mtDNA cr haplogroups(Fig. 3b).
Bayesian analysis of recent migration rates implemented inBayesAss indicated extremely low migration rates between thefour groups. The estimated proportion of migrants between groupsranged from 0.001 to 0.003 (Table 2).
4. Discussion
This study provides evidence for three genealogically distinct,reciprocally monophyletic, cytochrome b and control regionmtDNA lineages of bottlenose dolphins in southeastern and south-ern Australia. It also provides evidence for reproductive isolationamong these lineages, which is evident by the apparent absenceof gene flow at nuclear DNA between them. Individuals from oneof these lineages clustered with reference samples of common bot-tlenose dolphins Tursiops truncatus used in a comprehensivemtDNA cytochrome b phylogeny of the family Delphinidae by Le-Duc et al. (1999). Dolphins from the second lineage clustered toreference samples of Indo-Pacific bottlenose dolphins T. aduncus.The third lineage, represented by Southern Australian bottlenosedolphins, was not identified in LeDuc et al.’s (1999) study. In a re-cent mtDNA study of bottlenose dolphins from waters of the stateof Victoria, southern Australia, Charlton et al. (2006) alerted to thepotential presence of an undescribed taxon of bottlenose dolphinin this region, which was more related to the common bottlenosedolphin than to the Indo-Pacific species. That study, however, usedonly a few representative species of the sub-family Delphininae.Here we included all representative species of the sub-family Del-phininae in a mtDNA cytochrome b phylogeny and provide evi-dence for a sister relationship of this undescribed taxon (referredto as the Southern Australian bottlenose dolphin) to the Fraser’sdolphin L. hosei. Our result reinforces the idea proposed by LeDuc
Axe 1 (47.35 %)18,00016,00014,00012,00010,0008,0006,0004,0002,0000-2,000-4,000-6,000
Axe
2 (
33.2
2 %
)
170
160
150
140
130120
110
10090
80
7060
50
403020
100
-10-20-30-40
-50-60-70-80
Axe 3 (19.43 %)
18,00015,000
12,0009,000
6,000
3,000
0
-3,000
-6,000
Southern Australian Bottlenose Dolphin
Tursiopsaduncus
Tursiopstruncatus
Delphinusdelphis
Southern Australian Bottlenose Dolphin
Tursiopsaduncus
Tursiopstruncatus Delphinus
delphis
a
b
Fig. 3. (a) Bayesian clustering of the four mtDNA control region haplogroups of bottlenose and common dolphins from southern and southeastern Australia based on sixmicrosatellite loci. Each individual is represented by a vertical column partitioned into four colored segments, with the length proportional to the individual’s estimatedmembership coefficient into the four groups. (b) Three-dimensional representation of a factorial correspondence analysis of the four mtDNA control region haplogroups ofbottlenose and common dolphins from southern and southeastern Australia based on six microsatellite loci. The four haplogroups were identified as representing commonbottlenose dolphins, Tursiops truncatus, Indo-Pacific bottlenose dolphins, T. aduncus, Southern Australian bottlenose dolphins and short-beaked common dolphins, Delphinusdelphis, based on the mtDNA cytochrome b phylogeny.
Table 2Recent migration rates among the four dolphin mitochondrial control regionhaplogroups based on six microsatellite loci
SABD Tursiopsaduncus
Tursiopstruncatus
Delphinusdelphis
SABD 0.996 0.001 0.001 0.001Tursiops aduncus 0.003 0.992 0.003 0.003Tursiops truncatus 0.003 0.003 0.991 0.003Delphinus delphis 0.002 0.002 0.002 0.994
Means of the posterior distribution of the migration rate into each dolphin haplo-group (m) are shown. The haplogroups from which each dolphin belong are listed inthe rows, while the haplogroups from which they migrated are listed in the col-umns. Values along the diagonal are the proportions of dolphins derived from theirown haplogroups each generation. Standard deviations for all distributions were<0.01. SABD, Southern Australian bottlenose dolphin.
L.M. Möller et al. / Molecular Phylogenetics and Evolution 49 (2008) 674–681 679
et al. (1999) that bottlenose dolphins are part of a polyphyleticgroup. More importantly, based on the phylogenetic species con-cept, this study provides evidence for fixed and diagnosable genet-ic differences between these lineages, suggesting the presence of anew species of bottlenose dolphin in Southern Australia. This is dif-ferent from the aduncus-type dolphins from South Africa as shownby a phylogenetic analysis of the mtDNA control region (AppendixFig. S2). The aduncus-type dolphins from South Africa were sug-
gested to represent a different species from the Chinese aduncus-type by Natoli et al. (2004).
In our study southern Australian bottlenose dolphins were sam-pled in coastal waters of South Australia, Victoria and Tasmania,but not in New South Wales. By contrast, Indo-Pacific bottlenosedolphins (T. aduncus) were found in coastal waters of New SouthWales but not detected in Victoria, Tasmania or South Australia.Common bottlenose dolphins (T. truncatus), on the other hand,were sampled in offshore waters of New South Wales, andstranded in Victoria and Tasmania. Based on our sampling effortwe tentatively propose that Southern Australian bottlenose dol-phins are distributed in coastal waters of South Australia, Victoria,Tasmania and potentially south and south-western Western Aus-tralia (see below). The presence of both T. aduncus and T. truncatus,was previously proposed to South Australia based on a morpholog-ical study of stranded animals (Kemper, 2004). This study, how-ever, distinguished two morphological groups of South Australianbottlenose dolphins which were subsequently aligned with T.truncatus and T aduncus (Kemper, 2004). We believe that one ofthese groups may have been incorrectly identified and in fact rep-resent the Southern Australian bottlenose dolphin. Additional mor-phological studies including samples from Southern Australianbottlenose dolphins, Fraser’s dolphins, common bottlenose dol-
680 L.M. Möller et al. / Molecular Phylogenetics and Evolution 49 (2008) 674–681
phins and Indo-Pacific bottlenose dolphins are needed for clarify-ing morphological affinities of South Australian bottlenosedolphins.
It has been suggested that historical glacial cycles (Dartnall,1974; Burridge, 2000; Waters et al., 2004), contemporary latitudi-nal temperature gradients, and/or oceanographic patterns (Bennetand Pope, 1953, 1960; O’Hara and Poore, 2000) are associated withthe presence of different marine biogeographic provinces in Aus-tralia’s temperate region. For example, the land bridge connectingTasmania and the mainland during the Plio-Pleistocence glacia-tions was proposed to have promoted separation and divergenceof coastal taxa, such as of species of the six-rayed sea-stars of thegenus Patiriella (Waters et al., 2004) and gastropods of the genusNerita (Waters et al., 2005). The disappearance of the land bridgehas been a relatively recent event and therefore the resident pop-ulations along the Victorian coastline are likely to be a result ofniche filling with the release of suitable habitat. The potentialancestor is unlikely to have been from eastern Australian T. adun-cus populations, given the substantial genetic divergence of thisgroup, as previously discussed by Charlton et al. (2006). In the caseof the wider southern Australian bottlenose dolphin, it seems un-likely that the Tasmanian land bridge was responsible for allopatricspeciation of coastal animals, as neither the Indo-Pacific bottlenosedolphin or the common bottlenose dolphin were identified as a sis-ter taxon in the cytochrome b phylogeny. Rather, the Plio-Pleisto-cene glaciations may have given opportunity for colonization ofcoastal waters west and east of the barrier by two different dolphintaxa. In addition, contemporary ocean currents may be responsiblefor maintaining the apparent allopatric distribution displayed bythese taxa. The distribution of Indo-Pacific bottlenose dolphins inour study area coincides with the influence of the East AustralianCurrent, which flows southward along eastern Australia and de-flects away from the Australian continent as it reaches southernNew South Wales (Godfrey et al., 1980). By contrast, two currentsystems dominate in Southern Australia, the Coastal Current whichflows east along the coast in South Australia and Victoria, and theZeehan Current which flows southeast around Southern Tasmania(Cirano and Middleton, 2004). Interestingly, the distribution of theSouthern Australian bottlenose dolphins in South Australia, Victo-ria and Tasmanian coastal waters is in agreement with the distri-bution of these currents. On the other hand, in WesternAustralia, where the major oceanographic system is the LeeuwinCurrent (Waite et al., 2007), a bottlenose dolphin population genet-ics study in Shark Bay identified only control region haplotypescharacteristic of T. aduncus and T. truncatus (Krützen et al., 2004).This current flows southward along Western Australia and theneastward into south-western Australia in winter, with the systempartially reverted in summer (Cirano and Middleton, 2004; Waiteet al., 2007). The south-western region of Australia would be aninteresting area for further study as it may represent the westernboundary for the distribution of southern Australian bottlenosedolphins.
Our study adds to the escalating number of DNA-based reportsof cryptic species in charismatic megafauna (e.g. Beheregaray andCaccone 2007) and highlights the importance of an adequate sam-pling of geographic populations, taxa, and gene markers for taxo-nomic research.
Acknowledgments
Funding and logistic support was provided by Graduate Schoolof the Environment, Macquarie University, Linnean Society of NewSouth Wales, South Australian Research and Development Insti-tute, Dolphin Research Institute, Tasmanian Department of Pri-mary Industries, Water and Environment. Samples, fieldwork ortechnical support was provided by Rob Harcourt, Steve McKechnie,
Andrea Taylor, Cath Kemper, Sue Gibbs, Simon Allen, Anika War-ren-Smith, Joanna Wiszniewski, Rosemary Gales, Shannon Corri-gan. This research was carried out under permits by theDepartment of the Environment and Conservation (NSW), theDepartment of Environment and Heritage (SA), the VictorianDepartment of Sustainability and Environment (VIC) and animalethics approvals by DEH, Macquarie University and the DolphinResearch Institute.
Appendix A. Supplementary data
Supplementary data associated with this article can be found, inthe online version, at doi:10.1016/j.ympev.2008.08.011.
References
Barnes, L.G., Domming, D.P., Ray, C.F., 1985. Status of studies on fossil marinemammals. Mar. Mamm. Sci. 1, 15–53.
Beheregaray, L.B., Caccone, A., 2007. Cryptic biodiversity in a changing world. J. Biol.6, 1–5.
Bennet, I., Pope, E.C., 1953. Intertidal zonation of the exposed rocky shores ofVictoria, together with a rearrangement of the biogeographical provinces oftemperate Australian shores. Aust. J. Mar. Fresh. Res. 4, 105–159.
Bennet, I., Pope, E.C., 1960. Intertidal zonation of the exposed rocky shores ofTasmania and its relationship with the rest of Australia. Aust. J. Mar. Fresh. Res.11, 182–221.
Bilgmann, K., Griffiths, O.J., Allen, S.J., Möller, L.M., 2007. A biopsy pole system forbow-riding dolphins: sampling success, behavioral responses and test forsampling bias. Mar. Mamm. Sci. 23, 218–225.
Burridge, C.P., 2000. Biogeographic history of geminate cirrhitoids (Perciformes:Cirrhitoidea) with east-west allopatric distributions across southern Australia,based on molecular data. Global Ecol. Biogeogr. Lett. 9, 517–525.
Caballero, S., Trujillo, F., Vianna, J.A., Barrios-Garrido, H., Montiel, M.G., Beltran-Pedreros, S., Marmontel, M., Santos, M.C., Rossi-Santos, M., Santos, F.R., Baker,C.S., 2007. Taxonomic status of the genus Sotalia: species level ranking for‘‘tucuxi” (Sotalia fluviatilis) and ‘‘costero” (Sotalia guianensis) dolphins. Mar.Mamm. Sci. 23, 358–386.
Charlton, K., Taylor, A.C., McKechnie, S.W., 2006. A note on divergent mtDNAlineages of ‘‘bottlenose” dolphins from coastal waters of southern Australia. J.Cetacean Res. Manage. 8 (2), 173–179.
Cirano, M., Middleton, J.F., 2004. Aspects of the mean wintertime circulation alongthe Australia’s southern shelves: numerical studies. J. Phys. Oceanogr. 34, 668–684.
Clement, M., Posada, D., Crandall, K.A., 2000. TCS: a computer program to estimategene genealogies. Mol. Ecol. 9, 1657–1659.
Dartnall, A.J., 1974. Littoral biogeography. In: Williams, W.D. (Ed.), Biogeographyand Ecology in Tasmania. Dr. W. Junk, The Hague, pp. 171–194.
Felsenstein, J., 1985. Confidence limits on phylogenies: an approach using thebootstrap. Evolution 34, 783–791.
Godfrey, J., Cresswell, G., Golding, T., Pearce, A., Bpyd, R., 1980. The separation of theEast Australian Current. J. Phys. Oceanogr. 10, 430–440.
Hale, P.T., Barreto, A.S., Ross, G.J.B., 2000. Comparative morphology and distributionof the aduncus and truncatus forms of bottlenose dolphin Tursiops in the Indianand Western Pacific Oceans. Aquat. Mamm. 26, 101–110.
Hillis, D.M., Bull, J.J., 1993. An empirical test of bootstrapping as a method forassessing confidence in phylogenetic analysis. Syst. Biol. 42, 182–192.
Hoelzel, A.R., Potter, C.W., Best, P.B., 1998. Genetic differentiation betweenparapatric ‘nearshore’ and ‘offshore’ populations of the bottlenose dolphin.Proc. R. Soc. Lond. B 265, 1177–1183.
Kemper, C.M., 2004. Osteological variation and taxonomic affinities of bottlenosedolphins, Tursiops spp., from South Australia. Aust. J. Zool. 52, 29–48.
Knowlton, N., 1993. Sibling species in the sea. Annu. Rev. Ecol. Syst. 24, 189–216.Krützen, M., Valsecchi, E., Connor, R.C., Sherwin, W.B., 2001. Characterization of
microsatellite loci in Tursiops aduncus. Mol. Ecol. 1, 2. Notes.Krützen, M., Barré, L.M., Möller, L.M., Heithaus, M.R., Simms, C., Sherwin, W.B., 2002.
A biopsy system for small cetaceans: darting success and wound healing inTursiops spp. Mar. Mamm. Sci. 18, 863–878.
Krützen, M., Sherwin, W.B., Berggren, P., Gales, N.J., 2004. Population structure in aninshore cetacean revealed by microsattellite and mtDNA analysis: bottlenosedolphins (Tursiops sp.) in Shark Bay, Western Australia. Mar. Mamm. Sci. 20, 28–47.
Leduc, R.G., Perrin, W.F., Dizon, A.E., 1999. Phylogenetic relationships among thedelphinid cetaceans based on full cytochrome b sequences. Mar. Mamm. Sci. 15,619–648.
Möller, L.M., Beheregaray, L.B., 2004. Genetic evidence for sex-biased dispersal inresident bottlenose dolphins (Tursiops aduncus). Mol. Ecol. 13, 1607–1612.
Möller, L.M., Beheregaray, L.B., 2001. Coastal bottlenose dolphins from southeasternAustralia are Tursiops aduncus according to sequences of the mitochondrial DNAcontrol region. Mar. Mamm. Sci. 17, 249–263.
Natoli, A., Peddemors, V.M., Hoezel, A.R., 2004. Population structure and speciationin the genus Tursiops based on microsatellite and mitochondrial DNA analyses.J. Evol. Biol. 17, 363–375.
L.M. Möller et al. / Molecular Phylogenetics and Evolution 49 (2008) 674–681 681
O’Hara, T.D., Poore, G.C.B., 2000. Patterns of distribution for southern Australianmarine echinoderms and decapods. J. Biogeogr. 27, 1321–1335.
Perrin, W.F., Mitchell, E.D., Mead, J.G., van Bree, P.J.H., 1981. Stenella clymene, arediscovered tropical dolphin of the Atlantic. J. Mamm. 62, 583–598.
Pichler, F.B., Robineau, D., Goodal, R.N.P., Meyer, M.A., Olivarria, C., Baker, C.S., 2001.Origin and radiation of southern hemisphere coastal dolphins (genusCephalorhynchus). Mol. Ecol. 10, 2215–2223.
Posada, D., Crandall, K.A., 1998. MODELTEST: testing the model of DNA substitution.Bioinformatics 14, 817–818.
Pritchard, J.K., Stephens, M., Donnelly, P., 2000. Inference of population structureusing multilocus genotype data. Genetics 155, 945–959.
Raymond, M., Rousset, F., 1995. Population genetics software for exact tests andecumenicism. J. Hered. 86, 248–249.
Rice, W., 1989. Analysing tables of statistical tests. Evolution 43, 223–225.Rice, D.W., 1998. Marine mammals of the world: systematics and distribution.
Society for Marine Mammalogy, Lawrence, USA.Rosenbaum, H.C., Brownell Jr., R.L., Brown, M.W., Schaeff, C., Portway, V., White,
B.N., Malik, S., Pastene, L.A., Patenaude, N.J., Baker, C.S., Goto, M., Best, P.B.,Clapham, P.J., Hamilton, P., Moore, M., Payne, R., Rowntree, V., Tynan, C.T.,Bannister, J.L., Desalle, R., 2000. World-wide genetic differentiation ofEubalaena: questioning the number of right whale species. Mol. Ecol. 9, 1793–1802.
Ross, G.J.B., 1977. The taxonomy of bottlenosed dolphins Tursiops species in SouthAfrican waters, with notes on their biology. Ann. Cape Prov. Mus. (Nat. Hist.) 11,135–194.
Ross, G.J.B., Cockcroft, V.G., 1990. Comments on Australian bottlenose dolphins andthe taxonomic status of Tursiops aduncus (Ehrenberg, 1832). In: Leatherwood, S.,Reeves, R.R. (Eds.), The Bottlenose Dolphin. Academic Press, San Diego, pp. 101–128..
Sunnucks, P., Hales, D.F., 1996. Numerous transposed sequences of mitochondrialcytochrome oxidase I-II in aphids of the genus Sitobion (Hemiptera: Aphididae).Mol. Biol. Evol. 13, 510–523.
Sunnucks, P., Wilson, A.C.C., Beheregaray, L.B., Zenger, K., French, J., Taylor, A.C.,2000. SSCP is not so difficult: the application and utility of single-stranded
conformation polymorphism in evolutionary biology and molecular ecology.Mol. Ecol. 9, 1699–1710.
Swofford, D.L. 2003. PAUP*. Phylogenetic analysis using parsimony (*and othermethods). Version 4b 10. Sinauer Associates, Sunderland, MA.
Tamura, K., Nei, M., 1993. Estimation of the number of nucleotide substitutions inthe control region of mitochondrial DNA in humans and chimpanzees. Mol. Biol.Evol. 10, 512–526.
Templeton, A.R., Crandall, K.A., Sing, C.F., 1992. A cladistic analysis of phenotypicassociations with haplotypes inferred from restriction endonuclease mappingand DNA sequence data. III. Cladogram estimation. Genetics 132, 619–633.
Valsecchi, E., Amos, W., 1996. Microsatellite markers for the study of cetaceanpopulations. Mol. Ecol. 5, 151–156.
Waite, A.M., Thompson, P.A., Pesant, S., Feng, M., Beckley, L.E., Domingues, C.M.,Gaughan, D., Hanson, C.E., Holl, C.M., Koslow, T., Meuleners, M., Montoya, J.P.,Moore, T., Muhling, B.A., Paterson, H., Rennie, S., Strzelecki, J., Twomey, L., 2007.The Leeuwin Current and its eddies: An introductory overview. Deep-Sea Res.Part II 54, 789–796.
Wang, J.Y., Chou, L.S., White, B.N., 1999. Mitochondrial DNA analysis of sympatricmorphotypes of bottlenose dolphins (genus: Tursiops) in Chinese waters. Mol.Ecol. 8, 1603–1612.
Wang, J.Y., Chou, L.-S., White, B.N., 2000a. Osteological differences between twosympatric forms of bottlenose dolphins (genus Tursiops) in Chinese waters. J.Zool. Lond. 252, 147–162.
Wang, J.Y., Chou, L.-S., White, B.N., 2000b. Differences in the external morphology oftwo sympatric species of bottlenose dolphins (genus Tursiops) in Chinesewaters. J. Mamm. 81, 1157–1165.
Waters, J.M., O’Loughlin, P.M., Roy, M.S., 2004. Cladogenesis in a starfish speciescomplex from southern Australia: evidence for vicariant speciation? Mol. Phyl.Evol. 32, 236–245.
Waters, J.M., King, T.M., O’Loughlin, P.M., Spencer, H.G., 2005. Phylogeographicaldisjunction in abundant high-dispessal littoral gastropods. Mol. Ecol. 14, 2789–2802.
Wilson, G.A., Rannala, B., 2003. Bayesian inference of recent migration rates usingmultilocus genotypes. Genetics 163, 1177–1191.


![[MI 611-205] PH10 DolpHin Series pH Sensors and ORP10 ...](https://static.fdokumen.com/doc/165x107/63374b82479381eb2301dd3f/mi-611-205-ph10-dolphin-series-ph-sensors-and-orp10-.jpg)