Bubble ring play of bottlenose dolphins (Tursiops truncatus): Implications for cognition
Upload
independentCategory
view
3download
0
Population structure and speciation in the genus Tursiops based onmicrosatellite and mitochondrial DNA analyses
ADA NATOLI,* VICTOR M. PEDDEMORS� & A. RUS HOELZEL*
*School of Biological and Biomedical Sciences, University of Durham, Durham, UK
�Discipline of Zoology, School of Biology, University of Durban-Westville, Durban, South Africa and Natal Shark Board, Umhlanga Rocks, South Africa
Introduction
The evolutionary radiation of species is directly related
to the pattern of diversity within species, and the forces
that generate those patterns. In the marine environ-
ment, there are relatively few boundaries of the type
that can lead to differentiation by drift in territorial
species (such as rivers and mountains). For some
species, especially highly mobile marine vertebrates
such as teleost fishes, the pattern of genetic variation
can be effective panmixia across large geographic
regions (see review by Graves, 1996). However, marine
mammals often show fine-scale population structure,
although the extent varies among species (see review in
Hoelzel et al., 2002). Hoelzel (1998a) has argued that
this could be due to a combination of behavioural
specializations for local resources, social structure and in
some cases historical environmental change. In this
study, we investigate the pattern and forces leading to
population structure in a highly mobile, social marine
species, the bottlenose dolphin.
Tursiops is a polytypic genus, which in the past has
been divided into as many as 20 different species
(Hershkovitz, 1966), although often based on very
limited data. The more persistent classifications included
T. gilli and T. nuuanu in the eastern North Pacific (ENP)
(Walker, 1981) and T. aduncus (Ross, 1977; Ross &
Cockcroft, 1990) in Australia, the Indian Ocean, China
and South Africa (SA). Morphotypes differ in colour
pattern, body dimension and cranial structure, although
character distributions typically overlap (Walker, 1981;
Ross & Cockcroft, 1990). As a consequence, only the
single species T. truncatus was recognized (Ross &
Cockcroft, 1990; Wilson & Reeder, 1993) until molecular
data supported the separate classification of T. aduncus
(LeDuc et al., 1999; Wang et al., 1999). This pattern is not
uncommon among delphinid cetaceans [e.g. similar
morphotypic diversity is seen in Orcinus orca (Evans et al.,
1982; Visser & Makelainen 2000); Stenella longirostris
(Perrin et al., 1991) and Delphinus delphis (Jefferson & van
Waerebeek, 2002)]. However, it remains unclear to what
extend these are polytypic species or clusters of closely
related species (but see Hoelzel et al., 2002).
Correspondence: A. R. Hoelzel, School of Biological and Biomedical
Sciences, University of Durham, South Road DH1 3LE Durham, UK.
Tel.: +44-(0)191-334-1325; fax: +44-(0)191-334-1201;
e-mail: [email protected]
J . E V O L . B I O L . 1 7 ( 2 0 0 4 ) 3 6 3 – 3 7 5 ª 2 0 0 3 B L A C K W E L L P U B L I S H I N G L T D 363
Keywords:
bottlenose dolphins;
microsatellites;
molecular ecology;
mtDNA;
phylogeography;
population genetics;
speciation.
Abstract
Bottlenose dolphins (Tursiops truncatus) have a world-wide distribution, and
show morphotypic variation among regions. Distinctions between coastal and
pelagic populations have been documented; however, regional patterns of
differentiation had not been previously investigated in a wider geographic
context. We analysed up to nine different populations from seven different
areas of the world by mitochondrial DNA and microsatellite DNA markers, and
found differentiation among all putative regional populations. Both mtDNA
and microsatellite DNA data show significant differentiation, suggesting
restricted gene flow for both males and females. Dolphins in coastal habitat
showed less variability and were in most cases differentiated from a pelagic
lineage, which could suggest local founder events in some cases. Two coastal
populations recently classified as belonging to a new species, T. aduncus, were
each highly differentiated from populations of the truncatus morphotype, and
from each other, suggesting a possible third species represented by the South
African aduncus type.
doi:10.1046/j.1420-9101.2003.00672.x
The bottlenose dolphin has a wide distribution in both
hemispheres, from cold temperate to tropical waters. In
some parts of its range, there is a clear distinction between
populations in coastal and pelagic habitat, although this
has not been fully explored in many locations. Parapatric
coastal and pelagic populations sometimes differ in
morphology, prey choice and parasite load (Mead &
Potter, 1995; Hoelzel et al., 1998a), but the distinction
varies among geographic regions (Walker, 1981; Mead &
Potter, 1995). In most parts of its range, T. aduncus is
found in coastal habitat, and is distinguished from
T. truncatus by a smaller overall size, spotted ventral and
lateral pigmentation, and an elongated beak, among other
characters (Ross, 1977). Coastal and pelagic populations
described in Chinese waters around the Penghu Archi-
pelago were identified as T. aduncus (coastal form) and
T. truncatus (pelagic form) (Gao et al., 1995). Wang et al.
(1999) compared these populations using 5¢ mitochond-
rial DNA (mtDNA) control region sequence and found a
nucleotide divergence of 4.4%, six fixed nucleotide
differences, and reciprocal monophyly. These data,
together with the inclusion of T. aduncus in a delphinid
phylogeny based on the entire mtDNA cytochrome b
gene (LeDuc et al., 1999), support the reclassification of
aduncus morphotypes at the species level at least.
Coastal and pelagic populations in the western North
Atlantic (from Florida north to Nova Scotia) have been
compared for morphology, feeding ecology, parasite
load (Mead & Potter, 1995), haemoglobin profile (Hersh
& Duffield, 1990), microsatellite DNA and mtDNA
control region diversity (Hoelzel et al., 1998a). In each
case distinctions were evident. The genetic differenti-
ation between these populations was less than that
seen between T. truncatus and T. aduncus in China
(Wang et al., 1999). Putative populations on either side
of Florida were also compared and found to be
differentiated (based on mtDNA RFLP analysis),
although it is not clear whether all samples compared
were of the same morphotype (i.e. all coastal or all
pelagic; Dowling & Brown, 1993).
In this study, we test the hypothesis that the local fine-
scale population structure found in the western North
Atlantic for T. truncatus (Hoelzel et al., 1998a) is charac-
teristic of populations in this genus throughout its range.
Towards this end we greatly extend the representation of
regional populations in the Atlantic Ocean, and include a
comparison of aduncus-type dolphins from SA with the
published T. aduncus sequences from China, and with data
for the common dolphin (D. delphis). A sample of T. trunc-
atus from the ENP is also included. Our further objective is
to address the question of how population structure may
have evolved in a highly mobile marine vertebrate
species, given the pattern of differentiation observed.
We find differentiation among all regional populations,
with the strongest differences between the SA aduncus-
type samples and all others (including the published
Chinese T. aduncus sequences). The pattern shows a
distinction between two highly polymorphic pelagic
populations (one in the North Atlantic and one in the
North Pacific) and regional coastal populations that differ
from pelagic populations to varying extents, and often
show less polymorphism. The implication is that structure
has evolved as a result of philopatry and historical founder
events, and that behavioural strategy and historical
environmental factors are likely both important.
Materials and methods
Sample collection and DNA extraction
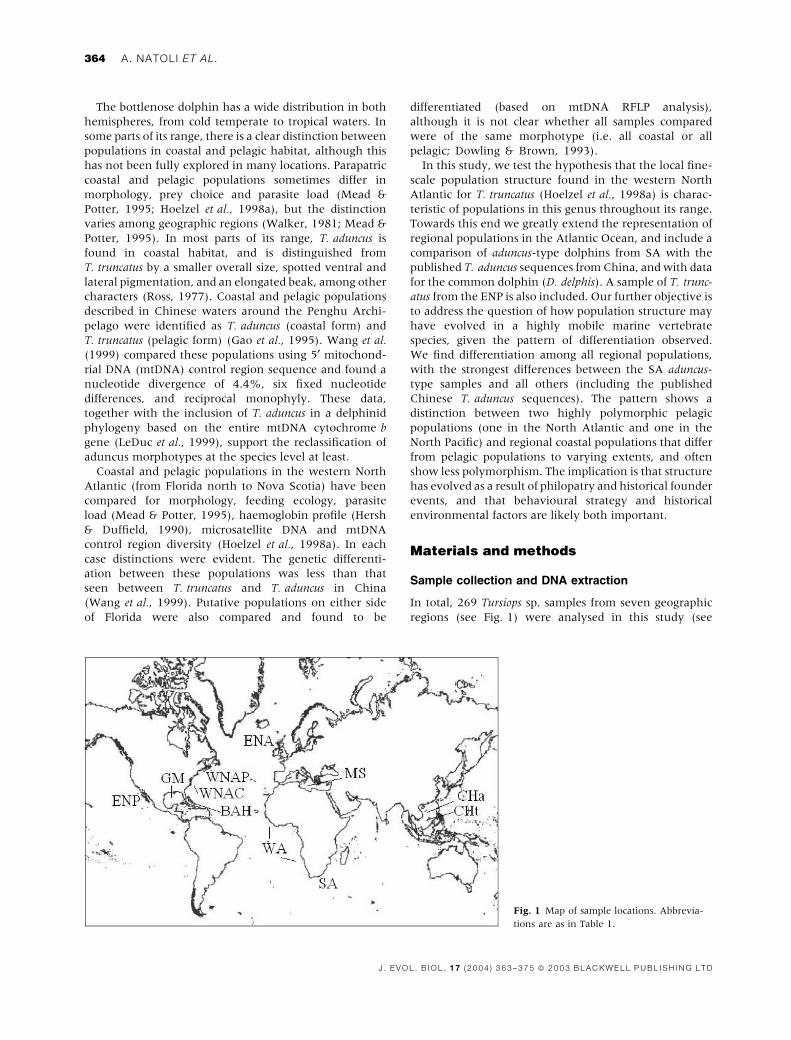
In total, 269 Tursiops sp. samples from seven geographic
regions (see Fig. 1) were analysed in this study (see
Fig. 1 Map of sample locations. Abbrevia-
tions are as in Table 1.
364 A. NATOLI ET AL.
J . E V O L . B I O L . 1 7 ( 2 0 0 4 ) 3 6 3 – 3 7 5 ª 2 0 0 3 B L A C K W E L L P U B L I S H I N G L T D
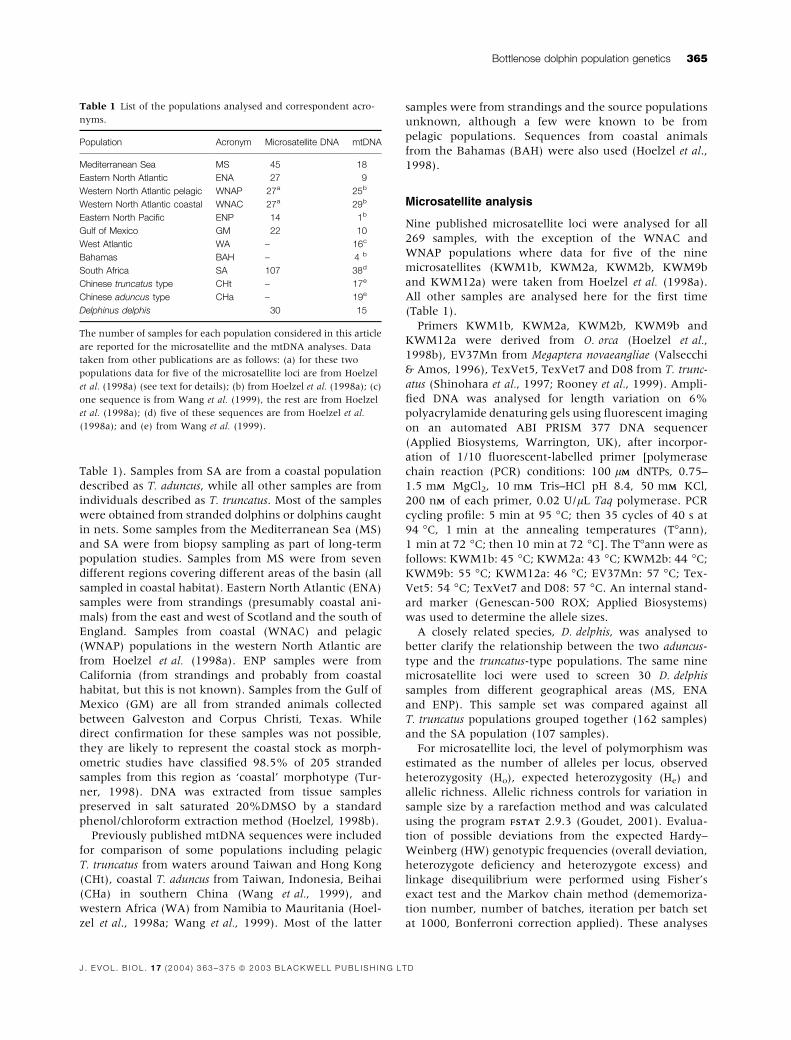
Table 1). Samples from SA are from a coastal population
described as T. aduncus, while all other samples are from
individuals described as T. truncatus. Most of the samples
were obtained from stranded dolphins or dolphins caught
in nets. Some samples from the Mediterranean Sea (MS)
and SA were from biopsy sampling as part of long-term
population studies. Samples from MS were from seven
different regions covering different areas of the basin (all
sampled in coastal habitat). Eastern North Atlantic (ENA)
samples were from strandings (presumably coastal ani-
mals) from the east and west of Scotland and the south of
England. Samples from coastal (WNAC) and pelagic
(WNAP) populations in the western North Atlantic are
from Hoelzel et al. (1998a). ENP samples were from
California (from strandings and probably from coastal
habitat, but this is not known). Samples from the Gulf of
Mexico (GM) are all from stranded animals collected
between Galveston and Corpus Christi, Texas. While
direct confirmation for these samples was not possible,
they are likely to represent the coastal stock as morph-
ometric studies have classified 98.5% of 205 stranded
samples from this region as ‘coastal’ morphotype (Tur-
ner, 1998). DNA was extracted from tissue samples
preserved in salt saturated 20%DMSO by a standard
phenol/chloroform extraction method (Hoelzel, 1998b).
Previously published mtDNA sequences were included
for comparison of some populations including pelagic
T. truncatus from waters around Taiwan and Hong Kong
(CHt), coastal T. aduncus from Taiwan, Indonesia, Beihai
(CHa) in southern China (Wang et al., 1999), and
western Africa (WA) from Namibia to Mauritania (Hoel-
zel et al., 1998a; Wang et al., 1999). Most of the latter
samples were from strandings and the source populations
unknown, although a few were known to be from
pelagic populations. Sequences from coastal animals
from the Bahamas (BAH) were also used (Hoelzel et al.,
1998).
Microsatellite analysis
Nine published microsatellite loci were analysed for all
269 samples, with the exception of the WNAC and
WNAP populations where data for five of the nine
microsatellites (KWM1b, KWM2a, KWM2b, KWM9b
and KWM12a) were taken from Hoelzel et al. (1998a).
All other samples are analysed here for the first time
(Table 1).
Primers KWM1b, KWM2a, KWM2b, KWM9b and
KWM12a were derived from O. orca (Hoelzel et al.,
1998b), EV37Mn from Megaptera novaeangliae (Valsecchi
& Amos, 1996), TexVet5, TexVet7 and D08 from T. trunc-
atus (Shinohara et al., 1997; Rooney et al., 1999). Ampli-
fied DNA was analysed for length variation on 6%
polyacrylamide denaturing gels using fluorescent imaging
on an automated ABI PRISM 377 DNA sequencer
(Applied Biosystems, Warrington, UK), after incorpor-
ation of 1/10 fluorescent-labelled primer [polymerase
chain reaction (PCR) conditions: 100 lMM dNTPs, 0.75–
1.5 mMM MgCl2, 10 mMM Tris–HCl pH 8.4, 50 mMM KCl,
200 nMM of each primer, 0.02 U/lL Taq polymerase. PCR
cycling profile: 5 min at 95 �C; then 35 cycles of 40 s at
94 �C, 1 min at the annealing temperatures (T�ann),
1 min at 72 �C; then 10 min at 72 �C]. The T�ann were as
follows: KWM1b: 45 �C; KWM2a: 43 �C; KWM2b: 44 �C;
KWM9b: 55 �C; KWM12a: 46 �C; EV37Mn: 57 �C; Tex-
Vet5: 54 �C; TexVet7 and D08: 57 �C. An internal stand-
ard marker (Genescan-500 ROX; Applied Biosystems)
was used to determine the allele sizes.
A closely related species, D. delphis, was analysed to
better clarify the relationship between the two aduncus-
type and the truncatus-type populations. The same nine
microsatellite loci were used to screen 30 D. delphis
samples from different geographical areas (MS, ENA
and ENP). This sample set was compared against all
T. truncatus populations grouped together (162 samples)
and the SA population (107 samples).
For microsatellite loci, the level of polymorphism was
estimated as the number of alleles per locus, observed
heterozygosity (Ho), expected heterozygosity (He) and
allelic richness. Allelic richness controls for variation in
sample size by a rarefaction method and was calculated
using the program FSTATFSTAT 2.9.3 (Goudet, 2001). Evalua-
tion of possible deviations from the expected Hardy–
Weinberg (HW) genotypic frequencies (overall deviation,
heterozygote deficiency and heterozygote excess) and
linkage disequilibrium were performed using Fisher’s
exact test and the Markov chain method (dememoriza-
tion number, number of batches, iteration per batch set
at 1000, Bonferroni correction applied). These analyses
Table 1 List of the populations analysed and correspondent acro-
nyms.
Population Acronym Microsatellite DNA mtDNA
Mediterranean Sea MS 45 18
Eastern North Atlantic ENA 27 9
Western North Atlantic pelagic WNAP 27a 25b
Western North Atlantic coastal WNAC 27a 29b
Eastern North Pacific ENP 14 1b
Gulf of Mexico GM 22 10
West Atlantic WA – 16c
Bahamas BAH – 4 b
South Africa SA 107 38d
Chinese truncatus type CHt – 17e
Chinese aduncus type CHa – 19e
Delphinus delphis 30 15
The number of samples for each population considered in this article
are reported for the microsatellite and the mtDNA analyses. Data
taken from other publications are as follows: (a) for these two
populations data for five of the microsatellite loci are from Hoelzel
et al. (1998a) (see text for details); (b) from Hoelzel et al. (1998a); (c)
one sequence is from Wang et al. (1999), the rest are from Hoelzel
et al. (1998a); (d) five of these sequences are from Hoelzel et al.
(1998a); and (e) from Wang et al. (1999).
Bottlenose dolphin population genetics 365
J . E V O L . B I O L . 1 7 ( 2 0 0 4 ) 3 6 3 – 3 7 5 ª 2 0 0 3 B L A C K W E L L P U B L I S H I N G L T D

were performed using GENEPOPGENEPOP 3.1d (Raymond & Rous-
set, 1995a,b). Genetic differentiation among populations
was assessed based on both the infinite allele model using
FST and the stepwise mutation model using RhoST. The
level of differentiation between population pairs was
estimated as FST (Weir & Cockerham, 1984) using the
program FSTATFSTAT 2.9.3 and RhoST using the program
RstCalc (Goodman, 1997). The significance of the
difference of FST and RhoST values from zero was tested
by permutation analysis, and the Sequential Bonferroni
correction (Holm, 1979) was applied using the program
Multiplicity (Brown & Russel, 1996). A permutation test
to assess differentiation for allele size was performed
comparing FST and RhoST using the program SPAGeDi
(Hardy & Vekemans, 2002). Genetic distances bet-
ween populations were estimated using Nei’s Da gen-
etic distance (Nei, 1987). Calculations were performed
using GenDist (http://www.biology.ualberta.ca/jbrzusto/
GeneDist.html). The distance matrix was used to recon-
struct unrooted neighbour-joining trees as implemented
in PHYLIPPHYLIP version 3.56 (Felsenstein, 1993).
mtDNA analysis
The first 297 bp at the 5¢-end of the mtDNA control
region were sequenced in a total of 70 samples, while
further sequences were obtained from the published
databases. In total 186 sequences of Tursiops sp. were
available (see Table 1).
The mitochondrial DNA control region was amplified
with universal primers MTCRf (5¢-TTC CCC GGT GTA
AAC C) and MTCRr (5¢-ATT TTC AGT GTC TTG CTT T)
after Hoelzel (1998b). The PCR reaction conditions were
as follows: 100 lMM dNTPs, 1.5 mMM MgCl2, 10 mMM Tris–
HCl pH 8.4, 50 mMM KCl, 200 nMM of each primer, 0.02 U/
lL Taq polymerase. The PCR cycling profile was 4 min at
95 �C, 35 cycles of 45 s at 94 �C, 1.5 min at 50 �C and
1.5 min at 72 �C followed by 8 min at 72 �C. PCR
products were purified with QIAgen PCR purification
columns (Qiagen, GmbH, Germany) and sequenced
directly using the ABI dye-terminator method. Five
samples were sequenced in both directions and no
ambiguities were found. A total of 15 D. delphis haplo-
types including two from MS, five from ENA (sequenced
for this study) and eight from ENP (from Rosel et al.,
1994) were also included. Sequence alignment was
performed using SEQUENCHERSEQUENCHER 3.0 (Gene Code Corp.
Ann Arbor, MI, USA).
The degree of differentiation (FST and UST) and Tajim-
a’s D were estimated using ARLEQUINARLEQUIN 2.0 (Schneider et al.,
1999). Estimates of UST used the Tamura–Nei genetic
distance model (Tamura & Nei, 1993) with a gamma
correction of a ¼ 0.47 (as estimated for the 5¢-hypervar-
iable segment of the human control region by Wakeley,
1993). Genetic distance (Da) was estimated using Tam-
ura–Nei with the SENDBSSENDBS program, written by N. Takezaki
(National Institute of Genetics, Mishima, Shizuoka, Japan;
http://oat.bio.indiana.edu:7580/documents/public/
molbio/tools/Sendbs/). SENDBSSENDBS was also used to estimate
p. Populations were compared using Da by neighbour-
joining in PHYLIPPHYLIP (unrooted trees), as for the microsatellite
DNA data, and the two consensus trees compared for
congruence using the quartet method and the program
QUARTETQUARTET (Estabrook, 1992).
Individual haplotypes were compared phylogenetically
by the neighbour-joining method using PAUPPAUP* 4.0b10
(Swofford, 1997) and rooted with homologous sequence
from the killer whale (O. orca). Majority-rule consensus
trees were constructed from 1000 bootstrap replications
and a 50% criterion for the retention of nodes was
applied. Distances were based on Tamura–Nei as above.
The ti/tv ratio was set at 6 : 1, based on observed values.
A maximum parsimony phylogenetic reconstruction was
based on 1000 bootstrap replications, retaining branches
with 50% support or greater.
A median-joining network was generated to infer
phylogenetic relationships between the Atlantic and
Mediterranean mtDNA haplotypes (ENA, MS, WA,
WNAC, WNAP and GM), using the program Network
2.0 (Bandelt et al., 1999; http://www.fluxus-engineer-
ing.com).
Results
Microsatellite results
Each pair of loci was tested for linkage disequilibrium and
genotypic independence was confirmed. Expected (He)
and observed (Ho) heterozygosity values for each locus
are reported in Table 2. HW equilibrium was tested for
each population at each locus. Only the Mediterranean
population deviated significantly from the HW genotypic
proportions (v218 ¼ 96.5, P < 0.001) and a significant
heterozygote deficiency was found for two loci (Table 2).
Omission of these loci did not significantly change the
pattern of differentiation between MS and other popu-
lations, so they were retained for the results presented
below. No significant heterozygote excess was observed
at any locus in any population. Comparisons among
populations showed higher average allelic diversity and
heterozygosity in WNAP and MS than any of the other
populations (see Table 2). In the North Atlantic, allelic
richness was significantly greater in the pelagic WNAP
sample than in the coastal WNAC, GM and ENA samples
combined (Mann–Whitney U-test: Z ¼ )2.14, P < 0.05),
but WNAP was not significantly different from MS (nor
were WNAC, GM or ENA significantly different from
each other). A similar pattern is seen for heterozygosity
where average Ho is significantly higher for WNAP than
WNAC, GM and ENA combined (Mann–Whitney U-test:
Z ¼ )1.96, P ¼ 0.05), and WNAP was not significantly
different from MS.
Genetic differentiation among pairwise populations was
estimated using FST and RhoST. The results obtained with
366 A. NATOLI ET AL.
J . E V O L . B I O L . 1 7 ( 2 0 0 4 ) 3 6 3 – 3 7 5 ª 2 0 0 3 B L A C K W E L L P U B L I S H I N G L T D
Tab
le2
Nu
mber
of
all
ele
s,expect
ed
(He)
an
dobse
rved
(Ho)
hete
rozy
gosi
ties
for
each
popu
lati
on
at
each
mic
rosa
tell
ite
locu
s.
Loci
Pop
ula
tions
Tru
ncatu
sA
duncus
MS
n¼
45
EN
A
n¼
27
WN
AP
n¼
27
EN
P
n¼
14
WN
AC
n¼
27
GM
n¼
22
SA
n¼
107
KW
M1b
No.
of
Alle
les
4(2
)[2
.8]
2[1
.9]
3[1
.8]
3(1
)[2
.8]
2[2
.0]
2[2
.0]
4(2
)[2
.4]
Ho
0.0
67*
0.0
80
0.0
83
0.2
50
0.3
48
0.2
27
0.5
05
He
0.2
48
0.1
87
0.1
22
0.3
08
0.3
29
0.3
12
0.5
24
KW
M2a
No.
of
Alle
les
10
(2)
[6.1
]4
[3.7
]7
[6.5
]5
[4.7
]4
[3.8
]5
[4.3
]4
(1)
[3.0
]
Ho
0.7
04
0.7
04
0.7
08
0.6
15
0.6
80
0.7
62
0.3
64
He
0.7
61
0.6
58
0.8
37
0.7
32
0.6
07
0.6
69
0.4
65
KW
M2b
No.
of
Alle
les
7(1
)[3
.3]
3[2
.9]
5[3
.5]
3[2
.9]
2[1
.7]
3[2
.6]
2[1
.9]
Ho
0.2
67
0.4
0.3
48
0.4
61
0.0
87
0.1
76
0.2
15
He
0.3
18
0.4
73
0.3
46
0.4
80
0.1
27
0.3
15
0.2
01
KW
M9b
No.
of
Alle
les
6[4
.3]
5[3
.1]
6[5
.7]
4[3
.7]
5[4
.0]
3[2
.7]
6(3
)[4
.3]
Ho
0.4
39
0.5
38
0.8
0.5
83
0.5
38
0.3
33
0.7
57
He
0.5
97
0.5
81
0.8
18
0.6
16
0.6
67
0.4
26
0.7
08
KW
M12a
No.
of
Alle
les
12
(1)
[7.3
]9
[6.2
]10
(1)
[7.5
]4
[3.9
]5
[4.4
]4
[3.9
]11
[6.3
]
Ho
0.7
10
0.6
96
0.6
67
0.5
45
0.6
67
0.3
68
0.7
55
He
0.7
98
0.7
50.8
07
0.5
15
0.7
20.6
54
0.7
70
EV
37M
n
No.
of
Alle
les
24
(3)
[12.8
]12
[8.6
]17
(1)
[11.9
]4
[6.4
]13
[8.2
]14
[10.6
]15
[6.3
]
Ho
0.9
23
0.6
15
0.9
17
0.6
92
0.7
78
0.9
54
0.7
43
He
0.9
47
0.8
48
0.9
26
0.7
69
0.8
15
0.9
21
0.8
11
TexV
et5
No.
of
Alle
les
5[4
.4]
5[4
.0]
9[7
.6]
6(1
)[6
.3]
6[4
.6]
4[4
.0]
6(1
)[4
.8]
Ho
0.5
67
0.6
11
0.8
33
0.6
43
0.6
30.4
0.7
11
He
0.6
81
0.5
71
0.8
71
0.7
54
0.6
99
0.6
0.6
96
TexV
et7
No.
of
Alle
les
9(1
)[4
.8]
4[3
.2]
8(1
)[6
.4]
5(1
)[4
.4]
6[4
.1]
5[4
.3]
4[2
.3]
Ho
0.3
64*
0.5
93
0.7
31
0.5
71
0.6
30.7
62
0.4
49
He
0.5
70
0.5
43
0.8
12
0.5
93
0.6
60.7
11
0.5
06
D08 No.
of
Alle
les
11
(2)
[6.4
]4
[3.7
]11
(1)
[7.7
]4
[3.7
]7
[4.4
]4
[3.9
]4
[1.7
]
Ho
0.6
98
0.4
61
0.8
08
0.4
61
0.6
67
0.6
67
0.0
75
He
0.7
85
0.4
95
0.8
69
0.5
48
0.6
0.6
79
0.0
82
Bottlenose dolphin population genetics 367
J . E V O L . B I O L . 1 7 ( 2 0 0 4 ) 3 6 3 – 3 7 5 ª 2 0 0 3 B L A C K W E L L P U B L I S H I N G L T D

the two methods both show significant differentiation for
all pairwise comparisons (Table 3), including the com-
parison between coastal samples from either side of
Florida (WNAC vs. GM). The smallest values, although
still significant, were seen between WNAP and MS. The
SA population showed the highest differentiation com-
pared with all the other populations. The data suggest
relative similarity between two clusters of putative pop-
ulations, MS, ENA and WNAP for one, and WNAC and
GM for the other. A comparison between FST and RhoST to
assess the role of allele size in population differentiation
(after Hardy et al., 2003) indicated no significant role for
allele size. The phylogeny comparing populations based
on Da distances and a neighbour-joining analysis was also
consistent with the grouping indicated by the FST and
RhoST analyses (Fig. 2).
mtDNA sequence analysis
Mitochondrial DNA control region sequences were com-
pared among the 70 samples sequenced for this study
(see Table 1) and in comparison with database sequences
representing WA (Hoelzel et al., 1998a; Wang et al.,
1999), the BAH (Hoelzel et al., 1998a) and China, where
two populations had been described, one as aduncus type
(CHa) and the other as truncatus type (CHt) (Wang et al.,
1999).
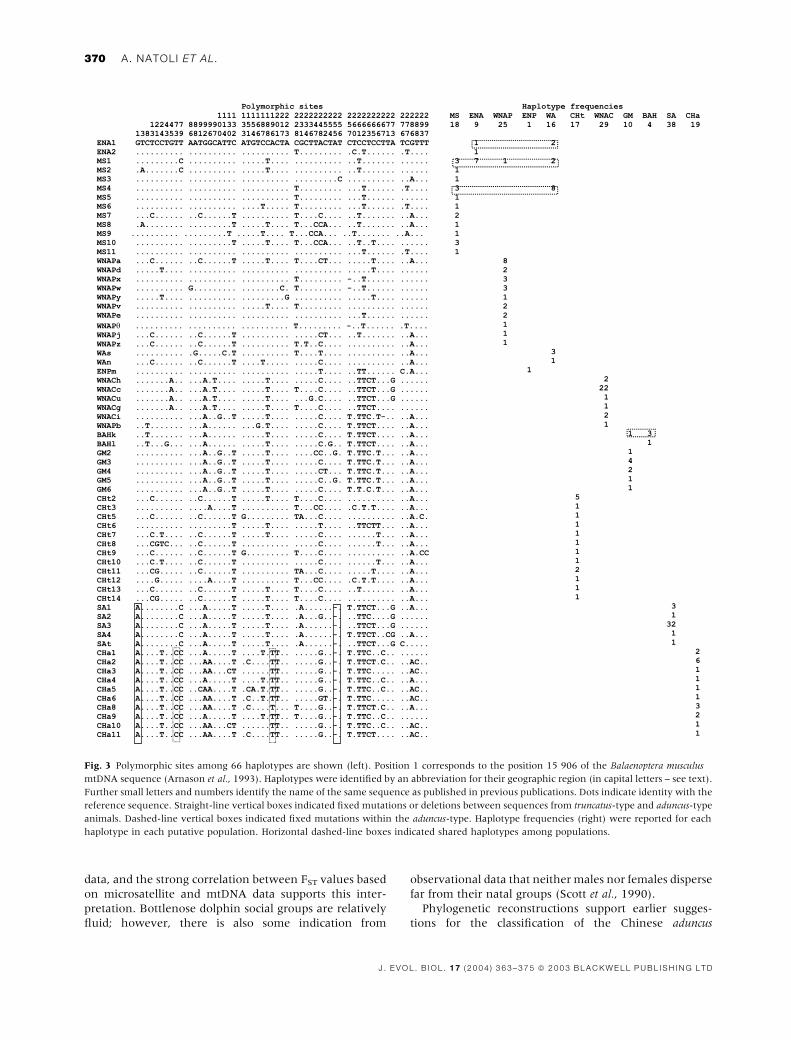
Sixty six haplotypes were identified showing 56 poly-
morphic sites (Fig. 3). Shared haplotypes between puta-
tive populations were uncommon, observed for three
haplotypes among the WNAP, MS, ENA and WA popu-
lations, and for one haplotype among GM and BAH. The
alignment showed fixed differences distinguishing the SA
aduncus-type, Chinese aduncus-type and truncatus-type
haplotypes (Fig. 3).
Average gene and nucleotide diversities were estimated
for each population. Diversities were relatively high for
MS (gene and nucleotide diversities, respectively: 0.94,
0.023), WNAP (0.88, 0.022), Chinese pelagic truncatus-
type (0.92, 0.024) and WA (0.73, 0.023) populations, and
relatively low for the coastal ENA (0.42, 0.016), WNACTab
le2
Con
tin
ued
Loci
Pop
ula
tions
Tru
ncatu
sA
duncus
MS
n¼
45
EN
A
n¼
27
WN
AP
n¼
27
EN
P
n¼
14
WN
AC
n¼
27
GM
n¼
22
SA
n¼
107
Ave
rage
No.
of
alle
les
9.8
±6.0
[5.8
±3.0
]5.3
±3.2
[4.2
±2.0
]8.4
±4.1
[6.5
±2.8
]4.2
±1.0
[4.3
±1.3
]5.6
±3.3
[4.1
±1.8
]4.9
±3.6
[4.3
±2.5
]6.2
±4.1
[3.7
±1.8
]
(±S
D)
Ho
0.5
27
±0.2
66
0.5
22
±0.1
93
0.6
55
±0.2
68
0.5
36
±0.1
32
0.5
58
±0.2
13
0.5
17
±0.2
75
0.5
08
±0.2
54
He
0.6
33
±0.2
28
0.5
67
±0.1
87
0.7
12
±0.2
79
0.5
91
±0.1
50
0.5
80
±0.2
16
0.5
87
±0.2
01
0.5
29
±0.2
52
Nu
mber
of
pri
vate
all
ele
sare
giv
en
inpare
nth
ese
san
dall
eli
cri
chn
ess
insq
uare
bra
ckets
.Th
east
eri
sks
indic
ate
those
loci
wit
ha
P-v
alu
e<
0.0
0079
(Bon
ferr
on
ico
rrect
ion
appli
ed)
wh
en
test
ed
for
hete
rozy
gote
defi
cien
cy.
Abbre
via
tion
sare
as
inTable
1.
Table 3 Genetic differentiation among pairwise populations using
microsatellite data.
n MS ENA WNAP ENP WNAC GM SA
MS 45 0.048* 0.034* 0.353** 0.196** 0.161** 0.345**
ENA 27 0.098* 0.161** 0.460** 0.367** 0.314** 0.540**
WNAP 27 0.064* 0.116* 0.272** 0.236** 0.251** 0.392**
ENP 14 0.283* 0.288* 0.219* 0.511** 0.555** 0.710**
WNAC 27 0.221* 0.282* 0.205* 0.270* 0.060* 0.576**
GM 22 0.224* 0.282* 0.199* 0.281* 0.060* 0.526**
SA 107 0.293* 0.273* 0.260* 0.364* 0.345* 0.317*
FST values are reported below the diagonal, whereas RhoST values
are reported above the diagonal. All the FST and RhoST values
are significantly different from zero (*P < 0.05, **P < 0.0001).
Abbreviations are as in Table 1.
368 A. NATOLI ET AL.
J . E V O L . B I O L . 1 7 ( 2 0 0 4 ) 3 6 3 – 3 7 5 ª 2 0 0 3 B L A C K W E L L P U B L I S H I N G L T D
(0.43, 0.018), SA (0.29, 0.008), GM (0.72, 0.013) and CHa
(0.88, 0.015). Tajima’s D was large and negative for three
of the populations (ENA: )0.97; WNAC: )1.22; SA:
)1.57), suggesting possible population expansion,
although it was only significant at the 0.05 level (beta
distribution approximation) for the SA population.
Genetic differentiation among pairwise populations
was estimated using FST and UST (Table 4). All pairwise
comparisons showed significant differentiation, consis-
tent with the pattern obtained with the microsatellite
data. We also found a significant correlation between the
FST and UST matrices applying the Mantel test (d.f. ¼ 8,
P ¼ 0.02). Significant correlation was also found
between the mtDNA and microsatellite DNA FST matrices
(Mantel test: d.f. ¼ 4, P < 0.001).
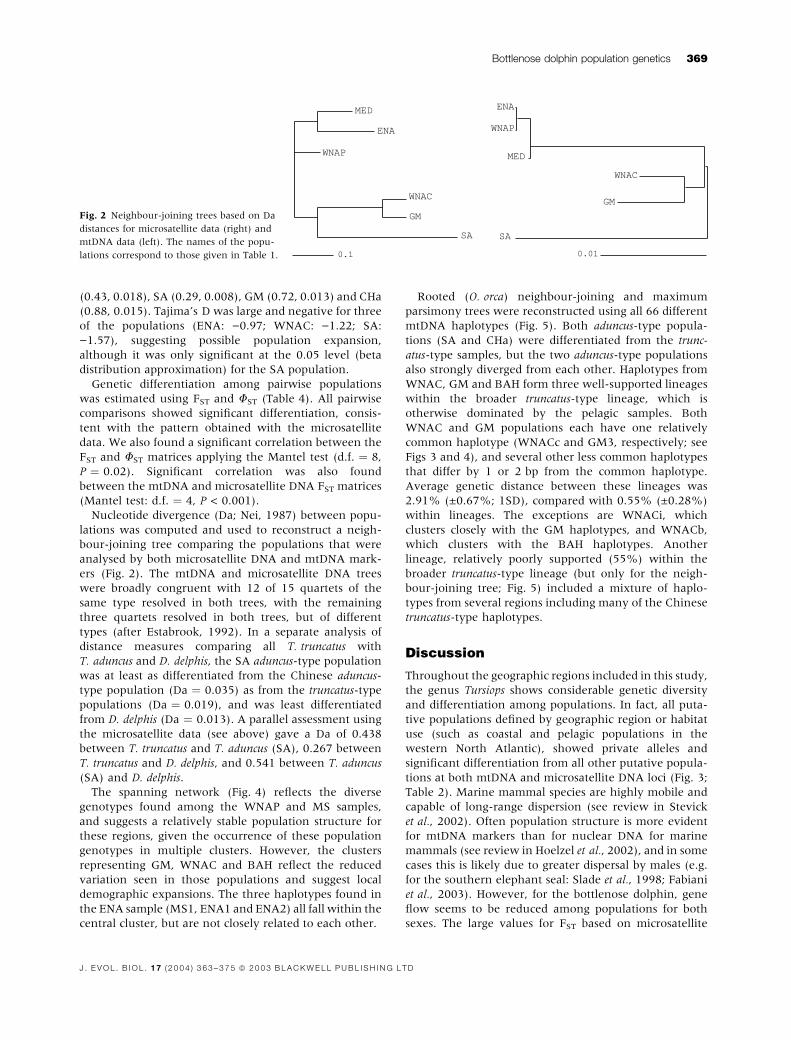
Nucleotide divergence (Da; Nei, 1987) between popu-
lations was computed and used to reconstruct a neigh-
bour-joining tree comparing the populations that were
analysed by both microsatellite DNA and mtDNA mark-
ers (Fig. 2). The mtDNA and microsatellite DNA trees
were broadly congruent with 12 of 15 quartets of the
same type resolved in both trees, with the remaining
three quartets resolved in both trees, but of different
types (after Estabrook, 1992). In a separate analysis of
distance measures comparing all T. truncatus with
T. aduncus and D. delphis, the SA aduncus-type population
was at least as differentiated from the Chinese aduncus-
type population (Da ¼ 0.035) as from the truncatus-type
populations (Da ¼ 0.019), and was least differentiated
from D. delphis (Da ¼ 0.013). A parallel assessment using
the microsatellite data (see above) gave a Da of 0.438
between T. truncatus and T. aduncus (SA), 0.267 between
T. truncatus and D. delphis, and 0.541 between T. aduncus
(SA) and D. delphis.
The spanning network (Fig. 4) reflects the diverse
genotypes found among the WNAP and MS samples,
and suggests a relatively stable population structure for
these regions, given the occurrence of these population
genotypes in multiple clusters. However, the clusters
representing GM, WNAC and BAH reflect the reduced
variation seen in those populations and suggest local
demographic expansions. The three haplotypes found in
the ENA sample (MS1, ENA1 and ENA2) all fall within the
central cluster, but are not closely related to each other.
Rooted (O. orca) neighbour-joining and maximum
parsimony trees were reconstructed using all 66 different
mtDNA haplotypes (Fig. 5). Both aduncus-type popula-
tions (SA and CHa) were differentiated from the trunc-
atus-type samples, but the two aduncus-type populations
also strongly diverged from each other. Haplotypes from
WNAC, GM and BAH form three well-supported lineages
within the broader truncatus-type lineage, which is
otherwise dominated by the pelagic samples. Both
WNAC and GM populations each have one relatively
common haplotype (WNACc and GM3, respectively; see
Figs 3 and 4), and several other less common haplotypes
that differ by 1 or 2 bp from the common haplotype.
Average genetic distance between these lineages was
2.91% (±0.67%; 1SD), compared with 0.55% (±0.28%)
within lineages. The exceptions are WNACi, which
clusters closely with the GM haplotypes, and WNACb,
which clusters with the BAH haplotypes. Another
lineage, relatively poorly supported (55%) within the
broader truncatus-type lineage (but only for the neigh-
bour-joining tree; Fig. 5) included a mixture of haplo-
types from several regions including many of the Chinese
truncatus-type haplotypes.
Discussion
Throughout the geographic regions included in this study,
the genus Tursiops shows considerable genetic diversity
and differentiation among populations. In fact, all puta-
tive populations defined by geographic region or habitat
use (such as coastal and pelagic populations in the
western North Atlantic), showed private alleles and
significant differentiation from all other putative popula-
tions at both mtDNA and microsatellite DNA loci (Fig. 3;
Table 2). Marine mammal species are highly mobile and
capable of long-range dispersion (see review in Stevick
et al., 2002). Often population structure is more evident
for mtDNA markers than for nuclear DNA for marine
mammals (see review in Hoelzel et al., 2002), and in some
cases this is likely due to greater dispersal by males (e.g.
for the southern elephant seal: Slade et al., 1998; Fabiani
et al., 2003). However, for the bottlenose dolphin, gene
flow seems to be reduced among populations for both
sexes. The large values for FST based on microsatellite
Fig. 2 Neighbour-joining trees based on Da
distances for microsatellite data (right) and
mtDNA data (left). The names of the popu-
lations correspond to those given in Table 1.
Bottlenose dolphin population genetics 369
J . E V O L . B I O L . 1 7 ( 2 0 0 4 ) 3 6 3 – 3 7 5 ª 2 0 0 3 B L A C K W E L L P U B L I S H I N G L T D
data, and the strong correlation between FST values based
on microsatellite and mtDNA data supports this inter-
pretation. Bottlenose dolphin social groups are relatively
fluid; however, there is also some indication from
observational data that neither males nor females disperse
far from their natal groups (Scott et al., 1990).
Phylogenetic reconstructions support earlier sugges-
tions for the classification of the Chinese aduncus
Fig. 3 Polymorphic sites among 66 haplotypes are shown (left). Position 1 corresponds to the position 15 906 of the Balaenoptera musculus
mtDNA sequence (Arnason et al., 1993). Haplotypes were identified by an abbreviation for their geographic region (in capital letters – see text).
Further small letters and numbers identify the name of the same sequence as published in previous publications. Dots indicate identity with the
reference sequence. Straight-line vertical boxes indicated fixed mutations or deletions between sequences from truncatus-type and aduncus-type
animals. Dashed-line vertical boxes indicated fixed mutations within the aduncus-type. Haplotype frequencies (right) were reported for each
haplotype in each putative population. Horizontal dashed-line boxes indicated shared haplotypes among populations.
370 A. NATOLI ET AL.
J . E V O L . B I O L . 1 7 ( 2 0 0 4 ) 3 6 3 – 3 7 5 ª 2 0 0 3 B L A C K W E L L P U B L I S H I N G L T D
morphotype as an ESU (Evolutionary Significant Unit)
(Wang et al., 1999), but also suggest that the SA coastal
population of ‘aduncus-type’ dolphins represents an
independent lineage from both the truncatus-type popu-
lations and ‘T. aduncus’ from China. The high distance
values for microsatellite DNA markers also indicate
substantial differentiation between the SA aduncus-type
and all other populations. As the initial description of the
‘aduncus’ form was based on the SA population (Ross,
1977), we propose (given that further data continue to
support the interpretation of isolation and differentiation
among these populations) that this ‘species’ retains the
name T. aduncus, while the Chinese population could be
reclassified as a third species. The inclusion of D. delphis
in our distance comparisons, and the closeness of
especially the SA aduncus form to this species, raises the
issue of generic classification as well (as earlier indicated
in LeDuc et al., 1999). However, we have not attempted
any further resolution of the generic status of these
species in this study. Both the neighbour-joining and the
maximum parsimony phylogenetic reconstructions sup-
ported the same lineage structure for the T. truncatus
populations, with the exception of a lineage with 55%
bootstrap support in the neighbour-joining tree, not
supported in the maximum parsimony tree. This lineage
was dominated by pelagic samples. Lineages representing
coastal populations (WNAC, GM and BAH) were well
supported in both reconstructions.
The lack of significant differentiation in microsatellite
DNA allele size among populations suggests that genetic
drift is important and that the rate of gene flow may be
high relative to the mutation rate. For the mtDNA data,
FST and UST were similar for comparisons among popu-
lations from the ENA, pelagic western North Atlantic,
West Africa and the Mediterranean, but UST values were
much larger for some other comparisons (Table 4). This
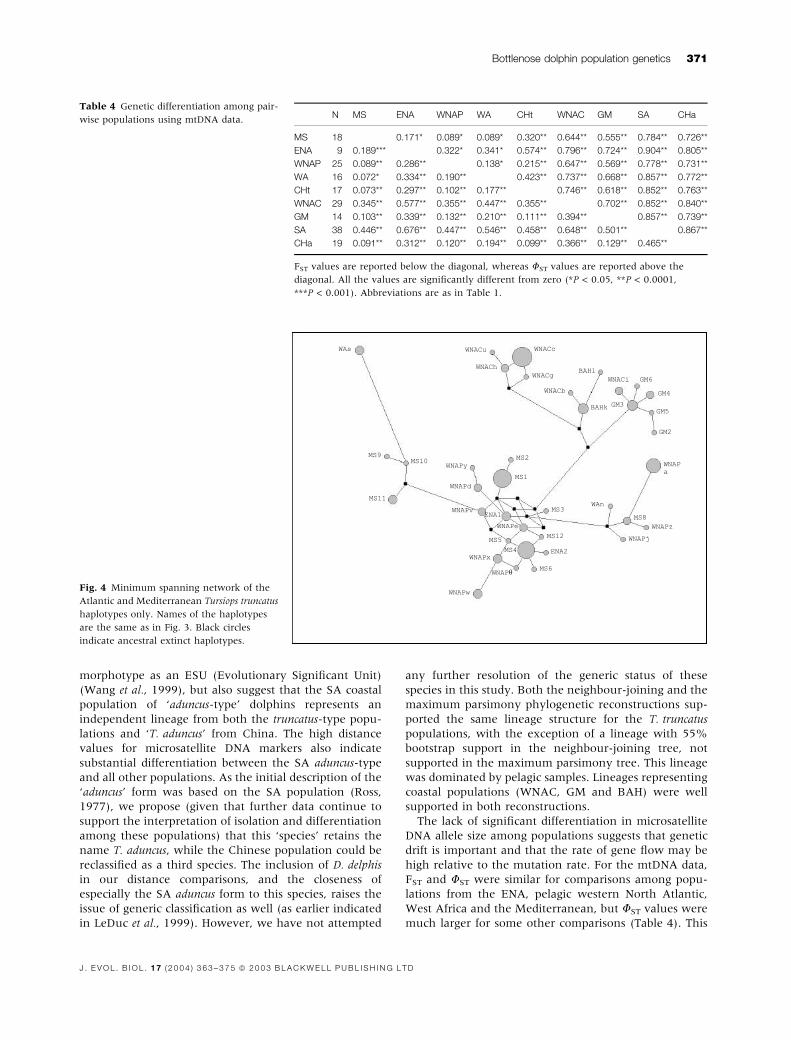
Table 4 Genetic differentiation among pair-
wise populations using mtDNA data.N MS ENA WNAP WA CHt WNAC GM SA CHa
MS 18 0.171* 0.089* 0.089* 0.320** 0.644** 0.555** 0.784** 0.726**
ENA 9 0.189*** 0.322* 0.341* 0.574** 0.796** 0.724** 0.904** 0.805**
WNAP 25 0.089** 0.286** 0.138* 0.215** 0.647** 0.569** 0.778** 0.731**
WA 16 0.072* 0.334** 0.190** 0.423** 0.737** 0.668** 0.857** 0.772**
CHt 17 0.073** 0.297** 0.102** 0.177** 0.746** 0.618** 0.852** 0.763**
WNAC 29 0.345** 0.577** 0.355** 0.447** 0.355** 0.702** 0.852** 0.840**
GM 14 0.103** 0.339** 0.132** 0.210** 0.111** 0.394** 0.857** 0.739**
SA 38 0.446** 0.676** 0.447** 0.546** 0.458** 0.648** 0.501** 0.867**
CHa 19 0.091** 0.312** 0.120** 0.194** 0.099** 0.366** 0.129** 0.465**
FST values are reported below the diagonal, whereas UST values are reported above the
diagonal. All the values are significantly different from zero (*P < 0.05, **P < 0.0001,
***P < 0.001). Abbreviations are as in Table 1.
Fig. 4 Minimum spanning network of the
Atlantic and Mediterranean Tursiops truncatus
haplotypes only. Names of the haplotypes
are the same as in Fig. 3. Black circles
indicate ancestral extinct haplotypes.
Bottlenose dolphin population genetics 371
J . E V O L . B I O L . 1 7 ( 2 0 0 4 ) 3 6 3 – 3 7 5 ª 2 0 0 3 B L A C K W E L L P U B L I S H I N G L T D

was especially true for comparisons between the aduncus-
type populations and the rest, and for the coastal
populations in the western North Atlantic in comparison
with the ENA and pelagic populations. The implication is
that there has been greater time for sequence divergence
among these populations.
Genetic diversity was highest for the population
samples known to be from pelagic sources (WNAP for
both mtDNA and microsatellite markers, and CHt based
on published data for mtDNA diversity). The coastal
populations mostly showed lower genetic variation,
including significantly lower allelic richness and hetero-
zygosity (which were also very consistent among the
coastal populations; Table 2). This could reflect inde-
pendent historical founder events, with pelagic popula-
tions representing the source. For example, WNAP may
represent a source population for founders establishing
GM, BAH and WNAC populations in the western North
Atlantic, although this would suggest that the founder
genotypes were rare in the source population, and either
unsampled or extinct in the current pelagic population
(for further discussion see Hoelzel et al., 1998a). The SA
Fig. 5 (a) Neighbour-joining and (b) maximum parsimony trees illustrating the phylogenetic relationships among 66 mtDNA haplotypes
(names correspond to those given in Fig. 2, and the abbreviations in bold refer to the geographic source of the sample). Bootstrap values >50%
are indicated. Aduncus-type haplotypes are represented by South African (SA) and Chinese (CHA) aduncus type. Chinese truncatus-type samples
are represented by CHT.
372 A. NATOLI ET AL.
J . E V O L . B I O L . 1 7 ( 2 0 0 4 ) 3 6 3 – 3 7 5 ª 2 0 0 3 B L A C K W E L L P U B L I S H I N G L T D
aduncus population may also have been founded from an
unidentified source population, although as suggested
above, the taxonomic issue has yet to be resolved.
Historical bottlenecks in coastal populations, or demo-
graphic cycles could also account for reduced diversity.
While the spanning network (Fig. 4) reinforces the
interpretation of founder origins for WNAC, GM and
BAH, ENA shows a more complex structure. This could
suggest multiple founder events or a source population
not well represented in our sample. Although coastal, the
MS population shows nearly as much diversity as WNAP,
but is also the least differentiated from WNAP, suggesting
recent or continuing gene flow. The samples from MS
may also be somewhat heterogeneous, as several geo-
graphic areas within the Mediterranean basin are repre-
sented. The significant deficiency (compared with HW
expectations) of heterozygotes at two microsatellite
DNA loci in MS may therefore reflect some population
structure within this sample (Wahlund effect).
Differential social structure in the coastal and pelagic
populations is a possible alternative explanation for the
difference in diversity, but there are no data to support
this, and the observed pattern of diversity in at least some
of the coastal populations is more consistent with
founder events. One possible mechanism for the estab-
lishment of coastal founder populations would be the
release of suitable habitat during interglacial periods. A
recent study on harbour porpoise (Phocoena phocoena)
phylogeography in the North Atlantic suggested an
influence of the last glacial epoch on their distribution
and population genetic structure (Tolley et al., 2001).
The pattern of mtDNA variation among samples from
the GM, the BAH and the WNA coastal region suggest
demographic events that left one dominant matriline at
each location. However, in the WNA coastal population
two haplotypes (represented by three individuals) stand
out as highly differentiated compared with other samples
from that region. One of these haplotypes falls clearly into
the GM lineage, and the other into the BAH lineage (see
Fig. 4). These could represent female dispersal events
from GM and BAH populations into the WNAC popula-
tion.
The high level of differentiation among regional
populations suggests a high potential for speciation in
this genus. Several of the T. truncatus populations show
reduced variation and a pattern of variation consistent
with population expansion. A possible scenario to
explain this pattern could be that peripheral populations
might have formed as founders at different times in the
past from relatively large and diverse pelagic populations.
While we have not fully characterized the putative
pelagic populations, relatively low diversity, evidence for
expansion in Tajima’s D and the structure of the span-
ning network reconstruction support this interpretation
for at least some coastal populations.
Population structure in marine vertebrates can range
from relative panmixia (e.g. the European eel, Anguilla
anguilla, Daemen et al., 2001) to highly structured pop-
ulations for species with limited dispersal range (e.g.
Acanthochromis polycanthus, Planes et al., 2001). Atlantic
and Pacific populations of striped mullet (Mugil cephalus)
were highly differentiated (Rossi et al., 1998), while
several tuna species are not differentiated among oceans
(Graves, 1996). Differences among species may in some
cases be due to life history characteristics. For example,
the relatively sedentary common sole (Solea vulgaris)
shows population structure in the MS (Guarniero et al.,
2002), while the highly mobile swordfish (Xiphias gladius)
apparently does not (Pujolar et al., 2002). At the same
time, closely related species with similar life histories may
show very different patterns of population structure (e.g.
comparing Dicentrarchus labrax and D. punctatus, Bon-
homme et al., 2002). It seems most likely that there will
typically be multiple factors involved. For example,
Riginos & Nachman (2001) found extensive population
structure for a small subtidal reef fish (Axoclinus nigricau-
dus) in California, and concluded that this structure was
due to a combination of biogeography, geographical
distance and the availability of suitable habitat. In our
study on bottlenose dolphins, we found a high degree of
population structure among geographic regions, includ-
ing differentiation between parapatric populations that
share the same coastal habitat (WNAC and GM), and
differentiation between three apparent ESUs, T. truncates
and the two aduncus-types in SA and China. The data
suggest a combination of factors leading to population
structure, including the utilization of different local
habitats, and possibly historical factors leading to the
founding of new populations.
Acknowledgments
We thank everyone who kindly provided samples: Elena
Politi, Giovanni Bearzi and Caterina Fortuna (Tethys
Research Institute), Letizia Marsili and Michela Podesta
(Centro Studi Cetacei), Giusy Buscaino (CNR, Palermo)
Frank Dhermain (Group d’Etude des Cetaces de Medi-
terranee), Domingo Mariano (University of Barcelona),
Taleb Mohamed Zoheir (Universite de Oran), Oz Goff-
man (IMMRAC) Bob Reid (SAC Veterinary Science
Division), Robert Deaville (University of London), Char-
lie Potter (Smithsonian Institute) and Daniel Engelhaup
(Texas Marine Mammal Stranding Network). Thanks to
the director and staff of the National Shark Board for
their support in the collection of South African Samples.
We thank the University of Milano scholarship and
Marion Zunz Award to Ada Natoli and the University of
Durham for their financial contribution.
References
Arnason, U., Gullberg, A. & Widegren, B. 1993. Cetacean
mtDNA control region sequences of all extant baleen whales
and two sperm whale species. Mol. Biol. Evol. 10: 960–970.
Bottlenose dolphin population genetics 373
J . E V O L . B I O L . 1 7 ( 2 0 0 4 ) 3 6 3 – 3 7 5 ª 2 0 0 3 B L A C K W E L L P U B L I S H I N G L T D
Bandelt, H.-J., Foster, P. & Rohl, A. 1999. Median joining
networks for inferring intraspecific phylogenies. Mol. Biol. Evol.
16: 37–48.
Bonhomme, F., Naciri, M., Bahir-Sfar, L. & Lemaire, C. 2002.
Comparative analysis of genetic structure of two closely
related sympatric marine fish species Dicentrarchus labrax and
D. punctatus. Comptes Rendus Biologies 325: 213–220.
Brown, B.W. & Russel, K. 1996. Multiplicity Programme. Identify-
ing Important Results from Multiple Statistical Tests (Version 2).
University of Texas, Houston.
Daemen, E., Cross, T., Ollevier, F. & Volckaert, F.A.M. 2001.
Analysis of the genetic structure of European eel (Anguilla
anguilla) using microsatellite DNA and mtDNA markers. Mar.
Biol. 139: 755–764
Dowling, T.E. & Brown, W.M. 1993. Population structure of the
bottlenose dolphin (Tursiops truncatus) as determined by
restriction endonuclease analysis of mitochondrial DNA.
Mar. Mam. Sci. 9: 138–155.
Estabrook, G.F. 1992. Evaluating undirected positional congru-
ence of individual taxa between two estimates of the phylo-
genetic tree for a group of taxa. Syst. Biol. 41: 172–177.
Evans, W.E., Yablokov, A.V. & Bowles, A.E. 1982. Geographic
variation in the color pattern of killer whales (Orcinus orca).
Rep. Int. Whale Commn. 32: 687–694.
Fabiani, A., Hoelzel, A.R., Galimberti, F. & Muelbert, M.M.C.
2003. Long-range paternal gene flow in the southern elephant
seal. Science. 299: 676.
Felsenstein, J. 1993. PHYLIP 3.5c Manual and Programme Available
From Joe Felsenstein. University of Washington, Seattle, WA,
USA.
Gao, A., Zhou, K. & Wang, Y. 1995. Geographical variation in
morphology of bottlenose dolphins (Tursiops sp.) in Chinese
waters. Aquatic Mammals 21: 121–135.
Goodman, S.J. 1997. RSTCalc: a collection of computer pro-
grams for calculation estimates of genetics differentiations
from microsatellite data and determining their significance.
Mol. Ecol. 6: 881–885.
Goudet, J. 2001. FSTAT, A Program to Estimate and Test Gene
Diversities and Fixation Indices (Version 2.9.3). Available at
http://www.unil.ch/izea/softwares/fstat.html.
Graves, J.E. 1996. Conservation genetics of fishes in the pelagic
realm. In: Conservation Genetics (J. C. Avise & J. L. Hamrick,
eds), pp. 335–366. Chapman & Hall, London, UK.
Guarniero, I., Franzellitti, S., Ungaro, N., Tommasini, S., Picci-
netti, C. & Tinti, F. 2002. Control region haplotype variation in
central Mediterranean common sole indicates geographical
isolation and population structuring in Italian stocks. J. Fish
Biol. 60: 1459–1474.
Hardy, O.J. & Vekemans X. 2002. SPAGeDi: a versatile computer
program to analyse spatial genetic structure at the individual
or population levels. Mol. Ecol. Notes 2: 618–620.
Hardy, O.J., Charbonnel, N., Freville H. & Heuertz, M. 2003.
Microsatellite allele sizes: a simple test to assess their
significance on genetic differentiation. Genetics 163: 1467–
1482.
Hersh, S.L. & Duffield, D.A. 1990. Distinction between North-
west Atlantic pelagic and coastal bottlenose dolphins based on
hemoglobin profile and morphometry. In: The Bottlenose
Dolphin (S. Leatherwood & R. R. Reevers, eds), pp. 129–139.
Academic Press, San Diego.
Hershkovitz, P. 1966. A catalogue of living whales. Bull. US Natl.
Mus. 246: 1–259.
Hoelzel, A.R. 1998a. Genetic structure of cetacean populations
in sympatry, parapatry and mixed assemblages: implications
for conservation policy. J. Hered. 89: 451–458.
Hoelzel, A.R. 1998b. Molecular Analysis of Populations: A Practical
Approach. Oxford University Press, Oxford.
Hoelzel, A.R., Potter, C.W. & Best, P.B. 1998a. Genetic
differentiation between parapatric ‘‘nearshore’’ and ‘‘off-
shore’’ populations of the bottlenose dolphin. Proc. R. Soc.
Lond. 265: 1177–1183.
Hoelzel, A.R., Dahleim, M. & Stern, S.J. 1998b. Low genetic
variation among killer whales (Orcinus orca) in the Eastern
North Pacific and genetic differentiation between foraging
specialists. J. Hered. 89: 121–128.
Hoelzel, A.R., Goldsworthy, S.D. & Fleischer, R.C. 2002.
Population genetics. In: Marine Mammal Biology: An Evolu-
tionary Approach (A. R. Hoelzel, ed.), pp. 325–352. Blackwell
Science, Oxford.
Holm, S. 1979. A simple sequentially rejective multiple test
procedure. Scand. J. Stat. 6: 56–70.
Jefferson, T.A. & van Waerebeek, K., 2002. The taxonomic status
of the nominal dolphin species Delphinus tropicalis van Bree,
1971. Mar. Mam. Sci. 18: 787–818.
LeDuc, R.G., Perrin, W.F. & Dizon, A.E. 1999. Phylogenetic
relationships among the delphinid cetaceans based on full
cytochrome b sequences. Mar. Mam. Sci. 15: 619–648.
Mead, J.G. & Potter, C.W. 1995. Recognizing two populations of
the bottlenose dolphin (Tursiops truncatus) off the Atlantic
coast of North America: morphologic and ecology considera-
tions. IBI Rep. 5: 31–44.
Nei, M. 1987. Molecular Evolutionary Genetics. Columbia Univer-
sity Press, New York.
Perrin, W.F., Akin, P.A. & Kashiwada J.V. 1991. Geographic
variation in external morphology of the spinner dolphin
Stenella longirostris in the eastern Pacific and implications for
conservation. Fish. Bull. 89: 411–428.
Planes, S., Doherty, P.J. & Bernardi, G. 2001. Strong genetic
divergence among populations of a marine fish with limited
dispersal, Acanthochromis polyacanthus, within the Great Barrier
Reef and the Coral Sea. Evolution 55: 2263–2273.
Pujolar, J.M., Roldan, M.I. & Pla, C. 2002. A genetic assess-
ment of the population structure of swordfish (Xiphias
gladius) in the Mediterranean Sea. J. Exp. Mar. Biol. Ecol.
276: 19–29
Raymond, M. & Rousset, F. 1995a. An exact test for population
differentiation. Evolution 49: 1280–1283.
Raymond, M. & Rousset, F. 1995b. GENEPOP (version 1.2):
population genetic software for exact tests and ecumenicism.
J. Hered. 86: 248–249.
Riginos, C. & Nachman, M.W. 2001. Population subdivision in
marine environments: the contributions of biogeography,
geographical distance and discontinuous habitat to genetic
differentiation in a blennioid fish, Axoclinus nigricaudus. Mol.
Ecol. 10: 1439–1453.
Rooney, A.P., Merritt, D.B. & Derr, J.N. 1999. Microsatellite
diversity in captive bottlenose dolphins (Tursiops truncatus). J.
Hered. 90: 228–231.
Rosel, P.E., Dizon, A.E. & Heyning, J.E. 1994. Genetic analysis of
sympatric morphotypes of common dolphins (genus Delphi-
nus). Mar. Biol. 119: 159–167.
Ross, G.J.B. 1977. The taxonomy of bottlenose dolphins Tursiops
species in South African waters, with notes on their biology.
Ann. Cape Prov. Museum 15: 173–410.
374 A. NATOLI ET AL.
J . E V O L . B I O L . 1 7 ( 2 0 0 4 ) 3 6 3 – 3 7 5 ª 2 0 0 3 B L A C K W E L L P U B L I S H I N G L T D
Ross, G.J.B. & Cockcroft, V.C. 1990. Comments on the
Australian bottlenose dolphins and the taxonomy status of
Tursiops aduncus (Ehrenberg, 1832). In: The Bottlenose Dolphin
(S. Leatherwood & R. R. Reevers eds), pp. 110–128. Academic
Press, New York.
Rossi, A.R., Capula, M., Crosetti, D., Sola, L. & Campton, D.E.
1998. Allozyme variation in global populations of striped
mullet, Mugil cephalus (Pices: Mugilidae). Mar. Biol. 131: 203–
212.
Schneider, S., Roessli, D. & Excoffier, L. 1999. Estimation of past
demographic parameters from the distribution of pairwise
differences when the mutation rates vary among sites:
application to human mitochondrial DNA. Genetics 152:
1079–1089.
Scott, M.D., Wells, R.S. & Irvine, A.B. 1990. A long-term study
of bottlenose dolphins on the West North Atlantic. In: The
Bottlenose Dolphin (S. Leatherwood & R. R. Reevers, eds), pp.
235–244. Academic Press, San Diego.
Shinohara, M., Domingo-Roura, X. & Takenaka, O. 1997.
Microsatellite in the bottlenose dolphin Tursiops truncatus.
Mol. Ecol. 6: 695–696.
Slade, R.W., Moritz, C., Hoelzel, A.R. & Burton, H.R. 1998.
Molecular population genetics of the southern elephant seal
Mirounga leonina. Genetics 149: 1945–1957.
Stevick, P.T., McConnell, B.J. & Hammond, P.S. 2002. Patterns
of movement. In: Marine Mammal Biology: An Evolutionary
Approach (A. R. Hoelzel, ed.), pp. 185–216. Blackwell Science,
Oxford.
Swofford, D.L. 1997. PAUP* (Phylogenetic Analysis Using Parsi-
mony), Version 4.0b10. Smithsonian Institution, Washington,
DC.
Tamura, K. & Nei, M. 1993. Estimation of the number of
nucleotide substitutions in the control region of mitochondrial
DNA in humans and chimpanzees. Mol. Biol. Evol. 10: 512–
526.
Tolley, K.A., Vikingsson, G.A. & Rosel, P.E. 2001. Mitochondrial
DNA sequence variation and phylogeographic patterns in
harbour porpoises (Phocoena phocoena) from the North Atlan-
tic. Cons. Genet. 2: 349–361.
Turner, J. 1998. A comparison of the cranial morphology of
bottlenose dolphins (Tursiops truncatus) in the Gulf of Mexico.
MS thesis, Texas A&M University.
Valsecchi, E. & Amos, B. 1996. Microsatellite markers for the
study of cetacean populations. Mol. Ecol. 5: 151–156.
Visser, I.N. & Makelainen, P. 2000. Variation in eye-patch shape
of killer whale (Orignus orca) in New Zealand waters. Mar.
Mammal. Sci. 16: 459–469.
Wakeley, J. 1993. Substitution rate variation among sites in
hypervariable region I of human mitochondrial DNA. J. Mol.
Evol. 37: 613–623.
Walker, W.A. 1981. Geographic variation in morphology and
biology of bottlenose dolphins (Tursiops) in the eastern North
Pacific. NOAA/NMFS Administrative Report no. LJ-81-0003c,
21 pp.
Wang, J.Y., Chou, L.-S. & White, B.N. 1999. Mitochondrial
DNA analysis of sympatric morphotypes of bottlenose
dolphins (genus: Tursiops) in Chinese waters. Mol. Ecol. 8:
1603–1612.
Weir, B.S. & Cockerham, C.C. 1984. Estimating F-statistics for
the analysis of population structure. Evolution 38: 1358–1370.
Wilson, D.E. & Reeder, D.M. 1993. Mammal Species of the World.
Smithsonian Institution Press, Washington, DC.
Received 9 May 2003; revised 9 October 2003; accepted 9 October 2003
Bottlenose dolphin population genetics 375
J . E V O L . B I O L . 1 7 ( 2 0 0 4 ) 3 6 3 – 3 7 5 ª 2 0 0 3 B L A C K W E L L P U B L I S H I N G L T D
Copyright © 2022 FDOKUMEN