Bubble ring play of bottlenose dolphins (Tursiops truncatus): Implications for cognition
gy, Part A 148 (2007) 266–277www.elsevier.com/locate/cbpa
Comparative Biochemistry and Physiolo
Annual, seasonal and individual variation in hematology and clinical bloodchemistry profiles in bottlenose dolphins (Tursiops truncatus)
from Sarasota Bay, Florida
Ailsa J. Hall a,⁎, Randall S. Wells b, Jay C. Sweeney c, Forrest I. Townsend d, Brian C. Balmer b,Aleta A. Hohn e, Howard L. Rhinehart b
a Sea Mammal Research Unit, Gatty Marine Laboratory, University of St. Andrews, Fife, Scotland, KY16 8LB, United Kingdomb Chicago Zoological Society, c/o Center for Marine Mammal and Sea Turtle Research, Mote Marine Laboratory 1600 Ken Thompson Parkway,
Sarasota, Florida 34236, USAc Dolphin Quest Inc., 4467 Saratoga Ave., Dan Diego, CA 92107, USA
d Bayside Hospital for Animals, 251 N.E. Racetrack Road, fort Walton Beach, LF 32547, USAe NOAA Fisheries, Beaufort, NC 28516, USA
Received 10 July 2006; received in revised form 17 April 2007; accepted 18 April 2007Available online 4 May 2007
Abstract
Hematology and clinical blood chemistry (HCBC) profiles in free-living bottlenose dolphins from Sarasota Bay, Florida have been monitoredover a 14-year period. This long-term dataset includes samples from recaptured dolphins, enabling individual variation to be accounted for wheninvestigating seasonal and annual variability. Four different laboratories carried out the assays and inter-laboratory comparisons found significantdifferences in 31 of 39 parameters measured. However, variability in comparable HCBCs by sex, age, condition, season and year could beinvestigated. Significant relationships with the independent variables were found for the majority of the HCBCs. Notable consistent seasonaldifferences included significantly elevated glucose and significantly lower creatinine concentrations in winter compared to summer. Thesedifferences may be due to energetic or thermoregulatory fluctuations in the animals by season and do not necessarily have any clinicalsignificance. Erythrocyte counts were significantly lower in the winter, possibly also due to nutritional differences. Albumin and calcium levels inthis population have increased significantly over the years of monitoring and consistently across seasons, being higher in the winter than thesummer. Again, nutritional and thermal constraints seem to be the most likely environmental factors influencing these patterns.© 2007 Elsevier Inc. All rights reserved.
Keywords: Serum chemistry; Reference ranges; Mixed effects models
Abbreviations: HCBC, Hematology and clinical blood chemistry; GLG,Growth layer groups; LME,Linearmixed effectsmodels;HCT, haematocrit; HGB,haemoglobin; MCV, mean corpuscular volume; MCH, mean cell haemoglobin;MCHC, mean corpuscular haemoglobin concentration; MPV, mean plateletvolume; RDW, red cell distribution width; CK, creatine phosphokinase (2.7.3.2);LDH, lactate dehydrogenase (EC 1.1.1.27); BUN, blood urea nitrogen; ALT,alanine aminotransferase (2.6.1.2); SDH, sorbitol dehydrogenase (EC 1.1.1.14);AST, aspartate aminotransferase (2.6.1.1); AP, alkaline phosphatase (EC 3.1.3.1);GGT, gamma-glutamyltransferase (EC 2.3.2.2).⁎ Corresponding author. Tel.: +44 1334 462630; fax: +44 1334 462632.E-mail address: [email protected] (A.J. Hall).
1095-6433/$ - see front matter © 2007 Elsevier Inc. All rights reserved.doi:10.1016/j.cbpa.2007.04.017
1. Introduction
Marine mammal populations are being increasingly impactedby disease and exposure to environmental contaminants. Overthe past 20 years the number of large-scale mortalities amongcetacean and seal species has increased worldwide (Geraci et al.,1982; Dietz et al., 1989; Aguilar and Raga, 1993; Krafft et al.,1995; Harvell et al., 1999; Scholin et al., 2000). The reason forthis phenomenon is not clear but climate change and an increasein human activities in the oceans have been implicated (Harvellet al., 1999). The causes and consequences of disease and dis-ease cycles in marine ecosystems remain poorly understood and
267A.J. Hall et al. / Comparative Biochemistry and Physiology, Part A 148 (2007) 266–277
require long-term data sets to investigate their dynamics (Altizeret al., 2003). A few long-term monitoring programmes are inplace that include disease and health investigations but only aminority include the marine top predators (Knap et al., 2002;Wells, 2003a,b; Kreuder et al., 2003; Wells et al., 2004; Pantusand Dennison, 2005) and the majority of these are focussed oninvestigating stranded (or dead) individuals (Jepson et al., 1999;Wise and Koster, 1995; Becker et al., 1997). Carcasses canprovide useful data on disease conditions (Malakoff, 2001) andpost-mortem examinations are central to investigations duringdisease outbreaks and large-scale mortalities. The few studiesthat have been published involving long-term monitoring of toppredators illustrate the importance of these investigations,highlighting emerging and resurging diseases (Daszak et al.,2001; Epstein, 1995; Godfroid et al., 2005). Indeed the impetusfor many long-term strandings schemes followed high-profilelarge-scale mortalities, such as the 1987–1988 bottlenosedolphin (Tursiops truncatus) mortality event affecting theputative coastal migratory stock along the mid-Atlantic coastof the US (Lipscomb et al., 1994). Further unusual events, in theGulf of Mexico in the early 1990s, (Geraci, 1989) in 1999 and in2004, also involving large numbers of bottlenose dolphins,indicated the importance of monitoring the health of live, free-living populations to provide both baseline epidemiological dataand early warning indicators for potentially long-term problemsat the population level.
Changes at lower trophic levels can also be detected by mon-itoring the top predators that integrate effects within the foodchain. Bottlenose dolphins forage on a variety of fish and, in someregions, cephalopod species (Barros and Wells, 1998) andchanges in food quality and quantity will be reflected in changesin condition and health of the predators (Thompson et al., 1997).For example, one hypothesis for the decline of the Steller sea lion(Eumetopias jubatus) population in Alaska has been a change intheir diet to lower quality prey (i.e. fish with a lower energydensity), leading to a reduction in the condition and survivalparticularly of the juveniles (Rosen and Trites, 2000; Fritz andHinckley, 2005).
One unique long-term monitoring study that does include thecollection and examination of a wide range of health measureshas been conducted on the resident population of bottlenosedolphins from Sarasota Bay, Florida, USA (27°20′N, 82°40′W).Since 1970 individuals in this population have been studied,and re-sampled, in a live–capture–release program (Irvine andWells, 1972). Humans have impacted the foraging areas ex-ploited by this population, particularly using the shallow lagoonsfor recreational fishing, pleasure craft, and water sports. Directinteractions between dolphins and man are therefore common(Wells, 1993). As traffic and population levels increase suchdisturbance (particularly acoustically as ambient noise levelsincrease) may have an insipid and increasing effect on the healthof individuals and thus the population (Buckstaff, 2004;Nowacek et al., 2001). Sarasota Bay is a highly populatedregion and the coastal waters have become a sink for persistentorganic pollutants (Hansen et al., 2004). Adverse reproductiveand immune function effects were predicted because studies onlaboratory model vertebrate species and on captive and wild
marine mammals have reported significant relationships be-tween contaminant exposure and these endpoints (Reijnders,1986; Kannan et al., 2000; Schwacke et al., 2002). A recentstudy speculated reduced first calf survival in the bottlenosedolphin females from Sarasota Bay (Wells et al., 2005) and thishas been incorporated into a risk assessment framework (Hallet al., 2006) and is currently being further investigated.
Individual animals within the population have beenmonitored and followed over four generations for life history,social structure, and ecology studies (Irvine et al., 1981; Scottet al., 1990; Wells, 1991, 2003a,b; Wells et al., 1980, 1987,2005). Wells et al. (2004) developed a health monitoring systemfor this population based on a scoring system from 19hematology and clinical blood chemistry (HCBCs) and lifehistory parameters that attempted to quantify clinical veterinaryqualitative health evaluations. Health scores were determinedfor individual dolphins, and mean seasonal values werecalculated for the population. Whilst this has proved a usefulinitial tool, yielding health measures that track general patternsof mortality, it was recognised by the authors that this approachsuffers from a lack of precision. Only some of the HCBC datacollected were utilised in developing the health profile. Theclassification approach also discards detailed information thatwould be present in the raw data by categorising the continuousvariables obtained from the HCBCs. In this study we investigateindividual, annual and seasonal variability in HCBCs using datacollected between 1990 and 2004. This analysis determinesvariation in HCBCs at the population level and does not includeanalysis at the individual level, in which the HCBCs might beused diagnostically. Here we explore variability in bloodparameters over time (accounting for changes at the individuallevel and due to sex, age and body condition), which mayindicate perturbations in the overall health of the populationof bottlenose dolphins in Sarasota Bay. These changes maybe subtle and sub-clinical and may not be sufficiently largeto cause changes in overall morbidity or mortality yet mayindicate changes in the marine environment and habitat of thedolphins (Neale et al., 2005; Thompson et al., 1997). Inferencesregarding the possible environmental and nutritional changesthat may account for the patterns observed for specific HCBCsare made.
2. Materials and methods
Blood samples were obtained from the long-term residentSarasota Bay, Florida bottlenose dolphin population in summer,and in some years, winter seasons during capture, sample, markand release operations conducted each year between 1990 and2004, except 1996. During each session, small numbers ofindividuals of the approximately 150 recognizable dolphins thatreside year-round in this system of bays and shallow Gulf ofMexico waters were selected for sampling, depending on thespecific research focus of the session.
To obtain the blood samples, dolphins were encircled inshallow water (b1.8 m) with a seine net. Once restrained,dolphins were either bled from their flukes which were heldabove the water's surface, or sampled when the animals were
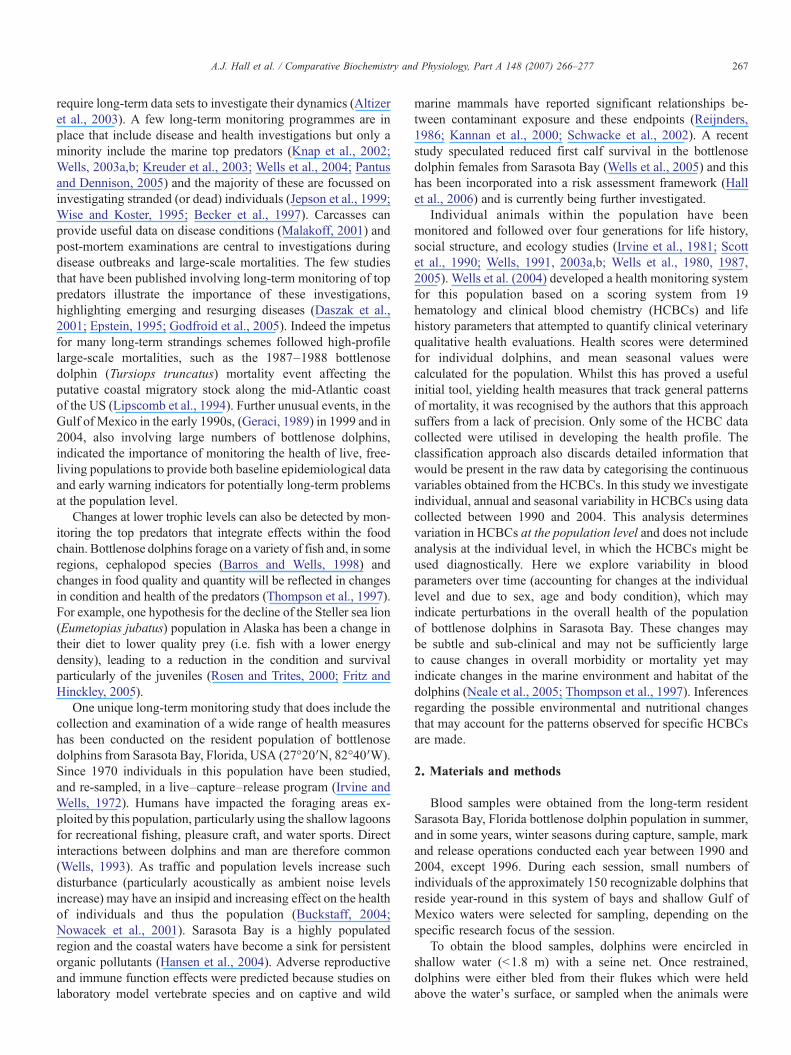
Fig. 1. Frequency distribution showing number of blood samples analysed byeach laboratory by year.
268 A.J. Hall et al. / Comparative Biochemistry and Physiology, Part A 148 (2007) 266–277
from the water. For the latter, they were placed into a sling forweighing, then carefully lifted either onto a twelve person liferaft (1990) or onto the foam-padded rear deck of a 8 to 13 m-long “veterinary examination and sampling boat” (1991–2004). Every effort was made to ensure the safety and health ofthe dolphins and personnel. Each dolphin was shaded, keptcool and wet, and carefully monitored for signs of discomfortby one to three marine mammal veterinarians experienced withcetaceans. The veterinary staff monitored the dolphin'srespiration rate and quality, responsiveness to external stimuli,mental alertness, skin temperature, and heart rate to evaluatethe animal's comfort level and immediate health status.
Sampling techniques and handling changed only slightlyover the 14-year study period. Blood samples were drawn fromthe ventral fluke vasculature by one of three methods: 1) a 20gauge×1ʺ needle attached to a 12–20mL syringe (1990), 2) a 19gauge×3/4ʺ butterfly catheter connected to a 12 or 20 mLsyringe (1991), or 3) a 19 gauge×3/4ʺ butterfly catheter withluer multi-sample adapter (Becton-Dickinson (BD), FranklinLakes, New Jersey, USA, BD#4919) which allowed the bloodcollection tubes to be filled directly from the venipuncture setduring the 1992–2004 seasons. In all years, a 5–7mLVacutainertube with EDTA as an anticoagulent (BD # 6452) was used forthe CBC determinations. During 1991 a 10 mL plain Vacutainertube without anticoagulent was employed for all chemistries,while in 1992–2004 a 9.5 mL serum separation Vacutainer tube(SST tube, BD # 6710) was used for all chemistry analyses.Upon filling, the EDTA tubes were gently rocked, thenimmediately refrigerated in an onboard cooler. Blood smearsfor differential white blood cell counts were made onboard,generally within an hour of sampling. During the 1991 seasonthe serum tubes were also immediately refrigerated. However, toavoid the potential hemolysis associated with removing clottedserum from the blood cells the serum separation tubes were keptcool and shaded until the clot had retracted (approximately 60–90 min post sampling) during the 1992–94 seasons. They werethen spun in an onboard centrifuge for 5 min to separate theserum from the cells, and refrigerated as above.
Upon returning to the dock each afternoon, samples were sentby courier to the laboratory where the analyses were performed.Hematology and CBC profile chemistries were performed lessthan 24 h post sampling. The hematology tests were performedmanually and by using a Technicon model H-1 and H-2 analyser.Chemistry profiles were run on an Olympus model AU 5061chemistry analyser or other comparable equipment. Inter-laboratory comparisons were carried out to determine the limitsof agreement between the different analysers and laboratories.
Age classes were determined primarily from sighting data,from observations of births to well-known mothers. Ages ofolder animals were determined from tooth growth layer groupsin teeth (GLG, Hohn et al., 1989). Juveniles were defined ashaving less than 10 GLGs or were known from sighting data tobe less than 10 years old. Adults had 10 or more GLGs or wereknown from sighting records to be 10 years or older.
The relationship between the various HCBCs sex, age,condition, season and year was investigated using a seriesof linear mixed effects models (Pinheiro and Bates, 2000).
Analyses were carried out using standard statistical packagesincluding S-PLUS 6.1 (Insightful Corporation) and SPSS 12.0(the Apache Software Foundation).
3. Results
3.1. Inter-laboratory variation
During the 14-year period over which these data were col-lected four laboratories were used. The SmithKline Beechamlaboratories analysed the samples between 1990 and 1995 afterwhich they discontinued their services. Between 1996 and 2000two laboratories were used (Sea World Orlando and theUniversity of Miami) before the fourth laboratory at CornellUniversity School of Veterinary Medicine was established asone able to routinely analyse the samples. The number ofsamples analysed by the different laboratories by year is shownin Fig. 1. A comparison of the earlier results obtained from theUniversity of Miami and from SmithKline Beecham with thosefrom Cornell University was possible as duplicate samples fromthe same animals were sent to both laboratories. In additionHCBC results from blood samples send to SmithKline Beechamand University of Miami, collected from bottlenose dolphinsstudied in North Carolina in 1995 were available forcomparison (Hansen and Wells, 1996). This allowed a two-way inter-laboratory comparison to be performed.
Passing–Bablok regression analyses were used to comparethe results for each pair of laboratories. This is often used inlaboratory medicine studies as it is a form of linear regressionanalyses in which random error of both the dependent andindependent variables are taken into account (Payne, 1997;Abrahams et al., 1999). Passing and Bablok's comparison
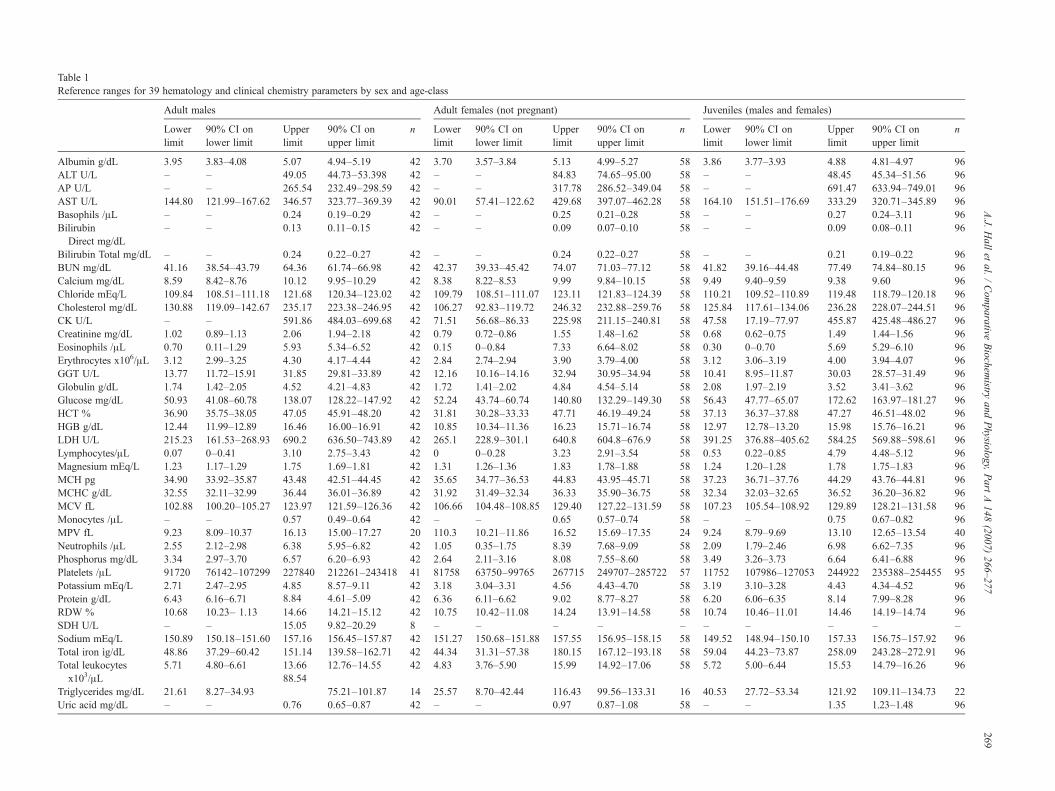
Table 1Reference ranges for 39 hematology and clinical chemistry parameters by sex and age-class
Adult males Adult females (not pregnant) Juveniles (males and females)
Lowerlimit
90% CI onlower limit
Upperlimit
90% CI onupper limit
n Lowerlimit
90% CI onlower limit
Upperlimit
90% CI onupper limit
n Lowerlimit
90% CI onlower limit
Upperlimit
90% CI onupper limit
n
Albumin g/dL 3.95 3.83–4.08 5.07 4.94–5.19 42 3.70 3.57–3.84 5.13 4.99–5.27 58 3.86 3.77–3.93 4.88 4.81–4.97 96ALT U/L – – 49.05 44.73–53.398 42 – – 84.83 74.65–95.00 58 – – 48.45 45.34–51.56 96AP U/L – – 265.54 232.49–298.59 42 – – 317.78 286.52–349.04 58 – – 691.47 633.94–749.01 96AST U/L 144.80 121.99–167.62 346.57 323.77–369.39 42 90.01 57.41–122.62 429.68 397.07–462.28 58 164.10 151.51–176.69 333.29 320.71–345.89 96Basophils /μL – – 0.24 0.19–0.29 42 – – 0.25 0.21–0.28 58 – – 0.27 0.24–3.11 96BilirubinDirect mg/dL
– – 0.13 0.11–0.15 42 – – 0.09 0.07–0.10 58 – – 0.09 0.08–0.11 96
Bilirubin Total mg/dL – – 0.24 0.22–0.27 42 – – 0.24 0.22–0.27 58 – – 0.21 0.19–0.22 96BUN mg/dL 41.16 38.54–43.79 64.36 61.74–66.98 42 42.37 39.33–45.42 74.07 71.03–77.12 58 41.82 39.16–44.48 77.49 74.84–80.15 96Calcium mg/dL 8.59 8.42–8.76 10.12 9.95–10.29 42 8.38 8.22–8.53 9.99 9.84–10.15 58 9.49 9.40–9.59 9.38 9.60 96Chloride mEq/L 109.84 108.51–111.18 121.68 120.34–123.02 42 109.79 108.51–111.07 123.11 121.83–124.39 58 110.21 109.52–110.89 119.48 118.79–120.18 96Cholesterol mg/dL 130.88 119.09–142.67 235.17 223.38–246.95 42 106.27 92.83–119.72 246.32 232.88–259.76 58 125.84 117.61–134.06 236.28 228.07–244.51 96CK U/L – – 591.86 484.03–699.68 42 71.51 56.68–86.33 225.98 211.15–240.81 58 47.58 17.19–77.97 455.87 425.48–486.27 96Creatinine mg/dL 1.02 0.89–1.13 2.06 1.94–2.18 42 0.79 0.72–0.86 1.55 1.48–1.62 58 0.68 0.62–0.75 1.49 1.44–1.56 96Eosinophils /μL 0.70 0.11–1.29 5.93 5.34–6.52 42 0.15 0–0.84 7.33 6.64–8.02 58 0.30 0–0.70 5.69 5.29–6.10 96Erythrocytes x106/μL 3.12 2.99–3.25 4.30 4.17–4.44 42 2.84 2.74–2.94 3.90 3.79–4.00 58 3.12 3.06–3.19 4.00 3.94–4.07 96GGT U/L 13.77 11.72–15.91 31.85 29.81–33.89 42 12.16 10.16–14.16 32.94 30.95–34.94 58 10.41 8.95–11.87 30.03 28.57–31.49 96Globulin g/dL 1.74 1.42–2.05 4.52 4.21–4.83 42 1.72 1.41–2.02 4.84 4.54–5.14 58 2.08 1.97–2.19 3.52 3.41–3.62 96Glucose mg/dL 50.93 41.08–60.78 138.07 128.22–147.92 42 52.24 43.74–60.74 140.80 132.29–149.30 58 56.43 47.77–65.07 172.62 163.97–181.27 96HCT % 36.90 35.75–38.05 47.05 45.91–48.20 42 31.81 30.28–33.33 47.71 46.19–49.24 58 37.13 36.37–37.88 47.27 46.51–48.02 96HGB g/dL 12.44 11.99–12.89 16.46 16.00–16.91 42 10.85 10.34–11.36 16.23 15.71–16.74 58 12.97 12.78–13.20 15.98 15.76–16.21 96LDH U/L 215.23 161.53–268.93 690.2 636.50–743.89 42 265.1 228.9–301.1 640.8 604.8–676.9 58 391.25 376.88–405.62 584.25 569.88–598.61 96Lymphocytes/μL 0.07 0–0.41 3.10 2.75–3.43 42 0 0–0.28 3.23 2.91–3.54 58 0.53 0.22–0.85 4.79 4.48–5.12 96Magnesium mEq/L 1.23 1.17–1.29 1.75 1.69–1.81 42 1.31 1.26–1.36 1.83 1.78–1.88 58 1.24 1.20–1.28 1.78 1.75–1.83 96MCH pg 34.90 33.92–35.87 43.48 42.51–44.45 42 35.65 34.77–36.53 44.83 43.95–45.71 58 37.23 36.71–37.76 44.29 43.76–44.81 96MCHC g/dL 32.55 32.11–32.99 36.44 36.01–36.89 42 31.92 31.49–32.34 36.33 35.90–36.75 58 32.34 32.03–32.65 36.52 36.20–36.82 96MCV fL 102.88 100.20–105.27 123.97 121.59–126.36 42 106.66 104.48–108.85 129.40 127.22–131.59 58 107.23 105.54–108.92 129.89 128.21–131.58 96Monocytes /μL – – 0.57 0.49–0.64 42 – – 0.65 0.57–0.74 58 – – 0.75 0.67–0.82 96MPV fL 9.23 8.09–10.37 16.13 15.00–17.27 20 110.3 10.21–11.86 16.52 15.69–17.35 24 9.24 8.79–9.69 13.10 12.65–13.54 40Neutrophils /μL 2.55 2.12–2.98 6.38 5.95–6.82 42 1.05 0.35–1.75 8.39 7.68–9.09 58 2.09 1.79–2.46 6.98 6.62–7.35 96Phosphorus mg/dL 3.34 2.97–3.70 6.57 6.20–6.93 42 2.64 2.11–3.16 8.08 7.55–8.60 58 3.49 3.26–3.73 6.64 6.41–6.88 96Platelets /μL 91720 76142–107299 227840 212261–243418 41 81758 63750–99765 267715 249707–285722 57 11752 107986–127053 244922 235388–254455 95Potassium mEq/L 2.71 2.47–2.95 4.85
4.61–5.0942 3.18 3.04–3.31 4.56 4.43–4.70 58 3.19 3.10–3.28 4.43 4.34–4.52 96
Protein g/dL 6.43 6.16–6.71 8.848.57–9.11
42 6.36 6.11–6.62 9.02 8.77–8.27 58 6.20 6.06–6.35 8.14 7.99–8.28 96RDW % 10.68 10.23– 1.13 14.66 14.21–15.12 42 10.75 10.42–11.08 14.24 13.91–14.58 58 10.74 10.46–11.01 14.46 14.19–14.74 96SDH U/L – – 15.05 9.82–20.29 8 – – – – – – – – – –Sodium mEq/L 150.89 150.18–151.60 157.16 156.45–157.87 42 151.27 150.68–151.88 157.55 156.95–158.15 58 149.52 148.94–150.10 157.33 156.75–157.92 96Total iron ìg/dL 48.86 37.29–60.42 151.14 139.58–162.71 42 44.34 31.31–57.38 180.15 167.12–193.18 58 59.04 44.23–73.87 258.09 243.28–272.91 96Total leukocytesx103/μL
5.71 4.80–6.61 13.66 12.76–14.55 42 4.83 3.76–5.90 15.99 14.92–17.06 58 5.72 5.00–6.44 15.53 14.79–16.26 96
Triglycerides mg/dL 21.61 8.27–34.9388.54
75.21–101.87 14 25.57 8.70–42.44 116.43 99.56–133.31 16 40.53 27.72–53.34 121.92 109.11–134.73 22Uric acid mg/dL – – 0.76 0.65–0.87 42 – – 0.97 0.87–1.08 58 – – 1.35 1.23–1.48 96
269A.J.
Hall
etal.
/Com
parativeBiochem
istryand
Physiology,
Part
A148
(2007)266–277
270 A.J. Hall et al. / Comparative Biochemistry and Physiology, Part A 148 (2007) 266–277
method makes no assumptions regarding the distribution of thesamples or the measurement errors. If both laboratoriesproduced identical results the regression lines would coincidewith an intercept of 0 and a slope of 1. Initially 32 individualHCBCs from University of Miami and Cornell University,analysed in duplicate on 26 samples, were compared. The 95%confidence intervals produced by the regression on the slopesand intercepts were then used to determine whether there wasonly a chance difference between the estimated slopes and 1 andthe estimated intercepts and 0 (i.e. if the interval contained 0 or1 respectively no difference was inferred). Of the 32 HCBCs, 17(53%) were comparable, namely total leukocytes, neutrophils,lymphocytes, eosinophils, erythrocytes, MCH, MCHC, albu-min, glucose, calcium, phosphorus, uric acid, BUN, sodium,chloride, potassium and total bilirubin. This comparison wasrepeated using 31 duplicate samples analysed at SmithKlineBeecham and University of Miami and 13 of the 32 HCBCs(41%) showed no difference between these two laboratories,namely neutrophils, lymphocytes, eosinophils, erythrocytes,HCT, MCH, total protein, albumin, glucose, calcium, phospho-rus, creatinine and BUN. In addition, 9 HCBC parameters werecomparable among all the laboratories (neutrophils, lympho-cytes, eosinophils, erythrocytes, MCH, albumin, glucose,calcium and phosphate). The data were therefore divided intothree groups for subsequent analysis relating the HCBCconcentrations to individual covariates and to seasonal (i.e.the time of year the dolphins were sampled; winter compared tosummer) and annual variability: (i) Samples analysed atSmithKline Beecham between 1990 and 1995 (ii) samplesanalysed at Cornell University between 2000 and 2004 and (iii)samples analysed at SmithKline Beecham, University of Miamiand Cornell University between 1990 and 2004 for the above 9comparable HCBCs. The 9 samples analysed by Sea World in1997 were excluded from subsequent analyses.
3.2. Reference ranges
For the first stage of analysis reference intervals for theHCBCs, stratified by sex and age-class (juvenilesb10 year,
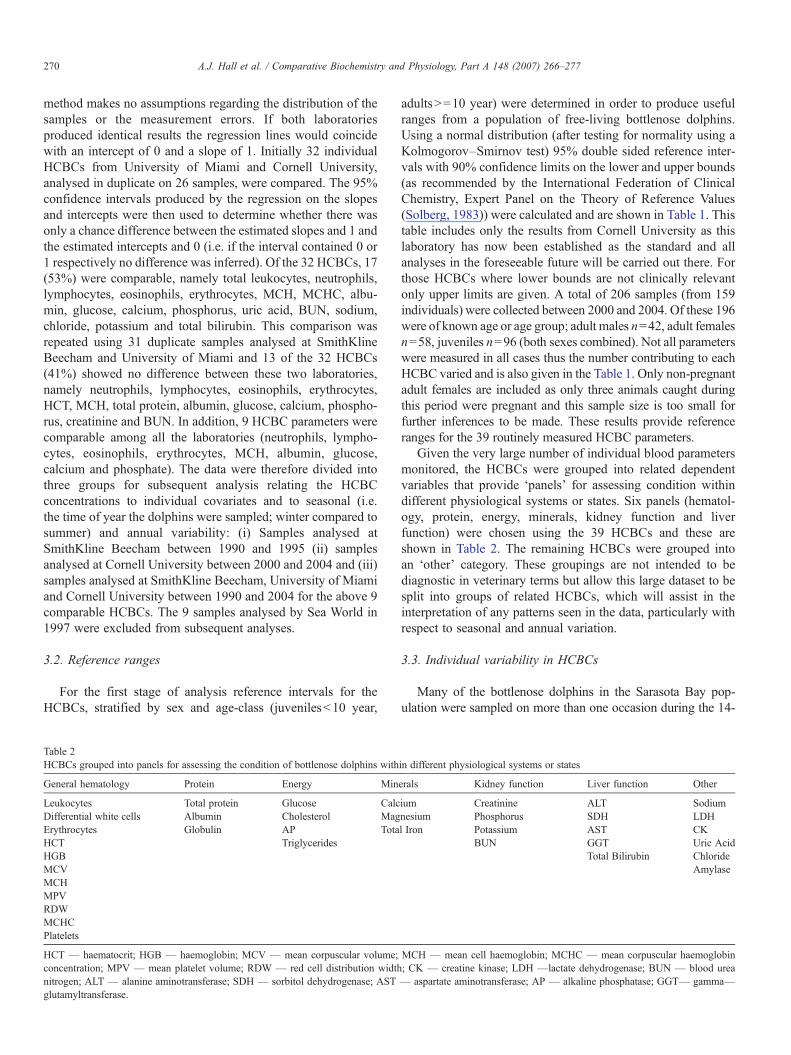
Table 2HCBCs grouped into panels for assessing the condition of bottlenose dolphins with
General hematology Protein Energy Min
Leukocytes Total protein Glucose CalcDifferential white cells Albumin Cholesterol MagErythrocytes Globulin AP TotaHCT TriglyceridesHGBMCVMCHMPVRDWMCHCPlatelets
HCT — haematocrit; HGB — haemoglobin; MCV — mean corpuscular volume;concentration; MPV — mean platelet volume; RDW — red cell distribution widthnitrogen; ALT — alanine aminotransferase; SDH — sorbitol dehydrogenase; ASTglutamyltransferase.
adultsN=10 year) were determined in order to produce usefulranges from a population of free-living bottlenose dolphins.Using a normal distribution (after testing for normality using aKolmogorov–Smirnov test) 95% double sided reference inter-vals with 90% confidence limits on the lower and upper bounds(as recommended by the International Federation of ClinicalChemistry, Expert Panel on the Theory of Reference Values(Solberg, 1983)) were calculated and are shown in Table 1. Thistable includes only the results from Cornell University as thislaboratory has now been established as the standard and allanalyses in the foreseeable future will be carried out there. Forthose HCBCs where lower bounds are not clinically relevantonly upper limits are given. A total of 206 samples (from 159individuals) were collected between 2000 and 2004. Of these 196were of known age or age group; adult males n=42, adult femalesn=58, juveniles n=96 (both sexes combined). Not all parameterswere measured in all cases thus the number contributing to eachHCBC varied and is also given in the Table 1. Only non-pregnantadult females are included as only three animals caught duringthis period were pregnant and this sample size is too small forfurther inferences to be made. These results provide referenceranges for the 39 routinely measured HCBC parameters.
Given the very large number of individual blood parametersmonitored, the HCBCs were grouped into related dependentvariables that provide ‘panels’ for assessing condition withindifferent physiological systems or states. Six panels (hematol-ogy, protein, energy, minerals, kidney function and liverfunction) were chosen using the 39 HCBCs and these areshown in Table 2. The remaining HCBCs were grouped intoan ‘other’ category. These groupings are not intended to bediagnostic in veterinary terms but allow this large dataset to besplit into groups of related HCBCs, which will assist in theinterpretation of any patterns seen in the data, particularly withrespect to seasonal and annual variation.
3.3. Individual variability in HCBCs
Many of the bottlenose dolphins in the Sarasota Bay pop-ulation were sampled on more than one occasion during the 14-
in different physiological systems or states
erals Kidney function Liver function Other
ium Creatinine ALT Sodiumnesium Phosphorus SDH LDHl Iron Potassium AST CK
BUN GGT Uric AcidTotal Bilirubin Chloride
Amylase
MCH — mean cell haemoglobin; MCHC — mean corpuscular haemoglobin; CK — creatine kinase; LDH —lactate dehydrogenase; BUN — blood urea— aspartate aminotransferase; AP — alkaline phosphatase; GGT— gamma—
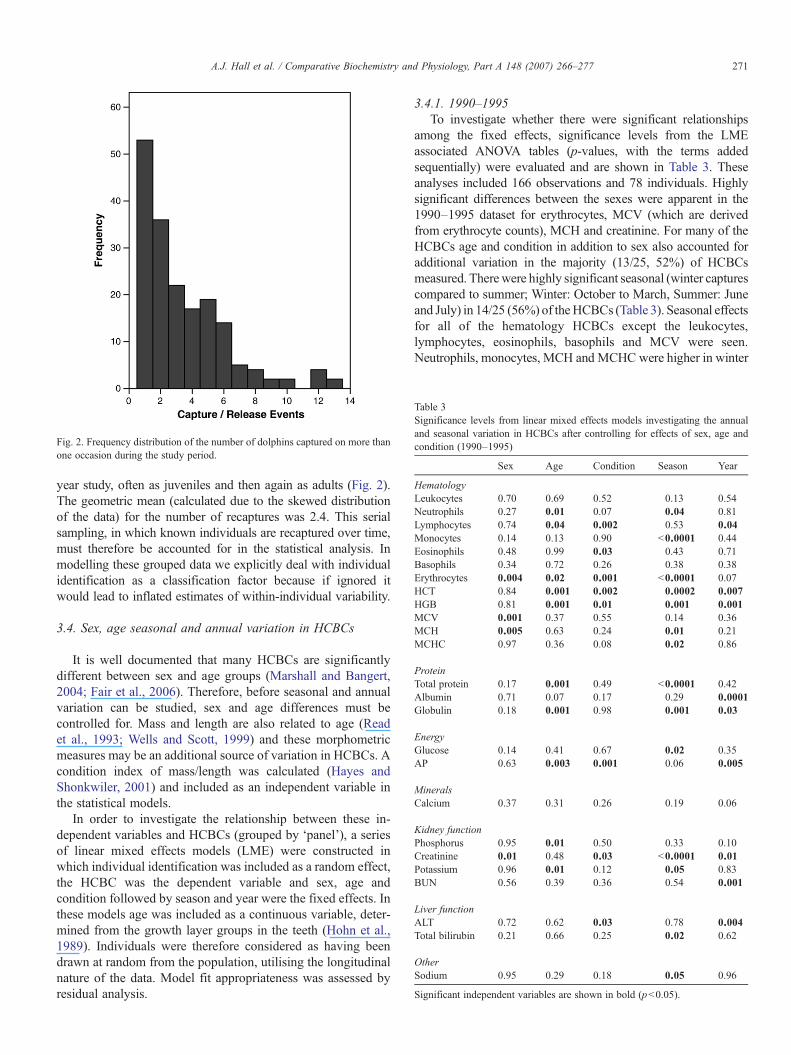
Fig. 2. Frequency distribution of the number of dolphins captured on more thanone occasion during the study period.
Table 3Significance levels from linear mixed effects models investigating the annualand seasonal variation in HCBCs after controlling for effects of sex, age andcondition (1990–1995)
Sex Age Condition Season Year
HematologyLeukocytes 0.70 0.69 0.52 0.13 0.54Neutrophils 0.27 0.01 0.07 0.04 0.81Lymphocytes 0.74 0.04 0.002 0.53 0.04Monocytes 0.14 0.13 0.90 b0.0001 0.44Eosinophils 0.48 0.99 0.03 0.43 0.71Basophils 0.34 0.72 0.26 0.38 0.38Erythrocytes 0.004 0.02 0.001 b0.0001 0.07HCT 0.84 0.001 0.002 0.0002 0.007HGB 0.81 0.001 0.01 0.001 0.001MCV 0.001 0.37 0.55 0.14 0.36MCH 0.005 0.63 0.24 0.01 0.21MCHC 0.97 0.36 0.08 0.02 0.86
ProteinTotal protein 0.17 0.001 0.49 b0.0001 0.42Albumin 0.71 0.07 0.17 0.29 0.0001Globulin 0.18 0.001 0.98 0.001 0.03
EnergyGlucose 0.14 0.41 0.67 0.02 0.35AP 0.63 0.003 0.001 0.06 0.005
MineralsCalcium 0.37 0.31 0.26 0.19 0.06
Kidney functionPhosphorus 0.95 0.01 0.50 0.33 0.10Creatinine 0.01 0.48 0.03 b0.0001 0.01Potassium 0.96 0.01 0.12 0.05 0.83BUN 0.56 0.39 0.36 0.54 0.001
Liver functionALT 0.72 0.62 0.03 0.78 0.004Total bilirubin 0.21 0.66 0.25 0.02 0.62
OtherSodium 0.95 0.29 0.18 0.05 0.96
Significant independent variables are shown in bold (pb0.05).
271A.J. Hall et al. / Comparative Biochemistry and Physiology, Part A 148 (2007) 266–277
year study, often as juveniles and then again as adults (Fig. 2).The geometric mean (calculated due to the skewed distributionof the data) for the number of recaptures was 2.4. This serialsampling, in which known individuals are recaptured over time,must therefore be accounted for in the statistical analysis. Inmodelling these grouped data we explicitly deal with individualidentification as a classification factor because if ignored itwould lead to inflated estimates of within-individual variability.
3.4. Sex, age seasonal and annual variation in HCBCs
It is well documented that many HCBCs are significantlydifferent between sex and age groups (Marshall and Bangert,2004; Fair et al., 2006). Therefore, before seasonal and annualvariation can be studied, sex and age differences must becontrolled for. Mass and length are also related to age (Readet al., 1993; Wells and Scott, 1999) and these morphometricmeasures may be an additional source of variation in HCBCs. Acondition index of mass/length was calculated (Hayes andShonkwiler, 2001) and included as an independent variable inthe statistical models.
In order to investigate the relationship between these in-dependent variables and HCBCs (grouped by ‘panel’), a seriesof linear mixed effects models (LME) were constructed inwhich individual identification was included as a random effect,the HCBC was the dependent variable and sex, age andcondition followed by season and year were the fixed effects. Inthese models age was included as a continuous variable, deter-mined from the growth layer groups in the teeth (Hohn et al.,1989). Individuals were therefore considered as having beendrawn at random from the population, utilising the longitudinalnature of the data. Model fit appropriateness was assessed byresidual analysis.
3.4.1. 1990–1995To investigate whether there were significant relationships
among the fixed effects, significance levels from the LMEassociated ANOVA tables (p-values, with the terms addedsequentially) were evaluated and are shown in Table 3. Theseanalyses included 166 observations and 78 individuals. Highlysignificant differences between the sexes were apparent in the1990–1995 dataset for erythrocytes, MCV (which are derivedfrom erythrocyte counts), MCH and creatinine. For many of theHCBCs age and condition in addition to sex also accounted foradditional variation in the majority (13/25, 52%) of HCBCsmeasured. There were highly significant seasonal (winter capturescompared to summer; Winter: October to March, Summer: Juneand July) in 14/25 (56%) of theHCBCs (Table 3). Seasonal effectsfor all of the hematology HCBCs except the leukocytes,lymphocytes, eosinophils, basophils and MCV were seen.Neutrophils, monocytes, MCH and MCHC were higher in winter

272 A.J. Hall et al. / Comparative Biochemistry and Physiology, Part A 148 (2007) 266–277
than summer and erythrocytes, HCT and HGB were lower inwinter than summer. The protein measures were higher in winterthan summer, as was glucose. Creatinine, potassium, totalbilirubin and sodium were all lower in winter than summer.
In order to test for time trends year was included as a con-tinuous variable to determine if there was a linear decrease orincrease in the HCBC parameters within or among the variousfunctional panels. Lymphocytes, AP and ALT were decreasingwith time, after accounting for the effect of the confoundingvariables, whereas HCT,HGB, albumin, globulin, creatinine andBUN were significantly increasing with time. The most notablechanges were seen in the HGB, albumin, creatinine and BUN.
Fig. 3. Mean and 95% confidence limits of fitted values from the linearmixed effectsmofor the effect of individual, sex, age, and condition. (a) albumin 1990–1994 (b) album
All were increasing over time, particularly albumin (Fig. 3(a))and were largely lower in winter than summer in the two yearswhen samples were collected during both seasons. Creatinineand HGB appeared not to vary until 1994 and 1995, when levelsincreased but winter levels were again consistently significantlylower than summer levels.
3.4.2. 2000–2004The same analyses were carried out on the samples analysed
by Cornell University between 2000 and 2004. A larger suiteof HCBCs were analysed by this laboratory (n=40). Thesignificant independent variables from the LME associated
dels investigating the relationship betweenHCBCs and season and year, controllingin 2000–2004 (c) albumin 1990–2004 (d) corrected calcium 1990–2004.
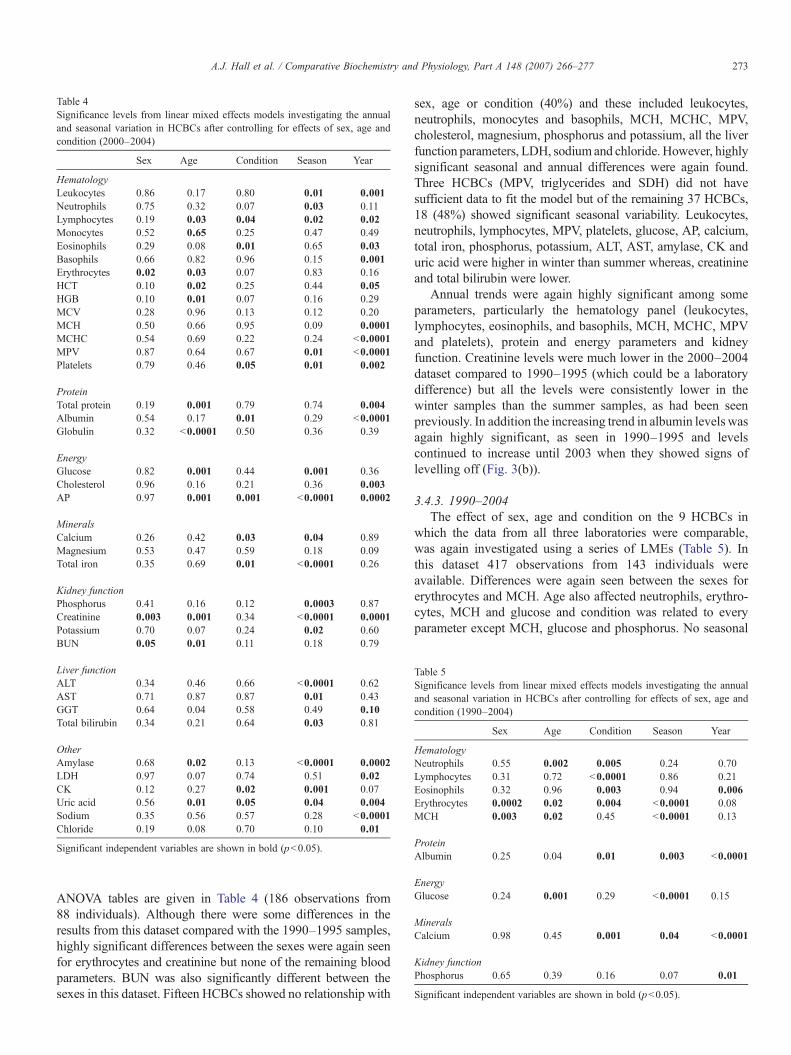
Table 5Significance levels from linear mixed effects models investigating the annualand seasonal variation in HCBCs after controlling for effects of sex, age andcondition (1990–2004)
Sex Age Condition Season Year
HematologyNeutrophils 0.55 0.002 0.005 0.24 0.70Lymphocytes 0.31 0.72 b0.0001 0.86 0.21Eosinophils 0.32 0.96 0.003 0.94 0.006Erythrocytes 0.0002 0.02 0.004 b0.0001 0.08MCH 0.003 0.02 0.45 b0.0001 0.13
ProteinAlbumin 0.25 0.04 0.01 0.003 b0.0001
EnergyGlucose 0.24 0.001 0.29 b0.0001 0.15
MineralsCalcium 0.98 0.45 0.001 0.04 b0.0001
Kidney functionPhosphorus 0.65 0.39 0.16 0.07 0.01
Significant independent variables are shown in bold (pb0.05).
Table 4Significance levels from linear mixed effects models investigating the annualand seasonal variation in HCBCs after controlling for effects of sex, age andcondition (2000–2004)
Sex Age Condition Season Year
HematologyLeukocytes 0.86 0.17 0.80 0.01 0.001Neutrophils 0.75 0.32 0.07 0.03 0.11Lymphocytes 0.19 0.03 0.04 0.02 0.02Monocytes 0.52 0.65 0.25 0.47 0.49Eosinophils 0.29 0.08 0.01 0.65 0.03Basophils 0.66 0.82 0.96 0.15 0.001Erythrocytes 0.02 0.03 0.07 0.83 0.16HCT 0.10 0.02 0.25 0.44 0.05HGB 0.10 0.01 0.07 0.16 0.29MCV 0.28 0.96 0.13 0.12 0.20MCH 0.50 0.66 0.95 0.09 0.0001MCHC 0.54 0.69 0.22 0.24 b0.0001MPV 0.87 0.64 0.67 0.01 b0.0001Platelets 0.79 0.46 0.05 0.01 0.002
ProteinTotal protein 0.19 0.001 0.79 0.74 0.004Albumin 0.54 0.17 0.01 0.29 b0.0001Globulin 0.32 b0.0001 0.50 0.36 0.39
EnergyGlucose 0.82 0.001 0.44 0.001 0.36Cholesterol 0.96 0.16 0.21 0.36 0.003AP 0.97 0.001 0.001 b0.0001 0.0002
MineralsCalcium 0.26 0.42 0.03 0.04 0.89Magnesium 0.53 0.47 0.59 0.18 0.09Total iron 0.35 0.69 0.01 b0.0001 0.26
Kidney functionPhosphorus 0.41 0.16 0.12 0.0003 0.87Creatinine 0.003 0.001 0.34 b0.0001 0.0001Potassium 0.70 0.07 0.24 0.02 0.60BUN 0.05 0.01 0.11 0.18 0.79
Liver functionALT 0.34 0.46 0.66 b0.0001 0.62AST 0.71 0.87 0.87 0.01 0.43GGT 0.64 0.04 0.58 0.49 0.10Total bilirubin 0.34 0.21 0.64 0.03 0.81
OtherAmylase 0.68 0.02 0.13 b0.0001 0.0002LDH 0.97 0.07 0.74 0.51 0.02CK 0.12 0.27 0.02 0.001 0.07Uric acid 0.56 0.01 0.05 0.04 0.004Sodium 0.35 0.56 0.57 0.28 b0.0001Chloride 0.19 0.08 0.70 0.10 0.01
Significant independent variables are shown in bold (pb0.05).
273A.J. Hall et al. / Comparative Biochemistry and Physiology, Part A 148 (2007) 266–277
ANOVA tables are given in Table 4 (186 observations from88 individuals). Although there were some differences in theresults from this dataset compared with the 1990–1995 samples,highly significant differences between the sexes were again seenfor erythrocytes and creatinine but none of the remaining bloodparameters. BUN was also significantly different between thesexes in this dataset. Fifteen HCBCs showed no relationship with
sex, age or condition (40%) and these included leukocytes,neutrophils, monocytes and basophils, MCH, MCHC, MPV,cholesterol, magnesium, phosphorus and potassium, all the liverfunction parameters, LDH, sodium and chloride. However, highlysignificant seasonal and annual differences were again found.Three HCBCs (MPV, triglycerides and SDH) did not havesufficient data to fit the model but of the remaining 37 HCBCs,18 (48%) showed significant seasonal variability. Leukocytes,neutrophils, lymphocytes, MPV, platelets, glucose, AP, calcium,total iron, phosphorus, potassium, ALT, AST, amylase, CK anduric acid were higher in winter than summer whereas, creatinineand total bilirubin were lower.
Annual trends were again highly significant among someparameters, particularly the hematology panel (leukocytes,lymphocytes, eosinophils, and basophils, MCH, MCHC, MPVand platelets), protein and energy parameters and kidneyfunction. Creatinine levels were much lower in the 2000–2004dataset compared to 1990–1995 (which could be a laboratorydifference) but all the levels were consistently lower in thewinter samples than the summer samples, as had been seenpreviously. In addition the increasing trend in albumin levels wasagain highly significant, as seen in 1990–1995 and levelscontinued to increase until 2003 when they showed signs oflevelling off (Fig. 3(b)).
3.4.3. 1990–2004The effect of sex, age and condition on the 9 HCBCs in
which the data from all three laboratories were comparable,was again investigated using a series of LMEs (Table 5). Inthis dataset 417 observations from 143 individuals wereavailable. Differences were again seen between the sexes forerythrocytes and MCH. Age also affected neutrophils, erythro-cytes, MCH and glucose and condition was related to everyparameter except MCH, glucose and phosphorus. No seasonal
274 A.J. Hall et al. / Comparative Biochemistry and Physiology, Part A 148 (2007) 266–277
effects were seen in neutrophils, lymphocytes, eosinophils andphosphorus, after accounting for sex, age and condition effectsbut the remaining 5 parameters did show seasonal differences.LME models were then fitted in which year was a continuousvariable and for four of the parameters significant time andseasonal trends, given sex, age and condition, were observed.Eosinophils were higher in summer than winter whereas albuminlevels were higher in the winter than the summer. Summer levelshave also been increasing significantly and linearly with time inthis dataset (Fig. 3(c)). Additionally, changes in plasma albuminconcentration will affect total calcium leading to a possible mis-interpretation of results. This was corrected using the followingformulae: (Marshall and Bangert, 2004).
Albumin b40 g=L; corrected calcium ¼ ½Ca� þ 0:02� f40� ½albumin�g mmol=LAlbumin N40 g=L; corrected calcium ¼ ½Ca� � 0:02� f½albumin�g mmol=L
The fitted values by year and season from the LME using thesecorrected values are shown in Fig. 3(d). This indicated thatcalcium levels were lower in the summer months than the winter,with a general increase over time.
4. Discussion
The estimation and use of reference values, reference intervalsand prediction intervals for clinical chemistry and hematologydata has long been accepted in human and veterinary medicine(Henny, 2004). They have also been widely utilised in studies offree-living marine mammals (Engelhardt, 1979; Geraci et al.,1979; Roletto, 1993; Hall, 1998; Koopman et al., 1995; Landeret al., 2003; Trumble et al., 2006; Fair et al., 2006) with the aim ofestablishing baselines from healthy populations against which tojudge perturbations in putative non-healthy populations orindividuals. The selection basis for healthy populations is clearlyvery difficult for free-living animals but data reported here wereall collected from apparently healthy individuals with no obviousclinical signs. Therefore these reference ranges (particularlybecause the confidence limits have also been included) could beused to compare to any free-ranging bottlenose dolphin from thisand indeed other regions. Limits are reported by sex for the adults,since differences between the sexes are reported for variousparameters following sexual maturity (Marshall and Bangert,2004). It would be reasonable to assume that future bloodsampling for clinical purposes would involve handling theanimals and therefore the sex of those individuals could bedetermined, enabling sex-specific values to be utilised. However,the sexes were combined for the juveniles.
In this dataset we also found a lack of comparability betweenthe data obtained from the different laboratories used in thisstudy. This additional source of variability meant we wereunable to combine all the data without biasing the results.However, we were able to use the results from a single laboratoryto determine some very useful reference values and intervals.Our results also suggest the continued use of a single laboratorywould be recommended wherever possible.
Variability in HCBCs due to sex, age, nutritive condition andother sources of biological variation must be accounted for wheninvestigating trends over time. However, it is often not possible to
account for individual variability. Here we have been able tocontrol for this because this unique dataset contained serialsamples collected from the same animals over time. We used aseries of linear mixed effects models, where any individualchanges over the time (differences between the model interceptsand slopes by individual animal) were fitted as random effects andother parameters important in determining the level of eachHCBCwere fitted as fixed effects. Sex, age and condition were allfound to be important determinants for themajority of the HCBCsmeasured in the Sarasota Bay bottlenose dolphins, regardless ofthe between-laboratory variation in results.
Seasonal differences between HCBCs measured during thesummer and those obtained in the winter were also investigated,after controlling for the effect of potential confounding var-iables; sex, age and condition. However, the differences werenot consistent across the subsets of data corresponding to thedifferent laboratories, so it is difficult to infer the biologicalsignificance with conflicting or inconsistent results. Neverthe-less, some consistent patterns did emerge. Indeed, wide seasonalchanges occur in the Sarasota Bay marine environment thatmight account for seasonal variability in HCBCs. Particularlynotable is the change in the water temperature. Between thesetwo periods of the year it decreases from around 30 °C in thesummer to 20 °C in the winter. The body condition (blubberthickness) of the dolphins also changes, increasing in the winterin response to the additional thermoregulatory demands(Samuel and Worthy, 2004). It is possible that these seasonalchanges and the biological response of the dolphins to them,could account for differences in key HCBCs by time of year.Other studies have found seasonally related changes in clinicalblood chemistry parameters in a variety of bird and mammalspecies (Sergent et al., 2004; Domingo-Roura et al., 2001;Christopher et al., 1999) many of which have been attributed toseasonal variation in body condition.
Creatinine levels in the bottlenose dolphins showed seasonaleffects that could be nutritionally related, as has been seenin other mammalian species (Domingo-Roura et al., 2001).Blood levels were significantly higher in summer than winter.Creatinine can increase as much as 30% after a protein meal,remaining elevated for as long as 7 h in humans (Marshall andBangert, 2004) and it is possible that prey availability and foodintake are higher in the summer compared to the winter. Butcreatinine is present in the muscle and there is a slow catabolismof creatinine at a rate directly proportional to muscle mass, so italso represents muscle bulk (Kerr, 1989). A study on captivebottlenose dolphins (Terasawa et al., 2002) also foundsignificantly higher creatinine levels in adult animals in summercompared to winter. The authors attribute these changes tovariations in muscle mass. In the study presented here, indi-vidual condition was taken into account in the model andseasonal variation was still apparent, even given differences indolphin condition. However, the index used might reflect blub-ber rather than muscle mass. Differences in the mean absolutecreatinine levels between the subsets in 1990–1995 and 2000–2004 could perhaps be due to laboratory differences. Over time,blood levels do not significantly increase until 1994 and 1995, sothis variation could be stochastic and blood levels may indeed be
275A.J. Hall et al. / Comparative Biochemistry and Physiology, Part A 148 (2007) 266–277
a reflection of total body protein. An additional considerationmight be that the Florida state-wide commercial fishing net banthat went into effect in the region in 1995. Since this changemore available prey might be expected and an improvement indolphin prey capture rates and nutritional condition.
In the complete dataset for 1990–2004 where there were nodifferences among the results from the various laboratories,higher erythrocytes were seen in the summer than winter. Thiscould be due to a slight anaemia in winter, again because ofnutritional differences in prey types taken. Highly significantdifferences in albumin (increasing with time) were also seenbetween summer and winter, with lower levels in the summer.Hypoalbuminaemia can be due to malnutrition (Etukudo et al.,1999) but this explanation would not fit with the previousobservations and the levels are not high or low enough to beclinically important (i.e. due to dehydration). Although theproduction of albumin is directly related to protein intake, thisexplanation contradicts the creatinine results, unless diets in thewinter are lower in certain nutrients that might produce mildincreases in albumin (such as calcium and iron which have beenshown in humans with diets low in these nutrients to causehyperalbuminaemia, Thibault and Roberge, 1987).
When corrected for albumin, the results for calcium levels inthe blood of the dolphins were lower in the winter than in thesummer with a general improvement over time. Again the levelsare not clinically abnormal and although this might be due toperturbations in the hormones that control calcium it is unlikelyto be problematic for the individual animals. Thyrotoxicosiscauses increases in calcium (Mohan et al., 2004; Carmelietet al., 2003) and effects of environmental contaminants onthyroid function have been well documented in many species,including marine mammals (Fisk et al., 2005; Hall et al., 2003;Debier et al., 2005). Relationships between these parametersand circulating thyroid hormones with exposure to contami-nants in this population will be investigated in the future.
Finally, red tides causing exposure to brevetoxin from thedinoflagellate Karenia brevis have occurred in the region.Significant blooms occurred in 1991, 1995 and again in 2002,2003 and 2005 (Kirkpatrick et al., 2004). Although thefrequency of red tides appears to be increasing, particularlyrecently, the red-tide years do not appear to coincide with peaksor troughs in bottlenose dolphin HCBCs. Indirect effects onprey availability would also result from red-tide events butagain it is not apparent from the data presented here that apredictable relationship between HCBCs and the effects of redtides on bottlenose dolphins and their prey exists.
In conclusion this study showed that inter-laboratorycomparisons are essential before the results of clinical chemistryand hematology parameters carried out using various laborato-ries are combined. We would therefore recommend that a singlelaboratory be used for long-term wildlife studies and monitoringprograms. Sex, age and condition were all found to be importantdeterminants of HCBCs in bottlenose dolphins and significantseasonal differences were seen, particularly in parameters relatedto nutritional status and/or thermoregulation. In addition somesignificant linear trends over time were observed, potentially dueto changes in the environment and habitat of the bottlenose
dolphins in Sarasota Bay, the availability of their prey, its typeand quality. Continued monitoring, using the same analyticaltechniques and laboratories and further investigations intorelationships between HCBCs and specific potential determi-nants of these changes (such as nutrition, contaminants andbiotoxins) will assist in the long-term management andconservation of the dolphins in this region.
Acknowledgements
Veterinary examinations and sampling were conductedthrough the support of the National Marine Fisheries Service,the U.S. Environmental Protection Agency, the NationalScience Foundation, Earthwatch Institute, Dolphin Quest, andthe Chicago Zoological Society. The field sampling in SarasotaBay benefited greatly from the efforts of B. Irvine, M. Scott, W.McLellan, L. Fulford, K. Urian, S. Hofmann, and S. Nowacek,along with a host of collaborating researchers and volunteerdolphin handlers. This research was conducted under ScientificResearch Permits Nos. 417, 655, 945 and 522–1669 issued bythe National Marine Fisheries Service.
References
Abrahams, I.L., Brunwin, D.M., Dubbs, S., 1999. Examination of Deming andPassing and Bablok regression techniques in method comparison foroncology markers using the Vitros (R) ECi Immunodiagnostic System assayfor CA15-3 (TM). Clin. Chem. 45, A105.
Aguilar, A., Raga, J.A., 1993. The striped dolphin epizootic in theMediterraneanSea. Ambio 22, 524–528.
Altizer, S., Harvell, D., Friedle, E., 2003. Rapid evolutionary dynamics anddisease threats to biodiversity. Trends Ecol. Evol. 18, 589–596.
Barros, N.B., Wells, R.S., 1998. Prey and feeding patterns of resident bottlenosedolphins (Tursiops truncatus) in Sarasota Bay, Florida. J. Mammal. 79,1045–1059.
Becker, P.R., Wise, S.A., Thorsteinson, L., Koster, B.J., Rowles, T., 1997.Specimen banking of marine organisms in the United States: current statusand long-term prospective. Chemosphere 34, 1889–1906.
Buckstaff, K.C., 2004. Effects of watercraft noise on the acoustic behavior ofbottlenose dolphins, Tursiops truncatus, in Sarasota Bay, Florida. Mar.Mamm. Sci. 20, 709–725.
Carmeliet, G., VanCromphaut, S., Daci, E.,Maes, C., Bouillon, R., 2003.Disordersof calcium homeostasis. Best practice and research. Clin. Endocrinol. Metab.17, 529–546.
Christopher, M.M., Berry, K.H., Wallis, I.R., Nagy, K.A., Henen, B.T., Peterson,C.C., 1999. Reference intervals and physiologic alterations in hematologicand biochemical values of free-ranging desert tortoises in the Mojave Desert.J. Wildl. Dis. 35, 212–238.
Daszak, P., Cunningham, A.A., Hyatt, A.D., 2001. Anthropogenic environmentalchange and the emergence of infectious diseases in wildlife. Acta Trop. 78,103–116.
Debier, C., Ylitalo, G.M., Weise, M., Gulland, F., Costa, D.P., Le Boeuf, B.J.,de Tillesse, T., Larondelle, Y., 2005. PCBs and DDT in the serum of juvenileCalifornia sea lions: associations with vitamins A and E and thyroid hormones.Environ. Pollut. 134, 323–332.
Dietz, R., Heide-Jorgensen, M.-P., Harkonen, T., 1989. Mass deaths of Harborseals (Phoca vitulina) in Europe. Ambio 18, 258–264.
Domingo-Roura, X., Newman, C., Calafell, F., Macdonald, D.W., 2001. Bloodbiochemistry reflects seasonal nutritional and reproductive constraints in theEurasian badger (Meles meles). Physiol. Biochem. Zool. 74, 450–460.
Engelhardt, F.R., 1979. Haematology and plasma chemistry of captive pinnipedsand cetaceans. Aquat. Mamm. 7, 11–20.
Epstein, P.R., 1995. Emerging diseases and ecosystem instability: new threats topublic health. Am. J. Public Health 85, 168–172.

276 A.J. Hall et al. / Comparative Biochemistry and Physiology, Part A 148 (2007) 266–277
Etukudo, M., Agbedana, O., Akang, E., Osifo, B., 1999. Biochemical changesand liver tissue pathology in weanlingWistar albino rats with protein-energymalnutrition (PEM). Afr. J. Med. Sci. 28, 43–47.
Fair, P.A., Hulsey, T.C., Rene, V.A., Goldstein, J.D., Adams, J., Zolman, E.S.,Bossart, G.D., 2006. Hematology, serum chemistry and cytology findingsfrom apparently healthy Atlantic bottlenose dolphins (Tursiops truncatus)inhabiting the estuarine waters of Charleston, South Carolina. Aq. Mamm.32, 182–195.
Fisk, A.T., de Wit, C.A., Wayland, M., Kuzyk, Z.Z., Burgess, N., Robert, R.,Braune, B., Norstrom, R., Blum, S.P., Sandau, C., Lie, E., Larsen, H.J.S.,Skaare, J.U., Muir, D.C.G., 2005. An assessment of the toxicologicalsignificance of anthropogenic contaminants in Canadian arctic wildlife. Sci.Total Environ. 351, 57–93.
Fritz, L.W., Hinckley, S., 2005. A critical review of the regime shift – “JunkFood” – nutritional stress hypothesis for the decline of the western stock ofSteller sea lion. Mar. Mamm. Sci. 21, 476–518.
Geraci, J.R., 1989. Clinical investigation of the 1987–1988 mass mortality ofbottlenose dolphins along the US central and south Atlantic coast. Finalreport to the National Marine Fisheries Service, US Navy (Office of NavalResearch) and Marine Mammal Commission. 63 pp.
Geraci, J.R., St Aubin, D.J., Smith, T.G., 1979. Influence of age, condition,sampling time and method on plasma chemical constituents in free-rangingringed seals Phoca hispida. J. Fish. Res. Board Can. 36, 1278–1282.
Geraci, J.R., St Aubin, D.J., Barker, I.K., Webster, R.G., Hinshaw, V.S., Bean,W.J., Ruhnke, H.L., Prescott, J.H., Early, G., Baker, A.S., Madoff, S.,Schooley, R.T., 1982. Mass mortality of harbor seals: pneumonia associatedwith influenza A virus. Science 215, 1129–1131.
Godfroid, J., Cloeckaert, A., Liautard, J.P., Kohler, S., Fretin, D., Walravens, K.,Garin-Bastuji, B., Letesson, J.J., 2005. From the discovery of the Maltafever's agent to the discovery of a marine mammal reservoir, brucellosis hascontinuously been a re-emerging zoonosis. Vet. Res. 36, 313–326.
Hall, A.J., 1998. Blood chemistry and hematology in gray seal pups from birthto post-weaning. J. Zoo Wildl. Med. 29, 401–407.
Hall, A.J., Kalantzi, O.I., Thomas, G., 2003. Polybrominated diphenyl ethers(PBDEs) in grey seal pups during their first year of life — are they thyroidhormone endocrine disrupters? Environ. Pollut. 126, 29–37.
Hall, A.J., McConnell, B.J., Rowles, T.K., Aguilar, A., Borrell, A., Schwacke,L., Reijnders, P.J.H., Wells, R.S., 2006. Population consequences ofpolychlorinated biphenyl exposure in bottlenose dolphins — an individualbased model approach. Environ. Health Perspect. 114 (Suppl. 1), 60–64.
Hansen, L.J., Wells, R.S., 1996. Bottlenose dolphin health assessment: Fieldreport on sampling near Beaufort, North Carolina, during July, 1995. NOAATech. Mem. NMFS-SEFSC-382. 24 pp.
Hansen, L.J., Schwacke, L.H.,Mitchum, G.B., Hohn, A.A.,Wells, R.S., Zolman,E.S., Fair, P.A., 2004. Geographic variation in polychorinated biphenyl andorganochlorine pesticide concentrations in the blubber of bottlenose dolphinsfrom the US Atlantic coast. Sci. Total Environ. 319, 147–172.
Harvell, C.D., Kim, K., Burkholder, J.M., Colwell, R.R., Epstein, P.R., Grimes,D.J., Hofmann, E.E., Lipp, E.K., Osterhaus, A.D.M.E., Overstreet, R.M.,Porter, J.W., Smith, G.W., Vasta, G.R., 1999. Emerging marine diseases —climate links and anthropogenic factors. Science 285, 1505–1510.
Hayes, J.P., Shonkwiler, J.S., 2001. Morphometric indicators of body condition:worthwhile or wishful thinking? In: Speakman, J.R. (Ed.), Body Compo-sition Analysis of Animals. A Handbook of Non-Destructive Methods.Cambridge University Press, Cambridge, pp. 8–38.
Henny, J., 2004. Reference values: from philosophy to a tool for laboratorymedicine. Clin. Chem. Lab. Med. 42, 686–691.
Hohn, A.A., Scott, M.D., Wells, R.S., Sweeney, J.C., Irvine, A.B., 1989. Growthlayers in teeth from known-age, free-ranging bottlenose dolphins. Mar.Mamm. Sci. 5, 315–342.
Irvine, B., Wells, R.S., 1972. Results of attempts to tag Atlantic bottlenosedolphins (Tursiops truncatus). Cetology 13, 1–5.
Irvine, A.B., Scott, M.D., Wells, R.S., Kaufmann, J.H., 1981. Movements andactivities of the Atlantic bottlenose dolphin, Tursiops truncatus, near Sarasota,Florida. Fish. Bull. U.S. 79, 671–688.
Jepson, P.D., Bennett, P.M., Allchin, C.R., Law, R.J., Kuiken, T., Baker, J.R.,Rogan, E., Kirkwood, J.K., 1999. Investigating potential associations betweenchronic exposure to polychlorinated biphenyls and infectious disease mortality
in harbour porpoises from England and Wales. Sci. Total Environ. 243/244,339–348.
Kannan, K., Blankenship, A.L., Jones, P.D., Giesy, J.P., 2000. Toxicity referencevalues for the toxic effects of polychlorinated biphenyls to aquatic mammals.Hum. Ecol. Risk Assess. 6, 181–201.
Kerr, M.G., 1989. Veterinary Laboratory Medicine, Clinical Biochemistry andHaematology. Blackwell Scientific Publications, Oxford.
Kirkpatrick, B., Fleming, L.E., Squicciarini, D., Baker, L.C., Clark, R.,Abraham, W., Benson, J., Cheng, Y.S., Johnson, D., Pierce, R., Zaias, J.,Bossart, G.D., Baden, D.G., 2004. Literature review of Florida red tide:implications for human health effects. Harmful Algae 3, 99–115.
Knap,A., Dewailly, E., Furgal, C., Galvin, J., Baden, D., Bowen, R.E., Depledge,M.,Duguay, L., Fleming, L.E., Ford, T.,Moser, F., Owen, R., Suk,W.A., Unluata,U.,2002. Indicators of ocean health and human health: developing a research andmonitoring framework. Environ. Health Perspect. 110, 839–845.
Koopman, H.N., Westgate, A.J., Read, A.J., Gaskin, D.E., 1995. Blood chemistryof wild harbor porpoises (Phocoena phocoena). Mar. Mamm. Sci. 11,123–135.
Krafft, A., Lichy, J.H., Lipscomb, T.P., Klaunberg, B.A.,Kennedy, S., Taubenberger,J.K., 1995. Postmortem diagnosis of morbillivirus infection in bottlenosedolphins (Tursiops truncatus) in the Atlantic and Gulf of Mexico epizootics bypolymerase chain reaction. J. Wildl. Dis. 31, 410–415.
Kreuder, C., Miller, M.A., Jessup, D.A., Lowenstein, L.J., Harris, M.D., Ames,J.A., Carpenter, T.E., Conrad, P.A., Mazet, J.A.K., 2003. Patterns ofmortality in southern sea otters (Enhydra lutris nereis) from 1998–2001.J. Wildl. Dis. 39, 495–509.
Lander, M.E., Harvey, J.T., Gulland, F.M.D., 2003. Hematology and serumchemistry comparisons between free-ranging and rehabilitated harbor seal(Phoca vitulina richardsi) pups. J. Wildl. Dis. 39, 600–609.
Lipscomb, T.P., Schulman, F.Y., Moffett, D., Kennedy, S., 1994. Morbilliviraldisease in Atlantic bottlenose dolphins (Tursiops truncatus) from the 1987–1988 epizootic. J. Wildl. Dis. 30, 567–571.
Malakoff, D., 2001. Marine mammals. Scientists use strandings to bring speciesto life. Science 293, 1754–1757.
Marshall, W.J., Bangert, S.K., 2004. Clinical Chemistry, 5th edition. Mosby,Edinburgh. 422 pp.
Mohan, H., Groves, A., Fogelman, I., Clarke, S., 2004. Thyroid hormone andparathyroid hormone competing to maintain calcium levels in the presenceof vitamin D deficiency. Thyroid 14, 789–791.
Neale, J.C.C., Gulland, F.M.D., Schmelzer, K.R., Harvey, J.T., Berg, E.A., Allen,S.G., Greig, D.J., Grigg, E.K., Tjeerdema, R.S., 2005. Contaminant loadsand hematological correlates in the harbor seal (Phoca vitulina) of SanFrancisco Bay, California. J. Toxicol. Environ. Health-Part A — CurrentIssues 68, 617–633.
Nowacek, S.M., Wells, R.S., Solow, A.R., 2001. Short-term effects of boattraffic on bottlenose dolphins, Tursiops truncatus, in Sarasota Bay, Florida.Mar. Mamm. Sci. 17, 673–688.
Pantus, F.J., Dennison, W.C., 2005. Quantifying and evaluating ecosystem health:a case study from Moreton Bay, Australia. Environ. Manage. 36, 757–771.
Payne, R.B., 1997. Method comparison: evaluation of least squares, Demingand Passing/Bablok regression procedures using computer simulation. Ann.Clin. Biochem. 34, 319–320.
Pinheiro, J., Bates, D., 2000. Mixed-Effects Models in S and S-PLUS. Springer-Verlag, New York. Vol.
Read, A.J., Wells, R.S., Hohn, A.A., Scott, M.D., 1993. Patterns of growth inwild bottlenose dolphins, Tursiops truncatus. J. Zool., Lond. 231, 107–123.
Reijnders, P.J.H., 1986. Reproductive failure in common seals feeding on fishfrom polluted coastal waters. Nature (Lond.) 324, 456–457.
Roletto, J., 1993. Hematology and serum chemistry values for clinically healthand sick pinnipeds. J. Zoo Wildl. Med. 24, 145–157.
Rosen, D.A.S., Trites, A.W., 2000. Pollock and the decline of Steller sea lions:testing the junk-food hypothesis. Can. J. Zool. 78, 1243–1250.
Samuel, A.M., Worthy, G.A.J., 2004. Variability in fatty acid composition ofbottlenose dolphin (Tursiops truncatus) blubber as a function of body site,season, and reproductive state. Can. J. Zool. 82, 1933–1942.
Scholin, C.A., Gulland, F., Doucette, G.J., Benson, S., Busman,M., Chavez, F.P.,Cordaro, J., DeLong, R., De Vogelaere, A., Harvey, J., Haulena, M.,Lefebvre, K., Lipscomb, T., Loscutoff, S., Lowenstine, L.J., Marin III, R.,
277A.J. Hall et al. / Comparative Biochemistry and Physiology, Part A 148 (2007) 266–277
Miller, P.E., McLellan, W.A., Moeller, P.D.R., Powell, C.L., Rowles, T.,Silvagni, P., Silver, M., Spraker, T., Trainer, V., Van Dolah, F.M., 2000.Mortality of sea lions along the central California coast linked to a toxicdiatom bloom. Nature (Lond.) 403, 80–84.
Schwacke, L.H.,Voit, E.O., Hansen, L.J.,Wells, R.S.,Mitchum,G.B., Hohn, A.A.,Fair, P.A., 2002. Probabilistic risk assessment of reproductive effects ofpolychlorinated biphenyls on bottlenose dolphins (Tursiops truncatus) fromthe southeast United States coast. Environ. Toxicol. Chem. 21, 2752–2764.
Scott, M.D., Wells, R.S., Irvine, A.B., 1990. A long-term study of bottlenosedolphins on the west coast of Florida. In: Leatherwood, S., Reeves, R.R.(Eds.), The Bottlenose Dolphin. Academic Press, San Diego, pp. 235–244.653 pp.
Sergent, N., Rogers, T., Cunningham, M., 2004. Influence of biological andecological factors on hematological values in wild Little Penguins, Eudyp-tula minor. Comp. Biochem. Physiol. Part A Mol. Integr. Physiol. 138,333–339.
Solberg, H., 1983. The theory of reference values. Part 5. Statistical treatment ofcollected reference values. Determination of reference limits. J. Clin. Chem.Clin. Biochem. 21, 749–760.
Terasawa, F., Kitamura, M., Fujimoto, A., Hayama, S., 2002. Seasonal changesof blood composition in captive bottlenose dolphins. J. Vet. Med. Sci. 64,1075–1078.
Thibault, L., Roberge, A., 1987. The nutritional status of subjects with anorexianervosa. Int. J. Vitam. Nutr. Res. 57, 447–452.
Thompson, P.M., Tollit, D.J., Corpe, H.M., Reid, R.J., Ross, H.M., 1997.Changes in haematological parameters in relation to prey switching in a wildpopulation of harbour seals. Funct. Ecol. 11, 743–750.
Trumble, S.J., Castellini, M.A., Mau, T.L., Castellini, J.M., 2006. Dietary andseasonal influences on blood chemistry and hematology in captive harborseals. Mar. Mamm. Sci. 22, 104–123.
Wells, R.S., 1991. The role of long-term study in understanding the socialstructure of a bottlenose dolphin community. In: Pryor, K., Norris, K.S.(Eds.), Dolphin Societies: Discoveries and Puzzles. Univ. of CaliforniaPress, Berkeley, pp. 199–225. 397 pp.
Wells, R.S., 1993. The marinemammals of Sarasota Bay. In: Roat, P., Ciciccolella,C., Smith, H., Tomasko, D. (Eds.), Sarasota Bay: 1992 Framework for Action.The Sarasota Bay National Estuary Program, 5333 N. Tamiami Trail, Sarasota,FL 34234, pp. 9.1–9.23. Chapter 9.
Wells, P.G., 2003a. Assessing health of the Bay of Fundy—concepts andframework. Mar. Pollut. Bull. 46, 1059–1077.
Wells, R.S., 2003b. Dolphin social complexity: lessons from long-term studyand life history. In: de Waal, F.B.M., Tyack, P.L. (Eds.), Animal SocialComplexity: Intelligence, Culture, and Individualized Societies. HarvardUniversity Press, Cambridge, MA, pp. 32–56.
Wells, R.S., Scott,M.D., 1999. Bottlenose dolphin Tursiops truncatus (Montagu,1821). In: Ridgway, S.H., Harrison, R. (Eds.), Handbook of MarineMammals. The Second Book of Dolphins and Porpoises, vol. 6. AcademicPress, San Diego, CA, pp. 137–182. 486 pp.
Wells, R.S., Irvine, A.B., Scott, M.D., 1980. The social ecology of inshoreodontocetes. In: Herman, L.M. (Ed.), Cetacean Behavior: Mechanisms andFunctions. J.Wiley & Sons, New York, pp. 263–317. 463 pp.
Wells, R.S., Scott, M.D., Irvine, A.B., 1987. The social structure of free-rangingbottlenose dolphins. In: Genoways, H. (Ed.), Current Mammalogy, vol. 1.Plenum Press, New York, pp. 247–305.
Wells, R.S., Rhinehart, H.L., Hansen, L.J., Sweeney, J.C., Townsend, F.I., Stone,R., Casper, D., Scott, M.D., Hohn, A.A., Rowles, T.K., 2004. Bottlenosedolphins as marine ecosystem sentinels: developing a health monitoringsystem. EcoHealth 1, 246–254.
Wells, R.S., Tornero, V., Borrell, A., Aguilar, A., Rowles, T.K., Rhinehart, H.L.,Hofmann, S., Jarman, W.M., Hohn, A.A., Sweeney, J.C., 2005. Integratinglife history and reproductive success data to examine potential relationshipswith organochlorine compounds for bottlenose dolphins (Tursiops trunca-tus) in Sarasota Bay, Florida. Sci. Total Environ. 349, 106–119.
Wise, S.A., Koster, B.J., 1995. Considerations in the design of an environmentalspecimen bank: experiences of the National Biomonitoring Specimen BankProgram. Environ. Health Perspect. 103 (Suppl 3), 61–67.
Copyright © 2022 FDOKUMEN