Effects of fresh and seawater ingestion on osmoregulation in Atlantic bottlenose dolphins (Tursiops...
14
J Comp Physiol B (2010) 180:563–576 DOI 10.1007/s00360-009-0439-0 123 ORIGINAL PAPER EVects of fresh and seawater ingestion on osmoregulation in Atlantic bottlenose dolphins (Tursiops truncatus) Sam Ridgway · Stephanie Venn-Watson Received: 26 May 2009 / Revised: 8 December 2009 / Accepted: 11 December 2009 / Published online: 1 January 2010 © Springer-Verlag 2009 Abstract Bottlenose dolphins (Tursiops truncatus) are marine mammals with body water needs challenged by lit- tle access to fresh water and constant exposure to salt water. Osmoregulation has been studied in marine mam- mals for a century. Research assessing the eVects of ingested fresh water or seawater in dolphins, however, has been limited to few animals and sampling times. Nine 16- to 25-h studies were conducted on eight adult dolphins to assess the hourly impact of fresh water, seawater, and seawater with protein ingestion on plasma and urine osmo- lality, urine Xow rate (ufr), urinary and plasma solute concentrations, and solute clearance rates. Fresh water ingestion increased ufr. Fresh water ingestion also decreased plasma and urine osmolality, sodium and chlo- ride urine concentrations, and solute excretion rates. Sea- water ingestion resulted in increased ufr, sodium, chloride, and potassium urine concentrations, sodium excretion rates, and urine osmolality. Seawater with protein ingestion was associated with increased ufr, plasma osmolality, sodium excretion, and sodium, chloride, potassium, and urea urine concentrations. In conclusion, bottlenose dolphins appear to maintain water and plasma solute balance after ingesting fresh water or seawater by altering urine osmolality and solute clearance. Ingestion of protein with seawater appears to further push osmoregulation limits and urine solute con- centrations in dolphins. Keywords Dolphin · Marine mammal · Osmoregulation · Fresh water · Seawater Abbreviations HPTR High protein test ration MMP Navy Marine Mammal Program Introduction Bottlenose dolphins (Tursiops truncatus) are secondary marine inhabitants with ancestors that lived in terrestrial environments (Shimamura et al. 1997; Thewissen and Madar 1999). As such, adaptations that dolphins and other marine mammals have developed to live in saltwater with little to no access to fresh water have been of interest to renal physiologists for a century. Marine mammals have been characterized as good osmoregulators, and bottlenose dolphin urine osmolality and urine to plasma osmolality ratio have been previously reported as 1,815 mOsm/kg and 5.3, respectively (Ortiz 2001; Malvin and Rayner 1968). The water concentrating capability of dolphins and other cetaceans appears to be better than humans and their close ancestral relatives, cattle, but not as eVective as other mam- mals, including the domestic cat and hopping mouse (Vander 1995; Birukawa et al. 2005; Schmidt-Nielsen 1990). Reports from the early twentieth century initially indi- cated that marine mammals did not ordinarily drink sea- water (Fetcher 1939). More recent literature, however, has demonstrated that some marine mammals ingest small Communicated by I. D. Hume. S. Ridgway (&) Department of Pathology, School of Medicine, University of California San Diego, 9500 Gilman Drive, Mail Code 0679, La Jolla, CA 92093, USA e-mail: [email protected] S. Ridgway · S. Venn-Watson Navy Marine Mammal Program Foundation, 1220 Rosecrans St. #284, San Diego, CA 92106, USA S. Venn-Watson e-mail: [email protected]
-
Upload
independent -
Category
Documents
-
view
0 -
download
0
Transcript of Effects of fresh and seawater ingestion on osmoregulation in Atlantic bottlenose dolphins (Tursiops...
J Comp Physiol B (2010) 180:563–576
DOI 10.1007/s00360-009-0439-0ORIGINAL PAPER
EVects of fresh and seawater ingestion on osmoregulation in Atlantic bottlenose dolphins (Tursiops truncatus)
Sam Ridgway · Stephanie Venn-Watson
Received: 26 May 2009 / Revised: 8 December 2009 / Accepted: 11 December 2009 / Published online: 1 January 2010© Springer-Verlag 2009
Abstract Bottlenose dolphins (Tursiops truncatus) aremarine mammals with body water needs challenged by lit-tle access to fresh water and constant exposure to saltwater. Osmoregulation has been studied in marine mam-mals for a century. Research assessing the eVects ofingested fresh water or seawater in dolphins, however, hasbeen limited to few animals and sampling times. Nine16- to 25-h studies were conducted on eight adult dolphinsto assess the hourly impact of fresh water, seawater, andseawater with protein ingestion on plasma and urine osmo-lality, urine Xow rate (ufr), urinary and plasma soluteconcentrations, and solute clearance rates. Fresh wateringestion increased ufr. Fresh water ingestion alsodecreased plasma and urine osmolality, sodium and chlo-ride urine concentrations, and solute excretion rates. Sea-water ingestion resulted in increased ufr, sodium, chloride,and potassium urine concentrations, sodium excretion rates,and urine osmolality. Seawater with protein ingestion wasassociated with increased ufr, plasma osmolality, sodiumexcretion, and sodium, chloride, potassium, and urea urineconcentrations. In conclusion, bottlenose dolphins appearto maintain water and plasma solute balance after ingesting
fresh water or seawater by altering urine osmolality andsolute clearance. Ingestion of protein with seawater appearsto further push osmoregulation limits and urine solute con-centrations in dolphins.
Keywords Dolphin · Marine mammal · Osmoregulation · Fresh water · Seawater
AbbreviationsHPTR High protein test rationMMP Navy Marine Mammal Program
Introduction
Bottlenose dolphins (Tursiops truncatus) are secondarymarine inhabitants with ancestors that lived in terrestrialenvironments (Shimamura et al. 1997; Thewissen andMadar 1999). As such, adaptations that dolphins and othermarine mammals have developed to live in saltwater withlittle to no access to fresh water have been of interest torenal physiologists for a century. Marine mammals havebeen characterized as good osmoregulators, and bottlenosedolphin urine osmolality and urine to plasma osmolalityratio have been previously reported as 1,815 mOsm/kg and5.3, respectively (Ortiz 2001; Malvin and Rayner 1968).The water concentrating capability of dolphins and othercetaceans appears to be better than humans and their closeancestral relatives, cattle, but not as eVective as other mam-mals, including the domestic cat and hopping mouse (Vander1995; Birukawa et al. 2005; Schmidt-Nielsen 1990).
Reports from the early twentieth century initially indi-cated that marine mammals did not ordinarily drink sea-water (Fetcher 1939). More recent literature, however, hasdemonstrated that some marine mammals ingest small
Communicated by I. D. Hume.
S. Ridgway (&)Department of Pathology, School of Medicine, University of California San Diego, 9500 Gilman Drive, Mail Code 0679, La Jolla, CA 92093, USAe-mail: [email protected]
S. Ridgway · S. Venn-WatsonNavy Marine Mammal Program Foundation, 1220 Rosecrans St. #284, San Diego, CA 92106, USA
S. Venn-Watsone-mail: [email protected]
123
564 J Comp Physiol B (2010) 180:563–576
amounts of seawater, including Weddell seal pups, harpseals, and bottlenose dolphins (Tedman and Green 2009;How and Nordøy 2007; Hui 1981; Telfer et al. 1970). Seaotters routinely drink seawater (Costa 1982), and ingestionof both fresh and seawater has been reported in captive harpseals (Gales and Renouf 1993; Renouf et al. 1990). Coastalbottlenose dolphins may swim into fresh water rivers(Caldwell and Caldwell 1972).
While fresh water ingestion may be a rare concern formost wild dolphins, managed collections of dolphins maybe more likely to be exposed to fresh water sources. Fur-ther, fresh water may be provided intentionally to dolphinsfor therapeutic purposes, including management of renaldisease or response to suspected dehydration.
Limited studies have assessed the impact of fresh water,seawater, and protein ingestion on cetacean osmoregula-tion. After feeding tap water to an adult bottlenose dolphin,urine osmolality appeared to remain at a steady state for 2 hfollowing ingestion, and diuresis did not occur (Malvin andRayner 1968). Hyperosmotic Xuid infusion via stomachtube, however, did demonstrate diuresis in bottlenose dol-phins (Fetcher and Fetcher 1942). Estimated glomerularWltration rate was higher in dolphins that were recently fedcompared to those that were fasted overnight (Venn-Watsonet al. 2008), and Ortiz et al. (2009) recently reported nosigniWcant eVect of feeding on plasma osmolality. In theOrtiz et al. study (2009), there were also no signiWcant post-feeding changes in plasma sodium concentrations. Basedupon dramatically higher plasma and urine urea levels incetaceans compared to cattle, it has been hypothesized thatcetacean osmoregulation mechanisms may be stronglyassociated with diet (Birukawa et al. 2005).
Extensive research has been conducted on seals and sealions to characterize marine mammal osmoregulatoryresponses to fresh water and seawater challenges. Increasedurine Xow rate and decreased urine osmolality have beenreported in seals and sea lions challenged with fresh waterinfusions, and increased Xow rate and increased sodium andchloride excretion have been reported following hypertonicsaline ingestion or infusions (Albrecht 1950; Bradley et al.1954; TarasoV and Toews 1972; Hong et al. 1982; Skogand Folkow 1994; Storeheier and Nordøy 2001; Ortiz et al.2002). Both fresh and seawater infusions increased urinevolume in harbor seals (TarasoV and Toews 1972), andinfusion of hypertonic saline in Northern elephant sealsresulted in increased glomerular Wltration rate and urineoutput (Ortiz et al. 2002, 2003).
To better assess the impact of fresh water, seawater, andseawater with protein ingestion on osmoregulation in dol-phins, nine 16- to 25-h urine and blood collection studieswere conducted on eight adult bottlenose dolphins. Asdemonstrated in other marine mammals, we hypothesizedthat ingestion of fresh water would increase urine Xow rate
and decrease urine osmolality and solute excretion; inges-tion of seawater would increase Xow rate, urine osmolality,and solute excretion; and addition of protein with seawatermay have an additive impact on osmoregulation, includingdiuresis.
Materials and methods
The Navy Marine Mammal Program (MMP) is accreditedby the Association for Assessment and Accreditation ofLaboratory Animal Care International and adheres to thenational standards of the United States Public Health Ser-vice Policy on the Humane Care and Use of LaboratoryAnimals and the Animal Welfare Act. As required by theDepartment of Defense, the MMP’s animal care and useprogram is routinely reviewed by an Institutional AnimalCare and Use Committee and the Navy Bureau of Medi-cine.
Experimental study
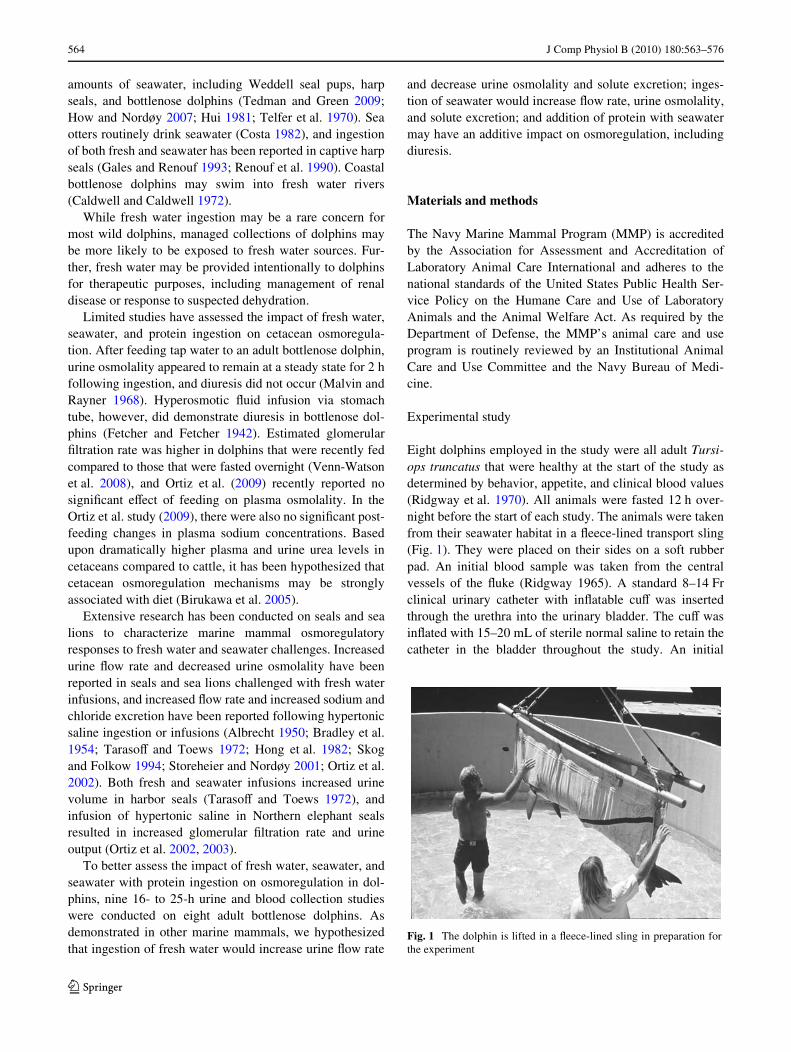
Eight dolphins employed in the study were all adult Tursi-ops truncatus that were healthy at the start of the study asdetermined by behavior, appetite, and clinical blood values(Ridgway et al. 1970). All animals were fasted 12 h over-night before the start of each study. The animals were takenfrom their seawater habitat in a Xeece-lined transport sling(Fig. 1). They were placed on their sides on a soft rubberpad. An initial blood sample was taken from the centralvessels of the Xuke (Ridgway 1965). A standard 8–14 Frclinical urinary catheter with inXatable cuV was insertedthrough the urethra into the urinary bladder. The cuV wasinXated with 15–20 mL of sterile normal saline to retain thecatheter in the bladder throughout the study. An initial
Fig. 1 The dolphin is lifted in a Xeece-lined sling in preparation forthe experiment
123
J Comp Physiol B (2010) 180:563–576 565
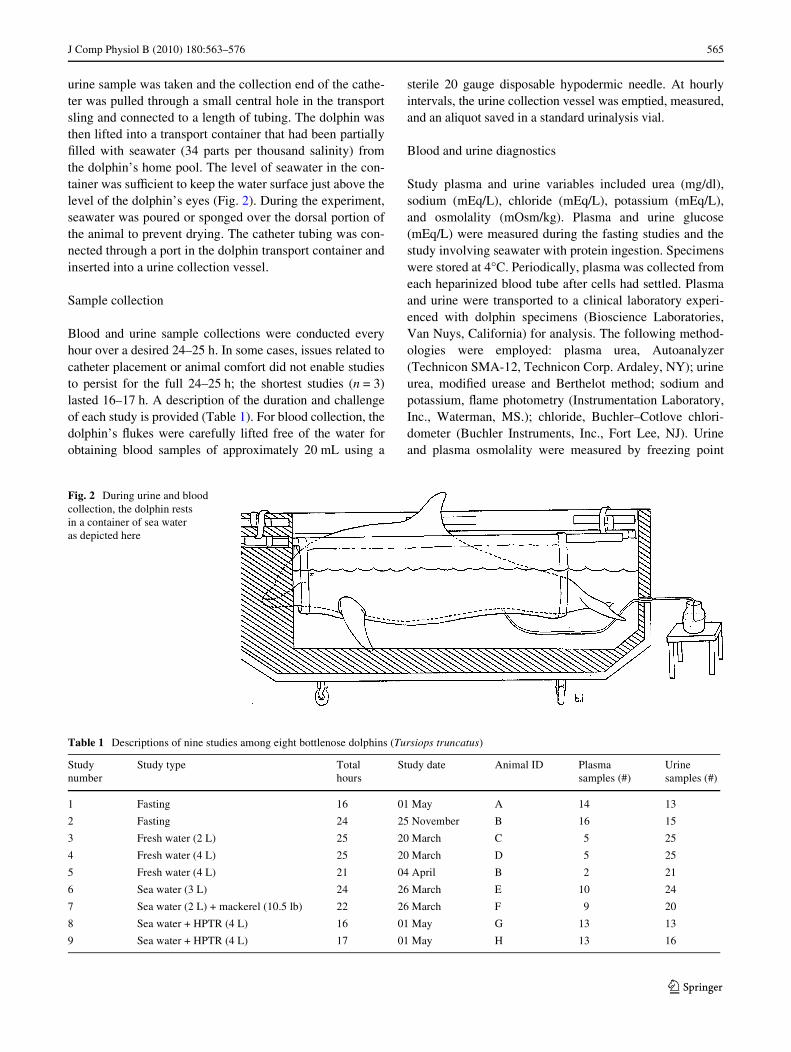
urine sample was taken and the collection end of the cathe-ter was pulled through a small central hole in the transportsling and connected to a length of tubing. The dolphin wasthen lifted into a transport container that had been partiallyWlled with seawater (34 parts per thousand salinity) fromthe dolphin’s home pool. The level of seawater in the con-tainer was suYcient to keep the water surface just above thelevel of the dolphin’s eyes (Fig. 2). During the experiment,seawater was poured or sponged over the dorsal portion ofthe animal to prevent drying. The catheter tubing was con-nected through a port in the dolphin transport container andinserted into a urine collection vessel.
Sample collection
Blood and urine sample collections were conducted everyhour over a desired 24–25 h. In some cases, issues related tocatheter placement or animal comfort did not enable studiesto persist for the full 24–25 h; the shortest studies (n = 3)lasted 16–17 h. A description of the duration and challengeof each study is provided (Table 1). For blood collection, thedolphin’s Xukes were carefully lifted free of the water forobtaining blood samples of approximately 20 mL using a
sterile 20 gauge disposable hypodermic needle. At hourlyintervals, the urine collection vessel was emptied, measured,and an aliquot saved in a standard urinalysis vial.
Blood and urine diagnostics
Study plasma and urine variables included urea (mg/dl),sodium (mEq/L), chloride (mEq/L), potassium (mEq/L),and osmolality (mOsm/kg). Plasma and urine glucose(mEq/L) were measured during the fasting studies and thestudy involving seawater with protein ingestion. Specimenswere stored at 4°C. Periodically, plasma was collected fromeach heparinized blood tube after cells had settled. Plasmaand urine were transported to a clinical laboratory experi-enced with dolphin specimens (Bioscience Laboratories,Van Nuys, California) for analysis. The following method-ologies were employed: plasma urea, Autoanalyzer(Technicon SMA-12, Technicon Corp. Ardaley, NY); urineurea, modiWed urease and Berthelot method; sodium andpotassium, Xame photometry (Instrumentation Laboratory,Inc., Waterman, MS.); chloride, Buchler–Cotlove chlori-dometer (Buchler Instruments, Inc., Fort Lee, NJ). Urineand plasma osmolality were measured by freezing point
Fig. 2 During urine and blood collection, the dolphin rests in a container of sea water as depicted here
Table 1 Descriptions of nine studies among eight bottlenose dolphins (Tursiops truncatus)
Study number
Study type Total hours
Study date Animal ID Plasma samples (#)
Urine samples (#)
1 Fasting 16 01 May A 14 13
2 Fasting 24 25 November B 16 15
3 Fresh water (2 L) 25 20 March C 5 25
4 Fresh water (4 L) 25 20 March D 5 25
5 Fresh water (4 L) 21 04 April B 2 21
6 Sea water (3 L) 24 26 March E 10 24
7 Sea water (2 L) + mackerel (10.5 lb) 22 26 March F 9 20
8 Sea water + HPTR (4 L) 16 01 May G 13 13
9 Sea water + HPTR (4 L) 17 01 May H 13 16
123
566 J Comp Physiol B (2010) 180:563–576
depression with a Fiske osmometer (Advanced InstrumentsInc., Norwood, MA).
Clearance rates, excretion rates, and urine to plasma osmolality ratios
Clearance and Wltration rates were calculated using the fol-lowing equations: hourly urine Xow rate (mL/min) = (totalmL urine/h)/60. Clearance rates for sodium, chloride,potassium and urea (mL/min) = [urine concentration ofsubstance (mEq/L) £ urine Xow rate (mL/min)]/plasmaconcentration of substance (mEq/L). Hourly excretion ratesof solutes were calculated as mEq/min = [total urinary sol-ute (mEq)/60]. Urine to plasma osmolality ratio = urineosmolality/plasma osmolality.
Feeding trials
A total of nine feeding trials were conducted via stomachtube with eight adult bottlenose dolphins (Table 1). Onedolphin (Animal B) participated in two feeding trials; thesetrials were conducted several months apart. The Wve feed-ing trial categories were fasting (last 16–23 h of a 36 h fast-ing period); 2–4 L deionized water; 3 L seawater; 2 Lseawater with 4.8 kg mackerel; and 4 L seawater with 4 kghigh protein test ration (HPTR). The HPTR was made inour laboratory and had been successfully fed to dolphinsand sea lions (Van Dyke 1972). Each kilogram of HPTRconsisted of the following ingredients: Wsh protein concen-trate (100 g), Fish meal (100 g), gelatin (40 g), lard (65 g),cottonseed oil (15 g), sodium alginate (9 g), sodium tripoly-phosphate (3 g), and 668 g water. Total protein, 17.6%,68% water, carbohydrate content was negligible. By com-parison mackerel contained 18.2% protein, 75% water andalso negligible carbohydrate.
Statistics
Data were analyzed using SAS® software (Release 9.2;SAS Institute, Inc., Cary, NC). Mean and standard error ofthe mean (SEM) values were determined for urine Xowrates, plasma and urine osmolalities, urine to plasma osmo-lality ratios, and urine concentrations, urine clearance rates,and serum levels for sodium, chloride, potassium, and urea.Within each study group, changes in urine and plasma val-ues over time were assessed by comparing mean valuesamong the following time categories: 0–5 h, >5–10 h, >10–15 h, and >15 h. An one-way analysis of variance with ageneral linear model was used with post hoc comparisonsamong each of the time categories (PROC GLM; CLASSTIMECATEGORY; MODEL [serum and urine variables]= TIMECATEGORY; MEANS TIMECATEGORY/SCHE-FFE; BY STUDY_TYPE).
Results
Descriptive analyses
Maximum values recorded for urine Xow rate, plasmaosmolality, urine osmolality, and urine to plasma osmolal-ity ratios were 8.2 mL/min, 378, 2,658 mOsm/kg, and 7.3,respectively. The maximum urine concentrations ofsodium, chloride, potassium, and urea were 1,706, 2,222,351, and 110 mEq/L, respectively. Maximum clearancerates for sodium, chloride, potassium, and urea were 24.1,42.7, 292, and 200 mEq/min, respectively. Minimum andmaximum sodium, chloride, potassium, and urea plasmalevels were 141–168, 102–127, 2.8–4.9, and 27.5–65 mEq/L,respectively. In-house serum reference ranges for thesevariables are 152–158, 115–125, 3.4–4.1, and 36–59 mEq/L;it is important to note that these reference ranges are forserum, not plasma, and were established from routine sam-ples submitted to a diVerent reference laboratory usingdiVerent equipment than that used in the present study.
Group comparisons and fasting
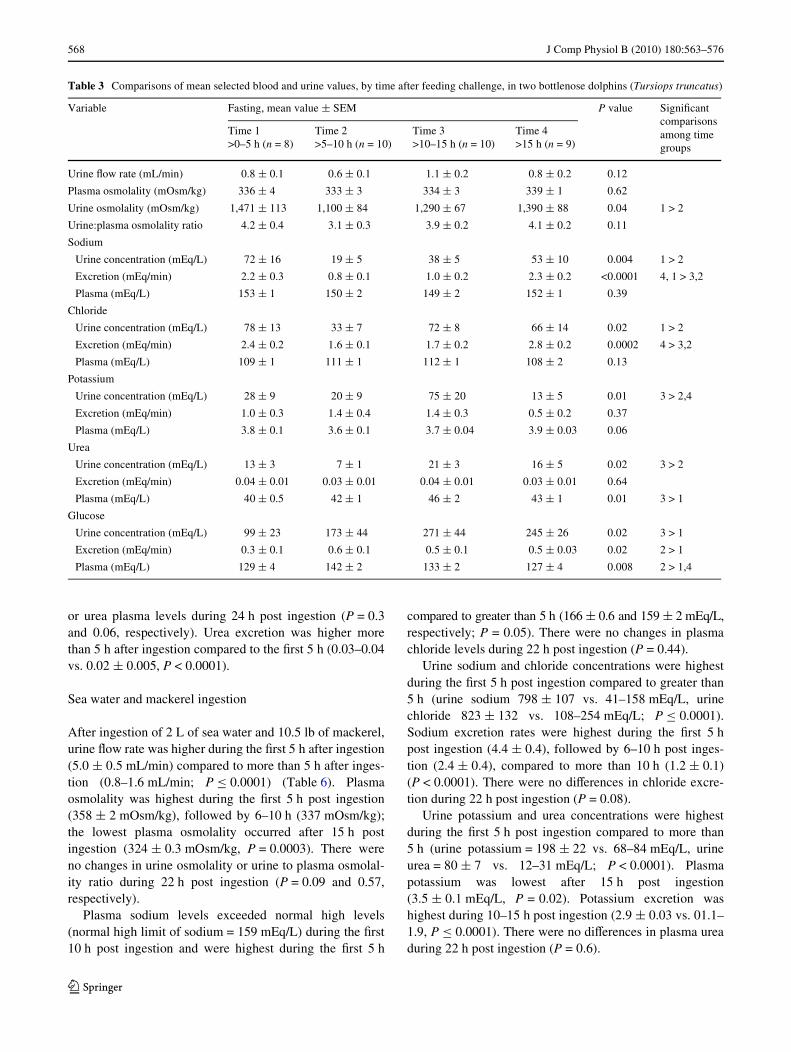
A comparison of mean § SEM plasma and urine valuesamong the Wve study groups is provided in Table 2. Whilethese comparisons are interesting, interpretation is limitedby the fact that only one to two animals were used for eachstudy, and inter-animal variation could not be controlled.Comparisons of measured blood and urine values duringthe last 24 h of 36 h of fasting are provided in Table 3.
Fresh water ingestion
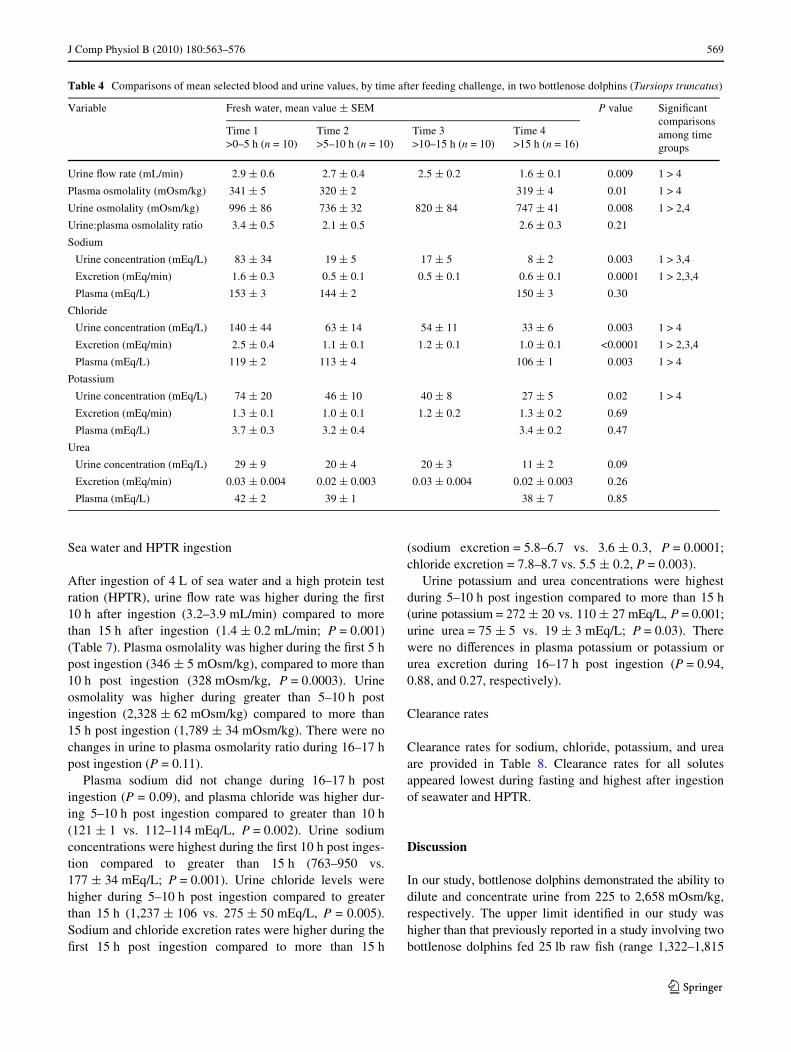
After ingestion of 2–4 L of fresh water, urine Xow rate wassigniWcantly higher during the Wrst 15 h after ingestion(2.5–2.9 mL/min) compared to more than 15 h after inges-tion (1.6 § 0.1 mL/min; P = 0.0009) (Table 4). Plasmaosmolality was lowest 15 or more hours after ingestion(319 § 4 mOsm/kg) compared to the Wrst 5 h (341 § 5mOsm/kg) (P = 0.01), and decreases in urine osmolalitywere detected at 6–10 h as well as more than 15 h afteringestion (736 § 32 and 747 § 41 mOsm/kg, respectively;P = 0.008). No changes in the urine to plasma osmolalityratio were noted during 24 h post ingestion (P = 0.21).
There were no statistically signiWcant changes in plasmasodium levels during 24 h post ingestion (P = 0.3). Plasmachloride was signiWcantly lower 15 h or more post ingestioncompared to the Wrst 5 h (119 § 2 and 106 § 1 mEq/L,respectively; P = 0.003). At greater than 5 h post ingestion,both sodium and chloride mean plasma levels went belowthe normal reference ranges for this population (normallow limit of sodium = 152 mEq/L, normal low limit ofchloride = 115 mEq/L, Venn-Watson et al. 2007).
123
J Comp Physiol B (2010) 180:563–576 567
Urine sodium and chloride concentrations decreasedafter 15 h post ingestion compared to the Wrst 5 h (urinesodium 8 § 2 vs. 83 § 34 mEq/L, urine chloride 33 § 6 vs.140 § 44 mEq/L; P = 0.003). Sodium and chloride excre-tion rates were higher during the Wrst 5 h post ingestioncompared to greater than 5–24 h (sodium excretion =1.6 § 0.3 vs. 0.6 § 0.1, chloride excretion = 2.5 § 0.4 vs.1.0 § 0.1; P = 0.0001).
Urine potassium concentration was lower 15 h or morepost ingestion compared to the Wrst 5 h (27 § 5 and74 § 20 mEq/L, respectively; P = 0.02). There were no sig-niWcant diVerences in potassium plasma levels or excretionrate during 24 h post ingestion. There were no diVerencesin plasma or urine urea concentrations or urea excretionrate during 24 h post ingestion.
Sea water ingestion
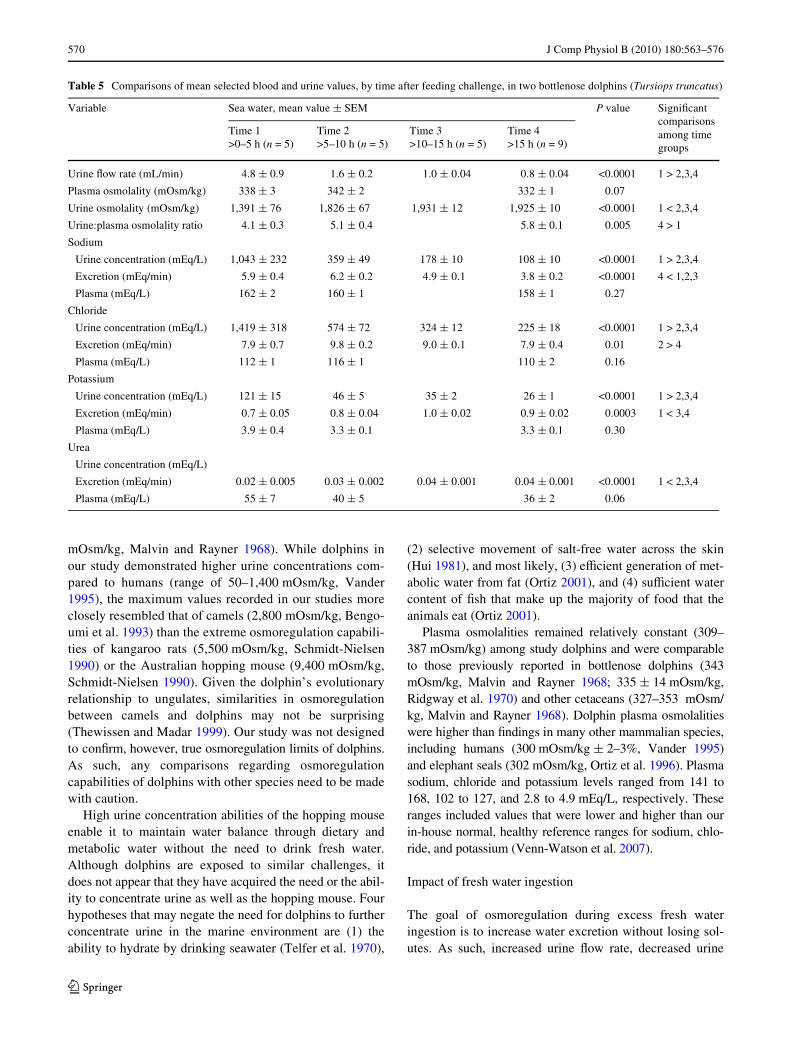
After ingestion of 3 L of sea water, urine Xow rate washigher during the Wrst 5 h after ingestion (4.8 § 0.9 mL/min) compared to more than 5 h after ingestion (0.8–1.6 mL/min; P · 0.0001) (Table 5). There were no changesin plasma osmolality during 24 h post ingestion(P = 0.07). Urine osmolality was higher 5 h or more postingestion compared to the Wrst 5 h (1,826–1,931 vs.
1,391 § 76 mOsm/kg; P · 0.0001). Urine to plasma osmo-lality ratio was higher 15 h or more post ingestion com-pared to the Wrst 5 h (5.8 § 0.1 and 4.1 § 0.3, respectively;P = 0.005).
There were no changes in plasma sodium or chloridelevels during 24 h post ingestion (P = 0.27 and 0.16,respectively). Plasma sodium did exceed normal highlevels, however, during the Wrst 10 h post ingestion (normalhigh limit of sodium 159 mEq/L, Venn-Watson et al.2007).
Urine sodium and chloride concentrations were highestduring the Wrst 5 h post ingestion compared to greater than5 h (urine sodium 1,043 § 232 vs. 108–359 mEq/L, urinechloride 1,419 § 318 vs. 225–574 mEq/L; P · 0.0001).Sodium excretion rates were higher during the Wrst 15 hpost ingestion compared to more than 15 h (4.9–6.2 vs.3.8 § 0.2). Chloride excretion was higher during 6–10 hpost ingestion compared to greater than 15 h (9.8 § 0.2 and7.9 § 0.4, respectively; P = 0.01).
Urine potassium concentration was highest during theWrst 5 h post ingestion compared to more than 5 h(121 § 15 vs. 26–46 mEq/L; P < 0.0001) (Table 4). Potas-sium excretion was highest 10 h or more post ingestioncompared to the Wrst 5 h (0.9–1.0 vs. 0.7 § 0.05, P =0.0003). There were no signiWcant diVerences in potassium
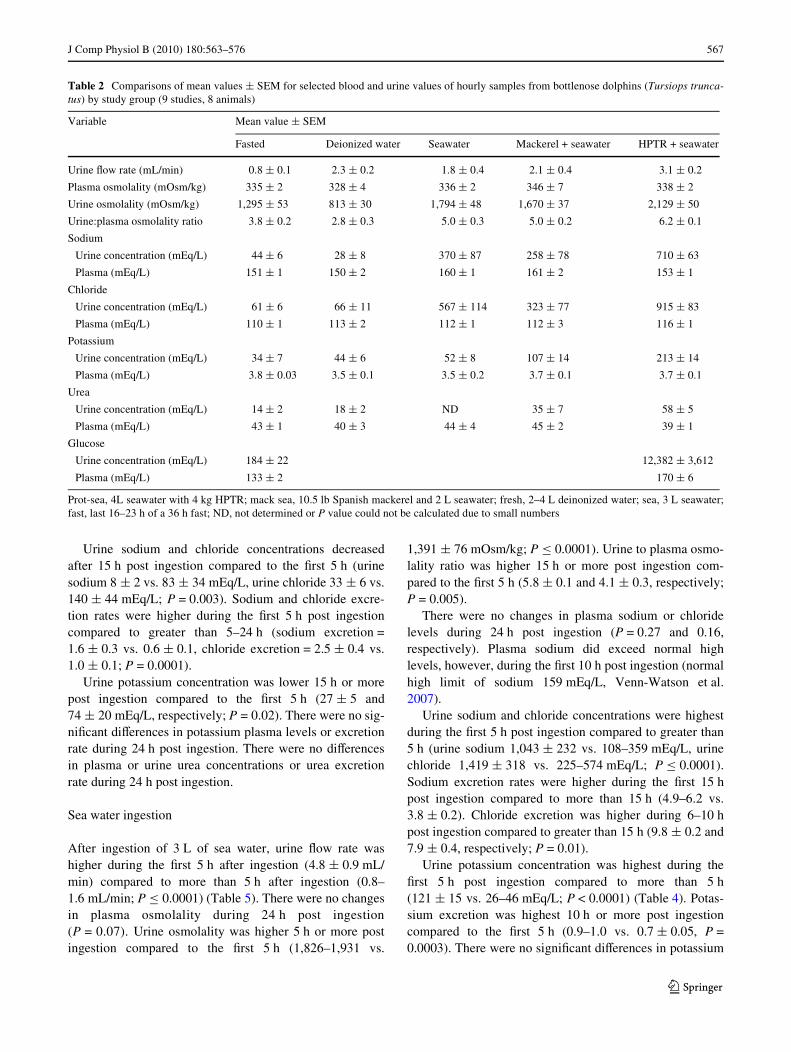
Table 2 Comparisons of mean values § SEM for selected blood and urine values of hourly samples from bottlenose dolphins (Tursiops trunca-tus) by study group (9 studies, 8 animals)
Prot-sea, 4L seawater with 4 kg HPTR; mack sea, 10.5 lb Spanish mackerel and 2 L seawater; fresh, 2–4 L deinonized water; sea, 3 L seawater;fast, last 16–23 h of a 36 h fast; ND, not determined or P value could not be calculated due to small numbers
Variable Mean value § SEM
Fasted Deionized water Seawater Mackerel + seawater HPTR + seawater
Urine Xow rate (mL/min) 0.8 § 0.1 2.3 § 0.2 1.8 § 0.4 2.1 § 0.4 3.1 § 0.2
Plasma osmolality (mOsm/kg) 335 § 2 328 § 4 336 § 2 346 § 7 338 § 2
Urine osmolality (mOsm/kg) 1,295 § 53 813 § 30 1,794 § 48 1,670 § 37 2,129 § 50
Urine:plasma osmolality ratio 3.8 § 0.2 2.8 § 0.3 5.0 § 0.3 5.0 § 0.2 6.2 § 0.1
Sodium
Urine concentration (mEq/L) 44 § 6 28 § 8 370 § 87 258 § 78 710 § 63
Plasma (mEq/L) 151 § 1 150 § 2 160 § 1 161 § 2 153 § 1
Chloride
Urine concentration (mEq/L) 61 § 6 66 § 11 567 § 114 323 § 77 915 § 83
Plasma (mEq/L) 110 § 1 113 § 2 112 § 1 112 § 3 116 § 1
Potassium
Urine concentration (mEq/L) 34 § 7 44 § 6 52 § 8 107 § 14 213 § 14
Plasma (mEq/L) 3.8 § 0.03 3.5 § 0.1 3.5 § 0.2 3.7 § 0.1 3.7 § 0.1
Urea
Urine concentration (mEq/L) 14 § 2 18 § 2 ND 35 § 7 58 § 5
Plasma (mEq/L) 43 § 1 40 § 3 44 § 4 45 § 2 39 § 1
Glucose
Urine concentration (mEq/L) 184 § 22 12,382 § 3,612
Plasma (mEq/L) 133 § 2 170 § 6
123
568 J Comp Physiol B (2010) 180:563–576
or urea plasma levels during 24 h post ingestion (P = 0.3and 0.06, respectively). Urea excretion was higher morethan 5 h after ingestion compared to the Wrst 5 h (0.03–0.04vs. 0.02 § 0.005, P < 0.0001).
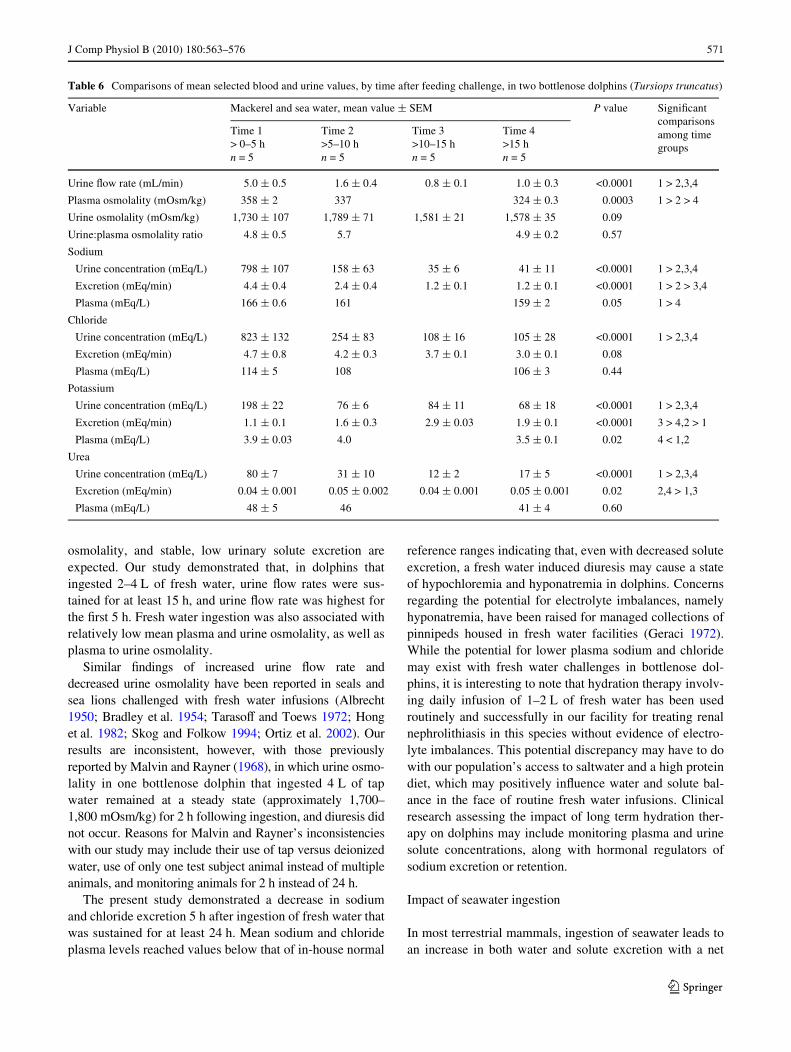
Sea water and mackerel ingestion
After ingestion of 2 L of sea water and 10.5 lb of mackerel,urine Xow rate was higher during the Wrst 5 h after ingestion(5.0 § 0.5 mL/min) compared to more than 5 h after inges-tion (0.8–1.6 mL/min; P · 0.0001) (Table 6). Plasmaosmolality was highest during the Wrst 5 h post ingestion(358 § 2 mOsm/kg), followed by 6–10 h (337 mOsm/kg);the lowest plasma osmolality occurred after 15 h postingestion (324 § 0.3 mOsm/kg, P = 0.0003). There wereno changes in urine osmolality or urine to plasma osmolal-ity ratio during 22 h post ingestion (P = 0.09 and 0.57,respectively).
Plasma sodium levels exceeded normal high levels(normal high limit of sodium = 159 mEq/L) during the Wrst10 h post ingestion and were highest during the Wrst 5 h
compared to greater than 5 h (166 § 0.6 and 159 § 2 mEq/L,respectively; P = 0.05). There were no changes in plasmachloride levels during 22 h post ingestion (P = 0.44).
Urine sodium and chloride concentrations were highestduring the Wrst 5 h post ingestion compared to greater than5 h (urine sodium 798 § 107 vs. 41–158 mEq/L, urinechloride 823 § 132 vs. 108–254 mEq/L; P · 0.0001).Sodium excretion rates were highest during the Wrst 5 hpost ingestion (4.4 § 0.4), followed by 6–10 h post inges-tion (2.4 § 0.4), compared to more than 10 h (1.2 § 0.1)(P < 0.0001). There were no diVerences in chloride excre-tion during 22 h post ingestion (P = 0.08).
Urine potassium and urea concentrations were highestduring the Wrst 5 h post ingestion compared to more than5 h (urine potassium = 198 § 22 vs. 68–84 mEq/L, urineurea = 80 § 7 vs. 12–31 mEq/L; P < 0.0001). Plasmapotassium was lowest after 15 h post ingestion(3.5 § 0.1 mEq/L, P = 0.02). Potassium excretion washighest during 10–15 h post ingestion (2.9 § 0.03 vs. 01.1–1.9, P · 0.0001). There were no diVerences in plasma ureaduring 22 h post ingestion (P = 0.6).
Table 3 Comparisons of mean selected blood and urine values, by time after feeding challenge, in two bottlenose dolphins (Tursiops truncatus)
Variable Fasting, mean value § SEM P value SigniWcant comparisons among time groups
Time 1>0–5 h (n = 8)
Time 2>5–10 h (n = 10)
Time 3>10–15 h (n = 10)
Time 4>15 h (n = 9)
Urine Xow rate (mL/min) 0.8 § 0.1 0.6 § 0.1 1.1 § 0.2 0.8 § 0.2 0.12
Plasma osmolality (mOsm/kg) 336 § 4 333 § 3 334 § 3 339 § 1 0.62
Urine osmolality (mOsm/kg) 1,471 § 113 1,100 § 84 1,290 § 67 1,390 § 88 0.04 1 > 2
Urine:plasma osmolality ratio 4.2 § 0.4 3.1 § 0.3 3.9 § 0.2 4.1 § 0.2 0.11
Sodium
Urine concentration (mEq/L) 72 § 16 19 § 5 38 § 5 53 § 10 0.004 1 > 2
Excretion (mEq/min) 2.2 § 0.3 0.8 § 0.1 1.0 § 0.2 2.3 § 0.2 <0.0001 4, 1 > 3,2
Plasma (mEq/L) 153 § 1 150 § 2 149 § 2 152 § 1 0.39
Chloride
Urine concentration (mEq/L) 78 § 13 33 § 7 72 § 8 66 § 14 0.02 1 > 2
Excretion (mEq/min) 2.4 § 0.2 1.6 § 0.1 1.7 § 0.2 2.8 § 0.2 0.0002 4 > 3,2
Plasma (mEq/L) 109 § 1 111 § 1 112 § 1 108 § 2 0.13
Potassium
Urine concentration (mEq/L) 28 § 9 20 § 9 75 § 20 13 § 5 0.01 3 > 2,4
Excretion (mEq/min) 1.0 § 0.3 1.4 § 0.4 1.4 § 0.3 0.5 § 0.2 0.37
Plasma (mEq/L) 3.8 § 0.1 3.6 § 0.1 3.7 § 0.04 3.9 § 0.03 0.06
Urea
Urine concentration (mEq/L) 13 § 3 7 § 1 21 § 3 16 § 5 0.02 3 > 2
Excretion (mEq/min) 0.04 § 0.01 0.03 § 0.01 0.04 § 0.01 0.03 § 0.01 0.64
Plasma (mEq/L) 40 § 0.5 42 § 1 46 § 2 43 § 1 0.01 3 > 1
Glucose
Urine concentration (mEq/L) 99 § 23 173 § 44 271 § 44 245 § 26 0.02 3 > 1
Excretion (mEq/min) 0.3 § 0.1 0.6 § 0.1 0.5 § 0.1 0.5 § 0.03 0.02 2 > 1
Plasma (mEq/L) 129 § 4 142 § 2 133 § 2 127 § 4 0.008 2 > 1,4
123
J Comp Physiol B (2010) 180:563–576 569
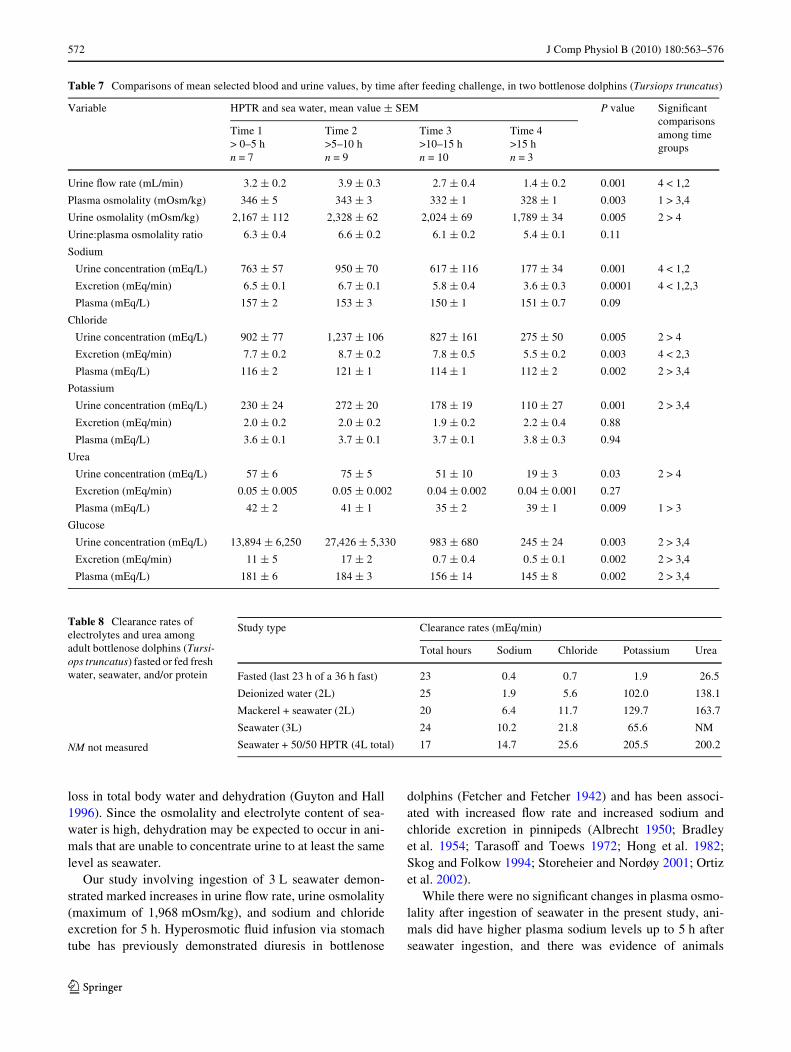
Sea water and HPTR ingestion
After ingestion of 4 L of sea water and a high protein testration (HPTR), urine Xow rate was higher during the Wrst10 h after ingestion (3.2–3.9 mL/min) compared to morethan 15 h after ingestion (1.4 § 0.2 mL/min; P = 0.001)(Table 7). Plasma osmolality was higher during the Wrst 5 hpost ingestion (346 § 5 mOsm/kg), compared to more than10 h post ingestion (328 mOsm/kg, P = 0.0003). Urineosmolality was higher during greater than 5–10 h postingestion (2,328 § 62 mOsm/kg) compared to more than15 h post ingestion (1,789 § 34 mOsm/kg). There were nochanges in urine to plasma osmolarity ratio during 16–17 hpost ingestion (P = 0.11).
Plasma sodium did not change during 16–17 h postingestion (P = 0.09), and plasma chloride was higher dur-ing 5–10 h post ingestion compared to greater than 10 h(121 § 1 vs. 112–114 mEq/L, P = 0.002). Urine sodiumconcentrations were highest during the Wrst 10 h post inges-tion compared to greater than 15 h (763–950 vs.177 § 34 mEq/L; P = 0.001). Urine chloride levels werehigher during 5–10 h post ingestion compared to greaterthan 15 h (1,237 § 106 vs. 275 § 50 mEq/L, P = 0.005).Sodium and chloride excretion rates were higher during theWrst 15 h post ingestion compared to more than 15 h
(sodium excretion = 5.8–6.7 vs. 3.6 § 0.3, P = 0.0001;chloride excretion = 7.8–8.7 vs. 5.5 § 0.2, P = 0.003).
Urine potassium and urea concentrations were highestduring 5–10 h post ingestion compared to more than 15 h(urine potassium = 272 § 20 vs. 110 § 27 mEq/L, P = 0.001;urine urea = 75 § 5 vs. 19 § 3 mEq/L; P = 0.03). Therewere no diVerences in plasma potassium or potassium orurea excretion during 16–17 h post ingestion (P = 0.94,0.88, and 0.27, respectively).
Clearance rates
Clearance rates for sodium, chloride, potassium, and ureaare provided in Table 8. Clearance rates for all solutesappeared lowest during fasting and highest after ingestionof seawater and HPTR.
Discussion
In our study, bottlenose dolphins demonstrated the ability todilute and concentrate urine from 225 to 2,658 mOsm/kg,respectively. The upper limit identiWed in our study washigher than that previously reported in a study involving twobottlenose dolphins fed 25 lb raw Wsh (range 1,322–1,815
Table 4 Comparisons of mean selected blood and urine values, by time after feeding challenge, in two bottlenose dolphins (Tursiops truncatus)
Variable Fresh water, mean value § SEM P value SigniWcant comparisons among time groups
Time 1>0–5 h (n = 10)
Time 2>5–10 h (n = 10)
Time 3>10–15 h (n = 10)
Time 4>15 h (n = 16)
Urine Xow rate (mL/min) 2.9 § 0.6 2.7 § 0.4 2.5 § 0.2 1.6 § 0.1 0.009 1 > 4
Plasma osmolality (mOsm/kg) 341 § 5 320 § 2 319 § 4 0.01 1 > 4
Urine osmolality (mOsm/kg) 996 § 86 736 § 32 820 § 84 747 § 41 0.008 1 > 2,4
Urine:plasma osmolality ratio 3.4 § 0.5 2.1 § 0.5 2.6 § 0.3 0.21
Sodium
Urine concentration (mEq/L) 83 § 34 19 § 5 17 § 5 8 § 2 0.003 1 > 3,4
Excretion (mEq/min) 1.6 § 0.3 0.5 § 0.1 0.5 § 0.1 0.6 § 0.1 0.0001 1 > 2,3,4
Plasma (mEq/L) 153 § 3 144 § 2 150 § 3 0.30
Chloride
Urine concentration (mEq/L) 140 § 44 63 § 14 54 § 11 33 § 6 0.003 1 > 4
Excretion (mEq/min) 2.5 § 0.4 1.1 § 0.1 1.2 § 0.1 1.0 § 0.1 <0.0001 1 > 2,3,4
Plasma (mEq/L) 119 § 2 113 § 4 106 § 1 0.003 1 > 4
Potassium
Urine concentration (mEq/L) 74 § 20 46 § 10 40 § 8 27 § 5 0.02 1 > 4
Excretion (mEq/min) 1.3 § 0.1 1.0 § 0.1 1.2 § 0.2 1.3 § 0.2 0.69
Plasma (mEq/L) 3.7 § 0.3 3.2 § 0.4 3.4 § 0.2 0.47
Urea
Urine concentration (mEq/L) 29 § 9 20 § 4 20 § 3 11 § 2 0.09
Excretion (mEq/min) 0.03 § 0.004 0.02 § 0.003 0.03 § 0.004 0.02 § 0.003 0.26
Plasma (mEq/L) 42 § 2 39 § 1 38 § 7 0.85
123
570 J Comp Physiol B (2010) 180:563–576
mOsm/kg, Malvin and Rayner 1968). While dolphins inour study demonstrated higher urine concentrations com-pared to humans (range of 50–1,400 mOsm/kg, Vander1995), the maximum values recorded in our studies moreclosely resembled that of camels (2,800 mOsm/kg, Bengo-umi et al. 1993) than the extreme osmoregulation capabili-ties of kangaroo rats (5,500 mOsm/kg, Schmidt-Nielsen1990) or the Australian hopping mouse (9,400 mOsm/kg,Schmidt-Nielsen 1990). Given the dolphin’s evolutionaryrelationship to ungulates, similarities in osmoregulationbetween camels and dolphins may not be surprising(Thewissen and Madar 1999). Our study was not designedto conWrm, however, true osmoregulation limits of dolphins.As such, any comparisons regarding osmoregulationcapabilities of dolphins with other species need to be madewith caution.
High urine concentration abilities of the hopping mouseenable it to maintain water balance through dietary andmetabolic water without the need to drink fresh water.Although dolphins are exposed to similar challenges, itdoes not appear that they have acquired the need or the abil-ity to concentrate urine as well as the hopping mouse. Fourhypotheses that may negate the need for dolphins to furtherconcentrate urine in the marine environment are (1) theability to hydrate by drinking seawater (Telfer et al. 1970),
(2) selective movement of salt-free water across the skin(Hui 1981), and most likely, (3) eYcient generation of met-abolic water from fat (Ortiz 2001), and (4) suYcient watercontent of Wsh that make up the majority of food that theanimals eat (Ortiz 2001).
Plasma osmolalities remained relatively constant (309–387 mOsm/kg) among study dolphins and were comparableto those previously reported in bottlenose dolphins (343mOsm/kg, Malvin and Rayner 1968; 335 § 14 mOsm/kg,Ridgway et al. 1970) and other cetaceans (327–353 mOsm/kg, Malvin and Rayner 1968). Dolphin plasma osmolalitieswere higher than Wndings in many other mammalian species,including humans (300 mOsm/kg § 2–3%, Vander 1995)and elephant seals (302 mOsm/kg, Ortiz et al. 1996). Plasmasodium, chloride and potassium levels ranged from 141 to168, 102 to 127, and 2.8 to 4.9 mEq/L, respectively. Theseranges included values that were lower and higher than ourin-house normal, healthy reference ranges for sodium, chlo-ride, and potassium (Venn-Watson et al. 2007).
Impact of fresh water ingestion
The goal of osmoregulation during excess fresh wateringestion is to increase water excretion without losing sol-utes. As such, increased urine Xow rate, decreased urine
Table 5 Comparisons of mean selected blood and urine values, by time after feeding challenge, in two bottlenose dolphins (Tursiops truncatus)
Variable Sea water, mean value § SEM P value SigniWcant comparisons among time groups
Time 1>0–5 h (n = 5)
Time 2>5–10 h (n = 5)
Time 3>10–15 h (n = 5)
Time 4>15 h (n = 9)
Urine Xow rate (mL/min) 4.8 § 0.9 1.6 § 0.2 1.0 § 0.04 0.8 § 0.04 <0.0001 1 > 2,3,4
Plasma osmolality (mOsm/kg) 338 § 3 342 § 2 332 § 1 0.07
Urine osmolality (mOsm/kg) 1,391 § 76 1,826 § 67 1,931 § 12 1,925 § 10 <0.0001 1 < 2,3,4
Urine:plasma osmolality ratio 4.1 § 0.3 5.1 § 0.4 5.8 § 0.1 0.005 4 > 1
Sodium
Urine concentration (mEq/L) 1,043 § 232 359 § 49 178 § 10 108 § 10 <0.0001 1 > 2,3,4
Excretion (mEq/min) 5.9 § 0.4 6.2 § 0.2 4.9 § 0.1 3.8 § 0.2 <0.0001 4 < 1,2,3
Plasma (mEq/L) 162 § 2 160 § 1 158 § 1 0.27
Chloride
Urine concentration (mEq/L) 1,419 § 318 574 § 72 324 § 12 225 § 18 <0.0001 1 > 2,3,4
Excretion (mEq/min) 7.9 § 0.7 9.8 § 0.2 9.0 § 0.1 7.9 § 0.4 0.01 2 > 4
Plasma (mEq/L) 112 § 1 116 § 1 110 § 2 0.16
Potassium
Urine concentration (mEq/L) 121 § 15 46 § 5 35 § 2 26 § 1 <0.0001 1 > 2,3,4
Excretion (mEq/min) 0.7 § 0.05 0.8 § 0.04 1.0 § 0.02 0.9 § 0.02 0.0003 1 < 3,4
Plasma (mEq/L) 3.9 § 0.4 3.3 § 0.1 3.3 § 0.1 0.30
Urea
Urine concentration (mEq/L)
Excretion (mEq/min) 0.02 § 0.005 0.03 § 0.002 0.04 § 0.001 0.04 § 0.001 <0.0001 1 < 2,3,4
Plasma (mEq/L) 55 § 7 40 § 5 36 § 2 0.06
123
J Comp Physiol B (2010) 180:563–576 571
osmolality, and stable, low urinary solute excretion areexpected. Our study demonstrated that, in dolphins thatingested 2–4 L of fresh water, urine Xow rates were sus-tained for at least 15 h, and urine Xow rate was highest forthe Wrst 5 h. Fresh water ingestion was also associated withrelatively low mean plasma and urine osmolality, as well asplasma to urine osmolality.
Similar Wndings of increased urine Xow rate anddecreased urine osmolality have been reported in seals andsea lions challenged with fresh water infusions (Albrecht1950; Bradley et al. 1954; TarasoV and Toews 1972; Honget al. 1982; Skog and Folkow 1994; Ortiz et al. 2002). Ourresults are inconsistent, however, with those previouslyreported by Malvin and Rayner (1968), in which urine osmo-lality in one bottlenose dolphin that ingested 4 L of tapwater remained at a steady state (approximately 1,700–1,800 mOsm/kg) for 2 h following ingestion, and diuresis didnot occur. Reasons for Malvin and Rayner’s inconsistencieswith our study may include their use of tap versus deionizedwater, use of only one test subject animal instead of multipleanimals, and monitoring animals for 2 h instead of 24 h.
The present study demonstrated a decrease in sodiumand chloride excretion 5 h after ingestion of fresh water thatwas sustained for at least 24 h. Mean sodium and chlorideplasma levels reached values below that of in-house normal
reference ranges indicating that, even with decreased soluteexcretion, a fresh water induced diuresis may cause a stateof hypochloremia and hyponatremia in dolphins. Concernsregarding the potential for electrolyte imbalances, namelyhyponatremia, have been raised for managed collections ofpinnipeds housed in fresh water facilities (Geraci 1972).While the potential for lower plasma sodium and chloridemay exist with fresh water challenges in bottlenose dol-phins, it is interesting to note that hydration therapy involv-ing daily infusion of 1–2 L of fresh water has been usedroutinely and successfully in our facility for treating renalnephrolithiasis in this species without evidence of electro-lyte imbalances. This potential discrepancy may have to dowith our population’s access to saltwater and a high proteindiet, which may positively inXuence water and solute bal-ance in the face of routine fresh water infusions. Clinicalresearch assessing the impact of long term hydration ther-apy on dolphins may include monitoring plasma and urinesolute concentrations, along with hormonal regulators ofsodium excretion or retention.
Impact of seawater ingestion
In most terrestrial mammals, ingestion of seawater leads toan increase in both water and solute excretion with a net
Table 6 Comparisons of mean selected blood and urine values, by time after feeding challenge, in two bottlenose dolphins (Tursiops truncatus)
Variable Mackerel and sea water, mean value § SEM P value SigniWcant comparisons among time groups
Time 1> 0–5 hn = 5
Time 2>5–10 hn = 5
Time 3>10–15 hn = 5
Time 4>15 hn = 5
Urine Xow rate (mL/min) 5.0 § 0.5 1.6 § 0.4 0.8 § 0.1 1.0 § 0.3 <0.0001 1 > 2,3,4
Plasma osmolality (mOsm/kg) 358 § 2 337 324 § 0.3 0.0003 1 > 2 > 4
Urine osmolality (mOsm/kg) 1,730 § 107 1,789 § 71 1,581 § 21 1,578 § 35 0.09
Urine:plasma osmolality ratio 4.8 § 0.5 5.7 4.9 § 0.2 0.57
Sodium
Urine concentration (mEq/L) 798 § 107 158 § 63 35 § 6 41 § 11 <0.0001 1 > 2,3,4
Excretion (mEq/min) 4.4 § 0.4 2.4 § 0.4 1.2 § 0.1 1.2 § 0.1 <0.0001 1 > 2 > 3,4
Plasma (mEq/L) 166 § 0.6 161 159 § 2 0.05 1 > 4
Chloride
Urine concentration (mEq/L) 823 § 132 254 § 83 108 § 16 105 § 28 <0.0001 1 > 2,3,4
Excretion (mEq/min) 4.7 § 0.8 4.2 § 0.3 3.7 § 0.1 3.0 § 0.1 0.08
Plasma (mEq/L) 114 § 5 108 106 § 3 0.44
Potassium
Urine concentration (mEq/L) 198 § 22 76 § 6 84 § 11 68 § 18 <0.0001 1 > 2,3,4
Excretion (mEq/min) 1.1 § 0.1 1.6 § 0.3 2.9 § 0.03 1.9 § 0.1 <0.0001 3 > 4,2 > 1
Plasma (mEq/L) 3.9 § 0.03 4.0 3.5 § 0.1 0.02 4 < 1,2
Urea
Urine concentration (mEq/L) 80 § 7 31 § 10 12 § 2 17 § 5 <0.0001 1 > 2,3,4
Excretion (mEq/min) 0.04 § 0.001 0.05 § 0.002 0.04 § 0.001 0.05 § 0.001 0.02 2,4 > 1,3
Plasma (mEq/L) 48 § 5 46 41 § 4 0.60
123
572 J Comp Physiol B (2010) 180:563–576
loss in total body water and dehydration (Guyton and Hall1996). Since the osmolality and electrolyte content of sea-water is high, dehydration may be expected to occur in ani-mals that are unable to concentrate urine to at least the samelevel as seawater.
Our study involving ingestion of 3 L seawater demon-strated marked increases in urine Xow rate, urine osmolality(maximum of 1,968 mOsm/kg), and sodium and chlorideexcretion for 5 h. Hyperosmotic Xuid infusion via stomachtube has previously demonstrated diuresis in bottlenose
dolphins (Fetcher and Fetcher 1942) and has been associ-ated with increased Xow rate and increased sodium andchloride excretion in pinnipeds (Albrecht 1950; Bradleyet al. 1954; TarasoV and Toews 1972; Hong et al. 1982;Skog and Folkow 1994; Storeheier and Nordøy 2001; Ortizet al. 2002).
While there were no signiWcant changes in plasma osmo-lality after ingestion of seawater in the present study, ani-mals did have higher plasma sodium levels up to 5 h afterseawater ingestion, and there was evidence of animals
Table 7 Comparisons of mean selected blood and urine values, by time after feeding challenge, in two bottlenose dolphins (Tursiops truncatus)
Variable HPTR and sea water, mean value § SEM P value SigniWcant comparisons among time groups
Time 1> 0–5 hn = 7
Time 2>5–10 hn = 9
Time 3>10–15 hn = 10
Time 4>15 hn = 3
Urine Xow rate (mL/min) 3.2 § 0.2 3.9 § 0.3 2.7 § 0.4 1.4 § 0.2 0.001 4 < 1,2
Plasma osmolality (mOsm/kg) 346 § 5 343 § 3 332 § 1 328 § 1 0.003 1 > 3,4
Urine osmolality (mOsm/kg) 2,167 § 112 2,328 § 62 2,024 § 69 1,789 § 34 0.005 2 > 4
Urine:plasma osmolality ratio 6.3 § 0.4 6.6 § 0.2 6.1 § 0.2 5.4 § 0.1 0.11
Sodium
Urine concentration (mEq/L) 763 § 57 950 § 70 617 § 116 177 § 34 0.001 4 < 1,2
Excretion (mEq/min) 6.5 § 0.1 6.7 § 0.1 5.8 § 0.4 3.6 § 0.3 0.0001 4 < 1,2,3
Plasma (mEq/L) 157 § 2 153 § 3 150 § 1 151 § 0.7 0.09
Chloride
Urine concentration (mEq/L) 902 § 77 1,237 § 106 827 § 161 275 § 50 0.005 2 > 4
Excretion (mEq/min) 7.7 § 0.2 8.7 § 0.2 7.8 § 0.5 5.5 § 0.2 0.003 4 < 2,3
Plasma (mEq/L) 116 § 2 121 § 1 114 § 1 112 § 2 0.002 2 > 3,4
Potassium
Urine concentration (mEq/L) 230 § 24 272 § 20 178 § 19 110 § 27 0.001 2 > 3,4
Excretion (mEq/min) 2.0 § 0.2 2.0 § 0.2 1.9 § 0.2 2.2 § 0.4 0.88
Plasma (mEq/L) 3.6 § 0.1 3.7 § 0.1 3.7 § 0.1 3.8 § 0.3 0.94
Urea
Urine concentration (mEq/L) 57 § 6 75 § 5 51 § 10 19 § 3 0.03 2 > 4
Excretion (mEq/min) 0.05 § 0.005 0.05 § 0.002 0.04 § 0.002 0.04 § 0.001 0.27
Plasma (mEq/L) 42 § 2 41 § 1 35 § 2 39 § 1 0.009 1 > 3
Glucose
Urine concentration (mEq/L) 13,894 § 6,250 27,426 § 5,330 983 § 680 245 § 24 0.003 2 > 3,4
Excretion (mEq/min) 11 § 5 17 § 2 0.7 § 0.4 0.5 § 0.1 0.002 2 > 3,4
Plasma (mEq/L) 181 § 6 184 § 3 156 § 14 145 § 8 0.002 2 > 3,4
Table 8 Clearance rates of electrolytes and urea among adult bottlenose dolphins (Tursi-ops truncatus) fasted or fed fresh water, seawater, and/or protein
Study type Clearance rates (mEq/min)
Total hours Sodium Chloride Potassium Urea
Fasted (last 23 h of a 36 h fast) 23 0.4 0.7 1.9 26.5
Deionized water (2L) 25 1.9 5.6 102.0 138.1
Mackerel + seawater (2L) 20 6.4 11.7 129.7 163.7
Seawater (3L) 24 10.2 21.8 65.6 NM
Seawater + 50/50 HPTR (4L total) 17 14.7 25.6 205.5 200.2NM not measured
123
J Comp Physiol B (2010) 180:563–576 573
reaching a hypernatremic state (>159 mEq/L) within 10 hafter ingestion of seawater. Along with the seawater andmackerel challenge, ingestion of seawater alone led to thehighest plasma sodium levels among all Wve study groups.Hyperosmotic Xuid challenges among pinnipeds have led tovomiting, diarrhea, and death (Albrecht 1950). While dol-phins may have achieved higher plasma sodium levels afteringestion of seawater, animals in our study did not demon-strate outward clinical signs of seawater toxicosis.
The general consensus, based upon results of earlierstudies involving infusion of hyperosmotic Xuid via stom-ach tube in dolphins, is that cetaceans do not routinelyingest seawater (Fetcher and Fetcher 1942; Malvin andRayner 1968). This hypothesis is supported by the lack ofroutine observation of urine osmolality and urine sodiumand chloride concentrations matching or exceeding that ofseawater (Ortiz 2001). In our study, dolphins were able toachieve urine osmolality above that of seawater, and meanurinary concentrations of sodium and chloride reached afteringestion of seawater were 370 and 567 mEq/L, respec-tively. Despite this response to seawater ingestion, sodiumurine concentrations in the seawater ingestion study did notmatch that found in seawater (470 and 548 mEq/L, respec-tively), supporting earlier evidence that bottlenose dolphinsmay not routinely ingest large boluses of seawater. Interest-ingly, mean sodium and chloride urine concentrations fol-lowing ingestion of HPTR and seawater led to mean urineconcentrations of 710 and 915 mEq/L, respectively, in ourstudy indicating that the dolphin is capable of concentratingsodium and chloride beyond levels found in seawater.
Ingestion of seawater by dolphins during the fasting statehas been reported [ranging between 4.5 and 13 mL/(kg day)] (Telfer et al. 1970; Hui 1981). Further, meanpostmortem urine osmolality among 286 Wn whales (Balae-noptera physalus) was higher than seawater (>2,400mOsm/L), demonstrating that at least some cetaceans canhave consistently high urine concentrations (Kjeld 2001).One hypothesis that may resolve this discrepancy may bethat dolphins ingest small amounts of seawater over timewhile ingesting high protein which does not elicit themarked response found after a single, large dose of 3 L.This hypothesis would make sense, given that wild dol-phins likely routinely ingest saltwater incidentally whencatching Wsh.
Our seawater ingestion studies demonstrate that marinemammals can tolerate disruption of ionic and osmotichomeostasis and restore balance relatively quickly, within5 h. In comparison, sodium-infused dogs may take 3 daysto recover (Bie 1977), and humans with water intoxicationmay take 24 h to restore plasma osmolality (Irving et al.1991). The ability for marine mammals to rapidly restoreosmotic balance likely evolved to enable their survivalin a hyperosmotic environment. The consistent and rapid
response of increased urine Xow rates in all of our chal-lenge studies indicate that GFR is an important means fordolphins to maintain osmotic balance. Further research iswarranted to explain the mechanism of increased GFRfollowing fresh and seawater ingestion among marinemammals.
Impact of seawater with protein
Perhaps the most interesting of all the groups in the presentstudy were those involving seawater with protein. Similarto our Wndings with seawater ingestion, ingestion of 3 L ofseawater with 10.5 lb of mackerel led to higher plasmasodium levels, urine Xow rates, sodium excretion rates, andsodium and chloride urinary concentrations during the Wrst5 h post ingestion. Unlike seawater alone, addition ofmackerel was associated with the highest plasma osmolal-ity achieved among all Wve study groups, and high plasmaosmolality lasted 10 h. Concurrent to high plasma osmolal-ity was a high sodium excretion rate also lasting 10 h. Fur-ther, unlike seawater alone, addition of mackerel wasassociated with highest potassium and urea urine concen-trations during the Wrst 5 h after ingestion.
Pinnipeds that ingest high protein diets have demon-strated increased glomerular Wltration rates after eating(Hiatt and Hiatt 1942). Positive associations between feed-ing and diuresis have also been reported among cetaceans,including bottlenose dolphins (Malvin and Rayner 1968;Venn-Watson et al. 2008). The cause of feeding-associateddiuresis in dolphins and other marine mammals appears tobe driven by nitrogen loading in the kidney (Hiatt and Hiatt1942). This association is also found in terrestrial animals;in fact, immediate weight loss with ingestion of highprotein, low carbohydrate diets is mainly attributed to adiet-driven diuresis in humans (Denke 2001).
Similar to our Wndings in dolphins, ingestion of Wshamong harbor seals was associated with increases insodium, potassium, and urea urine concentrations(Schmidt-Nielsen et al. 1959). High protein diets canenhance renal concentrating abilities in rats (Hendrikx andEpstein 1958) and have been associated with increasedurine osmolality independent of urine volume (Bouby et al.1991). Protein-associated changes in renal function, includ-ing increased urine osmolality and hyperWltration lasting upto 10 h post ingestion, appear to be partially attributed toalterations in vasoactive hormones, including plasma reninactivity and aldosterone (Daniels and Hostetter 1990;Rosenberg et al. 1987). Given the conWrmed presence ofrenin in bottlenose dolphins (Eichelberger et al. 1940;Malvin and Vander 1967; Malvin et al. 1978; Ortiz andWorthy 2000), it is likely that a similar association betweenhigh protein and high plasma renin exists in cetaceans.Interestingly, a recent study by Ortiz et al. (2009) did not
123
574 J Comp Physiol B (2010) 180:563–576
demonstrate signiWcant changes in plasma osmolality inpost-fed dolphins; this diVerence from our Wndings may bedue to the combined eVect of seawater with protein onplasma osmolality or diVerences in the dose or type of Wshand protein fed.
As with the seawater alone study group, animals in thepresent study that ingested seawater with mackerel hadhigh plasma sodium levels suggestive of hypernatremia forthe Wrst 5 h. Given the structure of this study, it was notpossible to determine how much of an impact protein hadon plasma sodium; there is a need to repeat urine andplasma studies on dolphins that ingested protein withoutseawater. Unlike the Wndings in our study, previouslyreported post-feeding dolphins did not exhibit signiWcantchanges in plasma sodium after 5, 11 or 24 h (Ortiz et al.2009).
In animals that ingested a HPTR with seawater, a highmean Xow rate lasted 10 h and remained at levels above thefasting state throughout the study. While plasma osmolalitywas highest during the Wrst 5 h post infusion, urine osmo-lality and urine concentrations of sodium, chloride, potas-sium, and urea reached the highest levels among all studytreatments at 5–10 h, maintaining a mean urine osmolalityabove 2,000 mOsm/L and high sodium and chloride excre-tion rates for 15 h. Interestingly, despite large shifts inosmoregulation after ingesting HPRT with seawater, ani-mals did not become hypernatremic or hyperchloremic.These results indicate that high doses of protein may extendthe duration of diuresis and higher urinary concentration ofall measured solutes. The physiological response causingthis protein-induced change peaked at 5–10 h. Our inter-preted role of protein in osmoregulation has been reportedpreviously by Birukawa et al. (2005), who demonstratedthat cetaceans had signiWcantly higher plasma and urineurea concentrations compared to cattle and concluded thatcetacean osmoregulation may be driven by diet more thanits terrestrial relatives.
There was a marked increase in mean glucose urine andplasma concentrations (2,743 and 1,048 mEq/L, respec-tively) as well as glucose excretion, after dolphins ingestedHPRT with seawater compared to fasted dolphins (urine =17 mEq/L, plasma = 142 mEq/L and excretion = 0.6); thegreatest increases of these variables, similar to urine osmo-lality and solute concentrations, occurred at 5–10 h postinfusion.
In rats, hyperglycemia induces diuresis by increasingnephron Wltration rate and reducing proximal reabsorption(Blantz et al. 1983). A hyperglycemic crisis that occurs inhumans with diabetes involves a hyperosmolar, hypergly-cemic state that includes diuresis (Kitabchi et al. 2001).Thus, there is a need to study how high protein diets impactplasma glucose levels in dolphins and, in turn, how hyper-glycemia may drive osmoregulation. Interestingly, unlike
terrestrial mammalian kidneys, cetacean kidneys appear tohave specialized glycogen stores in the proximal convo-luted tubule epithelial cells (PfeiVer 1997; Ortiz 2001).Given our study’s Wndings, it would be beneWcial to furtherunderstand the role of glycogen stores in dolphin kidneys.
The present study had several limitations, including theuse of eight diVerent adult bottlenose dolphins for ninestudies; while dolphins may have responded diVerently tothe Wve diVerent challenges, changes in urine and plasmalevels were tracked over time in individual animals, allow-ing animals to serve as their own controls. Interpretation ofintergroup comparisons was limited by the fact that onlyone to two animals were used for each study, and inter-ani-mal variation could not be controlled. Plasma solutes weremeasured using an outside laboratory not used for routineserum chemistries at our institution. As such, comparisonsof the study population’s values with that of our currentnormal reference ranges may be inaccurate. The duration ofhourly measurements varied from 16 to 25 h post infusion,which may have limited detectable and comparable impactsof water and protein challenges after 16 h. Most signiWcantresults, however, involved the Wrst 5–10 h post infusion.
In conclusion, bottlenose dolphins appear to diurese andconserve solutes in response to fresh water ingestion, con-centrate urinary solutes in response to seawater ingestion,and diurese and concentrate solutes to extreme levels afteringesting high protein meals. Abnormal plasma valuesappear possible, including hyponatremia after freshwateringestion and hypernatremia following seawater ingestion,indicating that dolphins do not routinely drink large bolusesof fresh or seawater. Protein, however, may play an impor-tant role in maintaining water and solute balance in dol-phins ingesting low levels of fresh water or seawater.Additional studies are needed to better characterize theimpact of high protein diets on dolphin metabolism.
Acknowledgments The authors wish to thank Mr. ChristopherHammell for his assistance with data entry and the reviewers of thismanuscript, including Dr. Rudy Ortiz, for their valuable contributionsand discussion topics. SHR conceived the study hypotheses and imple-mented experimental design. SVW analyzed the data. Both authorswrote and edited the manuscript. The experiments in this study com-plied with the current laws of the country in which the experimentswere performed.
ConXict of interest statement None.
References
Albrecht CB (1950) Toxicity of sea water in mammals. Am J Physiol163:370–385
Bengoumi M, Riad F, Giry J, de la Farge F, Safwate A, Davicco MJ,Barlet JP (1993) Hormonal control of water and sodium in plasmaand urine of camels during dehydration and rehydration. GenComp Endocrinol 89:378–386
123
J Comp Physiol B (2010) 180:563–576 575
Bie P (1977) Sustained water diuresis in anesthetized dogs: antidiure-sis in response to intravenous and bilateral introcarotid infusion ofhyper-osmolar solutions of sodium chloride. Act Physiol Scand101:446–457
Birukawa N, Ando H, Goto M, Kanda N, Pastene LA, Nakatsuji H,Hata H, Urano A (2005) Plasma and urine levels of electrolytes,urea, and steroid hormones involved in osmoregulation of ceta-ceans. Zool Sci 22:1245–1257
Blantz RC, Tucker BJ, Gushwa L, Peterson OW (1983) Mechanism ofdiuresis following acute modest hyperglycemia in the rat. AmJ Physiol Renal Physiol 244:F185–F194
Bouby N, Trinh-Trang-Tan MM, Coutaud C, Bankir L (1991) Vaso-pressin is involved in renal eVects of high-protein diet: study inhomozygous Brattleboro rats. Am J Physiol Renal Physiol260:96–100
Bradley SE, Mudge GH, Blake WD (1954) The renal excretion ofsodium, potassium and water by the harbor seal (Phoce vitulinaL.): eVect of apnea; sodium, potassium and; pitressin; and mercu-rial diuresis. J Cell Comp Physiol 43:1–22
Caldwell DK, Caldwell MC (1972) World of the bottlenose dolphin.J. B. Lippincott, Co., Philadelphia
Costa DP (1982) Energy, nitrogen, electrolyte Xux and sea water drink-ing in the sea otter Enhydra lutris. Physiol Zool 55:35–44
Daniels BS, Hostetter TH (1990) EVects of dietary protein intake onvasoactive hormones. Am J Phys Regul Integr Comp Physiol258:R1095–R1100
Denke M (2001) Metabolic eVects of high-protein low-carbohydratediets. Am J Cardiol 88:59–61
Eichelberger L, Leiter L, Geiling EMK (1940) Water and electrolytecontent of dolphin kidney and extraction of pressor substance(renin). Proc Soc Exp Biol Med 44:356–359
Fetcher ES Jr (1939) The water balance in marine mammals. Q RevBiol 14:451–459
Fetcher ES Jr, Fetcher GW (1942) Experiments on the osmotic regula-tion of dolphins. J Cell Comp Physiol 19:123–130
Gales R, Renouf D (1993) Detecting and measuring food and waterintake in captive seals using temperature telemetry. J WildlManage 57:514–519
Geraci JR (1972) Hyponatremia and the need for dietary salt supplemen-tation in captive pinnipeds. J Am Vet Med Assoc 161:618–623
Guyton AC, Hall JE (eds) (1996) Textbook of medical physiology, 9thedn. W. B. Saunders Company, Philadelphia
Hendrikx A, Epstein FH (1958) EVect of feeding protein and urea onrenal concentrating ability in the rat. Am J Physiol 195:539–542
Hiatt EP, Hiatt RB (1942) The eVect of food on the glomerular Wltra-tion rate and renal blood Xow in the harbor seal (Phoca vitulinaL.). J Cell Comp Physiol 19:221–227
Hong SK, Elsner R, Claybaugh JR, Ronald K (1982) Renal functionsof the Baikal seal Pusa sibirica and ringed seal Pusa hispida.Physiol Zool 55:289–299
How OJ, Nordøy ES (2007) Seawater drinking restores water balancein dehydrated harp seals. J Comp Physiol B Biochem Syst Envi-ron Physiol 177:535–542
Hui CA (1981) Seawater consumption and water Xux in the commondolphin Delphinus delphi. Physiol Zool 54:430–440
Irving RA, Noakes TD, Buck R, van Zyl Smit R, Raine E, GodlontonJ, Norman RJ (1991) Evaluation of renal function and Xuidhomeostasis during recovery from exercise-induced hyponatre-mia. J Appl Physiol 70:342–348
Kitabchi AE, Umpierrez GE, Murphy MB, Barrett EJ, Kreisberg RA,Malone JI, Wall BM (2001) Management of hyperglycemic crisesin patients with diabetes. Diabetes Care 24:131–153
Kjeld M (2001) Concentrations of electrolytes, hormones, and otherconstituents in fresh postmortem blood and urine of Wn whales(Balaenoptera physalus). Can J Zool 79:438–446
Malvin RL, Rayner M (1968) Renal function and blood chemistry incetacea. Am J Physiology 214:187–191
Malvin RL, Vander AJ (1967) Plasma renin activity in marine teleostsand Cetacea. Am J Physiol 213:1582–1584
Malvin RL, Ridgway S, Cornell L (1978) Renin and aldosterone levelsin dolphins and sea lions. Proc Soc Exp Biol Med 157:665–668
Ortiz RM (2001) Osmoregulation in marine mammals. J Exp Biol204:1831–1844
Ortiz RM, Worthy GAJ (2000) EVects of capture on adrenal steroidand vasopressin concentrations in free-ranging bottlenose dol-phins (Tursiops truncatus). Comp Biochem Physiol Part A MolIntegr Physiol 125:317–324
Ortiz RM, Adams SH, Costa DP, Ortiz CL (1996) Plasma vasopressinlevels and water conservation in fasting, postweaned northernelephant seal pups (Mirounga angustirostris). Mar Mamm Sci12:99–106
Ortiz RM, Wade CE, Costa DP, Ortiz CL (2002) Renal responses toplasma volume expansion and hyperosmolality in fasting sealpups. Am J Phys Regul Integr Comp Physiol 282:R805–R817
Ortiz RM, Wade CE, Ortiz CL (2003) Body water handling in responseto hypertonic-saline induced dieresis in fasting northern elephantseal pups (Mirounga angustriostris). Comp Biochem Physiol AMol Integr Physiol 134:423–428
Ortiz RM, Long B, Casper D, Ortiz L, Williams TM (2009) Biochem-ical and hormonal changes during acute fasting and re-feeding inbottlenose dolphins (Tursiops truncatus). Mar Mamm Sci.doi:10.111/j.1748-7692.2009.0009.x
PfeiVer CJ (1997) Renal cellular and tissue specializations in the bot-tlenose dolphin (Tursiops truncatus) and beluga whale (Dephin-apterus leucas). Aquat Mammal 23:75–84
Renouf D, Noseworthy E, Scott MC (1990) Daily fresh water con-sumption by captive harp seals (Phoca groenlandica). MarMamm Sci 6:253–257
Ridgway SH (1972) Homeostasis in the aquatic environment. In: Ridg-way S (ed) Mammals of the sea: biology and medicine. Charles C.Thomas, SpringWeld, pp 590–747
Ridgway SH, Simpson JG, Patton GS, Gilmartin WG (1970) Hemato-logic Wndings in certain small cetaceans. J Am Vet Med Assoc157:566–575
Rosenberg ME, Swanson JE, Thomas BL, Hostetter TH (1987)Glomerular and hormal responses to dietary protein intake inhuman renal disease. Am J Physiol Renal Physiol 253:F1083–F1090
Schmidt-Nielsen K (1990) Animal physiology: adaptation and envi-ronment, 4th edn. Cambridge University Press, New York
Schmidt-Nielsen B, Murdaugh HV, O’Dell R, Bacsanyi J (1959) Ureaexcretion and diving in the seal (Phoca vitulina L.). J Cell CompPhysiol 53:393–411
Shimamura MH, Yasue H, Ohshima K et al (1997) Molecular evidencefrom retroposons that whales form a clade within even-toed ungu-lates. Nature 388:666–670
Skog EB, Folkow LP (1994) Nasal heat and wter exchange is not aneVector mechanism for water balance regulation in grey seals.Acta Physiol Scand 151:233–240
Storeheier PV, Nordøy ES (2001) Physiological eVects of seawaterintake in adult harp seals during phase I of fasting. CompBiochem Physiol Part A Mol Integr Physiol 128:307–315
TarasoV F, Toews D (1972) The osmotic and ionic regulatory capaci-ties of the kidney of the harbor seal, Phoca vitulina. J Comp Phys-iol 81:121–132
Tedman R, Green B (2009) Water and sodium Xuxes and lactationalenergetic in suckling pups of Weddell seals (Leptonychotes wedd-ellii). J Zool 212:29–42
Telfer N, Cornell LH, Prescott JH (1970) Do dolphins drink water?J Am Vet Med Assoc 157:555–558
123
576 J Comp Physiol B (2010) 180:563–576
Thewissen JGM, Madar SI (1999) Ankle morphology of the earliestcetaceans and its implications for the phylogenetic relationsamong ungulates. Syst Biol 48:21–30
Van Dyke D (1972) Contingency ration for California sea lions (Zalo-phus californianus). Naval Undersea Center, Technical ReportNo 317. San Diego
Vander AJ (1995) Renal physiology, 5th edn. McGraw-Hill, Inc.,New York
Venn-Watson S, Jensen ED, Ridgway SH (2007) EVects of age and sexon clinicopathologic reference ranges in a healthy managedAtlantic bottlenose dolphin population. J Am Vet Med Assoc231:596–601
Venn-Watson S, Smith CR, Dold C, Ridgway SH (2008) Use of aserum-based glomerular Wltration rate prediction equation toassess renal function by age, sex, fasting, and health status in bot-tlenose dolphins (Tursiops truncatus). Mar Mamm Sci 24:71–80
123