Bubble ring play of bottlenose dolphins (Tursiops truncatus): Implications for cognition
Upload
georgetownCategory
view
1download
0
Molecular Ecology (2004)
13
, 1975–1990 doi: 10.1111/j.1365-294X.2004.02192.x
© 2004 Blackwell Publishing Ltd
00000111111111111111111111111111111111111Blackwell Publishing, Ltd.
‘O father: where art thou?’ — Paternity assessment in an open fission–fusion society of wild bottlenose dolphins (
Tursiops
sp.) in Shark Bay, Western Australia
MICHAEL KRÜTZEN,
*
LYNNE M. BARRÉ,
†
R ICHARD C. CONNOR,
‡
JANET MANN
§
and WILLIAM B. SHERWIN
*§
*
School of Biological, Earth and Environmental Sciences, University of New South Wales, Sydney NSW 2052, Australia,
†
National Marine Fisheries Service, NOAA, Seattle, WA 98115, USA,
‡
Biology Department, UMASS-Dartmouth, North Dartmouth, MA 02748, USA,
§
Department of Psychology and Department of Biology, Georgetown University, Washington, DC 20057, USA
Abstract
Sexually mature male bottlenose dolphins in Shark Bay cooperate by pursuing distinctalliance strategies to monopolize females in reproductive condition. We present the resultsof a comprehensive study in a wild cetacean population to test whether male alliancemembership is a prerequisite for reproductive success. We compared two methods forinferring paternity: both calculate a likelihood ratio, called the paternity index, betweentwo opposing hypotheses, but they differ in the way that significance is applied to the data.The first method, a Bayesian approach commonly used in human paternity testing, appearedto be overly conservative for our data set, but would be less susceptible to assumptionsif a larger number of microsatellite loci had been used. Using the second approach, thecomputer program
CERVUS
2.0, we successfully assigned 11 paternities to nine males, and17 paternities to 14 out of 139 sexually mature males at 95% and 80% confidence levels,respectively. It appears that being a member of a bottlenose dolphin alliance is not aprerequisite for paternity: two paternities were obtained by juvenile males (one at the 95%,the other at the 80% confidence level), suggesting that young males without alliance partnerspursue different mating tactics to adults. Likelihood analyses showed that these two juvenilemales were significantly more likely to be the true father of the offspring than to be theirhalf-sibling (
P
< 0.05). Using paternity data at an 80% confidence level, we could show thatreproductive success was significantly skewed within at least some stable first-orderalliances (
P
< 0.01). Interestingly, there is powerful evidence that one mating was incestuous,with one calf apparently fathered by its mother’s father (
P
< 0.01). Our study suggeststhat the reproductive success of both allied males, and of nonallied juveniles, needs to beincorporated into an adaptive framework that seeks to explain alliance formation in malebottlenose dolphins.
Keywords
: alliance formation, Bayesian inference of paternity, bottlenose dolphin, paternity index,
Tursiops
sp.
Received 29 November 2003; revision received 11 February 2004; accepted 24 February 2004
Introduction
Evolution by natural and sexual selection predicts thatindividuals will attempt to maximize their inclusive fitness.This usually leads to diverse forms of competition (Davies1985), especially in males, and ultimately to the evolution
of different mating systems (e.g. Bradbury & Vehrencamp1977; Clutton-Brock & Harvey 1978). Differences in mat-ing systems both within and among populations can beattributed mainly either to individual variation and/or theadaptation of male and female behaviour to ecological andsocial constraints (Rubenstein 1980; Dunbar 1981). Matingsystems usually fall under one of the three categories ofsexual selection (Smuts & Smuts 1993; Clutton-Brock &Parker 1994). The first category is intrasexual competition,
Correspondence: M. Krützen. Fax: + 61 29385 1558; E-mail: [email protected]
1976
M . K R Ü T Z E N
E T A L
.
© 2004 Blackwell Publishing Ltd,
Molecular Ecology
, 13, 1975–1990
where males either compete directly through physicalcontests or indirectly through the production of moreand higher quality sperm (Harcourt
et al
. 1981). The secondcategory is mate choice, where, for example, females ‘choose’a particular male because he can demonstrate his qualityeither through fighting (Cox & Le Boeuf 1977), energeticallycostly ornamentation (McGraw
et al
. 2001), or crypticchoice of sperm (Cordero & Eberhard 2003). Finally, thereis mate coercion, where males either intimidate, harass afemale, or force copulations to increase their mating success(Smuts & Smuts 1993). Whatever mating strategy occurs,selection is expected to maximize inclusive fitness benefits,either directly through reproduction, or indirectly throughreproduction of relatives (Hamilton 1964a,b).
In this paper, we focus on the reproductive success ofmales in a well-documented case of alliance formation andmate coercion in cetaceans: in bottlenose dolphins (
Tursiops
sp.), males form nested levels of alliances to sequesterfemales in reproductive condition (Wells
et al
. 1987;Connor
et al
. 1992a, 1999). Alliances in contests betweensocial groups are commonly found in mammals, butalliances within social groups are comparatively rare(Harcourt 1992). Females form alliances primarily tocompete for divisible resources, such as food (Wrangham1980), while males form alliances in competition for females.Because fertilizations are not divisible, male alliances areprobably much less common and thus of considerableinterest when found (van Hooff & van Schaik 1994). Malesmay ally in competition that is indirectly related to femaleaccess (e.g. rank competition), but more often the competi-tion is direct, as males attempt to take female consorts fromother males (Bercovitch 1988), herd females (Caro 1994),and/or guard females (Packer
et al
. 1991). When malescooperate to guard or sequester a single female, and bothhave mating access, then the question of who fathersthe offspring becomes of great interest. Furthermore, inpopulations where not all males form alliances, then itbecomes important to determine whether alternative (e.g.nonalliance) strategies are ever successful.
Measurement of reproductive skew in social groups isfundamental to the understanding of the evolution andmaintenance of sociality, as it determines the immediatefitness benefits to helpers of staying and helping in aparticular group. Over the past two decades, variousmodels for an evolutionarily stable strategy (
sensu
MaynardSmith 1982) in which skew varies have been developed(Vehrencamp 1983a,b; Cant 1997; Reeve 1998; Reeve
et al
.1998; Kokko & Johnstone 1999; Crespi & Ragsdale 2000;Johnstone 2000). Depending on the model, the correlationbetween relatedness and group size or skew is predicted tobe either negative, positive or zero. There is now a growingbody of research investigating the relationships betweenmale mating behaviour and variance in male matingsuccess, enabling us to test whether the observed male
competitive tactics are, in fact, successful. In many cases,it has emerged that paternity is significantly skewed infavour of a few dominant males [e.g. savannah baboons
Papiocynocephalus
(Alberts
et al
. 2003); black rhinoceros
Dicerosbicornis
(Garnier
et al
. 2001); fallow deer
Dama dama
(Say
et al
. 2003)].Compared to terrestrial systems, detailed studies of
parentage in marine mammals are scarce. Nielsen
et al
. (2001)reported that dominant male humpback whales (
Megapteranovaeangliae
) have a relatively higher reproductive successthan subdominant males. Although on a very limited dataset, Clapham & Palsbøll (1997) showed multiple paternitiesfor offspring from the same female from different years inthe same species. Investigating the breeding behaviour ofpilot whales,
Globicephela melas
, Amos
et al
. (1991) showedthat for 88% of all sampled foetuses, all sampled males fromwithin the pod could be excluded as fathers. However,several offspring within a pod often had the same fatherfrom another pod, creating paternal half-sibling cohortssimilar to lion prides.
To date, bottlenose dolphins comprise the only spe-cies outside humans where males have been shown to formtwo levels of nested alliance formation within a social group(Connor
et al
. 1992a,b, 1999). Mating strategies for malebottlenose dolphins in Shark Bay appear to be structuredaround two strategies of alliance formation, which we willcall strategy I and strategy II throughout the paper. StrategyI involves the formation of small and stable first-orderalliances, lasting up to 17 years (R. Connor, unpublisheddata); these alliances are pairs or trios of males who co-operate to sequester and control individual females inreproductive condition. Furthermore, teams of two or morefirst-order alliances may cooperate to attack other alliancesor to defend against such attacks, forming second-orderalliances (Connor
et al
. 1992a,b). Strategy II involves theformation of labile first-order alliances within a stable largesecond-order alliance called a ‘superalliance’ (Connor
et al
.1999, 2001). The best documented superalliance consists of14 males that associate in pairs and trios to control individualfemales, but is different from stable alliances as individualmales frequently switch their alliance partners within thesuperalliance.
An investigation of the relationship between alliancemembership and genetic relatedness showed markeddifferences in relatedness patterns within the Shark Baydolphin population (Krützen
et al
. 2003). Animals engagingin strategy I are, on average, more closely related thanexpected by chance, indicating that males engaging in thisalliance strategy could receive inclusive fitness benefits.Thus, it is conceivable that some male bottlenose dolphins inalliances composed of relatives might act as nonreproduc-tive helpers, as suggested for lions
Panthera leo
(Packer
et al
.1991). In contrast, strategy II males are not closely related(Krützen
et al
. 2003), indicating that this alliance type
P A T E R N I T Y A S S E S S M E N T I N W I L D B O T T L E N O S E D O L P H I N S
1977
© 2004 Blackwell Publishing Ltd,
Molecular Ecology
, 13, 1975–1990
provides, at best, less fitness benefits through the repro-duction of kin. Any advantage of strategy II must relateto other factors, such as a numerical advantage in competi-tion with strategy I alliances.
Cooperation among male bottlenose dolphins has beenreported from at least three other study sites (Wells
et al
.1987; Möller
et al
. 2001; Parsons
et al
. 2003). In Sarasota Bay,Florida, male bottlenose dolphins (
Tursiops truncatus
) arealso found to form stable pairs and consort with females(Wells
et al
. 1987; Wells 1991). In contrast, male bottlenosedolphins (
T. truncatus
) in the Moray Firth, Scotland, do notshow the high association coefficients with other malesthat is typical of alliance formation in other populations(Wilson
et al
. 1992, 1993).In this paper, we sought to determine the relationship
between alliance membership and reproductive success. Inparticular, we were interested in (1) whether reproductionis limited to males that form alliances, and (2) the distribu-tion of paternities within and among all strategy I alliances.These results will aid in the development of an adaptiveframework that seeks to explain alliance formation in malebottlenose dolphins.
Materials and methods
Behavioural sampling
Bottlenose dolphins have been systematically studiedin Shark Bay since the mid-1980s (Connor
et al
. 1992a,b;Smolker
et al
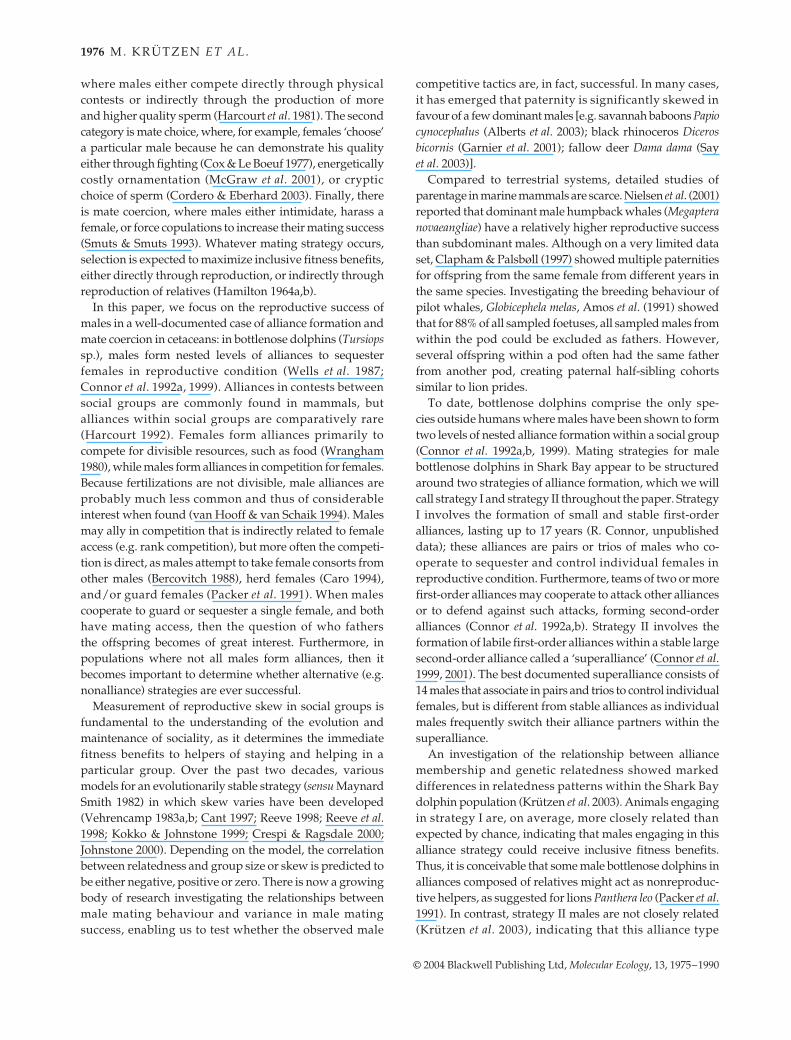
. 1992). The core study area covers about200 km
2
(Fig. 1). Between 1994 and 1999, tissue sampleswere opportunistically obtained from 305 free-rangingbottlenose dolphins in the Eastern Gulf, using a biopsysystem that was specially designed for use in small cetac-eans (Krützen
et al
. 2002).Age was determined using two approaches. The actual
year of birth was used if known. In the second approach,size and ventral speckling information were used. Specklingof the ventral area typically first appears between 7 and11 years of age and increases through adulthood (Smolker
et al
. 1992). Speckling begins around the genital area, thenthe belly and eventually spreads to the chest and chin invery old animals. Lateral speckling occurs later than ven-tral speckling. Grades of speckling range from 1 (no speck-ling) to 4 (heavy speckling). The grades of speckling were
Fig. 1 Geographical location of bottlenose dolphin samples collected for this study. One point may represent more than one individual.The dashed lines indicate the combined boundaries of survey blocks 3 and 5 (see Preen et al. 1997). There were no dolphin sightings southof the indicated area in the Eastern Gulf (Preen et al. 1997).

1978
M . K R Ü T Z E N
E T A L
.
© 2004 Blackwell Publishing Ltd,
Molecular Ecology
, 13, 1975–1990
calibrated by reference to speckles of animals of knownage. Individuals first sighted as juveniles could be moreaccurately aged compared to those first sighted as adults.For Shark Bay females, 12 years is the earliest known age atfirst reproduction (Mann
et al
. 2000). Therefore, all femalesaged 12 years or older at the time of their sampling wereconsidered to be sexually mature. Males were treated dif-ferently. Shark Bay males do not appear to form alliancesand begin herding females until their mid- to late teens(Connor
et al
. 2000a). However, sexual maturity mightbegin much earlier, as suggested by bursts in testosteronelevels in Sarasota Bay dolphins at 8 years of age (Wells
et al
.1987). For this reason, all males that could have been least8 years of age when they were sampled were included ascandidate fathers.
For males, alliance membership was known frompreviously published work (Connor
et al
. 1992a, 1999) andongoing studies. Males were also sampled whose affiliationto a particular type of alliance could not be entirely resolvedusing the behavioural data available (see Results). How-ever, preliminary observations suggested that 10 of thosemales fulfil the alliance membership criteria (Connor
et al
.1992a): during individual follows they have been observedto engage in aggressive behaviour towards other malesand females, and they showed association coefficients inthe range of stable alliances (R. Connor, unpublished data).Therefore, those 10 males will be referred to as ‘potentialstrategy I alliance’ members. It was not possible to assignalliance partners to the remaining males. However, this maywell be the result of limited behavioural data for thosemales, rather than that these animals genuinely do not havean alliance partner. In this paper, we refer to those malesas ‘males without assigned alliance partners’, bearing inmind that future studies with adequate behavioural samplesize may reveal alliance membership for those males.
Tissue sampling and genetic analysis
Tissue sampling and storage was carried out as describedin Krützen
et al
. (2002). Total genomic DNA was extractedfrom skin biopsies using standard methods (Davis
et al
.1986). The animals were genetically sexed following themethod developed by Gilson
et al
. (1998). All samples weregenotyped with a panel of eight highly polymorphicdinucleotide microsatellite loci: these were MK3, MK5,MK6, MK8, MK9 (Krützen
et al
. 2001); EV1 (Valsecchi &Amos 1996); KWM12 (Hoelzel
et al
. 1998); and 199/200(Amos
et al
. 1993). The polymerase chain reaction productswere run on an ABI 377 DNA automated sequencer (AppliedBiosystems), and the size of the fragments obtained wasmeasured using
genescan
, version 3.1 and
genotyper
,version 1.1.1 software (both Applied Biosystems).
To test for duplicate samples, the data were checkedfor identical genotype entries, using
mstools
, version
3.0 (available from http://oscar.gen.tcd.ie/~sdepark/ms-toolkit/). The level of expected heterozygosity (
H
E
) andother locus characteristics were estimated. The probabil-ity that two unrelated individuals have an identical geno-type was calculated using the formula from Paetkau
et al
.(1995):
where
p
i
and
p
j
are the frequencies of the
i
th and the
j
thalleles at each locus in a given population.
Studies of paternity require detailed knowledge aboutgenetic population structure. Previous studies have shownthat for nuclear DNA markers, there is weak isolation bydistance with male and female gene flow rates (
Nm
) of8–130 between adjacent sampling localities within theEastern Gulf of Shark Bay (Krützen
et al
. 2004). Because ofthe high gene flow, all individuals in the east Shark Baystudy area are considered to be part of the same populationand were pooled for subsequent analysis.
Paternity inference
Paternity was inferred using two different approaches. Bothmethods are identical in that they calculate a likelihoodratio of two competing hypotheses, known as the PaternityIndex (
PI
) in human paternity testing (Pena & Chakraborty1994). The two competing hypotheses are
H
(1)
: The candidate father is the true father
H
(0)
: The candidate father is an unrelated random malefrom the same population.
The likelihood ratios
LR
PO
=
PI
=
H
(1)
/
H
(0)
for each locusare calculated using the formulae developed for caseswhere the mother’s genotype is known (Brenner 1997), andfor individuals without maternal data (Brenner 1993) andwere generated using the software
cervus
2.0 (Marshall
et al
. 1998). Both approaches imply that the individuals to betested are from the same racial background (in human test-ing) or from the same population (in animal populations).
The difference between the two approaches lies in theway in which significance is applied to the paternity index.The first method (called ‘Bayesian inference’ throughoutthis paper) is commonly used in legal paternity disputes inhumans. The posterior likelihood (
W
; i.e. the probability ofpaternity, or ‘
Wahrscheinlichkeit
’) of
H
(1)
is calculated usingBayes’ theorem (Evett & Weir 1998):
W =
p
prior
Π
PI
/[(
p
prior
Π
PI
) + (1
−
p
prior
)]
where
p
prior
is the prior probability. In human paternitytesting,
p
prior
is the probability of
H
(1)
prior to
considering thegenetic evidence. In cases where there are many candidate
I p p pii
i jj ii
( )= +∑ ∑∑>
4 22
P A T E R N I T Y A S S E S S M E N T I N W I L D B O T T L E N O S E D O L P H I N S
1979
© 2004 Blackwell Publishing Ltd,
Molecular Ecology
, 13, 1975–1990
fathers for a child (i.e. orgies in humans, promiscuousmating systems in animals),
p
prior
for
H
(1)
= 1/n; n being thenumber of candidate fathers. Note that for a large PI,pprior has only a very small influence on the probability ofpaternity W.
The second method (called cervus throughout thispaper) uses a simulation approach to define a ∆ statisticbased on population allele frequencies and resolves pater-nities between the two males with the highest PIs with aknown level of statistical confidence (Marshall et al. 1998).cervus was developed with studies in mind where not allcandidate parents could be excluded using codominantgenetic markers; it allows incomplete sampling of thecandidate parents as well as potential scoring errors thatmight occur in large data sets. The input parametersrequired are: the number of candidate fathers (similar to nin Bayesian inference; this needs to be estimated fromecological data); the proportion of candidate fatherssampled (which needs to be estimated from field data); theproportion of loci typed (which can be calculated fromthe data set); and the genotyping error rate (which can beestimated from observed mismatches between mothersand their known offspring, assuming that the occurrenceof germ-line mutations is negligible and that the mutationrates between males and females are the same). The malewith the highest LOD-score, defined as the natural loga-rithm of the paternity index (Meagher 1986), will be assignedpaternity if the difference of his LOD-score to that of thesecond most likely male is larger than ∆. If a nonzero errorrate has been specified, some genotypic mismatches betweenthe candidate fathers and the tested offspring will beallowed. Through its simulation, cervus allows the explora-tion of assumptions and sampling limits on the final result.
For both the Bayesian approach and cervus, calculatingPI following both methods assumes that there are negligiblelevels of inbreeding in the population, as indicated bya nonsignificant overall FIS. If the population FIS is foundto be significant, the formulae to calculate the likelihoodratios need to be modified (Evett & Weir 1998). Hence,the global level of inbreeding of the Shark Bay dolphinpopulation was calculated as described in Weir &Cockerham (1984), using the program fstat, version 2.93(Goudet 1995).
Input parameters
The mating system of Shark Bay dolphins is promiscuous(Connor et al. 1996). Females have been observed to consortwith as many as 13 different males during one breedingseason (Connor et al. 1996), although this is likely to be agross underestimate, and females give birth to a singlecalf usually every 4–5 years (Mann et al. 2000). Thus, it isunlikely that there will be a high proportion of full siblingswithin the population.
The most conservative approach for estimating ppriorusing Bayesian inference is to estimate the number of males(regardless of their reproductive and social status) thatmight have physical access to the sampled females. Ourestimate of n was based on three previous studies. Aerialsurveys undertaken in 1989 and 1991 showed that theaverage number of all dolphins in the Eastern Gulf was 860(± 87.5); this area is about 5.5 times larger than our studyarea (Fig. 1, Preen et al. 1997). The sex ratio between adultmales and females is not significantly different from 1 : 1(Krützen, unpublished data). Population genetic studiesshowed that there is weak isolation by distance for bothnuclear and mitochondrial markers throughout SharkBay (Krützen et al. 2004). Both mitochondrial and nuclearmarkers reveal that animals from the western part of theWestern Gulf of Shark Bay are genetically different fromanimals from the Eastern Gulf (Fig. 1). The animals sampledoff the top of the Peron Peninsula are not genetically dif-ferent to the nearest sampling locations in the Eastern Gulfbut are significantly different at both mitochondrial andnuclear loci to animals from the Western Gulf (for samplinglocations see Krützen et al. 2004); hence, these animalscould be included in the analysis. Within our study areain the Eastern Gulf, female dispersal is limited betweenadjacent sampling localities, and male dispersal appearsto be slightly greater than that of females (Krützen et al.2004). Therefore, immigration of candidate fathers into ourstudy area appears to be negligible. Based on these data,the number of candidate fathers was estimated to be430, which is regarded as a conservative overestimate. Inaddition, the posterior probabilities were also calculated fortwo different priors, which are based on the average numberof male individuals found in the Eastern Gulf ± 2 SD (Preenet al. 1997) to evaluate the effect that different priors haveon the probability of paternity.
The software cervus 2.0 (Marshall et al. 1998) was usedand the input parameters were estimated as follows: thenumber of candidate fathers was derived in the same wayas for the Bayesian inference; the proportions of malessampled was calculated from field data the proportion ofloci typed was 0.939; and the error rate was set to zero, i.e.a mismatch between candidate fathers and offspring wasnot allowed. Similar to the Bayesian inference, weexplored the assumptions using cervus by altering theinput parameters for the 10 000 simulation runs. Thisconservative approach was chosen because, first, onlycandidate fathers that are genetically compatible with thecalf are subjected to the statistical analysis. This eliminatesthe potential problem of having to interpret parentageassignments where candidate fathers show high LOD-scores due to rare alleles that they share by chance with theoffspring, but have one or more genotypic mismatcheswith the calf, a scenario commonly observed using thecervus approach. Second, it allows direct comparison of
1980 M . K R Ü T Z E N E T A L .
© 2004 Blackwell Publishing Ltd, Molecular Ecology, 13, 1975–1990
both approaches used in this study. An error rate of 1.5%would lead to a nonassignment of an average of 1 in 66.6paternities using a pure exclusion approach in a matingsystem with no or low male reproductive skew. Given thatthere are only 64 offspring in our data set, we regard thispotential source of error as negligible.
A recent study showed that males forming strategy I alli-ances are, on average, more closely related than expectedby chance (Krützen et al. 2003). To account for potentiallyelevated levels of relatedness among candidate fathers, weset the relatedness parameter in cervus to 0.104, which isthe average relatedness of strategy I males (Krützen et al.2003), and included one relative at this relatedness level foreach candidate father in the simulation.
Is the assigned father actually a half-sibling?
Without detailed knowledge about genealogical relation-ships, a potential problem for paternity assignments inwild populations is that the assigned father could be a closerelative of the tested offspring. This is especially importantin our case because we had to make various assumptionsabout the reproductive status of males. Given the popula-tion and mating structure of Shark Bay dolphins (Connoret al. 1992a,b; Krützen et al. 2004) and the relatively longbirth intervals (Mann et al. 2000), one could propose thatthe assigned candidate father is indeed a half-sibling ofthe offspring. The two most likely propositions, given themating systems of the Shark Bay dolphins, are PP1: therelationship between the assigned candidate father andthe offspring is true; i.e. the DNA profiles are from fatherand offspring, and PP2: the assigned candidate father is indeeda half-sibling of the offspring. Brenner & Weir (2003) recentlydeveloped a method that allows the comparison of thelikelihoods of PP1 and PP2. In addition to H(0) and H(1), thereis one more hypothesis for each observed match to consider:
HA: The DNA profiles are from two half-siblings
The likelihood ratio for two individuals with alleles aband cd is
(modified from Brenner & Weir 2003), where a, b, c and drepresent the four alleles which may or may not be identicalin state; P0, P1, P2 and P3, P4, P5 are the probabilities thattwo individuals that are related as specified in H(1) and HA,respectively, share zero, one or two pairs of alleles identicalby descent; u and v depend on the frequencies of the allelesshared as follows: quantities x1, x2, x3, x4 are defined for
four possible allelic combinations ac, ad, bc, bd. Each x is setto zero if the two alleles are identical in state, and is thereciprocal of the allele frequencies when they are non-identical in state. Then u = (x1 + x2 + x3 + x4)/4 and v =(x1x4 + x2x3)/2 (Brenner & Weir 2003).
If LRPO/HS > 1, then PP1 is more likely than PP2. Con-versely, if LRPO/HS < 1, then PP2 is the more plausibleexplanation for the data. To test the significance of LRPO/HS,the likelihood ratio was converted into a χ2 statistic using theformula χ2 = log(LRPO/HS) × (2 ln 10) with one degree of free-dom (Lander & Kruglyak 1995). The suitability of this methodwas examined on two known maternal half-sibling pairs.
Testing for reproductive skew
For further questions such as whether reproduction islimited to allied males, and whether paternities within andamong all strategy I alliances are evenly distributed, thecervus results at the 80% confidence level were used.Although this increases the chance of a type I error, webelieve that this is warranted for three main reasons: first,for each paternity, there were no other matching males inthe data set (see Results); second, we did not allow a mis-match between candidate father and offspring; and third,we used a gross overestimate for the number of potentialfathers in the cervus simulation. The skew of the distribu-tion of paternities within and between strategy I allianceswas tested by randomly reassigning all paternities achievedby all strategy I alliance members 1000 times and countingthe number of occasions on which the variance of the random-ized distribution exceeded the observed.
Results
Sampling success
For this study, a total of 312 dolphins was sampled (Table 1).Seven samples were excluded from further analysisbecause it was not possible to determine the sex of sixadult animals, and one animal was sampled twice. Of theremaining 305 animals, 244 were assigned to the core studyarea based on their sampling location (Table 1, Fig. 1). Inthe core study area, 88.1% of the animals had previouslybeen sighted, while for the remainder of East Shark Bay,72.1% of the sampled animals were known. Thirty-fourknown mother–calf pairs (verified by behavioural andmicrosatellite data), 28 sexually mature members of malealliances, and 30 juveniles without paternal data weresampled (Tables 1 and 2). Fifteen of these males were mem-bers of seven strategy I alliances, and 13 were members ofthe superalliance. Ten potential strategy I alliance memberswere also sampled. It was not possible to assign an alliancepartner to the remaining males (101 from East Shark Bay or76 from the core study area; see Materials and methods).
LRPPPP
LRab cd Hab cd H
LRab cd Hab cd H
P uP vPP uP vPPO HS/
Pr ( , | )Pr ( , | )
Pr ( , | )Pr ( , | )
= =
=+ ++ +
1
2
1
0
0
0 1 2
3 4 5A
P A T E R N I T Y A S S E S S M E N T I N W I L D B O T T L E N O S E D O L P H I N S 1981
© 2004 Blackwell Publishing Ltd, Molecular Ecology, 13, 1975–1990
Microsatellite data
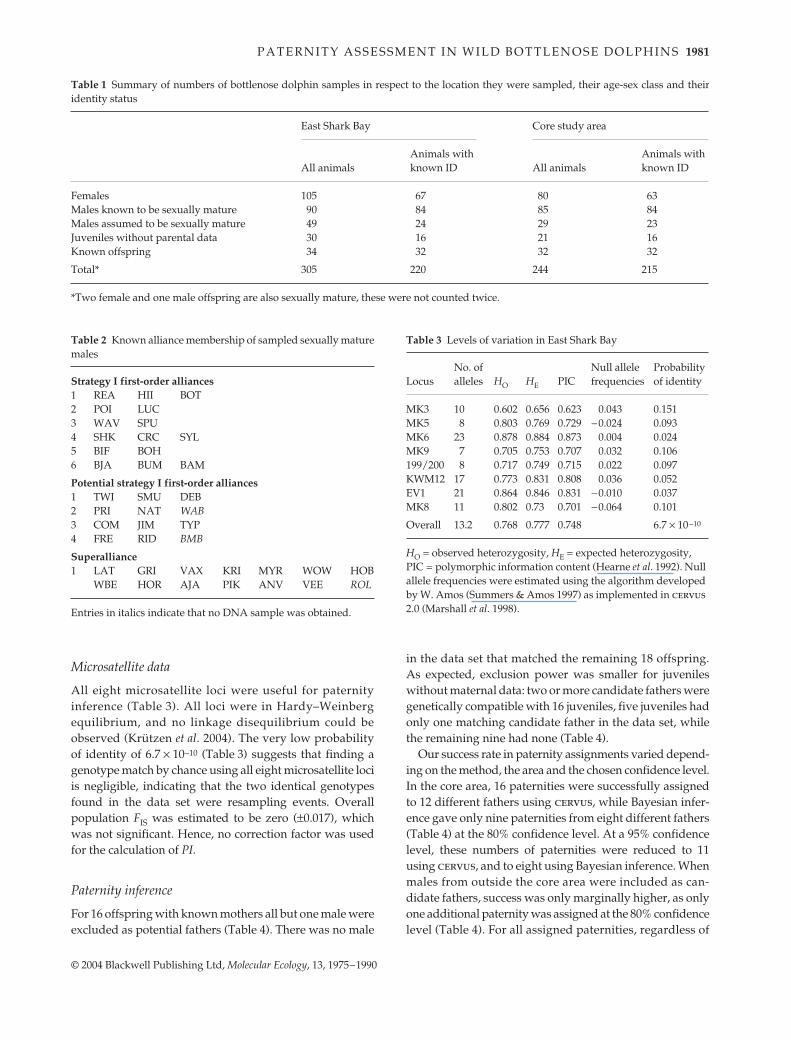
All eight microsatellite loci were useful for paternityinference (Table 3). All loci were in Hardy–Weinbergequilibrium, and no linkage disequilibrium could beobserved (Krützen et al. 2004). The very low probabilityof identity of 6.7 × 10⁻¹⁰ (Table 3) suggests that finding agenotype match by chance using all eight microsatellite lociis negligible, indicating that the two identical genotypesfound in the data set were resampling events. Overallpopulation FIS was estimated to be zero (±0.017), whichwas not significant. Hence, no correction factor was usedfor the calculation of PI.
Paternity inference
For 16 offspring with known mothers all but one male wereexcluded as potential fathers (Table 4). There was no male
in the data set that matched the remaining 18 offspring.As expected, exclusion power was smaller for juvenileswithout maternal data: two or more candidate fathers weregenetically compatible with 16 juveniles, five juveniles hadonly one matching candidate father in the data set, whilethe remaining nine had none (Table 4).
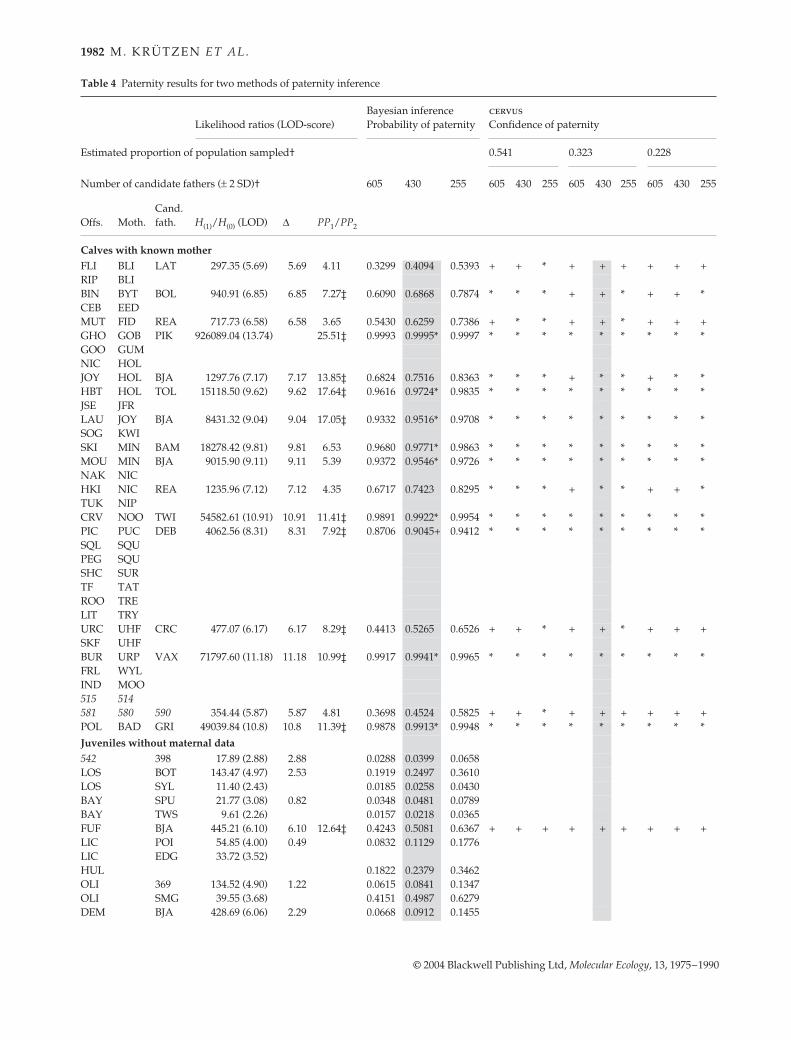
Our success rate in paternity assignments varied depend-ing on the method, the area and the chosen confidence level.In the core area, 16 paternities were successfully assignedto 12 different fathers using cervus, while Bayesian infer-ence gave only nine paternities from eight different fathers(Table 4) at the 80% confidence level. At a 95% confidencelevel, these numbers of paternities were reduced to 11using cervus, and to eight using Bayesian inference. Whenmales from outside the core area were included as can-didate fathers, success was only marginally higher, as onlyone additional paternity was assigned at the 80% confidencelevel (Table 4). For all assigned paternities, regardless of
Table 1 Summary of numbers of bottlenose dolphin samples in respect to the location they were sampled, their age-sex class and theiridentity status
East Shark Bay Core study area
All animalsAnimals with known ID All animals
Animals with known ID
Females 105 67 80 63Males known to be sexually mature 90 84 85 84Males assumed to be sexually mature 49 24 29 23Juveniles without parental data 30 16 21 16Known offspring 34 32 32 32
Total* 305 220 244 215
*Two female and one male offspring are also sexually mature, these were not counted twice.
Table 2 Known alliance membership of sampled sexually maturemales
Strategy I first-order alliances1 REA HII BOT2 POI LUC3 WAV SPU4 SHK CRC SYL5 BIF BOH6 BJA BUM BAM
Potential strategy I first-order alliances1 TWI SMU DEB2 PRI NAT WAB3 COM JIM TYP4 FRE RID BMB
Superalliance1 LAT GRI VAX KRI MYR WOW HOB
WBE HOR AJA PIK ANV VEE ROL
Entries in italics indicate that no DNA sample was obtained.
Table 3 Levels of variation in East Shark Bay
LocusNo. of alleles HO HE PIC
Null allele frequencies
Probability of identity
MK3 10 0.602 0.656 0.623 0.043 0.151MK5 8 0.803 0.769 0.729 −0.024 0.093MK6 23 0.878 0.884 0.873 0.004 0.024MK9 7 0.705 0.753 0.707 0.032 0.106199/200 8 0.717 0.749 0.715 0.022 0.097KWM12 17 0.773 0.831 0.808 0.036 0.052EV1 21 0.864 0.846 0.831 −0.010 0.037MK8 11 0.802 0.73 0.701 −0.064 0.101
Overall 13.2 0.768 0.777 0.748 6.7 × 10⁻¹⁰
HO = observed heterozygosity, HE = expected heterozygosity, PIC = polymorphic information content (Hearne et al. 1992). Null allele frequencies were estimated using the algorithm developed by W. Amos (Summers & Amos 1997) as implemented in cervus 2.0 (Marshall et al. 1998).
1982 M . K R Ü T Z E N E T A L .
© 2004 Blackwell Publishing Ltd, Molecular Ecology, 13, 1975–1990
Table 4 Paternity results for two methods of paternity inference
Likelihood ratios (LOD-score)Bayesian inference Probability of paternity
cervus Confidence of paternity
Estimated proportion of population sampled† 0.541 0.323 0.228
Number of candidate fathers (± 2 SD)† 605 430 255 605 430 255 605 430 255 605 430 255
Offs. Moth.Cand. fath. H(1)/H(0) (LOD) ∆ PP1/PP2
Calves with known motherFLI BLI LAT 297.35 (5.69) 5.69 4.11 0.3299 0.4094 0.5393 + + * + + + + + +RIP BLIBIN BYT BOL 940.91 (6.85) 6.85 7.27‡ 0.6090 0.6868 0.7874 * * * + + * + + *CEB EEDMUT FID REA 717.73 (6.58) 6.58 3.65 0.5430 0.6259 0.7386 + * * + + * + + +GHO GOB PIK 926089.04 (13.74) 25.51‡ 0.9993 0.9995* 0.9997 * * * * * * * * *GOO GUMNIC HOLJOY HOL BJA 1297.76 (7.17) 7.17 13.85‡ 0.6824 0.7516 0.8363 * * * + * * + * *HBT HOL TOL 15118.50 (9.62) 9.62 17.64‡ 0.9616 0.9724* 0.9835 * * * * * * * * *JSE JFRLAU JOY BJA 8431.32 (9.04) 9.04 17.05‡ 0.9332 0.9516* 0.9708 * * * * * * * * *SOG KWISKI MIN BAM 18278.42 (9.81) 9.81 6.53 0.9680 0.9771* 0.9863 * * * * * * * * *MOU MIN BJA 9015.90 (9.11) 9.11 5.39 0.9372 0.9546* 0.9726 * * * * * * * * *NAK NICHKI NIC REA 1235.96 (7.12) 7.12 4.35 0.6717 0.7423 0.8295 * * * + * * + + *TUK NIPCRV NOO TWI 54582.61 (10.91) 10.91 11.41‡ 0.9891 0.9922* 0.9954 * * * * * * * * *PIC PUC DEB 4062.56 (8.31) 8.31 7.92‡ 0.8706 0.9045+ 0.9412 * * * * * * * * *SQL SQUPEG SQUSHC SURTF TATROO TRELIT TRYURC UHF CRC 477.07 (6.17) 6.17 8.29‡ 0.4413 0.5265 0.6526 + + * + + * + + +SKF UHFBUR URP VAX 71797.60 (11.18) 11.18 10.99‡ 0.9917 0.9941* 0.9965 * * * * * * * * *FRL WYLIND MOO515 514581 580 590 354.44 (5.87) 5.87 4.81 0.3698 0.4524 0.5825 + + * + + + + + +POL BAD GRI 49039.84 (10.8) 10.8 11.39‡ 0.9878 0.9913* 0.9948 * * * * * * * * *
Juveniles without maternal data542 398 17.89 (2.88) 2.88 0.0288 0.0399 0.0658LOS BOT 143.47 (4.97) 2.53 0.1919 0.2497 0.3610LOS SYL 11.40 (2.43) 0.0185 0.0258 0.0430BAY SPU 21.77 (3.08) 0.82 0.0348 0.0481 0.0789BAY TWS 9.61 (2.26) 0.0157 0.0218 0.0365FUF BJA 445.21 (6.10) 6.10 12.64‡ 0.4243 0.5081 0.6367 + + + + + + + + +LIC POI 54.85 (4.00) 0.49 0.0832 0.1129 0.1776LIC EDG 33.72 (3.52)HUL 0.1822 0.2379 0.3462OLI 369 134.52 (4.90) 1.22 0.0615 0.0841 0.1347OLI SMG 39.55 (3.68) 0.4151 0.4987 0.6279DEM BJA 428.69 (6.06) 2.29 0.0668 0.0912 0.1455
P A T E R N I T Y A S S E S S M E N T I N W I L D B O T T L E N O S E D O L P H I N S 1983
© 2004 Blackwell Publishing Ltd, Molecular Ecology, 13, 1975–1990
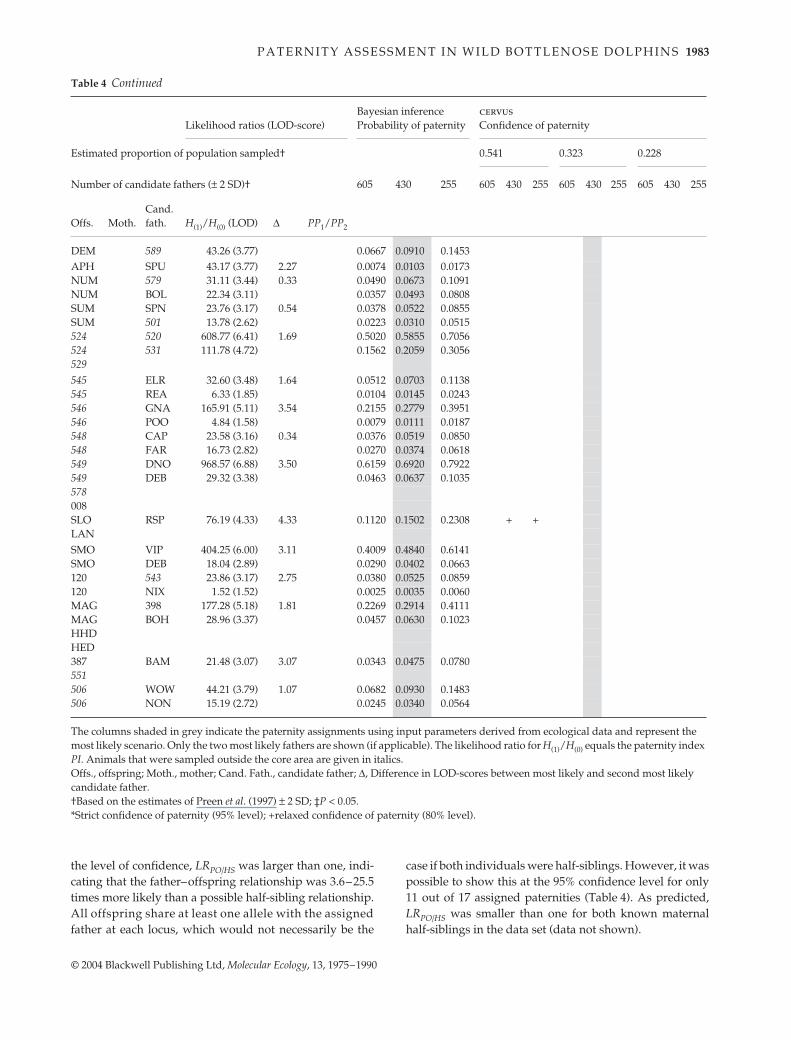
DEM 589 43.26 (3.77) 0.0667 0.0910 0.1453APH SPU 43.17 (3.77) 2.27 0.0074 0.0103 0.0173NUM 579 31.11 (3.44) 0.33 0.0490 0.0673 0.1091NUM BOL 22.34 (3.11) 0.0357 0.0493 0.0808SUM SPN 23.76 (3.17) 0.54 0.0378 0.0522 0.0855SUM 501 13.78 (2.62) 0.0223 0.0310 0.0515524 520 608.77 (6.41) 1.69 0.5020 0.5855 0.7056524 531 111.78 (4.72) 0.1562 0.2059 0.3056529545 ELR 32.60 (3.48) 1.64 0.0512 0.0703 0.1138545 REA 6.33 (1.85) 0.0104 0.0145 0.0243546 GNA 165.91 (5.11) 3.54 0.2155 0.2779 0.3951546 POO 4.84 (1.58) 0.0079 0.0111 0.0187548 CAP 23.58 (3.16) 0.34 0.0376 0.0519 0.0850548 FAR 16.73 (2.82) 0.0270 0.0374 0.0618549 DNO 968.57 (6.88) 3.50 0.6159 0.6920 0.7922549 DEB 29.32 (3.38) 0.0463 0.0637 0.1035578008SLO RSP 76.19 (4.33) 4.33 0.1120 0.1502 0.2308 + +LANSMO VIP 404.25 (6.00) 3.11 0.4009 0.4840 0.6141SMO DEB 18.04 (2.89) 0.0290 0.0402 0.0663120 543 23.86 (3.17) 2.75 0.0380 0.0525 0.0859120 NIX 1.52 (1.52) 0.0025 0.0035 0.0060MAG 398 177.28 (5.18) 1.81 0.2269 0.2914 0.4111MAG BOH 28.96 (3.37) 0.0457 0.0630 0.1023HHDHED387 BAM 21.48 (3.07) 3.07 0.0343 0.0475 0.0780551506 WOW 44.21 (3.79) 1.07 0.0682 0.0930 0.1483506 NON 15.19 (2.72) 0.0245 0.0340 0.0564
The columns shaded in grey indicate the paternity assignments using input parameters derived from ecological data and represent the most likely scenario. Only the two most likely fathers are shown (if applicable). The likelihood ratio for H(1)/H(0) equals the paternity index PI. Animals that were sampled outside the core area are given in italics.Offs., offspring; Moth., mother; Cand. Fath., candidate father; ∆, Difference in LOD-scores between most likely and second most likely candidate father.†Based on the estimates of Preen et al. (1997) ± 2 SD; ‡P < 0.05.*Strict confidence of paternity (95% level); +relaxed confidence of paternity (80% level).
Likelihood ratios (LOD-score)Bayesian inference Probability of paternity
cervus Confidence of paternity
Estimated proportion of population sampled† 0.541 0.323 0.228
Number of candidate fathers (± 2 SD)† 605 430 255 605 430 255 605 430 255 605 430 255
Offs. Moth.Cand. fath. H(1)/H(0) (LOD) ∆ PP1/PP2
the level of confidence, LRPO/HS was larger than one, indi-cating that the father–offspring relationship was 3.6–25.5times more likely than a possible half-sibling relationship.All offspring share at least one allele with the assignedfather at each locus, which would not necessarily be the
case if both individuals were half-siblings. However, it waspossible to show this at the 95% confidence level for only11 out of 17 assigned paternities (Table 4). As predicted,LRPO/HS was smaller than one for both known maternalhalf-siblings in the data set (data not shown).
Table 4 Continued

1984 M . K R Ü T Z E N E T A L .
© 2004 Blackwell Publishing Ltd, Molecular Ecology, 13, 1975–1990
When our assumptions were explored by changing thesimulation parameter in the cervus simulation, it becameevident that both estimated input parameters (proportionof population sampled, number of candidate fathers inthe population) have a large influence on the statisticalsignificance. Not surprisingly, there seems to be a positivecorrelation between the number of assigned paternities andthe proportion of population sampled, and a negative corre-lation between assignment success and number of potentialfathers (Table 4). In contrast, Bayesian inference does notseem to be susceptible to violation of assumptions: the sig-nificance of only one paternity assignment changed fromthe strict to the relaxed level when the number of potentialfathers was increased. Overall, however, Bayesian infer-ence led to a much lower number of successfully assignedpaternities given our data set. This is regarded as overlyconservative as it based on the assumption that every male
in the Eastern Gulf potentially copulated with the mother,which is an unlikely scenario even in promiscuous dolphins.
At the 80% confidence level, two males from two differ-ent strategy I alliances (BJA — four paternities, REA — twopaternities) accounted for six out of eight paternitiesachieved by all males in the data set engaging in thisalliance strategy (Table 5). The other two paternities wereassigned to two dolphins from one potential alliance, fourdifferent superalliance members, and four males withoutassigned alliance partners. Interestingly, it appears thatBJA fathered JOY in 1978 as well as JOY’s daughter LAU in1993 (Table 6). Therefore, we calculated the probabilitythat LAU is the product of an incestuous mating using thelikelihood ratio formula developed by Edwards (1988).The likelihood ratio for the two hypotheses incestuous vs.nonincestuous mating is 109.6, a highly significant result(P < 0.01), strongly suggesting that BJA is not only LAU’s
Table 5 Number of assigned paternities for males with different alliance strategies, using relaxed and strict confidence levels in cervus
Strategy I alliances SuperalliancePotential strategy I alliances
Males without assigned alliance partners
80% 95% 80% 95% 80% 95% 80% 95%
2 REA 1 REA 1 PIK 1 PIK 1 TWI 1 TWI 1 TOL 1 TOL4 BJA 3 BJA 1 VAX 1 VAX 1 DEB 1 DEB 1 5901 BAM 1 BAM 1 GRI 1 GRI 1 BOL1 CRC 1 LAT
Table 6 Estimated ages (in years) at conception for fathers assigned at a 80% confidence level
Assigned father at relaxed confidence level Calf Mother
Code YOB RangeMost likely age at conception Range Code YOB Range Code YOB Range
Age at conception
BJA 1966 1960–71 12 7–18 JOY 1979 HOL 1960 1958–62 28BJA 1966 1960–71 23 16–27 FUF 1987 1986–87 unknownBJA 1966 1960–71 24 20–31 MOU 1991 MIN 1964 1959–69 26BJA 1966 1960–71 28 23–34 LAU 1994 JOY 1979 14BAM 1971 1960–71 11 11–22 SKI 1983 1980–84 MIN 1964 1959–69 18REA 1972 1966–72 20 16–20 MUT 1993 FID 1981 11REA 1972 1966–72 22 18–22 HKI 1995 NIC 1975 19BOL 1984 1979–89 10 5–15 BIN 1995 BYT 1973 22CRC 1971 18 URC 1990 UHF 1972 1970–74 17PIK 1974 1971–77 16 13–19 GHO 1991 GOB 1979 11DEB 1971 20 PIC 1992 PUC 1976 16TOL 1986 1984–88 6 4–8 HBT 1993 HOL 1960 1958–62 32TWI 1980 1977–80 13 13–16 CRV 1994 NOO 1974 19GRI 1982 11 POL 1994 BAD 1981 1980–82 12VAX 1977 17 BUR 1995 URP 1976 1973–79 18LAT considered adult at time of sampling FLI 1984 1983–84 BLI 1970 1965–70 12590 considered adult at time of sampling 581 580 unknown
YOB = year of birth.
P A T E R N I T Y A S S E S S M E N T I N W I L D B O T T L E N O S E D O L P H I N S 1985
© 2004 Blackwell Publishing Ltd, Molecular Ecology, 13, 1975–1990
father, but also her grandfather. The paternities achievedby BJA were separated by 16 years (Table 6).
Skewed distribution of paternities among strategy I first-order alliance members and alliances
Most of the paternities were obtained by a minority ofindividuals and alliances: at the 80% confidence level, twoout of 15 first-order alliance members achieved 75.0% (meannumber of paternities per male = 0.53, variance = 1.27), andtwo out of six alliances achieved 62.5% of all paternities(mean = 1.33, variance = 3.87). When all eight paternitieswere randomly distributed among all sampled strategy Ifirst-order alliance members and strategy I first-order alliances1000 times, the observed variance was exceeded onlyseven and five times (P = 0.007 and P = 0.005, respectively).
Three out of 17 paternities were achieved by maleswithout obvious stable alliance partners at the time ofconception: TOL, BOL and the unknown individual fromoutside the core area (590). TOL and BOL achieved theirpaternities when they were 6 years (range 4–8 years) and10 years of age (range 5–15 years), respectively (Table 6).TOL’s offspring was conceived in 1992, but there areno sighting records for TOL before 1998. BOL achieved apaternity in 1994, 1 year after he was first seen. BOL wasseen in 1993 (four sightings with 20 different males) and1994 (three sightings with 17 different males). While strongassociations are evident between some immature males,adult alliance behaviour, including the regular formationof consortships with parous females, is not in evidence formales under the age of 14 (Connor et al. 2000a), renderingit unlikely that TOL and BOL had a stable alliance partnerat the time they achieved a paternity. Hence, albeit withcaution because of the limited behavioural data and thefact that BOL’s paternity was assigned at an 80% con-fidence level, the paternities of BOL and TOL are regardedas having been achieved when they were juvenile animalswithout alliance partners. This is further supported bythe finding that LRHS/PO for each paternity was 7.27 and17.64, both significant results (Table 4). It is not knownwhether individual 590 had an alliance partner when hesuccessfully reproduced because he was the only malefrom outside the core study area with no behavioural data.Hence, this individual was omitted entirely from all ana-lyses of reproductive success for different alliance types.
For two assigned paternities survey or focal data wereavailable indicating that the respective mothers were seentogether with the assigned fathers 1 year prior to parturi-tion, around the time of conception. BJA was seen withMIN during three surveys in September and October 1990,although no data on possible herding events were available.Focal data showed that NIC was actively herded by REA,HII and BOT for a month in August 1994, 1 year prior toHKI’s birth.
Discussion
The number of assigned paternities is small, but there arefive findings that require further discussion. (i) Adult malesknown to be in alliances enjoy the lion’s share of reproduc-tion in Shark Bay. (ii) Reproductive success appears to besignificantly skewed within at least some strategy I first-order alliances, using paternity data at the 80% confidencelevel. (iii) A small number of paternities were obtained byjuvenile males without any alliance partner at the time.(iv) One mating appears to be incestuous. (v) At the 80%confidence level, we could assign paternities to 16 out of34 (47.1%) of the calves with maternal data, and weresuccessful in only one out of 30 cases (3.3%) when therewere no maternal genotypes available.
(i) Alliance formation among male dolphins in SharkBay is clearly a strategy to obtain access to females (Connoret al. 1992a,b, 1999, 2001). Alliance formation in males hasbeen hypothesized to increase male fitness either thoughmate guarding (Connor et al. 1992a,b; Kempenaers et al.1995; Watts 1998) or female choice of males that synchronizetheir behaviour (Connor et al. 1992b; Trainer & McDonald1995). Many mating systems represent variations of mate-guarding adapted to the spatial and temporal distributionof oestrous females (Clutton-Brock 1989). There is a positivecorrelation between alliance formation and reproductivesuccess in horse stallions (Equus caballus), where low rank-ing males form alliances with unrelated males and fatherabout 25% of all offspring, which is significantly more thanother nonallied low-ranking males adopting a ‘sneaking’strategy (Feh 1999). Our data show that the vast majority ofoffspring in the core study area are sired by males engagingin some kind of alliance behaviour in that same area.Therefore, it appears that our identification of an alliancemember also predisposes us towards assigning him apaternity of a calf in the same area. There are two possiblereasons for this finding: first, allied males actually achievemore paternities; or second, this pattern is an artefact of thelogistical constraints on our study. This question will beresolved by further studies outside the core area.
(ii) Various models of group reproduction make pre-dictions about the presence or absence of reproductiveskew between group members (Vehrencamp 1983a,b; Cant1997; Reeve 1998; Reeve et al. 1998; Kokko & Johnstone 1999;Crespi & Ragsdale 2000; Johnstone 2000). Which of thesemodels are consistent with our data? There appears to be askew in reproductive success at least within stable strategyI alliances: two males from two different alliances achievedall five paternities obtained by this alliance type, suggest-ing dominance in obtaining fertilizations by relativelyfew alliance members. Thus, our results are consistent withmodels that predict some skew: concession, manipulationand, to a lesser extent, the restraint model. However, the lackof precise predictions for the level of skew, and our incom-

1986 M . K R Ü T Z E N E T A L .
© 2004 Blackwell Publishing Ltd, Molecular Ecology, 13, 1975–1990
plete data set, make firm tests of these models impossible,and further work will be required to test these models.
(iii) The fact that two juvenile males without alliancepartners at the time obtained one paternity each (which wereassigned at the 80% and 95% confidence levels, respectively)gives reason to assume that there might be an alternativemating strategy which does not involve allying with othermales. It is not unusual to find males from the samepopulation engaging in different mating strategies (Caro &Bateson 1986; Gross 1996). The maintenance of more thanone strategy within a population is typically explained bydifferent tactics having asymmetrical pay-offs and depend-ing on environmental or endogenous cues, which indicatetheir probability of success (Gross 1996). Different malemating strategies within a population have been reportedfrom only one other bottlenose dolphin study site: SarasotaBay (Wells et al. 1987). However, it was shown recentlythat in the Sarasota Bay population, pairing is the normand that solitary males are not single roving males, as pre-viously described (Wells et al. 1987), but are actually youngmales in a transitional stage (Owen et al. 2002).
Until recently it was thought that male dolphins attaintheir social maturity gradually over several years, with aburst in testosterone levels in males about 8 years of age(Wells et al. 1987), leading to a distinction between physicalmaturity (ability to produce sperm) and social maturity(ability to successfully compete for females). Our results ofjuvenile males achieving paternity provide support for thestatement that it is not useful to discriminate betweenphysical and social maturity in male bottlenose dolphins(Connor et al. 2000a). Although immature male dolphinsare not observed in alliances consorting adult females in themanner of adult males (Connor et al. 1992b), intromissionand sexual play have been frequently observed in bothShark Bay and Sarasota (Connor et al. 2000b), which mayreflect an opportunistic mating tactic as much as ‘practice’.Similar mechanisms have been observed in Soay rams (Ovisaries), where a significant number of juvenile sires wereassigned a paternity (Coltman et al. 1999).
(iv) Incest avoidance may counter other influences onreproductive skew (Haydock et al. 2001) and is of particu-larly importance in species with limited dispersal of eithersex, particularly in small populations (Smith et al. 1997;Griffin et al. 2003). Both genetic and behavioural data sug-gest that both sexes in Shark Bay dolphins are philopatric(Connor et al. 2000b; Krützen et al. 2004), which raises thepossibility of incest and/or incest avoidance mechanisms.However, our data suggest that incest avoidance doesnot play a large role in the mating behaviour of Shark Baydolphins. This finding is also supported by observationsof sexually mature males herding their own mother (R.Connor, unpublished data). Although incestuous matingsapparently do occur, their apparent low frequency andthe fission–fusion structure and the large population size
should minimize the inbreeding coefficient. This suggestionseems to be supported by the nonsignificant population FIS.
(v) Where are all the other fathers? Given the largenumber of potential males in the data set, the overallnumber of paternities assigned was low (47.1% for mother–offspring pairs, 3.3% for juveniles without maternaldata). Determining parentage in marine mammals is quitedemanding because of the lack of geographical boundaries,and the relative inaccessibility of most marine mammalsmakes their social structure difficult to elucidate. In general,success rates of paternity assignments in wild populationsare usually below expectations. For instance, in polygynouspinnipeds, paternity was assigned to 46% and 29% of greyseal (Halichoerus grypus) pups on two different islands(Worthington Wilmer et al. 1999). The majority of the pupsborn at a particular colony were not sired by males foundin that particular colony. Similarly, only 28% of Antarcticfur seals (Arctocephalus gazelle) pups could be assigned afather, although 90% of all candidate fathers were thoughtto have been sampled (Gemmell et al. 2001).
One obvious problem does not appear to afflict our study:inadequate numbers of genetic markers. The number ofmicrosatellite loci used in this study appears to be highenough, because by using only eight hypervariable loci,there were no cases in which we had two candidate fathersfor a calf with maternal data. However, to increase statisticalsignificance, it would be desirable to use more microsatelliteloci. In human paternity testing, it is not uncommon toobtain an average paternity index of 3.3 per locus (Okamotoet al. 2003). For instance, a PI of 107, which should bepossible to obtain using 12–14 loci with fairly equal allelefrequencies, would be significant at the 95% level evenif one had to assume that there were 500 000 candidatefathers! Given that microsatellite loci are already availablefor many taxa, or can be readily cloned (Zane et al. 2002), werecommend that future studies should use large numbersof loci, and use Bayesian inference as this approach willreduce the number of assumptions that need to be made,because large PIs swamp any prior assumptions. Even thepossibility of mutations and/or erroneous genotypes as aresult of mis-scoring can be implemented in such a frame-work, as there are likelihood ratio formulae available thattake into account mutation rates in the germ line (C. Brenner,personal communication; http://www.dna-view.com).
Another explanation for the low success rate in paternityassignments is the combination of the population structureand the timing of our sampling. In a previous study, weshowed that there is isolation by distance (Krützen et al.2004). Within the core study area, however, microsatellitedata suggested that gene flow was high enough to preventpopulation subdivision by drift. Thus, it is likely that therewere unsampled candidate fathers in the eastern part ofthe bay. Additionally, four major first-order alliances fromthe core study area disappeared between 1989 and 1992,
P A T E R N I T Y A S S E S S M E N T I N W I L D B O T T L E N O S E D O L P H I N S 1987
© 2004 Blackwell Publishing Ltd, Molecular Ecology, 13, 1975–1990
about 3–5 years before biopsy sampling was initiated inShark Bay (R. Connor and J. Mann, unpublished data).These males probably herded many of the females thatwere sampled during the course of this study so that theactual fathers of some calves in our data set may not havebeen available for sampling.
The relationship between paternity, alliance member-ship and genetic relatedness is crucial in seeking adaptiveexplanations for the formation of male alliances in dolphins.The data from this paternity study and a previous related-ness study of Shark Bay dolphins (Krützen et al. 2003)show that it will be possible to evaluate some of the predic-tions of current models of group formation given a largerdata set. However, as yet, there are insufficient data toevaluate all of the predictions. Our study suggests thatnot only the reproductive success of allied males, but alsothat of nonallied juveniles, need to be incorporated into anadaptive framework that seeks to explain alliance forma-tion in male bottlenose dolphins.
Acknowledgements
Special thanks to Hugh Finn, Michael Heithaus, Doro Heimeier,Per Berggren, Kerstin Bilgmann, Nick Gales, Helen McLachlan-Berggren, Leah Page, Colleen Sims and Rachel Smolker whohelped by collecting samples and information in the field. CharlesBrenner gave helpful information for the use of the Bayesianapproach to assign paternities and the likelihood approach todiscriminate between different genealogical relationships. Bill Amosgave valuable advice for the use of newpatxl. Anna Lindholm’scomments improved earlier drafts of this manuscript. TheMonkey Mia Dolphin Resort and Monkey Mia Wildlife Sailingsupported us during our field studies. The field work was carriedout under the permit # SF002958 issued by Conservation and LandManagement. Ethics approval was given from the University ofNew South Wales (# 99/52). The study was partly funded by theAustralian Research Council (ARC), the W. V. Scott Foundation(Australia), the Linnean Society of New South Wales (Australia),and the Dolphins of Monkey Mia Research Foundation (Australiaand USA).
References
Alberts SC, Watts HE, Altmann J (2003) Queuing and queue-jumping: long-term patterns of reproductive skew in malesavannah baboons, Papio cynocephalus. Animal Behaviour, 65,821–840.
Amos B, Barrett J, Dover GA (1991) Breeding system and socialstructure in the Faroese pilot whale as revealed by DNA finger-printing. In: Genetic Ecology of Whales and Dolphins (eds Hoelzel AR,Donovan GP), pp. 255–268. International Whaling Commission,Cambridge.
Amos B, Schlötterer C, Tautz D (1993) Social structure of pilotwhales revealed by analytical DNA profiling. Science, 260,670–672.
Bercovitch FB (1988) Coalitions, cooperation and reproductivetactics among adult male baboons. Animal Behaviour, 36, 1198–1209.
Bradbury JW, Vehrencamp SL (1977) Social organization andforaging in emballonurid bats III: mating systems. BehaviouralEcology and Sociobiology, 2, 1–17.
Brenner CH (1993) A note on paternity computation in caseslacking a mother. Transfusion, 33, 51–54.
Brenner CH (1997) Symbolic kinship program. Genetics, 145, 535–542.
Brenner CH, Weir BS (2003) Issues and strategies in the DNAidentification of World Trade Center victims. Theoretical Popula-tion Biology, 63, 173–178.
Cant MA (1997) A model for the evolution of reproductive skewwithout reproductive suppression. Animal Behaviour, 55, 163–169.
Caro TM (1994) Cheetahs of the Serengeti Plains. University ofChicago Press, Chicago.
Caro TM, Bateson P (1986) Organization and ontogeny of alter-native tactics. Animal Behaviour, 34, 1483–1499.
Clapham PJ, Palsbøll PJ (1997) Molecular analysis of paternityshows promiscuous mating in female humpback whales(Megaptera novaeangliae, Borowski). Proceedings of the RoyalSociety of London — Series B: Biological Sciences, 264, 95–98.
Clutton-Brock TH (1989) Mammalian mating systems. Proceedingsof the Royal Society of London — Series B: Biological Sciences, 236,339–372.
Clutton-Brock TH, Harvey PH (1978) Mammals, resources andreproductive strategies. Nature, 273, 191–195.
Clutton-Brock TH, Parker GA (1994) Sexual coercion in animalsocieties. Animal Behaviour, 5, 1345–1365.
Coltman DW, Bancroft DR, Robertson A et al. (1999) Malereproductive success in a promiscuous mammal: behaviouralestimates compared with genetic paternity. Molecular Ecology, 8,1199–1209.
Connor RC, Smolker RA, Richards AF (1992a) Two levels of alli-ance formation among male bottlenose dolphins (Tursiops sp.).Proceedings of the National Academy of Sciences, USA, 89, 987–990.
Connor RC, Smolker RA, Richards AF (1992b) Dolphin alliancesand coalitions. In: Coalitions and Alliances in Humans and OtherAnimals (eds Harcourt AH, de Waal FBM), pp. 415–443. OxfordUniversity Press, Oxford.
Connor RC, Richards AF, Smolker RA, Mann J (1996) Patternsof female attractiveness in Indian Ocean bottlenose dolphins.Behaviour, 133, 37–69.
Connor RC, Heithaus MR, Barre LM (1999) Superalliance ofbottlenose dolphins. Nature, 397, 571–572.
Connor RC, Read AJ, Wrangham R (2000a) Male reproductivestrategies and social bonds. In: Cetacean Societies (eds Mann J,Connor RC, Tyack PL, Whitehead H), pp. 247–269. ChicagoUniversity Press, Chicago, London.
Connor RC, Wells RS, Mann J, Read AJ (2000b) The bottlenosedolphin — social relationships in a fission–fusion society. In:Cetacean Societies (eds Mann J, Connor RC, Tyack PL, WhiteheadH), pp. 91–126. Chicago University Press, Chicago, London.
Connor RC, Heithaus MR, Barre LM (2001) Complex socialstructure, alliance stability and mating success in a bottlenosedolphin ‘super-alliance’. Proceedings of the Royal Society of London— Series B: Biology Sciences, 268, 263–267.
Cordero C, Eberhard WG (2003) Female choice of sexuallyantagonistic male adaptations: a critical review of some currentresearch. Journal of Evolutionary Biology, 16, 1–6.
Cox CR, Le Boeuf BJ (1977) Female incitation of male competition:a mechanism of mate selection. American Naturalist, 111, 317–335.

1988 M . K R Ü T Z E N E T A L .
© 2004 Blackwell Publishing Ltd, Molecular Ecology, 13, 1975–1990
Crespi BJ, Ragsdale JE (2000) A skew model for the evolutionof sociality via manipulation: why it is better to be fearedthan loved. Proceedings of the Royal Society of London — Series B:Biological Sciences, 267, 821–828.
Davies NB (1985) Cooperation and conflict among dunnocks,Prunella modularis in a variable mating system. Animal Behaviour,33, 628–648.
Davis LG, Dibner MD, Battey JF (1986) Basic Methods in MolecularBiology, 1st edn. Elsevier Science Publishing, New York.
Dunbar RIM (1981) Intraspecific variations in mating strategy. In:Perspectives in Ethology (eds Klopfer P, Bateson P), pp. 385–431.Plenum Press, New York.
Edwards JH (1988) The use of multiple hypervariable probes forthe probable detection or exclusion of incest. Annual Review ofHuman Genetics, 52, 351–353.
Evett IW, Weir BS (1998) Interpreting DNA Evidence. SinauerAssociates, Sunderland, MA.
Feh C (1999) Alliances and reproductive success in Camarguestallions. Animal Behaviour, 57, 705–713.
Garnier JN, Bruford MW, Goossens B (2001) Mating system andreproductive skew in the black rhinoceros. Molecular Ecology, 10,2031–2041.
Gemmell NJ, Burg TM, Boyd IL, Amos W (2001) Low reproductivesuccess in territorial male Antarctic fur seals (Arctocephalusgazella) suggests the existence of alternative mating strategies.Molecular Ecology, 10, 451–460.
Gilson A, Syvanen M, Levine K, Banks J (1998) Deer genderdetermination by polymerase chain reaction: validation studyand application to tissues, bloodstains, and hair forensicsamples from California. California Fish and Game, 84, 159–169.
Goudet J (1995) Fstat Version 1.2.: A computer program to calcu-late F-statistics. Journal of Heredity, 86, 485–486.
Griffin AS, Pemberton JM, Brotherton PNM et al. (2003) A geneticanalysis of breeding success in the cooperative meerkat(Suricata suricatta). Behavioral Ecology, 14, 472–480.
Gross MR (1996) Alternative reproductive strategies and tactics:diversity within sexes. Trends in Ecology and Evolution, 11, 92–98.
Hamilton WD (1964a) The genetical evolution of social behaviour,I. Journal of Theoretical Biology, 7, 1–16.
Hamilton WD (1964b) The genetical evolution of social behaviour,II. Journal of Theoretical Biology, 7, 17–52.
Harcourt AH (1992) Coalitions and alliances: are primatesmore complex than non-primates?. In: Coalitions and Alliancesin Humans and Other Animals (eds Harcourt AH, de Waal FBM),pp. 445–471. Oxford University Press, Oxford.
Harcourt AH, Harvey PH, Larson SG, Short RV (1981) Testisweight, body weight and breeding system in primates. Nature,293, 55–57.
Haydock J, Koenig WD, Stanback MT (2001) Shared parentageand incest avoidance in the cooperatively breeding acornwoodpecker. Molecular Ecology, 10, 1515–1525.
Hearne CM, Ghosh S, Todd JA (1992) Microsatellites for linkageanalysis of genetic traits. Trends in Genetics, 8, 288–294.
Hoelzel AR, Dahlheim M, Stern SJ (1998) Low genetic variationamong killer whales (Orcinus orca) in the eastern north pacificand genetic differentiation between foraging specialists. Journalof Heredity, 89, 121–128.
van Hooff JARAM, van Schaik CP (1994) Male bonds: affiliativerelationships among nonhuman primate males. Behaviour, 130,309–337.
Johnstone RA (2000) Models of reproductive skew: a review andsynthesis. Ethology, 106, 5–26.
Kempenaers B, Verheyen GR, Dhondt AA (1995) Mate guardingand copulation behaviour in monogamous and polygynousblue tits – do males follow a best-of-a-bad-job strategy? BehavioralEcology and Sociobiology, 36, 33–42.
Kokko H, Johnstone RA (1999) Social queuing in animal societies:a dynamic model of reproductive skew. Proceedings of the RoyalSociety of London — Series B: Biological Sciences, 266, 571–578.
Krützen M, Valsecchi E, Connor RC, Sherwin WB (2001) Char-acterisation of microsatellites in Tursiops aduncus. MolecularEcology Notes, 1, 170–172.
Krützen M, Barre LM, Möller LM et al. (2002) A biopsy system forsmall cetaceans: darting success and wound healing in Tursiopsspp. Marine Mammal Science, 18, 863–878.
Krützen M, Sherwin WB, Connor RC et al. (2003) Contrastingrelatedness patterns in bottlenose dolphins (Tursiops sp.) withdifferent alliance strategies. Proceedings of the Royal Society London— Series B: Biological Science, 270, 497–502.
Krützen M, Sherwin WB, Berggren P, Gales NJ (2004) Populationstructure in an inshore cetacean revealed by microsatelliteand mtDNA analysis: Bottlenose dolphins (Tursiops sp.) inShark Bay, Western Australia. Marine Mammal Science, 20, 28–47.
Lander E, Kruglyak L (1995) Genetic dissection of complex traits:guidelines for interpreting and reporting linkage results. NatureGenetics, 11, 241–247.
Mann J, Connor RC, Barre LM, Heithaus MR (2000) Female repro-ductive success in bottlenose dolphins (Tursiops sp.): life history,habitat, provisioning, and group-size effects. Behavioral Ecology,11, 210–219.
Marshall TC, Slate J, Kruuk LEB, Pemberton JM (1998) Statisticalconfidence for likelihood-based paternity inference in naturalpopulations. Molecular Ecology, 7, 639–655.
Maynard Smith J (1982) Evolution and the Theory of Games.Cambridge University Press, Cambridge.
McGraw KJ, Stoehr AM, Nolan PM, Hill GE (2001) Plumageredness predicts breeding onset and reproductive success in thehouse finch: a validation of Darwin’s theory. Journal of AvianBiology, 32, 90–94.
Meagher TR (1986) Analysis of paternity within a natural popula-tion of Chamaelirium luteum. I. Identification of most-likely maleparents. American Naturalist, 128, 199–215.
Möller LM, Beheregaray LB, Harcourt R, Krützen M (2001)Alliance membership and kinship in wild male bottlenosedolphins (Tursiops aduncus) of southeastern Australia. Proceed-ings of the Royal Society of London — Series B: Biological Sciences,268, 1941–1947.
Nielsen R, Mattila DK, Clapham PJ, Palsbøll PJ (2001) Statisticalapproaches to paternity analysis in natural populations andapplications to the north Atlantic humpback whale. Genetics,157, 1673–1682.
Okamoto O, Yamamoto Y, Inagaki S et al. (2003) Analysis of shorttandem repeat (STR) polymorphisms by the PowerPlex 16system and capillary electrophoresis: application to forensicpractice. Acta Medica Okayama, 57, 59–71.
Owen ECG, Wells RS, Hofmann S (2002) Ranging and associationpattern of paired and unpaired adult male Atlantic bottlenosedolphins, Tursiops truncatus, in Sarasota, Florida, provide noevidence for alternative male strategies. Canadian Journal ofZoology, 80, 2072–2089.
Packer C, Gilbert DA, Pusey AE, O’Brien SJ (1991) A moleculargenetic analysis of kinship and cooperation in African lions.Nature, 351, 562–565.

P A T E R N I T Y A S S E S S M E N T I N W I L D B O T T L E N O S E D O L P H I N S 1989
© 2004 Blackwell Publishing Ltd, Molecular Ecology, 13, 1975–1990
Paetkau D, Calvert W, Stirling I, Strobeck C (1995) Microsatelliteanalysis of population structure in Canadian polar bears.Molecular Ecology, 4, 347–354.
Parsons KM, Durban JW, Claridge DE et al. (2003) Kinship asa basis for alliance formation between male bottlenose dol-phins, Tursiops truncatus, in the Bahamas. Animal Behaviour, 66,185–194.
Pena SDJ, Chakraborty R (1994) Paternity testing in the DNA era.Trends in Genetics, 10, 204–209.
Preen AR, Marsh H, Lawler IR, Prince RIT, Shepherd R (1997)Distribution and abundance of dugongs, turtles, dolphins andother megafauna in Shark Bay, Ningaloo Reef and ExmouthGulf, Western Australia. Wildlife Research, 24, 185–208.
Reeve HK (1998) Game theory, reproductive skew, and nepotism.In: Game Theory and Animal Behaviour (eds Dugatkin LA, ReeveHK), pp. 118–145. Oxford University Press, Oxford.
Reeve HK, Emlen ST, Keller L (1998) Reproductive sharing inanimal societies: reproductive incentives or incomplete controlby dominant breeders. Behavioral Ecology, 9, 267–278.
Rubenstein DI (1980) On the evolution of alternative matingstrategies. In: Limits to Action (ed. Staddon JER), pp. 65–100.Academic Press, London.
Say L, Naulty F, Hayden TJ (2003) Genetic and behaviouralestimates of reproductive skew in male fallow deer. MolecularEcology, 12, 2793–2800.
Smith D, Meier T, Geffen E et al. (1997) Is incest common in greywolf packs? Behavioral Ecology, 8, 384–391.
Smolker RA, Richards AF, Connor RC, Pepper JW (1992) Sex-differences in patterns of association among Indian Oceanbottle-nosed dolphins. Behaviour, 123, 38–69.
Smuts BB, Smuts RW (1993) Male aggression and sexual coercionof females in nonhuman primates and other mammals: evidenceand theoretical implications. Advances in the Study of Behaviour,22, 1–63.
Summers K, Amos W (1997) Behavioural, ecological and moleculargenetic analyses of reproductive strategies in the Amazoniandart-poison frog, Dendrobates ventrimaculatus. Behavioral Ecology,8, 260–267.
Trainer JM, McDonald DB (1995) Singing performance, frequencymatching and courtship success of long-tailed manikins(Chiroxiphia linearis). Behavioural Ecology and Sociobiology, 37,249–254.
Valsecchi E, Amos W (1996) Microsatellite markers for the studyof cetacean populations. Molecular Ecology, 5, 151–156.
Vehrencamp SL (1983a) A model for the evolution of despoticversus egalitarian societies. Animal Behaviour, 31, 667–682.
Vehrencamp SL (1983b) Optimal degree of skew in cooperativesocieties. American Zoologist, 23, 327–335.
Watts DP (1998) Coalitionary mate guarding by male chimpanzeesat Ngogo, Kibale national park, Uganda. Behavioural Ecology andSociobiology, 44, 43–55.
Weir BS, Cockerham CC (1984) Estimating F-statistics for theanalysis of population structure. Evolution, 38, 1358–1370.
Wells RS (1991) The role of long-term study in understanding thesocial structure of a bottlenose dolphin community. In: DolphinSocieties: Discoveries and Puzzles (eds Pryor K, Norris KS),pp. 198–225. University of California Press, Berkeley.
Wells RS, Scott MD, Irvine AB (1987) The social structure offree-ranging bottlenose dolphins. In: Current Mammalogy (ed.Genoways H), pp. 247–305. Plenum Press, New York.
Wilson B, Thompson P, Hammond P (1993) The ecology ofbottle-nosed dolphins, Tursiops truncatus, in the Moray Firth.In: European Research on Cetaceans 6 (ed. Evans PGH), pp. 114–115. Cambridge, European Cetacean Society.
Wilson B, Thompson P, Hammond P (1993) An examination ofthe social structure of a resident group of bottlenose dolphins(Tursiops truncatus) in the Moray Firth, N. E. Scotland. In: Euro-pean Research on Cetaceans 7 (ed. Evans PGH), pp. 56–57. Cam-bridge, European Cetacean Society.
Worthington Wilmer J, Allen PJ, Pomeroy PP, Twiss SD, Amos W(1999) Where have all the fathers gone? An extensive micro-satellite analysis of paternity in the grey seal (Halichoerusgrypus). Molecular Ecology, 8, 1417–1429.
Wrangham R (1980) Female choice of least costly males: a possiblefactor in the evolution of leks. Zeitschrift für Tierpsychologie, 54,357–336.
Zane L, Bargelloni L, Patarnello T (2002) Strategies for micro-satellite isolation: a review. Molecular Ecology, 11, 1–16.
This work is the result of a collaborative effort of variousresearchers from different disciplines who are involved in theDolphins of Shark Bay Research Project. Michael Krützen is apostdoctoral research associate at UNSW and is interested incetacean social structure, molecular ecology and populationgenetics. This paper formed an integral part of his PhD thesisabout paternity and relatedness among male bottlenose dolphinsin Shark Bay, Western Australia. Lynne Barré is a marine mammalresearcher with NOAA and was involved in most aspects relatingto the field work of this study. Richard Connor is interested in theevolution of cooperation among male bottlenose dolphins. JanetMann’s research focuses on the behavioural ecology of femaledolphins and the development of calves. Bill Sherwin’s interestsare in molecular ecology, conservation genetics and demographicmodelling.
1990 M . K R Ü T Z E N E T A L .
© 2004 Blackwell Publishing Ltd, Molecular Ecology, 13, 1975–1990
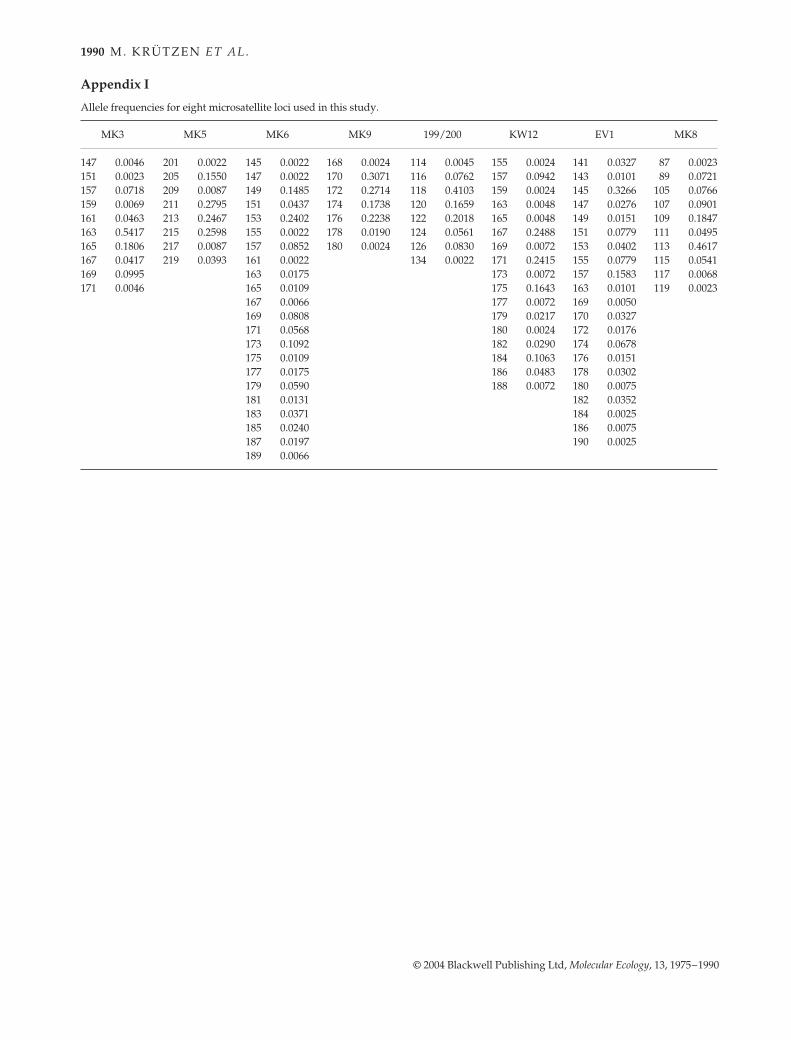
Appendix I
Allele frequencies for eight microsatellite loci used in this study.
MK3 MK5 MK6 MK9 199/200 KW12 EV1 MK8
147 0.0046 201 0.0022 145 0.0022 168 0.0024 114 0.0045 155 0.0024 141 0.0327 87 0.0023151 0.0023 205 0.1550 147 0.0022 170 0.3071 116 0.0762 157 0.0942 143 0.0101 89 0.0721157 0.0718 209 0.0087 149 0.1485 172 0.2714 118 0.4103 159 0.0024 145 0.3266 105 0.0766159 0.0069 211 0.2795 151 0.0437 174 0.1738 120 0.1659 163 0.0048 147 0.0276 107 0.0901161 0.0463 213 0.2467 153 0.2402 176 0.2238 122 0.2018 165 0.0048 149 0.0151 109 0.1847163 0.5417 215 0.2598 155 0.0022 178 0.0190 124 0.0561 167 0.2488 151 0.0779 111 0.0495165 0.1806 217 0.0087 157 0.0852 180 0.0024 126 0.0830 169 0.0072 153 0.0402 113 0.4617167 0.0417 219 0.0393 161 0.0022 134 0.0022 171 0.2415 155 0.0779 115 0.0541169 0.0995 163 0.0175 173 0.0072 157 0.1583 117 0.0068171 0.0046 165 0.0109 175 0.1643 163 0.0101 119 0.0023
167 0.0066 177 0.0072 169 0.0050169 0.0808 179 0.0217 170 0.0327171 0.0568 180 0.0024 172 0.0176173 0.1092 182 0.0290 174 0.0678175 0.0109 184 0.1063 176 0.0151177 0.0175 186 0.0483 178 0.0302179 0.0590 188 0.0072 180 0.0075181 0.0131 182 0.0352183 0.0371 184 0.0025185 0.0240 186 0.0075187 0.0197 190 0.0025189 0.0066
Copyright © 2022 FDOKUMEN