Habitat-driven population structure of bottlenose dolphins, Tursiops truncatus , in the North-East...
18
Habitat-driven population structure of bottlenose dolphins, Tursiops truncatus, in the North-East Atlantic MARIE LOUIS,* †‡ AM ELIA VIRICEL, † TAMARA LUCAS, † H EL ENE PELTIER, § ERIC ALFONSI, ¶ ** SIMON BERROW, ††‡‡ ANDREW BROWNLOW, §§ PABLO COVELO, ¶¶ WILLY DABIN, § ROB DEAVILLE,*** RENAUD DE STEPHANIS, ††† FRANC ß OIS GALLY, ‡ PAULINE GAUFFIER, ‡‡‡ ROD PENROSE, §§§ MONICA A. SILVA, ¶¶¶ **** †††† CHRISTOPHE GUINET* and BENOIT SIMON-BOUHET † *Centre d’Etudes Biologiques de Chiz e, UPR 1934, 79360 Villiers-en-Bois, France, †Littoral, Environnement et Soci et es (LIENSs), UMR 7266, CNRS/Universit e de La Rochelle, 2 rue Olympe de Gouges, 17000 La Rochelle, France, ‡GECC (Groupe d’Etude des C etac es du Cotentin), Place des Justes, 50130 Cherbourg-Octeville, France, §Observatoire PELAGIS, UMS 3462 CNRS/Universit e de La Rochelle, Po ˆle Analytique, 5 all ee de l’Oc ean, 17000 La Rochelle, France, ¶Laboratoire d’Etude des Mammif eres Marins, Oc eanopolis, port de plaisance, BP 91039, 29210 Brest Cedex 1, France, **Laboratoire BioGeMME (Biologie et G en etique des Mammif eres Marins dans leur Environnement), Universit e Europ eenne de Bretagne & Universit e de Bretagne Occidentale, Universit e de Brest, UFR Sciences et Techniques, 6 Av. Victor Le Gorgeu, CS93837, 29238 Brest Cedex 3, France, ††Irish Whale and Dolphin Group, Merchants Quay, Kilrush, Co Clare, Ireland, ‡‡Marine and Freshwater Research Centre, Galway-Mayo Institute of Technology, Dublin Road, Galway, Ireland, §§Scottish Marine Animal Stranding Scheme, SAC Disease Surveillance Centre, Drummond Hill, Inverness IV2 4JZ, UK, ¶¶CEMMA (Coordinadora para o Estudo dos Mamiferos Mari~ nos), Aptdo. 15, 36380 Gondomar (Pontevedra), Spain, ***Institute of Zoology, Zoological Society of London, Regent’s Park, London NWI 4RY,UK, †††Estaci on Biol ogica de Do~ nana-CSIC, Americo Vespuccio S/N, Isla de la Cartuja, Sevilla 41092,Spain, ‡‡‡CIRCE (Conservation, Information and Research on Cetaceans), Cabeza de Manzaneda 3, Pelayo Algeciras, 11390 Cadix, Spain, §§§Marine Environmental Monitoring, Penwalk, Llechryd, Cardigan, West Wales SA43 2PS, UK, ¶¶¶Center of the Institute of Marine Research & Department of Oceanography and Fisheries, University of the Azores, 9901-862, Horta, Portugal, ****Laboratory of Robotics and Systems in Engineering and Science, 9901-862 Horta, Portugal, ††††Biology Department, Woods Hole Oceanographic Institution, Woods Hole, MA 02543, USA Abstract Despite no obvious barrier to gene flow, historical environmental processes and eco- logical specializations can lead to genetic differentiation in highly mobile animals. Ecotypes emerged in several large mammal species as a result of niche specializations and/or social organization. In the North-West Atlantic, two distinct bottlenose dolphin (Tursiops truncatus) ecotypes (i.e. ‘coastal’ and ‘pelagic’) have been identified. Here, we investigated the genetic population structure of North-East Atlantic (NEA) bottlenose dolphins on a large scale through the analysis of 381 biopsy-sampled or stranded ani- mals using 25 microsatellites and a 682-bp portion of the mitochondrial control region. We shed light on the likely origin of stranded animals using a carcass drift prediction model. We showed, for the first time, that coastal and pelagic bottlenose dolphins were highly differentiated in the NEA. Finer-scale population structure was found within the two groups. We suggest that distinct founding events followed by parallel adapta- tion may have occurred independently from a large Atlantic pelagic population in the two sides of the basin. Divergence could be maintained by philopatry possibly as a result of foraging specializations and social organization. As coastal environments are under increasing anthropogenic pressures, small and isolated populations might be at risk and require appropriate conservation policies to preserve their habitats. While genetics can be a powerful first step to delineate ecotypes in protected and difficult to Correspondence: Marie Louis, Fax: +33-05-46-50-76-63; E-mail: [email protected] © 2014 John Wiley & Sons Ltd Molecular Ecology (2014) 23, 857–874 doi: 10.1111/mec.12653
-
Upload
independent -
Category
Documents
-
view
0 -
download
0
Transcript of Habitat-driven population structure of bottlenose dolphins, Tursiops truncatus , in the North-East...

Habitat-driven population structure of bottlenosedolphins, Tursiops truncatus, in the North-East Atlantic
MARIE LOUIS , *†‡ AM �ELIA VIRICEL,† TAMARA LUCAS,† H �EL �ENE PELTIER,§ ERIC ALFONSI ,¶ **SIMON BERROW,††‡‡ ANDREW BROWNLOW,§§ PABLO COVELO,¶¶ WILLY DABIN,§ROB DEAVILLE,** * RENAUD DE STEPHANIS,††† FRANC� OIS GALLY,‡ PAULINE GAUFFIER,‡‡‡
ROD PENROSE,§§§ MONICA A. SILVA,¶¶¶ *** *†††† CHRISTOPHE GUINET* and
BENOIT SIMON-BOUHET†
*Centre d’Etudes Biologiques de Chiz�e, UPR 1934, 79360 Villiers-en-Bois, France, †Littoral, Environnement et Soci�et�es
(LIENSs), UMR 7266, CNRS/Universit�e de La Rochelle, 2 rue Olympe de Gouges, 17000 La Rochelle, France, ‡GECC (Groupe
d’Etude des C�etac�es du Cotentin), Place des Justes, 50130 Cherbourg-Octeville, France, §Observatoire PELAGIS, UMS 3462
CNRS/Universit�e de La Rochelle, Pole Analytique, 5 all�ee de l’Oc�ean, 17000 La Rochelle, France, ¶Laboratoire d’Etude desMammif�eres Marins, Oc�eanopolis, port de plaisance, BP 91039, 29210 Brest Cedex 1, France, **Laboratoire BioGeMME
(Biologie et G�en�etique des Mammif�eres Marins dans leur Environnement), Universit�e Europ�eenne de Bretagne & Universit�e de
Bretagne Occidentale, Universit�e de Brest, UFR Sciences et Techniques, 6 Av. Victor Le Gorgeu, CS93837, 29238 Brest Cedex 3,
France, ††Irish Whale and Dolphin Group, Merchants Quay, Kilrush, Co Clare, Ireland, ‡‡Marine and Freshwater Research
Centre, Galway-Mayo Institute of Technology, Dublin Road, Galway, Ireland, §§Scottish Marine Animal Stranding Scheme,
SAC Disease Surveillance Centre, Drummond Hill, Inverness IV2 4JZ, UK, ¶¶CEMMA (Coordinadora para o Estudo dos
Mamiferos Mari~nos), Aptdo. 15, 36380 Gondomar (Pontevedra), Spain, ***Institute of Zoology, Zoological Society of London,
Regent’s Park, London NWI 4RY,UK, †††Estaci�on Biol�ogica de Do~nana-CSIC, Americo Vespuccio S/N, Isla de la Cartuja,
Sevilla 41092,Spain, ‡‡‡CIRCE (Conservation, Information and Research on Cetaceans), Cabeza de Manzaneda 3, Pelayo
Algeciras, 11390 Cadix, Spain, §§§Marine Environmental Monitoring, Penwalk, Llechryd, Cardigan, West Wales SA43 2PS,
UK, ¶¶¶Center of the Institute of Marine Research & Department of Oceanography and Fisheries, University of the Azores,
9901-862, Horta, Portugal, ****Laboratory of Robotics and Systems in Engineering and Science, 9901-862 Horta, Portugal,
††††Biology Department, Woods Hole Oceanographic Institution, Woods Hole, MA 02543, USA
Abstract
Despite no obvious barrier to gene flow, historical environmental processes and eco-
logical specializations can lead to genetic differentiation in highly mobile animals.
Ecotypes emerged in several large mammal species as a result of niche specializations
and/or social organization. In the North-West Atlantic, two distinct bottlenose dolphin
(Tursiops truncatus) ecotypes (i.e. ‘coastal’ and ‘pelagic’) have been identified. Here, we
investigated the genetic population structure of North-East Atlantic (NEA) bottlenose
dolphins on a large scale through the analysis of 381 biopsy-sampled or stranded ani-
mals using 25 microsatellites and a 682-bp portion of the mitochondrial control region.
We shed light on the likely origin of stranded animals using a carcass drift prediction
model. We showed, for the first time, that coastal and pelagic bottlenose dolphins were
highly differentiated in the NEA. Finer-scale population structure was found within
the two groups. We suggest that distinct founding events followed by parallel adapta-
tion may have occurred independently from a large Atlantic pelagic population in the
two sides of the basin. Divergence could be maintained by philopatry possibly as a
result of foraging specializations and social organization. As coastal environments are
under increasing anthropogenic pressures, small and isolated populations might be at
risk and require appropriate conservation policies to preserve their habitats. While
genetics can be a powerful first step to delineate ecotypes in protected and difficult to
Correspondence: Marie Louis, Fax: +33-05-46-50-76-63;
E-mail: [email protected]
© 2014 John Wiley & Sons Ltd
Molecular Ecology (2014) 23, 857–874 doi: 10.1111/mec.12653

access taxa, ecotype distinction should be further documented through diet studies
and the examination of cranial skull features associated with feeding.
Keywords: cetaceans, conservation, ecotypes, feeding specializations, philopatry, population
genetics
Received 27 September 2013; revision received 30 November 2013; accepted 18 December 2013
Introduction
Despite no obvious physical barrier to gene flow and
high movement capacities, intraspecific population dif-
ferentiation in vertebrates can be high at large and
small spatial scales (e.g. Natoli et al. 2004; Hoffman
et al. 2005; Sacks et al. 2005). Environmental factors, in
particular habitat characteristics and past climate
changes, have been correlated with population diver-
gence in fishes and mammals (e.g. Bernatchez 1997;
Gaggiotti et al. 2009; Amaral et al. 2012b). The degree of
connectivity between populations can also be influenced
by an interaction between ecological conditions and
behavioural traits. In fishes, natal homing (i.e. site fidel-
ity to natal breeding ground) is suggested as an impor-
tant factor shaping genetic differentiation among
populations through local adaptation to a particular
habitat that confers better fitness (e.g. Kawecki & Ebert
2004; Dionne et al. 2008). Similarly, despite high mobil-
ity, terrestrial carnivores (e.g. wolves and coyotes) can
show cryptic population structure linked to individual
preferential dispersal towards similar natal area habitats
where they will find familiar prey resources (Sacks et al.
2005; Pilot et al. 2012). Resource specializations may also
explain genetic differentiation of killer whales in the
Pacific between sympatric fish and marine mammal
eating ecotypes (Hoelzel et al. 1998a), and in the North-
East Atlantic (NEA) among different fish eating popula-
tions (Foote et al. 2011). Social cohesion and learning of
foraging techniques within the matrilineal pod is likely
to promote philopatry (Hoelzel et al. 1998a).
Niche specializations between genetically different
groups of individuals can result in the classification of
ecotypes. The term ‘ecotype’ was first defined in plants
following common garden experiments (Turesson
1922a,b) and corresponded to ecological units that arise
from genotypical responses to particular habitats.
Groups of individuals in distinct environments can
become differentiated, resulting in different ecotypes, if
heritable variation is sufficient for natural selection to
take place and if local adaptation is stronger than gene
flow between groups (Begon et al. 2006). Since its first
appearance, the definition of an ecotype has been con-
troversial (see review in Lowry 2012). We used Lowry’s
(2012) ecotype definition in this study, that is, groups of
populations, which differ across the landscape by genet-
ics (e.g. allele frequencies differences) and ecological
and/or physiological traits. Ecotype differentiation can
be confirmed using common garden experiments for
small animals like Dominican anoles (Thorpe et al.
2005). However, for large, highly mobile mammals,
these experiments would be impractical and ethically
controversial. Molecular, ecological, distribution and
behavioural studies are therefore needed. Killer whales
in the North-East Pacific were classified into three
ecotypes (resident, transient and offshore) from an
in-depth knowledge of foraging behaviour, genetics,
ranging patterns and morphology (see review in de
Bruyn et al. 2013). Coastal and pelagic bottlenose dol-
phin, Tursiops truncatus, ecotypes were distinguished
through genetics, distribution, diet and skull morpho-
logy in the North-West Atlantic (NWA) (Mead & Potter
1995; Hoelzel et al. 1998b) and in the Pacific (Walker
1981; Curry & Smith 1998; Perrin et al. 2011). The two
bottlenose dolphin ecotypes form separate mitochon-
drial lineages in the NWA, with less genetic diversity in
coastal populations. The situation is more complex in
the Pacific Ocean and the North-East Atlantic (NEA)
(Natoli et al. 2004; Tezanos-Pinto et al. 2009). In the
Pacific, mitochondrial DNA (mtDNA) genetic differenti-
ation between coastal and pelagic bottlenose dolphins is
significant, but there is no complete lineage sorting
(Segura et al. 2006). Tezanos-Pinto et al. (2009) sug-
gested that ecotype differentiation in the NWA may not
be representative of genetic structuring of bottlenose
dolphins worldwide.
In the NEA, bottlenose dolphins are found in coastal
waters where they form either discrete small resident
groups of tens to hundreds of individuals (e.g. Berrow
et al. 2012; Cheney et al. 2012) or more mobile groups
(O’Brien et al. 2009). They are transient and/or resident
in deep waters near offshore islands (Silva et al. 2008),
the Gibraltar Strait (de Stephanis et al. 2008) and pelagic
waters, in particular the shelf-edge of the Bay of Biscay
and Celtic Sea with abundance estimates of thousands
of individuals (Hammond et al. 2009, 2013). In the Med-
iterranean Sea, resident populations and mobile individ-
uals were also reported (e.g. Gnone et al. 2011). There is
a distributional hiatus in the NEA, that is, resident
coastal populations are mainly observed in shallow
waters less than 40 m deep, while the sightings of
large-scale surveys are mainly concentrated on the
outer shelf, the shelf-edge (depths from 200 to 4000 m)
© 2014 John Wiley & Sons Ltd
858 M. LOUIS ET AL.

and oceanic waters. There are also occasional sightings
on the rest of the shelf (Certain et al. 2008; SAMM aerial
campaigns 2011/2012, E. Pettex, personal communica-
tion; Hammond et al. 2013). Given this shallow coastal
vs. deep pelagic habitat distribution, the existence of
two distinct ecotypes could be possible. However, no
previous study attempted to delineate ecotypes in the
NEA. Fine-scale genetic structure was reported locally
in Ireland and the Iberian Peninsula where a potential
differentiation between pelagic and coastal dolphins
was suggested (Fernandez et al. 2011; Mirimin et al.
2011). In contrast, despite high geographical distance,
no differentiation was found between individuals sam-
pled around the pelagic islands of Madeira and the
Azores using a relatively small set of 10 microsatellites
markers (Qu�erouil et al. 2007). The only large-scale
genetic study (Natoli et al. 2005) correlated genetic
breaks with oceanographic boundaries between Scot-
land and the NEA (using samples from South England
to Gibraltar for the latter) and between West and East
Mediterranean Sea. However, despite samples coming
from Scotland to the Black Sea, this study was limited
by small sample sizes (e.g. 35 samples for the NEA)
and the relatively low number of microsatellites used
(9). Our understanding of the bottlenose dolphin popu-
lation structure is therefore extremely fragmented in the
NEA. Determining population structure and delineating
eventual bottlenose dolphin ecotypes in the NEA is
essential for management as anthropogenic pressure
can be extremely different in coastal and pelagic envi-
ronments. The small size of resident coastal populations
and the extinction of at least one genetically isolated
population in an estuary (Humber Estuary, UK) that
has not been repopulated raised conservation concerns
for the species in coastal waters (Nichols et al. 2007).
Moreover, bottlenose dolphins are protected in Europe
under the Habitat Directive where they are listed as a
species whose conservation requires the designation of
Special Areas of Conservation.
In this context, the aim of our study was to determine
the population structure of bottlenose dolphins in the
NEA. Thanks to a collaborative framework of organiza-
tions across Europe, we were able to gather a large
sample size (i.e. 405 tissue samples) covering an unprec-
edentedly wide geographical area encompassing both
coastal and pelagic waters. We used a combination of
biopsy samples and samples from stranded animals,
and interpretation of data from strandings was
enhanced by estimating, whenever possible, the most
likely area of death of stranded individuals using a drift
prediction model (Peltier et al. 2012). The most likely
area of death is indeed more indicative of the individual
living area than stranding location, and the model is a
promising and novel approach to improve the reliability
of using stranded animals in genetic studies of marine
megafauna. We also used a much larger set of indepen-
dent loci (25 microsatellites and a 682-bp fragment of
the mitochondrial control region) than previous studies.
In addition, we worked with several clustering meth-
ods, which is rarely done in marine mammal popula-
tion structure studies. The identified populations were
characterized in terms of genetic diversity, connectivity
and effective population sizes. We placed our work in
the broader phylogeographical context of the North
Atlantic basin, which raised new hypotheses about the
evolutionary history of bottlenose dolphins in this area.
Finally, we discussed ecotype delineation, evolutionary
scenarios and ecological and behavioural processes
driving the population structure of this highly mobile
top predator.
Longitude
Latit
ude
−30 −20 −10 0 10
35
40
45
50
55
60Moray Firth
North SeaUK
Connemara−Mayo
Shannon estuary
Cardigan Bay
English Channel
Iroise Sea
FranceBay of Biscay
Atlantic Ocean
Galicia
SpainPortugal
Azores
Madeira
Sado estuary
Gulf of Cadiz
Gibraltar Strait
Mediterranean Sea
Corsica
Fig. 1 Map of the study area. �1000 and
�200 m isobaths are plotted.
© 2014 John Wiley & Sons Ltd
BOTTLENOSE DOLPHIN ECOTYPES 859

Material and methods
Sample collection, DNA extraction and sexing
A total of 405 bottlenose dolphin samples were
obtained from the NEA and the Mediterranean Sea (see
studied area in Fig. 1). Samples were collected from
free-ranging dolphins by skin biopsy sampling between
2003 and 2012 (N = 164) and from skin, muscle or kid-
ney of stranded animals between 1990 and 2012
(N = 241). Tissue samples were either frozen or pre-
served in ethanol or DMSO. DNA was extracted using
NucleoSpin Tissue kits (Macherey-Nagel) following the
manufacturer’s protocol.
After checking for mitochondrial DNA (mtDNA)
sequence quality and duplicates (i.e. individuals that
were biopsy-sampled more than once), 381 samples
(Fig. 2) were kept in the analyses. 343 individuals had
both mitochondrial and microsatellite data, 26 only
mitochondrial data and 12 only microsatellites, resulting
in N = 355 for microsatellite and N = 369 for mitochon-
drial data analyses. Samples for which either mitochon-
drial or microsatellite data were missing came only
from stranded individuals and the failure to obtain
either mitochondrial or nuclear data is likely linked to
decomposition state. Geographical origin was known
for 173 samples (biopsy samples: N = 158; stranded ani-
mals that were previously photo-identified: N = 15),
while 208 samples came from stranded animals of
unknown origin. A drift prediction model which takes
into account meteorological conditions (currents, winds
and tides), the decomposition state of the carcasses and
cetacean body parameters (thickness and floatability)
was applied to stranded animals in the Bay of Biscay,
English Channel and North Sea (the areas encompassed
by the model), in order to estimate their most likely
area of death (Appendix S1, Supporting Information,
Peltier et al. 2012). This could only be estimated when
the decomposition state of the carcass was available
(N = 66). The decomposition state is a proxy of the time
after death in terms of intervals of days (Peltier et al.
2012). To estimate the most likely area of death, the cen-
troid position of all the drift gps coordinates during the
appropriate day interval was calculated for each indi-
vidual using the geosphere package (Hijmans et al.
2012) in R 3.0.0. (R Core Team 2013). All maps were cre-
ated using the MARMAP package (Pante & Simon-Bouhet
2013).
The gender of the individuals was determined by
amplification of the SRY plus ZFX/ZFY fragments as
described in Rosel (2003) and/or visually during nec-
ropsy.
Microsatellite genotyping and validity
Samples were genotyped at 25 microsatellite loci includ-
ing 20 published markers and five markers newly
developed during this study (see Appendix S2a, Sup-
porting Information for PCR and genotyping conditions
and Appendix S2b, Supporting Information for the
method of discovery of new microsatellites). To assess
genotyping error rate, 28 individuals were randomly
selected for re-amplification and scoring at all loci. Thir-
teen duplicates were also included in error rate calcula-
tion. 11.55% of the data set was therefore reprocessed.
Individuals were kept in the analyses when at least 12
loci were successfully amplified (N = 355), resulting in
1.84% of missing values in the whole data set. Each mi-
crosatellite locus was checked for null alleles and scor-
ing errors using Microchecker (Van Oosterhout et al.
2004). Departures from Hardy–Weinberg equilibrium
(HWE) and linkage equilibrium were tested using
Longitude
Latit
ude
−30 −20 −10 0 10
35
40
45
50
55
60
457 km
Known originStrandingArea of death
Fig. 2 Sampling locations for individuals
of known origin (biopsy samples and
stranded individuals previously photo-
identified), stranded animals (and their
stranding locations) and area of death
(stranded animals for which it was possi-
ble to apply the drift prediction model).
�1000 and �200 m isobaths are plotted.
© 2014 John Wiley & Sons Ltd
860 M. LOUIS ET AL.

10 000 iterations in GENEPOP web version 4.2 (Raymond
& Rousset 1995). Tests were conducted for the whole
data set and for each population identified by the clus-
tering methods. Significance levels were corrected for
multiple comparisons using the sequential Bonferroni
technique for this test and for all multiple comparisons
of the study (Holm 1979).
Mitochondrial DNA sequencing
A 682-base pair (bp) portion of the mitochondrial
control region was amplified using primers Dlp1.5
(5′-TCACCCAAAGCTGRARTTCTA-3′) (Baker et al.
1998) and Dlp8G (5′-GGAGTACTATGTCCTGTAACCA-
3′) (as reported in Dalebout et al. 2005; see Appendix
S3, Supporting Information for PCR conditions). Con-
sensus sequences were generated and checked for ambi-
guities with SEQUENCHER 5.0 Demo (Gene Codes
Corporation) and manually edited with BioEdit (Hall
1999). Unique haplotypes were identified using DNAsp
(Rozas & Rozas 1999).
Population structure
We used three clustering methods to determine the most
likely number of populations and assign individuals to
these: a multivariate method, the discriminant analysis of
principal components (DAPC) (Jombart et al. 2010) and
two Bayesian methods implemented in STRUCTURE
(Pritchard et al. 2000) and TESS (Durand et al. 2009b).
DAPC is a multivariate method that clusters individuals
using genetic similarity. It does not rely on any popula-
tion genetic model and is efficient at detecting hierarchi-
cal structure (Jombart et al. 2010). STRUCTURE clusters
individuals by minimizing Hardy–Weinberg and linkage
disequilibria (Pritchard et al. 2000). TESS is a spatially
explicit Bayesian model, which incorporates individual
geographical coordinates as a priori information (Durand
et al. 2009b). These three different approaches were used
to ensure the robustness of the inferred results as deter-
mining the most likely number of clusters can be chal-
lenging (Guillot et al. 2009).
DAPC was performed using the package adegenet
(Jombart 2008) in R 3.0.0 (Appendix S4, Supporting Infor-
mation). Membership probabilities were calculated for
each individual, and each individual was assigned to a
cluster using its maximum membership probability.
In STRUCTURE, the admixture models with correlated
and uncorrelated allele frequencies were used, without
indicating any a priori information on the origin of sam-
ples. Ten independent runs for K values set from 1 to 10
were performed using a burn-in period of 50 000 itera-
tions followed by 300 000 Markov chain Monte Carlo
(MCMC) steps. The most likely number of clusters was
chosen by calculating DK (Evanno et al. 2005), which is
the second-order rate of change of the mean loglikelihood
of the data [LnP(D)] between successive K values in
STRUCTURE HARVESTER v.0.5 (Earl & Vonholdt 2012). As this
method cannot identify K = 1, we confirmed the results
by plotting LnP(D) (Pritchard et al. 2000), examining
individual membership proportion plots and consistency
across runs. The Evanno method can reveal hierarchical
structure by detecting the upper level of genetic differen-
tiation (Evanno et al. 2005); therefore, STRUCTURE
was re-run in each of the identified clusters. When K was
defined, the run with the highest LnP(D) value was
selected and individuals were assigned to clusters based
on maximum membership proportions.
The conditional autoregressive (CAR) admixture
model was run in TESS using a burn-in of 20 000 steps
followed by 120 000 MCMC steps. The number of
clusters (K) to test was set from 2 to 10, with 10 repli-
cate runs for each K. The spatial interaction parameter
was set to 0.6 and the degree of trend to linear (which
are the default parameters). To exclude land masses
from the analysis, nine dummy points were added
along French and Spanish coasts (Durand et al. 2009a).
The most likely number of clusters was selected by
plotting Deviance Information Criterion (DIC) values
against K and by examining plots of individual assign-
ment probabilities. Consistency of the runs was
checked. When K was defined, the run with the lowest
DIC was used and individuals were assigned to clusters
based on maximum assignment probabilities.
As results were highly consistent between analyses in
terms of both the most likely number of clusters and
individual assignments (which were identical for
93.53% of individuals across the three methods), the
method that uses both multilocus genetic data and spa-
tial coordinates (i.e. TESS) was used to divide the data
set into populations for the following analyses (see
description of the populations in the population struc-
ture result section).
As the inclusion of closely related individuals could
impact population structure analyses, the Queller and
Goodnight (Queller & Goodnight 1989) relatedness coef-
ficient (r) was calculated using KINGROUP v.2 (Konovalov
et al. 2004) within each population identified by TESS.
TESS was then re-run by removing one individual from
each pair of individuals showing a relatedness coeffi-
cient superior or equal to 0.45 as in Rosel et al. (2009).
Sex-biased dispersal was tested in FSTAT 2.9.3 by com-
paring sex-specific assignment indices, relatedness, FSTand FIS values using 10 000 permutations (Goudet et al.
2002). The test was performed on the whole data set
using the populations identified by TESS and at the dif-
ferent levels of the hierarchical structure. Only adults
were included in the test (biopsy samples were only
© 2014 John Wiley & Sons Ltd
BOTTLENOSE DOLPHIN ECOTYPES 861

collected from adults, and for stranded animals, we
kept only individuals with a minimum total length of
250 cm, i.e. an arbitrary threshold for which we consid-
ered that individuals were physically mature, N = 292
individuals).
Nuclear genetic differentiation and diversity
To characterize the level of genetic differentiation among
the clusters identified by TESS, pairwise FST were esti-
mated between populations using ARLEQUIN 3.5.1.3 (Mic-
halakis & Excoffier 1996). The level of significance was
assessed using 10 000 permutations. The analyses were
also performed with the data set excluding closely
related individuals. For each identified population, mean
number of alleles (NA) and allele richness (AR) were cal-
culated in FSTAT 2.9.3. (Goudet 1995). Inbreeding coeffi-
cient (FIS), observed heterozygosity (Ho) and expected
heterozygosity (He) were calculated in ARLEQUIN. Convert
(Glaubitz 2004) was used to identify private alleles.
Diversity indices were also calculated per locus. Mean
AR and Ho were compared between pairs of populations
using a Wilcoxon paired-sample test.
Mitochondrial DNA differentiation and diversity
A haplotype network was constructed to determine gene-
alogical relationships using median-joining and maxi-
mum parsimony algorithms implemented in NETWORK
4.6.0.0 (Bandelt et al. 1999). Sequences were clustered
according to the populations identified by TESS. Number
of haplotypes (NH), number of polymorphic sites (S),
haplotypic diversity (h) and nucleotide diversity (p) were
determined for each population in ARLEQUIN. JMODELTEST
2.1.3 was used to determine the most accurate model of
substitution using the Bayesian Information Criterion
(BIC; Guindon & Gascuel 2003). Pairwise genetic differ-
entiation was estimated between populations in ARLEQUIN
using FST and ФST. For ФST, the Tamura and Nei (1993)
model of substitution was chosen as it is the closest
model to the HKY + I model, selected by JMODELTEST. Sig-
nificance levels were tested using 10 000 permutations.
Sequences from this study were placed in the phylo-
geographical context of the North Atlantic basin. Haplo-
types from the NWA and additional sequences from
the Azores and Madeira were obtained from GenBank
(Appendix S5, Supporting Information). A haplotype
network was constructed as described above using a
324-bp consensus length for unique haplotypes.
Recent migration rates
Recent and asymmetric migration rates (within the
last few generations) among populations identified by
TESS were estimated using the Bayesian method
implemented in BayesAss (Wilson & Rannala 2003)
on microsatellite data (see Appendix S6, Supporting
Information).
Effective population sizes
We used two methods for estimating contemporary
effective population sizes for each population identified
by TESS: a method that uses linkage disequilibrium in
LDNe (Waples & Do 2008) and an approximate Bayes-
ian computation method implemented in ONeSAMP
(Tallmon et al. 2008). In LDNe, alleles frequencies <0.02(Pcrit) were excluded from the analyses to avoid bias
caused by rare alleles but still get a high precision
(Waples & Do 2010). In ONeSAMP, Ne priors were set
from 2 to 500 and from 2 to 10 000 for the expected
small and large populations, respectively. Influences of
priors on the estimates were tested for the two coastal
populations, using priors from 4 to 1000 and from 2 to
200. Our data set included multiple cohorts and age
classes, which will bias Ne estimates downwards. For
instance, a 10–15% downward bias in Ne estimates was
observed in a study using mature bottlenose dolphins
and a Pcrit of 0.02 in LDNe (R. Waples, personal com-
munication). We therefore applied a bias correction of
15% to our results for both LDNe and ONeSAMP (Nec).
Results
Microsatellite validity
The genotyping error rate was 0.0097 (i.e. 10 incorrect
genotypes/1025 genotypes reprocessed). The error rate
for stranded individuals, which were fresh to moder-
ately decomposed (0.013, i.e. seven incorrect geno-
types/525 genotypes reprocessed), was twice as large as
the error rate for live individuals (0.006, i.e. three incor-
rect genotypes/500 genotypes reprocessed). Significant
departure from HWE was detected for the majority of
the loci when considering the whole data set as a single
population. However, this was the result of Wahlund
effects as no significant departure was found when
dividing the data set into the populations identified by
TESS, except for loci MK9 and EV37 in one population
each (Appendix S7, Supporting Information). As devia-
tion was significant in only one population and results
with and without these two loci were essentially the
same (number of clusters and individual assignments),
only results including MK9 and EV37 are reported.
Linkage disequilibrium was significant for 0.50% of the
pairwise comparisons, and when significant, it was not
detected across all populations and was therefore con-
sidered negligible.
© 2014 John Wiley & Sons Ltd
862 M. LOUIS ET AL.
Drift prediction model
The drift prediction model indicated that individuals
were likely to have died in coastal waters in the North
Sea and the English Channel and from coastal to the
outer shelf-edge waters in the Bay of Biscay (Appendix
S1, Supporting Information).
Population structure
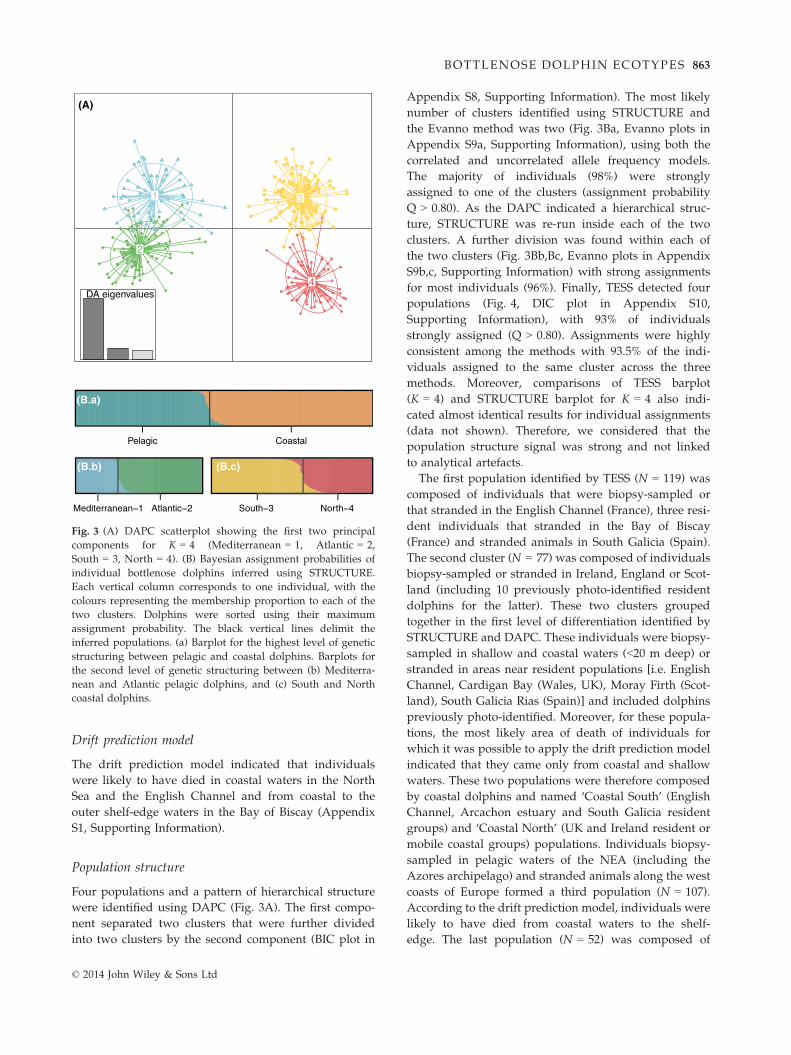
Four populations and a pattern of hierarchical structure
were identified using DAPC (Fig. 3A). The first compo-
nent separated two clusters that were further divided
into two clusters by the second component (BIC plot in
Appendix S8, Supporting Information). The most likely
number of clusters identified using STRUCTURE and
the Evanno method was two (Fig. 3Ba, Evanno plots in
Appendix S9a, Supporting Information), using both the
correlated and uncorrelated allele frequency models.
The majority of individuals (98%) were strongly
assigned to one of the clusters (assignment probability
Q > 0.80). As the DAPC indicated a hierarchical struc-
ture, STRUCTURE was re-run inside each of the two
clusters. A further division was found within each of
the two clusters (Fig. 3Bb,Bc, Evanno plots in Appendix
S9b,c, Supporting Information) with strong assignments
for most individuals (96%). Finally, TESS detected four
populations (Fig. 4, DIC plot in Appendix S10,
Supporting Information), with 93% of individuals
strongly assigned (Q > 0.80). Assignments were highly
consistent among the methods with 93.5% of the indi-
viduals assigned to the same cluster across the three
methods. Moreover, comparisons of TESS barplot
(K = 4) and STRUCTURE barplot for K = 4 also indi-
cated almost identical results for individual assignments
(data not shown). Therefore, we considered that the
population structure signal was strong and not linked
to analytical artefacts.
The first population identified by TESS (N = 119) was
composed of individuals that were biopsy-sampled or
that stranded in the English Channel (France), three resi-
dent individuals that stranded in the Bay of Biscay
(France) and stranded animals in South Galicia (Spain).
The second cluster (N = 77) was composed of individuals
biopsy-sampled or stranded in Ireland, England or Scot-
land (including 10 previously photo-identified resident
dolphins for the latter). These two clusters grouped
together in the first level of differentiation identified by
STRUCTURE and DAPC. These individuals were biopsy-
sampled in shallow and coastal waters (<20 m deep) or
stranded in areas near resident populations [i.e. English
Channel, Cardigan Bay (Wales, UK), Moray Firth (Scot-
land), South Galicia Rias (Spain)] and included dolphins
previously photo-identified. Moreover, for these popula-
tions, the most likely area of death of individuals for
which it was possible to apply the drift prediction model
indicated that they came only from coastal and shallow
waters. These two populations were therefore composed
by coastal dolphins and named ‘Coastal South’ (English
Channel, Arcachon estuary and South Galicia resident
groups) and ‘Coastal North’ (UK and Ireland resident or
mobile coastal groups) populations. Individuals biopsy-
sampled in pelagic waters of the NEA (including the
Azores archipelago) and stranded animals along the west
coasts of Europe formed a third population (N = 107).
According to the drift prediction model, individuals were
likely to have died from coastal waters to the shelf-
edge. The last population (N = 52) was composed of
Pelagic Coastal
Mediterr Nor
(A)
(B.a)
(B.c)(B.b)
Fig. 3 (A) DAPC scatterplot showing the first two principal
components for K = 4 (Mediterranean = 1, Atlantic = 2,
South = 3, North = 4). (B) Bayesian assignment probabilities of
individual bottlenose dolphins inferred using STRUCTURE.
Each vertical column corresponds to one individual, with the
colours representing the membership proportion to each of the
two clusters. Dolphins were sorted using their maximum
assignment probability. The black vertical lines delimit the
inferred populations. (a) Barplot for the highest level of genetic
structuring between pelagic and coastal dolphins. Barplots for
the second level of genetic structuring between (b) Mediterra-
nean and Atlantic pelagic dolphins, and (c) South and North
coastal dolphins.
© 2014 John Wiley & Sons Ltd
BOTTLENOSE DOLPHIN ECOTYPES 863

individuals biopsy-sampled in the Gulf of Cadiz and the
deep waters of the Gibraltar Strait and by individuals
stranded in Corsica. These two populations grouped
together in the upper level of structure revealed by
STRUCTURE and the DAPC. As the biopsied dolphins in
this group were sampled in deep waters (>200 m) of the
Azores, the NEA and the Gibraltar Strait, these two pop-
ulations were composed of pelagic individuals and
named ‘Pelagic Atlantic’ and ‘Pelagic Mediterranean’
populations.
The removal of one individual per pair of closely
related individuals (25, 21 and one individuals were
removed from the Coastal South, Coastal North and
Pelagic Mediterranean populations, respectively) did
not change the inferred population structure.
Gender was determined for 370 individuals (153
females and 217 males). No significant sex-biased dis-
persal was found for any of the tested indices (all
P > 0.05) either among the four populations or between
each of two main groups (coastal and pelagic). We had
reasonable numbers of males and females in each group
for the 292 adults included in the sex-biased dispersal
test (Coastal North = 23 females + 26 males, Coastal
South = 39 females + 70 males, Pelagic Atlantic = 32
females + 56 males and Pelagic Mediterranean = 20
females and 26 males).
A total of 55 mitochondrial DNA (mtDNA) haplo-
types were identified in the NEA data set (including 53
haplotypes for individuals that were also genotyped
for microsatellites, see Appendix S11, Supporting
Information for the table of polymorphic sites). The
median-joining network (Fig. 5) indicated that the
majority of individuals in the coastal group shared
haplotypes forming a lineage separated by 12 base pairs
(bp) from the lineage including most haplotypes found
in the pelagic group. Only two haplotypes were shared
between the coastal and the pelagic group. Some haplo-
types within the pelagic group were highly divergent,
with 49 bp separating the two most distant haplotypes.
When using only 324-bp sequences to include haplo-
types from other studies, the number of haplotypes was
reduced from 6 to 4 for NEA coastal dolphins and from
49 to 38 for NEA pelagic dolphins (Fig. 6). Haplotypes of
the NWA were classified as coastal or pelagic following
designation used in previous studies (listed in Appendix
S5, Supporting Information and P. Rosel, personal com-
munication). Coastal haplotypes from the NWA formed
a completely separate lineage. Haplotypes from NEA
and NWA pelagic individuals, from the Azores and
Madeira and from NEA coastal individuals were clus-
tered together in the network. Eighteen haplotypes were
shared between NWA pelagic and NEA pelagic, NEA
coastal or Azores and Madeira dolphins.
Genetic differentiation and genetic diversity in theNEA
All nuclear FST, mtDNA FST and ФST pairwise compari-
sons were significant, with the highest level of differen-
tiation found when comparing pelagic and coastal
0.0
0.2
0.4
0.6
0.8
1.0
(A) (B)
(C) (D)
Fig. 4 Map of individual assignment probabilities per population identified by TESS. The colour scale bar indicates the assignment
probabilities, (A) Pelagic Mediterranean, (B) Coastal South, (C) Pelagic Atlantic, (D) Coastal North.
© 2014 John Wiley & Sons Ltd
864 M. LOUIS ET AL.

Coastal NorthCoastal SouthPelagic AtlanticPelagic MediterraneanUnknown populationExtinct or unsampledintermediate haplotypes
Fig. 5 Median-joining network of
mtDNA control region haplotypes found
in bottlenose dolphins from the North-
East Atlantic. Each circle represents a
unique haplotype coloured in proportion
to the number of individuals from the
populations inferred by TESS that share
the haplotype (individuals for which the
population could not be inferred by mi-
crosatellite data are shaded in black).
Size of circles is proportional to haplo-
type frequencies. Black squares indicate
either extinct or unsampled intermediate
haplotypes. Black dashes indicate muta-
tion steps between haplotypes.
Coastal North-East Atlantic - this studyPelagic North-East Atlantic - this studyAzores and MadeiraCoastal North-West AtlanticPelagic North-West AtlanticUnknown origin - this studyExtinct or unsampled intermediate haplotypes
Fig. 6 Median-joining network of mtDNA
control region haplotypes found in bot-
tlenose dolphins from the North Atlantic.
Each circle represents a unique haplotype
coloured according to the population
where it was found. The haplotype fre-
quencies were not taken into account.
The two pelagic and coastal populations
of this study were grouped. Black
squares indicate either extinct or unsam-
pled intermediate haplotypes. Black
dashes indicate intermediate mutation
steps between haplotypes.
Table 1 Pairwise microsatellite FST between populations
Population Coastal South Coastal North Pelagic Atlantic Pelagic Mediterranean
Coastal South (N = 119) — 0.057** 0.133** 0.118**
Coastal North (N = 77) — 0.149** 0.157**
Pelagic Atlantic (N = 107) — 0.043**
Pelagic Mediterranean (N = 52) —
**P < 0.01 after sequential Bonferroni correction.
Table 2 Pairwise mitochondrial FST (above diagonal) and ΦST (below diagonal) between populations
Population Coastal South Coastal North Pelagic Atlantic Pelagic Mediterranean
Coastal South (N = 115) — 0.252** 0.279** 0.326**
Coastal North (N = 76) 0.233** — 0.195** 0.221**
Pelagic Atlantic (N = 101) 0.541** 0.349** — 0.071**
Pelagic Mediterranean (N = 51) 0.671** 0.445** 0.056** —
**P < 0.01 after sequential Bonferroni correction.
© 2014 John Wiley & Sons Ltd
BOTTLENOSE DOLPHIN ECOTYPES 865

populations (Tables 1 and 2). Comparisons of the two
coastal populations also had a high mtDNA FST value.
As identical results were obtained when excluding clo-
sely related dolphins, they were kept in the analyses.
Mitochondrial genetic diversity was higher in pelagic
populations than in coastal populations (Table 3). Despite
similar sample sizes, the number of haplotypes in the
coastal populations was considerably lower than in pela-
gic populations, with the majority of coastal individuals
sharing two haplotypes and with no evidence of most
common pelagic haplotypes (see Appendix S12, Support-
ing Information for haplotype frequencies by population).
Nuclear genetic diversity [allele richness (AR) and
observed heterozygosity (Ho)] was significantly lower in
coastal than in pelagic clusters (Wilcoxon test, P < 0.01)
(Table 3, Appendix S7, Supporting Information for val-
ues per loci per populations). All pairwise comparisons
were significant except for the AR, which was not sig-
nificantly different between the two coastal clusters.
Lower numbers of private alleles were identified in
coastal populations than in pelagic populations
(Table 3). A significant heterozygote deficiency was
detected in the Coastal North population (Table 3),
which was likely due to the inclusion of closely related
individuals because FIS was nonsignificant when they
were removed (FIS = 0.029, P = 0.119).
Recent migration rates
Estimates were highly consistent between runs; there-
fore, results for a randomly chosen run was selected
(Table 4). Estimates of recent migrations rates were low
among all clusters: 1.1% per generation at most, and
with 95% confidence intervals that included 0 (Table 4).
Effective population sizes
The two methods produced approximately similar con-
temporary effective size (Nec) estimates, with consider-
ably lower estimates for coastal populations than for
pelagic populations (Table 5). Using different priors for
coastal populations in ONeSAMP, Nec estimates varied
only slightly. Despite months of computation, pelagic
population Nec estimates using ONeSAMP never con-
verged.
Discussion
Hierarchical structure
Bottlenose dolphins were hierarchically structured in
the NEA. The strongest level of genetic differentiation
was found between coastal and pelagic dolphins with
both microsatellite and mtDNA markers. The NEATab
le3
Mitoch
ondrial
andnucleardiversities
foreach
populationinferred
byTESS
Populations
Mitoch
ondrial
Microsatellites
NNohap
l.S
hp
NFIS
PHo
He
NA
AR
PA
CoastalSouth
115
412
0.499(0.044)
0.001(0.001)
119
0.012
0.240
0.582(0.180)
0.596(0.172)
6.3(2.8)
5.8(2.6)
2
CoastalNorth
765
130.667(0.042)
0.006(0.003)
770.062
0.002
0.486(0.180)
0.541(0.191)
5.8(2.4)
5.3(2.2)
2
Pelag
icAtlan
tic
101
3841
0.929(0.013)
0.014(0.007)
107
0.008
0.236
0.734(0.131)
0.770(0.131)
9.8(3.9)
9.0(3.3)
48
Pelag
icMed
iterranean
5115
280.902(0.022)
0.013(0.007)
520.018
0.154
0.700(0.158)
0.726(0.140)
7.8(3.4)
7.8(3.4)
8
Overall*
369
5546
0.883(0.011)
0.012(0.006)
355
0.103
0.000
0.631(0.139)
0.715(0.142)
10.8
(5.2)
8.7(3.7)
—
N,number
ofindividuals;
Nohap
l.,number
ofhap
lotypes;S,number
ofpolymorphic
sites;
h,hap
lotypic
diversity;p,
nucleo
tidediversity;FIS,inbreed
ingcoefficien
t;P,FISP-
value;
Ho,
observed
heterozy
gosity;He,expectedheterozy
gosity;NA,meannumber
ofalleles;
AR,meanallele
rich
ness;
PA,totalnumber
ofprivatealleles;
SD
inparen
thesis
when
appropriate.
*26individualsthat
werenotincluded
inmicrosatellites
analyses(dueto
amplificationissu
es),an
dthuswerenotassigned
toan
ypopulation,wereincluded
intheoverallvalues
ofmtD
NA
diversities.12
individualsweresu
ccessfullyam
plified
formicrosatellitemarkers,
butnotformtD
NA.
© 2014 John Wiley & Sons Ltd
866 M. LOUIS ET AL.

haplotype network indicated two separate mitochon-
drial lineages with no complete lineage sorting between
coastal and pelagic dolphins. Shared haplotypes indi-
cated possible migration, incomplete lineage sorting or
introgression. As in the NWA (Natoli et al. 2004),
genetic diversities were higher in pelagic than in coastal
populations. Significant genetic structure was found
within each of the two groups. Migration rates between
populations were low (about 1% per generation or less).
In the coastal group, individuals sampled in the UK
and Ireland (Coastal North) formed one population.
Eight dolphins were reported moving between east and
west Scotland and between Scotland and Ireland coastal
groups through photo-identification (Robinson et al.
2012), which suggests that these wide-ranging individu-
als may maintain genetic connectivity between resident
groups. This population was differentiated from neigh-
bouring English Channel dolphins and more distant
Galician individuals. However, several resident coastal
groups [e.g. Shannon estuary (Ireland), Iroise Sea
(France)] were not sampled. Moreover, the Shannon
population is genetically isolated from other inshore
dolphins in Ireland (Mirimin et al. 2011). Thus, more
structuring is expected in coastal waters. In the pelagic
group, individuals from the NEA were separated from
individuals sampled in the Gulf of Cadiz, Gibraltar
Strait and Mediterranean Sea. Individuals sampled in
the Azores clustered with 88 individuals from the rest
of the NEA, which can be surprising given the large
distance between the Azores and the shelf-edge. Deep
waters (>200 m) are found very close to shore for this
archipelago, indicating that bottlenose dolphins inhabit
oceanic environments. Photo-identification work indi-
cated that resident individuals represented <5% of indi-
viduals found in the Azores, the majority of the
individuals being transients or migrants (Silva et al.
2008). This could explain the lack of structure found in
Qu�erouil et al. (2007) and our study, which contrasted
with other oceanic archipelagos where genetic structure
was found, like in Hawaii, where shallow water areas
are larger and high site fidelity has been reported
(Martien et al. 2011). Individuals of the Mediterranean
Sea were considered as coastal in previous studies
(Natoli et al. 2004, 2005), which contrasted with their
high genetic diversity and with our results indicating
that they were pelagic. Some coastal groups are resident
but movements were reported between Corsica and
France (Gnone et al. 2011), indicating that individuals
crossed pelagic waters. The pelagic habitat use was con-
firmed by aerial surveys conducted during winter
where bottlenose dolphins were mainly sighted in
deep-water (>200 m) areas (SAMM, 2011/2012, E. Pet-
tex, personal communication). We could, however, not
exclude further population structuring within this area
as we had a limited sample size and only samples from
stranded individual for Corsica. Biopsy sampling of
coastal and pelagic groups is therefore needed to assess
Mediterranean Sea bottlenose dolphin population
structure.
To our knowledge, this is the first time that the struc-
ture and connectivity between and within pelagic and
coastal bottlenose dolphin populations was investigated
in the NEA. Three clustering methods relying on differ-
ent assumptions produced extremely consistent results.
We therefore concluded that the genetic signal is strong
and inferences reliable. We emphasize that using differ-
ent methods is particularly important when working on
highly mobile animals for which geographical barriers
are not obvious. It is still rarely done in marine mam-
mal studies. In our case, the landscape genetic method
was efficient at detecting and geographically delineating
four populations. However, marine mammal studies
using a landscape genetics approach are still scarce (but
see Fontaine et al. 2007; M€oller et al. 2011). Our study
shed light on global patterns of population structure of
Table 4 Mean (and 95% CI) recent migration rates inferred using BayesAss. The migration rate is the proportion of individuals in a
population that immigrated from a source population per generation
From/To Coastal South Coastal North Pelagic Atlantic Pelagic Mediterranean
Coastal South 0.990 (0.979–1.000) 0.004 (0.000–0.012) 0.003 (0.000–0.008) 0.003 (0.000–0.009)Coastal North 0.008 (0.000–0.021) 0.9837 (0.967–1.000) 0.004 (0.000–0.012) 0.004 (0.000–0.012)
Pelagic Atlantic 0.004 (0.000–0.010) 0.003 (0.000–0.009) 0.983 (0.956–1.000) 0.011 (0.000–0.026)Pelagic Mediterranean 0.010 (0.000–0.026) 0.009 (0.000–0.024) 0.009 (0.000–0.024) 0.973 (0.947–0.999)
The diagonal values represent the proportion of nonimmigrants in a population.
Table 5 Contemporary effective population sizes corrected for
overlapping generations (Nec) estimated using LDNe and ONe-
SAMP
LDNe ONeSAMP
Coastal South 64 (56–74) 77 (62–108)Coastal North 32 (28–37) 46 (36–62)
Pelagic Atlantic 7748 (1333–infinite) Endless run
Pelagic Mediterranean 231 (168–360) Endless run
© 2014 John Wiley & Sons Ltd
BOTTLENOSE DOLPHIN ECOTYPES 867

bottlenose dolphins in the NEA. However, finer-scale
population structure could exist within the identified
populations, as Bayesian clustering methods have been
shown to be inefficient at detecting structure when dif-
ferentiation levels are below FST of 0.02 (Latch et al.
2006; Chen et al. 2007). This work could therefore be the
basis for more localized studies inferring finer-scale
population structure.
Although sampling stranded animals is a cost-effec-
tive method, we acknowledge that not all animals dying
at sea are likely to strand (see review in Peltier et al.
2012), which confers uncertainty about the representa-
tiveness of these samples. The use of the most likely
area of death (Peltier et al. 2012) for part of the stranded
individuals shed light on their origin, which was con-
sistent with the genetic results separating coastal and
pelagic bottlenose dolphins. Unfortunately, meteorologi-
cal data were not available for the whole area, making
it impossible to apply the model for the complete data
set. In addition, the most likely area of death does not
necessarily correspond to living areas in particular if
sick or weakened animals move to another area to die
(e.g. closer to shore). Despite these caveats, the likely
position of death was more indicative of the individual
living area than stranding position. Moreover, Peltier
et al.’s (2012) drift experiments with tagged individuals
indicated a high precision of the model: 27.1 � 24.5 km
(mean distance between the observed stranding
positions of the tagged animals and the positions
predicted by the model). It is therefore a promising tool
for the use of stranded dolphins in genetic studies,
which has recently been questioned (Bilgmann et al.
2011).
Possible drivers of population structure
A complex interaction between historic environmental
processes and contemporary ecological and behavioural
factors is likely to drive social cetacean population
structure (M€oller 2011; Amaral et al. 2012a,b).
For bottlenose dolphins in the NEA, given the topol-
ogy of the haplotype network, a single founding event
of the coastal populations from the pelagic population
could be a possible evolutionary scenario. This hypothe-
sis is supported by the low genetic diversities and small
effective population sizes of coastal populations. Foun-
der events often involve few individuals, which leads
to a loss of genetic diversity due to genetic drift. A sim-
ilar scenario is suggested for NWA bottlenose dolphins
(Hoelzel et al. 1998b; Natoli et al. 2004). When placing
our samples in the Atlantic basin context, the NEA
coastal haplotypes were more closely related to the
NWA pelagic haplotypes than to the NWA coastal
haplotypes. The pelagic population is possibly
undifferentiated in the North Atlantic (Qu�erouil et al.
2007) although this needs to be confirmed using a larger
sampling size and nuclear markers. Founder events
might therefore have occurred independently from this
wide-ranging pelagic population when suitable coastal
habitats were released during interglacial periods
(Natoli et al. 2004) on the two sides of the Atlantic
basin, and more recently in the NEA than in the NWA.
These hypotheses should be tested using coalescent
approaches. Nevertheless, our work indicated that evo-
lutionary history of bottlenose dolphins may differ
among oceanic regions.
Genetically identified coastal bottlenose dolphins
were only biopsy-sampled in shallow waters, whereas
genetically identified pelagic individuals were sampled
in deep waters. This supports a habitat-driven popula-
tion structure in bottlenose dolphins. Although sex-
biased dispersal methods are known to have low power
(Goudet et al. 2002) and thus caution should be taken
when interpreting the results, we showed that both
males and females were philopatric as found in several
other bottlenose dolphin populations (see review in
M€oller 2011). This situation contrasted with the mam-
malian mating system where females tend to be philop-
atric as their reproductive success is mainly limited by
food resources, while males tend to disperse as their
reproductive success is constrained by access to mates
(Emlen & Oring 1977; Greenwood 1980). Familiarity
with natal habitat, in particular resource specializations,
together with social structure and culturally or verti-
cally transmitted behaviour could possibly contribute
towards philopatry for both sexes (Sellas et al. 2005; Sar-
geant & Mann 2009; M€oller 2011; Cantor & Whitehead
2013). These processes could lead to assortative mating
and maintain divergence at a large scale between the
pelagic and coastal groups, and at a finer scale, within
the two groups. Natal habitat preference through diet
specializations was suggested as an important mecha-
nism underlying cryptic population structure in terres-
trial carnivores (Sacks et al. 2005; Pilot et al. 2012).
Moreover, socio-ecological factors also drove genetic
divergence between killer whale populations special-
ized on distinct prey (Hoelzel et al. 1998a; Foote et al.
2011). In our study, we had no direct evidence for dif-
ferent diets among populations and between pelagic
and coastal dolphins. However, localized stomach con-
tent (Scotland and Bay of Biscay) and stable isotope
(Galicia) studies suggested that coastal populations
were feeding on estuarine species, while demersal or
demerso-pelagic fishes mainly found on the shelf-edge
(e.g. hake or blue whiting) were the main prey of pre-
sumably pelagic bottlenose dolphins (Santos et al. 2001;
Spitz et al. 2006; Fernandez et al. 2011). Further diet
studies are needed to document the niche specialization
© 2014 John Wiley & Sons Ltd
868 M. LOUIS ET AL.

of the two groups and investigate the hypotheses
described above.
Effective population size estimates: small coastal vs.large pelagic populations
Effective population sizes were much larger for pelagic
than for coastal populations, which was consistent with
their genetic diversities. As pelagic populations were
likely to be very large, Ne estimates for these popula-
tions were not reliable (Tallmon et al. 2010). In addition,
our sample size for the Pelagic Mediterranean popula-
tion was relatively low for these approaches. For coastal
populations, we had a sufficient number of samples
(N = 77 and 119) and high precision (25 microsatellites)
to get reliable Ne estimates for small populations
(N < 500) (Tallmon et al. 2010). However, our sampling
scheme was not ideal. Two assumptions of both the
linkage disequilibrium and approximate Bayesian com-
putation methods were likely to be violated: closed
populations and discrete generations. For the ‘no immi-
gration’ assumption, the bias could be considered negli-
gible as migration rates were very low and at least for
LDNe, migration rates below 5–10% should have little
effects on Ne estimates (Waples & England 2011). The
‘discrete generations’ assumption was clearly violated.
First, bottlenose dolphins live up to 57 years and are
sexually mature between 5 and 14 years (Wells & Scott
1999). Second, our data, collected across a 22-year time
period, included multiple cohorts and generations. Ne
estimates obtained using samples with overlapping gen-
erations are likely to be biased downward (Waples
2010). Nevertheless, a study comparing different Ne esti-
mate methods for a brown bear population showed that
the Ne estimate obtained in ONeSAMP on multiple
cohorts was similar to the harmonic mean of Ne esti-
mates obtained from single cohorts using another
method, the Estimator by Parentage Assignment (Skrb-
insek et al. 2012). Robinson and Moyer (2013) found that
Ne estimates are closer to the per-generation Ne when
only mature adults are sampled, which resulted to a
downward bias of <15%. If it is not possible to sample
only mature adults, Robinson and Moyer (2013) sug-
gested that as many age classes as possible should be
included in the analyses. As our data set contained
multiple age classes and generations, results were likely
to be biased downward. The downward bias depends
also on the species’ life history. We corrected our esti-
mates for a 15% downward bias (Nec) as a 10–15%
downward bias was observed in a study using LDNe
where mature adult bottlenose dolphins of different
ages were sampled in Florida (R. Waples, personal com-
munication). Last but not least, Ne estimated using
LDNe related to the effective number of breeders Nb
(Waples 2005). Further empirical research is needed on
the relationships between Nb and Ne, which could be
particularly complex when generations overlap (Waples
2010). Nevertheless, the order of magnitude of the bias
should be similar across our data set. Our Nec estimates
are on par with abundance estimates obtained from sur-
veys in areas inhabited by each of the four populations.
The NEA pelagic population abundance estimate from
Scotland to Spain was tens of thousands of individuals
(Hammond et al. 2009, 2013). In the Mediterranean Sea,
abundance was estimated to several thousands of
individuals (Forcada et al. 2004; Gnone et al. 2011).
According to mark–recapture studies, resident coastal
population sizes were likely to be around 600–800
individuals for each of the two populations (M. Louis,
unpublished data for the Normandy resident group,
L�opez 2003; Pesante et al. 2008; see review for Ireland in
Mirimin et al. 2011; Cheney et al. 2012). For these two
coastal populations, the ratio between effective
population sizes and census sizes may be around 5–10%
based on our Nec estimates and abundances from mark–
recapture studies, which is in the lower end of the range
of values found in other species (Palstra & Ruzzante
2008).
Management implications
Coastal populations were isolated and their effective
population size was small in comparison with pelagic
populations. Estimated Nec (range: ~30–80) was close to
the value of Ne = 50 under which Mace and Lande
(1991) proposed that a population is in a critical state.
Low effective population sizes might lead to a low
adaptive potential to environmental changes (Hare et al.
2011). Ecological adaptation to specific habitats is likely
to drive coastal populations’ structure (this study,
Natoli et al. 2005; Rosel et al. 2009), which raises con-
cerns about potential impacts from the currently
increasing at-sea human activities. Habitat degradation
in terms of organic contaminants and noise pollution
from boat traffic and constructions (e.g. Pirotta et al.
2013) could strongly affect locally adapted coastal popu-
lations. In addition, in East England, a genetically dif-
ferentiated population became extinct and the estuary
was never repopulated (Nichols et al. 2007). Several
Special Areas of Conservation have been created
throughout Europe for the management of bottlenose
dolphins; however, some important areas for the spe-
cies still lack conservation measures. Given the vulnera-
bility of small and isolated populations that live within
increasingly disturbed environments, we recommend
extending the habitat protection of the species in Eur-
ope. Moreover, ecotypes should be distinguished in
management plans of the species.
© 2014 John Wiley & Sons Ltd
BOTTLENOSE DOLPHIN ECOTYPES 869
Ecotype delineation and future directions
Our results showing weaker separation between the
pelagic and coastal haplotypes in the NEA found using
324-bp in comparison with 682-bp sequences high-
lighted the importance of using long fragments of the
mitochondrial control region to investigate ecotype
delineation in bottlenose dolphins. We therefore recom-
mend the use of long mitochondrial fragments to inves-
tigate recent and/or fine-scale genetic structure in
delphinids displaying sequence variability levels similar
to bottlenose dolphins.
We employed an original approach to define eco-
types, considering Lowry’s (2012) definition as groups
of ecologically distinct populations. In most studies,
ecotypes were first described through diet, morphology
or spatial distribution and then linked to genetic differ-
entiation (e.g. Hoelzel et al. 1998b; Segura et al. 2006;
Musiani et al. 2007). The latter approach sometimes led
to the definition of ecotypes that were subsequently
found not to be demographically and genetically iso-
lated units (e.g. caribous Serrouya et al. 2012). For cryp-
tic and mobile species for which we have only hints on
ecology, genetic data could be an interesting first step
in ecotype delineation. Previous distribution and diet
studies gave us first clues on the ecological differentia-
tion of coastal and pelagic bottlenose dolphins. Further
investigations on diet specializations using stable iso-
topes and cranial skull features associated with feeding
analyses (Perrin et al. 2011) may be required to further
refine ecotype designations for bottlenose dolphins in
the NEA.
Acknowledgements
We thank Vanessa Becquet and Eric Pante (LIENSs), Eric Tay-
lor and two anonymous reviewers for their constructive com-
ments on the manuscript. We also thank everyone involved in
data collection or collaboration: Joanne O’Brien and Conor
Ryan (GMIT, IWDG), Nigel Monaghan and Ruth Carden
(National Museum of Ireland), Barry McGovern (SAC Inver-
ness) and Julie B�eesau, Gill Murray-Dickson and Paul Thomp-
son (University of Aberdeen), GECC and R�eseau National
Echouages volunteers, Fabien Demaret, Ghislain Doremus, Vin-
cent Ridoux and Olivier Van Canneyt (Pelagis), Sami Hassani
(Oc�eanopolis), Angela Llavona, Ruth Fernandez (CEMMA) and
Paula Mendez-Fernandez (CEMMA and LIENSs), Philippe Ver-
borgh and Ruth Esteban (CIRCE), Joan Gim�enez (EBD-CSIC).
All samples were taken under the relevant permits. We thank
Patricia Rosel for the information on the NWA haplotypes and
Emeline Pettex for the information on bottlenose dolphin sight-
ings of SAMM aerial surveys. We also thank the Molecular
Core Facility at the University of La Rochelle. UK samples
were collected under the aegis of the UK Cetacean Strandings
Investigation Programme, which is funded by Defra and the
Devolved Administrations of Scotland and Wales. Data from
offshore Irish waters were collected on the Cetaceans on the
Frontier cruise thanks to National Marine Research Vessels
Ship-Time Grant Aid Programme 2010 funded under the Sci-
ence Technology and Innovation Programme of National
Development Plan 2007–2013. Biopsy samples in Ireland were
carried out under licence from the National Parks and Wildlife
Service Nos. C104/2011 and DER/Dolphin2012-10. Samples
from Galicia were obtained with the support of Direcci�on Xeral
de Conservaci�on da Natureza-Xunta de Galicia, cofinanced
with European Regional Development Funds (ERDF/FEDER).
Southern Spain samples were collected thanks to LIFE ‘Conser-
vaci�on de Cet�aceos y tortugas de Murcia y Andaluc�ıa’ (LIFE 02
NAT/E/8610). MAS was supported by an FCT postdoctoral
grant (SFRH/BPD/29841/2006). Data collection in the Azores
was funded by projects TRACE (PTDC/MAR/74071/2006) and
MAPCET (M2.1.2/F/012/2011). Funding for sample collection
in France and analyses was provided by Fondation Total,
Agence de l’Eau Seine-Normandie, Fonds de Dotation pour la
Biodiversit�e, Agence des Aires Marines Prot�eg�ees, Association
Nationale de la Recherche et de la Technologie, Direction
R�egionale de l’Environnement, de l’Am�enagement et du Loge-
ment, Minist�ere de l’Ecologie, du D�eveloppement Durable et
de l’Energie and Conseil G�en�eral de la Manche.
References
Amaral AR, Beheregaray LB, Bilgmann K, Boutov D, Freitas L
(2012a) Seascape genetics of a globally distributed, highly
mobile marine mammal: the short-beaked common dolphin
(genus Delphinus). PLoS ONE, 7, e31482.
Amaral AR, Beheregaray LB, Bilgmann K et al. (2012b) Influ-
ences of past climatic changes on historical population struc-
ture and demography of a cosmopolitan marine predator,
the common dolphin (genus Delphinus). Molecular Ecology,
21, 4854–4871.Baker CS, Florez-Gonzalez L, Abernethy B et al. (1998) Mito-
chondrial DNA variation and maternal gene flow among
humpback whales of the southern hemisphere. Marine Mam-
mal Science, 14, 721–737.
Bandelt HJ, Forster P, Rohl A (1999) Median-joining networks
for inferring intraspecific phylogenies. Molecular Biology and
Evolution, 16, 37–48.Begon M, Townsend CR, Harper JL (2006) Ecology from Individ-
uals to Ecosystems. Blackwell Pub, Malden, Massachusetts.
Bernatchez L (1997) Mitochondrial DNA analysis confirms the
existence of two glacial races of rainbow smelt Osmerus mor-
dax and their reproductive isolation in the St Lawrence River
estuary (Qu�ebec, Canada). Molecular Ecology, 6, 73–83.Berrow S, O’Brien J, Groth L, Foley A, Voigh K (2012) Abun-
dance estimate of bottlenose dolphins (Tursiops truncatus) in
the Lower River Shannon candidate Special Area of Conser-
vation, Ireland. Aquatic Mammals, 38, 136–144.Bilgmann K, M€oller LM, Harcourt RG, Kemper CM, Beherega-
ray LB (2011) The use of carcasses for the analysis of ceta-
cean population genetic structure: a comparative study in
two dolphin species. PLoS ONE, 6, e20103.
de Bruyn PJN, Tosh CA, Terauds A (2013) Killer whale eco-
types: is there a global model? Biological Reviews, 88, 62–80.Cantor M, Whitehead H (2013) The interplay between social
networks and culture: theoretically and among whales and
dolphins. Philosophical Transactions of the Royal Society. B, Bio-
logical Sciences, 368, 20120340.
© 2014 John Wiley & Sons Ltd
870 M. LOUIS ET AL.

Certain G, Ridoux V, van Canneyt O, Bretagnolle V (2008) Delphi-
nid spatial distribution and abundance estimates over the shelf
of the Bay of Biscay. Ices Journal of Marine Science, 64, 656–666.
Chen C, Durand E, Forbes F, Francois O (2007) Bayesian clus-
tering algorithms ascertaining spatial population structure: a
new computer program and a comparison study. Molecular
Ecology Notes, 7, 747–756.
Cheney B, Culloch RM, Durban JW et al. (2012) Integrating
multiple data sources to assess the distribution and abun-
dance of bottlenose dolphins Tursiops truncatus in Scottish
waters. Mammal Review, 42, 71–88.
Curry BE, Smith J (1998) Phylogeographic structure of the bot-
tlenose dolphin (Tursiops truncatus): stock identification and
implications for management. In: Molecular Genetics of Marine
Mammals (eds Dizon AE, Chivers SJ, Perrin WF), pp. 227–
247. The Society for Marine Mammalogy, Special Publication
3, Lawrence, Kansas.
Dalebout ML, Robertson KM, Frantzis A et al. (2005) World-
wide structure of mtDNA diversity among Cuvier’s beaked
whales (Ziphius cavirostris): implications for threatened popu-
lations. Molecular Ecology, 14, 3353–3371.
Dionne M, Caron F, Dodson JJ, Bernatchez L (2008) Landscape
genetics and hierarchical genetic structure in Atlantic sal-
mon: the interaction of gene flow and local adaptation.
Molecular Ecology, 17, 2382–2396.
Durand E, Chen E, Francois O (2009a) Tess Version 2.3 - Refer-
ence Manual.
Durand E, Jay F, Gaggiotti OE, Francois O (2009b) Spatial
inference of admixture proportions and secondary contact
zones. Molecular Biology and Evolution, 26, 1963–1973.
Earl DA, Vonholdt BM (2012) STRUCTURE HARVESTER: a
website and program for visualizing STRUCTURE output
and implementing the Evanno method. Conservation Genetics
Resources, 4, 359–361.
Emlen ST, Oring LW (1977) Ecology, sexual selection and the
evolution of mating systems. Science, 197, 215–223.
Evanno G, Regnaut S, Goudet J (2005) Detecting the number of
clusters of individuals using the software STRUCTURE: a
simulation study. Molecular Ecology, 14, 2611–2620.Fernandez R, Santos MB, Pierce GJ et al. (2011) Fine-scale
genetic structure of bottlenose dolphins, Tursiops truncatus,
in Atlantic coastal waters of the Iberian Peninsula. Hydrobio-
logia, 670, 111–125.Fontaine MC, Baird SJE, Piry S et al. (2007) Rise of oceano-
graphic barriers in continuous populations of a cetacean: the
genetic structure of harbour porpoises in Old World waters.
BMC Biology, 5, 30.
Foote AD, Vilstrup JT, de Stephanis R et al. (2011) Genetic dif-
ferentiation among North Atlantic killer whale populations.
Molecular Ecology, 20, 629–641.
Forcada J, Gazo M, Aguilar A, Gonzalvo J, Fernandez-Contre-
ras M (2004) Bottlenose dolphin abundance in the NW Medi-
terranean: addressing heterogeneity in distribution. Marine
Ecology Progress Series, 275, 275–287.
Gaggiotti OE, Bekkevold D, Jorgensen HBH et al. (2009) Disen-
tangling the effects of evolutionary, demographic, and envi-
ronmental factors influencing genetic structure of natural
populations: atlantic herring as a case study. Evolution, 63,
2939–2951.Glaubitz JC (2004) CONVERT: a user-friendly program to
reformat diploid genotypic data for commonly used
population genetic software packages. Molecular Ecology
Notes, 4, 309–310.Gnone G, Bellingeri M, Dhermain F et al. (2011) Distribution,
abundance, and movements of the bottlenose dolphin (Tursi-
ops truncatus) in the Pelagos Sanctuary MPA (north-west
Mediterranean Sea). Aquatic Conservation-Marine and Freshwa-
ter Ecosystems, 21, 372–388.
Goudet J (1995) FSTAT (Version 1.2): a computer program to
calculate F-statistics. Journal of Heredity, 86, 485–486.
Goudet J, Perrin N, Waser P (2002) Tests for sex-biased dis-
persal using bi-parentally inherited genetic markers. Molecu-
lar Ecology, 11, 1103–1114.Greenwood PJ (1980) Mating systems, philopatry and dispersal
in birds and mammals. Animal Behaviour, 28, 1140–1162.Guillot G, Leblois R, Coulon A, Frantz AC (2009) Statistical
methods in spatial genetics. Molecular Ecology, 18, 4734–4756.Guindon S, Gascuel O (2003) A simple, fast, and accurate
algorithm to estimate large phylogenies by maximum
likelihood. Systematic Biology, 52, 696–704.
Hall TA (1999) BioEdit: a user-friendly biological sequence
alignment editor and analysis program for Windows 95/98/
NT. Nucleic Acids Symposium Series, 41, 95–98.Hammond PS, Macleod K, Gillespie D et al. (2009) Cetacean
Offshore Distribution and Abundance in the European
Atlantic (CODA). Final report to the European Commission.
St Andrews: Sea Mammal Research Unit, 42 pp.
Hammond PS, Macleod K, Berggren P et al. (2013) Cetacean
abundance and distribution in European Atlantic shelf
waters to inform conservation and management. Biological
Conservation, 64, 107–122.
Hare MP, Nunney L, Schwartz MK et al. (2011) Understanding
and estimating effective population size for practical applica-
tion in marine species management. Conservation Biology, 25,
438–449.
Hijmans RJ, Williams E, Vennes C (2012) geosphere: Spherical
Trigonometry. R package version 1.2-28. http://CRAN.
R-project.org/package=geosphere.
Hoelzel AR, Dahlheim M, Stern SJ (1998a) Low genetic varia-
tion among killer whales (Orcinus orca) in the eastern North
Pacific and genetic differentiation between foraging special-
ists. Journal of Heredity, 89, 121–128.Hoelzel AR, Potter CW, Best PB (1998b) Genetic differentiation
between parapatric ‘nearshore’ and ‘offshore’ populations of
the bottlenose dolphin. Proceedings of the Royal Society of Lon-
don. Series B, Biological Sciences, 265, 1177–1183.Hoffman EA, Kolm N, Berglund A, Arguello JR, Jones AG (2005)
Genetic structure in the coral-reef-associated Banggai cardinal-
fish, Pterapogon kauderni.Molecular Ecology, 14, 1367–1375.
Holm S (1979) A simple sequentially rejective multiple test pro-
cedure. Scandinavian Journal of Statistics, 6, 65–70.
Jombart T (2008) adegenet: a R package for the multivariate
analysis of genetic markers. Bioinformatics, 24, 1403–1405.
Jombart T, Devillard S, Balloux F (2010) Discriminant analysis
of principal components: a new method for the analysis of
genetically structured populations. BMC Genetics, 11, 94.
Kawecki TJ, Ebert D (2004) Conceptual issues in local adapta-
tion. Ecology Letters, 7, 1225–1241.Konovalov DA, Manning C, Henshaw MT (2004) KINGROUP:
a program for pedigree relationship reconstruction and kin
group assignments using genetic markers. Molecular Ecology
Notes, 4, 779–782.
© 2014 John Wiley & Sons Ltd
BOTTLENOSE DOLPHIN ECOTYPES 871
Latch EK, Dharmarajan G, Glaubitz JC, Rhodes OE (2006) Rela-
tive performance of Bayesian clustering software for infer-
ring population substructure and individual assignment at
low levels of population differentiation. Conservation Genetics,
7, 295–302.
L�opez A (2003) Estatus dos pequenos cet�aceos da plataforma de
Galicia. PhD dissertation, Universidade de Santiago de Com-
postela.
Lowry DB (2012) Ecotypes and the controversy over stages in
the formation of new species. Biological Journal of the Linnean
Society, 106, 241–257.
Mace GM, Lande R (1991) Assessing extinction threats -
towards a reevaluation of IUCN threatened species catego-
ries. Conservation Biology, 5, 148–157.Martien KK, Baird RW, Hedrick NM et al. (2011) Population
structure of island-associated dolphins: evidence from mito-
chondrial and microsatellite markers for common bottlenose
dolphins (Tursiops truncatus) around the main Hawaiian
Islands. Marine Mammal Science, 28, 208–232.
Mead JC, Potter CW (1995) Recognizing two populations of the
bottlenose dolphin (Tursiops truncatus) of the Atlantic coast
of North America - morphologic and ecologic considerations.
IBI Reports (International Marine Biological Research Institute,
Kamogawa, Japan), 5, 31–44.Michalakis Y, Excoffier L (1996) A generic estimation of
population subdivision using distances between alleles with
special reference for microsatellite loci. Genetics, 142,
1061–1064.
Mirimin L, Miller R, Dillane E et al. (2011) Fine-scale popula-
tion genetic structuring of bottlenose dolphins in Irish
coastal waters. Animal Conservation, 14, 342–353.M€oller LM (2011) Sociogenetic structure, kin associations and
bonding in delphinids. Molecular Ecology, 21, 745–764.M€oller L, Valdez FP, Allen S et al. (2011) Fine-scale genetic
structure in short-beaked common dolphins (Delphinus del-
phis) along the East Australian Current. Marine Biology, 158,
113–126.Musiani M, Leonard JA, Cluff HD et al. (2007) Differentiation
of tundra/taiga and boreal coniferous forest wolves: genet-
ics, coat colour and association with migratory caribou.
Molecular Ecology, 16, 4149–4170.Natoli A, Peddemors VM, Hoelzel AR (2004) Population struc-
ture and speciation in the genus Tursiops based on microsat-
ellite and mitochondrial DNA analyses. Journal of
Evolutionary Biology, 17, 363–375.Natoli A, Birkun A, Aguilar A, Lopez A, Hoelzel AR (2005)
Habitat structure and the dispersal of male and female bot-
tlenose dolphins (Tursiops truncatus). Proceedings of the Royal
Society. B, Biological Sciences, 272, 1217–1226.Nichols C, Herman J, Gaggiotti OE et al. (2007) Genetic isola-
tion of a now extinct population of bottlenose dolphins
(Tursiops truncatus). Proceedings of the Royal Society. B, Biologi-
cal Sciences, 274, 1611–1616.O’Brien JM, Berrow SD, Ryan C et al. (2009) A note on long-
distance matches of bottlenose dolphins (Tursiops truncatus)
around the Irish coast using photo-identification. Journal of
Cetacean Research and Management, 11, 71–76.Palstra FP, Ruzzante DE (2008) Genetic estimates of contempo-
rary effective population size: what can they tell us about
the importance of genetic stochasticity for wild population
persistence? Molecular Ecology, 17, 3428–3447.
Pante E, Simon-Bouhet B (2013) Marmap: a package for
importing, plotting and analyzing bathymetric and topo-
graphic data in R. PLoS ONE, 8, e73051.
Peltier H, Dabin W, Daniel P et al. (2012) The significance of
stranding data as indicators of cetacean populations at sea:
modelling the drift of cetacean carcasses. Ecological Indicators,
18, 278–290.
Perrin WF, Thieleking JL, Walker WA, Archer FI, Robertson
KM (2011) Common bottlenose dolphins (Tursiops
truncatus) in California waters: cranial differentiation of
coastal and offshore ecotypes. Marine Mammal Science, 27,
769–792.Pesante G, Evans PGH, Baines ME, McMath M (2008) Abun-
dance and life history parameters of bottlenose dolphin in
Cardigan Bay: monitoring 2005-2007. CCW Marine Monitor-
ing Report 61, 75 pp.
Pilot M, Jedrzejewski W, Sidorovich VE, Meier-Augenstein W,
Hoelzel AR (2012) Dietary differentiation and the evolution
of population genetic structure in a highly mobile carnivore.
PLoS ONE, 7, e39341.
Pirotta E, Laesser EV, Hardaker A et al. (2013) Dredging dis-
places bottlenose dolphins from an urbanised foraging patch.
Marine Pollution Bulletin, 14, 396–402.
Pritchard JK, Stephens M, Donnelly P (2000) Inference of popu-
lation structure using multilocus genotype data. Genetics,
155, 945–959.Queller DC, Goodnight KF (1989) Estimating relatedness using
genetic markers. Evolution, 43, 258–275.
Qu�erouil S, Silva MA, Freitas L et al. (2007) High gene flow in
oceanic bottlenose dolphins (Tursiops truncatus) of the North
Atlantic. Conservation Genetics, 8, 1405–1419.R Core Team (2013) R: A Language and Environment for Statisti-
cal Computing. R Foundation for Statistical Computing,
Vienna, Austria.
Raymond M, Rousset F (1995) GENEPOP (version 1.2) - Popu-
lation genetics software for exact tests and ecumenicism.
Journal of Heredity, 86, 248–249.Robinson JD, Moyer GR (2013) Linkage disequilibrium and
effective population size when generations overlap. Evolu-
tionary Applications, 6, 290–302.
Robinson KP, O’Brien J, Berrow SD et al. (2012) Discrete or not
so discrete: long distance movements by coastal bottlenose
dolphins in UK and Irish waters. Journal of Cetacean Research
and Management, 12, 365–371.
Rosel PE (2003) PCR-based sex determination in Odontocete
cetaceans. Conservation Genetics, 4, 647–649.
Rosel PE, Hansen L, Hohn AA (2009) Restricted dispersal in a
continuously distributed marine species: common bottlenose
dolphins Tursiops truncatus in coastal waters of the western
North Atlantic. Molecular Ecology, 18, 5030–5045.
Rozas J, Rozas R (1999) DnaSP version 3: an integrated pro-
gram for molecular population genetics and molecular evo-
lution analysis. Bioinformatics, 15, 174–175.Sacks BN, Mitchell BR, Williams CL, Ernest HB (2005)
Coyote movements and social structure along a cryptic
population genetic subdivision. Molecular Ecology, 14,
1241–1249.Santos MB, Pierce GJ, Reid RJ et al. (2001) Stomach contents of
bottlenose dolphins (Tursiops truncatus) in Scottish waters.
Journal of the Marine Biological Association of the United King-
dom, 81, 873–878.
© 2014 John Wiley & Sons Ltd
872 M. LOUIS ET AL.

Sargeant BL, Mann J (2009) Developmental evidence for forag-
ing traditions in wild bottlenose dolphins. Animal Behaviour,
78, 715–721.
Segura I, Rocha-Olivares A, Flores-Ramirez S, Rojas-Bracho L
(2006) Conservation implications of the genetic and ecologi-
cal distinction of Tursiops truncatus ecotypes in the Gulf of
California. Biological Conservation, 133, 336–346.
Sellas AB, Wells RS, Rosel PE (2005) Mitochondrial and nuclear
DNA analyses reveal fine scale geographic structure in bot-
tlenose dolphins (Tursiops truncatus) in the Gulf of Mexico.
Conservation Genetics, 6, 715–728.
Serrouya R, Paetkau D, McLellan BN et al. (2012) Population
size and major valleys explain microsatellite variation better
than taxonomic units for caribou in western Canada. Molecu-
lar Ecology, 21, 2588–2601.
Silva MA, Prieto R, Magalhaes S et al. (2008) Ranging pat-
terns of bottlenose dolphins living in oceanic waters:
implications for population structure. Marine Biology, 156,
179–192.
Skrbinsek T, Jelencic M, Waits L et al. (2012) Monitoring the
effective population size of a brown bear (Ursus arctos) popu-
lation using new single-sample approaches. Molecular Ecol-
ogy, 21, 862–875.
Spitz J, Rousseau Y, Ridoux V (2006) Diet overlap between har-
bour porpoise and bottlenose dolphin: an argument in
favour of interference competition for food? Estuarine Coastal
and Shelf Science, 70, 259–270.
de Stephanis R, Cornulier T, Verborgh P et al. (2008) Summer
spatial distribution of cetaceans in the Strait of Gibraltar in
relation to the oceanographic context. Marine Ecology Progress
Series, 353, 275–288.Tallmon DA, Koyuk A, Luikart G, Beaumont MA (2008) ONeS-
AMP: a program to estimate effective population size using
approximate Bayesian computation. Molecular Ecology
Resources, 8, 299–301.Tallmon DA, Gregovich D, Waples RS et al. (2010) When are
genetic methods useful for estimating contemporary abun-
dance and detecting population trends? Molecular Ecology
Resources, 10, 684–692.Tamura K, Nei M (1993) Estimation of the number of nucleo-
tide substitutions in the control region of mitochondrial
DNA in humans and chimpanzees. Molecular Biology and
Evolution, 10, 512–526.Tezanos-Pinto G, Baker CS, Russell K et al. (2009) A worldwide
perspective on the population structure and genetic diversity
of bottlenose dolphins (Tursiops truncatus) in New Zealand.
Journal of Heredity, 100, 11–24.Thorpe RS, Reardon JT, Malhotra A (2005) Common garden
and natural selection experiments support ecotypic differen-
tiation in the Dominican anole (Anolis oculatus). American
Naturalist, 165, 495–504.Turesson G (1922a) The genotypical response of the plant spe-
cies to the habitat. Hereditas, 3, 211–350.Turesson G (1922b) The species and the variety as ecological
units. Hereditas, 3, 100–113.Van Oosterhout C, Hutchinson WF, Wills DPM, Shipley P
(2004) MICRO-CHECKER: software for identifying and cor-
recting genotyping errors in microsatellite data. Molecular
Ecology Notes, 4, 535–538.Walker WA (1981) Geographic variation in morphology and
biology of bottlenose dolphins (Tursiops) in the eastern North
Pacific. NOAA/NMFS Administrative Report LJ-81-0003c, 21
pp.
Waples RS (2005) Genetic estimates of contemporary effective
population size: to what time periods do the estimates
apply? Molecular Ecology, 14, 3335–3352.
Waples RS (2010) Spatial-temporal stratifications in natural
populations and how they affect understanding and estima-
tion of effective population size. Molecular Ecology Resources,
10, 785–796.
Waples RS, Do C (2008) LDNE: a program for estimating effec-
tive population size from data on linkage disequilibrium.
Molecular Ecology Resources, 8, 753–756.Waples RS, Do C (2010) Linkage disequilibrium estimates of
contemporary Ne using highly variable genetic markers: a
largely untapped resource for applied conservation and evo-
lution. Evolutionary Applications, 3, 244–262.Waples RS, England PR (2011) Estimating contemporary effec-
tive population size on the basis of linkage disequilibrium in
the face of migration. Genetics, 189, 633–644.
Wells R, Scott MD (1999) Bottlenose dolphin Tursiops truncatus
(Montagu, 1821). In: Handbook of Marine Mammals (eds Ridg-
way SH, Harrison R), pp. 137–182. Academic Press, San
Diego.
Wilson GA, Rannala B (2003) Bayesian inference of recent
migration rates using multilocus genotypes. Genetics, 163,
1177–1191.
M.L., A.V., C.G. and B.S.B. conceptualized the work
and the analyses. M.L. and T.L. performed laboratory
work. M.L., A.V., H.P. and B.S.B. analysed data. M.L.,
E.A., S.B., A.B., P.C., W.D., R.D., R.dS., F.G., P.G., R.P.
and M.A.S. collected samples. M.L. wrote the paper. All
authors approved the final manuscript.
Data accessibility
DNA sequences GenBank accession nos: KF650783–
KF650837.
Newly developed microsatellites GenBank accession
nos: KF887998–KF888002.
Microsatellite genotypes, DNA sequence alignment
and analysis input files (TESS, DAPC, STRUCTURE and
Arlequin): Dryad: doi:10.5061/dryad.57rr4.
Supporting information
Additional supporting information may be found in the online ver-
sion of this article.
Appendix S1 Map of stranding locations (left) for individuals
for which we applied a drift prediction model and map of
their most likely area of death (right).
Appendix S2a PCR and genotyping conditions for each micro-
satellite locus.
© 2014 John Wiley & Sons Ltd
BOTTLENOSE DOLPHIN ECOTYPES 873

Appendix S2b New microsatellite discovery method.
Appendix S3 PCR conditions for the amplification of a portion
(682-bp) of the mitochondrial control region.
Appendix S4 DAPC settings.
Appendix S5 List of haplotypes obtained from GENBANK and
used for the North Atlantic basin mtDNA haplotype net-
work including information on accession nos (GENBANK),
sampling locations (Origin with NWA = North-West Atlantic)
and the articles where these sequences were reported and/or
analysed.
Appendix S6 BayesAss settings.
Appendix S7 Test for Hardy–Weinberg equilibrium (HWE)
deviation of each locus in each population and in the whole
data set (P-values that are significant after sequential Bonfer-
roni correction are highlighted in boldface).
Appendix S8 Selection of the optimal number of clusters for
the DAPC analysis using the lowest BIC (Bayesian Information
Criterion).
Appendix S9 Evanno plots of the STRUCTURE analyses sepa-
rating (a) the coastal and pelagic groups, (b) the two coastal
populations and (c) the two pelagic populations.
Appendix S10 Mean Deviance Information Criterion (and SD)
values using the 10 replicate TESS runs for each K from 2 to
10.
Appendix S11 Polymorphic nucleotide sites defining the 55
mitochondrial control region haplotypes for bottlenose dol-
phins in the North-East Atlantic.
Appendix S12 Haplotype frequencies by group and popula-
tion.
© 2014 John Wiley & Sons Ltd
874 M. LOUIS ET AL.