Influence of trawling on the behaviour and spatial distribution of Indo-Pacific bottlenose dolphins...
9
Influence of trawling on the behaviour and spatial distribution of Indo-Pacific bottlenose dolphins (Tursiops aduncus) in Moreton Bay, Australia B. Louise Chilvers, Peter J. Corkeron, and Marji L. Puotinen Abstract: Sympatric communities of inshore Indo-Pacific bottlenose dolphins (Tursiops aduncus) have previously been identified within Moreton Bay, southeast Queensland, Australia. The two communities overlap in distribution, yet are almost completely socially segregated and forage in distinctly different ways. The correlation between this social segre- gation, the different foraging strategies, and a human activity (trawling) has previously been demonstrated. This paper investigates the possible effects of trawling on the behaviour and spatial distribution of these two communities. A geo- graphical information system is used to determine the spatial use of each community. The behavioural budgets of both communities showed significantly higher levels of foraging behaviours than reported for most other bottlenose dolphin communities. The spatial use of both communities changed seasonally. These results provide further detail on how hu- man activities may indirectly influence the behaviour and spatial use of free-ranging marine wildlife. Résumé : On a déjà signalé l’existence de deux communautés côtières sympatriques du grand dauphin de l’océan Indien (Tursiops aduncus) dans la baie de Moreton dans le sud-est du Queenland, Australie. Les deux communautés ont des répartitions qui se chevauchent, mais elles sont presque totalement isolées socialement et elles recherchent leur nourriture de façon différente. Une relation entre cette ségrégation sociale, les différentes stratégies alimentaires et l’activité humaine (chalutage) a déjà pu être démontrée. Notre étude examine les effets possibles du chalutage sur le comportement et la répartition spatiale des deux communautés. Un système d’information géographique a permis de déterminer l’utilisation de l’espace par les deux communautés. Les bilans comportementaux des deux communautés ré- vèlent que les comportements de recherche de nourriture sont significativement plus intenses que ce qui est signalé chez la plupart des autres communautés de dauphins. L’utilisation de l’espace par les deux communautés varie d’une saison à une autre. Nos résultats fournissent des précisions sur l’influence indirecte possible des activités humaines sur le comportement et l’utilisation de l’espace par la faune marine en nature. [Traduit par la Rédaction] Chilvers et al. 1955 Introduction Nearshore cetacean communities are being affected by hu- man use of coastal waters, particularly by fisheries activities and habitat modification (Beddington et al. 1985; Barlow et al. 1994; Fertl and Leatherwood 1997). Human activities have both direct and indirect impacts on terrestrial mam- mals, including affecting animals’ densities, behaviour, and social structure (Ross et al. 1993; Berger and Cunningham 1995; Mace et al. 1996; Berger 1999). Anthropogenic con- centrations of food are an example of such a human activity (e.g., Wrangham 1974; Diaz 1994; Mace et al. 1996). Food patches in the marine environment, such as aquaculture farms and active prawn trawlers, can result in deaths of in- shore marine mammals from capture in nets, drowning, or “pest” control measures (Shaughnessy and Payne 1979; Wade 1995, 1998; Julian and Beeson 1998). Consequently, other impacts from marine anthropogenic food sources such as changes in behaviour, social structure, or spatial use of an area tend to have received less attention (Harwood and Croxall 1988; Fertl and Leatherwood 1997). Bottlenose dolphins, Tursiops spp., live in fission–fusion communities, where individuals form unstable schools, and individuals’ patterns of association vary with age and gender (Connor et al. 2000). In line with the recommendations of Connor et al. (1998), we distinguish between “schools”, ag- gregations of animals observed together at one moment in the field, and “groups”, longer term associations demon- strated through analyses of school sightings. Groups can form cohesive aggregations, referred to as “communities” (Connor et al. 2000). Previously, we have shown that from daylight observa- tions, Indo-Pacific bottlenose dolphins (Tursiops aduncus) in Moreton Bay, southeast Queensland, Australia, occur in two Can. J. Zool. 81: 1947–1955 (2003) doi: 10.1139/Z03-195 © 2003 NRC Canada 1947 Received 17 April 2003. Accepted 14 October 2003. Published on the NRC Research Press Web site at http://cjz.nrc.ca on 16 January 2004. B.L. Chilvers, 1,2 P.J. Corkeron, 3 and M.L. Puotinen. School of Tropical Environment Studies and Geography, James Cook University, Townsville, QLD 4811, Australia. 1 Corresponding author (e-mail: [email protected]). 2 Present address: Zoology Department, University of Canterbury, Private Bag 4800, Christchurch, New Zealand. 3 Present address: Institute of Marine Research, Tromsø Branch, Sykehusveien 21, N-9091 Tromsø, Norway.
-
Upload
departmentconservationnewzealand -
Category
Documents
-
view
0 -
download
0
Transcript of Influence of trawling on the behaviour and spatial distribution of Indo-Pacific bottlenose dolphins...
Influence of trawling on the behaviour and spatialdistribution of Indo-Pacific bottlenose dolphins(Tursiops aduncus) in Moreton Bay, Australia
B. Louise Chilvers, Peter J. Corkeron, and Marji L. Puotinen
Abstract: Sympatric communities of inshore Indo-Pacific bottlenose dolphins (Tursiops aduncus) have previously beenidentified within Moreton Bay, southeast Queensland, Australia. The two communities overlap in distribution, yet arealmost completely socially segregated and forage in distinctly different ways. The correlation between this social segre-gation, the different foraging strategies, and a human activity (trawling) has previously been demonstrated. This paperinvestigates the possible effects of trawling on the behaviour and spatial distribution of these two communities. A geo-graphical information system is used to determine the spatial use of each community. The behavioural budgets of bothcommunities showed significantly higher levels of foraging behaviours than reported for most other bottlenose dolphincommunities. The spatial use of both communities changed seasonally. These results provide further detail on how hu-man activities may indirectly influence the behaviour and spatial use of free-ranging marine wildlife.
Résumé : On a déjà signalé l’existence de deux communautés côtières sympatriques du grand dauphin de l’océanIndien (Tursiops aduncus) dans la baie de Moreton dans le sud-est du Queenland, Australie. Les deux communautésont des répartitions qui se chevauchent, mais elles sont presque totalement isolées socialement et elles recherchent leurnourriture de façon différente. Une relation entre cette ségrégation sociale, les différentes stratégies alimentaires etl’activité humaine (chalutage) a déjà pu être démontrée. Notre étude examine les effets possibles du chalutage sur lecomportement et la répartition spatiale des deux communautés. Un système d’information géographique a permis dedéterminer l’utilisation de l’espace par les deux communautés. Les bilans comportementaux des deux communautés ré-vèlent que les comportements de recherche de nourriture sont significativement plus intenses que ce qui est signaléchez la plupart des autres communautés de dauphins. L’utilisation de l’espace par les deux communautés varie d’unesaison à une autre. Nos résultats fournissent des précisions sur l’influence indirecte possible des activités humaines surle comportement et l’utilisation de l’espace par la faune marine en nature.
[Traduit par la Rédaction] Chilvers et al. 1955
Introduction
Nearshore cetacean communities are being affected by hu-man use of coastal waters, particularly by fisheries activitiesand habitat modification (Beddington et al. 1985; Barlow etal. 1994; Fertl and Leatherwood 1997). Human activitieshave both direct and indirect impacts on terrestrial mam-mals, including affecting animals’ densities, behaviour, andsocial structure (Ross et al. 1993; Berger and Cunningham1995; Mace et al. 1996; Berger 1999). Anthropogenic con-centrations of food are an example of such a human activity(e.g., Wrangham 1974; Diaz 1994; Mace et al. 1996). Foodpatches in the marine environment, such as aquaculturefarms and active prawn trawlers, can result in deaths of in-shore marine mammals from capture in nets, drowning, or“pest” control measures (Shaughnessy and Payne 1979;Wade 1995, 1998; Julian and Beeson 1998). Consequently,
other impacts from marine anthropogenic food sources suchas changes in behaviour, social structure, or spatial use of anarea tend to have received less attention (Harwood andCroxall 1988; Fertl and Leatherwood 1997).
Bottlenose dolphins, Tursiops spp., live in fission–fusioncommunities, where individuals form unstable schools, andindividuals’ patterns of association vary with age and gender(Connor et al. 2000). In line with the recommendations ofConnor et al. (1998), we distinguish between “schools”, ag-gregations of animals observed together at one moment inthe field, and “groups”, longer term associations demon-strated through analyses of school sightings. Groups canform cohesive aggregations, referred to as “communities”(Connor et al. 2000).
Previously, we have shown that from daylight observa-tions, Indo-Pacific bottlenose dolphins (Tursiops aduncus) inMoreton Bay, southeast Queensland, Australia, occur in two
Can. J. Zool. 81: 1947–1955 (2003) doi: 10.1139/Z03-195 © 2003 NRC Canada
1947
Received 17 April 2003. Accepted 14 October 2003. Published on the NRC Research Press Web site at http://cjz.nrc.ca on16 January 2004.
B.L. Chilvers,1,2 P.J. Corkeron,3 and M.L. Puotinen. School of Tropical Environment Studies and Geography, James CookUniversity, Townsville, QLD 4811, Australia.
1Corresponding author (e-mail: [email protected]).2Present address: Zoology Department, University of Canterbury, Private Bag 4800, Christchurch, New Zealand.3Present address: Institute of Marine Research, Tromsø Branch, Sykehusveien 21, N-9091 Tromsø, Norway.
J:\cjz\cjz8112\Z03-195.vpJanuary 7, 2004 7:55:23 AM
Color profile: DisabledComposite Default screen
distinct communities (Chilvers and Corkeron 2001). Despitetheir overlapping distributions, these two communities showalmost complete social segregation. Their response to com-mercial prawn trawlers also differs. One community,“trawler dolphins”, are regularly observed foraging with trawl-ers, whereas members of the other community, “nontrawlerdolphins”, have never been observed foraging with trawlers.Trawler dolphins occur in larger schools (regardless of be-havioural state) than do nontrawler dolphins (Chilvers andCorkeron 2001). Despite the different spatial use of thestudy area, the core areas of both communities (measured asthe 50% isopleth of kernel home ranges) overlapped sub-stantially (Chilvers and Corkeron 2001).
Here, we investigate whether trawling activity also influ-ences the behaviour and distribution of the bottlenose dolphincommunities within Moreton Bay using photo-identificationsurveys and geographical information systems (GIS).
Methods
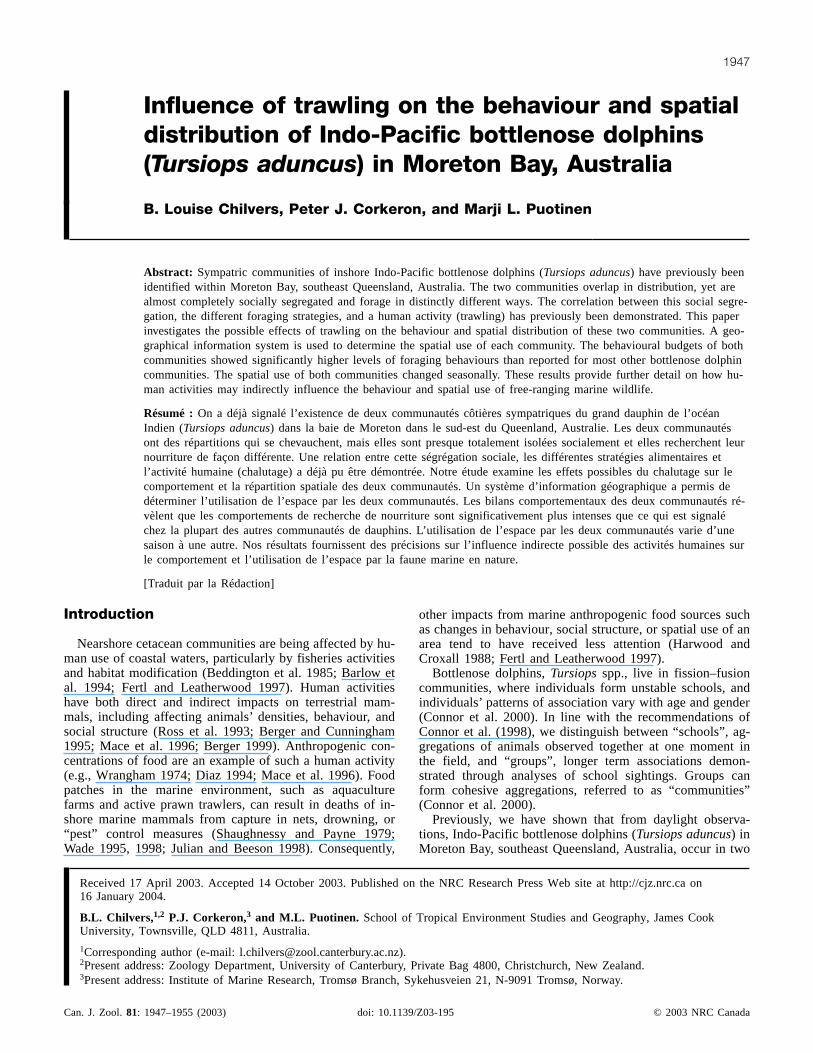
Study areaThe study area covered 350 km2 within the southeast area
of central Moreton Bay (27°20′ S, 153°20′ E) (Fig. 1). Thearea included both extensive sandbank and seagrass bedsand deeper areas where trawlers operate (Fig. 1). Waterdepth varied from <1 to approximately 30 m (Davie 1998).
Distance to shore and water depth are not linearly correlatedwithin Moreton Bay because of its shape and the extensiveareas of sandbanks. Prawn trawlers have worked withinMoreton Bay since the early 1950s. Although some trawlerswork all year within the bay, the most intensive trawling pe-riod is summer, November–May (Quinn 1992).
Photo-identification survey effortBoat-based surveys were conducted at least three times a
month from 30 July 1997 through to 30 November 1998 toobtain photo-identifications and behavioural data. Surveyswere conducted from an 8.5- or 5.8-m research vessel, sys-tematically searching the study area as allowed by theweather, tidal state, and location of boat storage, with theaim of equal coverage of all regions (Fig. 1).
Surveys began between 0600 and 0800 and ended mid-to late afternoon, earlier if winds increased to 15 knots(1 knot = 1.852 km/h) or wave height increased above 1 m.Surveys were conducted at slow planing speeds (~18 km/h),with the vessel slowing to <3 km/h for photography oncebottlenose dolphins were sighted. Weather conditions, boatlocation, and survey track were recorded every 30 min usinga handheld, nondifferentially corrected 12-channel GPS re-ceiver (©1998 GARMIN Corporation, Olathe, Kans.).
Photographs of bottlenose dolphins were taken using35-mm cameras with 300- and 400-mm lenses on slide film
© 2003 NRC Canada
1948 Can. J. Zool. Vol. 81, 2003
Fig. 1. Moreton Bay, southeast Queensland, Australia (centred on 27°15′S, 153°15′ E).
J:\cjz\cjz8112\Z03-195.vpJanuary 7, 2004 7:55:25 AM
Color profile: DisabledComposite Default screen
(Ektachrome 100) at a range of 10 m to animals. We at-tempted to take three photographs of the dorsal fin of eachanimal in a school (excluding calves). GPS location, time,school size, number of calves, and behavioural state were re-corded for each sighting. A school was defined as bottlenosedolphins in close spatial cohesion, individuals being within10 m of any other member (Smolker et al. 1992). Sizes ofschools were estimated independently by at least two peopleat each sighting and the mean number recorded. Calves weredefined as individuals less than three quarters of adult size,usually in close association with an adult.
We classified photographs into four grades according tofocus, contrast between dorsal fin and background, and sizeof dorsal fin in relation to frame. The two top-grade photo-graphs were scanned into a computer and hand drawn into acatalogue and then both used to identify individuals by eye.Only animals for which identification photographs were ob-tained on two occasions using the current catalogue wereclassified as identified.
Because of logistical and environmental constraints,photo-identification surveys could not be evenly distributedacross the entire study area. Therefore, to calculate unbiasedsighting distributions, data were corrected for survey effort.This was achieved by converting the study area into 1 km ×1 km grids, constructing buffer zones around individual boattracks, representing the distance from which animals werevisible from the boats and incorporating the GPS errors ofthe boat locations, and then overlaying these boat tracksonto the study area grid (Chilvers 2001). The number oftimes that each grid cell was crossed within the visibility ofthe boat (within the buffer zone) was counted to estimatesurvey effort within each 1 km × 1 km cell over the entirestudy period. Using the same process, survey effort for thesummer (trawler) and winter (nontrawler) seasons was alsocalculated.
BehaviourDuring photo-identification surveys, we recorded a single
behavioural sample for each sighting before approaching theanimals. The behavioural sample represented the behaviourof ≥50% of the individuals in each group. Groups werescanned from front to back (from the leading to the trailingbottlenose dolphin) to determine behavioural state, henceminimizing the likelihood of resampling the same individualor of being influenced by a particularly obvious individual’sbehaviour. Although group behaviour observations, ratherthan an individual’s behaviour, lowers the sample size ofbehaviours, we used it in this analysis to avoid pseudorepli-cation of behaviours within a group and to ensure independ-ence of data.
The behavioural states of groups were classified into trav-elling behaviour, behaviour associated with foraging, surfaceactive behaviour, and motionless (following Chilvers andCorkeron 2001).
Travelling was defined as swimming in a consistent direc-tion with regular surfacing intervals, with each school mem-ber spaced within three body lengths of another.
Foraging was defined by various activities including divesof changeable direction, frequency, and length in deep water(often preceded by fluke up or peduncle arches), erratic
movements at the surface, indicative of chasing fish, visiblechasing of fish, searching behaviours such as individualsswimming in a line abreast over shallow seagrass beds, longdives (preceded by fluke up or peduncle arches) in the vicin-ity of trawlers’ nets, taking fish discarded from trawlers, andappearing at the surface with prey in the mouth.
Surface active behaviour was defined as active surfacebehaviour that included interactions with other school mem-bers. Units of behaviour observed during socializing in-cluded breaching, fluke slapping, head slapping, and rolling.
Motionless was defined as slow and (or) minimal move-ments at the surface with a tendency for animals to remainor spend long periods of time within the same area.
For analysis, each school was treated as an independentsample, given that only one behavioural sample was takenfor each school. In addition, photo-identification of bottle-nose dolphins during each school observation ensured thatno school was sampled twice in the same day. Chi-squaretests were used to analyse the differences in observed behav-ioural states. Logistic regression models were used to ana-lyse ecological variables to predict binomial responsebehavioural data, with each behaviour recorded as either ob-served or not for each sighting. This technique provides ameasure of the significance of each variable in the model(Wald’s χ2) and the slope of the effect. For each community,only the travelling and foraging behavioural states weretested using the following explanatory variables: season, timeof day, tide, and presence or absence of trawlers (trawlerpresence relevant to trawler dolphin sightings only). Surfaceactive behaviour and motionless behaviour were observedtoo infrequently to justify full analysis using logistic regres-sion. Trawler seasons were defined as trawler-summer(November–April) and nontrawler-winter (May–October).Time of day was morning (0600–1000), midday (1000–1400), and afternoon (1400–1800). Tidal state was placedinto two classes: incoming, the 6 h from low to high tide,and outgoing, the 6 h from high to low tide. Full logistic re-gression models were constructed for each behavioural cate-gory that included all variables.
Community identificationWe identified bottlenose dolphins as a member of the
trawler or nontrawler community based on whether they hadbeen observed to feed in association with trawlers or not(Chilvers and Corkeron 2001). Therefore, school sightingswere identified as either trawler or nontrawler schools usingidentified individuals as indicators. Each school required atleast two identified individuals present to be classified intoeither community, unless the school was a single identifiedanimal or mother and calf pair. School sightings are used inthis analysis to determine community spatial use of thestudy area, reducing the likelihood of problems with pseudo-replication associated with repeated measures on individualsover short temporal scales. This assumption is true if schoolassociations within each community are relatively fluid andschool sightings are restricted to only one sighting each day.Both of these assumptions were assumed to be met throughthe restriction of school sightings to only schools with iden-tified animals and that those animals were only photo-graphed once in any given day and because the association
© 2003 NRC Canada
Chilvers et al. 1949
J:\cjz\cjz8112\Z03-195.vpJanuary 7, 2004 7:55:25 AM
Color profile: DisabledComposite Default screen
analysis demonstrated fission–fusion social structure in thesecommunities (Chilvers and Corkeron 2001). Every sightingwas analysed to determine if any mixed community schoolsoccurred. Only three sightings contained identified individu-als from both communities (Chilvers and Corkeron 2001)and these sightings were excluded from this analysis.
Spatial behaviour of communitiesAll bottlenose dolphin school sightings were converted to
a GIS point coverage. All points were spatially referencedusing a universal transverse mercator coordinate system(±50 m GPS error). The GIS point coverage of school sight-ings was overlaid with the survey effort grid to calculate un-biased estimates of each community’s density distributionwithin the study area. Kernel ranges were generated for eachcommunity from these sighting positions using the animalmovement extension (Hooge and Eichenlaub 1997) inArcView version 3.0 (ESRI Inc. 1998a). Kernel ranges rep-resenting 50% (core area) and 75% (representative range) ofeach community’s sightings were calculated using smooth-ing factors calculated via least squares cross-validation (Sea-man and Powell 1996). Kernel ranges were also generated toinvestigate distribution for each community in relation toseason and to the distribution of trawlers operating withinthe study area during daylight hours, regardless of whetherbottlenose dolphins were following them or not.
For each community, the mean distance to nearest landand mean water depth of all school sightings were analysedusing one-way ANOVAs. Distances to land were calculatedusing the GIS software and were calculated as the distancebetween the school sighting and the nearest point of land.Water depths were taken from the boat’s depth sounder atthe time of each school sighting. We used ArcView version3.0 (ESRI Inc. 1998a) and ArcInfo GIS (ESRI Inc. 1998b)programs for data handling and spatial analysis. Initial geo-
graphical coverage of Moreton Bay was digitized from auniversal transverse mercator 1 : 100 000 bathymetric chart.
Results
Sighting data and survey effortWe made 89 full daytime photo-identification surveys
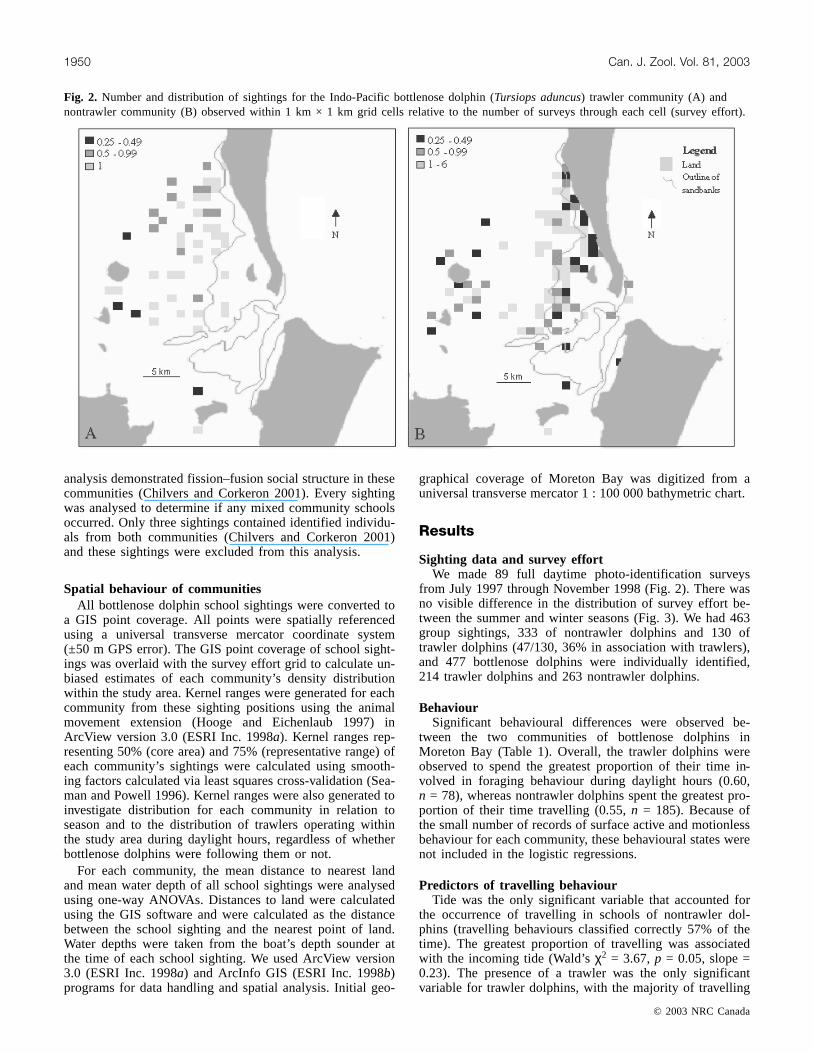
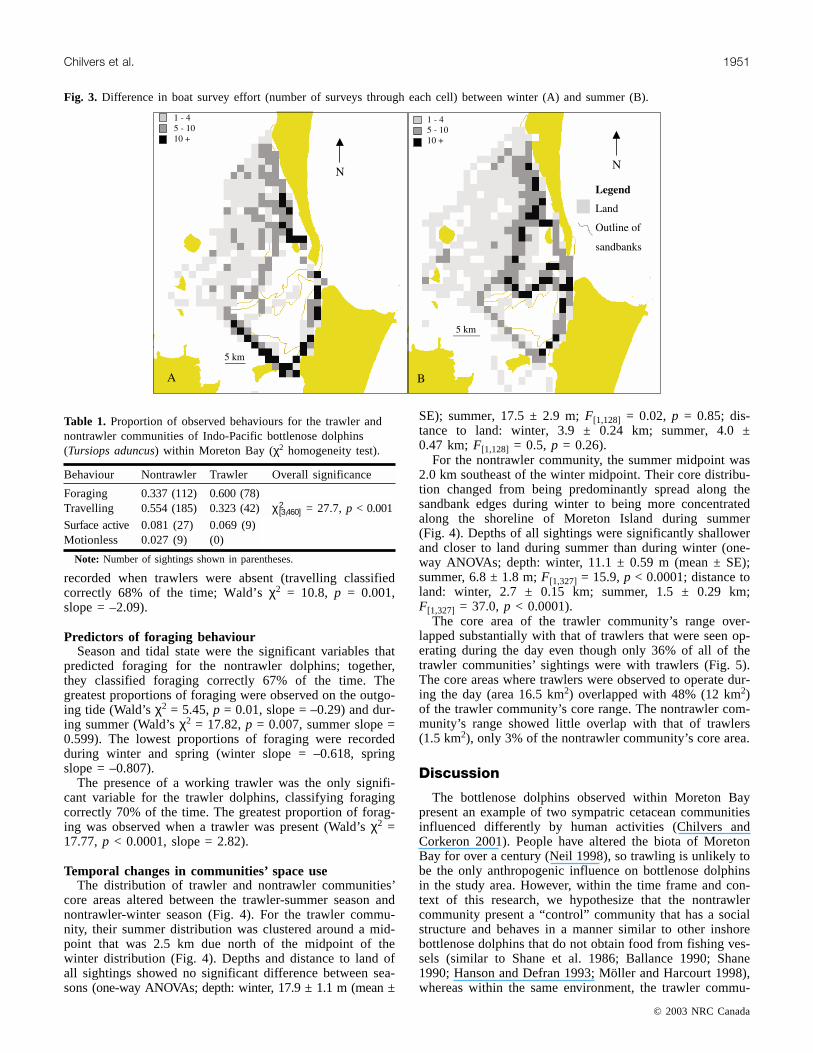
from July 1997 through November 1998 (Fig. 2). There wasno visible difference in the distribution of survey effort be-tween the summer and winter seasons (Fig. 3). We had 463group sightings, 333 of nontrawler dolphins and 130 oftrawler dolphins (47/130, 36% in association with trawlers),and 477 bottlenose dolphins were individually identified,214 trawler dolphins and 263 nontrawler dolphins.
BehaviourSignificant behavioural differences were observed be-
tween the two communities of bottlenose dolphins inMoreton Bay (Table 1). Overall, the trawler dolphins wereobserved to spend the greatest proportion of their time in-volved in foraging behaviour during daylight hours (0.60,n = 78), whereas nontrawler dolphins spent the greatest pro-portion of their time travelling (0.55, n = 185). Because ofthe small number of records of surface active and motionlessbehaviour for each community, these behavioural states werenot included in the logistic regressions.
Predictors of travelling behaviourTide was the only significant variable that accounted for
the occurrence of travelling in schools of nontrawler dol-phins (travelling behaviours classified correctly 57% of thetime). The greatest proportion of travelling was associatedwith the incoming tide (Wald’s χ2 = 3.67, p = 0.05, slope =0.23). The presence of a trawler was the only significantvariable for trawler dolphins, with the majority of travelling
© 2003 NRC Canada
1950 Can. J. Zool. Vol. 81, 2003
Fig. 2. Number and distribution of sightings for the Indo-Pacific bottlenose dolphin (Tursiops aduncus) trawler community (A) andnontrawler community (B) observed within 1 km × 1 km grid cells relative to the number of surveys through each cell (survey effort).
J:\cjz\cjz8112\Z03-195.vpJanuary 7, 2004 7:55:26 AM
Color profile: DisabledComposite Default screen
recorded when trawlers were absent (travelling classifiedcorrectly 68% of the time; Wald’s χ2 = 10.8, p = 0.001,slope = –2.09).
Predictors of foraging behaviourSeason and tidal state were the significant variables that
predicted foraging for the nontrawler dolphins; together,they classified foraging correctly 67% of the time. Thegreatest proportions of foraging were observed on the outgo-ing tide (Wald’s χ2 = 5.45, p = 0.01, slope = –0.29) and dur-ing summer (Wald’s χ2 = 17.82, p = 0.007, summer slope =0.599). The lowest proportions of foraging were recordedduring winter and spring (winter slope = –0.618, springslope = –0.807).
The presence of a working trawler was the only signifi-cant variable for the trawler dolphins, classifying foragingcorrectly 70% of the time. The greatest proportion of forag-ing was observed when a trawler was present (Wald’s χ2 =17.77, p < 0.0001, slope = 2.82).
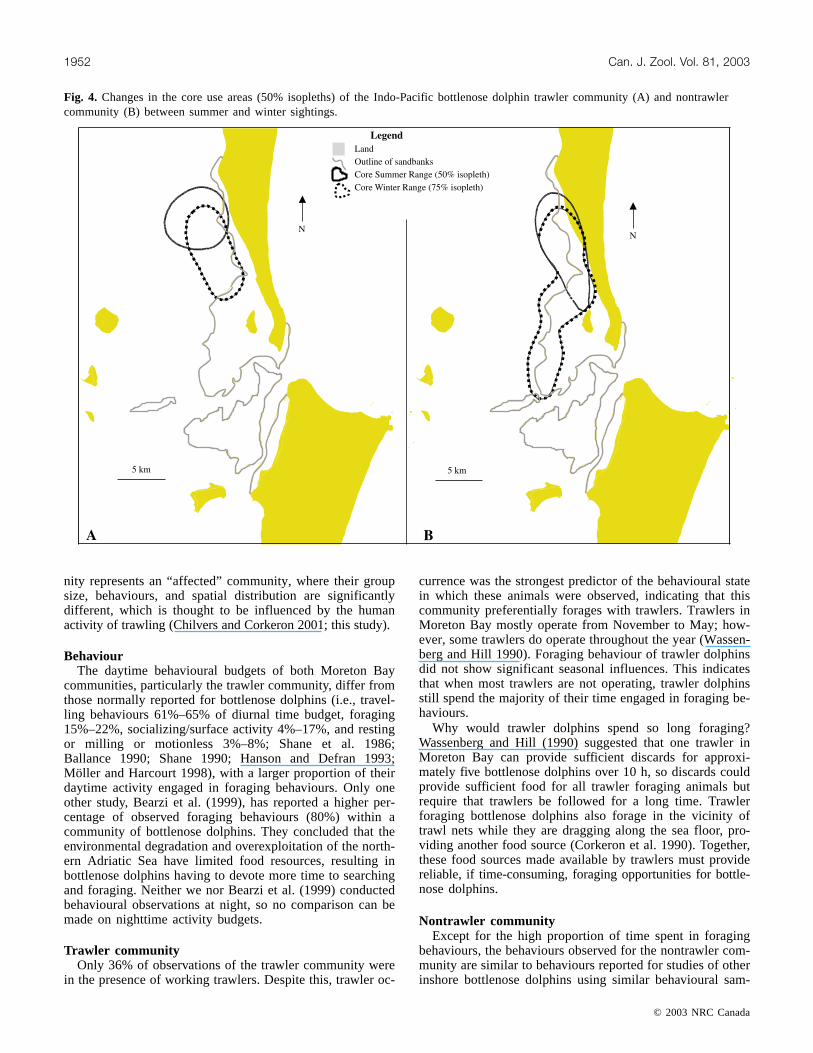
Temporal changes in communities’ space useThe distribution of trawler and nontrawler communities’
core areas altered between the trawler-summer season andnontrawler-winter season (Fig. 4). For the trawler commu-nity, their summer distribution was clustered around a mid-point that was 2.5 km due north of the midpoint of thewinter distribution (Fig. 4). Depths and distance to land ofall sightings showed no significant difference between sea-sons (one-way ANOVAs; depth: winter, 17.9 ± 1.1 m (mean ±
SE); summer, 17.5 ± 2.9 m; F[1,128] = 0.02, p = 0.85; dis-tance to land: winter, 3.9 ± 0.24 km; summer, 4.0 ±0.47 km; F[1,128] = 0.5, p = 0.26).
For the nontrawler community, the summer midpoint was2.0 km southeast of the winter midpoint. Their core distribu-tion changed from being predominantly spread along thesandbank edges during winter to being more concentratedalong the shoreline of Moreton Island during summer(Fig. 4). Depths of all sightings were significantly shallowerand closer to land during summer than during winter (one-way ANOVAs; depth: winter, 11.1 ± 0.59 m (mean ± SE);summer, 6.8 ± 1.8 m; F[1,327] = 15.9, p < 0.0001; distance toland: winter, 2.7 ± 0.15 km; summer, 1.5 ± 0.29 km;F[1,327] = 37.0, p < 0.0001).
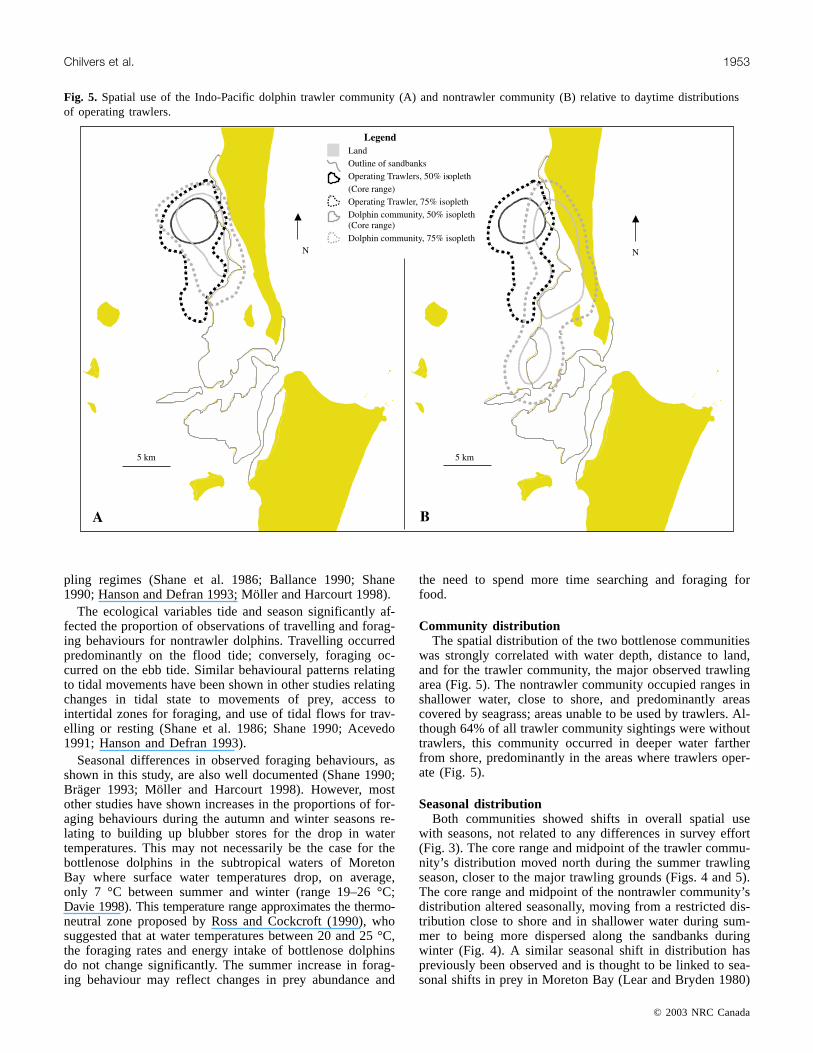
The core area of the trawler community’s range over-lapped substantially with that of trawlers that were seen op-erating during the day even though only 36% of all of thetrawler communities’ sightings were with trawlers (Fig. 5).The core areas where trawlers were observed to operate dur-ing the day (area 16.5 km2) overlapped with 48% (12 km2)of the trawler community’s core range. The nontrawler com-munity’s range showed little overlap with that of trawlers(1.5 km2), only 3% of the nontrawler community’s core area.
Discussion
The bottlenose dolphins observed within Moreton Baypresent an example of two sympatric cetacean communitiesinfluenced differently by human activities (Chilvers andCorkeron 2001). People have altered the biota of MoretonBay for over a century (Neil 1998), so trawling is unlikely tobe the only anthropogenic influence on bottlenose dolphinsin the study area. However, within the time frame and con-text of this research, we hypothesize that the nontrawlercommunity present a “control” community that has a socialstructure and behaves in a manner similar to other inshorebottlenose dolphins that do not obtain food from fishing ves-sels (similar to Shane et al. 1986; Ballance 1990; Shane1990; Hanson and Defran 1993; Möller and Harcourt 1998),whereas within the same environment, the trawler commu-
© 2003 NRC Canada
Chilvers et al. 1951
Behaviour Nontrawler Trawler Overall significance
Foraging 0.337 (112) 0.600 (78)Travelling 0.554 (185) 0.323 (42) χ[3,460]
2 = 27.7, p < 0.001
Surface active 0.081 (27) 0.069 (9)Motionless 0.027 (9) (0)
Note: Number of sightings shown in parentheses.
Table 1. Proportion of observed behaviours for the trawler andnontrawler communities of Indo-Pacific bottlenose dolphins(Tursiops aduncus) within Moreton Bay (χ2 homogeneity test).
Fig. 3. Difference in boat survey effort (number of surveys through each cell) between winter (A) and summer (B).
J:\cjz\cjz8112\Z03-195.vpJanuary 7, 2004 7:55:27 AM
Color profile: DisabledComposite Default screen
nity represents an “affected” community, where their groupsize, behaviours, and spatial distribution are significantlydifferent, which is thought to be influenced by the humanactivity of trawling (Chilvers and Corkeron 2001; this study).
BehaviourThe daytime behavioural budgets of both Moreton Bay
communities, particularly the trawler community, differ fromthose normally reported for bottlenose dolphins (i.e., travel-ling behaviours 61%–65% of diurnal time budget, foraging15%–22%, socializing/surface activity 4%–17%, and restingor milling or motionless 3%–8%; Shane et al. 1986;Ballance 1990; Shane 1990; Hanson and Defran 1993;Möller and Harcourt 1998), with a larger proportion of theirdaytime activity engaged in foraging behaviours. Only oneother study, Bearzi et al. (1999), has reported a higher per-centage of observed foraging behaviours (80%) within acommunity of bottlenose dolphins. They concluded that theenvironmental degradation and overexploitation of the north-ern Adriatic Sea have limited food resources, resulting inbottlenose dolphins having to devote more time to searchingand foraging. Neither we nor Bearzi et al. (1999) conductedbehavioural observations at night, so no comparison can bemade on nighttime activity budgets.
Trawler communityOnly 36% of observations of the trawler community were
in the presence of working trawlers. Despite this, trawler oc-
currence was the strongest predictor of the behavioural statein which these animals were observed, indicating that thiscommunity preferentially forages with trawlers. Trawlers inMoreton Bay mostly operate from November to May; how-ever, some trawlers do operate throughout the year (Wassen-berg and Hill 1990). Foraging behaviour of trawler dolphinsdid not show significant seasonal influences. This indicatesthat when most trawlers are not operating, trawler dolphinsstill spend the majority of their time engaged in foraging be-haviours.
Why would trawler dolphins spend so long foraging?Wassenberg and Hill (1990) suggested that one trawler inMoreton Bay can provide sufficient discards for approxi-mately five bottlenose dolphins over 10 h, so discards couldprovide sufficient food for all trawler foraging animals butrequire that trawlers be followed for a long time. Trawlerforaging bottlenose dolphins also forage in the vicinity oftrawl nets while they are dragging along the sea floor, pro-viding another food source (Corkeron et al. 1990). Together,these food sources made available by trawlers must providereliable, if time-consuming, foraging opportunities for bottle-nose dolphins.
Nontrawler communityExcept for the high proportion of time spent in foraging
behaviours, the behaviours observed for the nontrawler com-munity are similar to behaviours reported for studies of otherinshore bottlenose dolphins using similar behavioural sam-
© 2003 NRC Canada
1952 Can. J. Zool. Vol. 81, 2003
Fig. 4. Changes in the core use areas (50% isopleths) of the Indo-Pacific bottlenose dolphin trawler community (A) and nontrawlercommunity (B) between summer and winter sightings.
J:\cjz\cjz8112\Z03-195.vpJanuary 7, 2004 7:55:27 AM
Color profile: DisabledComposite Default screen
pling regimes (Shane et al. 1986; Ballance 1990; Shane1990; Hanson and Defran 1993; Möller and Harcourt 1998).
The ecological variables tide and season significantly af-fected the proportion of observations of travelling and forag-ing behaviours for nontrawler dolphins. Travelling occurredpredominantly on the flood tide; conversely, foraging oc-curred on the ebb tide. Similar behavioural patterns relatingto tidal movements have been shown in other studies relatingchanges in tidal state to movements of prey, access tointertidal zones for foraging, and use of tidal flows for trav-elling or resting (Shane et al. 1986; Shane 1990; Acevedo1991; Hanson and Defran 1993).
Seasonal differences in observed foraging behaviours, asshown in this study, are also well documented (Shane 1990;Bräger 1993; Möller and Harcourt 1998). However, mostother studies have shown increases in the proportions of for-aging behaviours during the autumn and winter seasons re-lating to building up blubber stores for the drop in watertemperatures. This may not necessarily be the case for thebottlenose dolphins in the subtropical waters of MoretonBay where surface water temperatures drop, on average,only 7 °C between summer and winter (range 19–26 °C;Davie 1998). This temperature range approximates the thermo-neutral zone proposed by Ross and Cockcroft (1990), whosuggested that at water temperatures between 20 and 25 °C,the foraging rates and energy intake of bottlenose dolphinsdo not change significantly. The summer increase in forag-ing behaviour may reflect changes in prey abundance and
the need to spend more time searching and foraging forfood.
Community distributionThe spatial distribution of the two bottlenose communities
was strongly correlated with water depth, distance to land,and for the trawler community, the major observed trawlingarea (Fig. 5). The nontrawler community occupied ranges inshallower water, close to shore, and predominantly areascovered by seagrass; areas unable to be used by trawlers. Al-though 64% of all trawler community sightings were withouttrawlers, this community occurred in deeper water fartherfrom shore, predominantly in the areas where trawlers oper-ate (Fig. 5).
Seasonal distributionBoth communities showed shifts in overall spatial use
with seasons, not related to any differences in survey effort(Fig. 3). The core range and midpoint of the trawler commu-nity’s distribution moved north during the summer trawlingseason, closer to the major trawling grounds (Figs. 4 and 5).The core range and midpoint of the nontrawler community’sdistribution altered seasonally, moving from a restricted dis-tribution close to shore and in shallower water during sum-mer to being more dispersed along the sandbanks duringwinter (Fig. 4). A similar seasonal shift in distribution haspreviously been observed and is thought to be linked to sea-sonal shifts in prey in Moreton Bay (Lear and Bryden 1980)
© 2003 NRC Canada
Chilvers et al. 1953
Fig. 5. Spatial use of the Indo-Pacific dolphin trawler community (A) and nontrawler community (B) relative to daytime distributionsof operating trawlers.
J:\cjz\cjz8112\Z03-195.vpJanuary 7, 2004 7:55:27 AM
Color profile: DisabledComposite Default screen

and changes in predator distributions in bay systems such asMoreton Bay (Simpfendorfer 1992).
ConclusionPrevious studies in this part of Moreton Bay assumed that
the bottlenose dolphins in the area formed one community(e.g., Corkeron 1997). Our spatial data show that twosympatric communities use this area in different ways andthat trawling influences the segregation in spatial use ofthese two communities (Chilvers and Corkeron 2001). Ourbehavioural data demonstrate that “natural” factors (seasonand tide) are the significant influences on the behaviour ofthe nontrawler community, whereas an anthropogenic factor(trawling) is the main influence on the behaviour of thetrawler community.
The distribution, social structure, and behaviour of bottle-nose dolphins are related, reflecting the physical environ-ment and the local distribution of abundance of prey andpredators (Shane 1990; Heithaus and Dill 2002). Studiesfrom geographically disjunct communities of bottlenose dol-phins have demonstrated social and behavioural adaptationsto their local environment, with influences being both natu-ral and anthropogenic (Ballance 1990; Shane 1990; Bearzi etal. 1997; Defran and Weller 1999). Our work in MoretonBay (this study; Chilvers and Corkeron 2001) indicates thathuman activities are influencing the social structure, behav-iour, and distribution of inshore delphinids within it. In thelong term, these differences in the trawler community’s be-haviour and distribution may impact on community size, de-mography, and genetic structure (Fertl and Leatherwood1997; Storz 1999; Chilvers and Corkeron 2001). Humanshave been, and continue to, reshape coastal ecosystems (e.g.,Jackson 2001) and in doing so are not only directly affectingcoastal marine mammals but, as this paper shows, can alsoindirectly affect their social structure and behaviour.
Acknowledgments
Funding for this research came from the Australian Re-search Council Small Grants Scheme and the Earthwatch In-stitute. We thank Grant Shearwin for skippering our researchvessel and numerous volunteers for field support includingEarthwatch Institute volunteers. The Queensland Parks andWildlife Service provided permits for this work.
References
Acevedo, A. 1991. Behaviour and movements of bottlenose dol-phins, Tursiops truncatus, in the entrance to Ensenada De LaPaz, Mexico. Aquat. Mamm. 17: 137–147.
Asper, E.D. 1975. Techniques of live capture of small cetaceans. J.Fish. Res. Board Can. 32: 1191–1196.
Ballance, L.T. 1990. Residence patterns, group organisation andsurfacing associations of bottlenose dolphins in Kino Bay, Gulfof California, Mexico. In The bottlenose dolphin. Edited by S.Leatherwood and R.R. Reeves. Academic Press, San Diego, Ca-lif. pp. 267–284.
Barlow, J., Baird, R.W., Heyning, J.E., Wynne, K., Manville, A.M.,Lowry, L.F., Hanan, D., Sease, J., and Burkanov, V.N. 1994. Areview of cetacean and pinniped mortality in coastal fisheriesalong the west coast of the USA and Canada and the east coast
of the Russian Federation. Rep. Int. Whaling Comm. Spec. Is-sue, 15: 405–426.
Bearzi, G., Notarbartolo di Sciara, G., and Poltiti, E. 1997. Socialecology of bottlenose dolphins in Kvarneric (Northern AdriaticSea). Mar. Mammal Sci. 13: 650–668.
Bearzi, G., Poltiti, E., and Di Scara, G.N. 1999. Diurnal behaviourof free-ranging bottlenose dolphins in the Kvarneric (NorthernAdriatic Sea). Mar. Mammal Sci. 15: 1065–1097.
Beddington, J.R., Beverton, R.J.H., and Lavigne, D.M. 1985. Ma-rine mammals and fisheries. George Allen and Unwin, London,U.K.
Berger, J. 1999. Anthropogenic extinction of top carnivores andinterspecific animal behaviour: implication of the rapid decoup-ling of a web involving wolves, bears moose and ravens. Proc.R. Soc. Lond. B Biol. Sci. 266: 2261–2267.
Berger, J., and Cunningham, C. 1995. Predation, sensitivity andsex — why female black rhinoceroses outlive males. Behav.Ecol. 6: 57–64.
Bräger, S. 1993. Diurnal and seasonal behaviour patterns of bottle-nose dolphins (Tursiops truncatus). Mar. Mammal Sci. 9: 434–437.
Chilvers, B.L. 2001. Behavioural ecology of bottlenose dolphins,Tursiops aduncus, in S.E. Queensland, Australia: adaptations toecological and anthropogenic influences. Ph.D. thesis, JamesCook University, Townsville, Queensland, Australia.
Chilvers, B.L., and Corkeron, P.J. 2001. Trawling and bottlenosedolphins’ social structure. Proc. R. Soc. Lond. B Biol. Sci. 268:1901–1905.
Connor, R.C., Mann, J., Tyack, P.L., and Whitehead, H. 1998. So-cial evolution in toothed whales. Trends Ecol. Evol. 13: 228–232.
Connor, R.C., Wells, R.S., Mann, J., and Read, A.J. 2000. Thebottlenose dolphin, social relationships in a fission–fusion soci-ety. In Cetacean societies: field studies of dolphins and whales.Edited by J. Mann, R.C. Connor, P.L. Tyack, and H. Whitehead.University of Chicago Press, Chicago. pp. 199–218.
Corkeron, P.J. 1997. Bottlenose dolphins, Tursiops truncatus, insouth-east Queensland waters: social structures and conservationbiology. In Marine mammal research in the Southern Hemi-sphere 1: Status, ecology and medicine. Edited by M. Hindelland C. Kemper. Surrey Beatty and Sons, Chipping Norton, U.K.pp. 1–10.
Corkeron, P.J., Bryden, M.M., and Hedstrom, K.E. 1990. Feedingby bottlenose dolphins in association with trawling operations inMoreton Bay, Australia. In The bottlenose dolphin. Edited byS. Leatherwood and R.R. Reeves. Academic Press, San Diego,Calif. pp. 329–336.
Davie, P. 1998. Wild guide to Moreton Bay, wildlife and habitatsof a beautiful Australian coast — Noosa to the Tweed. QueenslandMuseum, Brisbane, Queensland, Australia.
Defran, R.H., and Weller, D.W. 1999. Occurrence, distribution, sitefidelity and school size of bottlenose dolphins (Tursiops trunca-tus) off San Diego, California. Mar. Mammal Sci. 15: 366–380.
Diaz, M. 1994. Granivory in cereal crop landscapes of centralSpain — environmental correlates of the foraging impact of ro-dents, birds and ants. Acta Oecol. Int. J. Ecol. 15: 739–751.
ESRI Inc. 1998a. ArcView. Version 3.0 [computer program]. ESRIInc., Redlands, Calif.
ESRI Inc. 1998b. ArcInfo [computer program]. ESRI Inc., Redlands,Calif.
Fertl, D., and Leatherwood, S. 1997. Cetacean interactions withtrawlers: a preliminary review. J. Northwest Atl. Fish. Sci. 22:219–248.
© 2003 NRC Canada
1954 Can. J. Zool. Vol. 81, 2003
J:\cjz\cjz8112\Z03-195.vpJanuary 7, 2004 7:55:27 AM
Color profile: DisabledComposite Default screen

Hanson, M.T., and Defran, R.H. 1993. The behaviour and feedingecology of the Pacific coast bottlenose dolphin, Tursiopstruncatus. Aquat. Mamm. 19: 127–142.
Harwood, J., and Croxall, J.P. 1988. The assessment of competitionbetween seals and commercial fisheries in the North Sea and theAntarctic. Mar. Mammal Sci. 4: 13–33.
Heithaus, M.R., and Dill, L.M. 2002. Food availability and tigershark predation risk influence bottlenose dolphin habitat use.Ecology, 83: 480–491.
Hooge, P.N., and Eichenlaub, B. 1997. Animal movement exten-sion to Arcview 1.1. Alaska Biological Science Centre, U.S.Geological Survey, Anchorage, Alaska.
Jackson, J.B.C. 2001. What was natural in the coastal oceans?Proc. Natl. Acad. Sci. U.S.A. 98: 5411–5418.
Julian, F., and Beeson, M. 1998. Estimates of marine mammal, tur-tle, and seabird mortality for two California gillnet fisheries1990–1995. Fish. Bull. U.S. 96: 271–284.
Lear, R.J., and Bryden, M.M. 1980. A study of the bottlenose dol-phins, Tursiops truncatus, in eastern Australian waters. Occas.Pap. 4, Australian National Parks and Wildlife Service, Can-berra, Australia. pp. 1–25.
Mace, R.D., Waller, J.S., Manley, T.L., Lyon, L.J., and Zuuring, H.1996. Relationships among bears, roads and habitat in the SwanMountains, Montana. J. Appl. Ecol. 33: 1395–1404.
Möller, L.M., and Harcourt, R.G. 1998. Social dynamics and activ-ity patterns of bottlenose dolphins, Tursiops truncatus, in JervisBay, southeastern Australia. Proc. Linn. Soc. N.S.W. 120: 181–189.
Neil, D.T. 1998. Moreton Bay and its catchment: seascape andlandscape, development and degradation. In Moreton Bay andcatchment. Edited by I.R. Tibbetts, N.J. Hall, and W.C.Dennison. School of Marine Science, University of Queensland,Brisbane, Queensland, Australia. pp. 3–54.
Quinn, R.H. 1992. Fisheries resources of Moreton Bay. QueenslandFish Management Authority, Brisbane, Queensland, Australia.
Ross, C., Srivastava, A., and Pirta, R.S. 1993. Human influenceson the population density of Hanuman langurs, Presbytisentellus, and Rhesus Macaques, Macaca mulatta, in Shimla, In-dia. Biol. Conserv. 65: 159–163.
Ross, G.J.B., and Cockcroft, V.G. 1990. Comments on Australianbottlenose dolphins and the taxonomic status of Tursiops adun-cus (Ehrenberg, 1832). In The bottlenose dolphin. Edited byS. Leatherwood and R.R. Reeves. Academic Press, San Diego,Calif. pp. 101–128.
Seaman, D.E., and Powell, R.A. 1996. An evaluation of the accu-racy of kernel density estimators for home range analysis. Ecol-ogy, 77: 2075–2085.
Shane, S.H. 1990. Behaviour and ecology of the bottlenose dolphinat Sanibel Island, Florida. In The bottlenose dolphin. Edited byS. Leatherwood and R.R. Reeves. Academic Press, San Diego,Calif. pp. 245–265.
Shane, S.H., Wells, R., and Würsig, B. 1986. Ecology, behaviourand social organisation of the bottlenose dolphin: a review. Mar.Mammal Sci. 2: 34–63.
Shaughnessy, P.D., and Payne, A.I.L. 1979. Incidental mortality ofCape fur seals during trawl fishing activities in South Africanwaters. S. Afr. Fish. Bull. 12: 20–25.
Simpfendorfer, C. 1992. Biology of tiger sharks (Galeocerdocuvier) caught by the Queensland shark meshing program offTownsville, Australia. Aust. J. Mar. Freshw. Res. 43: 33–43.
Smolker, R.A., Richards, A.F., Connor, R.C., and Pepper, J.W.1992. Sex differences in patterns of association among IndianOcean bottlenose dolphins. Behaviour, 12: 38–69.
Storz, J.F. 1999. Genetic consequences of mammalian social struc-ture. J. Mammal. 80: 553–569.
Wade, P.R. 1995. Revised estimated of incidental kill of dolphins(Delphinidae) by the purse-seine tuna fishery in the eastern trop-ical pacific, 1959–1972. Fish. Bull. U.S. 93: 345–354.
Wade, P.R. 1998. Calculating limits to the allowable human-causedmortality of cetaceans and pinnipeds. Mar. Mammal Sci. 14: 1–37.
Wassenberg, T.J., and Hill, B.J. 1990. Partitioning of material dis-carded from prawn trawlers in Moreton Bay. Aust. J. Mar.Freshw. Res. 41: 27–36.
Wrangham, R.W. 1974. Artificial feeding of chimpanzees and ba-boons in their natural habitat. Anim. Behav. 22: 83–94.
© 2003 NRC Canada
Chilvers et al. 1955
J:\cjz\cjz8112\Z03-195.vpJanuary 7, 2004 7:55:27 AM
Color profile: DisabledComposite Default screen