Effects of Cd injection on osmoregulation and stress indicators in freshwater 3 Nile tilapia 4 5
27
1 CBP ms.23614 Revised – part C 1 2 Effects of Cd injection on osmoregulation and stress indicators in freshwater 3 Nile tilapia 4 5 Sofia Garcia-Santos 1* , Sandra Monteiro 1 , Salman Malakpour- 6 Kolbadinezhad 2 , António Fontaínhas-Fernandes 1 , Jonathan Wilson 2 7 8 1 Centre for the Research and Technology of Agro-Environmental and Biological Sciences, 9 CITAB, University of Trás-os-Montes and Alto Douro, UTAD, Quinta de Prados, 5000-801 Vila 10 Real, Portugal 11 2 Centro Interdisciplinar de Investigação Marinha e Ambiental (CIIMAR), Rua dos Bragas 289, 12 4050-123 Porto, Portugal. 13 14 *Corresponding author 15 Address: DeBA, UTAD, Apartado1013, 5001-801 Vila Real 16 Telephone: +351 259 350 245; 17 E-mail address: [email protected] 18 19 Abstract 20 Freshwater tilapia (Oreochromis niloticus) were intraperitoneally injected with sublethal doses 21 of cadmium (1.25 or 2.5 mg Cd kg -1 body mass) and sampled after 1, 4 and 7 days in order to 22 evaluate the mechanisms of Cd toxicity at physiological and biochemical levels. Cd levels were 23 significantly elevated in the gill and kidney following injection however levels in kidney 24 continued to accumulate while in gills levels either did not change or decreased with time. Cd 25 caused a generalized stress condition as indicated by an increase in blood glucose, lactate and 26 cortisol levels as well as an oxidative stress indicated by increases in lipid peroxidation and 27 protein carbonyl content. Furthermore, tilapia exhibited impairment in their osmoregulatory 28 status based on the fall in plasma sodium levels. Concerning ion regulatory disruption, the 29 kidney was the most affected organ since there was a generalized increase in renal Na + /K + - 30 ATPase activity after 1 day of exposure to Cd followed by a significant decrease by day 7. This 31 study provides some insights into the mechanisms of Cd toxicity at physiological and 32 biochemical levels and complements previously reported findings on O. niloticus. The 33
-
Upload
independent -
Category
Documents
-
view
0 -
download
0
Transcript of Effects of Cd injection on osmoregulation and stress indicators in freshwater 3 Nile tilapia 4 5
1
CBP ms.23614 Revised – part C 1
2
Effects of Cd injection on osmoregulation and stress indicators in freshwater 3
Nile tilapia 4
5
Sofia Garcia-Santos1*, Sandra Monteiro1, Salman Malakpour-6
Kolbadinezhad2, António Fontaínhas-Fernandes1, Jonathan Wilson2 7
8 1 Centre for the Research and Technology of Agro-Environmental and Biological Sciences, 9
CITAB, University of Trás-os-Montes and Alto Douro, UTAD, Quinta de Prados, 5000-801 Vila 10
Real, Portugal 11 2 Centro Interdisciplinar de Investigação Marinha e Ambiental (CIIMAR), Rua dos Bragas 289, 12
4050-123 Porto, Portugal. 13
14
*Corresponding author 15
Address: DeBA, UTAD, Apartado1013, 5001-801 Vila Real 16
Telephone: +351 259 350 245; 17
E-mail address: [email protected] 18
19
Abstract 20
Freshwater tilapia (Oreochromis niloticus) were intraperitoneally injected with sublethal doses 21
of cadmium (1.25 or 2.5 mg Cd kg-1 body mass) and sampled after 1, 4 and 7 days in order to 22
evaluate the mechanisms of Cd toxicity at physiological and biochemical levels. Cd levels were 23
significantly elevated in the gill and kidney following injection however levels in kidney 24
continued to accumulate while in gills levels either did not change or decreased with time. Cd 25
caused a generalized stress condition as indicated by an increase in blood glucose, lactate and 26
cortisol levels as well as an oxidative stress indicated by increases in lipid peroxidation and 27
protein carbonyl content. Furthermore, tilapia exhibited impairment in their osmoregulatory 28
status based on the fall in plasma sodium levels. Concerning ion regulatory disruption, the 29
kidney was the most affected organ since there was a generalized increase in renal Na+/K+-30
ATPase activity after 1 day of exposure to Cd followed by a significant decrease by day 7. This 31
study provides some insights into the mechanisms of Cd toxicity at physiological and 32
biochemical levels and complements previously reported findings on O. niloticus. The 33
2
disruption of ion homeostasis, alterations in Na+/K+-ATPase activity and oxidative damage are 34
effects of Cd exposure that can be integrated in a comprehensive model for Cd impacts. 35
36
Keywords: Cadmium; Osmoregulation; Stress; Oreochromis niloticus 37
38
1. Introduction 39
40
Cadmium (Cd) is one of the most toxic metals in the environment. It is mainly produced as a by-41
product from mining, smelting and refining sulfide ores of zinc, coal combustion, electroplating 42
processes, and the production of iron, steel, pigments, fertilizers and pesticides (USEPA, 2001). 43
In freshwater, total dissolved Cd is usually less than 0.5 µg L-1 (Pan et al., 2010). In Europe, 44
levels of Cd in stream water range from < 0.002 µg L-1 to 1.25 µg L-1 for the most pristine sites 45
and contaminated sites, respectively (Pan et al., 2010). However, within the aquatic environment 46
Cd can reacts with other constituents and be removed from solution into sediments. In fact, 47
Lawrence et al. (1996) in a multi-year lake dosing experiment demonstrated that less than 1% of 48
the Cd input remained in the water column. Continuous Cd input into the aquatic environment 49
builds reservoirs of Cd in sediment that may be released back into the water column when 50
aquatic loadings are reduced (Stephenson et al., 1996). 51
In freshwater fishes, Cd accumulates maximally in the kidney, gills, liver and gut, to a lesser 52
extent in the blood, but not significantly in the brain or muscle, although the pattern of 53
accumulation differs depending on the exposure route (McGeer et al, 2011). This biologically 54
nonessential metal is regarded as a potential risk for fishes and other aquatic organisms. In 55
fishes, Cd can exert a wide range of pathological effects including oxidative damage within 56
tissues (Almeida et al., 2001, Cao et al., 2012, Roméo et al., 2000 and Shi et al., 2005). 57
Specifically, Cd may trigger redox reactions that generate free radicals and reactive oxygen 58
species (ROS) (Cao et al., 2012), resulting in lipid peroxidation (LPO) and protein carbonyl 59
(PCO) formation which are two important indicators of oxidative damage of macromolecules 60
induced by ROS (Shi et al., 2005). 61
In aquatic animals, Cd exposure has been shown to change plasma stress parameters (i.e 62
cortisol, glucose) (Garcia-Santos et al., 2011, Lin et al., 2011 and Pratap and Wendelaar Bonga, 63
1990), interfere in ion regulation (Firat and Kargin, 2010, McGeer et al., 2000 and Pratap et al., 64
1989), inhibit enzyme activities (Lionetto et al., 2000 and Sastry and Subhadra, 1985), and cause 65
skeletal deformities and calcium (Ca) balance disturbances (Kessabi et al., 2009 and Muramoto, 66
1981). In fact, Cd exposure has been associated with disruption of important ions like Ca2+ and 67
Na+. For example, waterborne Cd exposure of rainbow trout at 3 µg L-1 resulted in significant 68
3
reductions in whole-body Na+ and Ca2+ levels over the first 4 days of exposure (McGeer et al., 69
2000). Similarly, a 10 µg L-1 Cd exposure of tilapia (O. mossambicus) resulted in reductions in 70
plasma Na+ and Ca2+ (Fu et al., 1990). Moreover, Cd has been shown to cause 71
morphopathological changes of varying severity in different fish organs (Garcia-Santos et al., 72
2007, 2006, Giari et al., 2007, Liu et al., 2011 and Thophon et al., 2003). 73
In their natural habitat, fish would be exposed to harmful substances in the water through 74
respiration, contact and feeding. Uptake via these routes is subject in variable biotic and abiotic 75
factors. In the present study, Cd was administered via intraperitoneal injection. Although 76
intraperitoneal metal injection does not mimick realistic environmental exposure, it has been 77
employed in fish studies to investigate the direct effects of cadmium (Sparus aurata, Garcia-78
Santos et al., 2011; Dicentrarchus labrax, Roméo et al., 2000; Lithognathus mormyrus, 79
Yudkovski et al., 2008; Oncorhynchus mykiss, Castaño et al., 1998; Pagrus major, Kuroshima, 80
1995). However, with this method fish receive a well defined Cd dose and the confounding 81
factors in metal uptake are avoided, making it possible to directly interpret changes in 82
physiological parameters. The sublethal Cd concentrations used in this work were selected based 83
on published studies in other fish species (Sparus aurata: 1.25 mg Cd kg-1, Garcia-Santos et al. 84
2011; 2.5 mg Cd kg-1; Vaglio and Landriscina, 1999, Oncorhynchus mykiss (0.5, 1, 2 mg Cd kg-85 1, Castaño et al., 1998) and Dicentrarchus labrax (LC50 3 mg kg-1; Roméo et al., 2000). 86
Nile tilapia (Oreochromis niloticus) belong to one of the most important groups of fishes, and 87
are recognized as good biological models, due to their ease in handling, culture, and 88
maintenance in the laboratory (e.g. Almeida et al., 2001 and Wu et al., 1999). The present work 89
was conducted to determine the impact of Cd on physiological stress, and osmoregulatory 90
performance of tilapia, O. niloticus. For this purpose, this study was conducted as a 91
multivariable approach examining osmoregulatory variables (gill and kidney Na+/K+-ATPase 92
expression and plasma ion levels), metabolic indicators (plasma lactate, triglycerides and 93
glucose values), stress response indicators (plasma cortisol, heat shock proteins - HSPs, lipid 94
peroxidation - LPO and protein carbonyl - PCO formation) and cell proliferation markers 95
(proliferating cell nuclear antigen - PCNA expression). 96
97
2. Material and Methods 98
99
2.1. Fish 100
Nile tilapia, O. niloticus, Linnaeus (1758) were raised in the Aquaculture Station of the 101
University of Trás-os-Montes and Alto Douro (UTAD, Vila Real, Portugal) in 600 L aerated 102
tanks supplied with a continuous flow (5 L min-1) of dechlorinated tap water (from the 103
4
university) whose quality parameters (84/449/EEC Directives, Annex 5, method c1) were 104
maintained by mechanical and biological filtration (pH 6.5-7.5; dissolved oxygen, 89%; 105
alkalinity, 38.15 mg L-1 as HCO3; conductivity, 63 mS cm-1; hardness, 48.45 mg L-1 CaCO3; 106
Na+, 21.10 mg L-1; K+, 5.5 mg L-1; Ca2+, 7.2 mg L-1; Mg2+, 7.4 mg L-1; Cl-, 34.30 mg L-1; NO3-, 107
99.75 mg L-1; NO2-, n.d.; suspended solids, n.d.). Fish were maintained under a controlled 108
photoperiod of 12 h:12 h (dark:light) and were fed daily to satiation with commercial fish food 109
(Aquasoja-Sorgal, Ovar, Portugal: fiber 1.9%, lipid 4.3%, crude protein 37.2%, Ca2+ 2.2%, P 110
1.4% and vitamins A, C, D3 and E). 111
112
2.2. Experimental design and sampling 113
Before the experiment, tilapia (n=120, 28.6 ± 1.5 g body mass) were randomly divided into one 114
of four groups in triplicate (Ctr0, Cd0, Cd1.25, Cd2.5), in 200 L recirculating tanks with the 115
same water and photoperiod conditions as used in the stock tanks. 116
After one week of acclimation, the fish were fasted for 24h, anaesthetized with 2-117
phenoxyethanol (0.5mL/L), weighed and injected intraperitoneally with cadmium solutions 118
(1.25 and 2.5 mg Cd kg-1 body mass in the form of CdCl2 in 0.9% NaCl) or vehicle alone (0.9% 119
NaCl) as a sham control (Cd0) and returned to the aquaria. The Ctr0 group was not subjected to 120
any treatment and was used to evaluate possible manipulation effects. 121
At days 1, 4 and 7, ten animals per treatment were anaesthetized with 2-phenoxyethanol (1 mL 122
L-1 water) and blood was collected by caudal puncture using heparinized needles and syringes. 123
Plasma was separated by centrifugation (3 min at 10,000 g) and aliquots were immediately 124
frozen in liquid nitrogen and stored at -80 ºC. Fish were euthanized by decapitation and from 125
each, small pieces from the posterior portion of the kidney and the gill arches were taken using 126
fine-point scissors. The tissues were placed in SEI buffer (300 mM sucrose/20 mM EDTA/50 127
mM imidazole, pH 7.5), and frozen at -80 ºC for later Na+/K+-ATPase activity measurement. 128
Livers were excised and their wet mass obtained to calculate the hepatosomatic index (HSI). 129
Larger samples of gill and kidney were taken, and frozen directly in liquid nitrogen and stored at 130
-80ºC for Cd concentration determination, immunoblotting, and for assessing oxidative stress 131
parameters. Additionally, a sample of white muscle was taken to analyze the percentage of 132
water in this tissue. 133
During the experiment no mortality was observed and the described experiments complied with 134
European Guidelines (86/609/EU) for the correct use of laboratorial animals. 135
136
2.3. Analytical techniques 137
2.3.1. Muscle water content, Condition factor (K), Hepatosomatic index 138
5
Muscle water content was determined by subtracting the dry mass of the sample (70ºC for 2 139
days) from the initial wet mass and dividing the product by the initial wet mass. 140
Condition was determined according to Abowei et al. (2009). K= 100M/L3, where K= condition 141
factor; M = fish mass (g); L= length of fish (cm). 142
The hepatosomatic index (HSI) was calculated according to Barton et al. (2002). HSI = (Liver 143
mass (g) / Body mass (g)) × 100. 144
145
2.3.2. Metal analysis 146
To measure Cd accumulation, the tissues (gill and kidney) were first dried at 60 ºC for 24 h until 147
a constant mass was reached. Samples were then transferred into glass tubes and digested in a 148
1:2 perchloric acid and nitric acid (Merck) mixture at 120 ºC. After complete digestion (visual 149
inspection), samples were cooled and diluted with distilled water to be within the range of 150
standards that were prepared from stock standard solutions of Cd (Merck). All samples were 151
completely clear and not filtered. Cd concentrations, expressed as µg Cd g-1 of dry mass, were 152
determined by atomic absorption spectrophotometry (Unicam 939, Kassel, Germany). 153
154
2.3.3. Plasma analysis 155
Glucose, lactate, triglyceride and calcium levels were measured with commercial kits from 156
Spinreact (Cat # 41010, 1001330, 1001310 and 1001060, respectively; Sant Esteve de Bas, 157
Girona, Spain) adapted to 96-well microplates. Plasma sodium (Na+) levels were determined in 158
diluted samples (1:500) by flame photometry (Jenway, UK). 159
Plasma cortisol levels were measured by Enzyme Linked ImmunoSorbent Assay (ELISA), using 160
a kit (Neogen ® Corporation) following extraction with diethylether. 161
162
2.3.4. LPO and PCO content assays 163
Oxidative damage to lipids and proteins were evaluated according to Ferreira et al. (2008). 164
Briefly, gill samples were homogenized in ice-cold 100 mM potassium phosphate buffer, 1 mM 165
Na2EDTA, pH 7.5 and the supernatants were obtained by centrifugation. Lipid peroxidation was 166
measured as the amount of malondialdehyde (MDA) determined by the thiobarbituric acid-167
reactive substance (TBARS) method. Tissue homogenate was incubated with trichloroacetic 168
acid (TCA) 100%, and after centrifugation the supernatant was incubated at 100°C, for 30 min, 169
with thiobarbituric acid (TBA) 1%, NaOH 0.05 mol L−1 and butylated hydroxytoluene (BHT) 170
0.025%. The absorbance was measured at 532 nm. Lipid peroxidation (LPO) is expressed as 171
mmol MDA g-1 of tissue. For protein carbonyl determination, the homogenate was reacted with 172
1 2,4-dinitrophenylhydrazine (DNPH) in hydrochloric acid (HCl) for 1h at room temperature, in 173
6
the dark, and precipitated with 20% TCA. After centrifugation, the pelleted protein was washed 174
twice in ethanol/ethylacetate (1:1), then resuspended in a guanidine hydrochloride solution and 175
incubated at 37 ºC until complete dissolution. The carbonyl content was measured 176
spectrophotometrically at 370 nm. Blank tubes were also incubated with 2N HCl without DNPH 177
for each sample. The results are expressed as nmoles of carbonyl mg-1 protein using the molar 178
extinction coefficient of 22000 M cm−1. All assays were performed in duplicate. 179
180
2.3.5. ATPase assay 181
Gill and kidney Na+/K+-ATPase activities were measured using a microplate technique 182
developed by McCormick (1993) and described by Garcia-Santos et al. (2011). Briefly, gill and 183
kidney tissues were homogenized in SEID buffer (SEI buffer with 0.1% deoxycholic acid; 184
Sigma) and centrifuged at 5000 g for 30 s. The homogenates were pipetted into a 96-well plate 185
and each sample had two wells containing a solution with ouabain (1.0 mM; Sigma-Aldrich 186
Chemical Co., St. Louis, MO, USA) and two wells containing an assay mixture without 187
ouabain. The kinetic assay was read at 340 nm for 10 min with intermittent mixing. Ouabain 188
sensitive ATPase activity was detected by the enzymatic coupling of ATP dephosphorylation to 189
NADH oxidation. The assay was performed in a microplate reader (EL-340i, Bio-Tek 190
Instruments) using DeltaSoft3 software for Macintosh (BioMetallics Inc.). 191
Protein concentrations were measured using the method of Bradford (1976) adapted for 192
microplates, with a bovine serum albumin (BSA) standard, and activity expressed as µmol ADP 193
mg-1 protein h-1. 194
195
2.3.6. Western blotting 196
For western blotting, proteins were prepared from gill and kidney tissue and analysis was done 197
as described by Garcia-Santos et al. (2011). Briefly, tissues were homogenized as described for 198
the ATPase assay and prepared in Laemmli’s buffer (Laemmli, 1970). Before loading onto gels, 199
the protein concentrations were adjusted to 1 mg mL-1. Samples were separated by SDS-PAGE 200
using a MiniProtean III system (Bio-Rad) and then equilibrated in transfer buffer and protein 201
bands transferred to polyvinylidenefluoride (PVDF) membranes, using a semidry transfer 202
apparatus (Bio-Rad). The membranes were rinsed in TTBS (0.05% Tween-20 in Tris buffered 203
saline, pH 7.4) and blocked with 5% powdered skim milk in TTBS. Following rinsing, 204
membranes were probed with the primary antibody diluted in 1% BSA in TTBS. After another 205
series of rinses, membranes were incubated with a horseradish peroxidase-conjugated secondary 206
antibody (goat anti-rabbit or anti-mouse) diluted in TTBS. Positive controls have been run on 207
separate membranes using the same antibodies. The blots were detected by chemiluminescence 208
7
(Immobilon Milipore) using an imager (LAS4000mini Fuji-Film, Tokyo Japan). Images were 209
imported into an image analysis software program for band semi-quantification (SigmaScan Pro, 210
Image analysis, Version 5.0.0, SPSS Chicago, IL, USA). 211
Na+/K+-ATPase α-subunit was detected using the panspecific α5 mouse monoclonal antibody 212
(Takeyasu et al., 1988). The antibody was obtained as culture supernatant from the 213
Developmental Hybridoma Bank, University of Iowa, Iowa City, under contract N01-HD-7-214
3263 from the National Institute of Child Health and Human Development. We have already 215
used this antibody in different studies of teleost fishes (Garcia-Santos et al., 2011, 2006 and 216
Wilson et al., 2004). The proliferating cell nuclear antigen (PCNA) was detected using a mouse 217
monoclonal antibody (clone PC10; Abcam, Cambridge, UK) that has previously been shown to 218
react with teleost fish PCNA (e.g. Dang et al., 2000, Garcia-Santos et al., 2011 and Monteiro et 219
al., 2009;). Heat shock protein (HSP70) was detected with a mouse monoclonal antibody (clone 220
BRM-22; Sigma), which has been used before in teleost fish tissues (e.g. Burkhardt-Holm et al., 221
1998, Garcia-Santos et al., 2011). 222
223
2.4. Statistical analysis 224
Data are expressed as means ± SEM. Prior to statistical analysis, normality and homogeneity of 225
variance were assessed. Differences among groups were tested by two-way ANOVA. When 226
significant differences were obtained, multiple comparisons were carried out using the post hoc 227
Student Neuman Keuls (SNK) test or the non-parametric equivalent (Kruskal-Wallis two-way 228
ANOVA on the ranks and Dunn’s test) (SigmaStat 3.0, SPSS). The fiducial limit was set at 229
0.05. 230
231
2.5. Ethics statement 232
The animals used in the research described in this paper were treated in accordance with the 233
Portuguese Animals and Welfare Law (Decreto-Lei n◦ 197/96) approved by the Portuguese 234
Parliament in 1996 and with the European directive 2010/63/UE approved by the European 235
Parliament in 2010. Institutional animal approval by CIIMAR/UP and General Veterinary 236
Direction was granted for this study. 237
238
3. Results 239
240
For all measured parameters there were no differences between sham fish injected with vehicle 241
alone (0.9% NaCl, Cd0) and those not subjected to any manipulation (Ctr0) during the 242
8
experiment (data not shown). Since sham injection had no effect we considered the Cd0 as the 243
control group in this experiment. 244
245
3.1. Mortality, morphometric parameters and muscle water content 246
No mortality occurred in either control or Cd-treated groups after injection or during 247
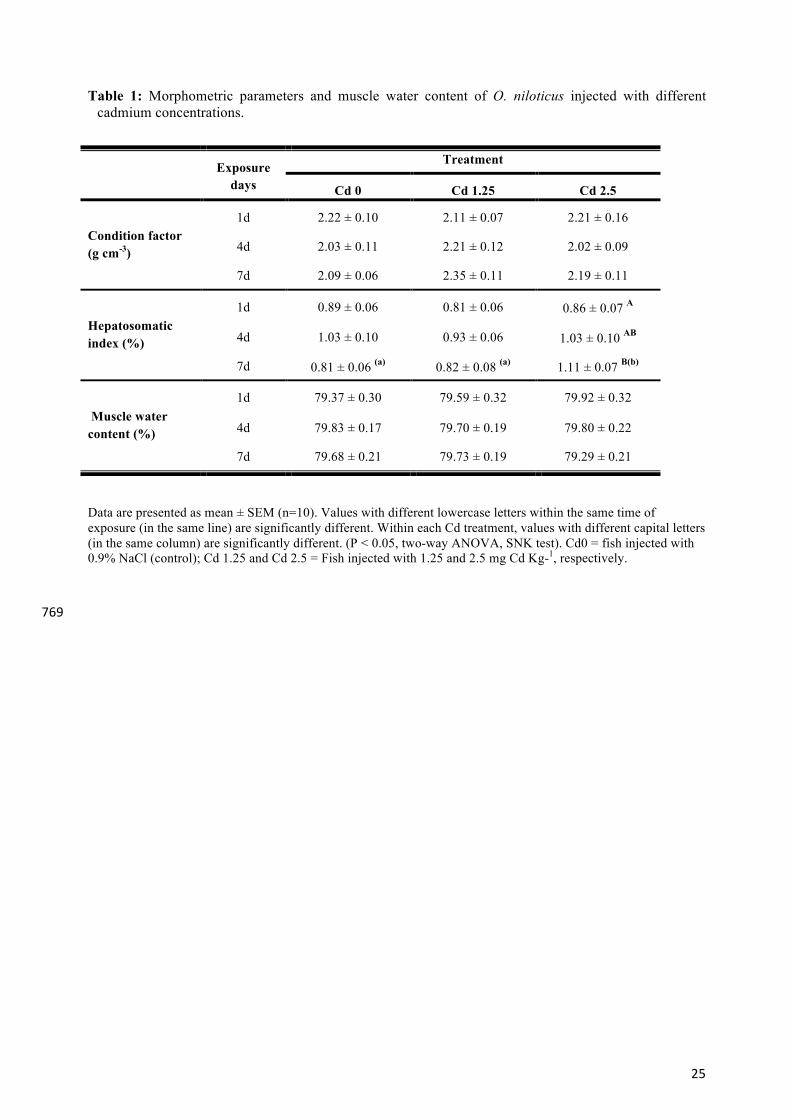
experimental time course. The fish condition factor did not change significantly with Cd 248
treatment or time of exposure. In contrast, the hepatosomatic index increased significantly 7 249
days after injection in the 2.5 mg Cd kg-1 group (Table 1). 250
There were no significant differences in muscle water content, an indicator of osmoregulatory 251
status, between exposure groups over time or between any Cd-treatment groups (Table 1). The 252
mean muscle water content was 79.4 ± 0.17%. 253
254
3.2. Tissue metal content 255
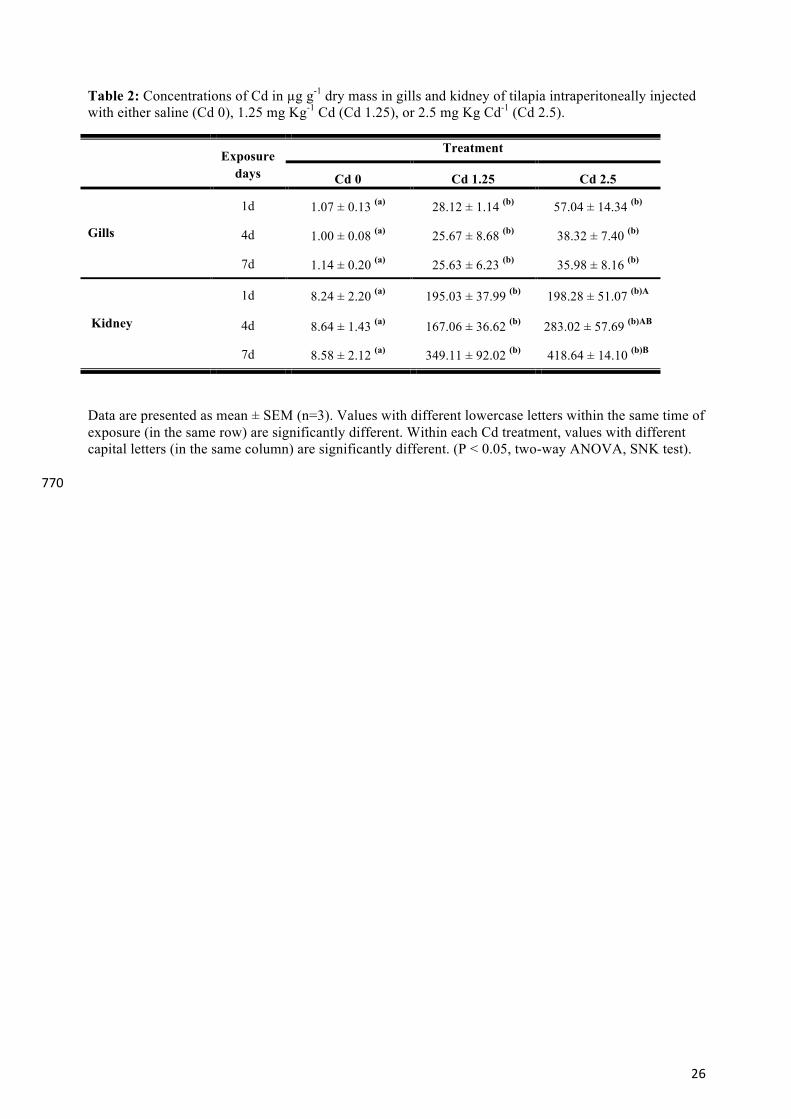
Cadmium concentrations measured in the gill and kidney of tilapia at 1, 4 and 7 days after i.p. 256
injection are presented in Table 2. The Cd concentrations in tissues from the control animals 257
were similar over the entire experiment period. Cd i.p. injection significantly increased Cd 258
levels in both tissues; however, over time gill and kidney showed differences in Cd level 259
patterns with levels in kidney being almost 10-fold higher than in gill. Kidney was the main 260
accumulation organ, with Cd levels reaching a maximum value of 418.64 ± 14.10 µg g-1 dry 261
mass 7 days after injection of 2.5 mg kg-1 Cd. In contrast, although not statistically different, 262
following i.p. injection gill Cd levels decreased by 37% over time at the higher dose (Cd 2.5) 263
from an initial Cd concentration of 57.04 ± 14.34 µg g-1 dry mass at day 1 or at the lower dose 264
(Cd 1.25) remained unchanged over time. 265
266
3.3. Plasma parameters 267
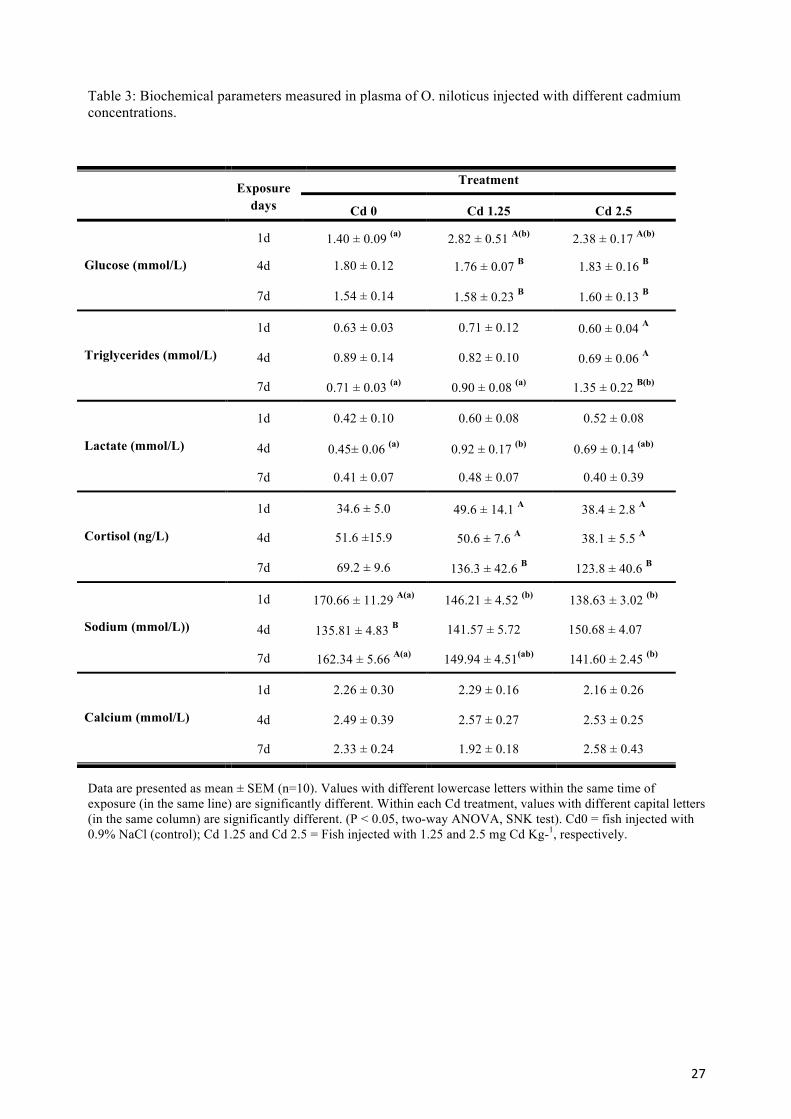
The results presented in Table 3 show that there were statistically significant interactions 268
between the Cd dose and the time after injection for some plasma parameters. The effect of 269
different levels of Cd on glucose and triglycerides concentrations was dependent on time of 270
exposure. Cadmium treatment transiently enhanced plasma glucose concentration after 1 day of 271
exposure, after which it returned to basal levels. Regarding plasma triglycerides, there was no 272
significant effect of Cd treatment after 1 and 4 days of exposure. However at 2.5 mg Cd kg-1, 273
and a longer exposure (7days), triglycerides increased significantly. 274
Four days after injection, plasma lactate levels showed a tendency to increase. However, only 275
the dose of 1.25 mg Cd kg-1 resulted in a statistically significant increase relative to the control 276
9
at day 4. After longer exposure (7 days), lactate levels returned to baseline values and no 277
significant treatment effects were noted. 278
Although within each sampling time no differences in plasma cortisol levels were detected 279
among Cd concentrations, the time of Cd exposition significantly affected plasma cortisol 280
levels. In fact, 7 days after the injection (at both concentrations) fish showed a significant 281
increase compared to the earlier exposure time. 282
No significant differences in plasma calcium levels with either Cd treatment or time of exposure 283
were observed. In contrast, plasma sodium levels showed a decreasing trend with Cd treatment 284
at days 1 and 7 after injection. The decrease was statistically significant on both days to 2.5 Cd 285
concentration and only on day 1 for the lower Cd concentration. On day 4, no differences 286
between the different Cd treatments were observed and, the control group showed a significant 287
decrease in plasma sodium levels when compared with those obtained at the other two sampling 288
times. 289
290
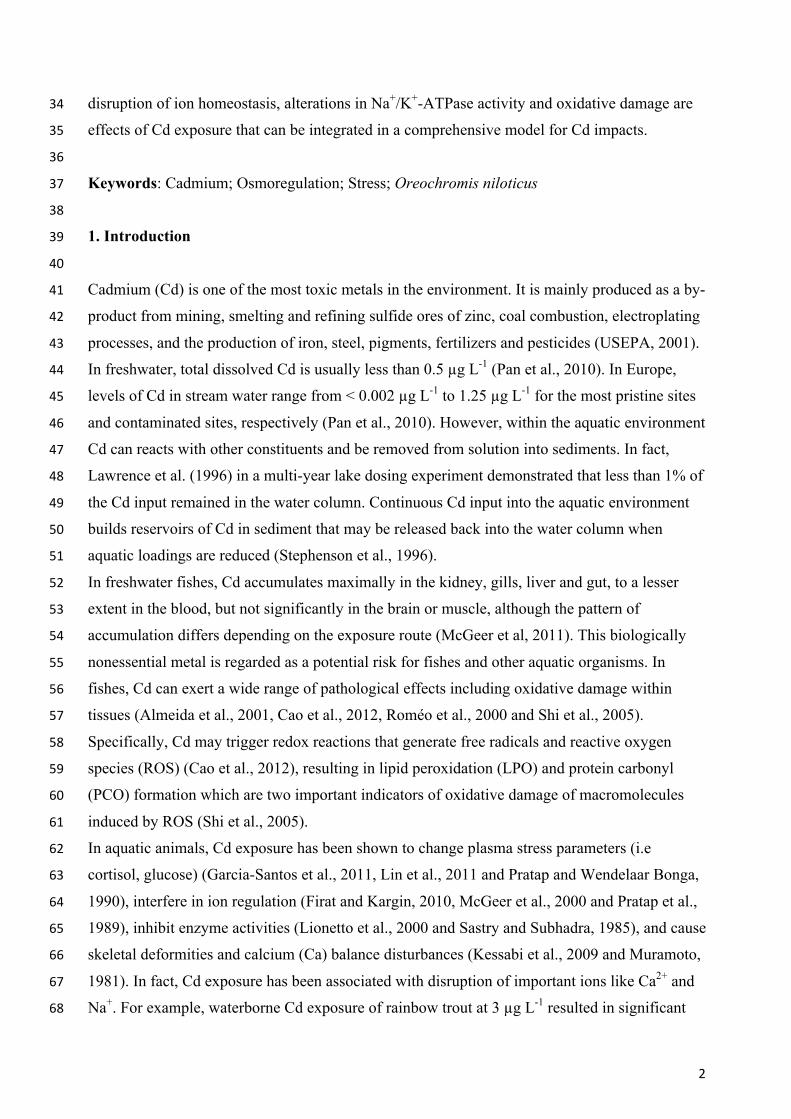
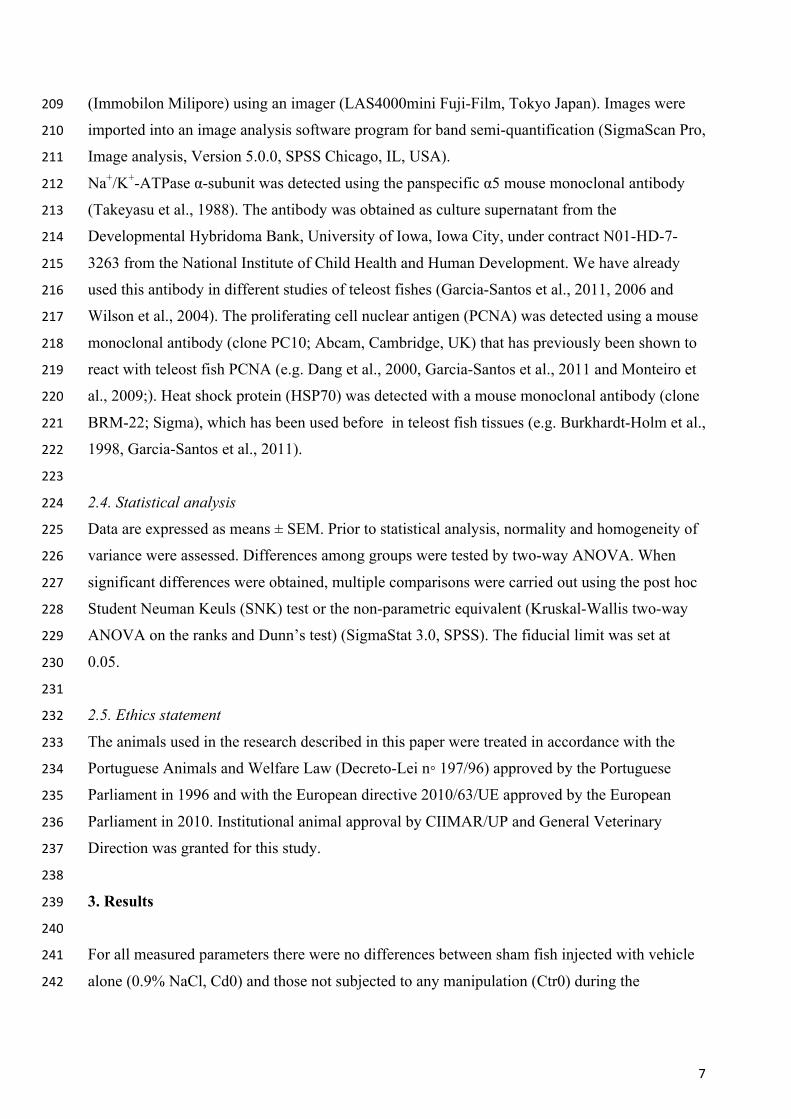
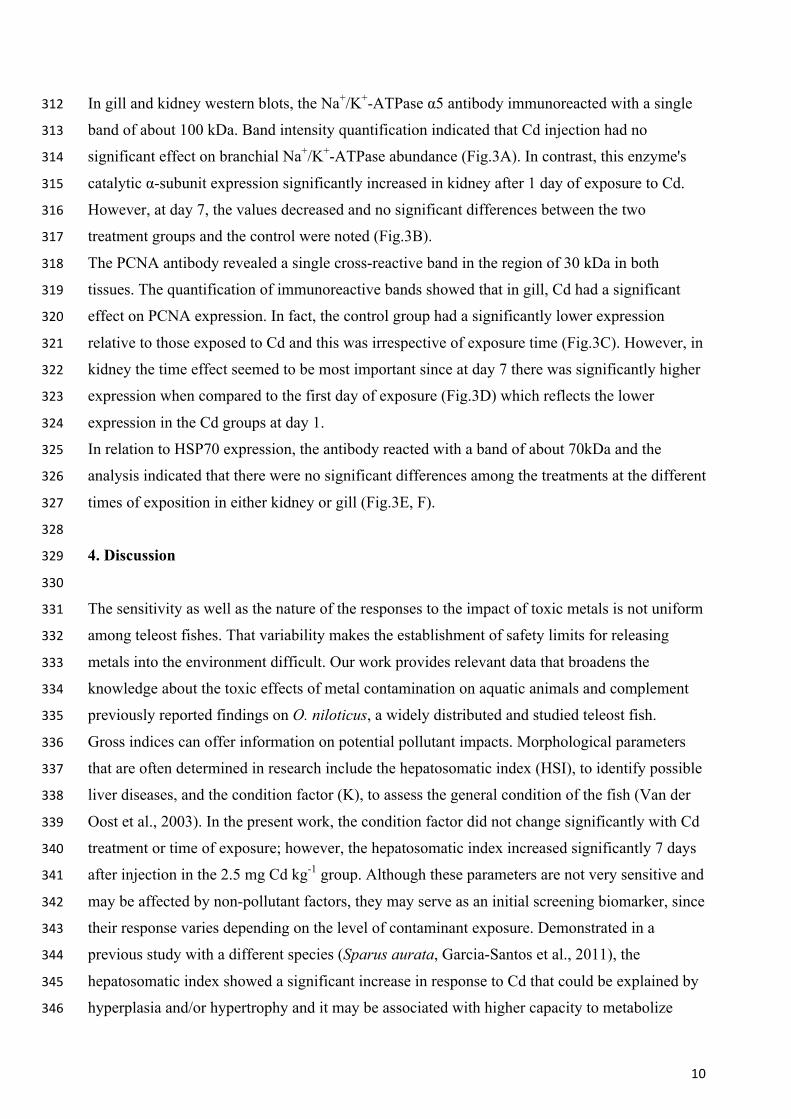
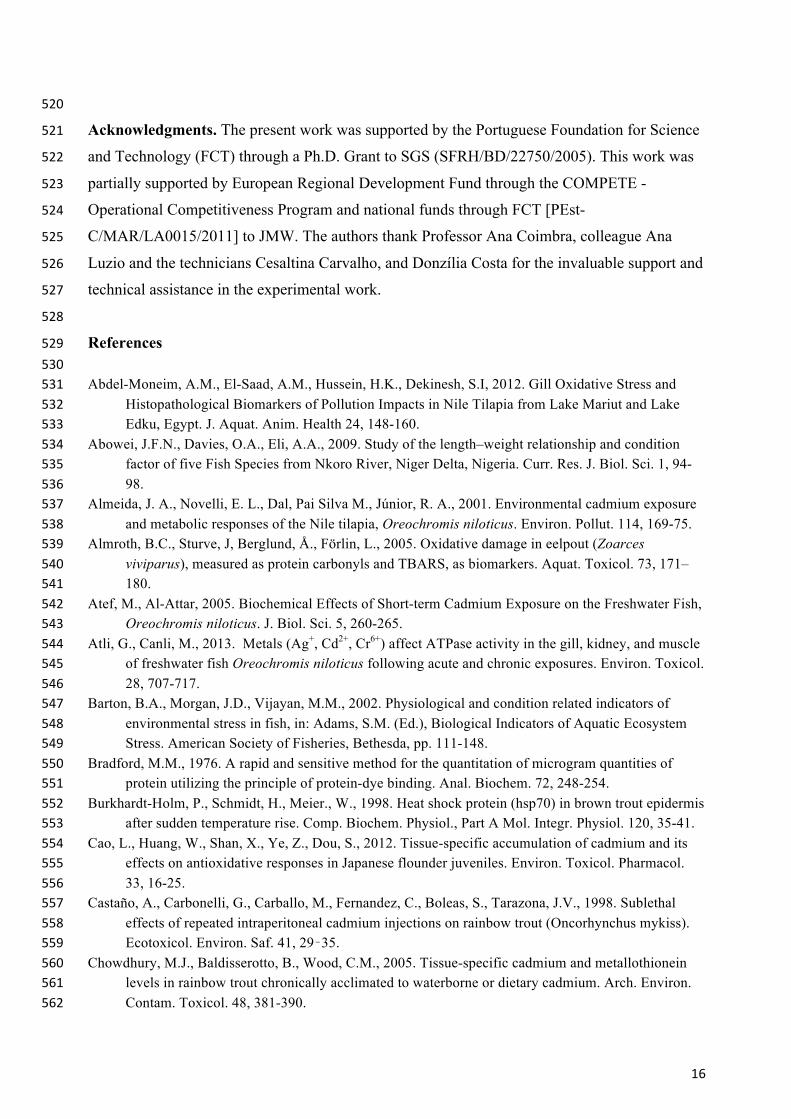
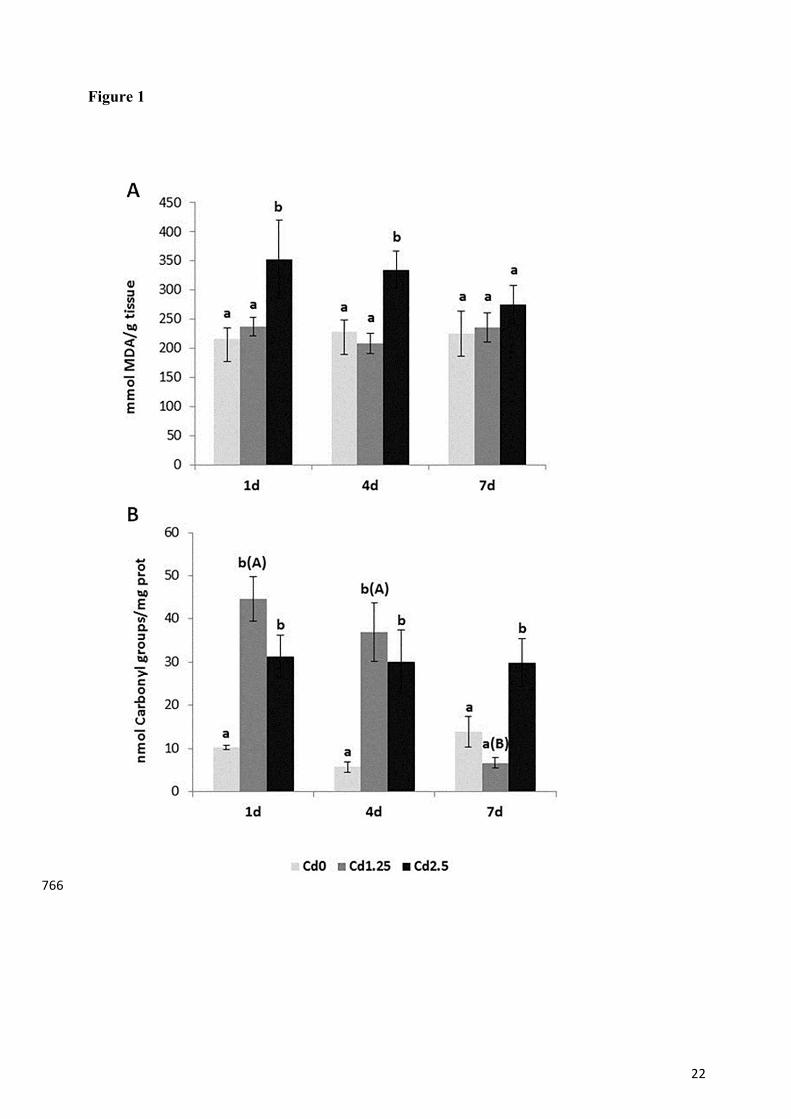
3.4. Gill oxidative damages 291
Oxidative damage to lipids and proteins were evaluated in the gill of tilapia as a measure of 292
oxidative stress (Fig. 1). Lipid peroxidation products (Fig.1A) increased significantly in fish 293
exposed to the highest Cd concentration 1 and 4 days after injection. At day 7 no significant 294
differences were seen between the groups. 295
Protein oxidation (carbonyl content; Fig.1B) increased with both injected Cd concentrations at 296
days 1 and 4. However, with longer exposition, only the highest concentration maintained a 297
significant carbonyl content elevation compared to the control. Fish exposed to the 1.25 Cd 298
concentration showed a significant decrease in carbonyl levels at day 7, compared to the other 299
sampling times. 300
301
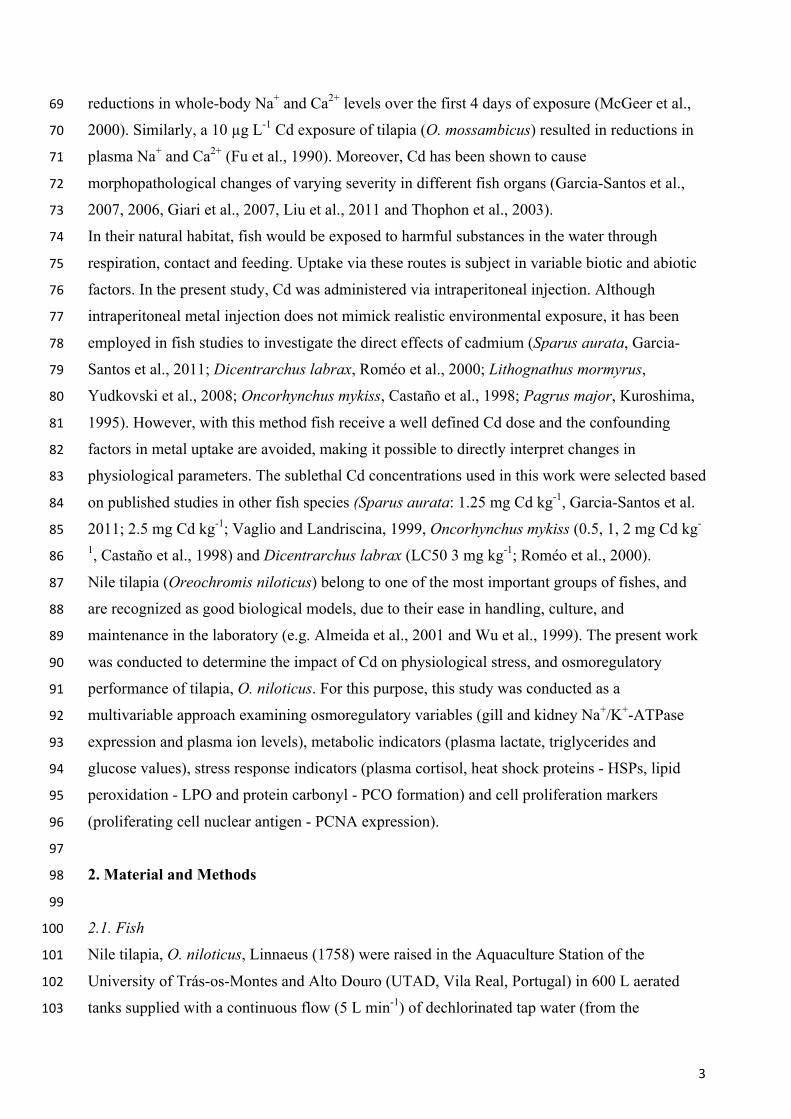
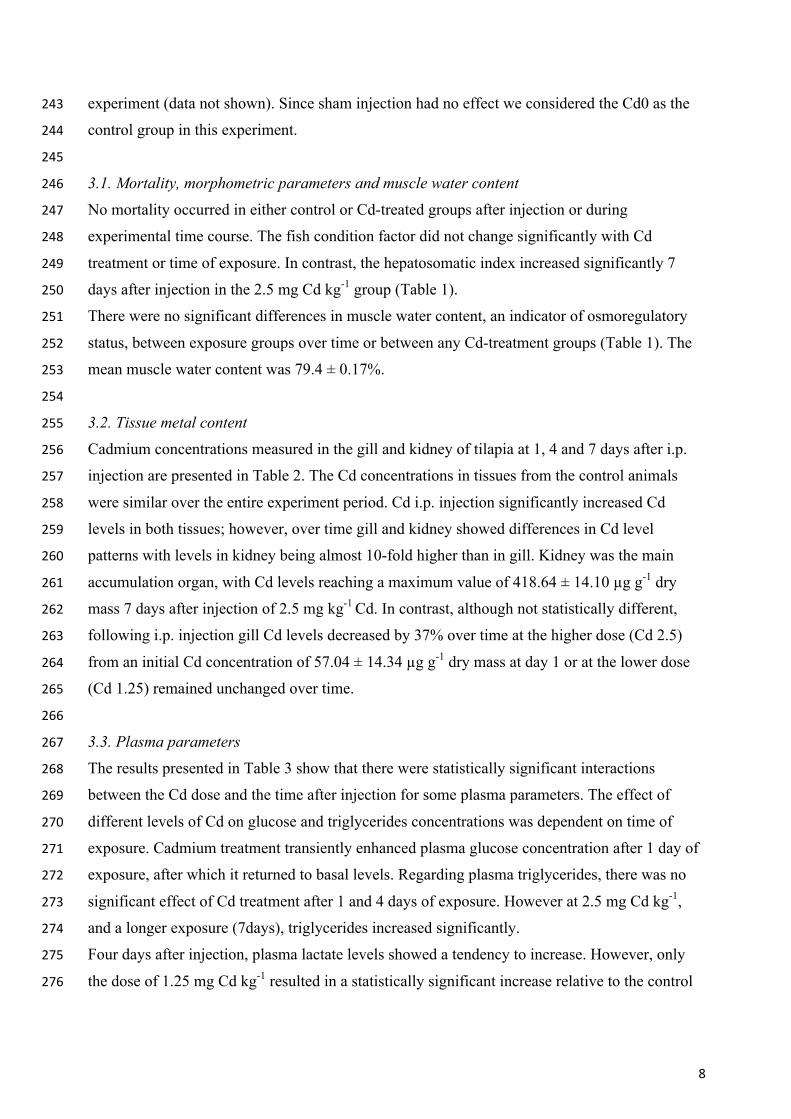
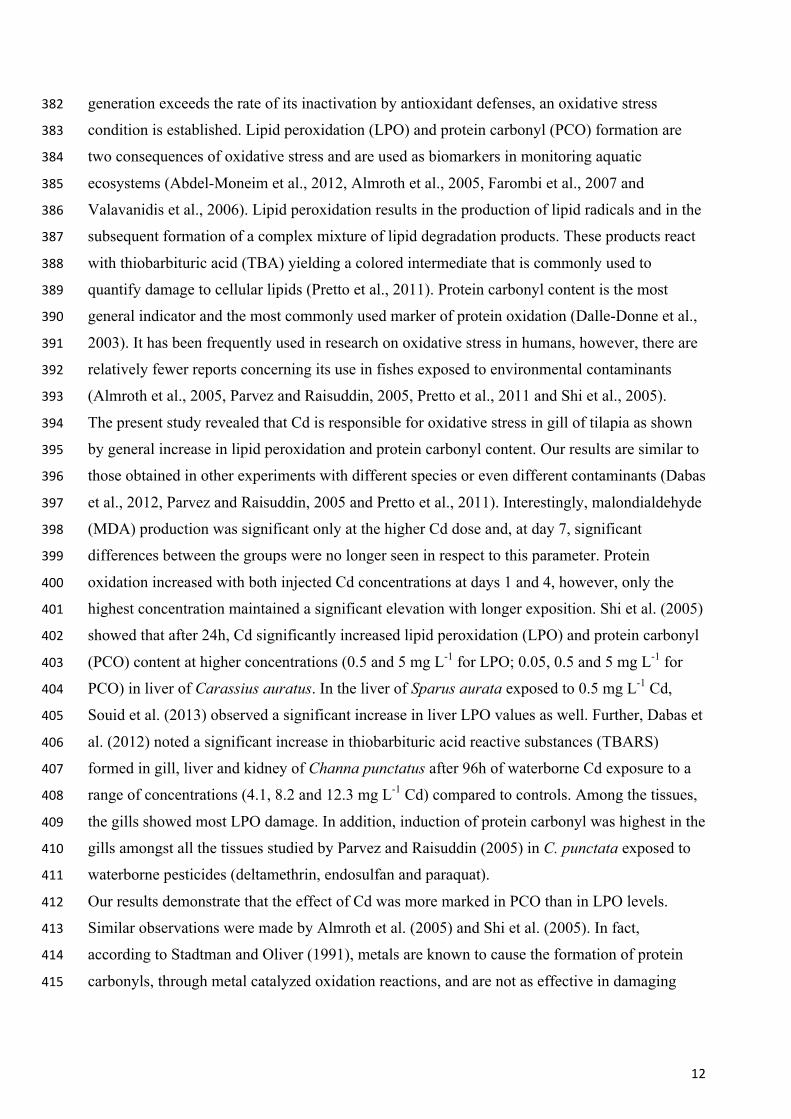
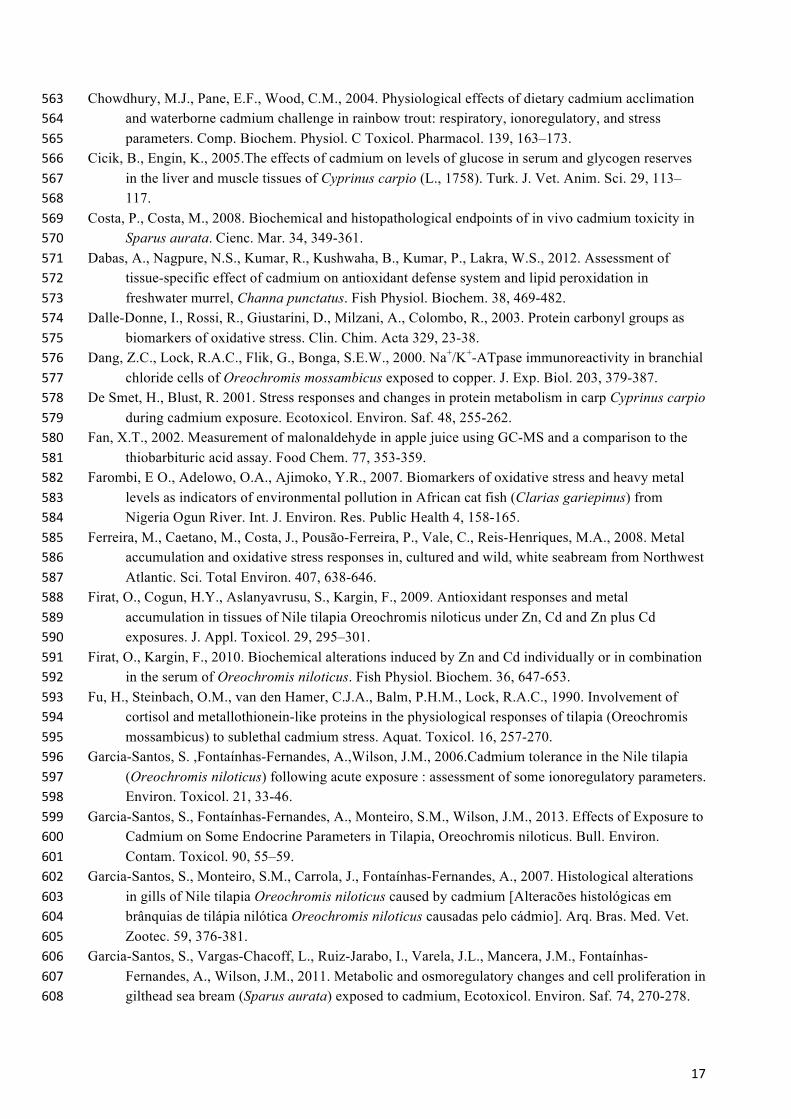
3.5. Na+/K+-ATPase activity 302
The activity of gill Na+/K+-ATPase (Fig.2A) did not reveal significant differences among the 303
treatments at the different exposure times and no time-related effects were seen within each 304
treatment. On the other hand, in the kidney (Fig.2B), the effect of the Cd treatment on Na+/K+-305
ATPase activity depended on time of exposure. Tilapia injected with the highest Cd 306
concentration after 1 day showed a significant increase in renal Na+/K+-ATPase activity when 307
compared with the fish exposed to the lower Cd level or the sham control. However, this 308
increase did not remain over time, but rather decreased significantly after 7 days exposure. 309
310
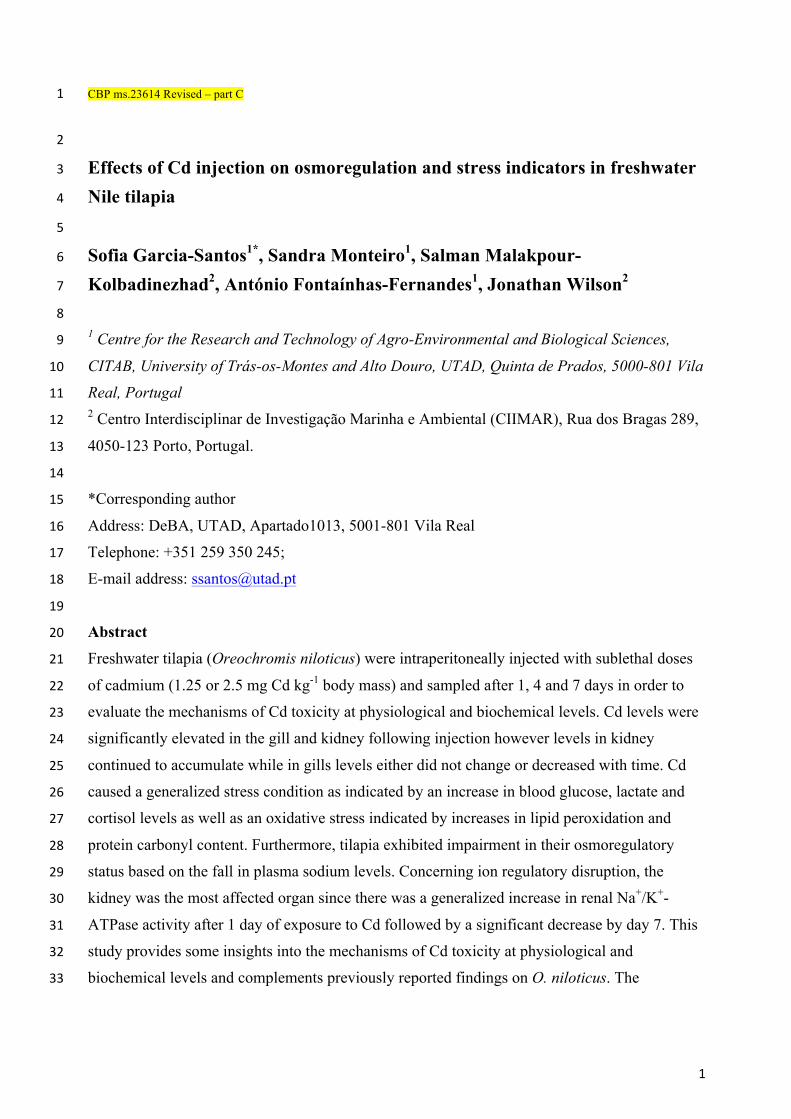
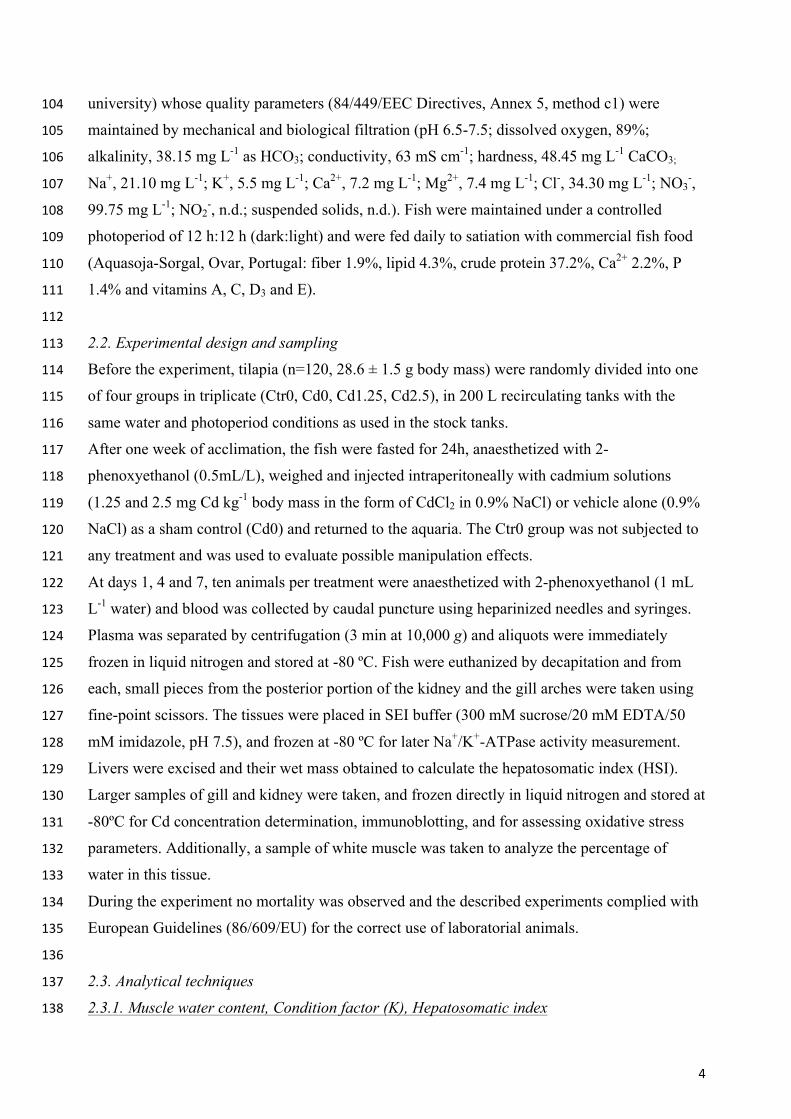
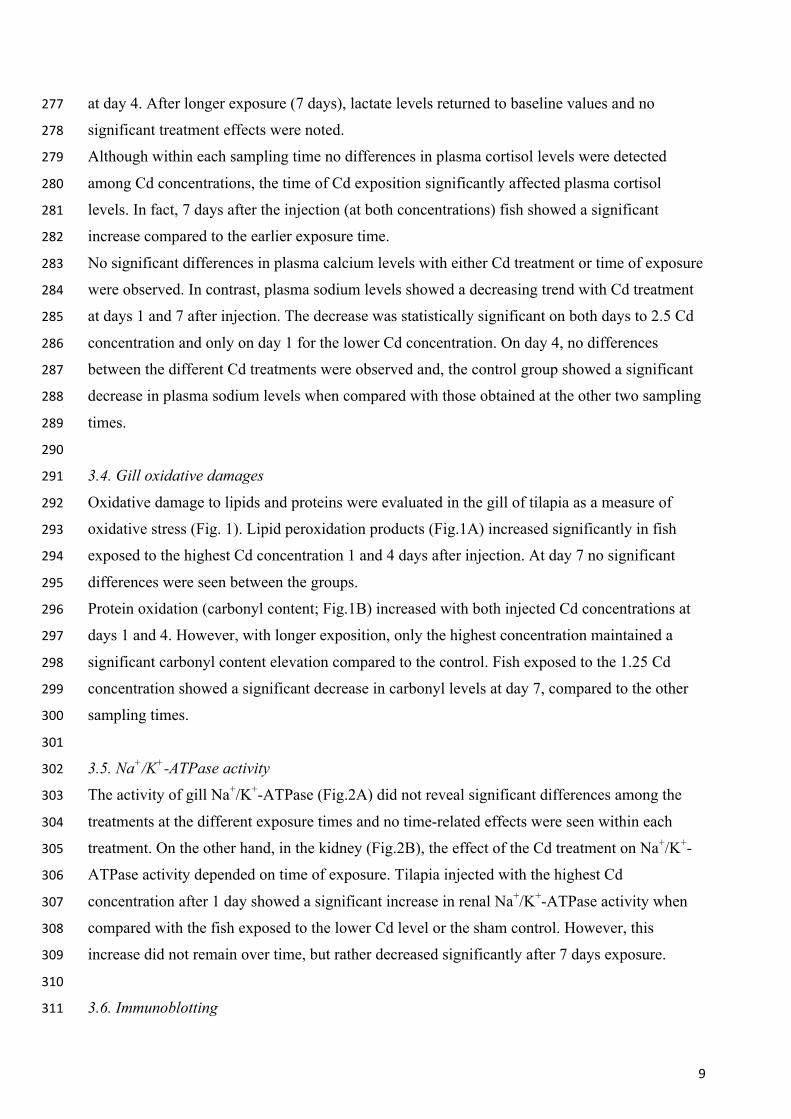
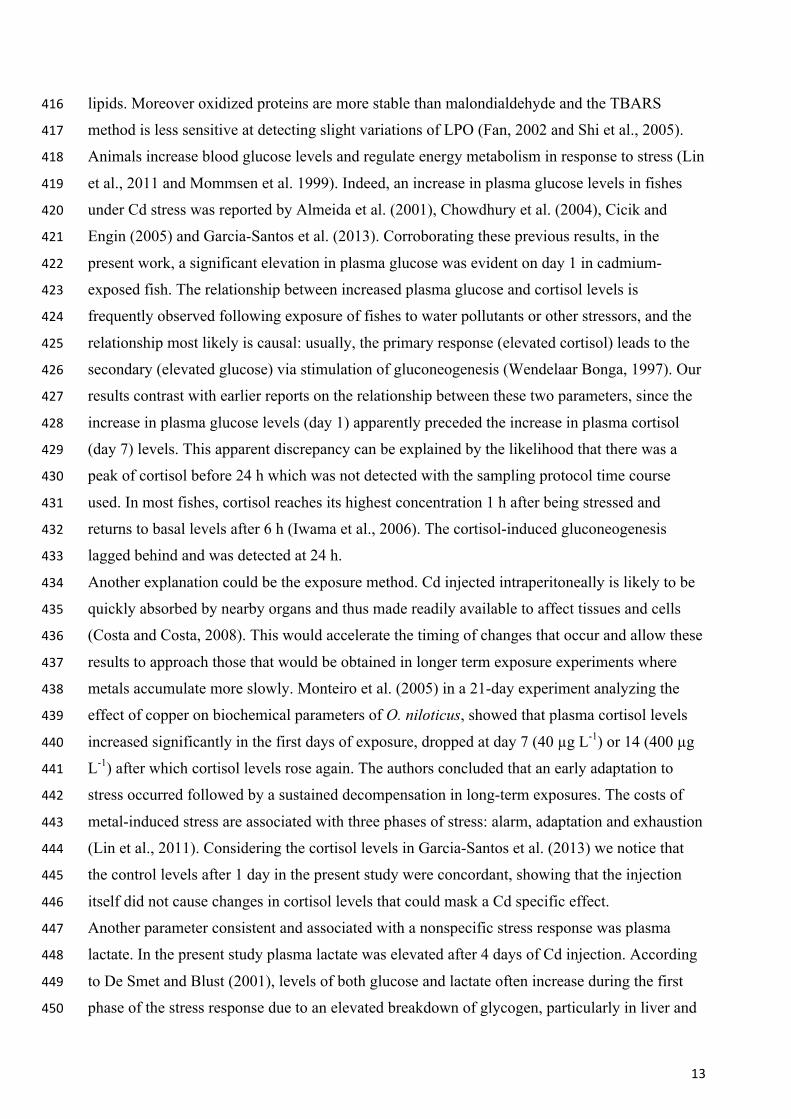
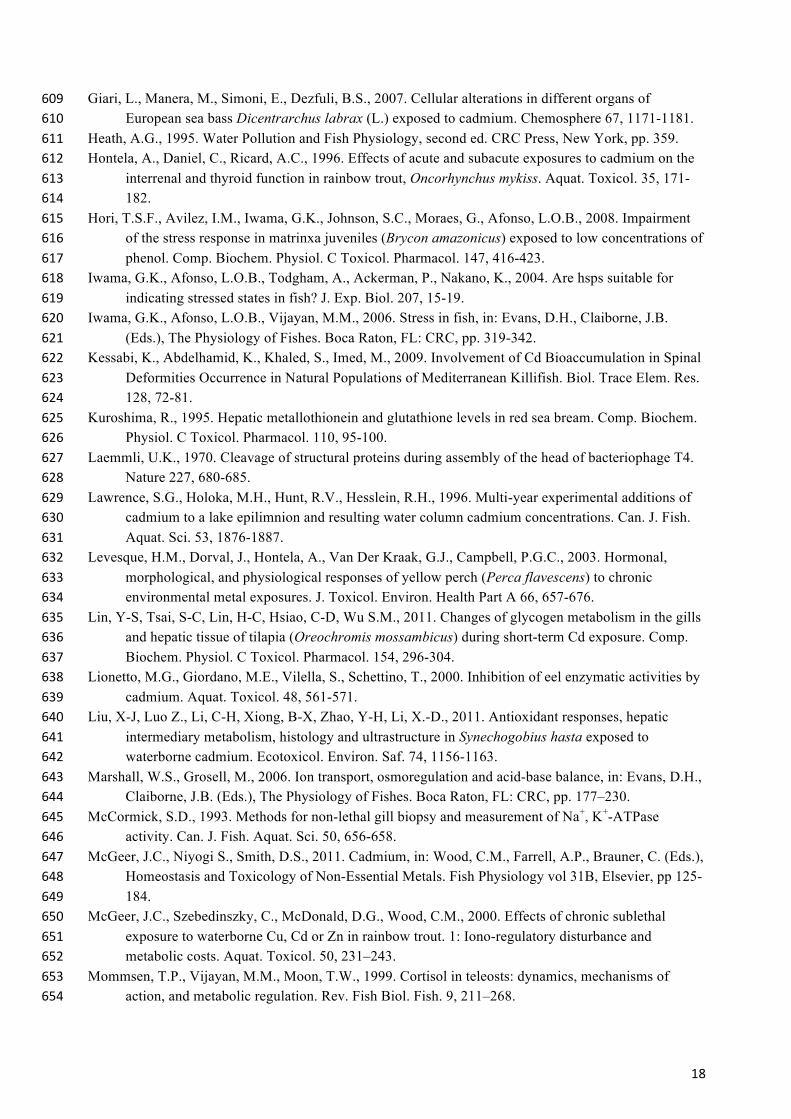
3.6. Immunoblotting 311
10
In gill and kidney western blots, the Na+/K+-ATPase α5 antibody immunoreacted with a single 312
band of about 100 kDa. Band intensity quantification indicated that Cd injection had no 313
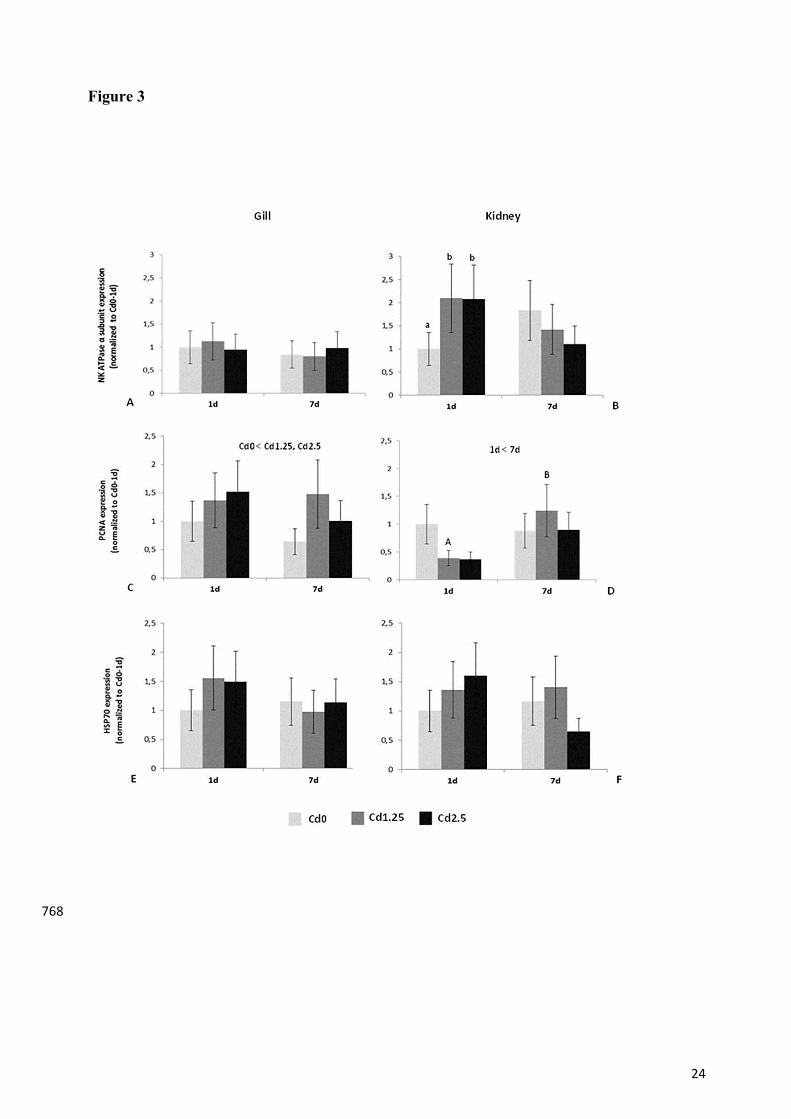
significant effect on branchial Na+/K+-ATPase abundance (Fig.3A). In contrast, this enzyme's 314
catalytic α-subunit expression significantly increased in kidney after 1 day of exposure to Cd. 315
However, at day 7, the values decreased and no significant differences between the two 316
treatment groups and the control were noted (Fig.3B). 317
The PCNA antibody revealed a single cross-reactive band in the region of 30 kDa in both 318
tissues. The quantification of immunoreactive bands showed that in gill, Cd had a significant 319
effect on PCNA expression. In fact, the control group had a significantly lower expression 320
relative to those exposed to Cd and this was irrespective of exposure time (Fig.3C). However, in 321
kidney the time effect seemed to be most important since at day 7 there was significantly higher 322
expression when compared to the first day of exposure (Fig.3D) which reflects the lower 323
expression in the Cd groups at day 1. 324
In relation to HSP70 expression, the antibody reacted with a band of about 70kDa and the 325
analysis indicated that there were no significant differences among the treatments at the different 326
times of exposition in either kidney or gill (Fig.3E, F). 327
328
4. Discussion 329
330
The sensitivity as well as the nature of the responses to the impact of toxic metals is not uniform 331
among teleost fishes. That variability makes the establishment of safety limits for releasing 332
metals into the environment difficult. Our work provides relevant data that broadens the 333
knowledge about the toxic effects of metal contamination on aquatic animals and complement 334
previously reported findings on O. niloticus, a widely distributed and studied teleost fish. 335
Gross indices can offer information on potential pollutant impacts. Morphological parameters 336
that are often determined in research include the hepatosomatic index (HSI), to identify possible 337
liver diseases, and the condition factor (K), to assess the general condition of the fish (Van der 338
Oost et al., 2003). In the present work, the condition factor did not change significantly with Cd 339
treatment or time of exposure; however, the hepatosomatic index increased significantly 7 days 340
after injection in the 2.5 mg Cd kg-1 group. Although these parameters are not very sensitive and 341
may be affected by non-pollutant factors, they may serve as an initial screening biomarker, since 342
their response varies depending on the level of contaminant exposure. Demonstrated in a 343
previous study with a different species (Sparus aurata, Garcia-Santos et al., 2011), the 344
hepatosomatic index showed a significant increase in response to Cd that could be explained by 345
hyperplasia and/or hypertrophy and it may be associated with higher capacity to metabolize 346

11
xenobiotics (Heath, 1995). In fact, in that previous work (Garcia-Santos et al., 2011), an 347
increase in liver cell proliferation in S. aurata exposed to Cd was reported. Further, Liu et al. 348
(2011) found that Cd exposure increased lipid deposits in the liver that may also contribute to 349
the higher HSI. 350
In freshwater fish, Cd accumulates predominantly in the kidney, gills, liver and gut, however, 351
the pattern of accumulation varies depending on the exposure route. During waterborne 352
exposure, the increase in Cd accumulation generally occurs in the order kidney > gills > liver > 353
intestine, whereas in dietary exposure the tissue Cd accumulation follows the order intestine > 354
kidney > liver > gills (McGeer et al., 2012; Szebedinszky et al., 2001; Chowdhury et al., 2005). 355
Our results corroborate these findings and it appears that whatever the route of contamination 356
(water, food, or i.p. injection) Cd accumulation in the kidney is always greater than in the gills. 357
Nevertheless, similar to what happens in dietary exposures (Szebedinszky et al., 2001; 358
Chowdhury et al., 2005), the gills accumulate considerable amounts of Cd after the i.p injection, 359
despite a lack of direct exposure. In fact, contrary to the kidney, the gills showed the highest Cd 360
concentration immediately 1 day after the exposure which then shows a decreasing trend over 361
time. According to this, we suggest that the gills could be a transient target organ of Cd 362
accumulation, and then Cd is transferred to other organs like kidney via the circulatory system 363
or excreted directly. 364
It has been suggested that metal concentrations in the organs of fish, rather than the metal 365
concentrations in the ambient water, could be used as a biomonitor for water pollution in natural 366
freshwaters (Pelgrom et al., 1995). The levels of Cd accumulation measured in the present work 367
are in agreement with others obtained from waterborne exposures (Wu et al., 2007; Firat et al., 368
2009). Firat et al. (2009) investigated the effects of 0.1 mg L-1 and 1.0 mg L-1 Cd on antioxidant 369
parameters and metal accumulation in O. niloticus. In that study, the values of Cd burdens in gill 370
after 7 days of exposure (25.77 ± 1.65 and 37.21 ± 0.49 µg Cd g-1dry mass) were similar to 371
those obtained in the present study using 1.25 and 2.5 mg Cd kg-1 i.p injections, respectively. 372
Furthermore, after 15 days of 0.5 mg L-1 Cd exposure, male hybrid tilapia (Oreochromis 373
niloticus×O. aureus) showed Cd levels in gill and kidney in the range of ours obtained at day 7 374
by i.p. injection (Wu et al., 2007). The waterborne Cd concentrations in the aforementioned 375
studies would be considered above the environmentally relevant values (<10µg L-1). In natural 376
freshwaters, Cd typically occurs at concentrations of less than 0.1 µg/L, however in impacted 377
environments, the concentrations can be several micrograms per liter or greater (USEPA, 2001), 378
particularly when a sudden and short-term discharge occurs into the aquatic environment. 379
Xenobiotic agents, including toxic metals, have the potential to produce reactive oxygen species 380
(ROS) such as hydrogen peroxide, and superoxide and hydroxyl radicals. When the rate of ROS 381
12
generation exceeds the rate of its inactivation by antioxidant defenses, an oxidative stress 382
condition is established. Lipid peroxidation (LPO) and protein carbonyl (PCO) formation are 383
two consequences of oxidative stress and are used as biomarkers in monitoring aquatic 384
ecosystems (Abdel-Moneim et al., 2012, Almroth et al., 2005, Farombi et al., 2007 and 385
Valavanidis et al., 2006). Lipid peroxidation results in the production of lipid radicals and in the 386
subsequent formation of a complex mixture of lipid degradation products. These products react 387
with thiobarbituric acid (TBA) yielding a colored intermediate that is commonly used to 388
quantify damage to cellular lipids (Pretto et al., 2011). Protein carbonyl content is the most 389
general indicator and the most commonly used marker of protein oxidation (Dalle-Donne et al., 390
2003). It has been frequently used in research on oxidative stress in humans, however, there are 391
relatively fewer reports concerning its use in fishes exposed to environmental contaminants 392
(Almroth et al., 2005, Parvez and Raisuddin, 2005, Pretto et al., 2011 and Shi et al., 2005). 393
The present study revealed that Cd is responsible for oxidative stress in gill of tilapia as shown 394
by general increase in lipid peroxidation and protein carbonyl content. Our results are similar to 395
those obtained in other experiments with different species or even different contaminants (Dabas 396
et al., 2012, Parvez and Raisuddin, 2005 and Pretto et al., 2011). Interestingly, malondialdehyde 397
(MDA) production was significant only at the higher Cd dose and, at day 7, significant 398
differences between the groups were no longer seen in respect to this parameter. Protein 399
oxidation increased with both injected Cd concentrations at days 1 and 4, however, only the 400
highest concentration maintained a significant elevation with longer exposition. Shi et al. (2005) 401
showed that after 24h, Cd significantly increased lipid peroxidation (LPO) and protein carbonyl 402
(PCO) content at higher concentrations (0.5 and 5 mg L-1 for LPO; 0.05, 0.5 and 5 mg L-1 for 403
PCO) in liver of Carassius auratus. In the liver of Sparus aurata exposed to 0.5 mg L-1 Cd, 404
Souid et al. (2013) observed a significant increase in liver LPO values as well. Further, Dabas et 405
al. (2012) noted a significant increase in thiobarbituric acid reactive substances (TBARS) 406
formed in gill, liver and kidney of Channa punctatus after 96h of waterborne Cd exposure to a 407
range of concentrations (4.1, 8.2 and 12.3 mg L-1 Cd) compared to controls. Among the tissues, 408
the gills showed most LPO damage. In addition, induction of protein carbonyl was highest in the 409
gills amongst all the tissues studied by Parvez and Raisuddin (2005) in C. punctata exposed to 410
waterborne pesticides (deltamethrin, endosulfan and paraquat). 411
Our results demonstrate that the effect of Cd was more marked in PCO than in LPO levels. 412
Similar observations were made by Almroth et al. (2005) and Shi et al. (2005). In fact, 413
according to Stadtman and Oliver (1991), metals are known to cause the formation of protein 414
carbonyls, through metal catalyzed oxidation reactions, and are not as effective in damaging 415
13
lipids. Moreover oxidized proteins are more stable than malondialdehyde and the TBARS 416
method is less sensitive at detecting slight variations of LPO (Fan, 2002 and Shi et al., 2005). 417
Animals increase blood glucose levels and regulate energy metabolism in response to stress (Lin 418
et al., 2011 and Mommsen et al. 1999). Indeed, an increase in plasma glucose levels in fishes 419
under Cd stress was reported by Almeida et al. (2001), Chowdhury et al. (2004), Cicik and 420
Engin (2005) and Garcia-Santos et al. (2013). Corroborating these previous results, in the 421
present work, a significant elevation in plasma glucose was evident on day 1 in cadmium-422
exposed fish. The relationship between increased plasma glucose and cortisol levels is 423
frequently observed following exposure of fishes to water pollutants or other stressors, and the 424
relationship most likely is causal: usually, the primary response (elevated cortisol) leads to the 425
secondary (elevated glucose) via stimulation of gluconeogenesis (Wendelaar Bonga, 1997). Our 426
results contrast with earlier reports on the relationship between these two parameters, since the 427
increase in plasma glucose levels (day 1) apparently preceded the increase in plasma cortisol 428
(day 7) levels. This apparent discrepancy can be explained by the likelihood that there was a 429
peak of cortisol before 24 h which was not detected with the sampling protocol time course 430
used. In most fishes, cortisol reaches its highest concentration 1 h after being stressed and 431
returns to basal levels after 6 h (Iwama et al., 2006). The cortisol-induced gluconeogenesis 432
lagged behind and was detected at 24 h. 433
Another explanation could be the exposure method. Cd injected intraperitoneally is likely to be 434
quickly absorbed by nearby organs and thus made readily available to affect tissues and cells 435
(Costa and Costa, 2008). This would accelerate the timing of changes that occur and allow these 436
results to approach those that would be obtained in longer term exposure experiments where 437
metals accumulate more slowly. Monteiro et al. (2005) in a 21-day experiment analyzing the 438
effect of copper on biochemical parameters of O. niloticus, showed that plasma cortisol levels 439
increased significantly in the first days of exposure, dropped at day 7 (40 µg L-1) or 14 (400 µg 440
L-1) after which cortisol levels rose again. The authors concluded that an early adaptation to 441
stress occurred followed by a sustained decompensation in long-term exposures. The costs of 442
metal-induced stress are associated with three phases of stress: alarm, adaptation and exhaustion 443
(Lin et al., 2011). Considering the cortisol levels in Garcia-Santos et al. (2013) we notice that 444
the control levels after 1 day in the present study were concordant, showing that the injection 445
itself did not cause changes in cortisol levels that could mask a Cd specific effect. 446
Another parameter consistent and associated with a nonspecific stress response was plasma 447
lactate. In the present study plasma lactate was elevated after 4 days of Cd injection. According 448
to De Smet and Blust (2001), levels of both glucose and lactate often increase during the first 449
phase of the stress response due to an elevated breakdown of glycogen, particularly in liver and 450
14
muscle. Furthermore, increased lactate levels after toxic metal exposure are considered to result 451
from anaerobic metabolism caused by gill impairment (Zhang et al., 2013), suggesting possible 452
damage to gas exchange. 453
The exposure of O. niloticus to 2.5 mg Cd kg-1 induced a significant rise in blood triglycerides 454
after 7 days of the experiment corroborating other studies that demonstrated that the blood 455
triglycerides levels were significantly increased in fishes exposed to different metals (Atef and 456
Al-Attar, 2005 and Singh and Reddy, 1990). There are several reports indicating that 457
contaminants influence the thyroid function (Hontela et al., 1996, Levesque et al., 2003 and 458
Ricard et al., 1998). In fact, in a previous work (Garcia-Santos et al., 2013) we demonstrated 459
that waterborne Cd impacted thyroid functions in tilapia, O. niloticus. Since the decrease in 460
thyroid secretion greatly increases triglycerides level in the blood, the observed 461
hypertriglyceridaemia may be due to hypothyroidism induced by cadmium and/or liver 462
dysfunction because the liver is the main center of lipid metabolism (Atef and Al-Attar, 2005). 463
Gills and kidneys are the most important organs responsible for ionoregulation in freshwater 464
teleosts since the diffusional loss of ions and the osmotic influx of water are balanced by 465
absorption of ions in the gills and excretion of large amounts of urine by the kidneys (Marshall 466
and Grosell 2006). Morphology and physiology of the gill ionocytes have been studied 467
extensively, however the ion transport mechanisms in the kidney are less well understood. 468
Immunocytochemical studies demonstrated that Na+/K+-ATPase is located mainly in 469
mitochondrion-rich cells of gill epithelia (Wilson and Laurent, 2002) and epithelia of kidney 470
tubules (Ura et al., 1996) in euryhaline teleosts. 471
Data from the literature have shown that there were considerable variations (inhibition, 472
stimulation or even no changes) in the response of Na+/K+-ATPase activity in fishes exposed to 473
Cd (Garcia-Santos et al., 2013, 2006, Lionetto et al., 2000 and Saglam et al., 2013). In the 474
present work, the abundance of the gill Na+/K+-ATPase α-subunit, like its activity, was not 475
significantly affected by Cd. Most authors, when comparing the differences between tissues, 476
concluded that gill ATPases seem to be more sensitive to metal exposures than ATPases from 477
other tissues, because of structure and position of gill tissue which allows direct contact with the 478
external medium (Atli and Canli, 2013). However, in our study, Cd was injected 479
intraperitoneally, which means that the gills were not the main or the first target organ to the 480
toxic metal effects. Moreover, these results corroborate our previous work (Garcia-Santos et al., 481
2006), where no significant changes in gill Na+/K+-ATPase activity were seen in O. niloticus 482
exposed to waterborne Cd. In that study we concluded that the species was relatively insensitive 483
to the effects of Cd. 484
15
Instead, a generalized increase in renal Na+/K+-ATPase activity was observed after 1 day of 485
exposure to Cd which was positively correlated with its α-subunit protein expression suggesting 486
that alterations in activity were due to variations in the relative abundance of the enzyme. The 487
increase may reflect a compensatory response to the drop observed in plasma sodium levels 1 488
day after Cd injection. That sodium decline could result, in turn, from the slightly (although not 489
statistically significant) decrease in gill Na+/K+-ATPase. The reestablishment of plasma sodium 490
levels, at day 4, would reflect the transient success of the compensatory mechanism. Over the 491
longer term (7 d), the ionic imbalance returns, and is accompanied by a decrease in renal 492
Na+/K+-ATPase activity as plasma sodium values fall. 493
Based on the Na+/K+-ATPase response and plasma sodium level changes, kidney was the most 494
affected tissue concerning ionic disruption and that could be attributed to its important function 495
in osmoregulation. Indeed, although in fishes the gill plays a quantitatively larger role in ionic 496
regulation, the kidney is the primary organ for elimination of excess water. This is particularly 497
important for freshwater species in which efficiency of ion reabsorption mechanisms in this 498
organ minimize the loss of ions, which is a pivotal role (Atli and Canli, 2013). 499
Studies in fishes have demonstrated that several stressors, including pollutants and thermal 500
stress, can induce HSP expression (Iwama et al., 2004). The function of HSP during stress is 501
related to cytoprotection as these proteins can act to prevent and repair protein damage. 502
Although, the HSP response seems to vary with factors such as species, development stage, 503
tissue, stressor, concentration and duration of exposure (Hori et al., 2008), in the present work, 504
there was a slight trend to increase HSP70 after 1 day of exposure to Cd. Similar results have 505
been observed in our previous study in sea bream (Garcia-Santos et al., 2011), suggesting that 506
acutely exposed fish were experiencing a cellular stress and trying to cope with Cd toxicity. In 507
addition, the increased expression of PCNA observed in gill, also suggests a compensatory 508
response to Cd exposure (Dang et al., 2000) with an increase in cell turnover that helps maintain 509
tissue structure and function. 510
Our results provided an insight into the mechanisms of Cd toxicity at physiological and 511
biochemical levels. Studies involving environmentally relevant pollutants in water are usually 512
constrained by variables such as contaminant bioavailability and interactions, and the 513
characteristics of the entry pathway and detoxification (Costa and Costa, 2008). By using the 514
intraperitoneal injection, the present experiment, allows a more objective interpretation of the 515
toxicological effects of Cd, which is fundamental for understanding studies involving 516
environmental xenobiotics tested under laboratory or even field conditions. The disruption of 517
ion homeostasis, alterations in Na+/K+-ATPase activity and oxidative damage are effects of Cd 518
injection that could be integrated into a comprehensive model for understanding Cd impacts. 519
16
520
Acknowledgments. The present work was supported by the Portuguese Foundation for Science 521
and Technology (FCT) through a Ph.D. Grant to SGS (SFRH/BD/22750/2005). This work was 522
partially supported by European Regional Development Fund through the COMPETE - 523
Operational Competitiveness Program and national funds through FCT [PEst-524
C/MAR/LA0015/2011] to JMW. The authors thank Professor Ana Coimbra, colleague Ana 525
Luzio and the technicians Cesaltina Carvalho, and Donzília Costa for the invaluable support and 526
technical assistance in the experimental work. 527
528
References 529 530 Abdel-Moneim, A.M., El-Saad, A.M., Hussein, H.K., Dekinesh, S.I, 2012. Gill Oxidative Stress and 531
Histopathological Biomarkers of Pollution Impacts in Nile Tilapia from Lake Mariut and Lake 532 Edku, Egypt. J. Aquat. Anim. Health 24, 148-160. 533
Abowei, J.F.N., Davies, O.A., Eli, A.A., 2009. Study of the length–weight relationship and condition 534 factor of five Fish Species from Nkoro River, Niger Delta, Nigeria. Curr. Res. J. Biol. Sci. 1, 94-535 98. 536
Almeida, J. A., Novelli, E. L., Dal, Pai Silva M., Júnior, R. A., 2001. Environmental cadmium exposure 537 and metabolic responses of the Nile tilapia, Oreochromis niloticus. Environ. Pollut. 114, 169-75. 538
Almroth, B.C., Sturve, J, Berglund, Å., Förlin, L., 2005. Oxidative damage in eelpout (Zoarces 539 viviparus), measured as protein carbonyls and TBARS, as biomarkers. Aquat. Toxicol. 73, 171–540 180. 541
Atef, M., Al-Attar, 2005. Biochemical Effects of Short-term Cadmium Exposure on the Freshwater Fish, 542 Oreochromis niloticus. J. Biol. Sci. 5, 260-265. 543
Atli, G., Canli, M., 2013. Metals (Ag+, Cd2+, Cr6+) affect ATPase activity in the gill, kidney, and muscle 544 of freshwater fish Oreochromis niloticus following acute and chronic exposures. Environ. Toxicol. 545 28, 707-717. 546
Barton, B.A., Morgan, J.D., Vijayan, M.M., 2002. Physiological and condition related indicators of 547 environmental stress in fish, in: Adams, S.M. (Ed.), Biological Indicators of Aquatic Ecosystem 548 Stress. American Society of Fisheries, Bethesda, pp. 111-148. 549
Bradford, M.M., 1976. A rapid and sensitive method for the quantitation of microgram quantities of 550 protein utilizing the principle of protein-dye binding. Anal. Biochem. 72, 248-254. 551
Burkhardt-Holm, P., Schmidt, H., Meier., W., 1998. Heat shock protein (hsp70) in brown trout epidermis 552 after sudden temperature rise. Comp. Biochem. Physiol., Part A Mol. Integr. Physiol. 120, 35-41. 553
Cao, L., Huang, W., Shan, X., Ye, Z., Dou, S., 2012. Tissue-specific accumulation of cadmium and its 554 effects on antioxidative responses in Japanese flounder juveniles. Environ. Toxicol. Pharmacol. 555 33, 16-25. 556
Castaño, A., Carbonelli, G., Carballo, M., Fernandez, C., Boleas, S., Tarazona, J.V., 1998. Sublethal 557 effects of repeated intraperitoneal cadmium injections on rainbow trout (Oncorhynchus mykiss). 558 Ecotoxicol. Environ. Saf. 41, 29–35. 559
Chowdhury, M.J., Baldisserotto, B., Wood, C.M., 2005. Tissue-specific cadmium and metallothionein 560 levels in rainbow trout chronically acclimated to waterborne or dietary cadmium. Arch. Environ. 561 Contam. Toxicol. 48, 381-390. 562
17
Chowdhury, M.J., Pane, E.F., Wood, C.M., 2004. Physiological effects of dietary cadmium acclimation 563 and waterborne cadmium challenge in rainbow trout: respiratory, ionoregulatory, and stress 564 parameters. Comp. Biochem. Physiol. C Toxicol. Pharmacol. 139, 163–173. 565
Cicik, B., Engin, K., 2005.The effects of cadmium on levels of glucose in serum and glycogen reserves 566 in the liver and muscle tissues of Cyprinus carpio (L., 1758). Turk. J. Vet. Anim. Sci. 29, 113–567 117. 568
Costa, P., Costa, M., 2008. Biochemical and histopathological endpoints of in vivo cadmium toxicity in 569 Sparus aurata. Cienc. Mar. 34, 349-361. 570
Dabas, A., Nagpure, N.S., Kumar, R., Kushwaha, B., Kumar, P., Lakra, W.S., 2012. Assessment of 571 tissue-specific effect of cadmium on antioxidant defense system and lipid peroxidation in 572 freshwater murrel, Channa punctatus. Fish Physiol. Biochem. 38, 469-482. 573
Dalle-Donne, I., Rossi, R., Giustarini, D., Milzani, A., Colombo, R., 2003. Protein carbonyl groups as 574 biomarkers of oxidative stress. Clin. Chim. Acta 329, 23-38. 575
Dang, Z.C., Lock, R.A.C., Flik, G., Bonga, S.E.W., 2000. Na+/K+-ATpase immunoreactivity in branchial 576 chloride cells of Oreochromis mossambicus exposed to copper. J. Exp. Biol. 203, 379-387. 577
De Smet, H., Blust, R. 2001. Stress responses and changes in protein metabolism in carp Cyprinus carpio 578 during cadmium exposure. Ecotoxicol. Environ. Saf. 48, 255-262. 579
Fan, X.T., 2002. Measurement of malonaldehyde in apple juice using GC-MS and a comparison to the 580 thiobarbituric acid assay. Food Chem. 77, 353-359. 581
Farombi, E O., Adelowo, O.A., Ajimoko, Y.R., 2007. Biomarkers of oxidative stress and heavy metal 582 levels as indicators of environmental pollution in African cat fish (Clarias gariepinus) from 583 Nigeria Ogun River. Int. J. Environ. Res. Public Health 4, 158-165. 584
Ferreira, M., Caetano, M., Costa, J., Pousão-Ferreira, P., Vale, C., Reis-Henriques, M.A., 2008. Metal 585 accumulation and oxidative stress responses in, cultured and wild, white seabream from Northwest 586 Atlantic. Sci. Total Environ. 407, 638-646. 587
Firat, O., Cogun, H.Y., Aslanyavrusu, S., Kargin, F., 2009. Antioxidant responses and metal 588 accumulation in tissues of Nile tilapia Oreochromis niloticus under Zn, Cd and Zn plus Cd 589 exposures. J. Appl. Toxicol. 29, 295–301. 590
Firat, O., Kargin, F., 2010. Biochemical alterations induced by Zn and Cd individually or in combination 591 in the serum of Oreochromis niloticus. Fish Physiol. Biochem. 36, 647-653. 592
Fu, H., Steinbach, O.M., van den Hamer, C.J.A., Balm, P.H.M., Lock, R.A.C., 1990. Involvement of 593 cortisol and metallothionein-like proteins in the physiological responses of tilapia (Oreochromis 594 mossambicus) to sublethal cadmium stress. Aquat. Toxicol. 16, 257-270. 595
Garcia-Santos, S. ,Fontaínhas-Fernandes, A.,Wilson, J.M., 2006.Cadmium tolerance in the Nile tilapia 596 (Oreochromis niloticus) following acute exposure : assessment of some ionoregulatory parameters. 597 Environ. Toxicol. 21, 33-46. 598
Garcia-Santos, S., Fontaínhas-Fernandes, A., Monteiro, S.M., Wilson, J.M., 2013. Effects of Exposure to 599 Cadmium on Some Endocrine Parameters in Tilapia, Oreochromis niloticus. Bull. Environ. 600 Contam. Toxicol. 90, 55–59. 601
Garcia-Santos, S., Monteiro, S.M., Carrola, J., Fontaínhas-Fernandes, A., 2007. Histological alterations 602 in gills of Nile tilapia Oreochromis niloticus caused by cadmium [Alteracões histológicas em 603 brânquias de tilápia nilótica Oreochromis niloticus causadas pelo cádmio]. Arq. Bras. Med. Vet. 604 Zootec. 59, 376-381. 605
Garcia-Santos, S., Vargas-Chacoff, L., Ruiz-Jarabo, I., Varela, J.L., Mancera, J.M., Fontaínhas-606 Fernandes, A., Wilson, J.M., 2011. Metabolic and osmoregulatory changes and cell proliferation in 607 gilthead sea bream (Sparus aurata) exposed to cadmium, Ecotoxicol. Environ. Saf. 74, 270-278. 608
18
Giari, L., Manera, M., Simoni, E., Dezfuli, B.S., 2007. Cellular alterations in different organs of 609 European sea bass Dicentrarchus labrax (L.) exposed to cadmium. Chemosphere 67, 1171-1181. 610
Heath, A.G., 1995. Water Pollution and Fish Physiology, second ed. CRC Press, New York, pp. 359. 611 Hontela, A., Daniel, C., Ricard, A.C., 1996. Effects of acute and subacute exposures to cadmium on the 612
interrenal and thyroid function in rainbow trout, Oncorhynchus mykiss. Aquat. Toxicol. 35, 171-613 182. 614
Hori, T.S.F., Avilez, I.M., Iwama, G.K., Johnson, S.C., Moraes, G., Afonso, L.O.B., 2008. Impairment 615 of the stress response in matrinxa juveniles (Brycon amazonicus) exposed to low concentrations of 616 phenol. Comp. Biochem. Physiol. C Toxicol. Pharmacol. 147, 416-423. 617
Iwama, G.K., Afonso, L.O.B., Todgham, A., Ackerman, P., Nakano, K., 2004. Are hsps suitable for 618 indicating stressed states in fish? J. Exp. Biol. 207, 15-19. 619
Iwama, G.K., Afonso, L.O.B., Vijayan, M.M., 2006. Stress in fish, in: Evans, D.H., Claiborne, J.B. 620 (Eds.), The Physiology of Fishes. Boca Raton, FL: CRC, pp. 319-342. 621
Kessabi, K., Abdelhamid, K., Khaled, S., Imed, M., 2009. Involvement of Cd Bioaccumulation in Spinal 622 Deformities Occurrence in Natural Populations of Mediterranean Killifish. Biol. Trace Elem. Res. 623 128, 72-81. 624
Kuroshima, R., 1995. Hepatic metallothionein and glutathione levels in red sea bream. Comp. Biochem. 625 Physiol. C Toxicol. Pharmacol. 110, 95-100. 626
Laemmli, U.K., 1970. Cleavage of structural proteins during assembly of the head of bacteriophage T4. 627 Nature 227, 680-685. 628
Lawrence, S.G., Holoka, M.H., Hunt, R.V., Hesslein, R.H., 1996. Multi-year experimental additions of 629 cadmium to a lake epilimnion and resulting water column cadmium concentrations. Can. J. Fish. 630 Aquat. Sci. 53, 1876-1887. 631
Levesque, H.M., Dorval, J., Hontela, A., Van Der Kraak, G.J., Campbell, P.G.C., 2003. Hormonal, 632 morphological, and physiological responses of yellow perch (Perca flavescens) to chronic 633 environmental metal exposures. J. Toxicol. Environ. Health Part A 66, 657-676. 634
Lin, Y-S, Tsai, S-C, Lin, H-C, Hsiao, C-D, Wu S.M., 2011. Changes of glycogen metabolism in the gills 635 and hepatic tissue of tilapia (Oreochromis mossambicus) during short-term Cd exposure. Comp. 636 Biochem. Physiol. C Toxicol. Pharmacol. 154, 296-304. 637
Lionetto, M.G., Giordano, M.E., Vilella, S., Schettino, T., 2000. Inhibition of eel enzymatic activities by 638 cadmium. Aquat. Toxicol. 48, 561-571. 639
Liu, X-J, Luo Z., Li, C-H, Xiong, B-X, Zhao, Y-H, Li, X.-D., 2011. Antioxidant responses, hepatic 640 intermediary metabolism, histology and ultrastructure in Synechogobius hasta exposed to 641 waterborne cadmium. Ecotoxicol. Environ. Saf. 74, 1156-1163. 642
Marshall, W.S., Grosell, M., 2006. Ion transport, osmoregulation and acid-base balance, in: Evans, D.H., 643 Claiborne, J.B. (Eds.), The Physiology of Fishes. Boca Raton, FL: CRC, pp. 177–230. 644
McCormick, S.D., 1993. Methods for non-lethal gill biopsy and measurement of Na+, K+-ATPase 645 activity. Can. J. Fish. Aquat. Sci. 50, 656-658. 646
McGeer, J.C., Niyogi S., Smith, D.S., 2011. Cadmium, in: Wood, C.M., Farrell, A.P., Brauner, C. (Eds.), 647 Homeostasis and Toxicology of Non-Essential Metals. Fish Physiology vol 31B, Elsevier, pp 125-648 184. 649
McGeer, J.C., Szebedinszky, C., McDonald, D.G., Wood, C.M., 2000. Effects of chronic sublethal 650 exposure to waterborne Cu, Cd or Zn in rainbow trout. 1: Iono-regulatory disturbance and 651 metabolic costs. Aquat. Toxicol. 50, 231–243. 652
Mommsen, T.P., Vijayan, M.M., Moon, T.W., 1999. Cortisol in teleosts: dynamics, mechanisms of 653 action, and metabolic regulation. Rev. Fish Biol. Fish. 9, 211–268. 654
19
Monteiro, S.M., dos Santos, N.M.S., Calejo, M., Fontaínhas-Fernandes, A., Sousa, M., 2009. Copper 655 toxicity in gills of the teleost fish, Oreochromis niloticus: effects in apoptosis induction and cell 656 proliferation. Aquat. Toxicol. 94, 219-228. 657
Monteiro, S.M., Mancera, J.M., Fontainhas-Fernandes, A., Sousa, M., 2005. Copper induced alterations 658 of biochemical parameters in the gill and plasma of Oreochromis niloticus. Comp. Biochem. 659 Physiol. C Toxicol. Pharmacol. 141, 375-383. 660
Muramoto, S., 1981. Vertebral column damage and decrease of calcium concentration in fish exposed 661 experimentally to cadmium. Environ. Pollut. (Series A) 24, 125–133. 662
Pan, J., Plant, J.A., Voulvoulis, N., Oates, C.J., Ihlenfeld, C., 2010. Cadmium levels in Europe: 663 implications for human health. Environ. Geochem. Health 32, 1-12. 664
Parvez, S., Raisuddin, S., 2005. Protein carbonyls: novel biomarkers of exposure to oxidative stress-665 inducing pesticides in freshwater fish Channa punctata (Bloch). Environ. Toxicol. Pharmacol. 20, 666 112–117. 667
Pelgrom, S.M.G.J., Lamers, L.P.M., Lock, R.A.C., Balm, P.H.M., Wendelaar Bonga, S.E., 1995. 668 Interactions between copper and cadmium modify metal organ distribution in mature tilapia, 669 Oreochromis mossambicus. Environ. Pollut. 90, 415–423. 670
Pratap, H.B., Fu, H., Lock, R.A.C, Wendelaar Bonga, S.E., 1989. Effect of waterborne and dietary 671 cadmium on plasma ions of the teleost Oreochromis mossambicus in relation to water calcium 672 levels. Arch. Environ. Contam. Toxicol. 18, 568–575. 673
Pratap, H.B., Wendelaar Bonga, 1990. Effect of waterborne cadmium on plasma cortisol and glucose in 674 the cichlid fish Oreochromis mossambicus. Comp. Biochem. Physiol. C Toxicol. Pharmacol. 95, 675 313-317. 676
Pretto, A., Loro, V.L., Baldisserotto, B., Pavanato, M.A., Moraes, B.S., Menezes, C., Cattaneo, R., 677 Clasen, B., Finamor, I.A., Dressler V., 2011. Effects of Water Cadmium Concentrations on 678 Bioaccumulation and Various Oxidative Stress Parameters in Rhamdia quelen. Arch. Environ. 679 Contam. Toxicol. 60, 309-318. 680
Ricard, A.C., Daniel, C., Anderson, P., Hontela, A., 1998. Effects of subchronic exposure to cadmium 681 chloride on endocrine and metabolic functions in rainbow trout Oncorhynchus mykiss. Arch. 682 Environ. Contam. Toxicol. 34, 377-381. 683
Roméo, M., Bennani, N., Gnassia-Barelli, M., Lafaurie, M., Girard, J.P., 2000. Cadmium and copper 684 display different responses towards oxidative stress in the kidney of the sea bass Dicentrarchus 685 labrax. Aquat. Toxicol. 48, 185–194. 686
Saglam, D., Atli, Canli, M., 2013. Investigations on the osmoregulation of freshwater fish (Oreochromis 687 niloticus) following exposures to metals (Cd, Cu) in differing hardness. Ecotoxicol. Environ. Saf. 688 92, 79-86. 689
Sastry, K.V., Subhadra K., 1985. In vivo effects of cadmium on some enzyme activities in tissues of the 690 freshwater catfish, Heteropneustes fossilis. Environ. Res. 36, 32-45. 691
Shi, H., Sui, Y., Wang, X., Luo, Y., Ji, L., 2005. Hydroxyl radical production and oxidative damage 692 induced by cadmium and naphthalene in liver of Carassius auratus . Comp. Biochem. Physiol. C 693 Toxicol. Pharmacol. 140, 115–121. 694
Singh, H.S., Reddy, T.V., 1990. Effect of copper-sulfate on hematology, blood-chemistry, and 695 hepatosomatic index of an Indian catfish, Heteropneustes-fossilis (Bloch), and its recovery. 696 Ecotoxicol. Environ. Saf. 20, 30-35. 697
Souid, G., Souayed, N., Yaktiti, F., Maaroufi, K., 2013. Effect of acute cadmium exposure on metal 698 accumulation and oxidative stress biomarkers of Sparus aurata. Ecotoxicol. Environ. Saf. 89, 1-699 7. 700
20
Stadtman, E.R., Oliver, C.N., 1991. Metal-catalyzed oxidation of proteins. Physiological consequences. 701 J. Biol. Chem. 266, 2005-2008. 702
Stephenson, M., Bendell Young, L., Bird, G.A., Brunskill, G.J., Curtis, P.J., Fairchild, W.L., Holoka, 703 M.H., Hunt, R.V., Lawrence, S.G., Motycka, M.F., Schwartz, W.J., Turner, M.A., Wilkinson, P., 704 1996. Sedimentation of experimentally added cadmium and Cd- 109 in Lake 382, Experimental 705 Lakes Area, Canada. Can. J. Fish. Aquat. Sci. 53, 1888–1902. 706
Szebedinszky, C.S., McGeer, J.C., McDonald, D.G., Wood, C.M., 2001. Effects of chronic Cd exposure 707 via the diet or water on internal organ-specific distribution and subsequent gill Cd uptake kinetics 708 in juvenile rainbow trout (Oncorhynchus mykiss). Environ. Toxicol. Chem. 20, 597-607. 709
Takeyasu, K., Tamkun, M.M., Renaud, K.J., Fambrough, D.M., 1988. Ouabain-sensitive (Na+, K+-710 ATPase activity expressed in mouse L cells by transfection with DNA encoding the α-subunit of 711 an avian sodium pump. J. Biol. Chem. 273, 4347-4354. 712
Thophon, S., Kruatrachue, M., Upatham, E.P., Pokethitiyook, P., Sahaphong, S., Jaritkhuan, S., 2003. 713 Histopathological alterations of white sea bass, Lates calcarifer, in acute and subchronic cadmium 714 exposure. Environ. Pollut. 121, 307–320. 715
Ura, K., Soyano, K., Omoto, N., Adachi, S., Yamauchi, K., 1996. Localization of Na+, K+-ATPase in 716 tissues of rabbit and teleosts using an antiserum directed against a partial sequence of the alpha-717 subunit. Zool. Sci. 13, 219-227. 718
USEPA., 2001. Update of ambient water quality criteria for cadmium. EPA-822-R-01 001. United States 719 Environmental Protection Agency (USEPA). Washington, DC, USA. 720
Vaglio, A., Landriscina, C., 1999. Changes in liver enzyme activity in the teleost Sparus aurata in 721 response to cadmium intoxication. Ecotoxicol. Environ. Saf. 43, 111–116. 722
Valavanidis, A., Vlahogianni, T., Dassenakis, M., Scoullos, M., 2006. Molecular biomarkers of oxidative 723 stress in aquatic organisms in relation to toxic environmental pollutants. Ecotoxicol. Environ. Saf. 724 64, 178–189. 725
Van der Oost, R., Beyer, J., Vermeulen, N.P.E., 2003. Fish bioaccumulation and biomarkers in 726 environmental risk assessment: a review. Environ. Toxicol. Pharmacol. 13, 57–149. 727
Wendelaar Bonga, S.E., 1997. The stress response in fish. Physiol. Rev. 77, 591-625. 728 Wilson, J.M., Antunes, J.C., Bouça, P.D., Coimbra, J., 2004. Osmoregulatory plasticity of the glass eel of 729
Anguilla anguilla: freshwater entry and changes in branchial ion-transport protein expression. Can. 730 J. Fish. Aquat. Sci. 61, 432-442. 731
Wilson, J.M., Laurent, P., 2002. Fish gill morphology: Inside out. J. Exp. Zool. 293, 192-213. 732 Wu, S.M., Shih, M.J., Ho, Y.C., 2007. Toxicological stress response and cadmium distribution in hybrid 733
tilapia (Oreochromis sp.) upon cadmium exposure. Comp. Biochem. Physiol. C Toxicol. 734 Pharmacol. 145C, 218–226. 735
Wu, S.M., Weng, C.F., Yu, M.J., Lin, C.C., Chen, S.T., Hwang, J.C., Hwang, P.P., 1999. Cadmium-736 inducible metallothionein in tilapia (Oreochromis mossambicus). Bull. Environ. Contam. Toxicol. 737 62, 758-768. 738
Yudkovski, Y., Rogowska-Wrzesinska, A., Yankelevich, I., Shefer, E., Herut, B., Tom M., 2008. 739 Quantitative immunochemical evaluation of fish metallothionein upon exposure to cadmium. 740 Marine Environ. Res. 65, 427–436. 741
Zhang, T., Zhang, Y., Li, D., Xiao, T., Li, J., 2013. Exposure of silver carp (Hypophthalmichthys 742 molitrix) to environmentally relevant levels of cadmium: hematology, muscle physiology, and 743 implications for stock enhancement in the Xiangjiang River (Hunan, China). Sci. China Life Sci. 744 56, 66-72. 745
746
21
Figure captions 747
748
Figure 1. Lipid peroxidation (A) and protein carbonylation (B) values in gill of tilapia exposed 749
by intraperitoneal injection to different concentrations of cadmium and sacrificed after 1, 4 and 750
7 days. The values are expressed as mean ± SEM (n=10). Comparisons between treatment 751
groups at the same exposure time with different lower cases are significantly different. Different 752
capital letters within each treatment group indicate significant differences between exposure 753
times. (P < 0.05) 754
755
Figure 2. Branchial (A) and renal (B) Na+/K+-ATPase activity of tilapia exposed by 756
intraperitoneal injection to different concentrations of cadmium and sacrificed after 1, 4 and 7 757
days. The values are expressed as mean ± SEM (n=10). All other details are identical to those in 758
Fig. 1 legend. 759
760
Figure 3. Effect of Cd intraperitoneal injection on Na+/K+-ATPase α-subunit, PCNA and 761
HSP70 expression determined by immunoblotting, in gill (A, C, E) and kidney (B, D, F) of O. 762
niloticus, after 1 and 7 days of exposition. The values are expressed as mean ± SEM (n=10) 763
relative to Cd0-1d. All other details are identical to those in Fig. 1 legend. 764 765
22
Figure 1
766

23
Figure 2
767
24
Figure 3
768
25
Table 1: Morphometric parameters and muscle water content of O. niloticus injected with different cadmium concentrations.
Data are presented as mean ± SEM (n=10). Values with different lowercase letters within the same time of exposure (in the same line) are significantly different. Within each Cd treatment, values with different capital letters (in the same column) are significantly different. (P < 0.05, two-way ANOVA, SNK test). Cd0 = fish injected with 0.9% NaCl (control); Cd 1.25 and Cd 2.5 = Fish injected with 1.25 and 2.5 mg Cd Kg-1, respectively. 769
Exposure days
Treatment
Cd 0 Cd 1.25 Cd 2.5
Condition factor (g cm-3)
1d 2.22 ± 0.10 2.11 ± 0.07 2.21 ± 0.16
4d 2.03 ± 0.11 2.21 ± 0.12 2.02 ± 0.09
7d 2.09 ± 0.06 2.35 ± 0.11 2.19 ± 0.11
Hepatosomatic index (%)
1d 0.89 ± 0.06 0.81 ± 0.06 0.86 ± 0.07 A
4d 1.03 ± 0.10 0.93 ± 0.06 1.03 ± 0.10 AB
7d 0.81 ± 0.06 (a) 0.82 ± 0.08 (a) 1.11 ± 0.07 B(b)
Muscle water content (%)
1d 79.37 ± 0.30 79.59 ± 0.32 79.92 ± 0.32
4d 79.83 ± 0.17 79.70 ± 0.19 79.80 ± 0.22
7d 79.68 ± 0.21 79.73 ± 0.19 79.29 ± 0.21
26
Table 2: Concentrations of Cd in µg g-1 dry mass in gills and kidney of tilapia intraperitoneally injected with either saline (Cd 0), 1.25 mg Kg-1 Cd (Cd 1.25), or 2.5 mg Kg Cd-1 (Cd 2.5).
Data are presented as mean ± SEM (n=3). Values with different lowercase letters within the same time of exposure (in the same row) are significantly different. Within each Cd treatment, values with different capital letters (in the same column) are significantly different. (P < 0.05, two-way ANOVA, SNK test). 770
Exposure days
Treatment
Cd 0 Cd 1.25 Cd 2.5
Gills
1d 1.07 ± 0.13 (a) 28.12 ± 1.14 (b) 57.04 ± 14.34 (b)
4d 1.00 ± 0.08 (a) 25.67 ± 8.68 (b) 38.32 ± 7.40 (b)
7d 1.14 ± 0.20 (a) 25.63 ± 6.23 (b) 35.98 ± 8.16 (b)
Kidney
1d 8.24 ± 2.20 (a)
1d
Ctrl 1,4829562 0,393
6
Cd1,25 33,85239013 5,643
9
Cd2,5 41,75478123 8,258
1
4d
Ctrl 1,582831878 0,331
9
Cd1,25 39,7258499 5,430
1 Cd2,5 71,01788141 13,18
7d
Ctrl 1,469178822 0,383
8
Cd1,25 74,17970173 19,22
6
Cd2,5 82,90123781 5,630
8
195.03 ± 37.99 (b) 198.28 ± 51.07 (b)A
4d 8.64 ± 1.43 (a) 167.06 ± 36.62 (b) 283.02 ± 57.69 (b)AB
7d 8.58 ± 2.12 (a)
84,19792498
349.11 ± 92.02 (b) 418.64 ± 14.10 (b)B
27
Table 3: Biochemical parameters measured in plasma of O. niloticus injected with different cadmium concentrations.
Data are presented as mean ± SEM (n=10). Values with different lowercase letters within the same time of exposure (in the same line) are significantly different. Within each Cd treatment, values with different capital letters (in the same column) are significantly different. (P < 0.05, two-way ANOVA, SNK test). Cd0 = fish injected with 0.9% NaCl (control); Cd 1.25 and Cd 2.5 = Fish injected with 1.25 and 2.5 mg Cd Kg-1, respectively.
Exposure days
Treatment
Cd 0 Cd 1.25 Cd 2.5
Glucose (mmol/L)
1d 1.40 ± 0.09 (a) 2.82 ± 0.51 A(b) 2.38 ± 0.17 A(b)
4d 1.80 ± 0.12 1.76 ± 0.07 B 1.83 ± 0.16 B
7d 1.54 ± 0.14 1.58 ± 0.23 B 1.60 ± 0.13 B
Triglycerides (mmol/L)
1d
4d
7d
0.63 ± 0.03 0.71 ± 0.12 0.60 ± 0.04 A
4d 0.89 ± 0.14 0.82 ± 0.10 0.69 ± 0.06 A
7d 0.71 ± 0.03 (a) 0.90 ± 0.08 (a) 1.35 ± 0.22 B(b)
Lactate (mmol/L)
1d 0.42 ± 0.10 0.60 ± 0.08 0.52 ± 0.08
4d 0.45± 0.06 (a) 0.92 ± 0.17 (b) 0.69 ± 0.14 (ab)
7d 0.41 ± 0.07 0.48 ± 0.07 0.40 ± 0.39
Cortisol (ng/L)
1d 34.6 ± 5.0 49.6 ± 14.1 A 38.4 ± 2.8 A
4d 51.6 ±15.9 50.6 ± 7.6 A 38.1 ± 5.5 A
7d 69.2 ± 9.6 136.3 ± 42.6 B 123.8 ± 40.6 B
Sodium (mmol/L))
1d 170.66 ± 11.29 A(a) 146.21 ± 4.52 (b) 138.63 ± 3.02 (b)
4d 135.81 ± 4.83 B 141.57 ± 5.72 150.68 ± 4.07
7d 162.34 ± 5.66 A(a) 149.94 ± 4.51(ab) 141.60 ± 2.45 (b)
Calcium (mmol/L)
1d 2.26 ± 0.30 2.29 ± 0.16 2.16 ± 0.26
4d 2.49 ± 0.39 2.57 ± 0.27 2.53 ± 0.25
7d 2.33 ± 0.24 1.92 ± 0.18 2.58 ± 0.43