A Growth Comparison Among Three Commercial Tilapia ...
107
A Growth Comparison Among Three Commercial Tilapia Species in a Biofloc Technology System in South Africa by Scott Bowerbank Day Thesis presented in partial fulfilment of the requirements for the degree of Master of Science in the Faculty of AgriSciences at Stellenbosch University Supervisor: Dr Khalid Salie Co-supervisor: Prof Danie Brink Faculty of AgriSciences Department of Animal Sciences December 2015
-
Upload
khangminh22 -
Category
Documents
-
view
1 -
download
0
Transcript of A Growth Comparison Among Three Commercial Tilapia ...

A Growth Comparison Among Three Commercial Tilapia Species in a Biofloc
Technology System in South Africa
by
Scott Bowerbank Day
Thesis presented in partial fulfilment of the requirements for the degree of Master of Science
in the Faculty of AgriSciences at Stellenbosch University
Supervisor: Dr Khalid Salie
Co-supervisor: Prof Danie Brink
Faculty of AgriSciences
Department of Animal Sciences
December 2015

i
Declaration
By submitting this thesis electronically, I declare that the entirety of the work contained therein
is my own, original work, that I am the sole author thereof (save to the extent explicitly
otherwise stated), that reproduction and publication thereof by Stellenbosch University will not
infringe any third party rights and that I have not previously in its entirety or in part submitted
it for obtaining any qualification.
Date: December 2015
Copyright © 2015 Stellenbosch University
All rights reserved
Stellenbosch University https://scholar.sun.ac.za

ii
Summary
With environmental conservation playing a growing role in decision making today, the aquaculture
industry has sought new innovative ways to reduce the impact on the environment, and maximize
efficiency. Much of the focus of such developments has included lower water usage and better feed
utilization, with the emergence of biofloc technology systems addressing such needs. Tilapia has been
identified as a fish for the future, with its production having already risen to make it an important food
fish globally, and an increase in its market share is predicted going forward. Although it is common
around the world, the production of tilapia has failed to take off in South Africa, with the reasoning being
put forward including; legislative restrictions, unfavourable climate, incorrect species choice and
shortage of expertise and supporting industry.
The major aims of this study were to address the main constraints and uncertainties facing the local
tilapia industry in terms of species choice, and to investigate the biofloc technology concept under local
conditions. Being restricted to the use of the Mozambique tilapia (Oreochromis mossambicus), and with
the recent changes allowing the use of the Nile tilapia (Oreochromis niloticus), the question whether O.
niloticus will in fact outperform O. mossambicus under South African conditions, was raised. With the
production of the Three Spot tilapia (Oreochromis andersonii) also prevalent in southern Africa, this
species was also included in the study. The secondary aim of the study was to create a profile of key
water quality parameters during the start-up period of the biofloc technology system prior to fish being
introduced, and throughout the course of the trial.
With the biofloc technology concept being expected to play a role in the development of the South
African tilapia industry, the study was conducted in a biofloc technology system. Twelve tanks,
connected through airlift pumps to homogenize the water quality, were stocked with fish. Each of the
three species were stocked randomly into four tanks with each tank being considered an independent
replicate. The growth trial was conducted within a greenhouse, and commenced at the start of the
summer grow out period for tilapia in South Africa, in October 2014, running for 10 weeks. Fish were
sampled fortnightly from the system, with the mass data being used to fit a linear regression. Water
quality measurements were taken from the start-up period in mid-September, for 12 weeks.
Profiles for temperature, dissolved oxygen, pH, salinity, electro-conductivity, total dissolved solids, floc
volume, total ammonia nitrogen, nitrite, nitrate, orthophosphate, total suspended solids and turbidity
were successfully documented over the trial period. Two spikes in total ammonia nitrogen and nitrite
were recorded, one during start-up, and one following a water loss event during the trial. A regression
fitted to the mass data showed O. niloticus to have the highest growth rate with an average daily gain
of 0.693±0.018 g/day, followed by O. mossambicus of 0.405±0.025 g/day, and then O. andersonii of
0.185±0.025 g/day, with significant difference between all three species. The lowest feed conversion
ratio was also recorded for O. niloticus being 1.00±0.05, followed by O. mossambicus of 2.24±0.16, and
O. andersonii with 2.53±0.28. These results suggest that of the three species investigated, O. niloticus
performs best in a biofloc technology system in South African conditions. It is recommended that this
species should therefore be used in biofloc technology systems as they develop in South Africa.
Stellenbosch University https://scholar.sun.ac.za

iii
Opsomming
Omgewingsbewaring speel vandag ‘n toenemend groter rol in besluitnemingsprosesse. In hierdie lig is
die akwakultuurbedryf op soek na nuwe, innoverende maniere om impak op die omgewing te verminder
en doeltreffendheid te maksimeer. Heelwat van die fokus in sulke ontwikkelinge is op laer waterverbruik
en meer effektiewe voerbenutting gebaseer. Met die ontwikkeling van biofloc tegnologie sisteme, kan
sulke behoeftes aangespreek word. Tilapia is geidentifiseer as 'n vis vir die toekoms. Die produksie van
tilapia is toenemend besig om te styg en is reeds 'n belangrike voedselbron wêreldwyd terwyl 'n verdere
verhoging in markaandele voorspel word. Alhoewel die produksie van tilapia regoor die wêreld
algemeen voorkom, het produksie nog nie werklik in Suid-Afrika posgevat nie. Die redes hiervoor is
onder andere: wetlike beperkings, ongunstige klimaat, verkeerde spesie-keuses, 'n tekort aan
kundigheid en gebrekkige ondersteuning van die bedryf.
Die hoofdoelwitte van die studie was om die belangrikste beperkinge en onsekerhede wat die plaaslike
tilapia-bedryf in terme van spesie-keuse ervaar te identifiseer en om die biofloc tegnologie-konsep
onder plaaslike omstandighede, te ondersoek. Beperk tot die gebruik van die Blou Kurper (Oreochromis
mossambicus) en met die veranderinge wat die gebruik van die Nyl Kurper (Oreochromis niloticus)
wettig gemaak het, was die vraag: Watter van of O. niloticus of O. mossambicus beter onder Suid-
Afrikaanse toestande sal presteer. Die Driekol Kurper (Oreochromis andersonii), algemeen geboer in
suidelike Afrika, was ook vir die studiedoeleindes ingesluit. Die sekondêre doel van die studie was om
'n profiel op te bou van die belangrikste waterkwaliteit-parameters vanaf die begin van die
aanvangstydperk van die biofloc tegnologie systeem, voor vis ingesit was, en deurlopend tot aan die
einde van die hele studie.
Met die konsep, wat verwag was om 'n belangrike rol te speel in die ontwikkeling van die Suid-
Afrikaanse tilapia-bedryf, het die studie in 'n biofloc tegnologie sisteem plaasgevind. Vier herhalingtenks
vir elk van die drie spesies (behandelings) was opgestel. Die aanwasproef het binne 'n kweekhuis
plaasgevind. Dit het met die aanvang van die somer-uitgroei-tydperk in Oktober 2014 begin, en vir 10
weke geduur. Vismonsters was twee-weekliks geneem en die massadata was gebruik om 'n lineêre
regressiekurwe op te stel. Waterkwaliteitmetings was vanaf die aanvangstydperk in middel-September
2014, vir 12 weke geneem.
Profiele vir temperatuur, suurstof, pH, soutgehalte, elektro-konduktiwiteit, opgeloste vastestowwe, floc
volume, totale ammoniakstikstof, nitriet, nitraat, ortofosfate, totale gesuspendeerde vastestowwe en
troebelrigheid was suksesvol gedokumenteer oor die proeftydperk. Twee uiterstes in totale
ammoniakstikstof en nitriet is aangeteken: een aan die begin, tydens die aanvangstydperk, en ‘n ander
na 'n waterverlies-geval tydens die proef. Oreochromis niloticus het die hoogste groeitempo van
0.693±0.018 g/dag gehad, gevolg deur O. mossambicus van 0.405±0.025 g/dag en dan O. andersonii
van 0.185±0.025 g/dag, met 'n beduidende verskil tussen al drie spesies. Die laagste
voeromsettingsverhouding van 1.00±0.05 was aangeteken vir O. niloticus, gevolg deur 2.24±0.16 vir
O. mossambicus en dan 2.53±0.28 vir O. andersonii. Die uitslae dui daarop dat O. niloticus die beste
Stellenbosch University https://scholar.sun.ac.za

iv
presteer in 'n biofloc tegnologie sisteem onder Suid-Afrikaanse toestande. Dit word dus aanbeveel dat
O. niloticus gebruik moet word in biofloc tegnologie sisteme soos dit verder in Suid-Afrika ontwikkel.
Stellenbosch University https://scholar.sun.ac.za

v
Acknowledgements
I would like to express my gratitude to the following:
Dr Khalid Salie, my supervisor, for his steering of the process, and academic supervision.
Prof. Danie Brink for his guidance and support, and always having an open door despite his
busy schedule.
Henk Stander for his assistance both technical and academic with great willingness to always
help.
Gail Jordaan for all her effort and patience with me and the statistics.
Anvor Adams for his on-the-ground help with the trial, friendship and encouragement.
The Agar Hamilton Trust and the Harry Crossley Trust for their financial support and for
backing me in the research being done when the odds were stacked up against us.
The Faculty of AgriSciences for the financial assistance and recognizing the importance of the
research.
Stellenbosch University https://scholar.sun.ac.za

vi
Dedication
I would like to dedicate this thesis to my father and mother, Philip and Michelle. Thank you for
always challenging Michael and I, and doing all in your power to ensure the best for us. Thank
you for stepping things up when we outgrew our surroundings. Thank you for an incredible
foundation you built for us, and a stable home. You have allowed us to get to where we are
today, and I cannot fault the way you brought us up. Thank you for identifying the importance
of education, but also guiding me to understand that life is more than that. Thank you for
allowing me to get to know God, and to develop a personal relationship with Him, that He may
guide me, and use my talents. Thank you for ensuring that the base is set for me to think for
myself and be effective in what I do. You have gone far beyond your call of duty to ensure that
my life is a success beyond worldly terms, and I am humbled to be living it.
Stellenbosch University https://scholar.sun.ac.za

vii
Notes
The language and style used in this thesis are in accordance with the requirements of the Aquaculture International Journal. This thesis represents a compilation of manuscripts where each chapter is an individual entity and some repetition between chapters has been unavoidable.
Stellenbosch University https://scholar.sun.ac.za

viii
Table of Contents
Declaration ............................................................................................................................. i
Summary ...............................................................................................................................ii
Opsomming .......................................................................................................................... iii
Acknowledgements ............................................................................................................... v
Dedication ............................................................................................................................. vi
Notes ................................................................................................................................... vii
1 Introduction .................................................................................................................... 1
1.1 World Aquaculture .................................................................................................. 1
1.2 Tilapia Production.................................................................................................... 1
1.3 Progression of the Industry ...................................................................................... 2
1.4 Biofloc Technology .................................................................................................. 4
1.5 South African Finfish Aquaculture Industry .............................................................. 4
1.6 Rationale ................................................................................................................. 5
1.7 Aims ........................................................................................................................ 6
1.8 References .............................................................................................................. 7
2 Literature Review ........................................................................................................... 9
2.1 Global Tilapia Production ........................................................................................ 9
2.2 Biofloc Technology (BFT)...................................................................................... 14
2.3 Tilapia Biology ...................................................................................................... 25
2.4 Feeding ................................................................................................................. 31
2.5 References ........................................................................................................... 41
3 A Growth Comparison Among Three Commercial Tilapia Species in a Biofloc System 55
3.1 Abstract ................................................................................................................ 55
3.2 Introduction ........................................................................................................... 55
3.3 Material and Methods ........................................................................................... 57
3.4 Results .................................................................................................................. 61
3.5 Discussion ............................................................................................................ 65
Stellenbosch University https://scholar.sun.ac.za
ix
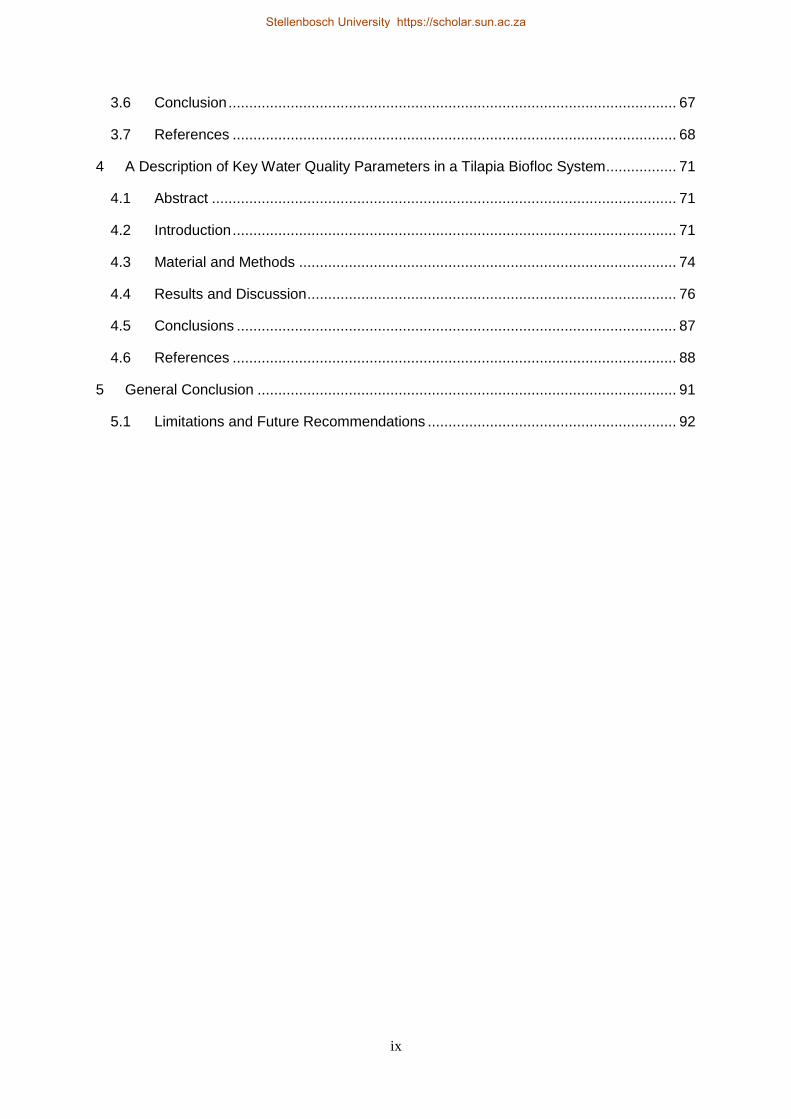
3.6 Conclusion ............................................................................................................ 67
3.7 References ........................................................................................................... 68
4 A Description of Key Water Quality Parameters in a Tilapia Biofloc System ................. 71
4.1 Abstract ................................................................................................................ 71
4.2 Introduction ........................................................................................................... 71
4.3 Material and Methods ........................................................................................... 74
4.4 Results and Discussion ......................................................................................... 76
4.5 Conclusions .......................................................................................................... 87
4.6 References ........................................................................................................... 88
5 General Conclusion ..................................................................................................... 91
5.1 Limitations and Future Recommendations ............................................................ 92
Stellenbosch University https://scholar.sun.ac.za

x
List of Figures
Figure 1.1. World production from capture fisheries and aquaculture over time, modified from FAO
(2014). ............................................................................................................................................. 3
Figure 2.1. The global annual production of tilapia in Metric Tons from 1950-1990 compiled with data
obtained from FAO (2015b). ......................................................................................................... 10
Figure 2.2. The global annual production of tilapia in Metric Tons from 1991-2013 compiled with data
obtained from FAO (2015b). ......................................................................................................... 11
Figure 2.3. Illustrates the value of the global tilapia aquaculture sector from 2002-2013 compiled with
data obtained from FAO (2015b). ................................................................................................. 12
Figure 2.4. Global tilapia production by region for 2012 (FIGIS 2015b). .............................................. 13
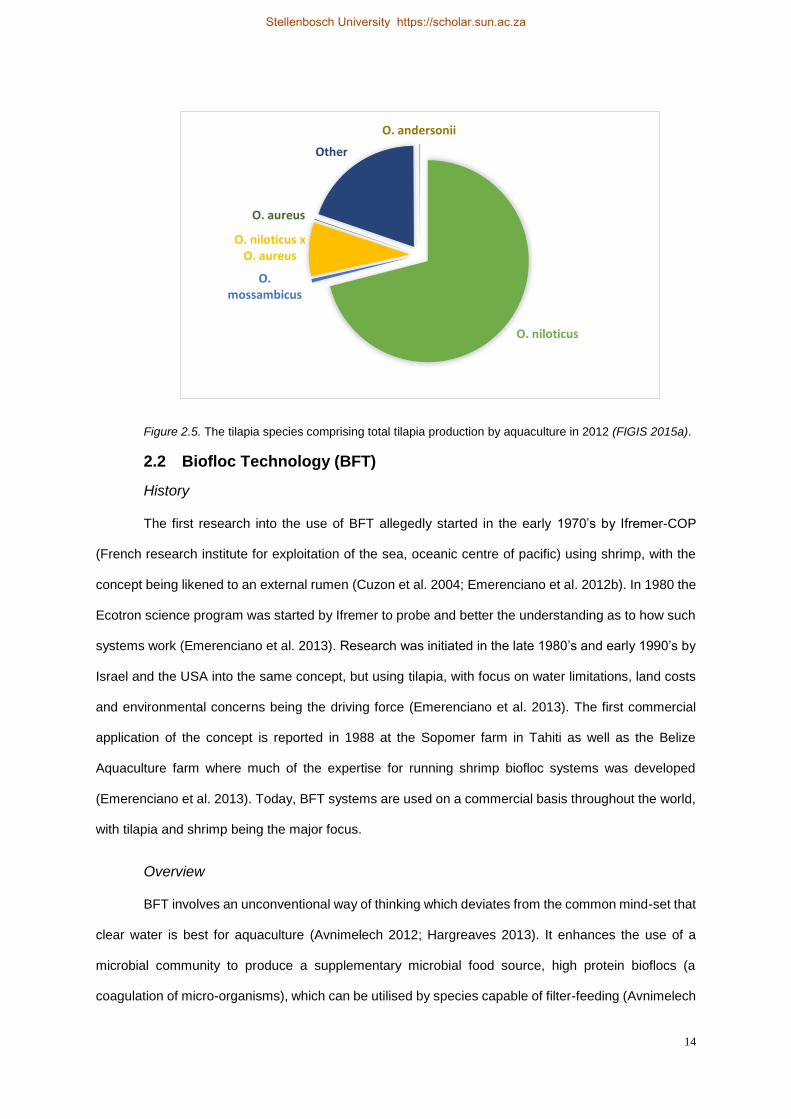
Figure 2.5. The tilapia species comprising total tilapia production by aquaculture in 2012 (FIGIS
2015a). .......................................................................................................................................... 14
Figure 2.6. Global distribution of Oreochromis niloticus (Global.Mapper 2015). .................................. 27
Figure 2.7. Global distribution of Oreochromis mossambicus (Global.Mapper 2015). ......................... 27
Figure 2.8. Global distribution of Oreochromis andersonii (Global.Mapper 2015). .............................. 28
Figure 2.9. A single biofloc, a coagulation of micro-organisms with the scale bar being 100 microns
(Hargreaves 2013). ....................................................................................................................... 35
Figure 2.10. The heterotrophic pathway exhibited in a biofloc technology (BFT) system (Avnimelech
2012). ............................................................................................................................................ 36
Figure 3.1. The experimental setup displaying the 250 L tanks used as well as the main 40 mm
aeration ring. ................................................................................................................................. 57
Figure 3.2. A regression for each species fitted on the rate of mean mass increase. .......................... 64
Figure 4.1. Morning and afternoon water temperatures through the course of the trial, measured twice
daily at 08h00 (am) and 16h00 (pm) in the system....................................................................... 77
Figure 4.2. Morning and afternoon dissolved oxygen (DO) levels of the tank water through the course
of the trial, measured twice daily at 08h00 (am) and 16h00 (pm). ................................................ 78
Figure 4.3. EC, salinity and total dissolved solid (TDS) levels through the course of the trial, measured
twice daily at 08h00 (am) and 16h00 (pm) in the system. ............................................................ 79
Figure 4.4. Orthophosphate (PO4) levels measured in the tanks through the course of the trial. ....... 80
Figure 4.5. Turbidity measured in formazin attenuation units (FAU) and total suspended solid (TSS)
levels measured in the tanks through the course of the trial. ....................................................... 81
Figure 4.6. Floc volume (FV) levels through the course of the trial, measured twice daily in the
system. .......................................................................................................................................... 82
Figure 4.7. Morning and afternoon pH levels through the course of the trial, measured twice daily in
the system. .................................................................................................................................... 83
Figure 4.8. The profiles of nitrogenous compounds, a) total ammonia nitrogen (TAN), b) nitrite (NO2),
c) un-ionised ammonia nitrogen (UIA-N), and d) nitrate (NO3) measured from tank water over the
course of the trial. .......................................................................................................................... 85
Stellenbosch University https://scholar.sun.ac.za
xi
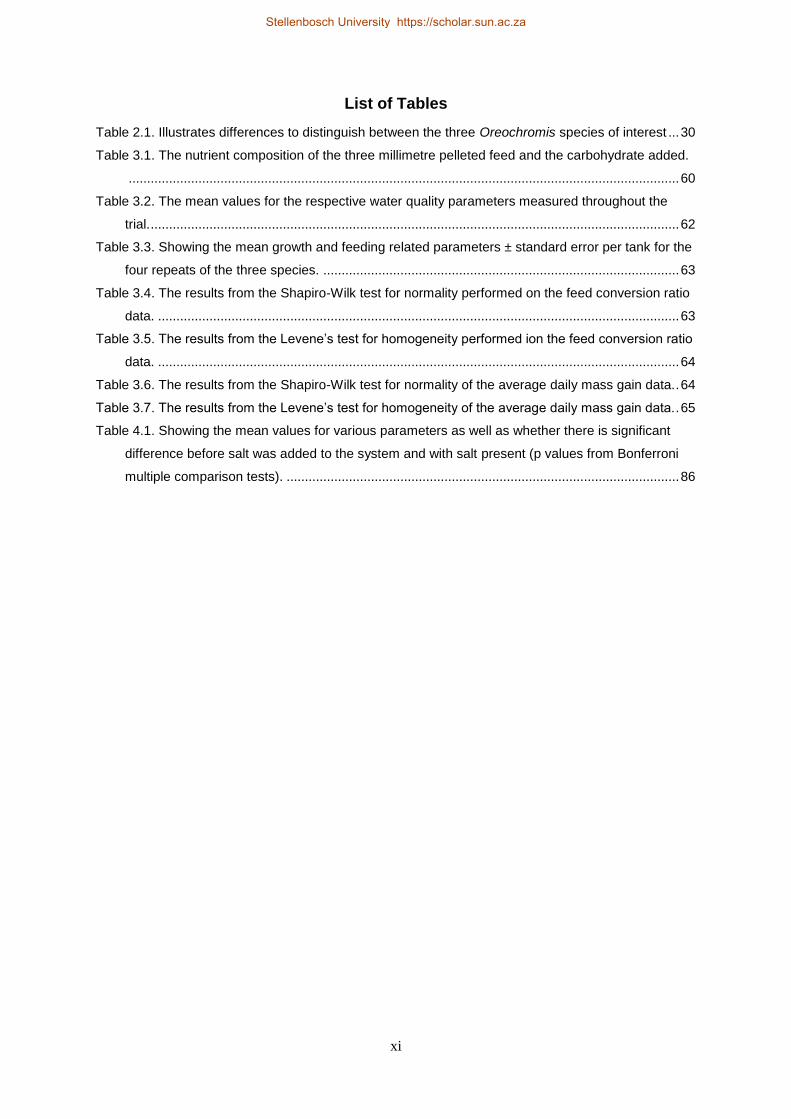
List of Tables
Table 2.1. Illustrates differences to distinguish between the three Oreochromis species of interest ... 30
Table 3.1. The nutrient composition of the three millimetre pelleted feed and the carbohydrate added.
...................................................................................................................................................... 60
Table 3.2. The mean values for the respective water quality parameters measured throughout the
trial. ................................................................................................................................................ 62
Table 3.3. Showing the mean growth and feeding related parameters ± standard error per tank for the
four repeats of the three species. ................................................................................................. 63
Table 3.4. The results from the Shapiro-Wilk test for normality performed on the feed conversion ratio
data. .............................................................................................................................................. 63
Table 3.5. The results from the Levene’s test for homogeneity performed ion the feed conversion ratio
data. .............................................................................................................................................. 64
Table 3.6. The results from the Shapiro-Wilk test for normality of the average daily mass gain data. . 64
Table 3.7. The results from the Levene’s test for homogeneity of the average daily mass gain data. . 65
Table 4.1. Showing the mean values for various parameters as well as whether there is significant
difference before salt was added to the system and with salt present (p values from Bonferroni
multiple comparison tests). ........................................................................................................... 86
Stellenbosch University https://scholar.sun.ac.za

xii
Symbols and Abbreviations
ºC - Degrees Celsius
> - Larger than
% - Percentage
< - Smaller than
ANOVA – Analysis of Variance
BOD - Biological Oxygen Demand
BFT – Biofloc Technology
C:N - Carbon-to Nitrogen Ratio
CH – Carbohydrate
DO – Dissolved Oxygen
EC – Electro-conductivity
FCR - Feed Conversion Ratio
FV – Floc Volume
GMO - Genetically Modified Organism
HDPE - High Density Polyethylene
IA-N – Ionised Ammonium
LS – Least Squares (Mean)
MCCI - Microbial Community Colour Index
MSY - Maximum Sustainable Yield
Mt - Metric tons
NO2 - Nitrite
NO3 – Nitrate
NOB - Nitrite Oxidising Bacteria
NTU - Nephelometric Turbidity Units
P – Probability as a statistically significant limit
PO4 – Orthophosphate
pp. - Pages
Stellenbosch University https://scholar.sun.ac.za

xiii
PVC - Polyvinyl Chloride
RAS - Recirculating Aquaculture System
SL – Standard Length
spp. - Species
TAN – Total Ammonia Nitrogen
TDS - Total Dissolved Solids
TL – Total Length
TSS - Total Suspended Solids
UIA-N – Un-Ionised Ammonium
USD – United States Dollars
Stellenbosch University https://scholar.sun.ac.za

1
1 Introduction
1.1 World Aquaculture
With declining wild fish stocks, aquaculture has risen globally to supply an estimated
70,500,000 Mt of food fish in 2013 (FAO 2014). Ninety-two point seven percent of the farmed fish in
2012 was produced in just 15 countries, with about 88 % of the production by volume taking place in
Asia (FAO 2014). With this knowledge base gained in such areas, and the many areas with suitable
conditions yet undeveloped, there is much room for the expansion of the industry into new regions.
In recent times between 2000 and 2012, the production of food fish by aquaculture has more
than doubled (FAO 2014). Over the same period, Africa is the continent which has shown the highest
growth rate of aquaculture production being 11.7 % annually (FAO 2014). Much of this growth is
attributed to the development of the booming Tilapia industry in Egypt (El-Sayed 2013).
The global production of food fish is dominated by inland, freshwater fish culture, making up
57.9 % of production in 2013 (FAO 2014). Between 2000 and 2010, the mean annual growth rate for
production in freshwater aquaculture systems was 7.2 % (FAO 2012). Of the freshwater species
cultured, carps make up the major portion of around 72 % of production by volume, followed by tilapias
and catfishes (FAO 2012).
1.2 Tilapia Production
Originating from Africa, tilapia has been deemed the fish of the 21st century (El-Sayed 2013),
with a rise in its share of global production being imminent. Currently it is the most widely produced
species around the world, with production being recorded in 135 countries (FAO 2014). The production
systems used for tilapia culture are usually simple semi-intensive systems, with only basic techniques
required for successful cultivation. Favouring warmer water, and being an easily produced species (El-
Sayed 2013), tilapia shows great promise in the many developing countries located within warmer
regions.
The hardy nature of the species is evident in the large range in environmental parameters
tolerable by tilapia (Boyd 2004; Jamandre et al. 2011; Celik 2012). This trait is beneficial in the basic
culture techniques practised, where there may be a lack in the availability of effective mechanisms for
Stellenbosch University https://scholar.sun.ac.za

2
water quality control and monitoring due to the nature of the systems. Being positioned at a low-trophic
level with omnivorous feeding habits (Njiru et al. 2004; Fitzsimmons et al. 2011), tilapia is able to utilize
a plant based diet effectively, and produce a versatile product well accepted by consumers (Brown et
al. 2014; Andretto et al. 2015).
The role of such freshwater fish farming, identified as the fundamental mechanism for achieving
food and protein security (FAO 2014), cements the place of tilapia in the future as a key species in
developing countries. With large portions of the world’s population living under the poverty line,
particularly in developing countries holding potential for tilapia culture, the capacity for employing basic
culture methods using tilapia is prevalent, and can potentially play a critical humanitarian role.
1.3 Progression of the Industry
There has been a significant rise in the prevalence of aquaculture since the 1970’s when the
fish supplied by capture fisheries begun to level off (Figure 1.1). Today, all rise in demand for seafood
is supplied by aquaculture, with capture fisheries in a steady to declining state. The early methods used
in aquaculture, particularly the salmon industry in Europe in the 1970’s and 80’s, were often considered
highly detrimental to the environment (Tveterås 2002), creating a negative stigma still haunting the
aquaculture industry today. The use of fishmeal and medicines, diseases, the escape of farmed fish,
the enrichment of water through effluent, long term sustainability and the use of Genetically Modified
Organisms (GMO’s) are some of the issues which have brought aquaculture under public scrutiny
(Hallerman and Kapuscinski 1995; Beveridge et al. 1997; Tovar et al. 2000; Tveterås 2002). Over time,
as would be expected with any developing industry, many of these issues have been remedied, with
research ongoing into developing more efficient culture mechanisms.
Stellenbosch University https://scholar.sun.ac.za

3
Figure 1.1. World production from capture fisheries and aquaculture over time, modified from FAO (2014).
With the environmental impact of all industries becoming an ever increasing
consideration, there has been a worldwide drive to go “green”, and ensure the sustainability of our
practises. With aquaculture being a largely technology driven industry, new innovative ways of limiting
the harm caused on the environment, are emerging. One such facet under intense investigation is the
search for alternative protein sources to the traditionally used fishmeal, which is diminishing in supply
(Carter and Hauler 2000; Millamena 2002; Naylor et al. 2009). Being able to replace fishmeal in the
manufacture of aquafeeds, aids in relieving pressure on strained stocks supplying the fishmeal, as well
as significantly decreasing the high cost of aquafeeds.
An exciting field emerging with a wide application which is ever broadening, is the use of micro-
organisms. Due to the sheer diversity, and lack of sufficient knowledge (Zhou et al. 2009), the
application of micro-organisms in our everyday lives is a largely unexplored field, virtually untapped.
Although the role of micro-organisms has been known, and relied upon in aquaculture for centuries
(Moriarty 1997), knowledge on the detailed mechanisms as to how they work, and their enhancement
has been limited. It is no surprise that their potential impact on the aquaculture industry could be
enormous. Rooted in innovation, aquaculture research has begun to look into developing a better
understanding, and incorporating this field with vast potential into the aquaculture industry. The
application of using micro-organisms to clean water has therefore emerged, with one facet being that
of biofloc technology (BFT).
Stellenbosch University https://scholar.sun.ac.za

4
1.4 Biofloc Technology
Biofloc technology research in the USA and Israel begun in the late 1980’s and early 90’s with
the focus being on limiting water and land usage, as well as reducing the environmental impact of
aquaculture practises (Emerenciano et al. 2013; Hargreaves 2013). The concept enhances the action
of predominantly heterotrophic bacteria, through raising the carbon to nitrogen ratio (C:N) within the
water of the culture environment, by adding an organic carbon source (Avnimelech 2012). The water is
well-aerated and vigorously mixed to ensure that heterotrophic bacteria proliferate, with the nitrogenous
compounds, excreted by the fish and excess feed, being the limiting factor to the growth of the
heterotrophic community (Avnimelech 2012; Hargreaves 2013). The mixing plays an important role in
keeping the coagulations of micro-organisms, referred to as bioflocs, in suspension, and therefore
prevents anoxic conditions from developing on the pond/tank bottom (Avnimelech 2012; Hargreaves
2013). By successfully implementing a BFT system, the benefit is two pronged. Firstly, dangerous
nitrogen species are eliminated from the water in situ, therefore avoiding the need for filtration, and
allowing much higher stocking densities to be achieved than are observed in extensive systems
(Avnimelech 2012; Hargreaves 2013). Secondly, nutrients are recycled from the waste and
incorporated into microbial protein by the bioflocs, which can be harvested by filter feeding fish, such
as tilapia, and shrimp, significantly reducing their usage of conventional feed, and enhancing their
growth rate (Avnimelech 2012; Hargreaves 2013). Water usage is low as the efficiency of the whole
system is enhanced, with environmental impact being reduced (Hargreaves 2013). With such benefits,
it is no surprise that large scale BFT systems have been set up across Asia, Latin America as well as
Central America, with the smaller scale greenhouse systems having an even broader reach
(Emerenciano et al. 2013).
1.5 South African Finfish Aquaculture Industry
With catch fisheries having provided the vast majority of fish up to this point, South Africa is
entering a phase where this source is reaching its maximum sustainable yield (MSY) (DAFF 2013). If
exploitation continues, without catch being limited at the level which is currently exploited, a collapse in
the fish stocks will be induced as has been seen extensively around the world. The developing gap
between the seafood supplied by wild catch fisheries, and that demanded by consumers, needs to be
Stellenbosch University https://scholar.sun.ac.za
5
filled by aquaculture (DAFF 2013). With aquaculture successfully growing to fill this gap around the
world, the same looks probably in South Africa (DAFF 2013).
With the rest of the world having put extensive effort in developing technology and refining
species to where they are today, the knowledge transfer and adoption of these modern methods is
imperative. The importance of testing such systems in our local conditions and circumstances is equally
crucial to prevent failure and ensure their viability (DAFF 2013).
With government realizing that the development of a local aquaculture industry is imminent,
recent legislative changes have occurred in order to smooth the path for such development (DAFF
2013). One being changes in the categorization of Nile tilapia, Oreochromis niloticus, from being a
prohibited species, to allow its use in certain biosecure aquaculture systems (DEA 2014). This comes
as a great victory to the emerging local tilapia industry who have struggled with using the indigenous
Mozambique tilapia, Oreochromis mossambicus, up to this point.
1.6 Rationale
Given the current situation in South Africa, and through extensive research into the current
questions being asked by local tilapia industry stakeholders, a study was designed to probe the BFT
concept under local conditions, and address a question which is being widely asked: will O. niloticus
live up to what has been speculated, and actually outperform O. mossambicus in our local conditions?
This study was intended to be a baseline starting point from which other studies could stem and
elaborate on.
Given the current drive for green development in South Africa, and with excessive water use,
feed wastage and environmental degradation often being associated with aquaculture practises
(Emerenciano et al. 2013), the modern BFT concept shows great potential to be employed at a grass
roots level in developing the local tilapia industry. Additionally it is in line with major government and
humanitarian obligations, to address hunger, malnutrition and food security in an environmentally
friendly way, by providing a good, cheap source of protein to impoverished communities (Celik 2012;
FAO 2014). Being a new concept in South Africa, the study aimed to explore and proof test the BFT
concept in local conditions, looking predominantly at water quality and growth rates of tilapia. It aimed
to give interested parties and future farmers an idea of what to expect when employing the concept, as
Stellenbosch University https://scholar.sun.ac.za

6
well as create a pioneering platform for future research to adjust and customize the concept to better
suit our circumstances.
With the culture of the Three Spot tilapia, Oreochromis andersonii, gaining traction in its
naturally distributed regions in Zambia, and given its availability to the researcher, it was incorporated
into the study. Although the three species investigated fill similar niches in their geographically separate
natural distributions (Skelton 2001), it is speculated that they may feed at slightly different trophic levels.
This speculation is supported by diet differences between the species (Popma and Lovshin 1996;
Skelton 2001; Winemiller and Kelso-Winemiller 2003; Njiru et al. 2004). If one species were to be more
suited to the utilization of biofloc in the diet, and therefore show higher growth rate and lower feed
conversion ratio (FCR) than the other species, it would intuitively be the preferred species for use in
such systems. Another dimension added to the frame is that of different levels of selection and breeding
experienced between the three species used. It was therefore decided to use what was available to the
researcher, and mimic the circumstances which will be faced by a commercial farmer in the same
region. For a species which has experienced less strain development for aquaculture purposes to be
considered for use in a commercial system, it would need to gain notably more benefit from the biofloc
than the most developed species, in order to show higher growth rate and a lower FCR. With no
previous work encountered by the researcher on this comparison in a BFT system, the study aimed to
investigate which species would indeed be best suited for use in a BFT system in a South African
context.
1.7 Aims
To act as an initial study into tilapia BFT systems in South Africa, aiding in proof testing
the concept in local conditions.
To create a platform from which further research may stem into adjusting and
customizing the BFT concept to better suit our local South African conditions.
To give interested parties and future farmers an idea on what to expect from BFT
systems in terms of water quality and tilapia growth rates.
To map a profile of key water quality parameters over a 10-week period.
To determine which species of tilapia is best suited for BFT systems in South Africa.
Stellenbosch University https://scholar.sun.ac.za

7
1.8 References
Andretto AP, Losch JA, Goncalves GA, et al. (2015) Assessment of the oxidative state, related parameters and quality of muscle tissue in Nile tilapia with the application of homeopathic product Homeopatila 100 in high-density cages. African J Pharm Pharmacol 9:279–286.
Avnimelech Y (2012) Biofloc technology - a practical guide book, 2nd edn. World Aquaculture Society, Baton Rouge.
Beveridge MCM, Phillips MJ, Macintosh DJ (1997) Aquaculture and the environment: the supply of and demand for environmental goods and services by Asian aquaculture and the implications for sustainability. Aquac Res 28:797–807.
Boyd C (2004) Farm-level issues in aquaculture certification : Tilapia. Auburn, Alabama.
Brown CL, Yang T, Fitzsimmons K, et al. (2014) The Value of Pig Manure as a Source of Nutrients for Semi-Intensive Culture of Nile tilapia in Ponds (A Review). Agric Sci 5:1182-1193.
Carter CG, Hauler RC (2000) Fish meal replacement by plant meals in extruded feeds for Atlantic Salmon, Salmo salar L . Aquaculture 185:299–311.
Celik E (2012) Tilapia culture review. Dissertation, Norwegian University of Life Sciences.
DAFF (2013) National aquaculture policy framework for South Africa. Gov Gaz 763:1-33.
DEA (2014) Alien and invasive species list. Gov Gaz 590:1–80.
El-Sayed AFM (2013) An overview of aquaculture in Egypt with focus on tilapia culture. Presented at the 11th conference of the aquaculture association of southern Africa, Stellenbosch University, Stellenbosch, 9-13 September 2013.
Emerenciano M, Gaxiola G, Cuzon G (2013) Biofloc Technology (BFT): A review for aquaculture application and animal food industry. In: Matovic MD (ed) Biomass now - cultivation and utilization. InTech, Rijeka, pp 301–328.
FAO (2012) The state of world fisheries and aquaculture. ISBN 978-92-5-107225-1. FAO Fisheries Department, Rome.
FAO (2014) The state of world fisheries and aquaculture. ISBN 978-92-5-108275-1. FAO Fisheries Department, Rome.
Fitzsimmons K, Martinez-Garcia R, Gonzalez-Alanis P (2011) Why tilapia is becoming the most important food fish on the planet. In: Liping L, Fitzsimmons K (eds) Better science, better fish, better life. 9th international symposium on tilapia in aquaculture, Shanghai, 22-24 April 2011.
Hallerman EM, Kapuscinski AR (1995) Incorporating risk assessment and risk management into public policies on genetically modified finfish and shellfish. Aquaculture 137:9–17.
Hargreaves JA (2013) Biofloc production systems for aquaculture. Southern regional aquaculture centre publication 4503.
Jamandre WE, Hatch U, Bolivar RB, Borski R (2011) Improving the supply chain of tilapia industry in the Philippines. In: Liping L, Fitzsimmons K (eds) Better science, better fish, better life. 9th international symposium on tilapia in aquaculture, Shanghai, 22-24 April 2011.
Stellenbosch University https://scholar.sun.ac.za

8
Millamena OM (2002) Replacement of fish meal by animal by-product meals in a practical diet for grow-out culture of Grouper, Epinephelus coioides. Aquaculture 204:75–84.
Moriarty DJW (1997) The role of microorganisms in aquaculture ponds. Aquaculture 151:333–349.
Naylor RL, Hardy RW, Bureau DP, et al. (2009) Feeding aquaculture in an era of finite resources. Proceedings of the national academy of sciences 106:15103–15110.
Njiru M, Okeyo-Owuor JB, Muchiri M, Cowx IG (2004) Shifts in the food of Nile tilapia, Oreochromis niloticus (L.) in Lake Victoria, Kenya. Afr J Ecol 42:163–170.
Popma TJ, Lovshin LL (1996) Worldwide prospects for commercial production of tilapia. In: Research and development series 41, International centre for aquaculture and aquatic environments, Auburn University, Alabama.
Skelton P (2001) A complete guide to freshwater fishes of southern Africa. Struik Publishers, Cape Town.
Tovar A, Moreno C, Mánuel-Vez MP, Garcia-Vargas M (2000) Environmental impacts of intensive aquaculture in marine waters. Water Res 34:334–342.
Tveterås S (2002) Norwegian Salmon aquaculture and sustainability: the relationship between environmental quality and industry growth. Mar Resour Econ 17:121–132.
Winemiller KO, Kelso-Winemiller LC (2003) Food habits of tilapiine cichlids of the upper Zambezi river and floodplain during the descending phase of the hydrologic cycle. J Fish Biol 63:120–128.
Zhou Q, Li K, Jun X, Bo L (2009) Role and functions of beneficial microorganisms in sustainable aquaculture. Bioresour Technol 100:3780–3786.
Stellenbosch University https://scholar.sun.ac.za

9
2 Literature Review
2.1 Global Tilapia Production
Historical Overview
The origin of tilapia culture allegedly lies some 4000 years ago, 1000 years prior to carp culture
first being introduced in China (Balarin and Hatton 1979). Apart from depictions in ancient Egyptian
tombs and biblical references, very little is known about the culture of tilapia in these early ages (El-
Sayed 2006b; Mjoun et al. 2010). In 1924 the first culture of tilapia was seen taking place for scientific
purposes in Kenya (Gupta and Acosta 2004). Thereafter Courtenay and Williams (1992) reported the
first non-native establishment of tilapia on the Java island of Indonesia in the 1930’s, recorded as an
aquarium release. Throughout World War II from 1939-1945, introduction of tilapia occurred in
numerous pacific islands as it proved to be a convenient, and easily transported source of protein for
Japanese soldiers (Popma and Lovshin 1996; Boyd 2004).
This was the start of the widespread development of the industry, and by 1950 seven countries
were reported to be producing tilapia (Fishstat.Plus 2004; El-Sayed 2006b). This figure had risen to 12
countries by 1969, with production at 24, 633 Mt, making up 0.76 % of total production by aquaculture
(Fishstat.Plus 2004; El-Sayed 2006b). At this time the concept of aquaculture as a food production
industry was still unfamiliar in most countries, and throughout the 1960’s and 70’s international aid and
development agencies endorsed aquaculture as a protein production method, promoting food security
in developing countries without having the environmental troubles accompanying conventional
agriculture (Canonico 2005; El-Sayed 2006b).
There was a continual growth and increased interest in the production of tilapia, and by 1990
global annual production was 383,654 Mt, making up 2.28 % of the total production by aquaculture
(Fishstat.Plus 2004; El-Sayed 2006b). From 1970 until 1990, the average growth of tilapia production
was 14.2 % annually (Figure 2.1), with the number of countries producing tilapia rising to 78
(Fishstat.Plus 2004; El-Sayed 2006b). This rapid expansion of tilapia production continued through the
next decade with new and improved techniques being developed. By 2002 global annual production
was initially reported to have risen to 1,505,804 Mt at an annual growth rate close on 12.2 %
(Fishstat.Plus 2004; El-Sayed 2006b). This is similar to the 1,499,000 Mt reported by Josupeit 2005.
These figures were however changed in 2008 when China revised its production statistics and
Stellenbosch University https://scholar.sun.ac.za

10
subsequently reduced its initial historical figures by around 13 %, which resulted in the figure for global
annual production being reduced to 1,418,816 Mt for 2002 (FIGIS 2015a). By 2010 this production had
more than doubled and was at 3,200,000 Mt (Fitzsimmons et al. 2011). This estimation for 2010 is
however slightly lower than reported by the FAO (2015) at 3,496,165 Mt. Variation in estimation
technique and model used to arrive at this global production figure for tilapia may explain this difference.
By 2012 this rapid growth of global tilapia production was still ongoing and production was reported to
be 4,507,002 Mt (FIGIS 2015a). The global annual production of tilapia from 1991-2013 showed good
growth (Figure 2.2). For the decade preceding 2012, global tilapia production by aquaculture had
therefore risen at an average rate of 14.5 % per annum. As the quantity produced increased, so did the
value of the tilapia aquaculture sector.
Figure 2.1. The global annual production of tilapia in Metric Tons from 1950-1990 compiled with data obtained from FAO (2015b).
0
50000
100000
150000
200000
250000
300000
350000
400000
19
50
19
52
19
54
19
56
19
58
19
60
19
62
19
64
19
66
19
68
19
70
19
72
19
74
19
76
19
78
19
80
19
82
19
84
19
86
19
88
19
90
Met
ric
Ton
s
Year
Stellenbosch University https://scholar.sun.ac.za

11
Figure 2.2. The global annual production of tilapia in Metric Tons from 1991-2013 compiled with data obtained from FAO (2015b).
Economics and International Trade
From 2002 until 2012, FAO (2015) reported that the value of the global tilapia sector had grown
from 1,696,522,000 United States Dollars (USD) in 2002 to 7,656,257,000 USD in 2012. There was
significant growth in the value of the global tilapia aquaculture sector from 2002 to 2013 (Figure 2.3).
The production from China made up 30 % of this value in 2012, having decreases from holding 36 %
in 2002 (FIGIS 2015a).
The majority of tilapia produced is consumed locally within the country in which it is cultured
(El-Sayed 2006b). International trade of tilapia products is however growing, with the United States of
America (USA) being the largest importer of tilapia (Mjoun et al. 2010). In 2014, the USA imported a
total of 230,738 Mt of tilapia, of which 164,992 Mt was in the form of frozen fillets (ERS 2015). Imports
into the USA from China totalled 186,349 Mt or 81 % of the total tilapia imported into the USA in 2014
(ERS 2015). The value of tilapia imports into the USA for 2014 stood at 1,114,646,000 USD having
risen steadily over the past decade (ERS 2015).
0
1000000
2000000
3000000
4000000
5000000
6000000
19
91
19
92
19
93
19
94
19
95
19
96
19
97
19
98
19
99
20
00
20
01
20
02
20
03
20
04
20
05
20
06
20
07
20
08
20
09
20
10
20
11
20
12
20
13
Met
ric
Ton
s
Year
Stellenbosch University https://scholar.sun.ac.za

12
Figure 2.3. Illustrates the value of the global tilapia aquaculture sector from 2002-2013 compiled with data obtained from FAO (2015b).
Production by Region
Tilapia has been introduced to many countries around the world because of its important role
in aquaculture, with its culture becoming widespread throughout Asia particularly. In 2002, China
showed a production of 611,165 Mt, making up 43 % of global tilapia production alone (FIGIS 2015a).
Asia as a whole accounted for 1,083,849 Mt in 2002 which equates to 76 % of tilapia produced globally
(FIGIS 2015a).
In the decade proceeding 2002, tilapia production had increased in areas outside of Asia, which
by 2012 held a decreased 69 % of the global share of tilapia production. The share held by China was
also decreased to 34 % in 2012 (FIGIS 2015a). Over the same period, the Americas had increased
production of tilapia from 140,302 Mt per annum or 9.9 % to 463,738 Mt, equivalent to 10.3 % of global
production in 2012 (FIGIS 2015a). Tilapia production in Africa had also grown substantially over the
same period from making up 13.7 % or 193,981 Mt of global production in 2002 to 919,017 Mt equating
to 20.4 % in 2012 (FIGIS 2015a). This production is largely credited to Egypt which showed 11.8 % of
global tilapia production in 2002 and 17.1 % by 2012 (Figure 2.4) (El-Sayed 2013; FIGIS 2015a).
0
1000000
2000000
3000000
4000000
5000000
6000000
7000000
8000000
9000000
20
02
20
03
20
04
20
05
20
06
20
07
20
08
20
09
20
10
20
11
20
12
20
13
Val
ue
(00
0 U
SD)
Year
Stellenbosch University https://scholar.sun.ac.za

13
Figure 2.4. Global tilapia production by region for 2012 (FIGIS 2015b).
By 2012, the culture of Oreochromis niloticus made up a share of 71 % or 3,197,330 Mt of the
4,507,002 Mt of total tilapia and other cichlids produced (Figure 2.5) (FIGIS 2015a). This share is slightly
lower than the 72 % reported by Fitzsimmons (2000) and the 74 % reported by the FAO (2015a) for the
year 1995. It shows that over the 17 year period preceding 2012, the share of O. niloticus had decreased
slightly even after holding a 79 % share in 2002 (FIGIS 2015a). Oreochromis aureus showed a total
production of 4,995 Mt for the year 2012 (Figure 2.5), having decreased its share of 0.24 % in 2002 to
0.11 % in 2012 (FIGIS 2015a). The development of the O. niloticus x O. aureus hybrid and the increase
of its use in commercial aquaculture may have played a crucial role in decreasing the share of these
two individual species by 2012. Oreochromis niloticus x O. aureus depicted a total production of 388,139
Mt for the year 2012, making up a share of 8.6 % of total tilapia production (Figure 2.5) (FIGIS 2015a).
Oreochromis mossambicus production dropped significantly from its 2002 figures, and was reported to
be 24,385 Mt in 2012 making up only 0.54 % of global tilapia production (Figure 2.5) (FIGIS 2015a). Its
use in Africa however increased from a low 130 Mt in 2002 to 1,440 Mt in 2012 (FIGIS 2015a). The
production of Oreochromis andersonii was still relatively low in 2012 recording 4038 Mt produced with
a decreased share of 0.090 % of total tilapia production (Figure 2.5) (FIGIS 2015a). Its use in
aquaculture had however increased significantly from 2002, and all production recorded in 2012 came
from the African continent (FIGIS 2015a).
AmericasOceania
Asia excluding China
Africa excluding Egypt
China
EgyptEurope
Stellenbosch University https://scholar.sun.ac.za
14
Figure 2.5. The tilapia species comprising total tilapia production by aquaculture in 2012 (FIGIS 2015a).
2.2 Biofloc Technology (BFT)
History
The first research into the use of BFT allegedly started in the early 1970’s by Ifremer-COP
(French research institute for exploitation of the sea, oceanic centre of pacific) using shrimp, with the
concept being likened to an external rumen (Cuzon et al. 2004; Emerenciano et al. 2012b). In 1980 the
Ecotron science program was started by Ifremer to probe and better the understanding as to how such
systems work (Emerenciano et al. 2013). Research was initiated in the late 1980’s and early 1990’s by
Israel and the USA into the same concept, but using tilapia, with focus on water limitations, land costs
and environmental concerns being the driving force (Emerenciano et al. 2013). The first commercial
application of the concept is reported in 1988 at the Sopomer farm in Tahiti as well as the Belize
Aquaculture farm where much of the expertise for running shrimp biofloc systems was developed
(Emerenciano et al. 2013). Today, BFT systems are used on a commercial basis throughout the world,
with tilapia and shrimp being the major focus.
Overview
BFT involves an unconventional way of thinking which deviates from the common mind-set that
clear water is best for aquaculture (Avnimelech 2012; Hargreaves 2013). It enhances the use of a
microbial community to produce a supplementary microbial food source, high protein bioflocs (a
coagulation of micro-organisms), which can be utilised by species capable of filter-feeding (Avnimelech
O. niloticus
O. mossambicus
O. niloticus x O. aureus
O. aureus
Other
O. andersonii
Stellenbosch University https://scholar.sun.ac.za

15
2012). Sufficient aeration and mixing is required to keep the floc in suspension in the water, which
allows the water quality to be controlled (Hargreaves 2013). The microbial community, predominantly
heterotrophic bacteria within the water act as a biofilter, resulting in nitrogen uptake and reducing
ammonia (NH4) levels faster and more efficiently than the nitrification process (Avnimelech 1999; Crab
et al. 2012). Biofloc systems have very low water exchange, and thus have a significantly lower impact
on the surrounding environment through lower water requirements and minimal to no effluent water
discharge (Avnimelech 2007; Avnimelech 2012; Hargreaves 2013). Degradation of the environment is
further reduced by the lower amount of pelleted feed needed and the efficiency in recycling nutrients
from the fish waste and uneaten feed (Hargreaves 2013).
Carbon Addition
The carbon to nitrogen ratio (C:N) plays an integral part of BFT systems (Hargreaves 2013). It
is this ratio which controls the proliferation of heterotrophic bacteria, which are generally limited by the
availability of organic carbon, and nitrifying bacteria which are not (Avnimelech 1999; Michaud et al.
2006; Emerenciano et al. 2013; Hargreaves 2013; Luo et al. 2014). By increasing the C:N ratio,
heterotrophic bacteria flourish, and ammonia is taken up from the water and converted into microbial
biomass, containing protein (Hargreaves 2013). The critical point of this ratio where heterotrophic
bacteria will outcompete nitrifying bacteria is variable with different organic carbon sources (Michaud et
al. 2006). Luo et al. (2014) put forward that in a BFT system the C:N ratio should be maintained at >10:1
with Hargreaves (2013) suggesting that it should be closer to 12-15:1 to support the heterotrophic
pathway. The lack of consensus on this point is further compounded by Emerenciano et al. (2013)
suggesting that the optimal ratio of C:N lies from 15-20:1. It is therefore evident that there is no exact
“golden ratio”, and that there is agreement in that the ratio should be elevated by the provision of an
additional organic carbohydrate (CH) source.
In the case of emergency where total ammonia nitrogen (TAN) levels are high, Avnimelech
(2012) suggests that 20 mg/L CH should be added to reduce TAN levels by one milligram per litre. The
addition of CH in BFT systems is closely linked to the feeding rate and protein content, or more
specifically nitrogen content of the feed (Hargreaves 2013). Hargreaves (2013) put forward that for
every one kilogram feed of 30-38 % protein added to the water, a CH source of 0.5-1 kg should also be
added to maintain the high C:N ratio. As protein is comprised on average of 15.5 % N, and fish excrete
Stellenbosch University https://scholar.sun.ac.za

16
as much as 75 % of N from the feed as NH4 (Avnimelech 2012), the amount of feed can be inserted
along with the calculated %N content of the feed expressed as a decimal, into the equation presented
by Avnimelech (1999) and Avnimelech (2012) below to calculate the amount of CH addition needed:
∆𝐶𝐻 = ∆𝐹𝑒𝑒𝑑 × %𝑁 𝑖𝑛 𝑓𝑒𝑒𝑑 × %𝑁 𝑒𝑥𝑐𝑟𝑒𝑡𝑖𝑜𝑛 ÷ 0.05
In practise, the choice of an organic carbon source is dependent on the availability of a cheap
carbohydrate near to where the BFT system is located (Emerenciano et al. 2013). Therefore, a range
of organic carbon sources such as wheat bran (Emerenciano et al. 2011; Emerenciano et al. 2012a),
molasses (Burford et al. 2004; Panjaitan 2004; Samocha et al. 2007), glucose (Crab et al. 2010),
cellulose (Avnimelech et al. 1989), cassava meal (Avnimelech and Mokady 1988; Chen et al. 2015),
sorghum meal (Avnimelech et al. 1989; López-Elías et al. 2015), wheat flour (Azim and Little 2008; Xu
et al. 2012) and corn/maize meal (Milstein et al. 2001; Asaduzzaman et al. 2010; Xu et al. 2012; Kurup
2015) can be used. The organic carbon source is linked to the feeding rate and is usually added to the
water once, or twice a day where practically possible, often after feeding has taken place (Avnimelech
1999; Azim and Little 2008; Xu et al. 2012). The practical application and specific routine of adding an
organic carbon source is dependent on the nature of the BFT system used.
Production Systems
Tilapia can be cultured in freshwater, brackish-water as well as seawater environments (El-
Sayed 2006b). This range of salinities allows for the use of a diverse number of different culture methods
to be employed. The majority of production is however in freshwater environments which was the
preferred salinity for 83 % of global tilapia production in 2012 (FIGIS 2015a).
As tilapia is a relatively low-value finfish when compared to other cultured species such as
salmonids or shrimp, low-cost production is key to financial success in most regions of the world
(Edwards 2000; Celik 2012; FAO 2012). The contribution of aquaculture to the livelihoods of
impoverished communities is large, as explored by Edwards (2000), and may play an increasing role in
rural development in the future. By providing these livelihoods, the importance of tilapia on a
subsistence scale to human welfare as well as growing the sector should not be underestimated. These
circumstances, coupled with tilapia being a hardy fish, largely resistant to stress and tolerant of a wide
Stellenbosch University https://scholar.sun.ac.za

17
spectrum of environmental conditions, lead towards very basic culture methods being most effective
(El-Sayed 2006b; Celik 2012; El-Sayed 2013).
Semi-intensive culture systems are the most common for small scale producers in developing
countries (Celik 2012). The prevalence of this intensity for the production of tilapia in China was also
reported by El-Sayed (2006). Additionally it was noted that as global production rises, a shift to become
ever more intensive in our culture practises is evident (El-Sayed 2006b). This shift does however
demand more hands-on management and increasing the use of innovative technology in aquaculture
systems, but does not necessarily hold the key to the further development of the tilapia industry within
developing countries in particular (El-Sayed 2013). Semi-intensive culture makes use of both the natural
productivity of the pond as well as supplementary feed, positioning itself midway between the two
extremes of intensive and extensive culture methods (El-Sayed 2006b).
Biofloc Technology Systems
The semi-intensive application of commercial scale BFT operations means that they are mainly
exposed to light and employ only a few system types, namely; plastic lined ponds or tanks, and raceway
systems in greenhouses (Hargreaves 2013). Pond sizes are generally 0.5-1.5 ha in size and are based
on specifications used in early research at the Waddell mariculture centre, being lined with up to a 1
mm thick high density polyethylene (HDPE) plastic (Gupta and Acosta 2004; Emerenciano et al. 2013;
Hargreaves 2013; Green et al. 2014). In commercial BFT ponds, Hargreaves (2013) suggested that
aeration and mixing is mainly conducted by paddlewheel aerators at a rate of 28-32 hp/ha (20.9-23.9
kW/ha). This is slightly less than the 50 hp/ha (37.3 kW/ha) used by Burford et al. 2004 in Belize.
Avnimelech (2012) suggested that aeration can range from 6.7 hp/ha (5 kW/ha) to more than 134 hp/ha
(100 kW/ha) with an effective approximate being one kilowatt per 500 kg of fish or shrimp. The
positioning and rotation of aerators within a pond is important to prevent sludge collecting in calm areas
where anaerobic conditions may develop (Avnimelech 2007; Avnimelech 2012; Hargreaves 2013).
Commercial BFT systems may have zero or minimal water exchange taking place, where sludge is
drained (Burford et al. 2003; Avnimelech 2007; Widanarni et al. 2012; Emerenciano et al. 2013).
Research systems tend to encompass a wider range of smaller systems both outdoors and
indoors, and in cases where the system is indoors, temperatures can be more controlled and the system
not exposed to light (Azim and Little 2008; Hargreaves 2013). These systems are more easily monitored
Stellenbosch University https://scholar.sun.ac.za

18
and controlled, often making use of a compressor/blower to ensure aeration and sufficient mixing
through air diffusers (Azim et al. 2008; Azim and Little 2008; Green et al. 2014).
As BFT systems are often situated in areas of water scarcity, the water used in these systems
is limited, and biosecurity issues have driven the minimal to zero water exchange approach (Hargreaves
2013). BFT has therefore been seen as an environmentally friendly aquaculture technique, with
sustainability at its core (Widanarni et al. 2012). Before stocking, BFT systems are usually prepared for
a number of weeks where the water may be seeded with biofloc, and is fertilized with organic matter to
allow the biofloc time to establish in the water (Avnimelech 2012; Hargreaves 2013). Ekasari et al.
(2014) reported a three week period of preparation until total suspended solids (TSS) exceeded 500
mg/L and the trials commenced. This is in line with a few weeks suggested by Avnimelech (2012).
Water quality parameters fluctuate throughout this establishment period and through the grow-out
phase of the cultured species.
Water Quality
The importance and monitoring of water quality is well known in aquaculture, and no different
in BFT systems (Azim and Little 2008; Prajith and Madhusoodana 2011; Widanarni et al. 2012; Crab et
al. 2012; Liu et al. 2014). As well as being of interest to other researchers, a profile of different water
parameters in a BFT system within a particular region can serve as a guideline to farmers in the area
in what to expect in their systems. With the concept of BFT being new in South Africa, and no
commercial BFT facilities yet, it is research such as this which will aid the development and
understanding of the BFT concept and its implementation. A range of different parameters are
measured and recorded over different time frames. The measurement of some parameters may be time
consuming, depending on the method used, and needs to be weighed up against the importance of the
parameter, in order to find out how often it should be measured. Azim and Little (2008) reported
measuring temperature, dissolved oxygen (DO) and pH twice weekly in their BFT research system.
These parameters were measured more frequently by Widanarni et al. (2012) and Liu et al. (2014) who
took measurements once a day before feeding in the morning. These regimes are similar to the DO,
Temperature and floc volume (FV) measurements taken daily by Avnimelech (2007). There is however
evidence to suggest that there is fluctuation in these parameters over the course of a day (Neori et al.
1989). Crab et al. (2009) looked into this by taking DO and temperature readings every three hours,
Stellenbosch University https://scholar.sun.ac.za

19
and found that the readings taken at 7am were representative of the average DO and temperature
throughout the 24 h period. Other parameters such as TAN, NO2, NO3 and TSS are often monitored
weekly (Azim and Little 2008; Liu et al. 2014), or bi-weekly (Prajith and Madhusoodana 2011; Widanarni
et al. 2012). As water quality measurements in BFT research systems are usually taken to ensure the
wellbeing and safety of the fish, it would be of value to create a “typical” water quality profile or band for
each parameter over the grow-out cycle, and give farmers an indication of where their water quality
should be at any particular time.
Crab et al. (2009) reported that temperature is optimal for tilapia growth from 25-28 ºC, which
is within the range of 25-30 ºC reported by El-Sayed (2006b) who also indicated that normal growth is
experienced down to 20 ºC. Temperature in a BFT system cannot be easily controlled due to the outdoor
nature, making BFT systems dependent on climatic variables in the chosen area (De Schryver et al.
2012). With minimal water exchange and large volumes in BFT systems, heat can be relatively well
conserved within the water body and act to buffer the air temperature (Crab et al. 2009).
Popma and Lovshin (1996) along with Ebeling et al. (2006) and Avnimelech (2012) identified
DO levels as the major limiting factor in increasing production for intensive aquaculture systems. It is
therefore a fundamental need for organisms being cultured, and should be efficiently supplied and
constantly monitored. It is common knowledge that oxygen is more soluble in cooler water and DO
levels are therefore generally higher when water is cooler (Swann 1997; El-Sayed 2006b; Avnimelech
2012). It is intuitive that DO levels are also affected by the biological load within the water body which
consumes DO through respiration (Hargreaves 2013). As DO levels are fundamental to respiration of
both the cultured species and the micro-organisms making up the suspended floc, the demand for DO
is elevated in BFT systems to as high as 5-8 mg O2/L/h (Hargreaves 2013). The response time in the
event of system failure is thus often less than one hour (Hargreaves 2013). Popma and Lovshin (1996)
indicated that tilapia show a higher tolerance to low DO levels than other cultured species, and are able
to withstand DO levels lower than 0.5 mg O2/L. El-Sayed (2006b) claimed that they can even tolerate
levels lower than this, and make use of surface air when DO is at zero mg O2/L. It is however best to
keep levels higher than 2-3 mg O2/L to limit stress on the tilapia (Popma and Lovshin 1996). Avnimelech
(2012) suggested that DO levels are best at above four milligrams O2 per litre for BFT systems.
Stellenbosch University https://scholar.sun.ac.za

20
Oreochromis niloticus can tolerate a pH range from 4-11 (Balarin and Hatton 1979; Wangead
et al. 1988). The best growth in tilapia is seen at pH levels which are neutral or slightly alkaline (Popma
and Lovshin 1996). Acidic conditions tend to reduce the natural productivity of a pond, and would
therefore have an effect on the growth rate of tilapia (Popma and Lovshin 1996). Widanarni et al. (2012)
found that pH was relatively stable from 6.3-7.5 for BFT tanks, unlike the fluctuations observed in their
control tanks without biofloc. The pH range observed by Azim and Little (2008) in BFT trials was greater
and spanned from 5.0-8.5. Avnimelech (2012) put forward that the optimal pH range for BFT systems
is 7-9. pH is related to nitrification and fluctuations are observed throughout a day (Avnimelech 2012).
FV is measured through the use of an Imhoff Cone, where one litre of water is left to stand for
a set amount of time, usually 10-20 minutes, before the floc volume settled towards the apex of the
cone is measured in mL/L (Hargreaves 2013). This simple method gives a good indication of the level
of biofloc in the water. Hargreaves (2013) suggested that FV for tilapia should be maintained at 25-50
mL/L, which is lower than the level of up to 100 mL/L put forward by Avnimelech (2012).
Electro-conductivity (EC) is a measure of the amount of nutrient dissolved in the water and is
linked to the pH, hardness, salinity as well as the total dissolved solids (TDS) (Roets et al. 1999; De
Schryver et al. 2008; Rahman 2010). A study conducted by Iqbal et al. (2012) showed significant
correlation between EC and the growth of O. niloticus, although it may be more closely linked to pH.
Fluctuations in EC levels are often as a result of water loss/change, liming to raise pH, and higher
feeding rate which therefore often elevated the EC throughout a growout period (Roets et al. 1999).
Considerably higher levels on EC were recorded in a BFT system by Rahman (2010) when compared
to other intensive systems, due to low water exchange and elevated total suspended solids (TSS)
levels.
El-Sayed (2006b) included dissolved solid metabolites among the most important factors which
determine the success for intensive cultivation of tilapia. TDS is generated by the bacterial degradation
of faecal materials as well as leaching from feed (Rafiee and Saad 2005). It is this organic matter as
well as the microbial community degrading it which raises the TDS as well as TSS measurement (Rafiee
and Saad 2005). Lack of water exchange also leads to elevated TDS levels in aquaculture, which can
be potentially toxic to certain cultured species when >2000 mg/L (Rafiee and Saad 2005). TDS levels
have not been well documented in BFT systems, and it is speculated that it would be kept within
Stellenbosch University https://scholar.sun.ac.za

21
tolerable levels due to the harvesting of biofloc by the cultured species. Boyd (2000) stated that there
is a strong correlation between TDS and salinity which share very similar concentrations in natural
waters.
Tilapia, and particularly O. mossambicus, are able to handle highly saline waters (Popma and
Lovshin 1996). Much of the tilapia cultured around the world is done in brackish water (Legendre and
Ecoutin 1989; Suresh and Lin 1992). BFT is practised in a range of water salinities, with studies
concluding that the salinity level has no major effect on the bacterial growth or other nutritional
parameters (fatty acid profile, crude protein, crude lipid, ash) which were similar at different salinities
(Del Giorgio and Cole 1998; Nielsen et al. 2003).
Nitrogen species are commonly measured in aquaculture, and they are often considered to be
the primary limiting factor to the survival of the cultured organism (Avnimelech 1999; Tseng and Chen
2004; Crab et al. 2007; Barbieri 2010; Xian et al. 2011; Santacruz-Reyes and Chien 2012). Ammonia
originates from uneaten feed, along with the majority coming from the cultured organism, as it is a final
product of protein metabolism (Avnimelech 1999; El-Sayed 2006b; Crab et al. 2007). Ionised
ammonium (NH4+ or NH4+–N or IA–N) and un-ionised ammonia (NH3 or NH3–N or UIA-N) levels are in
equilibrium, being reliant on the pH and temperature of the water (Timmons et al. 2002). These two
forms together make up TAN, possibly the most critical inorganic nitrogenous species of interest to the
aquaculture industry. It is however the UIA–N which is the most dangerous of the two to cultured
organisms (El-Shafai et al. 2004; El-Sayed 2006b). In most aquaculture systems, IA–N is oxidised by
nitrifying bacteria to the highly toxic nitrite (NO2) and then on to the much less toxic nitrate (NO3) species
(Avnimelech 1999). In a closed intensive aquaculture system, these nitrogen compound levels can
accumulate until toxic levels are reached, and mortalities occur, as there are few effective mechanisms
for their removal (Avnimelech 1999). The nitrification process with an end product of the less toxic NO3
is therefore facilitated, along with water exchange to remove the enriched water (Avnimelech 1999; El-
Sayed 2006b). In a BFT system, an alternative pathway is encouraged for the removal of dangerous
nitrogen compounds from the water, and makes use of the action of predominantly heterotrophic
bacteria (Figure 2.10). Uptake by algae, as well as nitrification, do still play variable roles in the
immobilization of TAN from the water body, but their action is overshadowed by that of the heterotrophic
bacteria (Hargreaves 2013). At low pH, the majority of the TAN is stored in the water as IA–N, which is
Stellenbosch University https://scholar.sun.ac.za

22
therefore less toxic to the fish (Avnimelech 2012). The level of toxicity of TAN is also elevated at low
DO levels (Avnimelech 2012). TAN, which is commonly measured, can be used to calculate the UIA–
N level described by El-Shafai et al. (2004) using the general equation of bases illustrated by Albert
(1973):
[𝑁𝐻3 + 𝑁𝐻4+]
[1 + 10(𝑝𝐾𝑎−𝑝𝐻)]
With pKa in freshwater being calculated by the formula presented by Emerson et al. 1975:
𝑝𝐾𝑎 = 0.09018 +2729.92
𝑇
where T is measured in Kelvin which is 273 + T ºC.
Tilapia can tolerate UIA–N up to two milligrams per litre (El-Shafai et al. 2004; Avnimelech
2012). Other reports however suggest that the 48 hour median lethal concentration (LC50) is much
higher, with Ça and Köksal (2005) reporting LC50 of 7.40 mg/L for O. niloticus fingerlings, and Daud et
al. (1988) finding LC50 to be 6.6 mg/L for O. mossambicus x O. niloticus. Although higher levels can
be tolerated, this tolerance is coupled to a certain exposure time period and compromised growth, which
would therefore direct tilapia farmers to keep UIA–N well below this level. The toxic level for UIA–N is
as low as 0.14 mg/L and it should be maintained below 0.1 mg/L (El-Shafai et al. 2004). NO2 is an
intermediatary product of the nitrification process between TAN and NO3, and highly toxic to aquatic life
(El-Sayed 2006b; Avnimelech 2012; Hargreaves 2013). NO2 spikes are often observed during the start-
up of the nitrification process, and if insufficient aeration is taking place (Avnimelech 2012). The 96 hour
LC50 of NO2 for tilapia has been extensively researched between different fish sizes and chloride
concentrations, with reports ranging from 44.67 mg/L at high chloride levels (Wang et al. 2006), to 81
mg/L for small O. niloticus (Atwood et al. 2001). The addition of salt (NaCl) can therefore be used to
lower the NO2 toxcicity in culture systems when needed (Durborow et al. 1997). Rakocy (1989) reported
that tilapia usually begin to die at NO2 concentrations above five milligrams per litre. It is however good
practise to constantly monitor and maintain NO2 concentrations below one milligram per litre for optimal
production (Stone and Thomforde 2004). As the toxicity of NO3 is greatly reduced from that of NO2, and
seldom has an effect on the wellbeing of fish, it should be monitored accordingly to keep track of the
prevalence of the nitrification process taking place in a BFT system.
Stellenbosch University https://scholar.sun.ac.za

23
Reactive phosphorus/orthophosphate (𝑃𝑂43−
or PO4–P) originates from the feed, and is an
important measurement in water quality monitoring, as increased levels, along with NO3 can result in
algae blooms (Macintosh and Little 1995; Stone and Thomforde 2004). This mechanism is however
useful when fertilizing ponds to stimulate autotrophs and heterotrophs, and the process of using animal
litter to supply these nutrients has been practised for centuries (Macintosh and Little 1995; Nguenga et
al. 1997; Stone and Thomforde 2004; El-Sayed 2006b). Luo et al. (2014) found the level of PO4 to be
considerably lower in BFT tanks when compared to the levels found in recirculating aquaculture
systems (RAS). This is similar to results by Ray et al. (2011) who found lower PO4 levels in BFT
raceways with high solids.This may be due to the extensive utilization of the PO4 which takes place by
the outsized community of autotrophs and heterotrophs within the BFT system, and thus keeps levels
lower (Luo et al. 2014).
Turbidity is a measure of the degree to which the transparency of water is lost due to suspended
solids in the water, and it is linked to the FV, TSS and therefore the level of biofloc (Ray et al. 2011;
Hargreaves 2013). High levels of turbidity have reportedly lead to lower production in ponds, due to
less light penetration into the water, which hampers photosynthesis (Chandler 1942; Ledgerwood et al.
1978; Kirk 1985; Green et al. 1990). This is also linked to reduced artificial feed intake which has been
observed for tilapia when turbidity is high (Ardjosoediro and Ramnarine 2002; Azim and Little 2008).
There are however some desirable observations, and lower aggression and cannibalism levels in fish,
have been attributed to high turbidity levels (Hecht and Pienaar 1993; Popma and Lovshin 1996). There
is however uncertainty in the recommended turbidity level in biofloc system, with Ray et al. (2010a)
attempting to maintain levels below 30 nephelometric turbidity units (NTU), Hargreaves (2013)
suggesting that normal levels range from 75-150 NTU and Rakocy et al. (2008) as well as Ray et al.
(2011) experiencing levels far higher. With the nature of a BFT system, variation in turbidity levels are
expected, with Azim and Little (2008) rationalizing the difficulty in maintaining constant turbidity and
TSS levels.
TSS is an indication of biofloc level, being a measurement of the amount of solid particles
suspended in a water body, with high levels being discouraged in intensive aquaculture systems where
clear water has been preferred (El-Sayed 2006b). However, BFT encourages higher levels of TSS as
long as the pond mixing system can keep solids suspended, to prevent accumulation on the bottom of
Stellenbosch University https://scholar.sun.ac.za

24
the pond leading to anaerobic conditions (Avnimelech 2012). Although Avnimelech (2012) estimated
that intervention should take place above a level of 500 mg/L, each farm is unique, with levels rising up
to a point of 2100 mg/L in a study by Green et al. (2014). However, there appears to be an optimal band
of TSS levels in BFT systems, with studies by Green et al. (2014) as well as Ray et al. (2010b)
concluding that the removal of solids above a certain level, resulted in higher yield and lower feed
conversion ratio (FCR) of Channel catfish (Ictalurus punctatus) and Whiteleg shrimp (Litopenaeus
vannamei) respectively. The consumption of biofloc by tilapia was measured as a reduction in TSS by
Ekasari et al. (2014) who determined that consumption was at a level of 117 g TSS/kg fish, regardless
of the floc size. It is therefore evident that the TSS level is very dependent on the stocking density and
feeding rate within a BFT system, however little is known about optimal levels for these variables,
particularly with tilapia (Azim and Little 2008; Avnimelech 2012; Emerenciano et al. 2013; Green et al.
2014).
Different fish species have different effects on the water quality of an aquaculture system, and
depends on factors such as the feeding behaviour, its ability to change feeding habits, and the trophic
level at which it operates (Bosma and Verdegem 2011).
Environmental Requirements
Most parts of South Africa have been regarded by many as an unfavourable environment for the culture
of tilapia, with this being put forward as reasoning for the inability of the local tilapia aquaculture sector
to develop. Tilapia are considered a hardy fish, and can be cultured under a large range of
environmental conditions (Boyd 2004; Jamandre et al. 2011). Generally, tilapia are able to handle poor
water quality with low dissolved oxygen (DO) content and high ammonia levels (Shelton 2002). They
are able to adapt to a range of culture conditions at varying stocking densities, with different species
and being fed different food types (Shelton 2002). Salinities of varying levels can be tolerated by tilapia,
with culture being able to take place in seawater which opens up the scope to even more diverse
habitats (Potts et al. 1967; Heijden et al. 1997; Shelton 2002; de Oca et al. 2015). Temperatures from
10-40ºC can be tolerated by tilapia (Josupeit 2005; Jinliang 2011). It must be noted that although tilapia
can tolerate a diverse range of environmental parameters, growth will not be optimized throughout the
range, and will decrease outside of the ideal conditions.
Stellenbosch University https://scholar.sun.ac.za

25
2.3 Tilapia Biology
General Classification
The phylum Chordata is a large group of organisms possessing a notochord within the animal
kingdom including Mammalia, Aves, Reptilia, Amphibia and Pisces among other classes. Within the
class Pisces, the order Perciformes accommodates the Cichlidae family which is the largest fish family
in Africa, with around 900 described species (Skelton 2001). Tilapia is a broad name given to three
genera within the Cichlidae family, namely: Oreochromis, Tilapia and Sarotherodon (Kocher et al. 1998;
Canonico et al. 2005). It is within the maternal mouth-brooding Oreochromis genus where we find the
most prevalent tilapia species’ in the aquaculture industry (El-Sayed 2006b; D’Amato et al. 2007).
Oreochromis niloticus is the most widely produced of the Oreochromis genus and has been
introduced around the world for its use in aquaculture where production has been recorded in more
than 135 countries (Figueredo and Giani 2005; FAO 2014). Of the individual tilapia species used in
aquaculture globally, the production of Oreochromis mossambicus is second only to O. niloticus (El-
Sayed 2006b; FIGIS 2015a). However the use of hybrid O. niloticus x O. aureus has grown in popularity
and proved a successful alternative to O. niloticus in certain conditions, positioning itself above O.
mossambicus on the production scale (FAO 2015). Within Africa, the O. andersonii is still highly
regarded as a viable option, particularly within its natural distribution areas where it is cultured
(Gopalakrishnan 1988; Kefi et al. 2012). Although unrefined, and still very much undeveloped, its
potential for aquaculture is being examined (Gopalakrishnan 1988; Prein 1993; Musuka and Musonda
2012).
Distribution and Habitat
Today tilapia is mainly cultured in developing countries located in areas exhibiting a tropical or
subtropical climate (Boyd 2004; Figueredo and Giani 2005). Within these climatic regions, tilapia thrive
in disturbed habitats, and are able to survive in almost all aquatic environments, posing major threats
to the biodiversity and indigenous organisms of the water body (Kaufman 1992; Fitzsimmons 2001;
Boyd 2004; Canonico et al. 2005). They have established in virtually all of the water bodies in which
they are cultured, or in which they have managed to gain access, including estuarine systems, making
Stellenbosch University https://scholar.sun.ac.za

26
them the most widely distributed group of exotic fish around the world (Courtenay 1997; Costa-Pierce
2003; FAO 2014).
Oreochromis niloticus is indigenous to parts of central and northern Africa, including the Nile
basin and lakes of the Rift Valley (Figure 2.6) (Skelton 2001). Pickering (2015) established a Global
Mapping tool for depicting the occurrence of a chosen species based on numerous sources. Although
present outside of the tropical and subtropical regions, it is clear from that the species is more
concentrated in the central band consisting of warmer climates (Figure 2.6). Oreochromis niloticus
shows a preference to well vegetated, shallow, stagnant water (Picker and Griffiths 2013). First being
introduced to South Africa in 1959, as a food fish for Bass (Micropterus spp.) in the Kwa-Zulu Natal and
Western Cape province, O. niloticus escaped into river systems and formed well established
populations in the Limpopo and Incomati systems (van Schoor 1966; Picker and Griffiths 2013).
Oreochromis mossambicus is indigenous to southern Africa with its distribution stretching in
the eastward flowing rivers from the lower Zambezi system, down the east coast of the continent until
the Bushman’s river system in the Eastern Cape province of South Africa (Skelton 2001; Russell et al.
2012). In the southern reaches of its natural distribution, O. mossambicus occurred only in estuaries
and the coastal reaches of rivers (Skelton 2001). Oreochromis mossambicus, as with O. niloticus, has
been introduced to many countries around the world for it various uses which are similar to those of O.
niloticus (Figure 2.7) (Fitzsimmons 2000; Skelton 2001; Omar et al. 2014). Its introduction outside of its
native range is reported to have taken place before O. niloticus, as it was possibly mistaken to be the
best tilapia species for use in aquaculture before O. niloticus became the dominant species
(Fitzsimmons 2000; Canonico et al. 2005). Although not being indigenous to all parts of South Africa,
O. mossambicus has been extensively introduced to many water bodies throughout South Africa in
which it has successfully established (Skelton 2001).
Oreochromis andersonii is naturally found in the Cunene, Upper Zambezi, Kafue and Okavango
river systems in southern Africa (Trewavas 1983; Skelton 2001). It has not experienced the same
degree of commercialization as seen with O. niloticus and O. mossambicus, but was identified as an
aquaculture candidate in Zambia as early as 1980 (Gopalakrishnan 1988). Oreochromis andersonii has
not been widely introduced outside of its natural range (Figure 2.8). An interesting study by Økland et
Stellenbosch University https://scholar.sun.ac.za

27
al. (2007) found that adult O. andersonii did not seem to be specialists in any habitat type with a lot of
individual variation and flexible movement patterns being observed. 51 % of the tagged fish preferred
to reside in vegetative areas, with 11 % being near vegetation, and 39 % away from vegetation (Økland
et al. 2007). This relatively high percentage away from vegetation coincides with the 39 % observed to
reside in the main stream of the river, where the flowing water often prevents the growth of vegetation
(Økland et al. 2007). This habitat selection of different fish species is directly linked to their behaviour,
with certain traits being beneficial and others detrimental when cultured in a confined system.
Figure 2.6. Global distribution of Oreochromis niloticus (Global.Mapper 2015).
Figure 2.7. Global distribution of Oreochromis mossambicus (Global.Mapper 2015).
Stellenbosch University https://scholar.sun.ac.za

28
Figure 2.8. Global distribution of Oreochromis andersonii (Global.Mapper 2015).
Behaviour
Fish behaviour and the response to feeding play a crucial role in monitoring the wellbeing of
fish as well as increases efficiency and profit margins in any aquaculture system. Although difficult to
quantify and measure, behavioural changes observed by the feeder can save feed costs and reduce
environmental degradation by reducing feed wastage (Alanärä et al. 2001; El-Sayed 2006b). Observing
fish behaviour can also give an indication of various diseases and water quality problems from which
the fish may be suffering (Toguyeni et al. 1997; El-Sayed 2006b). The importance of understanding the
specific behaviour of the fish species being cultured is no secret to successful aquaculture, and forms
the fundamental bases of husbandry practises.
El-Sayed (2006b) indicated the importance of human contact in small scale tilapia aquaculture,
as there are benefits of hand feeding tilapia rather than using other feeding methods. This labour
intensive practise does however become difficult in large-scale production, and is suggested to be used
in combination with other feeding methods (Alanärä et al. 2001; El-Sayed 2006b). With the continuous
feeding behaviour exhibited by tilapia, it is appropriate to adapt the feeding regime accordingly to
achieve maximum efficiency (Boyd 2004; El-Sayed 2006b).
Tilapia have been found to feed predominantly at night (Fortes-Silva et al. 2010). This is
contrary to the findings by Toguyeni et al. (1997) who found that O. niloticus fry were more inclined to
feed from self feeders during the light period. The importance of this is however contextualized by the
Stellenbosch University https://scholar.sun.ac.za

29
results from Madrid et al. (2001) who specified that the circadian rhythm is not as imperative in fish as
in higher vertebrates. The level at which fish feed in the water column is also a significant behavioural
trait which is important to fish farmers. Although earlier studies suggested O. andersonii to be a bottom
feeder, Gopalakrishnan (1988) discovered that they actually feed at all levels. Regardless of the light
period and level at which tilapia feed, biofloc is always available to them. Dempster et al. (1993)
suggested that quantitative aspects of ingestion have not been extensively explored in tilapia. This is
however a topic of interest as it ultimately has influence on the diet and feeding behaviour of the fish.
With tilapia predominantly being regarded as omnivorous, and differences in feeding behaviour
between species of tilapia being likely, it is probable that different species will lie at different trophic
levels or points of a scale between herbivore and carnivore.
In tilapia grow-out systems, aggression is considered a negative trait and should be mitigated
as much as possible (Watanabe et al. 1988). With aggression being shown, less energy is expended
on growth with injuries as well as cannibalism being a reality (Pantastico et al. 1988; El-Sayed and
Kawanna 2004; El-Sayed 2006b). The social stress associated with aggression can also lead to
decreased disease resistance (Volpato et al. 2003). Watanabe et al. (1988) found that by increasing
the salinity of the water, the territorial aggression of Florida Red tilapia was reduced. Stocking of
predominantly male tilapia into grow-out systems is also known to mitigate territorial aggression
associated with breeding. It is through mitigating this aggression that we are able to increase efficiency
in tilapia aquaculture. Falter (1996) reported a difference in the level of aggression between
Oreochromis macrochir and O. niloticus even though interbreeding was observed, and suggested
mapping species on an aggression gradient with overlapping zones which are areas where
interbreeding may take place. It is also conveyed by Falter (1996) that the risk of hybridization is
elevated where species of the same genus interact as the level of aggression is often similar within a
genus.
Anatomy
The Cichlidae family of fish can be distinguished from other bony fishes by the break in the
lateral line, running lower down on the posterior part of the flank, and higher up closer to the head
(Popma and Lovshin 1996). Fish of the Oreochromis genus are generally deep bodied fish, laterally
compressed, and can grow to large sizes in comparison to other cichlids (Skelton 2001; El-Sayed
Stellenbosch University https://scholar.sun.ac.za

30
2006b). The skin of tilapia is covered with cycloid scales which are large in size (Macintosh and Little
1995; El-Sayed 2006b). For commercial strains, most reports of fillet yield range from 30-38 % (Boyd
2004; Josupeit 2005; Netto et al. 2014). Tilapia produce white flesh with a good taste, used in many
restaurants around the world (Josupeit 2005; Stickney 2006; Celik 2012). Females of O. mossambicus
have a larger buccal cavity than males, due to the preopercular and interopercular bones being larger,
which is in line with their responsibility of mouth-brooding (Oliveira and Almada 1995). Within the mouth,
tilapia have pharyngeal teeth which are used in the grinding of vegetable matter, and it is also suggested
that these teeth play a role in tilapia not being well suited for capturing large prey (Trewavas 1983;
Popma and Lovshin 1996). The long intestine of tilapia, usually six times the total length of the fish,
allows for efficient utilization of plant material (Popma and Lovshin 1996; Boyd 2004). Judging by a
shorter intestine length, it was also suggested by Popma and Lovshin (1996) that O. mossambicus is
less efficient at making use of planktonic algae than what O. niloticus and O. aureus are.
Distinguishing between different species of the Oreochromis genus can be a difficult task due
to the diverse phenotypic variation found within species. Using the count of gill rakers on the lower limb
of the first gill arch is a common method used to identify fish species, along with the fin ray formula and
a lateral scale count (Ginsburg 1945; Randall 1958; Elst and Wallace 1976; Lindsey 1981; McDowall
2001; El-Sayed 2006b; Randall and Page 2014). Common anatomical differences and characteristics
are useful to distinguish between the three Oreochromis species of interest to this study (Table 2.1).
Table 2.1. Illustrates differences to distinguish between the three Oreochromis species of interest1
Structure Species
O. andersonii O. mossambicus O. niloticus
Mouth enlarged jaw duck-bill like not enlarged
Gill rakers 21-27 16-20 20-26
Lateral line scales 31-35 30-32 30-34
Caudal fin no vertical lines no vertical lines vertical lines
Dorsal spines Dorsal branched rays
16-18 15-17 16-18
11-14 10-13 12-14
Anal spines Anal branched rays
3 3 3
11-13 9-12 9-11
Colour pattern 3 spots on flank mid-lateral blotches banded
Breeding colours blue-purplish head black with white dark, reddish head
1 Content depicted in table sourced from (Trewavas 1983; Skelton 2001; Lamboj 2004)
Stellenbosch University https://scholar.sun.ac.za

31
2.4 Feeding
Natural Diet
The anatomy of fish in the Oreochromis genus is well suited to the grazing of algae, diatoms
and detritus (Skelton 2001). A high number of gill rakers, a long intestine, fine pharyngeal teeth and a
few rows of fine teeth on the jaws make Oreochromis spp. good grazers as well as filter feeders (Popma
and Lovshin 1996; Skelton 2001; Figueredo and Giani 2005).
Popma and Lovshin (1996) reiterated the favourable ability of tilapia to obtain nutritional benefit
from bacteria and plant material. They put it down to two key mechanisms, namely the grinding of
material between the fine teeth on the phanyngeal plates, and the low stomach pH of below two, which
ruptures cell walls resulting in the ability of tilapia to utilise 30-60 % of protein in algae (Popma and
Lovshin 1996).
Oreochromis niloticus, originally known to be herbivorous (Getachew and Fernando 1989; Njiru
et al. 2004), is now described as a typical omnivore, consuming insects, fish, algae, planktonic
organisms, and plant material (Popma and Lovshin 1996; Njiru et al. 2004; Figueredo and Giani 2005;
Gominho-Rosa et al. 2015; Pedrotti et al. 2015). Juveniles <50 mm tend to utilise zooplankton as their
main food source (Njiru et al. 2004).
Naturally, O. mossambicus feeds on insects, algae, diatoms, invertebrates and detritus
(Skelton 2001). A study by Whitfield and Blaber (1978) in Lake St. Lucia in northern Kwa-Zulu Natal,
South Africa revealed a decrease in the dependence on animal material in the diet of O. mossambicus
with age. This shift towards the utilization of more plant material is interesting and may be linked to the
development of the gut with age.
Oreochromis andersonii feed on zooplankton, detritus and diatoms (Skelton 2001). Winemiller
and Kelso-Winemiller (2003) found similar feeding preferences on vegetative detritus and diatoms as
well as invertebrates and algae being consumed. Juveniles were found to have consumed more
invertebrates than adult O. andersonii, similar to the findings for O. mossambicus (Winemiller and
Kelso-Winemiller 2003).
Oreochromis niloticus, O. andersonii and O. mossambicus exhibit diet overlap (Skelton 2001),
but may feed at slightly different trophic levels, as was found between O. niloticus, Oreochromis
Stellenbosch University https://scholar.sun.ac.za

32
esculentus and Oreochromis variabilis in a study by Njiru et al. (2004). This possible difference may
allow the three species of interest to utilise certain food resources better than the respective other
species. If this is the case, aquafeeds developed for a particular species may be utilised best if they
were customized for that species. With there being no overlap in their natural distribution range, it is
likely that these three species may have fitted into a similar position in the foodweb of their natural
ecosystems, exhibiting niche complementarity when under culture conditions (Skelton 2001; Winemiller
and Kelso-Winemiller 2003). Findings by Oso et al. (2006) suggest a high degree of trophic flexibility
for O. niloticus, but this may be due to the small variety of natural foods reported in the reservoire.
Zambrano et al. (2006) advocate that O. niloticus often alter the trophic structure within an ecosystem
by competing with other fish as well as preying on juvenile fish and amphibians, which is supportive of
trophic flexibility of the species (Kolding 1989; Morgan et al. 2004).
Aquaculture Feeding
Fish can respond to their nutritional requirements and select a diet which will fulfil their nutrient
need (Sánchez-Vázquez et al. 1998; Sánchez--Vázquez et al. 1999; Yamamoto et al. 2000; Vivas et
al. 2006). Fortes-Silva et al. (2010) illustrated the advantageous use of a self-selective feeding method
to better understand the nutritional requirements and therefore play a role in feed development.
In more extensive tilapia aquaculture practises, the natural food produced in the water body is
solely relied on to feed the fish (El-Sayed 2006b). Fertilizing the pond with organic or inorganic fertilizers
stimulates the primary productivity of the pond, which is the growth of autotrophic and heterotrophic
organisms on which the fish feed (Celik 2012).
Semi-intensive systems combine the natural productivity of the pond with a supplementary
feeding regime and are therefore positioned between extensive and intensive systems (De Silva 1995).
Interactions between supplementary feeding and natural productivity are very complex and not well
understood (De Silva 1995). Fish in semi-intensive systems have been documented to select a narrower
range of food items, and the full utilization of the food variety available may be questionable (Spataru
et al. 1980). Supplementary feed needs to be well balanced, taking into account the quantity and type
of natural food available to ensure that the total food consumed by the fish is of the correct balance (De
Silva 1995; Hooley et al. 2014).
Stellenbosch University https://scholar.sun.ac.za

33
Intensive systems consist of a feeding regime whereby all the food consumed by the fish is
formulated, usually in the form of pellets. Celik (2012) reiterated the dependence of intensive tilapia
culture on high quality commercial feeds.
Protein is arguably the most important ingredient in aquafeed. It makes up the greatest cost in
feed, and it is important to feed the correct level of protein in the diet to different life stages of tilapia,
taking into account the energy content of the diet as well as the protein source (Wu et al. 1994; Wu et
al. 1995; El-Sayed 2006b; Loum et al. 2013). Adult tilapia are generally fed a diet with a protein content
of 20-30 %. (El-Sayed 2004; El-Sayed 2006b).
Fishmeal has been used extensively in the manufacture of aquafeeds for use in aquaculture
around the world (El-Sayed 2006b; Tacon and Metian 2008; Singh and Muthukumarappan 2014). High
protein content, good digestibility and good composition of essential amino acids and essential fatty
acids have led to fishmeal being deemed the “gold standard” protein source for carnivorous fish by
Lunger et al. (2006). Global shortage of fishmeal, along with much ethical protest of its use has resulted
in prices sky rocketing, and a search for alternative proteins to replace fishmeal (Lunger et al. 2006;
Naylor et al. 2009; Hardy 2010; Singh and Muthukumarappan 2014).
Soyabean meal offers the closest known plant protein alternative to fishmeal, with its high
protein content and essential amino acid composition (El-Sayed 2006b; Singh and Muthukumarappan
2014). Much research has been done on the replacement of fishmeal at various levels by soybean
meal, which can supply between 67 and 100 % of the protein requirements of tilapia (Shiau et al. 1990;
Fontainhas-Fernandes et al. 1999; El-Sayed et al. 2000; El-Saidy and Gaber 2002; Trosvik et al. 2013).
A study by Lin and Luo (2011) indicated that above a level of 75 % of fishmeal replaced by soybean
meal, adverse effects were encountered in terms of growth rate, feed utilization and serum lysozyme
levels. There are however some additional drawbacks with the use of soybean meal, namely the
undersupply of sulphur containing amino acids, the disabling effect of heating which is required when
using soybean meal, and the presence of endogenous anti nutrients (El-Sayed et al. 2000; El-Sayed
2006b).
In recent times, researches have looked into the use of maggot meal to take the pressure off
of fishmeal as a protein source in animal feeds, particularly for monogastrics (Téguia et al. 2002;
Stellenbosch University https://scholar.sun.ac.za

34
Awoniyi et al. 2003; Ajani et al. 2004; Sing et al. 2014; Charlton et al. 2015). Being of animal origin, and
grown on animal waste, the prospects for cheap production are promising, with studies on tilapia
showing good growth and encouraging results as an effective, sustainable substitute (Ogunji et al. 2007;
Ogunji et al. 2008; Sing et al. 2014).
Intuitive thinking has led to another alternative protein source. The use of microbial protein by
ruminants as their main protein source, through internal action by the rumen, is well documented (Stern
and Hoover 1979; Clark et al. 1992; Firkins 1996; Zhu et al. 2013). The external production of microbial
protein is now being explored to aid in replacing fishmeal used in the manufacture of animal feeds, and
in particular feeds used in aquaculture (Azim et al. 2008). Microbial protein is able to be generated from
waste products produced by other industries such as food processing, by enhancing the use of micro-
organisms (Browdy et al. 2010). Through nutrient recycling by micro-organisms, the efficiency of
systems can be improved and a valuable protein source can be produced. With aquaculture firmly
embedded in efficiency, the use of microbial protein has been explored with one school of thought being
that of biofloc technology (BFT) which is applicable to filter feeding organisms such as tilapia.
Microbial Community Composition
Biofloc systems may be indoors or outdoors, with outdoor system being more commercialized
and showing increased share of photoautotrophs due to the presence of light (Ray et al. 2009;
Avnimelech 2012; Baloi et al. 2013). In the development of an outdoor BFT system, the water shifts
from a greenwater algal system to a brownwater bacterial system with increased feeding, and can be
measured on the Microbial Community Colour Index (MCCI) (Hargreaves 2013). This shift also
indicates a shift from algae as the main mechanism for ammonia control to the more efficient bacteria,
which also require an increase in aeration (Hargreaves 2013).
A single floc was described by Emerenciano et al. (2013) as a macroaggregate (Figure 2.9).
BFT systems are made up of flocs, typically consisting of organic matter, physical substrate,
phytoplankton, free and attached bacteria and zooplankton grazers (Ray et al. 2010b; Emerenciano et
al. 2013). The interactions and ratios in abundance between the micro-organisms are however complex
and vary considerably from case to case (Emerenciano et al. 2013). A study by Avnimelech and Kochba
(2009) determined that organisms in the biofloc have a typical residence time of 10 hours, indicating a
Stellenbosch University https://scholar.sun.ac.za

35
speedy turnover rate through the harvesting by fish and microbial degradation, which leads to a
consistency of mainly young and active cells (Avnimelech 2012).
Figure 2.9. A single biofloc, a coagulation of micro-organisms with the scale bar being 100 microns (Hargreaves 2013).
Within a BFT system, it is bacteria which is the most fundamentally important micro-organism
in providing a microbial food source and controlling water quality (Avnimelech 2012). There are two
functional groups of bacteria which are relied upon to control the water quality, namely
chemoautotrophic nitrifying bacteria, and heterotrophic ammonia assimilating bacteria (Ebeling et al.
2006; Ray et al. 2010b). The action of these functional groups results in high oxygen use and lowered
alkalinity, which both require supplementation (Ray et al. 2010b).
The pathway of nitrifying bacteria in aquaculture systems is well understood and has been
extensively studied (Tal et al. 2003; Michaud et al. 2006; Crab et al. 2007). It works by TAN being
converted by oxidation reactions to the highly toxic nitrite species, and is in turn converted to nitrate
which poses a much reduced danger to the cultured fish (Peng and Zhu 2006; Ray et al. 2010b;
Hargreaves 2013).
On the other hand, heterotrophic bacteria removes TAN from the water and incorporates it into
cellular protein, which can be consumed by the cultured species (Figure 2.10) (Ebeling et al. 2006; Ray
et al. 2010b; Celik 2012). Additionally, heterotrophic bacteria have a growth rate up to ten times higher
than nitrifying bacteria in the presence of adequate amounts of an organic carbon supply, which results
Stellenbosch University https://scholar.sun.ac.za

36
in a much more rapid reduction of TAN levels and increase in microbial biomass, holding nutritional
potential (Hargreaves 2006; Crab et al. 2012; Hargreaves 2013).
Figure 2.10. The heterotrophic pathway exhibited in a biofloc technology (BFT) system (Avnimelech 2012).
Nutritional Properties
Crab et al. 2010 put forward that biofloc consists of sufficient levels of protein, lipid,
carbohydrate and ash to comprise a complete aquafeed. Bioflocs offer good nutritional properties, but
due to the nature of BFT systems, there is varying consistency in different culture environments, as the
biological composition of the biofloc varies (Ju et al. 2008; Hargreaves 2013). Widanarni et al. (2012)
found a crude protein content of between 39 and 48 % for biofloc collected from Red tilapia trials of
varying stocking density. This is consistent with the 25-50 % range reported by Hargreaves (2013).
However, Ekasari et al. (2014) presented 17.2-27.8 % protein for biofloc harvested from shrimp culture
systems, with Crab et al. (2010) recording 58 %, which is testimony of the varying consistency between
production environments. The lipid content of 6-7.5 % found by Ekasari et al. (2014) was within the
typical range of 0.5-15 % reported by Hargreaves (2013). The elevated lipid content of up to 24 % found
by Widanarni et al. (2012) is not encompassed by the range put forward by Hargreaves (2013), or in
line with other findings of 2-5 % by Azim et al. (2008); Azim and Little (2008) and Crab et al. (2010).
This high lipid level reported by Widanarni et al. (2012) may be partly explained by the high level of
Stellenbosch University https://scholar.sun.ac.za

37
diatoms reportedly found in the biofloc investigated, which can contain lipid levels of up to 25 % (Shifrin
and Chisholm 1981). The amino acid and fatty acid composition of biofloc is not well documented, with
contradictory results requiring more research in the field in order to better understand this facet (Crab
et al. 2012; Hargreaves 2013).
Feeding in a Biofloc System
Tilapia can be fed with biofloc in two different ways, namely harvesting of biofloc and using it to
create a pelleted feed, and the in situ production and consumption of biofloc within the pond in which
the fish are grown (Avnimelech 2012; Widanarni et al. 2012; Emerenciano et al. 2013). The former may
offer value as not only an aquafeed, but as a feed for other animals in the form of a biofloc meal
(Emerenciano et al. 2013). The processing of the biofloc for this product is however costly, and the
nutritional qualities of the biofloc may be altered through the processing, but nevertheless it is gaining
more attention and the focus of much research (Kuhn et al. 2009; Kuhn et al. 2010; Bauer et al. 2012;
Emerenciano et al. 2013; Hussain et al. 2014; Kurup 2015; Valle et al. 2015). In situ utilization requires
a filter feeding species to harvest the biofloc directly from the water in which it is cultured, and is the
major application of BFT in the aquaculture industry today (Avnimelech 2012; Crab et al. 2012;
Hargreaves 2013; Ekasari et al. 2014).
There are a number of ways in which the gain experienced in BFT systems is expressed.
Hargreaves (2013) suggested that shrimp or tilapia in biofloc systems are able to derive 20-30 % of
their growth from feeding on this available microbial protein. A study by Avnimelech (2007) put forward
that the biofloc consumed by tilapia makes up around 50 % of the usual amount of feed which is fed to
the fish. Widanarni et al. (2012) found that Red tilapia fed on biofloc required up to 73 % less feed than
the control treatments. The gains experienced by Luo et al. (2014) were depicted in a number of different
ways. The mass of individual fish at harvest was 22 % higher in BFT treatments with FCR being 18 %
lower as opposed to RAS treatments (Luo et al. 2014). Total mass gained was 128 % higher in the BFT
treatment with the specific growth rate being 112 % higher than the RAS treatment (Luo et al. 2014).
No difference in growth was observed by Azim and Little (2008) for tilapia in BFT tanks fed pelleted
feed of 35 % and 24 % protein respectively, although both treatments exhibited higher growth than the
control without biofloc and fed the 35 % protein diet.
Stellenbosch University https://scholar.sun.ac.za

38
It is therefore evident that within BFT systems following the conventional, low-cost, in situ
approach, the administering of pelleted feed is able to be significantly reduced, as the cultured organism
is able to feed on the biofloc ad lib (Avnimelech 2007; Azim and Little 2008; Avnimelech 2012; Celik
2012; Widanarni et al. 2012). It is well known in aquaculture that by increasing the frequency of feeding,
higher efficiency and better growth are realised (Popma and Lovshin 1996; El-Sayed 2006a; Fortes-
Silva et al. 2010; Celik 2012). The benefit from the ad lib availability of biofloc in these systems is
therefore evident.
Growth
Mass and length have formed the basis of measurements for recording fish growth in fishery
science and aquaculture (Pelletier et al. 1995; Jones et al. 1999; Richter et al. 2000; Cade et al. 2008).
The growth rate and efficiency of growth is of utmost importance to tilapia farmers around the
world. A number of indicators may be calculated to measure efficiency; FCR is one, and is an indication
of the amount of dry feed given to the fish divided by the wet mass gained (Stadtlander et al. 2011).
This is however more challenging to calculate in more extensive types of systems, as the fish utilise
natural feed which is difficult to quantify. Fish grown extensively tend to grow slower than those grown
more intensively where feeding is more meticulous. Within a semi-intensive biofloc technology (BFT)
system, tilapia are able to feed continuously on the natural food source produced in the form of bioflocs
within the water body, and in addition, are fed a pelleted feed. Being able to feed continuously should
therefore result in better growth than if just fed at set times (Emerenciano et al. 2013).
Feeding more frequently has also proven to be more efficient with fish showing decreased FCR
when fed frequently (El-Sayed 2006b). Feed conversion ratio values of below 1:1 have been reported
for O. niloticus, with FCR varying throughout the life cycle of the fish (De Silva and Anderson 1995;
Ogunji et al. 2008).
The protein type and content of the feed are also of importance to the growth rate and ability of
the fish to utilise feed (Tacon and Hassan 2007). Protein which shows a higher bioavailability will often
yield better growth, but are usually more costly. It is up to the tilapia farmer to weigh up the cost against
the benefit gained from the feed, and work out which is best for him.
Stellenbosch University https://scholar.sun.ac.za

39
With the two pronged approach of traditional animal selection and genetic improvement taking
place, faster growing strains of tilapia are being developed, with the effort being accelerated in recent
times (Lutz et al. 2006; Ansah et al. 2014). This comes as no surprise, as genetic improvement has
been earmarked to be one of the cheapest and influential ways of improving the efficiency of
aquaculture (Ponzoni et al. 2007). The genetic improvement of farmed tilapia (GIFT) project has been
a significant advancement in recent times, and the technology and method used in developing the GIFT
strain of O. niloticus has been replicated elsewhere (Attipoe et al. 2013).
Much of the effort put into genetic improvement has been focussed on O. niloticus (Mair et al.
1997; Bentsen et al. 1998; Eknath et al. 2007; Tanamati et al. 2015). This is largely due to its extensive
use throughout the globe as it has been regarded as the best tilapia species for aquaculture. The usage
of O. mossambicus globally, has also resulted in this species experiencing a fair amount of genetic
improvement itself (Ch’ang 1971; Cnaani et al. 2000). Having been introduced internationally in the
1930’s, the time consuming practise of selective breeding programs have had time to better the
aquaculture potential of this species (Ch’ang 1971; Agresti et al. 2000). On the other hand, O.
andersonii has experienced very little genetic improvement, with Gopalakrishnan (1988) identifying the
need for the development of high quality seed.
As genetic improvement has inevitably been focussed on certain species more than others
(Attipoe et al. 2013), it adds complication when comparing the growth rates between species.
Additionally to being difficult to quantify, genetic improvement of tilapia species has used different wild
strains and taken place independently in some cases, but also replicated in different countries around
the world in other cases (Attipoe et al. 2013). It would be implausible to assume that one could obtain
strains with the same level of genetic improvement and should rather be focussed on what is available
and likely to be used in commercial aquaculture at the location at which the researcher is applying the
research.
Species
Species chosen to be cultured in a BFT system should be able to tolerate poorer water quality
with high solids, as well as obtain nutrition from the biofloc through filter feeding (Crab et al. 2012;
Hargreaves 2013). It is also suggested by Crab et al. (2012) that the focus should be on lower trophic
species which exhibit a herbivorous diet. Hargreaves (2013) indicated the use of either Shrimp, Carp
Stellenbosch University https://scholar.sun.ac.za

40
or tilapia in almost all BFT systems worldwide, with Widanarni et al. (2012) pointing out the additional
use of Sturgeon an Snook in a study by Serfling (2006). Although research is also looking into the
incorporation of various Catfish species (Green et al. 2014), the inability to handle high solid content,
as well as not possessing the adaptation to gain nutritional benefit from biofloc, are limiting factors
(Hargreaves 2013). It is suggested by Avnimelech (2012) that Shrimp and tilapia are the major species
cultured in BFT systems, with Ekasari et al. (2013) ear-marking tilapia as one of the most promising.
Tilapia are a warm water fish species, and therefore their commercial use in BFT systems is
predominantly done in countries which possess adequate climatic conditions to successfully culture this
species. Although research has been conducted in controlled microclimates outside of these preferred
areas (Azim and Little 2008; De Schryver and Verstraete 2009; Ekasari et al. 2010), the commercial
application in these areas would be questionable with high costs of maintaining suitable temperatures.
In BFT systems, tilapia are grown at a stocking density of up to 50 kg/mᵌ or 500 ton/ha with
daily feeding rates being up to one kilogram per metre cubed (Avnimelech 2012). Tilapia can make use
of the biofloc as they are efficient filter feeders, having the physiological ability to harvest biofloc from
the water (Hargreaves 2013). Considered to occupy a low trophic level, tilapia is foreseen to play an
increasingly important role into the future where lower trophic species are being nominated for intensive
focus on the way forward (Fitzsimmons 2000; Shelton 2002; Tacon et al. 2009; Swaminathan 2012;
Crab et al. 2012).
The three tilapia species in focus, O. niloticus, O. mossambicus and O. andersonii differ in
biological aspects from anatomy to natural diet and feeding behaviour. As these are different species
of tilapia utilised in aquaculture, there is reason to believe that they may feed at slightly different trophic
levels and occupy niches which somewhat differ from one another. If a particular species could fill the
required niche better than another species in an aquaculture system, efficiency would increase without
having to rely on the overlapping niche of the less preferred species. By selecting the preferred species
to fill this required niche, the species would be more compatible in that position in the food-web, and
would show increased production in an aquaculture facility. Although all three of these tilapia species
can utilise biofloc, comparisons on their compatibility to a BFT system in terms of growth have not been
investigated. It would therefore be of value to conduct a study into which of these species shows the
best utilization of biofloc and therefore the highest growth rate in a BFT system.
Stellenbosch University https://scholar.sun.ac.za

41
2.5 References
Agresti JJ, Seki S, Cnaani A, et al. (2000) Breeding new strains of tilapia: development of an artificial center of origin and linkage map based on AFLP and microsatellite loci. Aquaculture 185:43–56.
Ajani EK, Nwanna LC, Musa BO (2004) Replacement of fishmeal with maggot meal in the diets of Nile tilapia, Oreochromis niloticus. World Aquac 35:52–54.
Alanärä A, Kadri S, Paspatis M (2001) Feeding management. In: Houlihan D, Boujard T, Jobling M (eds) Food intake in fish. Blackwell Science, Oxford.
Albert A (1973) Selective toxicity: the physico-chemical basis of therapy, 5th edn. Chapman and Hall, London.
Ansah YB, Frimpong EA, Hallerman EM (2014) Genetically-improved tilapia strains in Africa: potential benefits and negative impacts. Sustain 6:3697–3721.
Ardjosoediro I, Ramnarine IW (2002) The influence of turbidity on growth, feed conversion and survivorship of the Jamaica Red tilapia strain. Aquaculture 212:159–165.
Asaduzzaman M, Rahman MM, Azim ME, et al. (2010) Effects of C/N ratio and substrate addition on natural food communities in freshwater prawn monoculture ponds. Aquaculture 306:127–136.
Attipoe FY, Blay Jnr J, Agyakwah S, et al. (2013) Genetic parameters and response to selection in the development of Akosombo strain of the Nile tilapia (Oreochromis niloticus) in the Volta Basin, Ghana. In: 10th international symposium on tilapia in aquaculture. Jerusalem, 6-10 October 2013.
Atwood HL, Fontenot QC, Tomasso JR, Isely JJ (2001) Toxicity of nitrite to Nile tilapia: effect of fish size and environmental chloride. N Am J Aquac 63:49–51.
Avnimelech Y (2012) Biofloc technology - a practical guide book, 2nd edn. World Aquaculture Society, Baton Rouge.
Avnimelech Y (1999) Carbon/nitrogen ratio as a control element in aquaculture systems. Aquaculture 176:227–235.
Avnimelech Y (2007) Feeding with microbial flocs by tilapia in minimal discharge bio-flocs technology ponds. Aquaculture 264:140–147.
Avnimelech Y, Kochba M (2009) Evaluation of nitrogen uptake and excretion by tilapia in biofloc tanks, using 15 N tracing. Aquaculture 287:163–168.
Avnimelech Y, Mokady S (1988) Protein biosynthesis in circulated fishponds In: Pullin RSV, Bhukaswan T, Tonguthai K, Maclean JL (eds) ICLARM, 2nd international symposium on tilapia in aquaculture, Bangkok, 16-20 March 1987.
Avnimelech Y, Mokady S, Schroeder GL (1989) Circulated ponds as efficient bioreactors for single cell protein production. Isr J Aquac 41:58–66.
Awoniyi TA, Aletor VA, Aina JM (2003) Performance of broiler-chickens fed on maggot meal in place of fishmeal. Int J Poult Sci 2:271–274.
Stellenbosch University https://scholar.sun.ac.za

42
Azim ME, Little DC (2008) The biofloc technology (BFT) in indoor tanks: water quality, biofloc composition, and growth and welfare of Nile tilapia (Oreochromis niloticus). Aquaculture 283:29–35.
Azim ME, Little DC, Bron JE (2008) Microbial protein production in activated suspension tanks manipulating C: N ratio in feed and the implications for fish culture. Bioresour Technol 99:3590–3599.
Balarin JD, Hatton JP (1979) Tilapia: A guide to their biology and culture in Africa. University of Stirling, Stirling.
Baloi M, Arantes R, Schveitzer R, et al. (2013) Performance of Pacific White Shrimp Litopenaeus vannamei raised in biofloc systems with varying levels of light exposure. Aquac Eng 52:39–44.
Barbieri E (2010) Acute toxicity of ammonia in White Shrimp (Litopenaeus schmitti) (Burkenroad, 1936, Crustacea) at different salinity levels. Aquaculture 306:329–333.
Bauer W, Prentice-Hernandez C, Tesser MB, et al. (2012) Substitution of fishmeal with microbial floc meal and soy protein concentrate in diets for the Pacific White Shrimp Litopenaeus vannamei. Aquaculture 342:112–116.
Bentsen HB, Eknath AE, Palada-de Vera MS, et al. (1998) Genetic improvement of farmed tilapias: growth performance in a complete di-allele cross experiment with eight strains of Oreochromis niloticus. Aquaculture 160:145–173.
Bosma RH, Verdegem MCJ (2011) Sustainable aquaculture in ponds: principles, practices and limits. Livest Sci 139:58–68.
Boyd C (2004) Farm-level issues in aquaculture certification : Tilapia. Auburn, Alabama.
Boyd CE (2000) Water quality: an introduction. Kluwer Academic, Boston, Massachusetts.
Browdy CL, Hulata G, Liu Z, et al. (2010) Novel and emerging technologies: can they contribute to improving aquaculture sustainability. In: Subasinghe R, Arthur J, Bartley D, et al. (eds) Farming the Waters for People and Food. FAO/NACA global conference on aquaculture, Phuket, 22-25 September 2010.
Burford MA, Thompson PJ, McIntosh RP, et al. (2004) The contribution of flocculated material to shrimp (Litopenaeus vannamei) nutrition in a high-intensity, zero-exchange system. Aquaculture 232:525–537.
Burford MA, Thompson PJ, McIntosh RP, et al. (2003) Nutrient and microbial dynamics in high-intensity, zero-exchange shrimp ponds in Belize. Aquaculture 219:393–411.
Ça A, Köksal G (2005) The acute toxicity of ammonia on tilapia (Oreochromis niloticus L.) larvae and fingerlings. Turkish J Vet Anim Sci 29:339–344.
Cade BS, Terrell JW, Porath MT (2008) Estimating fish body condition with quantile regression. North Am J Fish Manag 28:349–359.
Canonico GC, Arthington A, Mccrary JK, Thieme ML (2005) The effects of introduced tilapias on native biodiversity. Aquat Conserv Mar Freshw Ecosyst 15:463–483.
Celik E (2012) Tilapia culture review. Dissertation, Norwegian University of Life Sciences.
Stellenbosch University https://scholar.sun.ac.za

43
Ch’ang MT (1971) Determination of realized weight heritability in tilapia (Tilapia mossambica Peters). Sov Genet 7:1550–1554.
Chandler DC (1942) Limnological studies of Western Lake Erie II: Light penetration and its relation to turbidity. Ecology 23:41–52.
Charlton AJ, Dickinson M, Wakefield ME, et al. (2015) Exploring the chemical safety of fly larvae as a source of protein for animal feed. J Insects as Food Feed 1:7–16.
Chen QL, Zhang RJ, Wang YH, et al. (2015) The Effect of biofloc technology on nursery system of Litopenaeus vannamei. Appl. Mech. Mater. pp 358–361.
Clark JH, Klusmeyer TH, Cameron MR (1992) Microbial protein synthesis and flows of nitrogen fractions to the duodenum of dairy cows. J Dairy Sci 75:2304–2323.
Cnaani A, Gall GAE, Hulata G (2000) Cold tolerance of tilapia species and hybrids. Aquac Int 8:289–298.
Costa-Pierce BA (2003) Rapid evolution of an established feral tilapia (Oreochromis spp.): the need to incorporate invasion science into regulatory structures. Biol Invasions 5:71–84.
Courtenay WR (1997) Tilapias as non-indigenous species in the Americas: environmental, regulatory and legal issues. In: Costa-Pierce BA, Rakocy JE (eds) Tilapia aquaculture in the Americas, Vol 1. The World Aquaculture Society, Baton Rouge, Louisiana.
Courtenay WR, Williams JD (1992) Dispersal of exotic species from aquaculture sources, with emphasis on freshwater fishes. In: Rosenfield A, Mann R (eds) Dispersal of living organisms into aquatic systems. Maryland Sea Grant Program, College Park, Maryland.
Crab R, Avnimelech Y, Defoirdt T, et al. (2007) Nitrogen removal techniques in aquaculture for a sustainable production. Aquaculture 270:1–14.
Crab R, Chielens B, Wille M, et al. (2010) The effect of different carbon sources on the nutritional value of bioflocs, a feed for Macrobrachium rosenbergii postlarvae. Aquac Res 41:559–567.
Crab R, Defoirdt T, Bossier P, Verstraete W (2012) Biofloc technology in aquaculture: beneficial effects and future challenges. Aquaculture 356-357:351–356.
Crab R, Kochva M, Verstraete W, Avnimelech Y (2009) Bio-flocs technology application in over-wintering of tilapia. Aquac Eng 40:105–112.
Cuzon G, Lawrence A, Gaxiola G, et al. (2004) Nutrition of Litopenaeus vannamei reared in tanks or in ponds. Aquaculture 235:513–551.
D’Amato ME, Esterhuyse MM, Van Der Waal BCW, et al. (2007) Hybridization and phylogeography of the Mozambique tilapia Oreochromis mossambicus in southern Africa evidenced by mitochondrial and microsatellite DNA genotyping. Conserv Genet 8:475–488.
Daud SK, Hasbollah D, Law QT (1988) Effects of unionized ammonia on red tilapia (Oreochromis mossambicus/O. niloticus hybrid) fry. In: Pullin RSV, Bhukaswan T, Tonguthai K, Maclean JL (eds) ICLARM, 2nd international symposium on tilapia in aquaculture, Bangkok, 16-20 March 1987.
De Oca GAR, Román-reyes JC, Alaniz-gonzalez A, et al. (2015) Effect of salinity on three tilapia (Oreochromis sp.) strains : hatching rate , length and yolk sac size. Int J Aquat Sci 6:96–106.
Stellenbosch University https://scholar.sun.ac.za
44
De Schryver P, Boon N, Verstraete W, Bossier P (2012) The biology and biotechnology behind bioflocs. In: Avnimelech Y (ed) Biofloc technology - a practical guide Book, 2nd edn. World Aquaculture Society, Baton Rouge, Louisiana.
De Schryver P, Crab R, Defoirdt T, et al. (2008) The basics of bio-flocs technology: the added value for aquaculture. Aquaculture 277:125–137.
De Schryver P, Verstraete W (2009) Nitrogen removal from aquaculture pond water by heterotrophic nitrogen assimilation in lab-scale sequencing batch reactors. Bioresour Technol 100:1162–1167.
De Silva SS (1995) Supplementary feeding in semi-intensive aquaculture systems. In: New MB, Tacon AGJ, Csavas I (eds) Farm-made aquafeeds. FAO, Rome.
De Silva SS, Anderson TA (1995) Fish nutrition in aquaculture. Springer Science & Business Media, Dordrecht.
Del Giorgio PA, Cole JJ (1998) Bacterial growth efficiency in natural aquatic systems. Annu Rev Ecol Syst 29:503–541.
Dempster PW, Beveridge MCM, Baird DJ (1993) Herbivory in the tilapia Oreochromis niloticus: a comparison of feeding rates on phytoplankton and periphyton. J Fish Biol 43:385–392.
Durborow RM, Crosby DM, Brunson MW (1997) Nitrite in fish ponds. Southern regional aquaculture centre publication 462.
Ebeling JM, Timmons MB, Bisogni JJ (2006) Engineering analysis of the stoichiometry of photoautotrophic, autotrophic, and heterotrophic removal of ammonia-nitrogen in aquaculture systems. Aquaculture 257:346–358.
Edwards P (2000) Aquaculture, poverty impacts and livelihoods. Natural Resource Perspectives ODI, London.
Ekasari J, Angela D, Waluyo SH, et al. (2014) The size of biofloc determines the nutritional composition and the nitrogen recovery by aquaculture animals. Aquaculture 426:105–111.
Ekasari J, Crab R, Verstraete W (2010) Primary nutritional content of bio-flocs cultured with different organic carbon sources and salinity. Hayati J Biosci 17:125–130.
Ekasari J, Zairin M, Putri DU, et al. (2013) Biofloc-based reproductive performance of Nile tilapia Oreochromis niloticus L. broodstock. Aquac Res 46:509–512.
Eknath AE, Bentsen HB, Ponzoni RW, et al. (2007) Genetic improvement of farmed tilapias: composition and genetic parameters of a synthetic base population of Oreochromis niloticus for selective breeding. Aquaculture 273:1–14.
El-Saidy DMSD, Gaber M (2002) Complete replacement of fish meal by soybean meal with dietary L-lysine supplementation for Nile tilapia Oreochromis niloticus (L.) fingerlings. J World Aquac Soc 33:297–306.
El-Sayed AFM (2006a) Tilapia culture in salt water: environmental requirements, nutritional implications and economic potentials. In: Suárez LEC, Marie DR, Salazar MT, et al. (eds) Avances en Nutrición Acuícola. 8vo simposium internacional de nutrición acuícola, Monterrey, 15-17 November 2006.
El-Sayed AFM (2006b) Tilapia culture, 1st edn. CABI Publishing, Wallingford.
Stellenbosch University https://scholar.sun.ac.za

45
El-Sayed AFM (2013) An overview of aquaculture in Egypt with focus on tilapia culture. Presented at the 11th conference of the aquaculture association of southern Africa, Stellenbosch University, Stellenbosch, 9-13 September 2013.
El-Sayed AFM (2004) Protein nutrition of farmed tilapia: searching for unconventional sources. In: Bolivar RB, Mair GC, Fitzsimmons K (eds) 6th international symposium on tilapia in aquaculture, Manila, 12-16 September 2004.
El-Sayed AFM, Kawanna M (2004) Effects of photoperiod on the performance of farmed Nile tilapia Oreochromis niloticus: Growth, feed utilization efficiency and survival of fry and fingerlings. Aquaculture 231:393–402.
El-Sayed AFM, Nmartínez I, Moyano FJ (2000) Assessment of the effect of plant inhibitors on digestive proteases of Nile tilapia using in vitro assays. Aquac Int 8:403–415.
El-Shafai SA, El-Gohary FA, Nasr FA, et al. (2004) Chronic ammonia toxicity to duckweed-fed tilapia (Oreochromis niloticus). Aquaculture 232:117–127.
Elst RP, Wallace JH (1976) Identification of the juvenile mullet of the east coast of South Africa. J Fish Biol 9:371–374.
Emerenciano M, Ballester ELC, Cavalli RO, Wasielesky W (2011) Effect of biofloc technology (BFT) on the early postlarval stage of Pink Shrimp Farfantepenaeus paulensis: growth performance, floc composition and salinity stress tolerance. Aquac Int 19:891–901.
Emerenciano M, Ballester ELC, Cavalli RO, Wasielesky W (2012a) Biofloc technology application as a food source in a limited water exchange nursery system for Pink Shrimp Farfantepenaeus brasiliensis (Latreille, 1817). Aquac Res 43:447–457.
Emerenciano M, Cuzon G, Goguenheim J, Gaxiola G (2012b) Floc contribution on spawning performance of Blue Shrimp Litopenaeus stylirostris. Aquac Res 44:75–85.
Emerenciano M, Gaxiola G, Cuzon G (2013) Biofloc Technology (BFT): A review for aquaculture application and animal food industry. In: Matovic MD (ed) Biomass now - cultivation and utilization. InTech, Rijeka, pp 301–328.
Emerson K, Russo RC, Lund RE, Thurston RV (1975) Aqueous ammonia equilibrium calculations: effect of pH and temperature. J Fish Board Canada 32:2379–2383.
ERS (2015) Aquaculture trade tables. In: Aquaculture Data, Economic Research Services, United States Department of Agriculture. Available via DIALOG. http://www.ers.usda.gov/datafiles/Aquaculture/Trade/aquaculturetraderecent.pdf. Cited 13 July 2015.
Falter U (1996) Searching for behavioural isolating mechanisms in tilapias. In: Pullin RSV, Lazard J,
Legendre M, et al. (eds) 3rd international symposium on tilapia in aquaculture, Abidjan, 11-15 November 1991.
FAO (2012) The state of world fisheries and aquaculture. ISBN 978-92-5-107225-7. FAO Fisheries Department, Rome.
FAO (2014) The state of world fisheries and aquaculture. ISBN 978-92-5-108275-1. FAO Fisheries Department, Rome.
FIGIS (2015a) FAO, Rome. http://www.fao.org/fishery/figis/en. Cited 10 Feb 2015.
Stellenbosch University https://scholar.sun.ac.za

46
FIGIS (2015b) FAO, Rome. http://www.fao.org/fishery/figis/en. Cited 1 Apr 2015.
Figueredo CC, Giani A (2005) Ecological interactions between Nile tilapia (Oreochromis niloticus, L.) and the phytoplanktonic community of the Furnas reservoir (Brazil). Freshw Biol 50:1391–1403.
Firkins J. (1996) Maximizing microbial protein synthesis in the rumen. J Nutr 126:1347–1354.
Fishstat.Plus (2004) FAO, Rome. http://www.fao.org/fishery/statistics/software/fishstat/en. Cited 2004.
Fitzsimmons K (2001) Environmental and conservation issues in tilapia aquaculture. In: Subasinghe S, Singh T (eds) Tilapia: production, marketing and technical development. Tilapia 2001 International technical and trade conference on tilapia, Kuala Lumpur, 28-30 May 2001.
Fitzsimmons K (2000) Future trends of tilapia aquaculture in the Americas. In: Costa-Pierce BA, Rakocy JE (eds) Tilapia aquaculture in the Americas, Vol 2. The World Aquaculture Society, Baton Rouge, Louisiana.
Fitzsimmons K, Martinez-Garcia R, Gonzalez-Alanis P (2011) Why tilapia is becoming the most important food fish on the planet. In: Liping L, Fitzsimmons K (eds) Better science, better fish, better life. 9th international symposium on tilapia in aquaculture, Shanghai, 22-24 April 2011.
Fontainhas-Fernandes A, Gomes E, Reis-Henriques MA, Coimbra J (1999) Replacement of fish meal by plant proteins in the diet of Nile tilapia: digestibility and growth performance. Aquac Int 7:57–67.
Fortes-Silva R, Martínez FJ, Villarroel M, Sánchez-Vázquez FJ (2010) Daily rhythms of locomotor activity, feeding behavior and dietary selection in Nile tilapia (Oreochromis niloticus). Comp Biochem Physiol Part A 156:445–450.
Getachew T, Fernando CH (1989) The food habits of an herbivorous fish (Oreochromis niloticus Linn.) in Lake Awasa, Ethiopia. Hydrobiologia 174:195–200.
Ginsburg I (1945) Contribution to a methodology in the caudal fin ray count of fishes and its use in classification. Copeia 133–142.
Global.Mapper (2015) Discover Life, Athens, Georgia. http://www.discoverlife.org/mp/20m?&act=make_map. Cited 27 Feb 2015.
Gominho-Rosa MDC, Rodrigues APO, Mattioni B, et al. (2015) Comparison between the omnivorous Jundiá Catfish (Rhamdia quelen) and Nile tilapia (Oreochromis niloticus) on the utilization of dietary starch sources: digestibility, enzyme activity and starch microstructure. Aquaculture 435:92–99.
Gopalakrishnan V (1988) Role of tilapia (Oreochromis andersonii) in integrated farming systems in Zambia. In: Pullin RSV, Bhukaswan T, Tonguthai K, Maclean JL (eds) Paper presented at ICLARM, 2nd international symposium on tilapia in aquaculture, Bangkok, 16-20 March 1987.
Green BW, Schrader KK, Perschbacher PW (2014) Effect of stocking biomass on solids, phytoplankton communities, common off-flavors, and production parameters in a Channel Catfish biofloc technology production system. Aquac Res 45:1442–1458.
Green BW, Teichert-Coddington DR, Phelps RP (1990) Response of tilapia yield and economics to varying rates of organic fertilization and season in two central American countries. Aquaculture 90:279–290.
Gupta M V, Acosta BO (2004) A review of global tilapia farming practices. Aquac Asia 9:1–14.
Stellenbosch University https://scholar.sun.ac.za

47
Hardy RW (2010) Utilization of plant proteins in fish diets: effects of global demand and supplies of fishmeal. Aquac Res 41:770–776.
Hargreaves JA (2013) Biofloc production systems for aquaculture. Southern regional aquaculture centre publication 4503.
Hargreaves JA (2006) Photosynthetic suspended-growth systems in aquaculture. Aquac Eng 34:344–363.
Hecht T, Pienaar AG (1993) A review of cannibalism and its implications in fish larviculture. J World Aquac Soc 24:246–261.
Heijden A, Verbost P, Eygensteyn J, et al. (1997) Mitochondria-rich cells in gills of tilapia (Oreochromis mossambicus) adapted to fresh water or sea water: quantification by confocal laser scanning microscopy. J Exp Biol 200:55–64.
Hooley CG, Barrows FT, Paterson J, Sealey WM (2014) Examination of the effects of dietary protein and lipid levels on growth and stress tolerance of juvenile tilapia, Oreochromis niloticus. J World Aquac Soc 45:115–126.
Hussain AS, Mohammad DA, Ali EM, Sallam WS (2014) Nutrient optimization for the production of microbial flocs in suspended growth bioreactors. J Arab Aquac Soc 9:113–130.
Iqbal KJ, Qureshi NA, Ashraf M, et al. (2012) Effect of Different salinity Levels on Growth and Survival of Nile tilapia (Oreochromis Niloticus). J Anim Plant Sci 22:919–922.
Jamandre WE, Hatch U, Bolivar RB, Borski R (2011) Improving the supply chain of tilapia industry in the Philippines. In: Liping L, Fitzsimmons K (eds) Better science, better fish, better life. 9th international symposium on tilapia in aquaculture, Shanghai, 22-24 April 2011.
Jinliang Z (2011) Tilapia germplasm in China: chance and challenge In: Liping L, Fitzsimmons K (eds) Better science, better fish, better life. 9th international symposium on tilapia in aquaculture, Shanghai, 22-24 April 2011.
Jones RE, Petrell RJ, Pauly D (1999) Using modified length-weight relationships to assess the condition of fish. Aquac Eng 20:261–276.
Josupeit H (2005) World Market of tilapia, Vol 79. FAO Globefish Research Programme, Rome.
Ju ZY, Forster I, Conquest L, et al. (2008) Determination of microbial community structures of shrimp floc cultures by biomarkers and analysis of floc amino acid profiles. Aquac Res 39:118–133.
Kaufman L (1992) Catastrophic change in species-rich freshwater ecosystems. Bioscience 846–858.
Kefi AS, Kang’ombe J, Kassam D, Katongko C (2012) Growth, reproduction and sex ratios in Oreochromis andersonii (Castelnau, 1861) fed with varying Levels of 17α-methyl testosterone. J Aquac Res Dev 3:130–137.
Kirk JTO (1985) Effects of suspensoids (turbidity) on penetration of solar radiation in aquatic ecosystems. Hydrobiologia 125:195–208.
Kocher TD, Lee WJ, Sobolewska H, et al. (1998) A genetic linkage map of a cichlid fish, the tilapia (Oreochromis niloticus). Genetics 148:1225–1232.
Stellenbosch University https://scholar.sun.ac.za

48
Kolding J (1989) The fish resources of Lake Turkana and their environment. Dissertation, University of Bergen.
Kuhn DD, Boardman GD, Lawrence AL, et al. (2009) Microbial floc meal as a replacement ingredient for fish meal and soybean protein in shrimp feed. Aquaculture 296:51–57.
Kuhn DD, Lawrence AL, Boardman GD, et al. (2010) Evaluation of two types of bioflocs derived from biological treatment of fish effluent as feed ingredients for Pacific White Shrimp, Litopenaeus vannamei. Aquaculture 303:28–33.
Kurup BM (2015) Biofloc Technology: An overview and its application in animal food industry. Int J Fish Aquac 5:1–20.
Lamboj A (2004) The cichlid fishes of western Africa. Birgit Schmettkamp Verlag, Bornheim.
Ledgerwood RD, Hughes DG, Ortiz MV (1978) Wet and dry season comparison of tilapia aurea production in El Salvador in new fertilized and unfertilized earthen ponds. J World Aquac Soc 9:357–371.
Legendre M, Ecoutin JM (1989) Suitability of brackish water tilapia species from the Ivory Coast for lagoon aquaculture. I-Reproduction. Aquat Living Resour 2:71–79.
Lin S, Luo L (2011) Effects of different levels of soybean meal inclusion in replacement for fish meal on growth, digestive enzymes and transaminase activities in practical diets for juvenile tilapia, Oreochromis niloticus x O. aureus. Anim Feed Sci Technol 168:80–87.
Lindsey CC (1981) Stocks are chameleons: plasticity in gill rakers of coregonid fishes. Can J Fish Aquat Sci 38:1497–1506.
Liu L, Hu Z, Dai X, Avnimelech Y (2014) Effects of addition of maize starch on the yield, water quality and formation of bioflocs in an integrated shrimp culture system. Aquaculture 418:79–86.
López-Elías JA, Moreno-Arias A, Miranda-Baeza A, et al. (2015) Proximate composition of bioflocs in culture systems containing hybrid Red tilapia fed diets with varying levels of vegetable meal inclusion. N Am J Aquac 77:102–109.
Loum A, Sagne M, Fall J, et al. (2013) Effects of dietary protein level on growth performance, carcass composition and survival rate of fry monosex Nile tilapia , Oreochromis niloticus reared under re-circulating system. J Biol Life Sci 4:13–22.
Lunger AN, Craig SR, McLean E (2006) Replacement of fish meal in Cobia (Rachycentron canadum) diets using an organically certified protein. Aquaculture 257:393–399.
Luo G, Gao Q, Wang C, et al. (2014) Growth, digestive activity, welfare, and partial cost-effectiveness of genetically improved farmed tilapia (Oreochromis niloticus) cultured in a recirculating aquaculture system and an indoor biofloc system. Aquaculture 422:1–7.
Lutz CG, Lim CE, Webster CD (2006) Recent directions in genetics. In: Lim CE, Webster CD (eds) Tilapia: biology, culture, and nutrition. CRC Press, Boca Raton, Florida.
Macintosh D, Little D (1995) Nile tilapia (Oreochromis niloticus). In: Bromage NR, Roberts RJ (eds) Broodstock management and egg and larval quality. Blackwell Science, Oxford.
Madrid JA, Boujard T, Sánchez-Vázquez FJ (2001) Feeding rhythms. In: Houlihan, D (ed) Food intake in fish. Blackwell Science, Oxford.
Stellenbosch University https://scholar.sun.ac.za

49
Mair GC, Abucay JS, Abella TA, et al. (1997) Genetic manipulation of sex ratio for the large-scale production of all-male tilapia Oreochromis niloticus. Can J Fish Aquat Sci 54:396–404.
McDowall RM (2001) The principal caudal fin ray count-a fundamental character in the galaxioid fishes. New Zeal J Zool 28:395–405.
Michaud L, Blancheton JP, Bruni V, Piedrahita R (2006) Effect of particulate organic carbon on heterotrophic bacterial populations and nitrification efficiency in biological filters. Aquac Eng 34:224–233.
Milstein A, Avnimelech Y, Zoran M, Joseph D (2001) Growth performance of hybrid Bass and hybrid tilapia in conventional and active suspension intensive ponds. Isr J Aquac – Bamidgeh 53:147–157.
Mjoun K, Rosentrater KA, Brown ML (2010) Tilapia : profile and economic importance. South Dakota Cooperative Extension Service. Brookings, South Dakota.
Morgan DL, Gill HS, Maddern MG, Beatty SJ (2004) Distribution and impacts of introduced freshwater fishes in western Australia. New Zeal J Mar Freshw Res 38:511–523.
Musuka CG, Musonda FF (2012) Current and future prospects of commercial fish farming in Zambia. Int J Bioflux Soc 5:79–87.
Naylor RL, Hardy RW, Bureau DP, et al. (2009) Feeding aquaculture in an era of finite resources. Proceedings of the national academy of sciences 106:15103–15110.
Neori A, Krom MD, Cohen I, Gordin H (1989) Water quality conditions and particulate chlorophyll a of new intensive seawater fishponds in Eilat, Israel: daily and diel variations. Aquaculture 80:63–78.
Netto JDPC, de Oliveira Filho PRC, Lapa-Guimarães J, Viegas EMM (2014) Physicochemical and sensory characteristics of snack made with minced Nile tilapia. Food Sci Technol 34:591–596.
Nguenga D, Breine JJ, Sulem Yong S, et al. (1997) Effect of animal manure and chemical fertilizer on the growth and survival of tilapia cameronensis Holly in Cameroon. Aquac Res 28:231–234.
Nielsen DL, Brock MA, Rees GN, Baldwin DS (2003) Effects of increasing salinity on freshwater ecosystems in Australia. Aust J Bot 51:655–665.
Njiru M, Okeyo-Owuor JB, Muchiri M, Cowx IG (2004) Shifts in the food of Nile tilapia, Oreochromis niloticus (L.) in Lake Victoria, Kenya. Afr J Ecol 42:163–170.
Ogunji J, Nimptsch J, Wiegand C, Schulz C (2007) Evaluation of the influence of housefly maggot meal (magmeal) diets on catalase, glutathione S-transferase and glycogen concentration in the liver of Oreochromis niloticus fingerling. Comp Biochem Physiol Part A 147:942–947.
Ogunji J, Toor RUAS, Schulz C, Kloas W (2008) Growth performance, nutrient utilization of Nile tilapia Oreochromis niloticus fed housefly maggot meal (magmeal) diets. Turkish J Fish Aquat Sci 147:141–147.
Økland F, Hay CJ, Næsje TF, et al. (2007) Movements of, and habitat utilisation by, Threespot tilapia Oreochromis andersonii (Teleostei: Cichlidae) in the upper Zambezi River, Namibia. African J Aquat Sci 32:35–38.
Oliveira R, Almada V (1995) Sexual dimorphism and allometry of external morphology in Oreochromis mossambicus. J Fish Biol 46:1055–1064.
Stellenbosch University https://scholar.sun.ac.za

50
Omar I, Janifa UA, Haque SA, et al. (2014) Analysis of marketing efficiency, value addition and spatial co-integration of Mozambique tilapia (Oreochromis mossambicus) fish in some selected areas of Bangladesh. 5:79–89.
Oso JA, Ayodele IA, Fagbuaro O (2006) Food and feeding habits of Oreochromis niloticus (Linn) and Sarotherodon galilaeus ( Linn) in a tropical reservoir. World J Zool 1:118–121.
Panjaitan P (2004) Field and laboratory study of Penaeus monodon culture with zero water exchange and limited water exchange model using molasses as a carbon source. Dissertation, Charles Darwin University.
Pantastico J, Dangilan MJVLA, Eguia RV (1988) Cannibalism among different sizes of tilapia (Oreochromis niloticus) fry/fingerlings and the effect of natural food. In: Pullin RSV, Bhukaswan T, Tonguthai K, Maclean JL (eds) ICLARM, 2nd international symposium on tilapia in aquaculture, Bangkok, 16-20 March 1987.
Pedrotti FS, Davies S, Merrifield DL, et al. (2015) The autochthonous microbiota of the freshwater omnivores Jundia (Rhamdia quelen) and tilapia (Oreochromis niloticus) and the effect of dietary carbohydrates. Aquac Res 46:472–481.
Pelletier D, Blier P, Dutil JD, Guderley H (1995) How should enzyme activities be used in fish growth studies? J Exp Biol 198:1493–1497.
Peng Y, Zhu G (2006) Biological nitrogen removal with nitrification and denitrification via nitrite pathway. Appl Microbiol Biotechnol 73:15–26.
Picker M, Griffiths C (2013) Alien and invasive animals: a South African perspective. Struik Publishers, Cape Town.
Ponzoni RW, Nguyen NH, Khaw HL (2007) Investment appraisal of genetic improvement programs in Nile tilapia (Oreochromis niloticus). Aquaculture 269:187–199.
Popma TJ, Lovshin LL (1996) Worldwide prospects for commercial production of tilapia. In: Research and development series 41, International centre for aquaculture and aquatic environments, Auburn University, Alabama.
Potts WTW, Foster MA, Rudy PP, Howells GP (1967) Sodium and water balance in the cichlid teleost, Tilapia mossambica. J Exp Biol 47:461–470.
Prajith KK, Madhusoodana KB (2011) Application of biofloc technology (BFT) in the nursery rearing and farming of Giant Freshwater Prawn, Macrobrachium rosenbergii (deMan). Dissertation, Cochin University of Science and Technology.
Prein M (1993) Multivariate analysis of tilapia growth experiments in Israel, Zambia and Peru. In: Prein M, Hulata G, Pauly D (eds) Multivariate methods in aquaculture research: case studies of tilapias in experimental and commercial systems. ICLARM, Manila.
Rafiee G, Saad CR (2005) Nutrient cycle and sludge production during different stages of Red tilapia (Oreochromis sp.) growth in a recirculating aquaculture system. Aquaculture 244:109–118.
Rahman SSA (2010) Effluent water characterization of intensive tilapia culture units and its application in an integrated lettuce aquaponic production facility. Dissertation, Auburn University.
Rakocy JE (1989) Tank culture of tilapia. Southern regional aquaculture centre publication 282.
Stellenbosch University https://scholar.sun.ac.za

51
Rakocy JE, Danaher JJ, Bailey DS, Shultz RC (2008) Development of a biofloc system for the production of tilapia. Aquaculture 277:138–145.
Randall JE (1958) A review of the Labrid fish genus Labroides, with descriptions of two new species and notes on ecology. Pacific Sci 12:327–347.
Randall ZS, Page LM (2014) A New Species of Homalopteroides (Teleostei: Balitoridae) from Sarawak, Malaysian Borneo. Copeia 2014:160–167.
Ray AJ, Dillon KS, Lotz JM (2011) Water quality dynamics and shrimp (Litopenaeus vannamei) production in intensive, mesohaline culture systems with two levels of biofloc management. Aquac Eng 45:127–136.
Ray AJ, Lewis BL, Browdy CL, Leffler JW (2010a) Suspended solids removal to improve shrimp (Litopenaeus vannamei) production and an evaluation of a plant-based feed in minimal-exchange, superintensive culture systems. Aquaculture 299:89–98.
Ray AJ, Seaborn G, Leffler JW, et al. (2010b) Characterization of microbial communities in minimal-exchange, intensive aquaculture systems and the effects of suspended solids management. Aquaculture 310:130–138.
Ray AJ, Shuler AJ, Leffler JW, Browdy CL (2009) Microbial ecology and management of biofloc systems. In: Browdy CL, Jory DE (eds) The Rising Tide, Proceedings of the Special Session on Sustainable Shrimp Farming, World Aquaculture 2009, Veracruz, 25-29 September 2009.
Ray A, Venero J, Browdy C, Leffler J (2010c) Simple settling chambers aid solids management in biofloc system. Global Aquaculture Advocate June/July 2010. pp 28–30.
Richter H, Lückstädt C, Focken UL, Becker K (2000) An improved procedure to assess fish condition on the basis of length-weight relationships. Arch Fish Mar Res 48:226–235.
Roets W, Theron J, Hoffman LC (1999) Changes in some water quality conditions in recycling water using three types of biofiltration systems during the production of the Sharptooth Catfish Clarias gariepinus (Burchell). Water SA 25:239–252.
Russell DJ, Thuesen PA, Thomson FE (2012) A review of the biology, ecology, distribution and control of Mozambique tilapia, Oreochromis mossambicus (Peters 1852)(Pisces: Cichlidae) with particular emphasis on invasive Australian populations. Rev Fish Biol Fish 22:533–554.
Samocha TM, Patnaik S, Speed M, et al. (2007) Use of molasses as carbon source in limited discharge nursery and grow-out systems for Litopenaeus vannamei. Aquac Eng 36:184–191.
Sánchez-Vázquez FJ, Yamamoto T, Akiyama T, et al. (1998) Selection of macronutrients by Goldfish operating self-feeders. Physiol Behav 65:211–218.
Sánchez--Vázquez FJ, Yamamoto T, Akiyama T, et al. (1999) Macronutrient self-selection through demand-feeders in Rainbow Trout. Physiol Behav 66:45–51.
Santacruz-Reyes RA, Chien YH (2012) The potential of Yucca schidigera extract to reduce the ammonia pollution from shrimp farming. Bioresour Technol 113:311–314.
Serfling SA (2006) Microbial flocs: Natural treatment method supports freshwater, marine species in recirculating systems. Global Aquaculture Advocate June 2006. pp 34–36.
Stellenbosch University https://scholar.sun.ac.za

52
Shelton WL (2002) Tilapia culture in the 21st century. In: Guerrero RD III, Guerrero-del Castillo MR (eds) International forum on tilapia farming in the 21st century (Tilapia Forum 2002). Philippines Fisheries Association, Los Baños, 25-27 February 2002.
Shiau SY, Lin SF, Yu SL, et al. (1990) Defatted and full-fat soybean meal as partial replacements for fishmeal in tilapia (Oreochromis niloticus x O. aureus) diets at low protein level. Aquaculture 86:401–407.
Shifrin NS, Chisholm SW (1981) Phytoplankton lipids: interspecific differences and effects of nitrate, silicate and light-dark cycles. J Phycol 17:374–384.
Sing KW, Kamarudin MS, Wilson JJ, Sofian-Azirun M (2014) Evaluation of Blowfly (Chrysomya megacephala) maggot meal as an effective, sustainable replacement for fishmeal in the diet of farmed juvenile Red tilapia (Oreochromis sp.). Pak Vet J 34:288–292.
Singh SK, Muthukumarappan K (2014) Effect of different extrusion processing parameters on physical properties of soy white flakes and high protein distillers dried grains-based extruded aquafeeds. J Food Res 3:107–123.
Skelton P (2001) A complete guide to freshwater fishes of southern Africa. Struik Publishers, Cape Town.
Spataru P, Hepher B, Halevy A (1980) The effect of the method of supplementary feed application on the feeding habits of Carp (Cyprinus carpio L.) with regard to natural food in ponds. Hydrobiologia 72:171–178.
Stadtlander T, Khalil WKB, Levavi-Sivan B, et al. (2011) Effects of saponin fractions from Trigonella foenum-graecum and Balanites aegyptiaca on gene expression of GH, IGF-1 and their respective receptors, growth, nutrient utilization, body composition oxygen consumption and plasma IGF-1 in Nile tilapia (Oreochromis niloticus, L.) In: Liping L, Fitzsimmons K (eds) Better science, better fish, better life. 9th international symposium on tilapia in aquaculture, Shanghai, 22-24 April 2011.
Stern MD, Hoover WH (1979) Methods for determining and factors affecting rumen microbial protein synthesis: a review. J Anim Sci 49:1590–1603.
Stickney R. (2006) Foreword. In: El-Sayed AFM (ed) Tilapia culture, 1st edn. CABI Publishing, Wallingford.
Stone NM, Thomforde HK (2004) Understanding your fish pond water analysis report. University of Arkansas, Pine Bluff.
Suresh AV, Lin CK (1992) Tilapia culture in saline waters: a review. Aquaculture 106:201–226.
Swaminathan MS (2012) Keynote Address: Aquaculture and sustainable nutrition security in a warming planet. In: Subasinghe R, Arthur J, Bartley D, et al. (eds) Farming the Waters for People and Food. FAO/NACA global conference on aquaculture, Phuket, 22-25 September 2010.
Swann L (1997) A fish farmer’s guide to understanding water quality. Aquaculture Extension Fact Sheet AS-503, Lafayette, Indiana.
Tacon AGJ, Hassan MR (2007) Global synthesis of feeds and nutrients for sustainable aquaculture development. In: Hasan MR, Hecht T, De Silva SS, et al. (eds), Study and analysis of feeds and fertilizers for sustainable aquaculture development. FAO fisheries technical paper, Vol. 497. FAO, Rome.
Stellenbosch University https://scholar.sun.ac.za

53
Tacon AGJ, Metian M (2008) Global overview on the use of fish meal and fish oil in industrially compounded aquafeeds: trends and future prospects. Aquaculture 285:146–158.
Tacon AGJ, Metian M, Turchini GM, De Silva SS (2009) Responsible aquaculture and trophic level implications to global fish supply. Rev Fish Sci 18:94–105.
Tal Y, Watts JEM, Schreier SB, et al. (2003) Characterization of the microbial community and nitrogen transformation processes associated with moving bed bioreactors in a closed recirculated mariculture system. Aquaculture 215:187–202.
Tanamati F, Da Silva SCC, Rodriguez MDPR, et al. (2015) GHR and IGF-I gene expression and production characteristics associated with GH gene polymorphism in Nile tilapia. Aquaculture 435:195–199.
Téguia A, Mpoame M, Mba JAO (2002) The production performance of broiler birds as affected by the replacement of fish meal by maggot meal in the starter and finisher diets. Tropicultura 20:187–192.
Timmons MB, Ebeling JM, Wheaton FW, et al. (2002) Recirculating aquaculture systems, 2nd edn. Cayuga Aqua Ventures, Ithaca, New York.
Toguyeni A, Fauconneau B, Boujard T, et al. (1997) Feeding behaviour and food utilisation in tilapia, Oreochromis niloticus: Effect of sex ratio and relationship with the endocrine status. Physiol Behav 62:273–279.
Trewavas E (1983) Tilapiine fishes of the genera Sarotherodon, Oreochromis and Danakilia. British Natural History Museum, London.
Trosvik KA, Webster CD, Thompson KR, et al. (2013) Effects on growth performance and body composition in Nile tilapia, Oreochromis niloticus, fry fed organic diets containing yeast extract and soyabean meal as a total replacement of fish meal without amino acid supplementation. Biol Agric Hortic 29:173–185.
Tseng IT, Chen JC (2004) The immune response of White Shrimp Litopenaeus vannamei and its susceptibility to Vibrio alginolyticus under nitrite stress. Fish Shellfish Immunol 17:325–333.
Valle BCS, Dantas EM, Silva JFX, et al. (2015) Replacement of fishmeal by fish protein hydrolysate and biofloc in the diets of Litopenaeus vannamei postlarvae. Aquac Nutr 21:105–112.
Van Schoor DJ (1966) Studies on the culture and acclimation of tilapia in the Western Cape Province, report no. 7. Department of Nature Conservation, Cape Town.
Vivas M, Rubio VC, Sánchez-Vázquez FJ, et al. (2006) Dietary self-selection in Sharpsnout Seabream (Diplodus puntazzo) fed paired macronutrient feeds and challenged with protein dilution. Aquaculture 251:430–437.
Volpato GL, Luchiari AC, Duarte CRA, et al. (2003) Eye color as an indicator of social rank in the fish Nile tilapia. Brazilian J Med Biol Res 36:1659–1663.
Wang Y, Zhang W, Li W, Xu Z (2006) Acute toxicity of nitrite on tilapia (Oreochromis niloticus) at different external chloride concentrations. Fish Physiol Biochem 32:49–54.
Wangead C, Geater A, Tansakul R (1988) Effects of acid water on survival and growth rate of Nile tilapia (Oreochromis niloticus). In: Pullin RSV, Bhukaswan T, Tonguthai K, Maclean JL (eds) ICLARM, 2nd international symposium on tilapia in aquaculture, Bangkok, 16-20 March 1987.
Stellenbosch University https://scholar.sun.ac.za

54
Watanabe WO, French KE, Ellingson LJ, et al. (1988) Further investigations on the effects of salinity on growth in Florida Red tilapia: evidence for the influence of behavior. In: Pullin RSV, Bhukaswan T, Tonguthai K, Maclean JL (eds) ICLARM, 2nd international symposium on tilapia in aquaculture, Bangkok, 16-20 March 1987.
Whitfield AK, Blaber SJM (1978) Resource segregation among iliophagous fish in Lake St. Lucia, Zululand. Environ Biol Fishes 3:293–296.
Widanarni W, Ekasari J, Maryam S (2012) Evaluation of biofloc technology application on water quality and production performance of Red tilapia Oreochromis sp. cultured at different stocking densities. Hayati J Biosci 19:73–80.
Winemiller KO, Kelso-Winemiller LC (2003) Food habits of tilapiine cichlids of the upper Zambezi river and floodplain during the descending phase of the hydrologic cycle. J Fish Biol 63:120–128.
Wu YV, Rosati R, Sessa DJ, Brown PB (1994) Utilization of protein-rich ethanol co-products from corn in tilapia feed. J Am Oil Chem Soc 71:1041–1043.
Wu YV, Rosati RR, Sessa DJ, Brown PB (1995) Evaluation of corn gluten meal as a protein source in tilapia diets. J Agric Food Chem 43:1585–1588.
Xian JA, Wang AL, Chen XD, et al. (2011) Cytotoxicity of nitrite on haemocytes of the Tiger Shrimp, Penaeus monodon, using flow cytometric analysis. Aquaculture 317:240–244.
Xu WJ, Pan LQ, Zhao DH, Huang J (2012) Preliminary investigation into the contribution of bioflocs on protein nutrition of Litopenaeus vannamei fed with different dietary protein levels in zero-water exchange culture tanks. Aquaculture 350:147–153.
Yamamoto T, Shima T, Furuita H, et al. (2000) Self-selection of diets with different amino acid profiles by Rainbow Trout (Oncorhynchus mykiss). Aquaculture 187:375–386.
Zambrano L, Martínez-Meyer E, Menezes N, Townsend Peterson A (2006) Invasive potential of Common Carp (Cyprinus carpio) and Nile tilapia (Oreochromis niloticus) in American freshwater systems. Can J Fish Aquat Sci 63:1903–1910.
Zhu W, Fu Y, Wang B, et al. (2013) Effects of dietary forage sources on rumen microbial protein synthesis and milk performance in early lactating dairy cows. J Dairy Sci 96:1727–1734.
Stellenbosch University https://scholar.sun.ac.za

55
3 A Growth Comparison Among Three Commercial Tilapia Species in a
Biofloc System
3.1 Abstract
Despite a worldwide boom in tilapia aquaculture, South Africa has failed to follow suit, resulting
in a small, very much undeveloped local industry. Much of the justification for this reality lies on the
inadequacy of the species used and the stringent legislation preventing the use of the Nile tilapia,
Oreochromis niloticus. With momentum gained in recent years, the local industry lobbying for the
legalisation of the O. niloticus has made great progress and its use in certain systems has recently been
facilitated. This study was conducted to compare the growth performance between the indigenous
Mozambique tilapia, Oreochromis mossambicus, another African alternative gaining momentum in
Zambia, the Three Spot tilapia, Oreochromis andersonii, and the globally reputable O. niloticus. The
study was conducted in a biofloc technology (BFT) system, showing great potential as an
environmentally friendly technology. The trial was run for 10 weeks with 60 fish/tank stocked into four
repeats tanks per species. Fish were sampled on six occasions with a regression fitted to the mass
data. Oreochromis niloticus showed a significantly higher growth rate with an average daily gain of
0.693±0.018 g/day and the lowest feed conversion ratio (FCR) of 1.01±0.05, followed by O.
mossambicus with average daily gain of 0.405±0.025 g/day and FCR of 2.24±0.16, and then O.
andersonii with an average daily gain of 0.185±0.025 g/day and an FCR of 2.53±0.28 respectively.
From this study, O. niloticus therefore appears to be the most adequate species for use in BFT systems
in South Africa.
3.2 Introduction
Tilapia is a general name referring to three genera within the Cichlidae family, namely:
Oreochromis, Tilapia and Sarotherodon (Kocher et al. 1998; Canonico et al. 2005). Despite a large
number of tilapia species, it is within the Oreochromis genus where we find the species’ most
extensively used in aquaculture today (El-Sayed 2006; D’Amato et al. 2007).
Global tilapia production has risen to supply 4,823,312 Mt in 2013, with the industry being
valued at 8,248,933,000 USD (FIGIS 2015). In Asia, 75.9 % of the world’s tilapia production takes place,
with China alone making up 34.4 % (FIGIS 2015).
Stellenbosch University https://scholar.sun.ac.za

56
Being a low-valued finfish, low cost production of tilapia dominates, with basic culture methods
being most effective (El-Sayed 2006; Celik 2012; El-Sayed 2013). This offers potential for developing
countries in particular, where it can play a critical role in job creation and food security, boosting the
income of low earning households (Edwards 2000; Musuka and Musonda 2013; Arita and Leung 2014;
Avadí and Fréon 2014; Belton et al. 2014; Dygert et al. 2014; Eltholth et al. 2015).
Within South Africa, marine catch fisheries supply the bulk of the seafood produced, with
aquaculture producing an estimated 6010 Mt in 2013 (FIGIS 2015). Freshwater fishes make up 250 Mt
of this production (FIGIS 2015). Strict and poorly understood environmental regulations, unfavourable
climate, poor strains and sufficient cheap supply by marine catch fisheries have been put forward as
justification for the inability of the local aquaculture sector to advance as it has worldwide (DAFF 2013).
The commercial production of tilapia as a food fish in South Africa has up until recently been
restricted to only indigenous species, predominantly O. mossambicus, with little strain development and
extension support services being implemented. Conversely, work in Zambia involving their indigenous
O. andersonii has been ongoing since the 1980’s (Gopalakrishnan 1988; Kefi et al. 2012; Musuka and
Musonda 2012), with Cayron-Thomas (2007) prospecting it to be the most adequate tilapia species for
use in Zambia. This is however contrary to suggestions by Simataa and Musuka (2013) indicating
poorer compatibility of O. andersonii to culture systems when compared to O. niloticus, with particular
reference to the superior ability of O. niloticus to utilise plankton as a food source and therefore incur
lower feeding costs than O. andersonii. The culture of O. niloticus is widely practised and well
established worldwide (El-Sayed 2006), with recent changes in its categorization in South African
legislation permitting its use in certain aquaculture systems under regulation (DEA 2014).
Biofloc technology (BFT) has emerged as an innovative technique to increase the efficiency,
lower the water usage, recycle nutrients, and lower the running costs of aquaculture systems, while
reducing the adverse effects inflicted on the environment (Azim and Little 2008; Avnimelech 2012;
Hargreaves 2013; Luo et al. 2014). Through utilising a microbial community, dominated by heterotrophic
bacteria, BFT systems act as an in situ biofilter removing dangerous nitrogen compounds from the water
(Avnimelech 1999; Crab et al. 2012). By raising the carbon to nitrogen ratio (C:N) through the addition
of a carbohydrate source, nitrogen is then incorporated into microbial protein in the form of bioflocs, a
Stellenbosch University https://scholar.sun.ac.za

57
coagulation of micro-organisms, which are harvested by the filter feeding cultured species such as
tilapia (Avnimelech 2012; Widanarni et al. 2012).
With insufficient information available on growth performance comparisons between these
three tilapia species, and given the current controversy and species dilemma facing South Africa, the
current study aims to provide information around the issue, and aid decision makers with scientific
backing to validate decisions on which tilapia species to endorse. It also aims to explore the field of BFT
in South Africa, opening up doors for future research in this alternative approach, which may hold great
potential and assist in the development of the tilapia industry both locally and worldwide.
3.3 Material and Methods
Experimental system
The experiment was conducted on the Welgevallen experimental farm near Stellenbosch,
South Africa. A single greenhouse was used to house the experiment, and fitted with removable sides
in order to aid in temperature regulation and mimic commercial BFT systems in more temperate
environments. Twelve cylindrical tanks with a diameter of 620 mm, each with a volume of 250 L as used
by Azim and Little (2008), were fitted with a central 40 mm drain at the bottom in order to effectively
drain the sludge when necessary. Tanks were elevated on building blocks and placed in a 6x2 formation
(Figure 3.1).
Figure 3.1. The experimental setup displaying the 250 L tanks used as well as the main 40 mm aeration ring.
Stellenbosch University https://scholar.sun.ac.za

58
Aeration and circulation
A 1.1 kw side channel blower (FPZ, Concorezzo, Italy) was used, and ran continuously
throughout the duration of the experiment. It fed into a ring of 40 mm black irrigation piping, which aided
to even the pressure and ensure that each individual tank received even aeration and mixing. From the
40 mm ring, a 15 mm black irrigation pipe was run into the bottom of each tank, and attached to the
aeration ring. This aeration ring consisted of a 1940 mm long piece of 15 mm irrigation pipe bent into a
ring, with individual holes made with a pin every 25 mm along the length of the pipe. This ring fitted
snugly around the inner perimeter of the tank, producing a ring of bubbles additionally aiding in mixing,
and was anchored in place with two stones.
To ensure that the water quality was uniform and homogenised throughout the tanks, 12 airlift
pumps were constructed using 15 mm polyvinyl chloride (PVC) pipes, with air fed from the 40 mm air
ring using micro tubing commonly used in drip irrigation systems. These air lift pumps were inter-leading
from one tank to the next, and had an output of six litres per minute each. In anticipation for the case of
a blockage of an airlift pump, a connection between adjacent tanks was made using 32 mm flexible
pipe, just above the 250 L water level of the tanks, in order to even out the water and prevent tanks
from overflowing.
Fish Stocking
All procedures throughout the trial were in line with the ethical protocol (SU-ACUD15-00005)
approved by the research ethics committee for animal care and use at Stellenbosch University. Fish
were housed in a recirculating aquaculture system (RAS) on the Welgevallen premises, and fed the
pelleted feed used in the experiment for two weeks prior to the commencement of the trial, in order to
accustom them to the feed. The three fish species were stocked at a rate of 60 mixed sex fish/tank, into
an already established BFT system on 6 October 2014, once temperatures had risen sufficiently after
the winter, and removed 10 weeks later on 15 December 2014. The 12 tanks allowed for four repeat
tanks per species as done by Azim and Little (2008), with completely random allocation. Oreochromis
andersonii of average mass 19.30±0.41 g were stocked into tanks one, two, seven and 10. Oreochromis
niloticus of average mass 36.82±0.59 g, similar to that used by Hooley (2012), were stocked into tanks
3,4,8 and 12, with O. mossambicus of average mass 36.53±0.45 g being stocked in tanks 5,6,9 and 11
respectively. Differences in starting mass were as a result of the limited availability of all species of
Stellenbosch University https://scholar.sun.ac.za

59
similar size at the time when the experiment commenced. Oreochromis andersonii used were the
offspring of wild caught fish from the Kaprivi region in Namibia. Oreochromis niloticus were of the GIFT
strain, and imported as fry from Thailand, being grown to the size at which they were stocked into the
system. The red strain of O. mossambicus used in the trial came from stock at Stellenbosch University
which has been the result of selective breeding strategies at this respective institution.
Tank Management
The system was checked at least four times a day, with feeding taking place twice a day, at
08h00 and at 16h00. Special effort was made to individually observe each tank, and check for signs of
unconventional behaviour indicating distress, in order to ensure the well-being of the fish and pick up
any problems. The afternoon feeding did take place slightly later at 17:00 in the beginning of the
experiment, but a high biological oxygen demand (BOD) in the water under low light conditions resulted
in dissolved oxygen (DO) levels falling into the evening. It was therefore brought forward in order to
allow the autotrophs within the microbial community to still utilise sunlight and aid in replenishing DO
levels. As is conventionally done, temperature, DO, pH, floc volume (FV), salinity, total dissolved solids
(TDS) and electro-conductivity (EC) were monitored twice daily, with total ammonia nitrogen (TAN),
nitrite (NO2), nitrate (NO3), un-ionized ammonia nitrogen (UIA-N), orthophosphate (PO4), total
suspended solids (TSS) and turbidity being monitored weekly. All parameters were kept within desirable
levels for the greater part of the experiment. Sludge was drained weekly, and replaced with fresh water
from a seperate backup biofloc tank containing no fish. Each day at the evening feeding event, a Secchi
disk was used to record the visibility in each tank, and give an idea of how homogenized the water was.
An alarm system was installed on day nine of the trial following water loss, in order to trigger when such
an event was taking place.
Mortalities
Mortalities were removed from the respective tanks, without being replaced. Measurements of the
mortalities were taken as was done with the sampling of the fish, along with the date and tank of origin
being recorded.
Feeding
Fish were fed a three millimetre pelleted feed which is commercially available (AVI feeds, tilapia
grower, protein: 35% lipid: 5%) (Table 3.1). Feeding rates were in line with the amount fed by Azim and
Stellenbosch University https://scholar.sun.ac.za

60
Little (2008) with 1.5 % of body mass fed daily and being split evenly between the two feeding events
with some adjustments down to 1.0 %, 0.5 % or no feed when required to improve water quality. A
carbohydrate source in the form of maize meal (Table 3.1), was added to the water directly after each
feeding at a rate of 80 % of the mass of the feed given, in accordance with the suggestion by Hargreaves
(2013) and calculation using the following equation developed by Avnimelech (2012):
∆𝐶𝐻 = ∆𝐹𝑒𝑒𝑑 × %𝑁 𝑖𝑛 𝑓𝑒𝑒𝑑 × %𝑁 𝑒𝑥𝑐𝑟𝑒𝑡𝑖𝑜𝑛 ÷ 0.05
This was increased when required to improve water quality with feeding and carbohydrate
addition being adjusted fortnightly after sampling of the fish took place.
Table 3.1. The nutrient composition of the three millimetre pelleted feed and the carbohydrate added.
Nutrient % composition in: Feed Maize Meal
protein 35 6,6
lysine 2 -
fat 5 1,2
fibre 5 3,7
Ca 3 -
P 0,7 -
moisture 10 -
sodium - 0,018
Glycaemic carbohydrate - 74
Feed Conversion Ratio
Cumulative FCR’s were calculated for each tank over the period of the trial. This was done using the
recorded amount of feed given to each tank daily, along with the mass increase per tank which was
extrapolated from the sampled fish at each sampling event. This was done using the following formula:
𝐹𝐶𝑅 = 𝑎𝑚𝑜𝑢𝑛𝑡 𝑜𝑓 𝑓𝑒𝑒𝑑 𝑓𝑒𝑑 (𝑔) ÷ 𝑡𝑜𝑡𝑎𝑙 𝑚𝑎𝑠𝑠 𝑖𝑛𝑐𝑟𝑒𝑎𝑠𝑒 𝑜𝑓 𝑓𝑖𝑠ℎ 𝑓𝑟𝑜𝑚 𝑡𝑎𝑛𝑘 (𝑔)
The maize meal used to stimulate the biofloc was not included as feed, as it was not directly consumed
by the fish. In tanks where mortalities occurred, a commercial standpoint was taken and it was viewed
to decrease the total mass from each tank, and they were therefore not excluded from the calculation.
Sampling
Fish were sampled from each tank on six occasions throughout the experiment, at the start of
the trial and fortnightly thereafter until the end of the trial. Every two weeks, all the fish in each tank
were netted using a specially constructed circular net. Twenty fish/tank were randomly selected and
Stellenbosch University https://scholar.sun.ac.za

61
placed in a mild solution of clove oil (0.1 mL/10 L water) for a period of 30 seconds in order to sedate
them. Mass, total length (TL) and standard length (SL) measurements were taken, after which the fish
were placed into a well-aerated recovery bucket with clean water, and then returned to the tank once
fully recovered. Special care was taken to ensure that the sampling process was fast and efficient, and
would impose the least possible stress on the fish. Furthermore, feeding did not take place on sampling
days in order to reduce the stress.
Statistical Analysis
Data were analysed using SAS for windows version 9.3. Average daily weight gain was
calculated by means of fitting a simple linear regression for each species, then comparing the species
using PROC GLM. Due to the larger difference in starting mass of the O. andersonii, the intercept was
included as a covariate and the Bonferroni least squares means were calculated for all variables. For
the FCR’s calculated, one way analysis of variance (ANOVA) was used to analyse the data as well as
Bonferroni multiple comparison tests, where P < 0.05 was considered significant. The assumptions of
normality and homogeneity for the analyses were tested using the Shapiro-Wilk and Levene’s test
respectively.
3.4 Results
Daily Water Quality
Throughout the trial, the mean water temperature recorded in the morning was 22.5±0.2ºC with
the afternoon reading being 27.5±0.2ºC (Table 3.2). On the two occasions early on in the trial where
the water temperature dropped below 20ºC in the morning, feeding was postponed until after the
temperature had risen above 20ºC in accordance with normal growth recommendations by El-Sayed
(2006). DO levels had a mean of 6.5±0.1 mg O2/L throughout the trial with pH averaging 6.28±0.04
(Table 3.2). Total dissolved solids (TDS) levels averaged 1.493±0.063 g/L with floc volume (FV) having
a mean of 48±4 mL/L (Table 3.2). Secchi disk readings were the same throughout each tank on each
day, indicating that the water was well homogenized.
Stellenbosch University https://scholar.sun.ac.za

62
Table 3.2. The mean values for the respective water quality parameters measured throughout the trial.
Weekly Water Quality
Mean values for the parameters measured weekly were calculated (Table 3.2). High levels of
NO2 were recorded from day 13 to day 18 of the experiment, following an unplanned water loss event
due to system failure, which took place on day nine and a cold spell on days 12 and 13. This resulted
in the mortality of 32 O. andersonii, and 39 O. mossambicus with none for O. niloticus. Un-ionised
ammonia nitrogen (UIA-N) was calculated as described by El-Shafai et al. (2004) (Table 3.2), with the
value never exceeding 0.042 mg/L throughout the course of the trial.
Fish Mortality
Between days 13 and 18, a total of 32 O. andersonii, and 39 O. mossambicus mortalities were observed,
with none being observed for O. niloticus.
Feeding
The different parameters related to feeding are displayed as an average per tank of 60 fish for
each species (Table 3.3). In tanks where the fish grew faster and therefore had a higher body mass
used to adjust feeding rates, total feeding was intuitively higher. The end stocking density was highest
in the O. niloticus tanks, having increased by 123 % over the course of the trial as opposed to the 39 %
increase for both the O. mossambicus and the O. andersonii respectively. These values also
Frequency Parameter Unit Mean Value
Daily Temperature am ºC 22,5±0.2
Temperature pm ºC 27,5±0.2
DO mg/L 6,5±0.1
pH - 6,28±0.04
EC mS/cm 2.309±0.099
salinity ppt 1,2±0.1
TDS mg/L 1,493±0.063
FV mlL/L 48±4
Weekly TAN mg/L 3,8±0.4
NO2 mg/L 3,510±0.799
NO3 mg/L 5,6±0.9
UIA-N mg/L 0,008±0.002
PO4 mg/L 6,4±1.6
Turbidity FAU 458±51
TSS mg/L 520±55
Stellenbosch University https://scholar.sun.ac.za
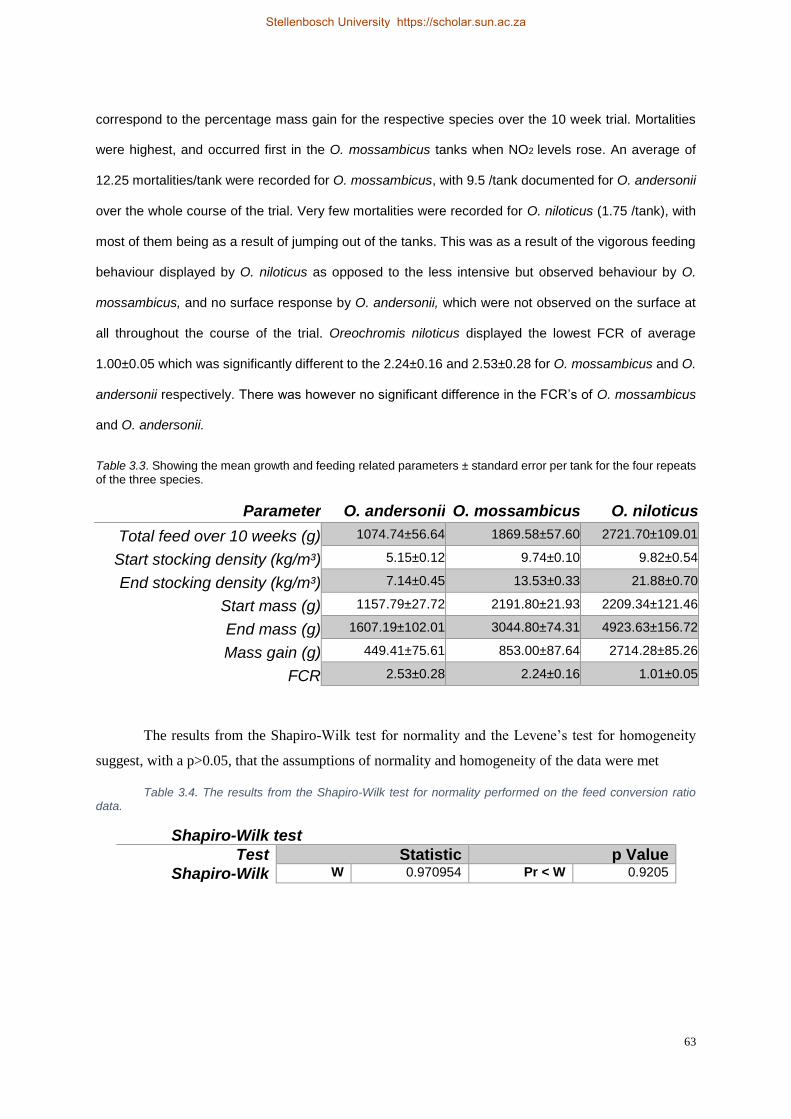
63
correspond to the percentage mass gain for the respective species over the 10 week trial. Mortalities
were highest, and occurred first in the O. mossambicus tanks when NO2 levels rose. An average of
12.25 mortalities/tank were recorded for O. mossambicus, with 9.5 /tank documented for O. andersonii
over the whole course of the trial. Very few mortalities were recorded for O. niloticus (1.75 /tank), with
most of them being as a result of jumping out of the tanks. This was as a result of the vigorous feeding
behaviour displayed by O. niloticus as opposed to the less intensive but observed behaviour by O.
mossambicus, and no surface response by O. andersonii, which were not observed on the surface at
all throughout the course of the trial. Oreochromis niloticus displayed the lowest FCR of average
1.00±0.05 which was significantly different to the 2.24±0.16 and 2.53±0.28 for O. mossambicus and O.
andersonii respectively. There was however no significant difference in the FCR’s of O. mossambicus
and O. andersonii.
Table 3.3. Showing the mean growth and feeding related parameters ± standard error per tank for the four repeats of the three species.
Parameter O. andersonii O. mossambicus O. niloticus
Total feed over 10 weeks (g) 1074.74±56.64 1869.58±57.60 2721.70±109.01
Start stocking density (kg/m³) 5.15±0.12 9.74±0.10 9.82±0.54
End stocking density (kg/m³) 7.14±0.45 13.53±0.33 21.88±0.70
Start mass (g) 1157.79±27.72 2191.80±21.93 2209.34±121.46
End mass (g) 1607.19±102.01 3044.80±74.31 4923.63±156.72
Mass gain (g) 449.41±75.61 853.00±87.64 2714.28±85.26
FCR 2.53±0.28 2.24±0.16 1.01±0.05
The results from the Shapiro-Wilk test for normality and the Levene’s test for homogeneity
suggest, with a p>0.05, that the assumptions of normality and homogeneity of the data were met
Table 3.4. The results from the Shapiro-Wilk test for normality performed on the feed conversion ratio data.
Shapiro-Wilk test
Test Statistic p Value
Shapiro-Wilk W 0.970954 Pr < W 0.9205
Stellenbosch University https://scholar.sun.ac.za
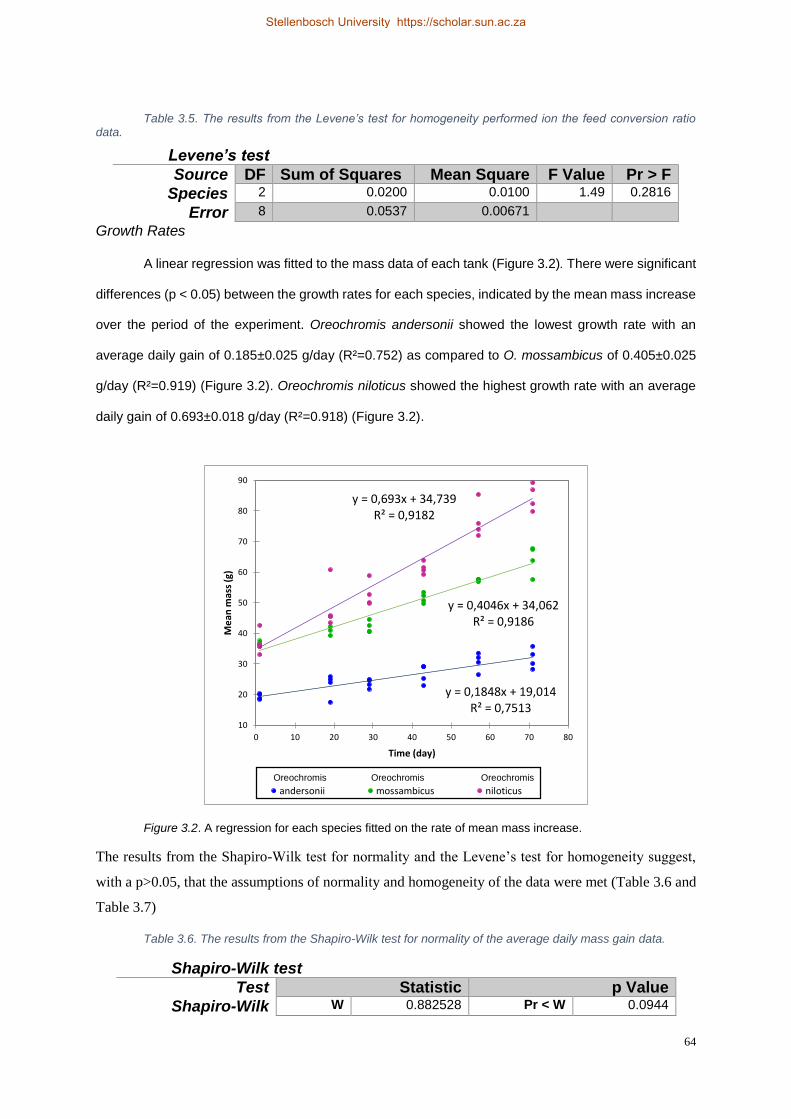
64
Table 3.5. The results from the Levene’s test for homogeneity performed ion the feed conversion ratio data.
Growth Rates
A linear regression was fitted to the mass data of each tank (Figure 3.2). There were significant
differences (p < 0.05) between the growth rates for each species, indicated by the mean mass increase
over the period of the experiment. Oreochromis andersonii showed the lowest growth rate with an
average daily gain of 0.185±0.025 g/day (R²=0.752) as compared to O. mossambicus of 0.405±0.025
g/day (R²=0.919) (Figure 3.2). Oreochromis niloticus showed the highest growth rate with an average
daily gain of 0.693±0.018 g/day (R²=0.918) (Figure 3.2).
Figure 3.2. A regression for each species fitted on the rate of mean mass increase.
The results from the Shapiro-Wilk test for normality and the Levene’s test for homogeneity suggest,
with a p>0.05, that the assumptions of normality and homogeneity of the data were met (Table 3.6 and
Table 3.7)
Table 3.6. The results from the Shapiro-Wilk test for normality of the average daily mass gain data.
Shapiro-Wilk test
Test Statistic p Value
Shapiro-Wilk W 0.882528 Pr < W 0.0944
Levene’s test
Source DF Sum of Squares Mean Square F Value Pr > F
Species 2 0.0200 0.0100 1.49 0.2816
Error 8 0.0537 0.00671
y = 0,1848x + 19,014R² = 0,7513
y = 0,4046x + 34,062R² = 0,9186
y = 0,693x + 34,739R² = 0,9182
10
20
30
40
50
60
70
80
90
0 10 20 30 40 50 60 70 80
Me
an m
ass
(g)
Time (day)
andersonii mossambicus niloticus
Oreochromis Oreochromis Oreochromis
Stellenbosch University https://scholar.sun.ac.za

65
Table 3.7. The results from the Levene’s test for homogeneity of the average daily mass gain data.
Levene's Test
Source DF Sum of Squares Mean Square F Value Pr > F
Species 2 2.149x10⁻⁶ 1.074x10⁻⁶ 0.26 0.7773
3.5 Discussion
Water Temperature
The mean morning (22.5±0.2 ºC) and afternoon (27.5±0.2 ºC) water temperature readings were
both within the range of 20-35 ºC given by El-Sayed (2006) for the normal growth of tilapia.
Temperatures in the morning were however outside the general consensus of an optimal range, where
estimations are within the 25-30 ºC bracket (El-Sayed 2006; Crab et al. 2009). This optimal temperature
range for the fish is however higher than the range of 20-25 ºC put forward by De Schryver et al. (2008)
as the ideal temperature for a stable BFT system. It is therefore difficult to optimize both simultaneously,
and with the daily temperature changes expected in commercial scale BFT systems, it is likely for
temperatures to vary between both brackets at different times of the day.
Water Loss
Water loss was recorded on day nine after an airlift pump became blocked. As the system was
filled up with clean water following this event, and the occurrence of a cold spell on days 12 and 13, it
resulted in a considerable decrease in the concentration of biofloc in the system. This reduced level of
biofloc was therefore not capable of controlling the high nitrogen input by feeding, and lethal
concentrations of NO2 and TAN levels were measured, resulting in mortalities. These spikes are similar
to those reported by Avnimelech (2012) in the establishment of new BFT systems. This event
highlighted the fine balance of the system and the importance of an adequate level of biofloc required
in order to control the level of dangerous nitrogenous compounds. It also emphasized the importance
of having backup water with biofloc established for research systems, and the significance of an alarm
system to notify the relevant personnel when water is being lost in such systems. To help prevent the
high levels of toxic nitrogen compounds in such an event, feeding should also be cut with an increase
in the level of the carbohydrate source added to the water in order to allow the effective recovery and
Stellenbosch University https://scholar.sun.ac.za

66
re-establishment of the biofloc. Feeding should then be slowly increased to the required level as the
level of biofloc increases accordingly.
As a result of this event, corrective measures implemented, and mortalities, growth rates were
significantly reduced between the sampling events on days 19 and 29. Oreochromis andersonii showed
an average increase in mass per fish from 23.00±1.14 g to 23.57±0.97 g, with O. mossambicus
increasing from 41.96±1.14 g to 42.01±0.97 g respectively. Oreochromis niloticus however, showed a
higher growth rate with the average mass per fish increasing from 48.78±1.14 g to 52.79±0.97 g. This,
coupled with no mortalities induced by poor water quality, and a constant response to feeding when the
other species did not feed, advocates the superior resilience of O. niloticus in poor water quality
conditions. It is resilience such as this which is sought after when selecting a species for use in
aquaculture (Boyd 2004; Jamandre et al. 2011). Due to the control mechanism used for dangerous
nitrogen compounds in BFT, and its dynamic nature, a hardy species which can handle these levels if
needed will be an advantage.
Feed Conversion Ratio
During the period from day 19 to 29, and being substantially influenced by the number of
mortalities, the overall mass in seven tanks (three O. mossambicus, three O. andersonii and one O.
niloticus) decreased and therefore rendered negative FCR values for this period. Negative FCR have
been documented in studies by Cotton et al. (2003) as well as Jalali et al. (2013) and are often linked
to mortalities where although the individual fish mass may not decrease, the total mass per tank
decreases.
Over the 10 week period of the trial, O. niloticus showed a superior FCR of 1.01±0.05 as
opposed to the 2.24±0.16 for O. mossambicus and the 2.53±0.28 for O. andersonii. This is similar to
findings by Gopalakrishnan (1988) and Siddiqui and Al-Harbi (1995) on the better efficiency
performance of O. niloticus when compared to the other concerned species in earthen ponds and RAS
respectively. Although the number of mortalities recorded for O. mossambicus and O. andersonii did
effect this FCR, these finding suggests that the superior hardiness and efficiency of O. niloticus is
consistent in BFT systems as well. As mortalities are considered a negative factor from a commercial
standpoint, a decrease in fish biomass due to mortality is decreasing the total mass potentially
harvested from each tank. To keep FCR linked to this application, and credit species showing the
Stellenbosch University https://scholar.sun.ac.za

67
desirable hardiness, tanks with fewer mortalities would have a better chance of reflecting this in their
FCR data as the total mass from each tank would decrease less due to mortality. Even though this
approach was used, the FCR’s obtained may partially relate to the suggestion by Popma and Lovshin
(1996) that the shortened intestine as recorded for O. mossambicus, may inhibit its ability to utilize
planktonic algae, and thus better use of this food source is observed for O. niloticus.
Growth
The growth rate of O. niloticus was significantly higher (p < 0.0001) than that of O. mossambicus
which was significantly higher (p = 0.0106) than that of O. andersonii over the entire period of the trial.
This ranking was also in sequence with the amount of selective breeding and strain development
attributed to the three species investigated, and highlights the importance of such strategies in raising
the performance of cultured organisms. Even though the stocking density in kg/m³ was significantly
lower in the O. andersonii tanks due to the smaller starting size, this did not appear to be a limiting
factor for the O. niloticus or O. mossambicus tanks, which still showed superior growth when compared
to the O. andersonii.
As these species occupy slightly different niches and feed at different trophic levels in their
segregated natural habitats (Skelton 2001), it was speculate that one species may be able to better
utilise biofloc and therefore grow better in a BFT system. The FCR and growth results suggest that this
is not the case for O. mossambicus and O. andersonii respectively, as they cannot derive significantly
higher benefit from the consumption of biofloc in order to compete with the low FCR and high growth
rate of O. niloticus.
3.6 Conclusion
BFT systems can operate successfully in local South African conditions. The study could serve
to give interested parties an idea on tilapia growth rate when utilizing BFT systems in South Africa.
Oreochromis niloticus showed superior growth rates and FCR to O. mossambicus which was superior
to O. andersonii. With this documented in a BFT system under South African conditions, O. niloticus
was the most compatible candidate of the three species investigated to proceed with in such systems
in South Africa. The industry should therefore advise farmers on the benefits of using this species in
BFT systems instead of the other tilapia species investigated, and pave the way by providing farmers
with adequate accessibility to O. niloticus fingerlings. There is much scope for further research in more
Stellenbosch University https://scholar.sun.ac.za

68
extensive periods of the life cycle, as well as the seasonal viability of BFT, given our local climate.
Studies into different mechanisms of customizing BFT to local South African conditions would be of
value as well as looking at the correlation between intestinal length, and the efficiency to utilize biofloc
between species. Economic viability comparisons between BFT and other aquaculture systems used
for the cultivation of tilapia would also be beneficial to the growing industry in South Africa and
worldwide.
3.7 References
Arita S, Leung P (2014) A technical efficiency analysis of Hawaii’s aquaculture industry. J World Aquac Soc 45:312–321.
Avadí A, Fréon P (2014) A set of sustainability performance indicators for seafood: direct human consumption products from Peruvian anchoveta fisheries and freshwater aquaculture. Ecol Indic 48:518–532.
Avnimelech Y (2012) Biofloc technology - a practical guide book, 2nd edn. World Aquaculture Society, Baton Rouge.
Avnimelech Y (1999) Carbon/nitrogen ratio as a control element in aquaculture systems. Aquaculture 176:227–235.
Azim ME, Little DC (2008) The biofloc technology (BFT) in indoor tanks: water quality, biofloc composition, and growth and welfare of Nile tilapia (Oreochromis niloticus). Aquaculture 283:29–35.
Belton B, van Asseldonk IJM, Thilsted SH (2014) Faltering fisheries and ascendant aquaculture: implications for food and nutrition security in Bangladesh. Food Policy 44:77–87.
Boyd C (2004) Farm-level issues in aquaculture certification : Tilapia. Auburn, Alabama.
Canonico GC, Arthington A, Mccrary JK, Thieme ML (2005) The effects of introduced tilapias on native biodiversity. Aquat Conserv Mar Freshw Ecosyst 15:463–483.
Cayron-Thomas E (2007) Using Oreochromis andersonii (Kafue bream) in Zambia. In: Feature Articles, The Fish Site. http://www.thefishsite.com/articles/1105/using-emoreochromis-andersonii-em-kafue-bream-in-zambia/. Cited 9 Apr 2015.
Celik E (2012) Tilapia culture review. Dissertation, Norwegian University of Life Sciences.
Cotton CF, Walker RL, Recicar TC (2003) Effects of temperature and salinity on growth of juvenile Black Sea Bass, with implications for aquaculture. N Am J Aquac 65:330–338.
Crab R, Defoirdt T, Bossier P, Verstraete W (2012) Biofloc technology in aquaculture: beneficial effects and future challenges. Aquaculture 356-357:351–356.
Crab R, Kochva M, Verstraete W, Avnimelech Y (2009) Bio-flocs technology application in over-wintering of tilapia. Aquac Eng 40:105–112.
Stellenbosch University https://scholar.sun.ac.za

69
D’Amato ME, Esterhuyse MM, Van Der Waal BCW, et al. (2007) Hybridization and phylogeography of the Mozambique tilapia Oreochromis mossambicus in southern Africa evidenced by mitochondrial and microsatellite DNA genotyping. Conserv Genet 8:475–488.
DAFF (2013) National aquaculture policy framework for South Africa. Gov Gaz 763:1-33.
De Schryver P, Crab R, Defoirdt T, et al. (2008) The basics of bio-flocs technology: the added value for aquaculture. Aquaculture 277:125–137.
DEA (2014) Alien and invasive species list. Gov Gaz 590:1–80.
Dygert JP, Morris ML, Messick EM, Browning PH (2014) Feasibility of an energy efficient large-scale aquaponic food production and distribution facility. In: ASME 2014. 8th international conference on energy sustainability, Boston, Massachusetts, 30 June-2July 2014.
Edwards P (2000) Aquaculture, poverty impacts and livelihoods. Natural Resource Perspectives ODI, London.
El-Sayed AFM (2006) Tilapia culture, 1st edn. CABI Publishing, Wallingford.
El-Sayed AFM (2013) An overview of aquaculture in Egypt with focus on tilapia culture. Presented at the 11th conference of the aquaculture association of southern Africa, Stellenbosch University, Stellenbosch, 9-13 September 2013.
El-Shafai SA, El-Gohary FA, Nasr FA, et al. (2004) Chronic ammonia toxicity to duckweed-fed tilapia (Oreochromis niloticus). Aquaculture 232:117–127.
Eltholth M, Fornace K, Grace D, et al. (2015) Characterisation of production, marketing and consumption patterns of farmed tilapia in the Nile Delta of Egypt. Food Policy 51:131–143.
FIGIS (2015) FAO, Rome. http://www.fao.org/fishery/figis/en. Cited 1 Apr 2015.
Gopalakrishnan V (1988) Role of tilapia (Oreochromis andersonii) in integrated farming systems in Zambia. In: Pullin RSV, Bhukaswan T, Tonguthai K, Maclean JL (eds) Paper presented at ICLARM, 2nd international symposium on tilapia in aquaculture, Bangkok, 16-20 March 1987.
Hargreaves JA (2013) Biofloc production systems for aquaculture. Southern regional aquaculture centre publication 4503.
Hooley CG (2012) Examination of the effects of dietary protein and lipid on growth and stress response of Nile tilapia cultured in high intensity systems. Dissertation, Montana State University.
Jalali M, Davoodi R, Ali A, et al. (2013) Effect of salinity on survival and growth parameters of Shyrbot (Barbus grypus) fingerlings. World J Fish Mar Sci 5:549–552.
Jamandre WE, Hatch U, Bolivar RB, Borski R (2011) Improving the supply chain of tilapia industry in the Philippines. In: Liping L, Fitzsimmons K (eds) Better science, better fish, better life. 9th international symposium on tilapia in aquaculture, Shanghai, 22-24 April 2011.
Kefi AS, Kang’ombe J, Kassam D, Katongko C (2012) Growth, reproduction and sex ratios in Oreochromis andersonii (Castelnau, 1861) fed with varying Levels of 17α-methyl testosterone. J Aquac Res Dev 3:130–137.
Stellenbosch University https://scholar.sun.ac.za

70
Kocher TD, Lee WJ, et al. (1998) A genetic linkage map of a cichlid fish, the tilapia (Oreochromis niloticus). Genetics 148:1225–1232.
Luo G, Gao Q, Wang C, et al. (2014) Growth, digestive activity, welfare, and partial cost-effectiveness of genetically improved farmed tilapia (Oreochromis niloticus) cultured in a recirculating aquaculture system and an indoor biofloc system. Aquaculture 422:1–7.
Musuka CG, Musonda FF (2013) Contribution of small water bodies and small-holder aquaculture towards poverty alleviation and enhancing household food security in Zambia. Int J Fish Aquac 5:295–302.
Musuka CG, Musonda FF (2012) Current and future prospects of commercial fish farming in Zambia. Int J Bioflux Soc 5:79–87.
Popma TJ, Lovshin LL (1996) Worldwide prospects for commercial production of tilapia. In: Research and development series 41, International centre for aquaculture and aquatic environments, Auburn University, Alabama.
Siddiqui AQ, Al-Harbi AH (1995) Evaluation of three species of tilapia, Red tilapia and a hybrid tilapia as culture species in Saudi Arabia. Aquaculture 138:145–157.
Simataa S, Musuka CG (2013) Impact of withdrawing Oreochromis niloticus (Nile tilapia) from aquaculture production in Zambia: a case study of Solwezi district. Int J Aquac 3:158–164.
Skelton P (2001) A complete guide to freshwater fishes of southern Africa. Struik Publishers, Cape Town.
Widanarni W, Ekasari J, Maryam S (2012) Evaluation of biofloc technology application on water quality and production performance of Red tilapia Oreochromis sp. cultured at different stocking densities. Hayati J Biosci 19:73–80.
Stellenbosch University https://scholar.sun.ac.za

71
4 A Description of Key Water Quality Parameters in a Tilapia Biofloc
System
4.1 Abstract
Biofloc technology (BFT) is envisaged to play an increasing role in fish production, with
research into the mechanisms and dynamics being of paramount importance. Water quality plays a key
role in the performance of the cultured species, therefore it is intuitive to document this facet over time
in a BFT system. This study was aimed at building a profile of key water quality parameters during the
initial 15 day start-up phase, and once tilapia (Oreochromis spp) were introduced to a BFT system.
Furthermore it looked at the effects of the addition of salt (NaCl) on a variety of water quality parameters.
The trial was initiated in September 2014 at the start of the summer growing season for tilapia in South
Africa. Temperature, dissolved oxygen (DO), pH, floc volume (FV), salinity, total dissolved solids (TDS)
and electro-conductivity (EC) were measured twice daily, with total ammonia nitrogen (TAN), nitrite
(NO2), nitrate (NO3), un-ionized ammonia nitrogen (UIA-N), orthophosphate (PO4), total suspended
solids (TSS) and turbidity being measured weekly over the 87 day trial. Salt was added to the system
31 days into the trial. Nitrogenous compounds reached critical levels on two occasions, once during
start-up and the other with fish present, following a water loss event. TAN, TSS and turbidity showed a
steady increase as the trial progressed. It was found to be difficult to maintain all parameters within
optimal levels for tilapia for the entire duration of the trial in the small research system used. Salt had
an effect on increasing EC and TDS while decreasing NO2 levels, and may have had an indirect effect
on decreasing DO levels. It was apparent that salt was a minor contributing factor to these changes
with other primary contributing factors playing a larger role. This trial will prove valuable in what water
quality changes to expect during start-up and following a water loss event in a BFT system.
4.2 Introduction
Water quality is widely accepted to be of importance to aquaculture, with extensive work being
done to develop a better understanding of this eminent aspect (Boyd and Tucker 1992; El-Sayed 2006;
Cole et al. 2009; Auffret et al. 2013; Amal et al. 2015). Although a number of parameters can influence
water quality, the measurement of a few key parameters is practical and common practise in
commercial systems to maintain good water quality (Boyd and Pillai 1985; El-Sayed 2006).
Stellenbosch University https://scholar.sun.ac.za

72
Biofloc Technology
Biofloc technology (BFT) employs an alternative approach to maintaining good water quality
through the in situ action of micro-organisms within the water, predominantly heterotrophic bacteria
(Avnimelech 1999; Avnimelech 2012; Hargreaves 2013). The concept of BFT requires the manipulation
of the C:N ratio of inputs through the addition of a carbohydrate source, as well as sufficient mixing and
aeration in order to keep the biofloc (aggregation of micro-organisms and organic matter) in suspension
and active (Avnimelech 1999; Crab et al. 2012). Heterotrophic bacteria operate at up to a factor 10
higher growth rate than nitrifying bacteria, and therefore rapidly remove TAN from the water and
incorporate it into microbial protein (Hargreaves 2006; Avnimelech 2012; Crab et al. 2012). This
microbial protein housed in the suspended biofloc, is then available to be harvested by cultured species
which are capable of filter feeding (Hargreaves 2013).
Originating from studies on water conservation, land costs and environmental concerns, BFT
was developed to make more efficient use of the inputs available (Emerenciano et al. 2013). The
recycling of nutrients within a BFT system allows feeding with pelleted feed to be significantly reduced,
as feeding efficiency is enhanced (Avnimelech 2007; Widanarni et al. 2012; Hargreaves 2013; Luo et
al. 2014). With water being constantly ridded of nitrogen compounds, and low to zero water exchange
in BFT systems, the costs associated with purchasing and running external filters are eliminated, with
the environmental cost of high water usage and effluent release being minimised (Avnimelech 2007;
Avnimelech 2012; Emerenciano et al. 2012; Hargreaves 2013). Furthermore, the low water usage in
BFT systems means that there is no need to be constantly pumping water into the pond or through a
filtration system, and therefore the high costs associated with pumping are reduced. With sustainability
and efficiency at its core, BFT has been labelled as an environmentally friendly aquaculture technique,
and therefore shows potential for future application (Emerenciano et al. 2011; Widanarni et al. 2012;
Emerenciano et al. 2013).
Tilapia
With tilapia being identified as the fish of the 21st century (Fitzsimmons 2000; Ridha 2006; El-
Sayed 2013), capable of filter feeding and withstanding a high total suspended solids (TSS) level (El-
Sayed 2006; Avnimelech 2012), its increased use in BFT shows positive potential. The stocking density
of tilapia in BFT systems can also be far greater than that of shrimp, reaching up to 50 kg/mᵌ or 500
Stellenbosch University https://scholar.sun.ac.za

73
tons/ha (Avnimelech 2012). At such high stocking densities, the constant monitoring of water quality is
essential to ensure the well-being of the fish at all times.
Water Quality Monitoring
In BFT research and commercial systems it is common practise to have two groups of water
parameters which are measured, as was done by Azim and Little (2008); Widanarni et al. (2012) and
Liu et al. (2014). The first is easier to measure and usually performed daily, or twice a day, in the
morning and evening. It includes parameters such as temperature, dissolved oxygen (DO), pH, floc
volume (FV), salinity, electro-conductivity (EC) and total dissolved solids (TDS). The importance of
these individual parameters to the proper functioning of a BFT system varies, with the major focus being
on temperature, DO, pH and FV (Avnimelech 2007; Widanarni et al. 2012; Liu et al. 2014). The
interrelatedness of these parameters is also evident, and would aid in the justification of only measuring
certain ones.
The second and less frequently measured group is typically evaluated weekly or bi-weekly, and
includes total ammonia nitrogen (TAN), nitrite (NO2), nitrate (NO3), orthophosphate (PO4), alkalinity,
turbidity and TSS (Azim and Little 2008; Prajith and Madhusoodana 2011; Widanarni et al. 2012; Liu et
al. 2014). Nitrogen parameters have been regarded worldwide to be the foremost limiting factor to the
survival of organisms grown in aquaculture (Tseng and Chen 2004; Crab et al. 2007; Barbieri 2010;
Xian et al. 2011; Santacruz-Reyes and Chien 2012). The dangerous nitrogen levels are often displayed
as un-ionised ammonia nitrogen (UIA-N), NH3–N or NH3 which is in equilibrium with the far less toxic
ionized ammonia nitrogen (IA-N), NH4+ or NH4+–N, together making up TAN.
The importance of monitoring water quality in BFT systems should not be underestimated.
Being intricately balanced and totally reliant on the microbial community for good water quality, it is
important to consistently monitor water quality in order to better understand this poorly documented
component of a BFT system. By describing a profile of the water quality in BFT systems, and the
collective effort of many such studies combined, we can compile a standard profile of the different
parameters. This will not only aid in enhancing existing BFT systems, but also create a starting point
for market entrants on what to expect. Being faced with high feed costs, water restrictions, little market
development, and a know-how shortage, the infant tilapia sector in South Africa may gain benefit from
a combination of such studies on the BFT concept where such issues are addressed.
Stellenbosch University https://scholar.sun.ac.za

74
4.3 Material and Methods
Experimental System
The experiment took place from 20 September 2014 until 15 December 2014 in a greenhouse,
on the Welgevallen experimental farm near Stellenbosch, South Africa. The experiment commenced
once water temperatures had risen satisfactorily to be consistently above 20ºC after the winter, and
would coincide with the start of the summer growing season. The same system as described in section
3.3 of chapter three was used in this trial.
Biofloc Establishment
Matured tank water from the recirculating aquaculture system (RAS) system housing the fish
prior to the trial was used to fill the newly constructed experimental system on 20 September 2014,
sixteen days prior to fish being introduced to the system. It was intended that this water would provide
a base level inoculation of some of the microbial community required in a biofloc system, and therefore
speed up the establishment of the microbial community, as opposed to using fresh water. The system
was left to run for two days to observe the functionality of the new system, after which the addition of
feed and a carbon source in the form of maize meal commenced, to stimulate the progression into a
biofloc system.
A commercially available three millimetre extruded, pelleted feed, the same as would be used
to feed the fish in the trial was utilized to fertilize the experimental system prior to the trial. The feed
contained five percent lipids and 35 % protein. The amount added per day was based on a calculation
of the amount of uneaten feed which would be entering the system if the fish were present, assuming
25 % nitrogen assimilation by the fish (Hargreaves 2013). Maize meal was added to the inoculated
system based on the calculation from the equation below, presented by Avnimelech (1999) and
Avnimelech (2012).
∆𝐶𝐻 = ∆𝐹𝑒𝑒𝑑 × %𝑁 𝑖𝑛 𝑓𝑒𝑒𝑑 × %𝑁 𝑒𝑥𝑐𝑟𝑒𝑡𝑖𝑜𝑛 ÷ 0.05
Fish Management
Three available species of tilapia; Oreochromis niloticus, Oreochromis mossambicus and
Oreochromis andersonii of average mass 36.82±0.49 g, 36.53±0.49 g and 19.30±0.49 g respectively,
were separately stocked by random allocation into four tanks each. Sixty fish were stocked per tank to
Stellenbosch University https://scholar.sun.ac.za
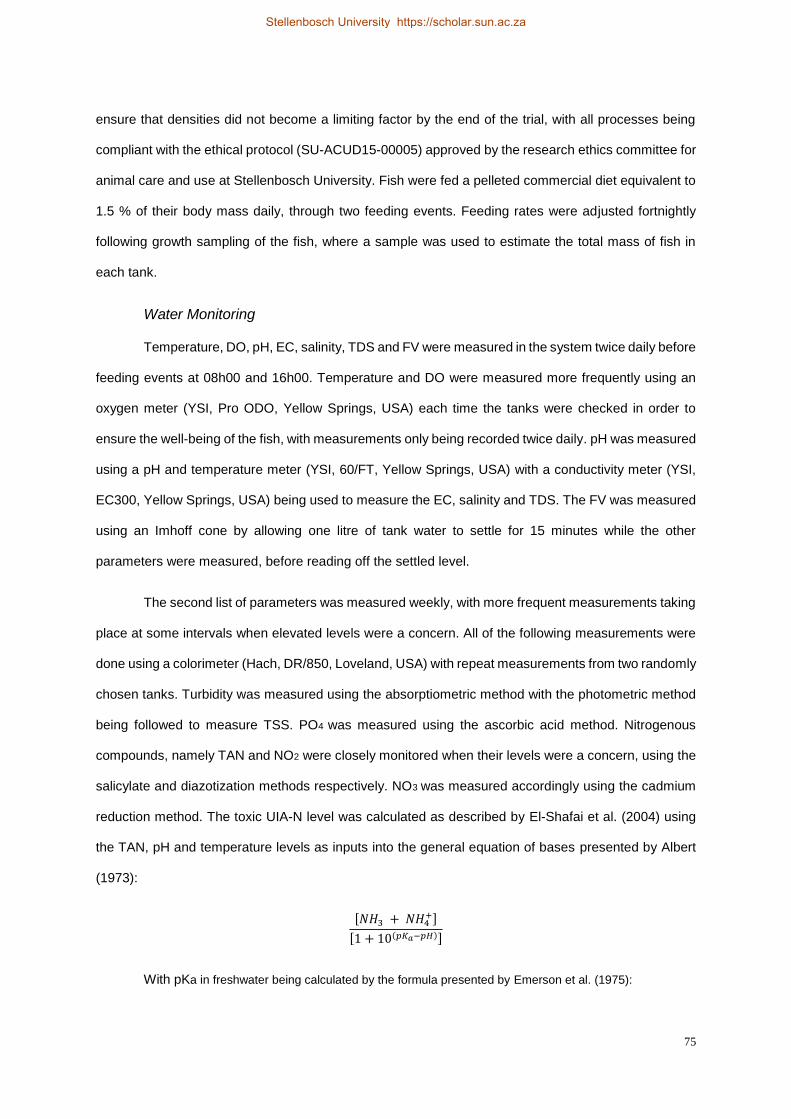
75
ensure that densities did not become a limiting factor by the end of the trial, with all processes being
compliant with the ethical protocol (SU-ACUD15-00005) approved by the research ethics committee for
animal care and use at Stellenbosch University. Fish were fed a pelleted commercial diet equivalent to
1.5 % of their body mass daily, through two feeding events. Feeding rates were adjusted fortnightly
following growth sampling of the fish, where a sample was used to estimate the total mass of fish in
each tank.
Water Monitoring
Temperature, DO, pH, EC, salinity, TDS and FV were measured in the system twice daily before
feeding events at 08h00 and 16h00. Temperature and DO were measured more frequently using an
oxygen meter (YSI, Pro ODO, Yellow Springs, USA) each time the tanks were checked in order to
ensure the well-being of the fish, with measurements only being recorded twice daily. pH was measured
using a pH and temperature meter (YSI, 60/FT, Yellow Springs, USA) with a conductivity meter (YSI,
EC300, Yellow Springs, USA) being used to measure the EC, salinity and TDS. The FV was measured
using an Imhoff cone by allowing one litre of tank water to settle for 15 minutes while the other
parameters were measured, before reading off the settled level.
The second list of parameters was measured weekly, with more frequent measurements taking
place at some intervals when elevated levels were a concern. All of the following measurements were
done using a colorimeter (Hach, DR/850, Loveland, USA) with repeat measurements from two randomly
chosen tanks. Turbidity was measured using the absorptiometric method with the photometric method
being followed to measure TSS. PO4 was measured using the ascorbic acid method. Nitrogenous
compounds, namely TAN and NO2 were closely monitored when their levels were a concern, using the
salicylate and diazotization methods respectively. NO3 was measured accordingly using the cadmium
reduction method. The toxic UIA-N level was calculated as described by El-Shafai et al. (2004) using
the TAN, pH and temperature levels as inputs into the general equation of bases presented by Albert
(1973):
[𝑁𝐻3 + 𝑁𝐻4+]
[1 + 10(𝑝𝐾𝑎−𝑝𝐻)]
With pKa in freshwater being calculated by the formula presented by Emerson et al. (1975):
Stellenbosch University https://scholar.sun.ac.za

76
𝑝𝐾𝑎 = 0.09018 +2729.92
𝑇
where T is measured in Kelvin which is 273 + TºC. In the case where the levels of nitrogen
compounds were deemed to be hazardously high, salt (NaCl) was added, feeding rates were reduced
or cut, with maize meal addition being increased in order to stimulate the microbial community to reduce
the high levels. Sludge, with an approximate volume of three litres was drained weekly from each tank,
was also removed more frequently during these critical times. When pH levels were below 6.0, one
kilogram of limestone was added per tank in perforated bags. This was intended to help with raising the
pH along with adding to the buffering capacity of the system.
Correlation Analysis
The mean values of each of the water parameters measured were compared for the two periods
from 15 days before the stocking event to day 15 of the trial (before salt addition) and days 16-71 (after
salt addition) using one way analysis of variance (ANOVA) coupled with Bonferroni multiple comparison
tests. Differences were considered statistically significant where P < 0.05.
4.4 Results and Discussion
Temperature
Water temperatures increased accordingly over the 15 days prior to fish being introduced to
the system, from 12.8ºC on day -15 to 23.9ºC on day one (Figure 4.1). This was in line with the start of
the seasonal growing period for tilapia in more temperate areas, where fish would be introduced after
temperatures had risen sufficiently after the winter (Dan and Little 2000). As expected, temperature
readings were higher in the afternoon due to the solar heating received during the daylight hours. Over
the course of the trial, the mean morning and afternoon temperatures were 22.5±0.2ºC and 27.5±0.2ºC
respectively.
It was reported by De Schryver et al. (2008) that temperatures from 20-25ºC are optimal for
maintaining a stable BFT system at an intermediate FV. This requirement needs to also be balanced
with the optimal temperature requirement of the cultured species, reported between 25 and 30ºC for
tilapia (El-Sayed 2006; Crab et al. 2009). Due to the nature of a semi-intensive BFT system, it would
be impractical to maintain temperatures within one of these ranges for the duration of the culture period,
and in most cases temperatures will vary through both ranges.
Stellenbosch University https://scholar.sun.ac.za

77
Due to the large surface area to volume ratio of the small research system used in the trial,
heat loss and temperature fluctuations were observed. These fluctuations would otherwise be buffered
in large scale commercial systems, where a smaller surface area to volume ratio results in less heat
loss per unit volume. In order to prevent water temperatures from dropping below 20ºC for long periods,
heaters were placed in each tank and used on four occasions throughout the course of the trial when
temperatures were below 20ºC. On warm days when air temperatures where high, the tunnel housing
the system was opened up on the ends to allow ventilation, with the lids of tanks being removed and
the air intake being drawn through an ice box in extreme heat, in order to prevent water temperatures
from exceeding 30ºC for extended periods.
Figure 4.1. Morning and afternoon water temperatures through the course of the trial, measured twice
daily at 08h00 (am) and 16h00 (pm) in the system.
Dissolved Oxygen
As water temperature increases, DO levels decrease (El-Sayed 2006; Avnimelech 2012). Thus,
from days -15 until day zero, the decrease in DO level (Figure 4.2), corresponds to the increase in the
water temperature (Figure 4.1). The decrease in DO levels over this initial period of the trial is also
consistent with the development and growth of biofloc in the system, increasing the Biological Oxygen
Demand (BOD) of the system. With a high BOD being characteristic of a BFT system, it was expected
that DO levels may become hazardously low for tilapia at higher temperatures experienced during the
early afternoon (Figure 4.2). This may be further exacerbated at high stocking densities of the cultured
12
14
16
18
20
22
24
26
28
30
32
-15 -10 -5 0 5 10 15 20 25 30 35 40 45 50 55 60 65 70 75
Tem
per
atu
re (
ºC)
Time (day)
am pm
Stellenbosch University https://scholar.sun.ac.za

78
organism as well as at high biofloc levels revealed in FV, turbidity and TSS readings. DO levels steadily
decreased from day 40 until the end of the trial (Figure 4.2), consistent with the growing BOD on the
system driven by the increase in stocking density (kg/m³) caused by the growth of the fish, rather than
by temperature, which was relatively constant (Stickney 2009; Widanarni et al. 2012).
Figure 4.2. Morning and afternoon dissolved oxygen (DO) levels of the tank water through the course of the trial, measured twice daily at 08h00 (am) and 16h00 (pm).
Salinity, Total Dissolved Solids and Electro-conductivity
The solubility of oxygen is lower in more saline conditions (Boyd and Pillai 1985), therefore DO
decrease as salinity increases. EC, salinity and TDS are closely related (Figure 4.3), with some
researchers regarding TDS measurements as a measure of salinity (Grattan 2002). Although this may
be the case in clean water, there are however other organic solutes contributing to TDS apart from just
salts, which make up the salinity reading. The measurements for TDS and salinity are derived from EC
as this easily measured parameter is directly related to the ion concentration in the water, with this
relationship being clearly evident (Figure 4.3) These EC related parameters are used as an early
indication of significant changes in the water quality through the presence of dissolved solutes which
could be of detriment to the aquatic life. The drop in EC, salinity and TDS seen on day 52 was as a
result of separation strategies and sludge drainage incited by high FV and low DO readings, indicative
of an excessive level of biofloc.
3
4
5
6
7
8
9
10
11
-15 -10 -5 0 5 10 15 20 25 30 35 40 45 50 55 60 65 70 75
DO
(m
g/L)
Time (day)
am pm
Stellenbosch University https://scholar.sun.ac.za
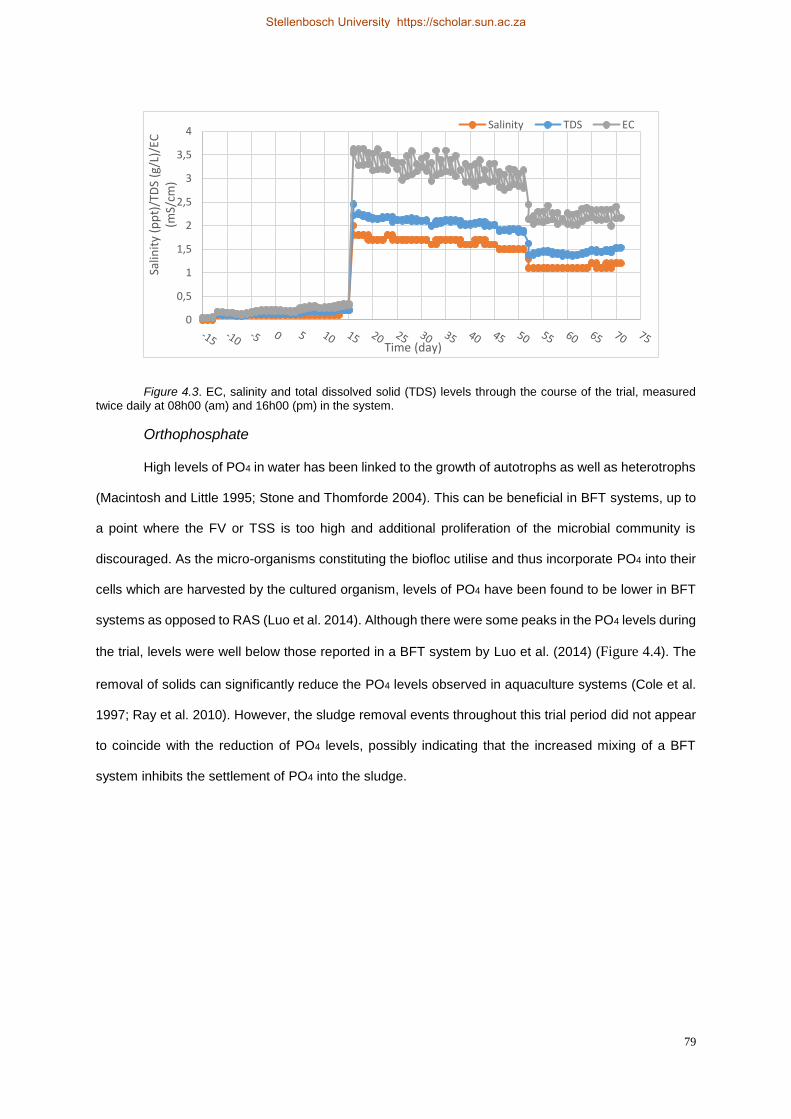
79
Figure 4.3. EC, salinity and total dissolved solid (TDS) levels through the course of the trial, measured twice daily at 08h00 (am) and 16h00 (pm) in the system.
Orthophosphate
High levels of PO4 in water has been linked to the growth of autotrophs as well as heterotrophs
(Macintosh and Little 1995; Stone and Thomforde 2004). This can be beneficial in BFT systems, up to
a point where the FV or TSS is too high and additional proliferation of the microbial community is
discouraged. As the micro-organisms constituting the biofloc utilise and thus incorporate PO4 into their
cells which are harvested by the cultured organism, levels of PO4 have been found to be lower in BFT
systems as opposed to RAS (Luo et al. 2014). Although there were some peaks in the PO4 levels during
the trial, levels were well below those reported in a BFT system by Luo et al. (2014) (Figure 4.4). The
removal of solids can significantly reduce the PO4 levels observed in aquaculture systems (Cole et al.
1997; Ray et al. 2010). However, the sludge removal events throughout this trial period did not appear
to coincide with the reduction of PO4 levels, possibly indicating that the increased mixing of a BFT
system inhibits the settlement of PO4 into the sludge.
0
0,5
1
1,5
2
2,5
3
3,5
4
Salin
ity
(pp
t)/T
DS
(g/L
)/EC
(m
S/cm
)
Time (day)
Salinity TDS EC
Stellenbosch University https://scholar.sun.ac.za

80
Figure 4.4. Orthophosphate (PO4) levels measured in the tanks through the course of the trial.
Turbidity and Total Suspended Solids
Turbidity and TSS are closely related, as was seen with their profiles over the course of the trial
(Figure 4.5). The levels of both parameters rose relatively consistently over the period of the trial, similar
to findings by Liu et al. (2014), with two events leading to short term reductions in their levels. The first
was the stocking of fish on day one of the trial. The consumption of biofloc by the fish, meant that the
levels of turbidity (253 FAU) and TSS (322 mg/L) recorded on day minus two of the trial dropped, only
to be surpassed on day 26. This decrease in TSS levels with stocking, is similar to findings by
Avnimelech (2007) with Azim and Little (2008) also pointing out a link to stocking density and suggesting
further research into finding the optimum TSS level at different stocking densities. Achieving a balance
at which TSS levels are relatively constant at a certain stocking density without separation or settlement
strategies would be of significant value, and is a major challenge. The practicality of achieving this on
a large scale system may be questionable at this stage, but may have prospects in the future. The
second decrease in turbidity and TSS seen from days 50-55 (Figure 4.5), was as a result of settlement
strategies implemented by allowing biofloc to settle, and then being drained from tank water in order to
bring down the biological load in the system. This was done following low DO levels and suggestion by
Avnimelech 2012 to maintain TSS below 500 mg/L.
0
2
4
6
8
10
12
14
16
18
20
PO
4(m
g/L)
Time (day)
Stellenbosch University https://scholar.sun.ac.za

81
Figure 4.5. Turbidity measured in formazin attenuation units (FAU) and total suspended solid (TSS) levels measured in the tanks through the course of the trial.
Floc Volume
The levels of FV varied between zero and 240 mL/L through the period of the trial, showing two
major peaks (Figure 4.6). Being closely related, these peaks are in similar positions to those of TSS
and turbidity (Figure 4.5), with the levels of FV dropping off for similar reasons, namely the stocking of
fish and settlement strategies. As the trial progressed with FV readings being taken twice daily,
scepticism arose around the standardization by using a standardized time when measuring FV.
Although a standard settlement time of 15 minutes was used throughout the trial, it was noticed that the
amount of time taken for the floc plug to settle changed through the course of the trial. In the beginning
of the trial, all the floc in the sampled water appeared to be settled out in 15 minutes and if left for 20
minutes, would re-suspend. From day 59 to the end of the trial, this was not the case, and if left for an
extra five to ten minutes, the FV reading would significantly increase. This seems to point towards
different densities of the biofloc at different stages in the culture cycle, and did not appear to be linked
to the addition of salt which occurred on day 15 of the trial. There was no significant difference between
the mean FV values from before (40±5 mL/L) and after (50±7 mL/L) this day, with p=0.280 (Table 4.1).
0
200
400
600
800
1000
Turb
idit
y (F
AU
)/TS
S (m
g/L)
Time (day)
Turbidity TSS
Stellenbosch University https://scholar.sun.ac.za

82
Figure 4.6. Floc volume (FV) levels through the course of the trial, measured twice daily in the system.
pH
pH levels showed great fluctuation throughout the period of the trial (Figure 4.7). Limestone
was added to the system on day four in an attempt to raise the critically low pH levels. Morning readings
were generally higher than afternoon readings, consistent with findings by Samocha et al. (2007).
Declining FV appeared to be associated with decreasing pH. This may be due to the action of bacteria
being reduced by the decreasing pH level (Hargreaves 2013). The input of acid to the system through
the nitrification process appears to have been a major component of the pH fluctuations observed, as
correlation between the various nitrogenous compounds associated with nitrification and the pH is
evident.
0
50
100
150
200
250
FV (
mL/
L)
Time (day)
Stellenbosch University https://scholar.sun.ac.za

83
Figure 4.7. Morning and afternoon pH levels through the course of the trial, measured twice daily in the system.
Nitrogenous Compounds
At low pH, the toxicity of TAN is reduced, as the equilibrium between UIA-N and IA-N favours
the less toxic IA-N species (Avnimelech 2012). TAN levels showed an upward trend through the trial
period, with various peaks and a maximum value of 7.3 mg/L being recorded on day 57 (Figure 4.8a).
This was less than the maximum values observed in BFT systems of eight milligrams per litre and 60
mg/L by Azim and Little (2008) as well as Luo et al. (2014) respectively.
The UIA-N levels were calculated over the course of the trial (Figure 4.8c). Partly due to low
pH values shifting the equilibrium, UIA-N levels were kept below the 0.1 mg/L recommended level for
the majority of the trial, and well within the tolerance levels of tilapia throughout the entire trial period
(El-Shafai et al. 2004; Avnimelech 2012).
Two major spikes in NO2 levels were observed just prior to the fish stocking event, and from
days 13-18 (Figure 4.8b). As in the first instance, spikes are expected in the establishment of a new
BFT system during the start-up period prior to fish being stocked, as the microbial community controlling
the nitrogen assimilation has not yet established (Avnimelech 2012). Spikes in this dangerous
compound can lead to mortalities, as observed in the second instance. The second spike appears to
have been induced by system failure causing a water loss event to take place on day nine of the trial
whereby the sudden loss of biofloc caused the FV reading to decrease from 27.5 mL/L on day eight to
4,0
4,5
5,0
5,5
6,0
6,5
7,0
7,5
8,0
-15 -10 -5 0 5 10 15 20 25 30 35 40 45 50 55 60 65 70 75
pH
Time (day)
am pm
Stellenbosch University https://scholar.sun.ac.za

84
10 mL/L on day nine. This, coupled with a cold period on days 12 and 13, possibly inhibiting the efficient
re-establishment of the microbial community, may have caused a shift away from the heterotrophic
pathway of nitrogen control to a more nitrification centred pathway. With this sudden shift, the action of
the nitrite oxidising bacteria (NOB), tasked with converting NO2 into NO3, did not have the immediate
capacity of handling such high levels, causing partial nitrification where NO2 levels rose to toxic levels,
as is often observed in start-up (Hargreaves 2013). Such events should be avoided at all costs in BFT
systems, and mechanisms such as alarm systems and back-up biofloc containing tanks should be
installed in order to minimize the risk of such events.
The presence of NO3, being the end product of the nitrification process, indicates that this
process was still taking place in the experimental system, even though it may not have been the
dominant mechanism of nitrogen control for much of the trial period. High levels of NO3 (Figure 4.8d),
although not toxic, were observed, following peaks in TAN levels (Figure 4.8a), indicative of the two
step nitrification process taking place. There did not appear to be an accumulation of NO3 over the
course of the trial as has been obseved by Azim and Little (2008) and Luo et al. (2014) (Figure 4.8d),
and may be due to the weekly sludge draining acting as an output for this compound.
Stellenbosch University https://scholar.sun.ac.za

85
Figure 4.8. The profiles of nitrogenous compounds, a) total ammonia nitrogen (TAN), b) nitrite (NO2), c) un-ionised ammonia nitrogen (UIA-N), and d) nitrate (NO3) measured from tank water over the course of the trial.
0
2
4
6
8
TAN
(m
g/L)
Time (day)
a)
02468
1012141618
NO
2(m
g/L)
Time (day)
b)
0,000
0,010
0,020
0,030
0,040
0,050
-15 -10 -5 0 5 10 15 20 25 30 35 40 45 50 55 60 65 70 75
UIA
-N (
mg/
L)
Time (day)
c)
0
5
10
15
NO
3(m
g/L)
Time (day)
d)
Stellenbosch University https://scholar.sun.ac.za

86
Salt Addition
Salt was added to the research system on day 15 of the trial following high NO2 levels, to
prevent NO2 toxicity as was demonstrated by Wang et al. (2006); Wuertz et al. (2013) and Luo et al.
(2014).
The temperature of water was significantly different before and after the addition of salt (Table
4.1). Due to the changing of seasons, and with the trial running into the summer period, this is as a
result of changing climatic conditions, and shouldn’t be correlated to the presence of salt in the water.
The addition of salt appeared to have a significant (P < 0.0001) effect on the reduction of DO levels
from 7.7±0.2 mg/L to 6.5±0.1 mg/L. As DO levels are largely dependent on water temperature, this rise
is likely to be as an indirect result of the progression into the summer heat. As DO levels are also largely
dependent on the bioload of the system, this significant difference should not be entirely attributed to
the rising temperatures, as the addition of salt may in fact increase the system’s bioload and therefore
indirectly influence DO levels.
Table 4.1. Showing the mean values for various parameters as well as whether there is significant difference before salt was added to the system and with salt present (p values from Bonferroni multiple comparison tests).
Mean salinity levels rose significantly from 0.1±0.005 ppt before the event to 1.5±0.026 ppt after
the addition of salt (Table 4.1). Mean TDS (0.132±0.006 g/L) and EC (0.198±0.010 mS/cm) levels
before, were significantly different to those recorded after the salt addition event, where means were
Parameter Unit No Salt Salt P value Significant
Temperature °C 22.9±0.5 25.2±0.3 <0.0001 Yes
DO mg/L 7.7±0.2 6.5±0.1 <0.0001 Yes
pH - 6.30±0.08 6.34±0.04 0.647 No
EC mS/cm 0.198±0.010 2.865±0.050 <0.0001 Yes
salinity ppt 0.1±0.005 1.5±0.026 <0.0001 Yes
TDS mg/L 0.132±0.006 1.851±0.030 <0.0001 Yes
FV mL/L 40±5 50±7 0.280 No
TAN mg/L 2.6±0.7 4.0±0.4 0.071 No
NO2 mg/L 6.529±2.042 2.713±0.680 0.027 Yes
NO3 mg/L 5.2±1.2 5.4±1.2 0.869 No
PO4 mg/L 4.3±1.0 6.9±2.0 0.347 No
Turbidity FAU 149±48 500±51 0.001 Yes
TSS mg/L 194±54 564±55 0.001 Yes
UIA-N mg/L 0.003±0.001 0.010±0.002 0.034 Yes
Stellenbosch University https://scholar.sun.ac.za

87
1.851±0.030 g/L and 2.865±0.050 mS/cm respectively. As expected, the addition of salt affected these
closely related parameters accordingly.
Despite TAN and NO3 showing an increase, but no significant difference between the two periods (Table
4.1), NO2 levels were significantly reduced from 6.529±2.042 mg/L to 2.713±0.680 mg/L when salt was
added. It should be noted that the addition of salt is often employed in aquaculture to reduce the toxicity
of NO2 rather than decrease its level (Durborow et al. 1997). This significant difference observed, may
be as a result of the first period including the two peaks in the NO2 levels which prompted the addition
of salt to the system. As these peaks were classified as extreme events, the addition of salt may not be
totally responsible for the lower NO2 levels. Salt did however appeared to have a stabilizing effect on
the NO2 levels (Figure 4.8b), and thus would be a recommended addition to aid in stabilizing a system.
UIA-N levels were significantly higher after salt was added to the system, rising from 0.003±0.001 mg/L
to 0.010±0.002 mg/L. As this calculated level is dependent on TAN, pH and temperature, all of which
showed an increase, it may have be expected to have increased. However, being at such a low level
even after the increase, it is improbable that the level of UIA-N would have had a significant effect on
the BFT system.
With the levels of turbidity and TSS consistently rising over the period of the trial (Figure 4.5), it is no
surprise that there is significant difference in the mean values of both these parameters before and after
the addition of salt to the system. As the rise was relatively stable, it is unlikely that the addition of salt
was a primary contributing factor to these elevated levels.
4.5 Conclusions
Although water quality parameters may have been kept within optimal levels for tilapia for the
majority of the trial, maintaining these optimal conditions for 100 % of the time proved to be difficult.
Due to the small size of many BFT research systems, similar problems were documented in other
studies (Azim and Little 2008; Luo et al. 2014). Using larger water bodies in larger commercial style
systems may have its benefits, but also comes at a significantly higher cost. The profiles of various
parameters documented over time, along with those of other such studies may serve as valuable
information to farmers entering or already involved in BFT, giving an idea of what to expect in terms of
water quality. Other such studies on water quality in South African conditions can aid in filling the
information gap and aiding farmers to better understand their water quality profiles. Documenting the
Stellenbosch University https://scholar.sun.ac.za

88
profiles of these parameters over an entire grow out season in certain conditions would be highly
beneficial. Although the mean values for Temperature, DO, EC, TDS, NO2, turbidity, TSS and UIA-N
showed significant difference for the periods before and after the addition of salt, it is unlikely that this
was the primary contributing factor to these differences. The addition of salt may however have played
a lesser role in these differences. Adding salt to the system did appear to have had a stabilizing effect
on the NO2 levels, and should thus be used as a tool in such instances. More comprehensive studies
are needed on the effects of salt addition, where multiple repeats can further credit the findings. Further
research is needed into strategies of curbing NO2 spikes following water loss or other events causing
system imbalances. A more standardized field method for quantifying the levels of biofloc, and
determining and maintaining the optimal level of biofloc for tilapia should be investigated.
4.6 References
Albert A (1973) Selective toxicity: the physico-chemical basis of therapy, 5th edn. Chapman and Hall, London.
Amal MNA, Saad MZ, Zahrah AS, Zulkafli AR (2015) Water quality influences the presence of Streptococcus agalactiae in cage cultured red hybrid tilapia, Oreochromis niloticus x Oreochromis mossambicus. Aquac Res 46:313–323.
Auffret M, Yergeau É, Pilote A, et al. (2013) Impact of water quality on the bacterial populations and off-flavours in recirculating aquaculture systems. FEMS Microbiol Ecol 84:235–247.
Avnimelech Y (2012) Biofloc technology - a practical guide book, 2nd edn. World Aquaculture Society, Baton Rouge, Louisiana.
Avnimelech Y (1999) Carbon/nitrogen ratio as a control element in aquaculture systems. Aquaculture 176:227–235.
Avnimelech Y (2007) Feeding with microbial flocs by tilapia in minimal discharge bio-flocs technology ponds. Aquaculture 264:140–147.
Azim ME, Little DC (2008) The biofloc technology (BFT) in indoor tanks: water quality, biofloc composition, and growth and welfare of Nile tilapia (Oreochromis niloticus). Aquaculture 283:29–35.
Barbieri E (2010) Acute toxicity of ammonia in White Shrimp (Litopenaeus schmitti) (Burkenroad, 1936, Crustacea) at different salinity levels. Aquaculture 306:329–333.
Boyd CE, Pillai VK (1985) Water quality management in aquaculture. Central Marine Fisheries Research Institute Special Publication, Cochin.
Boyd CE, Tucker CS (1992) Water quality and pond soil analyses for aquaculture. Alabama Agricultural Experiment Station, Auburn University, Alabama.
Stellenbosch University https://scholar.sun.ac.za

89
Cole DW, Cole R, Gaydos SJ, et al. (2009) Aquaculture: environmental, toxicological, and health issues. Int J Hyg Environ Health 212:369–377.
Cole WM, Rakocy JE, Shultz KA, Bailey DS (1997) Effects of solids removal on tilapia production and water quality in continuously aerated, outdoor tanks. In: Fitzsimmons K (ed) 4th International Symposium of tilapia in aquaculture. Ithaca, New York. November 1997.
Crab R, Avnimelech Y, Defoirdt T, et al. (2007) Nitrogen removal techniques in aquaculture for a sustainable production. Aquaculture 270:1–14.
Crab R, Defoirdt T, Bossier P, Verstraete W (2012) Biofloc technology in aquaculture: beneficial effects and future challenges. Aquaculture 356-357:351–356.
Crab R, Kochva M, Verstraete W, Avnimelech Y (2009) Bio-flocs technology application in over-wintering of tilapia. Aquac Eng 40:105–112.
Dan NC, Little DC (2000) The culture performance of monosex and mixed-sex new-season and overwintered fry in three strains of Nile tilapia (Oreochromis niloticus) in northern Vietnam. Aquaculture 184:221–231.
De Schryver P, Crab R, Defoirdt T, et al. (2008) The basics of bio-flocs technology: the added value for aquaculture. Aquaculture 277:125–137.
Durborow RM, Crosby DM, Brunson MW (1997) Nitrite in fish ponds. Southern Regional Aquaculture Centre Publication 462.
El-Sayed AFM (2006) Tilapia culture, 1st edn. CABI Publishing, Wallingford.
El-Sayed AFM (2013) An overview of aquaculture in Egypt with focus on tilapia culture. Presented at the 11th conference of the aquaculture association of southern Africa, Stellenbosch University, Stellenbosch, 9-13 September 2013.
El-Shafai SA, El-Gohary FA, Nasr FA, et al. (2004) Chronic ammonia toxicity to duckweed-fed tilapia (Oreochromis niloticus). Aquaculture 232:117–127.
Emerenciano M, Ballester ELC, Cavalli RO, Wasielesky W (2012) Biofloc technology application as a food source in a limited water exchange nursery system for Pink Shrimp Farfantepenaeus brasiliensis (Latreille, 1817). Aquac Res 43:447–457.
Emerenciano M, Ballester ELC, Cavalli RO, Wasielesky W (2011) Effect of biofloc technology (BFT) on the early postlarval stage of Pink Shrimp Farfantepenaeus paulensis: growth performance, floc composition and salinity stress tolerance. Aquac Int 19:891–901.
Emerenciano M, Gaxiola G, Cuzon G (2013) Biofloc Technology (BFT): A review for aquaculture application and animal food industry. In: Matovic MD (ed) Biomass now - cultivation and utilization. InTech, Rijeka, pp 301–328.
Emerson K, Russo RC, Lund RE, Thurston R V (1975) Aqueous ammonia equilibrium calculations: effect of pH and temperature. J Fish Board Canada 32:2379–2383.
Fitzsimmons K (2000) Future trends of tilapia aquaculture in the Americas. In: Costa-Pierce BA, Rakocy JE (eds) Tilapia Aquaculture in the Americas, Vol 2. The World Aquaculture Society, Baton Rouge, Louisiana.
Grattan S (2002) Irrigation water salinity and crop production. University of California, Davis.
Stellenbosch University https://scholar.sun.ac.za

90
Hargreaves JA (2013) Biofloc production systems for aquaculture. Southern Regional Aquaculture Centre Publication 4503.
Hargreaves JA (2006) Photosynthetic suspended-growth systems in aquaculture. Aquac Eng 34:344–363.
Liu L, Hu Z, Dai X, Avnimelech Y (2014) Effects of addition of maize starch on the yield, water quality and formation of bioflocs in an integrated shrimp culture system. Aquaculture 418-419:79–86.
Luo G, Gao Q, Wang C, et al. (2014) Growth, digestive activity, welfare, and partial cost-effectiveness of genetically improved farmed tilapia (Oreochromis niloticus) cultured in a recirculating aquaculture system and an indoor biofloc system. Aquaculture 422:1–7.
Macintosh D, Little D (1995) Nile tilapia (Oreochromis niloticus). In: Bromage NR, Roberts RJ (eds) Broodstock Management and Egg and Larval Quality. Blackwell Science, Oxford.
Prajith KK, Madhusoodana KB (2011) Application of biofloc technology (BFT) in the nursery rearing and farming of Giant Freshwater Prawn, Macrobrachium rosenbergii (deMan). Dissertation, Cochin University of Science and Technology.
Ray AJ, Lewis BL, Browdy CL, Leffler JW (2010) Suspended solids removal to improve shrimp (Litopenaeus vannamei) production and an evaluation of a plant-based feed in minimal-exchange, superintensive culture systems. Aquaculture 299:89–98.
Ridha MT (2006) Comparative study of growth performance of three strains of Nile tilapia, Oreochromis niloticus, L. at two stocking densities. Aquac Res 37:172–179.
Samocha TM, Patnaik S, Speed M, et al. (2007) Use of molasses as carbon source in limited discharge nursery and grow-out systems for Litopenaeus vannamei. Aquac Eng 36:184–191.
Santacruz-Reyes RA, Chien YH (2012) The potential of Yucca schidigera extract to reduce the ammonia pollution from shrimp farming. Bioresour Technol 113:311–314.
Stickney RR (2009) Aquaculture: an introductory text, 2nd edn. Cabi, Wallingford.
Stone NM, Thomforde HK (2004) Understanding your fish pond water analysis report. University of Arkansas, Pine Bluff.
Tseng IT, Chen JC (2004) The immune response of White Shrimp Litopenaeus vannamei and its susceptibility to Vibrio alginolyticus under nitrite stress. Fish Shellfish Immunol 17:325–333.
Wang Y, Zhang W, Li W, Xu Z (2006) Acute toxicity of nitrite on tilapia (Oreochromis niloticus) at different external chloride concentrations. Fish Physiol Biochem 32:49–54.
Widanarni W, Ekasari J, Maryam S (2012) Evaluation of biofloc technology application on water quality and production performance of Red tilapia Oreochromis sp. cultured at different stocking densities. Hayati J Biosci 19:73–80.
Wuertz S, Schulze SGE, Eberhardt U, et al. (2013) Acute and chronic nitrite toxicity in juvenile Pike-perch (Sander lucioperca) and its compensation by chloride. Comp Biochem Physiol Part C 157:352–360.
Xian JA, Wang AL, Chen XD, et al. (2011) Cytotoxicity of nitrite on haemocytes of the Tiger Shrimp, Penaeus monodon, using flow cytometric analysis. Aquaculture 317:240–244.
Stellenbosch University https://scholar.sun.ac.za

91
5 General Conclusion
This study set out to pioneer the concept of biofloc technology (BFT) under South African
conditions with special focus on tilapia species, namely Oreochromis niloticus, Oreochromis
mossambicus, and Oreochromis andersonii. It was intended to act as an initial investigation for the BFT
concept, from which future research could stem. It aimed to address the species dilemma currently
facing South Africa, and shed light on the performance of different tilapia species under BFT conditions.
It was conducted at a crucial and exciting time, with the freshwater aquaculture industry’s emergence
from its infant stage imminent, due to its rapid development being prioritized and streamlined by
government.
A 10-week growth comparison trial was conducted in a BFT system between three tilapia
species; O. niloticus, O. mossambicus and O. andersonii, with a regression being fitted to the mass
data. The average growth rate of O. niloticus shown as an average daily gain of 0.693±0.018 g/day,
was significantly (p < 0.05) higher than the 0.405±0.025 g/day of O. mossambicus, which was
significantly higher than the 0.185±0.025 g/day shown by O. andersonii. Additionally, the lowest feed
conversion ratio (FCR) was recorded for O. niloticus, being 1.01±0.05, followed by O. mossambicus
and then O. andersonii, being 2.24±0.16 and 2.53±0.28 respectively. Mortalities and reduced feeding
were observed in O. mossambicus and O. andersonii, tanks during periods of poor water quality, which
was not the case for O. niloticus tanks. This indicates the higher tolerance of the latter species to poor
water quality, being beneficial to the application in dynamic BFT systems.
A number of water quality parameters were successfully monitored throughout the trial period,
and were used to create a profile of the various parameters over time, which may be useful to
researchers and farmers alike. Temperature, dissolved oxygen (DO), pH, floc volume (FV), salinity,
total dissolved solids (TDS), electro-conductivity (EC) were monitored twice daily with total ammonia
nitrogen (TAN), nitrite (NO2), nitrate (NO3), un-ionized ammonia nitrogen (UIA-N), orthophosphate
(PO4), total suspended solids (TSS) and turbidity being measured weekly. Two spikes in the levels of
dangerous nitrogen compounds were recorded during start-up and due to a water loss event. The first
Stellenbosch University https://scholar.sun.ac.za

92
spike was expected during the start-up phase, with the second coming as a result of a sudden decrease
in the bioload in the water, induced by filling up the system with clean water not containing biofloc. This
resulted in the inability to effectively remove TAN through the heterotrophic pathway, and stimulated
the nitrification pathway to initiate, resulting in the initial accumulation of NO2. This unplanned event
illustrated the importance of preventing major water loss in BFT systems, as the lag in recovery of the
heterotrophic community can result in the levels of TAN and NO2 rising to lethal concentrations. The
water quality parameters were however maintained within optimal levels for tilapia throughout the
majority of the trial, although it was evident that keeping levels constantly within these limits did prove
difficult in this dynamic system.
The study provided valuable information, and was a successful introduction into research on
BFT systems in South Africa. It achieved its objective of being a baseline study, with many prospects
being opened for further research. It has provided an idea of what to expect, and shed light on some
vital current issues facing the South African tilapia industry. It is intended to be of value to researchers
and the aquaculture sector in South Africa alike, and aid in enhancing the progress of the local industry.
The results from this study suggest that BFT can indeed work in South Africa, and O. niloticus appears
to be the most compatible species for use in such systems.
5.1 Limitations and Future Recommendations
Through the research conducted, and the experience gained, a number of areas for future
research have become apparent:
Due to time constraints, the duration of the trial was 10 weeks, simulating the beginning of the
grow-out season. It would be of value for future research to look at the whole grow out period within
BFT systems, from stocking until harvest.
Four repeats were used per species. It could be beneficial to incorporate additional repeats in
future research.
Water loss occurred on day nine of the trial due to an airlift pump becoming blocked. After this
event an alarm system was installed using a mobile phone to trigger when water was being lost. The
water loss caused an imbalance in the system, resulting in the levels of dangerous nitrogenous
Stellenbosch University https://scholar.sun.ac.za

93
compounds rising substantially. Water loss should be prevented at all costs in future research in BFT
systems, through the use of alarm systems from the outset.
The time it took for the settlement of the biofloc when taking floc volume (FV) readings appeared
to differ at different times of the trial. This concept could be further explored to provide reasons for this,
as well as devise a better measurement method which can be easily performed in practice.
The use of a larger water body would better simulate commercial conditions. This would be
beneficial in buffering the temperature fluctuations observed in smaller systems with a large surface
area to volume ratio. It is likely that commercial facilities will be available within South Africa in the near
future, and could be mutually beneficial if research were conducted in these systems.
As South Africa has often been regarded as being too cold for year round production of tilapia,
research into the seasonal variability in biofloc levels and the growth rates of tilapia would be valuable.
As there is variation within species, the use of additional strains from each particular species
could aid in refining the preferred species to a preferred strain of that species within a BFT system.
Further research could look at single sex culture, common in commercial application. As this trial was
run in the Western Cape, additional trials can be conducted in other provinces of South Africa, and
provide a better indication of the performance of tilapia or other species under the specific conditions
experienced in those areas.
A variable which was not explored in this thesis, but is of high interest to the tilapia industry in
South Africa, is the comparison of BFT against recirculating aquaculture systems (RAS). This could be
looked at in economic, feeding inputs, as well as yield/production terms. A lifecycle assessment of tilapia
between these respective systems may also be valuable.
Stellenbosch University https://scholar.sun.ac.za