Transcriptional networks and chromatin remodeling controlling adipogenesis
Upload
khangminh22Category
view
1download
0
UMass Chan Medical School UMass Chan Medical School
eScholarship@UMassChan eScholarship@UMassChan
GSBS Dissertations and Theses Graduate School of Biomedical Sciences
2019-07-12
Chromatin Interaction Dynamics Revealed by Liquid Chromatin Hi-Chromatin Interaction Dynamics Revealed by Liquid Chromatin Hi-
C C
Houda Belaghzal University of Massachusetts Medical School
Let us know how access to this document benefits you. Follow this and additional works at: https://escholarship.umassmed.edu/gsbs_diss
Part of the Bioinformatics Commons, and the Genetics and Genomics Commons
Repository Citation Repository Citation Belaghzal H. (2019). Chromatin Interaction Dynamics Revealed by Liquid Chromatin Hi-C. GSBS Dissertations and Theses. https://doi.org/10.13028/x96d-xg55. Retrieved from https://escholarship.umassmed.edu/gsbs_diss/1046
Creative Commons License
This work is licensed under a Creative Commons Attribution-Noncommercial 4.0 License This material is brought to you by eScholarship@UMassChan. It has been accepted for inclusion in GSBS Dissertations and Theses by an authorized administrator of eScholarship@UMassChan. For more information, please contact [email protected].

i
CHROMATIN INTERACTION DYNAMICS REVEALED BY LIQUID
CHROMATIN Hi-C
A Dissertation Presented
By
Houda Belaghzal
Submitted to the Faculty of the
University of Massachusetts Graduate School of Biomedical Sciences, Worcester
in partial fulfillment of the requirements for the degree of
DOCTOR OF PHILOSOPHY
July 12th , 2019

ii
CHROMATIN INTERACTION DYNAMICS REVEALED BY LIQUID
CHROMATIN Hi-C
A Dissertation Presented
By
Houda Belaghzal
This work was undertaken in the Graduate School of Biomedical Sciences
Interdisciplinary Graduate Program
Under the mentorship of
_________________________________
Job Dekker, PhD; Thesis Advisor
______________________________
Jeanne Lawrence , PhD; Member of Committee
_________________________________
Craig Peterson, PhD; Member of Committee
_____________________________
Amir Mitchell, PhD; Member of Committee
___________________________
Stavros Lomvardos, PhD; External Member of Committee
_________________________________
Paul Kaufman, PhD, Chair of Committee
Mary Ellen Lane, Ph.D.,
Dean of the Graduate School of Biomedical Sciences
July 12th , 2019

iii
DEDICATION
In memory of my uncle Aziz Rrhioua- a father figure to me, who lost his
battle with lung cancer in February of 2019. Uncle Aziz never missed an
opportunity to show me how much he cared and supported me in the pursuit of
my dreams, especially when it comes to my love and dedication to science. His
encouragement and never ending generosity to all of those around him motivated
me to keep going even in the most challenging moments.
To my courageous and precious mother, grandmother and sister: you
have taught me the most valuable lessons that define me today as a person.

iv
ACKNOWLEDGEMENTS
This thesis would not have been possible without the continuous guidance
from my advisor- Job Dekker, Ph.D. When I met Job, during one of my GSBS
interviews, I instantly knew he will be the most profound mentor and role model
any PhD student could ask for. I am honored to have had a chance to join his
laboratory. What sets him apart from many others is not only his absolute
command and knowledge of the field but most importantly his humbleness,
patience and enthusiasm to teach others, and genuine effort he invests in others.
Working with him hasn’t only been an empowering and inspiring experience but
also a mentorship that will be one of the guiding principles to live my life. I am
immensely thankful for his patience, trust and support throughout the many
challenges along this journey
I also would like to thank all of my collaborators, both past and present,
especially Tyler Borrman for four years of collaboration, during which we
developed new tools to analyze the data for our paper, “Liquid chromatin Hi-C”,
presented in the fourth chapter of this dissertation; we had a great collaboration.
Also for the same project, “Liquid chromatin Hi-C”, I thank John Marko and his
postdoc Andrew D. Stephens for their collaboration, which entailed applying their
cool micromanipulation techniques and for brainstorming about our results. Also,
I thank Leonid A. Mirny and Edward J. Banigan for discussions about “Liquid
chromatin Hi-C” presented I chapter IV

v
To my Committee Members: Paul Kaufman PhD, Jeannie Lawrence,
PhD., and Craig Peterson, PhD, and Amir Mitchel, PhD- I am very thankful for
your encouragement, constructive feedback and continuous support during this
process.
During my time at the Dekker Lab, I had the privilege to work with a
number of extremely talented scientists. Thank you to past members: Natalia
Naumova. PhD, Amartya Sanyal, PhD, Jon-Matthew Belton, PhD, Emily Smith,
PhD, Rachel Patton-McCord, PhD, Gaurav Jain, PhD, Noam Kaplan, PhD,
Jennifer E. Phillips-Cremins, PhD, Filipe Tavares-Cadete, PhD, and Hakan
Ozadam PhD. Special thank you to Bryan and Jon for their support, and
kindness as colleagues and friends. And Jennifer E. Phillips-Cremins PhD for her
tremendous support and help during my qualify exam. Thank you to my current
lab team members: Ye Zhan, Anne-Laure Valton PhD , Marlies Oomen, Allana
Schooley PhD, Nicki Fox PhD,Kristin Abramo, Betul Akgol Oksuz , Bastiaan
Dekker , Denis L. Lafontaine, Johan Gibcus PhD, Liyan Yang, Ankita Nand,
Sergey Venev PhD, Erica Hildebrand PhD, Yu Liu (Sunny) PhD, Ozgun Uyan,
and of course, once again, our amazing mentor Job Dekker PhD. A heartfelt
thank you goes to Allana Schooley and Anne-Laure Valton PhD for proofreading
some content of this thesis.
To members of the Program in Systems Biology thank you for being a
very inspiring and creative group during “Science On Tap” seminars and also

vi
during our daily unscheduled interactions in the kitchen of our department. I
thank Marian Walhout PhD for her support during some challenging times, and
Amir Mitchell PhD for some insightful advice in the project I am presenting in the
fourth chapter of this dissertation. Thanks to Ryan Richards PhD for his
constructive edits for some content of this dissertation.
I will like to thank Allan S Jacobson PhD for believing in me, supporting
me, and defended me fiercely. And Nadia Amrani for your enormous support
and mentorship.
Thanks to all the administrative and technical support staff of the Systems
Biology department, past and present; because of your hard work, we are able to
work smoothly every day in the lab.
To all my amazing friends, especially Edina Skaljic you have been the
most supportive friend; you believe in me and remind me of my strength during
challenging times. Thank you for being very thoughtful and supportive. You are
like a sister to me, and I feel so grateful and lucky to call you my best friend. To
my superwoman, perfectionist, and very supportive friend Hasena Omanovic, I
am very grateful for our friendship and your support. To Katharina Alshafie, thank
you for being an amazing friend who makes time for me even after having two
kids. Betul Akgol Oksuz, thank you for being such a great supportive friend, and
for being there for me during hard days. To Anne-Laure thank you for your
tremendous support continuous encouragement. To all of you, we have

vii
supported each other through many struggles, I could not have done this without
your support.
To my family, اركش. Finally the answer to your persistent question, when
are you going to be done with your Ph.D.? Yes, I am almost done. Thank you in
particular to the three most important women of my life, my Grandmother, my
mother, and my only sister Naoual for supporting me and believing in me, and
most importantly supporting my decision to leave the country to pursue my
dream to be a scientist. Thanks for asking me to explain my research to you,
even if you ask me the same question every year. Thank you for your continuous
support and unconditional love. And the biggest thanks to my uncle Mohammed
Bourdi, a scientist in National Institue of Health (NIH), for his tremendous
support. He encouraged me and supported my decision to come to the US for an
internship, then to get a PhD, and most importantly encouraged me to keep
going throughout all the years of my PhD, Mohammed and Amina I would have
never been able to get where I am today without your tremendous support.

viii
ABSTRACT
Development and application of genomic approaches based on 3C
methods combined with increasingly powerful imaging approaches have enabled
high-resolution genome-wide analysis of the spatial organization of
chromosomes in genome function. In this thesis, I first describe an updated
protocol for Hi-C (Hi-C 2.0), integrating recent improvements that significantly
contribute to the efficient and high-resolution capture of chromatin interactions.
Secondly, I present an assessment of the epigenetic landscape and
chromosome conformation around the MYC gene in acute myeloid leukemia
(AML) cells before and after small molecule, AI-10-49, treatment. MYC is up-
regulated upon inhibition of the RUNX1 repressor by the fusion oncoprotein
CBFβ-SMMHC. Treatment of AML cells with AI-10-49 blocks the RUNX1-CBFβ-
SMMHC interaction, restoring RUNX1 at MYC regulatory elements. We
demonstrate that the established loop is maintained and exchange between
activating and repressive chromatin complexes at the regulatory elements, rather
than altered chromatin topology, mediates disruption of target gene expression.
Finally, Hi-C interaction maps represent the population-averaged steady-
states. To understand the forces that promote and maintain the association of
loci with specific sub-nuclear structures genome-wide, we developed liquid
chromatin Hi-C. Detection of intrinsic locus-locus interaction stabilities and
chromatin mobility are enabled by fragmenting chromosomes prior to fixation and

ix
Hi-C, thus removing strong polymeric constraints. Nuclear compartmentalization
was found to be stable for average fragment lengths are 10-25 kb while
fragmentation below 6kb led to a gradual loss of spatial genome organization.
Dissolution kinetics of chromatin interactions vary widely for different domains
and are analyzed in detail in the final chapter of this thesis., with lamin-
associated domains being most stable, and speckle-associated loci most
dynamic.

x
TABLE OF CONTENTS
CHAPTER I: Introduction............................................................................................................... 1
Introduction .................................................................................................................................. 1
Microscopy-based methods ......................................................................................................... 1
3C-based methods ....................................................................................................................... 2
3D genome during interphase ...................................................................................................... 4
Chromosomal territories ............................................................................................................... 6
Interchromatin domain (ICD) ........................................................................................................ 7
Compartments .............................................................................................................................. 9
Compartmentalization model ..................................................................................................... 14
Topologically associating domain (TAD) .................................................................................... 16 TADs in single cells ................................................................................................................ 17 TAD boundaries and gene regulation .................................................................................... 18 Models for TAD formation ...................................................................................................... 20 Depletion of TAD building elements ....................................................................................... 22
The interplay between TADs and compartments ....................................................................... 25
Promoter enhancer interactions ................................................................................................. 27 Promoter enhancer interactions within TADs......................................................................... 27 Long-range promoter-enhancer interactions .......................................................................... 29 Super-enhancers .................................................................................................................... 29 Interchromosomal enhancer-promoter interactions ............................................................... 30
Biophysical processes that form chromosome conformation .................................................... 32
CHAPTER II: Hi-C 2.0: an optimized Hi-C procedure for high-resolution genome-wide mapping of chromosome conformation .................................................................................... 36
PREFACE .................................................................................................................................. 36
Abstract ...................................................................................................................................... 36
INTRODUCTION ........................................................................................................................ 37
MATERIALS AND METHODS ................................................................................................... 40 Hi-C 2.0 .................................................................................................................................. 40
Crosslinking ........................................................................................................................ 40 Cells lysis: .......................................................................................................................... 41 Digestion ............................................................................................................................ 41

xi
Biotin Fill-in: ........................................................................................................................ 42 Ligation: .............................................................................................................................. 42 Reverse Crosslinking ......................................................................................................... 42 DNA purification: ................................................................................................................ 43 Removal of Biotin from unligated ends: ............................................................................. 44 Sonication: ......................................................................................................................... 44 Size fractionation using AMpure XP: ................................................................................. 44 End Repair ......................................................................................................................... 46 Biotin pull-down .................................................................................................................. 46 A-tailing: ............................................................................................................................. 47 Illumina adapter ligation and paired-end PCR ................................................................... 47 Illumina Truseq Kit for PCR:............................................................................................... 48
RESULTS ................................................................................................................................... 48 CELL CULTURE & CROSSLINKING CELLS USING FORMALDEHYDE ........................ 48 Marking of DNA ends with biotin ............................................................................................ 53 In situ Ligation of proximal ends ............................................................................................ 54 Reversal of crosslinking and DNA purification ....................................................................... 55 Quality Control of Hi-C ligation products ................................................................................ 55 Removal of Biotin from un-ligated ends ................................................................................. 56 Sonication .............................................................................................................................. 58 Size selection ......................................................................................................................... 58 End repair ............................................................................................................................... 59 Biotin pulldown ....................................................................................................................... 59 A-tailing and adaptor ligation ................................................................................................. 60 PCR titration and production .................................................................................................. 61 Sequencing ............................................................................................................................ 63 MAPPING AND BINNING PIPELINE .................................................................................. 63 Bias in inward read orientation ............................................................................................... 66 Analysis of valid interaction pairs ........................................................................................... 67 Compartments ........................................................................................................................ 72 Topologically associated domains (TADs) ............................................................................. 72 Point to point interactions (loops) ........................................................................................... 73
CONCLUSION ........................................................................................................................... 75
CHAPTER III: CBFβ-SMMHC Inhibition Triggers Apoptosis by .............................................. 76
Disrupting MYC Chromatin Dynamics in Acute ........................................................................ 76
Myeloid Leukemia ........................................................................................................................ 76
PREFACE .................................................................................................................................. 76
SUMMARY ................................................................................................................................. 76
INTRODUCTION ........................................................................................................................ 77 MYC expression is critical for the survival of leukemia cells .................................................. 78 The inhibitory role of CBFβ-SMMHC oncoprotein ................................................................. 80

xii
AI-10-49 restores RUNX1 binding ......................................................................................... 81 The inhibitor AI-10-49 is a selective inhibitor of CBFβ-SMMHC which disrupts its binding to RUNX1 and induces apoptosis of inv(16) AML cells (Xue et al., 2015). Analysis of chromatin-immunoprecipitation (ChIP) experiments shows that treatment of ME-1 cells revealed that AI-10-49 restores RUNX1 transcriptional activity by increased RUNX1 binding to its target promoters (Fig. 3.1B) (Xue et al., 2015). ............................................................ 81
MATERIALS AND METHODS ................................................................................................... 82 Cell growth ............................................................................................................................. 82 Assay for Transposase-Accessible Chromatin with sequencing (ATAC-seq) ....................... 82 ATAC-qPCR ........................................................................................................................... 84 CRISPR/Cas9 – mediated deletion of the enhancer regions ................................................. 84 5C experimental design ......................................................................................................... 85 Primer settings ....................................................................................................................... 87 Generation of 5C libraries ...................................................................................................... 87 5C read mapping .................................................................................................................... 88 5C filtering and analysis ......................................................................................................... 88 4C-style plots ......................................................................................................................... 90
RESULTS ................................................................................................................................... 90 Inhibition of CBFβ-SMMHC Activity by AI-10-49 Represses MYC Expression ..................... 90 AI-10-49 enhances genome-wide RUNX1 DNA binding ....................................................... 91 RUNX1 represses MYC expression through binding at downstream enhancers .................. 93 ME1, ME2, and E3 enhancers physically interact with the MYC promoter ........................... 96 MYC expression and viability of inv(16) AML cells depend on ME1, ME2, and E3 enhancers ............................................................................................................................................. 100 AI-10-49 induces a switch of SWI/SNF active to PRC-repressive complexes at the AML-associated MYC enhancers ................................................................................................. 102
CONCLUSION ......................................................................................................................... 105 Transcription factor function can determine leukemia maintenance ................................... 105 The direct role of RUNX1 in MYC repression ...................................................................... 105 Enhancers can modulate the expression of their targets gene in a pair-wise manner ........ 106
CHAPTER IV: Compartment-dependent chromatin interaction dynamics revealed by liquid chromatin Hi-C ........................................................................................................................... 108
SUMMARY ............................................................................................................................... 108
INTRODUCTION ...................................................................................................................... 109
MATERIALS AND METHODS ................................................................................................. 112 Digestion, cross-linking and copolymer architecture and hetero/euchromatin phase separation ............................................................................................................................ 112 K562 nuclei purification ........................................................................................................ 116 3C (Chromosome Conformation Capture) ........................................................................... 117 BAC library for 3C-PCR ....................................................................................................... 121 Chromosome Conformation Capture Carbon Copy (5C) ..................................................... 121 Pre-digestion of nuclei (liquify chromatin) ............................................................................ 125

xiii
Hi-C 2.0 ................................................................................................................................ 126 DpnII-Seq ............................................................................................................................. 127 Lamin A Immunofluorescence and DAPI ............................................................................. 134 Chromatin fractionation assay ............................................................................................. 135 Micromanipulation force measurement and treatments of an isolated nuclei ...................... 137 3C-PCR ................................................................................................................................ 138 5C data processing .............................................................................................................. 139 Hi-C data processing ............................................................................................................ 140 A/B compartments ................................................................................................................ 141 LOS and half-life calculation ................................................................................................ 141 DpnII-seq data analysis ........................................................................................................ 144 Subcompartments ................................................................................................................ 145 Sub-nuclear structures ......................................................................................................... 146 Gene Expression .................................................................................................................. 148 Compartmentalization saddle plots ...................................................................................... 149 Homotypic interaction saddle plots ...................................................................................... 149 Scaling plot ........................................................................................................................... 150 Mean z-score heatmap ........................................................................................................ 150 Code availability ................................................................................................................... 150
RESULTS ................................................................................................................................. 151 Measuring the stability of chromatin interactions that maintain nuclear .............................. 151 compartmentalization ........................................................................................................... 151 Chromosome conformation in isolated nuclei ...................................................................... 153 Extensive chromatin fragmentation leads to the formation of liquid chromatin ................... 156 Liquid chromatin Hi-C analysis reveals that compartmental segregation requires chromatin fragments larger than 6 kb ................................................................................................... 160 Quantification of chromosome conformation dissolution upon chromatin fragmentation .... 162 Independent contributions of compartment status and fragmentation level to chromatin dissolution ............................................................................................................................ 164 Dissociation kinetics of chromatin interactions and compartments ..................................... 171 Quantification of the half-life of chromosome conformation across the genome ................. 173 Independent contributions of compartment status and fragmentation level to the half-life of chromatin interactions .......................................................................................................... 181 Compartment size and boundaries influence chromatin interaction stability ....................... 185 Chromatin loops dissociate upon chromatin fragmentation ................................................. 196
DISCUSSION ........................................................................................................................... 199
CHAPTER V: Discussion ........................................................................................................... 200
3C-based technologies ............................................................................................................ 200
Promoter-enhancer interactions ............................................................................................... 202
liquid chromatin Hi-C ................................................................................................................ 207
BIBLIOGRAPHY .......................................................................................................................... 219
xiv
LIST OF FIGURES
Figure 1.1: Schematic of the different levels of genome organization in 3D ......... 6 Figure 1.2 : A simple schematic of loop extrusion…………………………….…...22 Figure 1.3: Block copolymer folds into spatially segregated domains…………..35
Figure 2.1 : Overview of the Hi-C method .......................................................... 51 Figure 2.2: Quality Control of Hi-C ligation products ........................................... 62 Figure 2.3:Possible products generated by Hi-C ................................................ 65 Figure 2.4: Dangling end removal and to increase valid pair reads .................... 70 Figure 2.5: Topological structures observed with Hi-C ....................................... 74 Figure 3.1: Schematic of inv(16)(p13;q22), which fuse CBFβ and MYH11 genes. ........................................................................................................................... 81 Figure 3.2: Double alternating design for 5C probes. ......................................... 86 Figure 3.3: MYC transcript level in response to AI-10-49 treatment. .................. 91 Figure 3.4: RUNX1 binding in response to AI-10-49 treatment. ......................... 93 Figure 3.5: RUNX1 binding to MYC downstream enhancers. ............................. 95 Figure 3.6: Three enhancers downstream of MYC interact directly with MYC promoter. ............................................................................................................ 98 Figure 3.7: Deletion of Three RUNX1-Associated MYC Enhancer Elements Impairs MYC Expression and Viability of inv(16) AML ...................................... 101 Figure 3.8: AI-10-49 Induces a Switch of Activation for Repressive Marks at RUNX1-Associated MYC Enhancers. ............................................................... 104 Figure 4.1: Approach for measuring chromatin interaction stability .................. 152 Figure 4.2: Chromosome conformation in isolated nuclei ................................ 154 Figure 4.3: Extensive fragmentation of chromatin leads to liquefied chromatin 159 Figure 4.5: Hi-C analysis reveals chromosome disassembly upon chromatin liquefication....................................................................................................... 168 Figure 4.7: Kinetics of chromatin fragmentation and chromatin dissolution ...... 177 Figure 4.8: Liquid chromatin-Hi-C protocol and quantification of loss of structure after chromatin pre-digestion ............................................................................ 179 Figure 4.9: Variations in Half-life and LOS are not explained by DpnII digestion kinetics. ............................................................................................................ 183 Figure 4.10: Associations between sub-nuclear structures, compartment characteristics and chromatin interaction stability ............................................. 192 Figure 4.11: Dissociation kinetics of chromatin interactions at different sub-nuclear structures ............................................................................................. 194
xv
Figure 4.12: Chromatin loop dissociation upon fragmentation .......................... 198 Figure 5.1: Illustration of chromatin interaction dynamics in the nucleus and model for cohesin loss after chromatin digestion .............................................. 217
COPYRIGHT MATERIAL
Some content or figures have been previously published as described below.
According to the publisher’s copyright policies, as an author of these articles, I
retain the right to publish these contents in a thesis dissertation. Specific
attributions are listed in the Preface section accompanying each chapter.
Houda Belaghzal1, Job Dekker1, 2*, Johan H. Gibcus1. Methods. 2017 Jul
1;123:56-65. doi: 10.1016/j.ymeth.2017.04.004. Epub 2017 Apr 18.
John Anto Pulikkan,1 Mahesh Hegde,1 Hafiz Mohd Ahmad,1 Houda
Belaghzal,2 Anuradha Illendula,3 Jun Yu,1 Kelsey O’Hagan,1 Jianhong Ou,1
Carsten Muller-Tidow,4 Scot A. Wolfe,1 Lihua Julie Zhu,1 Job Dekker,2 John
Hackett Bushweller,3 and Lucio Hernān Castilla1. Cell 174, 172–186, June 28,
2018
The content of chapter IV is a manuscript under revisions
Houda Belaghzal1*, Tyler Borrman2*, Andrew D. Stephens3, Denis L.
Lafontaine1, Sergey Venev1, Zhiping Weng2, John F. Marko3,4, Job Dekker1

1
CHAPTER I: Introduction
Introduction Sequencing the human genome was a revolutionary step toward
understanding normal genome function and dysfunction in DNA related diseases.
However, genome function is dependent on the folded state of DNA inside the
cell nucleus. In humans, ~2 meters of DNA is intricately folded inside a small
nucleus of ~10 micrometers in diameter. Consequently, a major challenge of
genome folding is maintaining appropriate accessibility for regulatory elements
across cell divisions. The genomic community has developed various
technologies to help reveal the three-dimensional (3D) structure of the genome.
Such advancements have shed light upon the 3D structure of the genome as it
relates to its function, nuclear processes, and importantly some of the molecular
mechanisms that build the 3D genome structure itself.
Microscopy-based methods
Over the last decade, improvements in imaging approaches and 3C-
based technologies led to the untangling of many complex questions pertaining
to how the genome folds. In traditional Fluorescence In Situ Hybridization (FISH)
experiments, a limited number of loci are targeted to investigate their
interactions and their location inside the nucleus. More recently, high-throughput
FISH experiments were developed, capable of investigating hundreds of
chromatin interactions in single cells (Finn et al., 2019). Utilizing super-

2
resolution imaging, Boettiger and coworkers modified a previously reported
oligopaint approach to produce tens of thousands of unique oligonucleotide
probes, in order to label and visualize kilobase to megabase long genomic
regions using massively parallel oligonucleotide synthesis (Boettiger et al.,
2016). Finally, Genome Architecture Mapping (GAM) enables the measurement
of chromatin contacts and other features of three-dimensional chromatin
topology based on sequencing DNA from a large collection of thin nuclear
sections (Beagrie et al., 2017).
3C-based methods
Numerous biochemical approaches are capable of mapping physical
genome interactions with the aid of DNA sequencing. Chromosome conformation
capture (3C) based technologies (3C, 4C, 5C, capture-C, and Hi-C) (Job
Dekker, Rippe, Dekker, & Kleckner, 2002) (Dryden et al., 2014) (Dostie et al.,
2006) (Lieberman-aiden et al., 2009) use formaldehyde to capture DNA
interactions that are in close proximity in 3-dimensional space. After
formaldehyde crosslinking, DNA is fragmented followed by ligation of proximal
fragments and sequencing of ligated products. Combinations of these 3C-based
methods with next-generation sequencing technology have enabled the mapping
of DNA interactions at high resolution. Building on these techniques, ChIA-PET
(Fullwood et al., 2010) incorporates an immunoprecipitation step to 3C to enrich
for pair-wise interactions bounds by a specific protein. Promoter Capture Hi-C
“PCHi-C” enables enrichment of interactions between promoters and distal

3
regions in order to assign regulatory elements to their target genes (Schoenfelder
et al., 2015). The power of all of these 3C-based techniques is that no prior
knowledge of specific targets is needed, which allows for the detection of new
interactions in the genome. On the other side, a caveat of 3C-based methods is
that they are population-based and thus results reflect the average signal in the
analyzed cell population.
The invention of many 3C-based techniques led to the challenging question:
which 3C-based technique is best suited to answer a specific biological problem?
The following differences between 3C-based methods should be taken into
consideration when determining which method is most favorable. First, genomic
coverage varies amongst all 3C-based techniques (~ 200 kb using 3C-PCR, up
to ~5Mb using 5C or capture-C, and genome-wide coverage using Hi-C, 4C, and
ChIA-PET). Second, 3C-PCR investigates the interactions between two genomic
loci (one-vs-one), 4C reveals the interactions between one specific DNA anchor
of interest and all other loci genome-wide (one-vs-all), 5C and Capture-C explore
the interactions between all loci within the targeted region (many-vs-many) , and
Hi-C reveals pair-wise interactions genome-wide (all-vs-all). However, in
mammalian cells, sequencing depths on the order of 108 – 109
valid reads are
required to produce a high-resolution Hi-C interaction map. One downside of
ChIA-PET and PCHi-C techniques is the higher rate of false negative peak calls
due to the techniques’ enrichment for specific interactions. These false negative
peaks would not get called in high-resolution Hi-C because they are not enriched

4
compared to their neighboring interactions. Further data normalization is
necessary to decrease such false negative peaks. Recently, another 3C-based
method, ‘‘split-pool recognition of interactions by tag extension’’ (SPRITE), was
developed to overcome the limitations of pair-wise interactions in Hi-C (Quinodoz
et al., 2018), this technique enriches for longer range and cluster of DNA
interactions. Like all other 3C-based methods, SPRITE relies on crosslinking of
proximal loci and DNA fragmentation. DNA, RNA, and proteins are crosslinked in
cells, nuclei are isolated, chromatin is fragmented and interacting molecules
within an individual complex are barcoded using a split-pool strategy. Finally,
DNA interactions are identified by sequencing and matching all reads that
contain identical barcodes, which enables genome-wide detection of multiple
DNA interactions that occur simultaneously within the nucleus (Quinodoz et al.,
2018).
3D genome during interphase
The fractal globule is an attractive model for the 3D genome as it lacks
knots and can facilitate polymer unfolding and refolding analogous to the
unfolding and refolding of chromatin segments that are known to occur during
gene activation, gene repression, or during the cell cycle. In a fractal globule,
contiguous regions of the genome tend to form spatial sectors whose size
corresponds to the length of the region and reflect the scaling of distance versus
interactions seen in the interphase nucleus by Hi-C (Lieberman-aiden et al.,
2009). The combination of microscopy and 3C-based methods was very

5
powerful in elucidating the different levels of genome organization, including
chromosome territories (CT) and active (euchromatin) and inactive
(heterochromatin) chromatin domains within CTs that tend to create separate
compartments with an average size of 3Mb. Within compartments, insulated
domains termed topologically associated domains (TADs) with an average size
of 400kb further segregate the linear genome. Each TAD is a cluster of many
genes and their regulatory elements (Fig. 1.1). Furthermore, 165 base pairs of
DNA is wrapped around a nucleosome, and the first level of nucleosome packing
is believed to produce a fiber of about 30 nanometers (nm) wide (Wu, Bassett, &
Travers, 2007). However, a 3D model of chromosome III in yeast that was
derived from 3C data, estimated a packing ratio of 11.1 nm/kb which allows
chromatin flexibility (J Dekker, Rippe, Dekker, & Kleckner, 2002)

6
Figure 1.1 Schematic of the different levels of genome organization in 3D
Chromosomal territories
Inside the nucleus, the spatial positioning of chromatin is not random.
Chromatin is organized into chromosome territories that reflect the physical
space each chromosome occupies during interphase (Cremer et al., 1982).
Employing chromosome painting coupled with FISH, it was observed that
chromosomes do not readily mix with other chromosomes. Each chromosome
occupies a distinct volume, or territory, in the nucleus ( Dekker & Misteli, 2015).
Chromosome territories were also detected in genome-wide Hi-C interaction
matrices (Lieberman-aiden et al., 2009). Moreover, the radial arrangement of the
chromosomes inside the nucleus is tissue and cell type specific, which suggests

7
that appropriate positioning of chromosomes within the nucleus, is important for
proper genes expression. Large and gene-poor chromosomes tend to localize
toward the nuclear periphery, while small and gene-rich chromosomes
preferentially localize near the center of the nucleus. For example, the positioning
of chromosome 18 ( gene-poor) near the periphery and chromosome 19 (gene-
rich) near the nuclear center has been observed in human lymphocytes (Thomas
Cremer & Cremer, 2010). Similar preferential location patterns have been
documented for all chromosomes in the human genome. Human chromosomes
13, 14, 15, 21, and 22, which are rich in ribosomal RNA genes, localize around
nucleolus. Finally, X chromosomes localize more peripherally in liver cells
compared to kidney cells (Parada, Mcqueen, & Misteli, 2004). Radial
chromosome position often differs in diseased cells. For instance, in pancreatic
cancer, chromosome 8 shifts to a more peripheral location. Similarly,
chromosomes 18 and 19 were shown to change nuclear location in various
cancers types, including cervical and colon cancer (Thomas Cremer & Cremer,
2010).
Interchromatin domain (ICD)
Chromatin painting of all chromosomes using FISH revealed that CTs are
insulated neighborhoods inside the nucleus. However, due to the limited local
resolution of chromatin painting, interchromatin domains (ICDs) between different
CTs were not detected. Higher-resolution cryo-FISH experiments revealed a
greater level of intermingling between neighboring chromosomes than was

8
previously assumed (Branco & Pombo, 2006). Loci located at the surface of CTs
interact with each other in a clustering manner once they are sufficiently close in
3D (Branco & Pombo, 2006). Interactions between loci from different
chromosomes were also observed in Hi-C. Large chromosomes tend to
intermingle with other large chromosomes, whereas the smaller and gene-dense
chromosomes also preferentially interact (Lieberman-aiden et al., 2009). These
preferential interminglings are consistent with the observations that large
chromosomes are more peripherally localized, smaller gene-dense
chromosomes tend to be more internally positioned in the nucleus, and
intermingling of chromosomes can occur for neighboring CTs (T Cremer &
Cremer, 2001). Furthermore, the ICD is not distributed randomly throughout the
entire surface of a CT but is specific to loci that are anchored to transcriptions
factories (PolII clusters) and splicing factories (Nuclear speckles) (Misteli, 2007).
The degree of intermingling of chromatin from different CTs correlates highly with
translocation frequency and is mediated by transcription (Branco & Pombo,
2006). For example, the clustering of chromosomes 12, 14, and 15, which
associate with each other with high frequency in mouse lymphocytes are
involved in chromosomal translocations in lymphoma (Parada, Mcqueen,
Munson, & Misteli, 2002). Evidence for polymerase-mediated loops between
genomic loci on different chromosomes exists in prokaryotes and eukaryotes
ranging from yeast to humans (Cook, 2002). Furthermore, depletion of
transcription results in less chromosome intermingling and rearrangements

9
(Branco & Pombo, 2006); indicating that transcription factories are stabilizing the
intermingling of transcribed loci at the surface of different CTs. These loci are
subject to high double-strand breaks which lead to a relatively high frequency of
translocation.
The following section discusses another well-established
compartmentalization of chromatin within the nucleus critical to the regulation of
gene expression; the active (A) and inactive (B) compartments.
Compartments
Based on simulations, a block copolymer consisting of alternating blocks
of monomers of different types with different affinities for each other can form
separate spatial compartments by microphase separation (Nuebler et al, 2018).
In an analogous way, active (euchromatin) and inactive (heterochromatin)
chromatin domains cluster to give rise to the A and B compartments,
respectively, in the mammalian genome. Segregation of the two types of
chromatin in the nucleus was first observed by electron microscopy and later
detected by 4C and Hi-C. Alternating A (active) and B (inactive) compartments
give rise to a nice checkboard pattern within each chromosome (Cis) and
between chromosomes (Trans) readily visible in Hi-C contact maps (Lieberman-
aiden et al., 2009).
It has been proposed that compartmentalization is driven by clustering of
loci with similar epigenetic marks once they are in close proximity in 3D, similar

10
to the microphase separation phenomenon described in the block copolymer
(Nuebler et al, 2018) (Lieberman-aiden et al., 2009) (Pieroo, Zhang, Lieberman,
Wolynes, & Onuchic, 2016) (Falk et al., 2019) (Erdel & Rippe, 2018) (Jost et al.,
2014) (Michieletto, Orlandini, & Marenduzzo, 2016) (Nuebler et al, 2018) (L. Liu,
Shi, Thirumalai, & Changbong Hyeon, 2018)(Shin et al., 2018). Based on Hi-C
data, the compartment pattern is cell-type specific, suggesting a role in genome
function. However, population Hi-C can not entangle if the compartment
patterns, emerge based on the average of population signal, or persist at the
single-cell level. Recently a very sophisticated imaging method enabled the
mapping of the spatial position of numerous genomic regions along individual
chromosomes by using multiplexed FISH (Wang et al., 2016a). In this study, 3D
tracking was performed for each 100kb loci in the middle of each TAD defined in
Hi-C along chromosome 21. The resulting mean spatial distance matrix from 120
copies of chromosome 21 shows a high correlation with the inverse of contact
frequency of Hi-C, with a Pearson correlation coefficient of 0.9. Further analysis
shows the Hi-C contact frequency was inversely proportional to the fourth power
of the mean spatial distance (Wang et al., 2016). Furthermore, the mean spatial
distance matrix also recapitulates the A and B compartment signal seen in Hi-C
population data. These results were able to answer a very important question
about the direct relationship between interaction frequency detected by Hi-C and
the spatial distance at the Mb scale. These data also affirm the existence of A
and B compartments in single cells, indicating that compartments are functional

11
clusters that emerge in every single cell for a potent genomic function (Shin et
al., 2018) (Wang et al., 2016).
Although initial Hi-C experiments (Lieberman-aiden et al., 2009) showed
two types of compartments, the Hi-C checkboard pattern of high-resolution Hi-C
reveals a subcompartmentalization of A to two distinct subcompartments and B
into three subcompartments. These subcompartments correlate with different
epigenetic marks (Rao et al., 2014) and were also validated in recent work by
the Belmont group using TSA-seq, a new mapping method that estimates the
mean chromosomal distance from a targeted protein (Chen et al., 2018).
Belmont and colleagues were able to relate these sub-compartments directly to
cytological structures observed by microscopy, such as speckles (mostly A1
domains) located in the nuclear interior and the peripherally located nuclear
lamina (B2 and B3), with the remaining Hi-C sub-compartments (A2, B1) located
in between (Chen et al., 2018).
Prior to Hi-C, many microscopy studies have shown compartmentalization
of different genomic processes that are reflected by clustering of the protein
factories necessary for each process throughout the nucleus. This clustering of
protein factories suggests that subcompartments can be driven by specific
colocalization of genomic loci based on their functional association with
appropriate subnuclear structures. For example, active loci localize to
transcription factories and splicing factories, while silenced chromatin interacts

12
with Lamin A and C (Misteli, 2007). Accordingly, transcription factories, also
called hot spots of transcription, have been visualized throughout the genome as
compartmentalized hubs anchoring transcription factories and polymerase. On
average, each transcription hub contains 65,000 copies of the polymerase
protein and 10,000 genes (Cook, 2002). One hypothesis for the function of these
hubs is that the regulation of multiple constituent genes in each cluster is
coordinated by their shared particular transcription factor composition.
Surprisingly, in vivo imaging has demonstrated that the transcription factories are
very dynamic (Gorski & Misteli, 2005), with an average residence time on
chromatin in the order of a few seconds (Phair et al., 2004). Another example of
clustering that was revealed by microscopy is DNA repair factories. Upon DNA
double-strand breakage, a very fast requirement of repair factors leads to the
formation of repair foci; which appear as clusters in the nucleus that are even
less homogeneously distributed throughout the nucleus compared to
transcription clusters (Misteli, 2007). These repair factors remain bound to
chromatin until they complete their task at the specific foci (Politi et al., 2005).
This principle of compartmentalization can thus provide the right environment for
efficient processing of many loci simultaneously and may stabilize the chromatin
fiber by anchoring them to the cluster.
Compartmentalization is also observed for other nuclear structures that
share clustering of highly dynamic proteins including nuclear bodies, Cajal
bodies, PML bodies, and speckles (Gorski & Misteli, 2005). In another study

13
examining the 3D organization of chromatin in different epigenetic states using
super-resolution imaging, the genome was partitioned into three groups. This
study classified genomic domains in Drosophila cells as transcriptionally active,
inactive, or Polycomb-repressed states. The chromatin in the three different
chromatin states was found to display a noticeable difference in packing density.
Furthermore, distinctly different from the self-similar organization displayed by
transcriptionally active and inactive chromatin, the Polycomb-repressed domains
are characterized by a high degree of chromatin intermixing within the domain,
and spatially exclude neighboring active chromatin to a much stronger degree
(Boettiger et al., 2016).
Finally, several recent studies have been conducted to understand how
microphase separation plays a role in genome organization inside the nucleus. In
one particularly elegant study, the authors demonstrate condensation and
clustering of DNA upon Hp1α binding in vitro (Larson et al., 2017). Staining of
HP1α in cells revealed largely clustered puncta for wildtype HP1α regardless of
phosphorylation status, but substantially more diffuse localization for an HP1α
mutant that is defective in dimerization and in vitro DNA-driven phase-separation
(Larson et al., 2017).
In summary, using 3C-based technologies and different microscopy
techniques, compartments have been found to result from preferential
interactions between loci with similar chromatin features, which may be explained

14
by microphase separation. This model is further motivated by the observed
partitioning of chromatin into a small number of types based on histone
modifications, which may entail different affinities for each other, and affect the
recruitment of HP1α and other proteins (Nuebler et al., 2018).
Compartmentalization model
A model that explains chromatin compartmentalization inside the cell
nucleus was recently developed by Leonid Mirny’s group (Falk et al., 2019). In
this study, they take advantage of the dramatic chromatin reorganization that
takes place during rod differentiation from thymocytes in which localization of
heterochromatin switches from the periphery to nuclear interior. Immunostaining
of SINEs and LINEs combined with FISH for pre-defined A and B loci revealed
that in inverted rod nuclei, euchromatin (A) is located at the periphery while
heterochromatin (B) is found more toward the center of the nucleus. However, in
the Hi-C contact matrix, no clear difference was seen for interaction frequencies
genome-wide in rod cells compared to thymocytes. This surprising observation
contradicts a prevailing theory that Lamina is the most important driver of
compartmentalization in the nucleus. Instead, this study suggests that the
nucleus has a mechanism that can compartmentalize heterochromatin and
euchromatin in a manner independent of the spatial nuclear location.
Leonid Mirny’s group in this study conducted a simulation that satisfies
phase separation theory (Flory-Huggins), and in which compartmentalization of

15
heterochromatin and euchromatin is independent of the spatial nuclear location.
They developed an equilibrium polymer model that represents chromosomes as
blocks copolymers, similar to other phase separation models of
compartmentalization (Flory-Huggins) with three different types of monomers:
euchromatin, heterochromatin, and pericentromeric constitutive heterochromatin
(which is unmapped by Hi-C but can be traced in microscopy) by modeling eight
different chromosomes. Pair-wise attraction parameters were set for all possible
chromatin-type interactions (A-A, A-B, B-B, B-C C-C and A-C) leading to 720
hypothetical permutations. The only permutations that could drive inverted and
conventional genome structure in the simulations were heterochromatin
interactions in order of strength: A-B < A-C < B-B < B-C < C-C. When A-A
interactions were assigned to have stronger attractions, globules formed in the
middle of the nucleus. When C-B heterochromatin interactions were
strengthened in the model, mixing between B and C occurred and when B-C was
set as very weak C-domains tended to be expulsed from the center. Finally, by
changing only B-B attraction and keeping the order of strength they indicated
above, an optimum fit was found that satisfies all the criteria of the inverted
nucleI (Falk et al., 2019). In this case, B-B interactions are similar to B-Lamina
interactions because there was no change in the epigenetic marks of loci
connected to Lamin in conventional nuclei compared to the centrally located B-B
chromatin in the inverted nuclei. A time course of inversion was modeled based
on all the criteria, reflecting a smooth inversion similar to what was seen by

16
microscopy. This study concluded that heterochromatin interactions is what
drives all compartmentalization in the genome, while B and lamina attraction
controls the global spatial morphology.
Topologically associating domain (TAD)
At the level of subcompartments, the genome is organized in distinct
insulated blocks of chromatin with enriched interactions and an average size of
400kb called topologically associating domains (TADs) (Nora et al., 2012)
(Jesse R Dixon et al., 2012). Ninety percent of TADs are insulated from the
neighboring region by CTCF-enrichment at their boundaries (Nora et al., 2012),
which is thought to play a role as an insulator against interactions between loci
located in different topological domains. TAD boundary positioning is conserved
during differentiation and in different cell types, tissues, and species (Job
Dekker & Heard, 2015) although the internal organization of a TAD for a given
genomic region in mouse ESCs, NPCs, and primary MEFs revealed some
differences (Nora et al., 2012), suggesting that not all aspects of TAD structure
are tissue invariant. High-resolution Hi-C shows another feature of some TADs,
namely an enrichment of interactions for 50% of TADs between convergent
CTCFs at the boundaries that give rise to visible corner peaks ( Rao et al.,
2014). Because of the prevalence of TADs as robust chromatin domains that
display favorable interactions between the loci within them and a strong
depletion of interactions between loci located in different domains, numerous
studies in recent years were aimed at answering the following questions: Are

17
TADs functional domains? Can CTCF act alone to insulate TADs at the
boundaries? What mechanism is robust enough to build TADs throughout the
whole genome after exiting mitosis? Are TADs static or dynamic blocks?
TADs in single cells
In order for a TAD to be a functional unit, it should persist in every single
cell. This question could not be answered by Hi-C, since Hi-C contact probability
matrices are built from averaging the interactions across a population of cells. A
single cell study using Hi-C confirmed that TAD domains exist at the single cell
level (Takashi Nagano et al., 2013). Single cell Hi-C performed for 60 cells,
revealed domain-like structures with a size range from 100 kb to 1 Mb. Using
1,403 TADs called in population Hi-C for the same cell line, a statistical analysis
of the ratio of intra to inter-domain contact at the single-cell level shows a two-
fold enrichment of interactions within the domains.
Another single cell study aimed at visualizing TADs used a super-
resolution chromatin tracing method that enabled the identification of 3D locale
for specific genomic coordinates, similar to the multiplexed FISH technique
discussed in an earlier section of this thesis regarding compartments. In order to
query TADs, each 1.2 to 2.5 Mb region of interest was partitioned into
consecutive 30-kb segments with unique probes. Each probe was then labeled
and imaged following a sequential hybridization protocol and spatial distances
and overlap between loci were determined (Bintu et al., 2018). The resulting

18
ensemble matrix which averaged thousands of cells shows a high correlation
between the mean spatial distance determined by super-resolution chromatin
tracing and interaction frequencies determined by Hi-C, with a Pearson
correlation of -0.92 and power-law scaling between Hi-C contact frequencies and
spatial distance on the kb scale. This study observed TAD-like domain structure
at single cell level, although some of the domain boundaries display cell-cell
variation, which could be due to the short residency of CTCF on chromatin which
may generate variability from cell-cell at any given moment (Bintu et al., 2018).
Accordingly, more frequently observed boundaries correlated with stronger CTCF
and cohesin peaks defined in population ChIP data.
The fact that TAD structure persists in single cells supports the proposition
that TADs act as functional blocks of chromatin that regulate gene expression. In
agreement with this function for TADs, it was shown that gene expression is
preferentially correlated for genes within the same TAD versus genes located in
neighboring TADs (Nora et al., 2012). Another study using transposable
elements to insert reporter genes randomly throughout the genome (Symmons et
al., 2014), found that when a series of these reporter genes ended up at the
same continuous domain, correlating with TAD, they exhibit very similar tissue-
specific expression.
TAD boundaries and gene regulation

19
Another important question pertains to the role of TAD boundaries in the
regulation of gene expression by coordinating the cell-type appropriate
communication between genes and their regulatory elements. Enrichment of
small deletions in the TAD boundaries at CTCF sites adjacent to the LMO2 proto-
oncogene, was detected in T-cell lymphoblastic leukemia patients. Patient cells
that harbored these small deletions were found to have a high level of LMO2
expression (Hnisz et al., 2016). To analyze whether loss of the CTCF sites
specifically drives the increase in gene expression, a Cas9 mediated deletion at
the same regions in the leukemia patients was performed at two different
boundaries near LMO2 and TAL1 in nonmalignant cells. In both cases, deletion
led to the disruption of insulation between the neighboring TADs, and an
increase of 2- and 2.3-fold in the expression of the LMO2 and TAL1 genes,
respectively (Hnisz et al., 2016). In another study by Lupianez and co-workers,
CRISPR/CAS9 was used to induce deletions and inversions at the TAD
boundaries that cover the key loci for limb development in mouse: WNT6, IHH,
EPHA4, and PAX3. These CRISPR-dependent rearrangements induced rewiring
of gene–enhancer interactions and disruption of insulation domains (TADs).
Interestingly, an inversion around a TAD boundary was able to rearrange the
proximal TADs and led to abnormal long-range interactions between key genes
and enhancers and downstream limb malformation (Visel & Mundlos, 2015).
Taken together these data suggest that TADs are functional blocks with

20
boundaries that control normal long-range interactions between genes and their
regulatory elements and inhibit aberrant interactions.
Models for TAD formation
Numerous models have been proposed to explain the physical and
molecular mechanisms underlying TAD formation and insulation in the
boundaries. One of these models entails TAD formation by preferential
interactions between loci with similar epigenetic landscapes, which results in
domains wherein all loci possess similar epigenetic marks (Barbieri et al., 2012)
(Jost et al., 2014). This mechanism fails to explain TAD formation for two
reasons: First, the preferential interaction of loci would lead to an alternating
pattern in the Hi-C contact matrix analogous to what is seen for compartments
and this is not the case (Job Dekker & Mirny, 2016). Secondly, a model based on
preferentially associating loci cannot explain the spreading of interactions across
two neighboring TADs after the deletion of a boundary, as described above.
Another proposed mechanism for the observed insulation at boundaries is
unconstrained supercoiling driving domain-like structures (Benedetti, Dorier,
Burnier, & Stasiak, 2014). However, this model is not able to explain the
enrichment of interactions between TAD boundaries (Fudenberg et al., 2015).
In order for a model to explain the TAD, it must satisfy several criteria (Job
Dekker & Mirny, 2016): 1) efficient establishment of interactions that spread to
1Mb, 2) conserved in different cell lines, with minimal cell to cell variation which

21
means that boundaries are site-specific, 3) constant insulation at the boundaries
by CTCF and other proteins, and 4) accounts for the spreading of interactions
between TADs after boundary deletion. A loop extrusion model that satisfies all
these principles was proposed by several groups (Alipour & Marko, 2012)
(Fudenberg et al., 2015) (Sanborn, Rao, Huang, Durand, & Huntley, 2015)
(Bouwman & Laat, 2015) (Nichols & Corces, 2015) and successfully reproduces
quantitatively and qualitatively the TADs observed in high resolution in situ Hi-C
data. Based on polymer simulations of chromatin fibers, a simple loop extrusion
motor (cohesin) can form dynamic, growing and dissociating loops (Fig. 1.2)
(Fudenberg et al., 2015). The key that allows the loop extrusion models to
recapitulate the Hi-C TAD-like structure is that extrusion machinery recruited to
the chromatin fiber enlarges the loop until it touches another extrusion machine
or is halted at the boundary by proteins, such as CTCF or PolII at a TSS (Nuebler
et al, 2018). Loop extrusion can only act in cis and for loci that are 120-400kb
apart and can not extrude loci at larger 1D distances or on different
chromosomes (Nuebler et al, 2018). This emerging model highlights CTCF and
cohesin as the most important players for TAD formation, with two distinct roles;
cohesin is the motor that extrudes and enlarges the loop to package DNA and
CTCF defines the sites of boundaries. At its inception, this loop extrusion model
was very hypothetical and was criticized due to the fact that according to cohesin
residency time and ATP dependency to function as a motor, it cannot efficiently
generate the rapid processivity required to make 100 kb to 1 Mb domains. In

22
order for this model to be validated (Fig. 1.2), it is thus invaluable to determine
whether cohesin can indeed act as an efficient motor that satisfies the model. In
the next section, I discuss the crucial experimental evidence that cohesin and
CTCF are the main players in the formation of TADs by loop extrusion in
interphase chromatin.
Figure 1.2 : A simple schematic of loop extrusion
Depletion of TAD building elements
One of the first studies that depleted CTCF to study its effect on TAD
structure used an auxin-inducible degron system in mouse embryonic stem cells.
CTCF depletion led to the disappearance of TADs by the loss of insulation at
TAD boundaries or a reduction of intra-TAD interactions compared to the level of
inter-TAD interactions in Hi-C data. Recovery of CTCF levels could reestablish
proper TAD structure on affected chromosomes (Nora et al., 2012). On the other

23
hand, intra-TAD FISH distances were unaffected by CTCF depletion, indicating
that loss of CTCF does not trigger global chromatin reorganization. Finally, gene
expression was altered upon CTCF depletion with upregulated genes typically
located less than 200 kb from their enhancers across a TAD boundary (Nora et
al., 2012). This study supports the notion that CTCF is a powerful and necessary
element for insulating TAD boundaries promoting normal long-range interactions
within a TAD and preventing undesired long-range interactions between genes
and enhancers in neighboring TADs.
In order to deplete chromatin-associated cohesin, the cohesin-loading
factor Nipbl was depleted in mouse liver, leading to global reorganization of
chromosomal folding. In the Nipbl-depleted background, TADs and CTCF-CTCF
peaks dissolve globally and independently of gene expression (Schwarzer et al.,
2017). Both CTCF and cohesion depletion dissolve TADs; however, only the
loss of chromatin-associated cohesin led to changes in DNA compaction at the
level of intra-TAD (Nora et al., 2012)(Schwarzer et al., 2017). These observations
suggest that TADs are cohesin-dependent and that CTCF and cohesin have
essential and distinct roles in TAD formation. Cohesin is responsible for
chromatin condensation, probably by loop extrusion, and CTCF dictates the TAD
boundaries by halting cohesin at specific sites (Gassler et al., 2017) (Nuebler et
al, 2018).

24
In contrast to Nipbl, WAPL limits the residence time of cohesin on
chromatin by unloading it. Depletion of WAPL results in increased cohesin on
chromatin and an increase in the strength and the number of CTCF-CTCF, and
the loops accumulate in an axial structure called “vermicelli” (Wutz et al., 2017).
In heatmaps of contact probability from Hi-C data, up to three regions of strong
interaction frequency can be seen for each CTCF anchor (Haarhuis et al., 2017).
Taken together, these results indicate that cohesin loading and unloading is very
well balanced by NIPL and WAPL under normal physiological conditions in order
to generate and maintain proper genome structure (Nuebler et al, 2018).
Finally, inspiring work by Terakawa and co-workers examined the
biophysical mechanism of condensin translocation along DNA in vitro using
single-molecule imaging. The results show that condensin is a molecular motor
capable of ATP hydrolysis-dependent translocation along double-stranded DNA
in a very efficient manner (Terakawa, Bisht, Eeftens, Dekker, & Haering, 2017).
Condensin’s translocation activity is rapid and highly processive, with individual
complexes traveling an average distance of ≥10 kilobases at a velocity of ~60
base pairs per second (Terakawa et al., 2017). Both condensin and cohesin have
SMC proteins, and a distinguishing feature of SMC complexes is their large ring-
like configuration that exists in both condensin and cohesin. This similarity
suggests that cohesin may act as a motor with the capacity to translocate
efficiently and provide an adequate driving force for loop extrusion during
interphase.

25
The interplay between TADs and compartments
The existence of different levels of genome folding, such as several TADs
inside one compartment, could imply hierarchical folding of chromatin. Because
TADs are the invariant building blocks of chromosomes and in a given cell type
consecutive TADs of a similar epigenetic profile cluster in one compartment, it
has also been proposed that the larger cell type-specific compartments are
formed through a process of self-assembly of these smaller TADs (Job Dekker,
2014) (Gibcus & Dekker, 2013). However, as described in the previous section
of this thesis regarding TADs, depletion of CTCF and chromatin-bound cohesin,
decreased TAD structure without having a major effect on compartments,
suggesting distinct mechanisms for TAD and compartment formation.
Compartments are remarkably resistant to CTCF depletion despite
dramatic changes happening at the TAD level, indicating that compartments are
established independently of CTCF (Nora et al., 2012). Compartments were not
only resistant to chromatin-associated cohesin depletion, but small
compartments emerged and the overall strength of compartments increased
(Schwarzer et al., 2017). The opposite effect was achieved by increasing the
residence time and the number of cohesin molecules on chromatin by deleting
WAPL. In this case, TADs were sharper and CTCF-CTCF loops were stronger
while compartmentalization weakened relative to the control (Extension et al.,
2017). These results suggest that the molecular mechanisms that build TADs
and compartments are independent. Furthermore, the cohesin motor is

26
responsible for attenuating compartmentalization in wildtype cells since CTCF
removal did not have any effect in compartments while chromatin-bound cohesin
depletion strengthened compartments. Therefore, TADs and compartments do
not represent a hierarchy in the folding of mammalian chromosomes (Nuebler et
al., 2018).
These depletion experiments offer a resource that can be further
investigated by simulation modelling. In one such study by Johannes and
colleagues, a polymer model that includes compartmentalization (by microphase
separation) was integrated with loop extrusion in order to examine how an active
loop extrusion mechanism affects compartmentalization and to determine
whether the interplay between the two mechanisms can explain the biological
data for cohesin and CTCF depletion. In order to address compartmentalization
a copolymer composed of A (euchromatin) and B (heterochromatin) blocks was
modelled such that the differential attraction between A and B versus the
attraction within like compartments leads to phase separation and reproduces the
compartmentalization observed in Hi-C datasets. If the conditions conducive to
loop extrusion are removed from the model TADs disappear and compartments,
particularly the smaller ones, become more pronounced, in perfect agreement
with the cohesin depletion experiments (Schwarzer et al., 2017) (Wutz et al.,
2017) (Nuebler et al., 2018). Furthermore, depletion of loop extrusion in this
model enhanced compartments of 500 kb to 2 Mb in size but did not affect
compartments greater than 2 Mb. The phenomenon of a length-dependent

27
transition is known from the physics of block copolymers. It occurs when the
product of segment length and compartmental interaction parameter exceeds a
critical value as described by the Flory-Huggins theory. In this copolymer
simulation, adding loop extrusion shifts this phase transition to larger segments
of ~ 1 Mb. For example, 800-kb segments are segregated in the absence of loop
extrusion but get mostly mixed in its presence. These results suggest that loop
extrusion counteracts the innate phase separation of small compartments, and
thus only larger-scale compartmentalization is visible in a wildtype mammalian
cell (Nuebler et al., 2018). A further investigation using the same copolymer
model that combines phase separation and loop extrusion demonstrates that
dynamic loop extrusion reflects experimental Hi-C data in terms of the strength
for both TADs and compartments compared to static loop with simulation of loop
extrusion (loops remain static after their formation by loop extrusion, while the
chromatin fiber is subject to thermal motion) . These results also suggest that the
motor-dependent dynamic loop extrusion mechanism is much faster than phase
segregation, given that the chromatin fiber has less time to resegregate by
microphase separation for small compartments before the passage of cohesin.
Finally, changing the volume occupied by the polymer in the simulation,
increased compartmentalization but had no effect on TADs (Nuebler et al., 2018).
Promoter enhancer interactions
Promoter enhancer interactions within TADs

28
In the mammalian genome, only 22% of the active genes form looping
interactions with the nearest regulatory element, indicating that genomic
proximity is not a good predictor of promoter-enhancer interactions (Amartya
Sanyal, Lajoie, Jain, & Dekker, 2012). The long distance separating genes from
regulatory elements raised the need for detection of the specific physical pair-
wise interactions in order to understand the impact of long-range interactions on
gene expression. Looping interactions are more common for active genes
compared to silent ones (Misteli, 2007). Accordingly, loops detected by 5C in
three different cell lines show enrichment for histones with modifications that are
characteristic of active functional elements: H3K4me1, H3K4me2, and
H3K4me3. Loops are also enriched for H3K9ac and H3K27ac, but significantly
depleted for H3K27me3, a mark typically found at inactive or closed chromatin
(Amartya Sanyal et al., 2012). Many of the promoters, for example in the case of
the HoxD gene, interact with multiple regulatory elements, which results in a
complex network of interactions (Andrey et al., 2013).
As we described earlier, TADs are highly conserved but intra-TAD
interactions tend to be cell-type specific, possibly reflecting a role in regulated
gene-expression (Nora et al., 2012). Direct contact between enhancers and
promoters is controlled by the insulation in TAD boundaries such that the majority
of promoter-enhancer interactions ( ~ 88%) occur within a TAD (Dowen et al.,
2014). One well-known example of enhancer-promoter loops is the locus control

29
region (LCR) regulatory elements and the β-globin gene which interact in
erythroid cells (k562) but not in other cell types.
Long-range promoter-enhancer interactions
On the other hand, some promoter-enhancer interactions resist the
insulation at the TAD boundary to form giant loops greater than 1 Mb in size
(Yashiro-ohtani et al., 2014) (Allahyar et al., 2018)(Dostie et al., 2006). These big
loops can be explained by the positioning of promoters and enhancers that are
engaged in very long looping interactions relatively near to their TAD boundary
and their interaction with a CTCF hub. Interactions between multiple CTCF
molecules at boundaries can lead to the formation of rosette-like structures that
bring the promoters and enhancers from neighboring TADs in sufficiently close
proximity to form a loop (Allahyar et al., 2018).
Super-enhancers
Super-enhancer interaction networks invoke a large level of transcription
of their associated genes. A recent study that probed super-enhancer and
promoter interactions using ChIA-PET, found that the majority of super-
enhancers possess a very unique chromatin feature. A super-enhancer and its
associated genes are located within a loop connected by two interacting CTCF
sites co-occupied by cohesin and enriched for mediator, which forms a super
enhancer insulated domain within a TAD (Dowen et al., 2014). This observation
supports a previous study, showing that loops mediated by cohesin and CTCF

30
tend to be larger and more conserved across multiple cell types compared to
promoter-enhancer loops associated with cohesin and Mediator (Phillips-
cremins et al., 2013). These cell type-specific Mediator/cohesin loops bridge
short-range enhancer-promoter interactions within and between larger
subdomains in cells where they are expressed (Phillips-cremins et al., 2013). In
contrast, the insulated subdomains that contain super-enhancer are persistent in
cell types in which their target genes are silenced and enriched for polycomb
proteins instead of mediators. The proper association of super-enhancers and
their target genes in such ‘‘insulated neighborhoods’’ is of considerable
importance, as the mistargeting of a single super-enhancer is sufficient to cause
leukemia (Sanders et al., 2014).
Interchromosomal enhancer-promoter interactions
There are many well-known instances of genes that are regulated by
interchromosomal interactions. For example, in naive T cells, the γ locus on
chromosome 10 and the Th2 interleukin locus on chromosome 11 form a cluster
of interchromosomal interactions (Spilianakis, Lalioti, Town, Lee, & Flavell,
2005) (Noordermeer et al., 2011). Similarly, the interaction between super-
enhancer LCR elements with the β-globin gene can occur in both cis and trans
(Noordermeer et al., 2011), although the trans interactions happen in a very
small fraction of cells in a population as chromosomes territories are not
homogeneously distributed. In order for specific trans-chromosomal interactions
to occur, the two chromosomes containing the promoter and enhancer have to

31
land near each other in the nucleus. In one example, extrachromosomal loops
are induced upon activation of the mouse Hox cluster and the synchrony of this
movement with the activation kinetics of the Hox cluster suggests a functional
link (Chambeyron & Bickmore, 2004).
One of the most striking interchromosomal interactions between genes
and their regulatory elements occurs in mouse olfactory receptors (OR) that are
encoded by more than 1,000 olfactory receptor genes (Buck & Axel, 1991). The
clustering of more than 1,000 OR genes from 18 chromosomes forms
heterochromatin domains in both cis and trans, (Markenscoff-papadimitriou et al.,
2014). Interestingly, in each mature olfactory sensory neuron only one single
olfactory receptor gene is activated (Lomvardas et al., 2006). The activation of
one specific OR occurs within the robust interchromosomal hub of 68 intergenic
olfactory receptor enhancer ‘Greek islands’ which are enriched for the specific
transcription factor LHX2 and LBD (Markenscoff-papadimitriou et al., 2014).
Depletion of transcription factor LHX2 or LDB1 mediator results in a strong
reduction of the cis and trans-Greek island interactions and widespread
transcriptional downregulation (Alexander et al., 2019). These results indicate a
direct role of the cooperative effort between the specific OR transcription factor
LHX2 and LDB1 mediator in maintaining long-range interactions to bridge the
active gene with its enhancers, and additionally, imply a vital role for long-range
cis and trans interactions in regulated gene expression.

32
Biophysical processes that form chromosome conformation Major new questions revolve around the molecular and biophysical
processes by which different aspects of chromosome conformation form.
Significant progress has been made in developing and testing mechanistic
models for TAD and loop formation. The model that currently has most
experimental support proposes that TADs and CTCF-CTCF loops form via loop
extrusion performed by the cohesin complex (Alipour & Marko, 2012)(Fudenberg
et al., 2015) (Sanborn et al., 2015) (Bouwman & Laat, 2015) (Nichols & Corces,
2015)(Schwarzer et al., 2017). In this model, loop extrusion proceeds until the
complex encounter a CTCF protein bound to a CTCF site in the convergent
orientation. As a result, CTCF-CTCF loops form, and interactions between loci
located between convergent CTCF sites are generally increased (TADs). The
mechanisms of loop extrusion are not known in detail yet, but may involve the
cohesin ring encircling strands of DNA at the bases of loops in a topological or
pseudo-topological manner (Schwarzer et al., 2017) (Ivanov & Nasmyth,
2005)(Kagey et al., 2010)(Srinivasan et al., 2018).
Also much less in know about the processes that determine nuclear
compartmentalization. Mechanisms of compartmentalization are distinct from the
formation of TADs and loops, as mutations in CTCF or cohesin disrupt TADs but
not compartmentalization per se (P. Nora et al., 2017) (Nuebler et al., 2018)
(Haarhuis et al., 2017) (Extension et al., 2017) (Glenn, Hilaire, Casellas, Lander,
& Aiden, 2017) (Schwarzer et al., 2017)(Wutz et al., 2017). Compartmentalization

33
has been proposed to be the result of polymer phase separation driven by
attractions between chromatin domains of the same or similar status (Lieberman-
aiden et al., 2009) (Pieroo et al., 2016) (Falk et al., 2019) (Erdel & Rippe, 2018)
(Jost et al., 2014) (Michieletto et al., 2016) (Nuebler et al, 2018) (L. Liu et al.,
2018)(Shin et al., 2018). Polymer models simulating such attractions can
reproduce the plaid pattern characteristic of Hi-C interaction maps (Jost et al.,
2014) (Michieletto et al., 2016) (Pieroo et al., 2016) (Falk et al., 2019). However,
the molecular and biophysical basis of these attractions is unknown. Possibly
these attractions result from co-association of domains with sub-nuclear bodies
that themselves appear to form by a process of liquid-liquid phase separation
(Feric et al., 2016) (Larson et al., 2017) (Marzahn et al., 2016) (Strom &
Alexander, 2017). An example is the interactions between heterochromatic loci
driven by multivalent interactions among HP1 proteins and between HP1 proteins
and H3K9me3-modified chromatin domains (Larson et al., 2017) (Strom &
Alexander, 2017).
The formation of spatially segregated heterochromatic and euchromatic
domains can be viewed as microphase separation of a polymer composed of
different types of monomers (loci). For instance, a “block copolymer” is a polymer
that contains a series of alternating blocks (e.g., A-type and B-type, or blocks of
euchromatin and heterochromatin), each composed of multiple monomers (A
monomers and B monomers (Fig. 1.3). When As attract As and Bs attract Bs,
such polymer can fold into spatially segregated domains of As and Bs (Fig. 1.3)

34
(Michael Rubinstein & Colby-standand, n.d.) (Leiblerf, 1980) (Matsen & Schick,
1994). A key point is that the A and B blocks of a copolymer cannot
macroscopically phase separate because they are connected: copolymers
undergo microphase separation, forming microdomains of sizes comparable to
the polymer coil size of the individual blocks. Applied to chromatin in vivo,
microphase separation may underlie the formation of chromatin interaction
domains. However, the biophysical forces and interaction dynamics that
determine chromosome compartmentalization in cells are not known.
Whether microphase separation of a block copolymer occurs depends on
the interaction strengths between monomers as well as the lengths of the blocks
of monomers of each type (Fig. 1.3). Flory-Huggins polymer theory predicts that
spatial segregation will occur when the product of the length of the blocks (N, the
number of monomers that make up blocks) and their effective preferential
homotypic interaction strength ( א, a parameter that represents the difference in
the strength of homotypic interactions as compared to heterotypic (A-B)
interactions) is larger than a critical value C (Leiblerf, 1980) (Matsen & Schick,
1994). Large blocks of a polymer can spatially segregate even when attractive
interactions among monomers are weak, while short blocks will only phase
separate when interactions are sufficiently strong. Given that in mammals,
domains of heterochromatin and euchromatin are typically large (hundreds of kb
up to several Mb), spatial segregation can occur even when attractive forces
between monomers (loci) are weak. Thus, a wide range of interaction strengths

35
between loci within A and B compartments could lead to a spatially segregated
genome. The corollary is that observation of spatially compartmentalized
chromosomes per se, e.g., by Hi-C, does not provide quantitative information
about the strength of the interactions that drive this organization. Should
quantitative measurements of chromatin interaction strength or stability be
available genome-wide, such data would allow deeper molecular understanding
of the mechanisms leading to chromosome and nuclear compartmentalization, by
relating these measurements to binding of specific factors, association with sub-
nuclear structures, and the presence of chromatin modifications and processes
such as transcription and replication. In Chapter V we will describe a strategy
that allows quantitative measurements of chromatin interaction stability be
available genome-wide, we call liquid chromatin Hi-C.
Figure 1.3: Block copolymer folds into spatially segregated domains
A: Block copolymer composed of a series of alternating A and B blocks, each composed of a number of monomers (left). The polymer can fold into spatially segregated domains of As and Bs (middle). Flory-Huggins polymer theory predicts that spatial segregation will occur when the product of the length of the blocks N (the number of monomers that make up blocks) and their effective preferential homotypic interaction strength Ҳ(difference in the strength of homotypic interactions as compared to heterotypic (A-B) interactions) is larger than a critical value C.

36
CHAPTER II: Hi-C 2.0: an optimized Hi-C procedure for high-resolution genome-wide mapping of chromosome conformation
PREFACE The content of this chapter is a part of the following publication: Houda
Belaghzal1, Job Dekker1, 2*, Johan H. Gibcus1. Methods. 2017 Jul 1;123:56-65.
doi: 10.1016/j.ymeth.2017.04.004. Epub 2017 Apr 18.
Abstract Chromosome conformation capture-based methods such as Hi-C have become
mainstream techniques for the study of the 3D organization of genomes. These
methods convert chromatin interactions reflecting topological chromatin
structures into digital information (counts of pair-wise interactions). Here, we
describe an updated protocol for Hi-C (Hi-C 2.0) that integrates recent
improvements into a single protocol for efficient and high-resolution capture of
chromatin interactions. This protocol combines chromatin digestion and
frequently cutting enzymes to obtain kilobase (Kb) resolution. It also includes
steps to reduce random ligation and the generation of uninformative molecules,
such as unligated ends, to improve the amount of valid intra-chromosomal read
pairs. This protocol allows for obtaining information on conformational structures
such as compartment and topologically associating domains, as well as high-
resolution conformational features such as DNA loops.

37
INTRODUCTION The spatial organization of chromatin has been a topic of study for many years
since chromatin conformation, and long-range associations between genes and
distal elements are thought to play important roles in gene expression regulation
and other genomic activities. The concept that dense matrices of chromatin
interactions could be used to determine the spatial organization of chromatin
domains, chromosomes and ultimately entire genomes, was first introduced in
the original publication that described the chromosome conformation capture
(3C) method (Job Dekker et al., 2002). This concept was then tested by the
development of the 3C technology, its application to yeast chromosomes, and
analysis of interaction data using polymer models. This led to the first 3D model
of a chromosome.
In 3C, chromatin is first fixed with formaldehyde to covalently link spatially
proximal loci. This is essential for efficient detection of chromatin interactions, as
leaving out cross-linking leads to the dramatic loss of detected contacts and, in
our hands, inability to detect chromatin conformation beyond a few Kb.
Chromatin is then fragmented with a nuclease and ends are re-ligated. This
leads to unique ligation products between spatially proximal loci that can then be
detected by PCR, ligation-mediated amplification, or direct sequencing.
The concept of using matrices of contact frequencies to infer chromatin folding,
and its proof-of-principle in yeast (J Dekker et al., 2002) has led to many new
studies and the development of a range of 3C-based assays with increased

38
throughput including 4C (Simonis et al., 2006; Z. Zhao et al., 2006), 5C
(Ferraiuolo, Sanyal, Naumova, Dekker, & Dostie, 2012; Smith, Lajoie, Jain, &
Dekker, 2016) and ChIA-PET (M J Fullwood, Han, Wei, Ruan, & Ruan, 2010).
Hi-C was introduced in 2009 (Lieberman-Aiden et al., 2009) as a genome-wide
version of 3C (J Dekker et al., 2002). The incorporation of biotinylated
nucleotides at the digested DNA ends prior to ligation allowed for the specific
capture of digested and subsequently ligated chimeric molecules using
streptavidin-coated beads. These chimeric molecules are then directly
sequenced, e.g. on an Illumina platform. Since its introduction, the technique
has gone through several stages of optimization. We have previously presented
a base protocol that used incorporation of biotinylated dCTP in an overhang
generated by HindIII digestion (Belton et al., 2012).
Here we describe Hi-C 2.0, a further optimized Hi-C protocol that integrates
several recent technical improvements in one single protocol. One adaptation to
the base protocol is the removal of a SDS solubilization step after digestion to
better preserve nuclear structure . This prevents random ligation between
released chromatin fragments by ligation in situ, i.e. in intact nuclei (Takashi
Nagano, Várnai, et al., 2015). This adaptation was first introduced for 4C
(Splinter, de Wit, van de Werken, Klous, & de Laat, 2012) and has since been
used for single cell Hi-C (T Nagano et al., 2013; Takashi Nagano, Lubling, et al.,
2015) and more recently for Hi-C ( Rao et al., 2014). A second adaptation in
recently developed protocols increases the resolution of Hi-C through the use of

39
restriction enzymes that digest more frequently, such as MboI and DpnII, or
nucleases such as DNaseI and Micrococcal nuclease (T.-H. S. Hsieh,
Fudenberg, Goloborodko, & Rando, 2016; T. H. Hsieh et al., 2015; Ma et al.,
2014; Rao et al., 2014). Thirdly, experimental steps can be included to reduce
the number of uninformative sequences such as unligated (“dangling”) ends. This
is important because even though many topological structures, including
compartments and topologically associating domains (TADs) can effectively be
resolved by binning 100 million valid pair reads at 100 kb and 40 kb resolution
respectively (Bernardi, 2015; J R Dixon et al., 2012; Nora et al., 2012; Valton &
Dekker, 2016), detection of point-to-point looping interactions, e.g. between
promoters and enhancers or between pairs of CTCF sites typically require >1
billion valid pairs ( Rao et al., 2014). Therefore, steps to increase the fraction of
informative intra-chromosomal reads will help reduce cost by increasing the
relative quantity of valid pairs. Removing dangling ends is also important
because a sub-population of dangling ends can appear as valid interactions
between adjacent restriction fragments. As we describe below, this subgroup
can be as large as ~10% of reads, and can represent a large fraction of
interactions detected over short distances. This in turn can influence subsequent
data analysis (section 3.1).
Alternative approaches to determine chromatin interactions for specific regions of
interest in a more cost-effective way include targeted approaches such as 4C
(Simonis et al., 2006; Z. Zhao et al., 2006), 5C (Ferraiuolo et al., 2012; Smith et

40
al., 2016), capture Hi-C (Mifsud, Tavares-Cadete, et al., 2015) and Capture C
(M J Fullwood et al., 2009; Hughes et al., 2014).
Here we describe Hi-C 2.0 which uses the DpnII restriction enzyme, in situ
ligation, and efficient unligated ends removal. A detailed step-by-step protocol is
provided In method section.
MATERIALS AND METHODS
Hi-C 2.0
Hi-C was performed as described {Belaghzal, 2017 #1369} with some
modifications in the crosslinking and lysis step as described below.
Crosslinking: isolated, undigested, and pre-digested (with liquified
chromatin) nuclei were not pelleted after the pre-digestion step above but were
crosslinked immediately as follows: for each sample 1,250 µL volume of nuclei in
the digestion buffer was transferred to a 21.875 mL mix [625 μL of 37%
formaldehyde + 21.25 mL of HBSS]. For intact cells: 5 million K562 cells or nuclei
were washed twice with 15 mL of HBSS and pelleted at 300 g for 10 min, then
resuspended in 2.5 mL of HBSS. The sample was transferred to 20.625 mL
crosslinking mix [625 μL of 37% formaldehyde + 20 mL of HBSS]. All samples
were incubated at RT for 10 min on a rocking platform. Next, to stop cross-linking
1.25 mL of 2.5 M glycine was added to each sample and the mix was incubated

41
at RT for 5 min on a rocking platform. To pellet the crosslinked cells/nuclei, the
sample was centrifuged at 1,000 g for 10 min at 4°C. The supernatant was
discarded and the pellet was washed twice with HBSS before going to the next
step or storing samples at -80°C.
Cells lysis: This step is not needed for isolated, undigested, and pre-
digested (with liquified chromatin) nuclei. For Hi-C with intact cells: the 5 million
crosslinked cells were lysed by adding 1 mL cold lysis buffer [10 mM Tris-HCl
(pH=8.0), 10 mM NaCl, 0.2% Igepal CA-630 (NP40)] and 10 µL of 100X
Protease inhibitors. The sample was incubated on ice for 15 min to let the cells
swell. The cells were lysed on ice using a dounce homogenizer with pestle A
(KIMBLE Kontes 885300-0002) by moving the pestle slowly up and down 30
times and incubating on ice for 1 min followed by another 30 strokes. The sample
was transferred to a new 1.5 mL microcentrifuge tube, and the sample was
centrifuged at 5,000 g at RT for 5 min.
Digestion: from each sample (isolated undigested, and pre-digested
(with liquified chromatin) nuclei and lysed cells) the pellet was resuspended in
500 μL of ice-cold 1X NEBuffer 3.1, and pelleted for 5 min at 4,000 g. The pellet
was washed twice using 500 μL of ice-cold 1X NEBuffer 3.1. After the last wash,
the pellet was resuspended in 350 µL 1X NEBuffer 3.1, and 8 µL was taken and
kept at 4°C to assess the DNA integrity later. 38 μL of 1% SDS was added to 342
µL (380 µL total volume), and the mixture was resuspended and incubated for 10
min at 65°C. The tube was placed on ice immediately afterward. Next 43 μL of

42
10% Triton X-100 was added and the sample was mixed gently by pipetting. The
tubes were placed at room temperature and 12 µL of 10X NEBuffer 3.1 was
added. Then 400 U of DpnII (R0543L) was added and mixed gently before an
overnight incubation at 37°C on a Thermomixer (with 900 rpm for 30 sec every 4
min).
Biotin Fill-in: After overnight digestion, the sample was incubated at 65˚C
for 20 min in order to inactivate the restriction enzyme. Then, 10 µL of the
digested sample was taken and kept at 4°C to assess the digestion efficiency
later. DNA ends were marked with biotin-14-dATP by adding 60 μL of biotin fill-in
master mix [1XNEB 3.1, 0.25 mM dCTP, 0.25 mM dGTP, 0.25 mM dTTP, 0.25
mM biotin-dATP (ThermoFisher#19524016), 50U Klenow polymerase
Polymerase I (NEB M0210L)]. Next, the sample was incubated for 4 h at 23°C on
a thermocycler (with 900 rpm for 30 sec every 4 min). Finally, the sample was
placed on ice immediately for 15 min before proceeding to the next step.
Ligation: After fill-in, the total sample volume was ~535 µL. Ligation was
performed by adding 665 µL of ligation mix [240 μL of 5x ligation buffer (1.8X)
(Invitrogen), 120 μL 10% Triton X-100, 12 μL of 10 mg/mL BSA, 50 μL T4 DNA
ligase (Invitrogen 15224090), and 243 μL ultrapure distilled water (Invitrogen)], to
make a total volume of 1,200 µL. The reaction was then incubated at 16°C for 4
hours in a Thermomixer with interval shake.
Reverse Crosslinking: 50 μL of 10 mg/mL proteinase K (Fisher BP1750I-
400) was added after ligation, the sample was incubated at 65°C for 4 hr followed

43
by a second addition of 50 μL 10 mg/mL Proteinase K and overnight incubation
65°C
DNA purification: Reactions were cooled to room temperature and the 1.3
mL total volume was transferred to a 15 mL tube. The DNA was extracted by
adding an equal volume of 1.3 mL of saturated phenol pH 8.0: chloroform (1:1)
(Fisher BP1750I-400) and vortexing for 1 min. Then the total volume of 2.6 mL
was transferred to a 15 ml phase-lock tube (Quiagen #129065) and tubes were
centrifuged at 5,000 g for 10 min. The upper phase was transferred to a 15 mL
tube to start the second extraction. An equal volume of 1.3 mL saturated phenol
pH8.0: chloroform (1:1) was added and the sample was vortexed for 1 min. Then
the mix was transferred to 15 ml phase-lock tube (Quiagen #129065) followed by
spinning tubes at 5,000 g for 10 min. The upper phase of ~1.3 mL was
transferred to a 15 mL tube (high speed) to precipitate the DNA. 1/10 volume
(130 μL) of 3 M sodium acetate pH 5.2 was added and the sample was briefly
vortexed. Then, 2.5 volumes of ice-cold 100% ethanol 3.25 mL was added, the
tube was inverted slowly several times and then incubated at -80° C for 1hr.
Next, the DNA was pelleted at 16,000 g for 30 min at 4°C. The supernatant was
discarded and the pellet was dissolved in 500 µL 1X TLE and transferred to a 0.5
mL AMICON Ultra Centrifuge filter (UFC5030BK EMD Millipore). The column
was spun for 5 min at 14,000 g and the flow-through was discarded. The column
was washed 4 times using 450 µL of 1X TLE for desalting of DNA. After the final
wash the DNA remaining in the column (~50 µL) was eluted in 52 µL of 1XTLE.

44
The column flipped upside down into a new tube to collect DNA and spun for 3
min at 4,000 g, the volume was adjusted to 102 µL. RNA was degraded by
adding 1 µL of 10 mg/mL RNAase A and incubation for 30 min at 37°C. To
quantify the DNA concentration, 2 µL of the final DNA sample along with the first
8 µL sample taken before digestion, the 10 µL sample taken after digestion, and
various amounts of the 1 kb ladder (NEB#N3232s) were run on 1% Agarose gel.
Removal of Biotin from unligated ends: To remove biotinylated nucleotides at
DNA ends that did not ligate, the Hi-C sample was treated with T4 DNA
polymerase. For each Hi-C sample, we assembled the following reaction: [up to 5
µg of Hi-C library, 5 µL 10x NEBuffer 3.1, 0.025 mM dATP, 0.025 mM dGTP and
15 U T4 DNA polymerase (NEB # M0203L). The samples were brought up to 50
µL total volume adding ultrapure distilled water. Reactions were incubated at
20°C for 4 hours, the enzyme was then inactivated by incubation of the reaction
for 20 mins at 75°C and placed at 4°C. Next, the samples were pooled and the
volume was brought up to 130 µL 1XTLE in preparation for sonication.
Sonication: the DNA was sheared to a size of 100-300 bp using a Covaris
instrument [Duty cycle 10%, Intensity 5, Cycles per Burst 200, set Mode
Frequency sweeping, continuous degassing, process time 60 sec, Number of
cycles] for 3 cycles. The volume was brought up to 500 µL using TLE for Ampure
fractionation.
Size fractionation using AMpure XP: 500 µL AMpure beads (Beckman Coulter
A63881) were added to a 1.5 mL tube labeled as 1.1X. Then the tube was placed

45
on the Magnetic Particle Separator (MPS) for 5 min, and the supernatant was
removed. Beads were resuspended in 150 µL AMpure mixture in order to make
the 1.1X solution. 400 µL of AMpure mixture was added to 500 µL of sonicated
DNA from the previous step and the tube was labeled 0.8X. The sample was
vortexed and spun down briefly followed by incubation at RT for 10 min on a
rotating platform. Then the tube was placed on the MPS for 5 min at RT. The
supernatants were collected and added to the 1.1X tube, the tube was briefly
vortexed and spun down followed by incubation at RT for 10 min on a rotating
platform. Then the tube was placed on the MPS for 5 min at RT. The supernatant
was discarded and the beads in 0.8X and 1.1X tubes were washed twice with 1
mL 70% ethanol. Beads were reclaimed by the MPS for 5 min. Beads were then
air-dried on the MPS until ethanol had evaporated completely. Next, 51 µL of
1XTLE was added to the 0.8X and 1.1X tubes to resuspend the DNA from the
beads. Tubes were incubated at RT on a rotating platform for 10 min. Then the
tubes with AMpure beads from both 0.8X and 1.1X tubes were placed on the
MPS for 5 min. Finally, the supernatants were transferred to 1.7 mL tubes
labeled 0.8X and 1.1X. Our sample with DNA that ranges from 100-300 bp is in
the 1.1X sample, the 0.8X sample was kept in case more DNA was needed. DNA
from both samples 0.8X and 1.1X were quantified by running 1 µL on a 2%
agarose gel along with different amounts of low molecular weight DNA ladder
(100 ng, 200 ng, 400 ng).

46
End Repair: 50 µL of Hi-C sample was transferred to a PCR tube, then 20
µL of the end-repair mix [3.5X NEB ligation buffer (NEB B0202S), 17.5 mM dNTP
mix, 7.5 U T4 DNA polymerase (NEBM0203L), 25 U T4 polynucleotide kinase
(NEB M0201S), 2.5 U Klenow polymerase Polymerase I (NEB M0210L)] was
added. The 70 µL total volume reaction was then incubated at 37°C for 30 min,
followed by incubation at 65°C for 20 min to inactivate Klenow polymerase, and
then the sample was put at 4°C. The volume was brought up to 400 µL using 1X
TLE for the next step.
Biotin pull-down: All the following steps were performed with 1.5 mL loBind
tubes (Eppendorf 22431021). 15 µL of MyOne streptavidin C1 beads mix
(Thermo Fisher 65001) was transferred to a 1.5 mL tube. The beads were
washed twice by adding 400 µL of TWB [5 mM Tris-HCl pH8.0, 0.5 mM EDTA, 1
M NaCl, 0.05% Tween20] followed by incubation for 3 min at RT. The tube was
then placed on an MPS for 1 min and the supernatant was removed. After the
washes, the beads were resuspended in 400 µL of 2X Binding Buffer (BB) [10
mM Tris-HCl pH8, 1 mM EDTA, 2 M NaCl] and mixed with the 400 µL DNA from
the previous step in a new 1.5 mL tube. The mixture was incubated for 15 min at
RT with rotation, the tube was then placed on the MPS for 1 min and the
supernatant was removed. The DNA bound to the beads was washed by adding
400 µL of 1X BB and transferred to a new tube. The beads were reclaimed
against the MPS for 1 min, and the supernatant was discarded. The second
wash used 100 µL of 1X TLE, beads were reclaimed against MPS for 1 min, and

47
the supernatant was discarded. Finally, the DNA bound to the beads was eluted
in 32 µL of 1X TLE.
A-tailing: A dATP was added to the 3’ ends by adding 18 µL of A-tailing mix
[5 µL NEB buffer 3.1, 10 µL of 1 mM dATP, 3 U Klenow exo (NEB M0212S)] to
the 32 µL of DNA sample from the previous step. The reaction was incubated in
a PCR machine [at 37°C for 30 min, then at 65°C for 20 min, followed by cool
down to 4°C]. Next, the tube was placed on ice immediately. The sample was
transferred to a 1.5 mL loBind tube, the tube was placed on the MPS for 1 min
and the supernatant was removed. The streptavidin beads bound to DNA were
washed twice using 100 µL 1X T4 DNA Ligase Buffer (Invitrogen). Finally,
streptavidin beads bound to DNA were resuspended in 40 µL 1X T4 DNA Ligase
buffer (Invitrogen).
Illumina adapter ligation and paired-end PCR: For this step, the TruSeq DNA
LT kit Set A (REF#15041757) was used. 10 µL of ligation mix [5 µL Illumina
paired-end adapters, 3 µL T4 DNA ligase Invitrogen, 2 µL 5x T4 DNA ligase
buffer (Invitrogen 5X)] was added to the 40 µL Hi-C sample from the previous
step. The ligation sample was then incubated at RT for 2 hours on a rotator. The
sample was transferred to a 1.5 mL loBind tube, the tube was placed on the MPS
for 1 min and the supernatant was removed. The streptavidin beads bound to
DNA were washed twice with 400 µl of TWB, then twice using 100 µL 1X TLE.
Finally, the sample was resuspended in 20 µL 0f 1XTLE.

48
Illumina Truseq Kit for PCR: We performed three trial PCR reactions as
follows [2.5 µL DNA bound to beads, 2 µL of Primers mix (TruSeq DNA LT kit Set
A 15041757)), 10 µL Master Mix (TruSeq DNA LT kit Set A 15041757), 10.5 µL
of ultrapure distilled water (Invitrogen)]. We split the 25 µL over three PCR tubes
(5 µL, 5 µL, 15 µL per tube). Each of the three samples was then amplified with
different numbers of PCR cycles (6, 8, 10 respectively) to assess the Hi-C library
quality: [30 sec at 98°C, n cycles of (30 sec at 98°C, 30 sec at 65°C, 30 sec at
72°C), 5 min at 72°C, hold at 10°C]. 10 µL was taken from the 15 µL sample
(with 10 PCR cycles), the 10 µL sample was then digested with ClaI for 1 h by
adding 10 µL of digestion mix [1.5 µL 10x NEB Cutsmart buffer, 1.5 µL ClaI (
NEB R0197S ), 7 µL ultrapure distilled water]. The 5 µL of each PCR cycle
sample along with the 20 µL digested sample, and titration of the low molecular
ladder (100 ng, 200 ng, 400 ng) (NEB) were run on a 2% Agarose gel. After
digestion with ClaI, a downward shift of the amplified DNA to smaller sizes is
expected, which indicates DNA ends were correctly filled in and ligated (creating
a ClaI site). The number of PCR cycles to generate the final Hi-C material for
deep sequencing was chosen based the minimum number of PCR cycles in the
PCR titration that was needed to obtain sufficient amounts of DNA for
sequencing using the remaining 17.5 µL Hi-C
RESULTS
CELL CULTURE & CROSSLINKING CELLS USING FORMALDEHYDE

49
The objective to increase the resolution of Hi-C requires a robust and
efficient capturing of spatial DNA interactions, such as between enhancers and
promoters. Digesting the genome into more and smaller pieces of DNA increases
both the resolution and the complexity of a Hi-C library. To fully capture individual
interactions within this complex library of pair-wise interactions, it is helpful to
start with a large amount of cells. As such, even very infrequent interactions can
still be captured, but in a statistically significant manner. In our Hi-C protocol, we
start with 5 Million cells to ensure the generation of complex libraries. This
improvement from 25 Million cells in our previous protocol, has successfully been
implemented after adapting to in situ Hi-C ( Rao et al., 2014). Using a further
adaptation to the protocol described here, we have successfully generated
libraries with as little as 500,000 cells of starting material. However, the reduced
amount of genome copies made these libraries less complex.
We use a final 1% concentration of formaldehyde to crosslink DNA-DNA
interactions that are bridged by proteins (Fig. 2.1A). Serum can affect the cross-
linking efficiency because it is very rich in proteins and it will compete for
formaldehyde. Therefore we replace serum containing medium with serum free
medium before fixation. Although formaldehyde-based cross-linking biases have
been proposed (Gavrilov, Razin, & Cavalli, 2015), our current fixation protocol
has been the standard for immunoprecipitation and has remained unaltered from
previous Hi-C or 3C based protocols (Belton et al., 2012; J Dekker et al., 2002).

50
Further, any such biases can be removed using several normalization strategies
(section 3.1.2).
We distinguish between adherent and suspension cells in order to fix them
in their normal growth conditions. Adherent cells are washed once with the
relevant serum-free medium before fixation. Fixation occurs by incubation in
formaldehyde containing medium without detaching cells from their growth
surface. For suspension cells we replace the wash medium with medium
containing formaldehyde after centrifugation.
For both cell types, the formaldehyde is quenched with glycine to terminate the
crosslinking. Cells are washed with PBS and pelleted cells can be snap-frozen
with dry ice or liquid nitrogen. These cells can be stored at -80°C for up to a year
before continuing Hi-C.

51
Figure 0.1.1 : Overview of the Hi-C method
(A) Cells fixed with formaldehyde contain protein-mediated DNA-DNA interactions. (B) DNA digestion with DpnII, recognizing GATC, generates a 5’-GATC overhang. (C) Filling in of the 5’overhang with dNTPs and biotin-14-dATP blunts the overhang. Ligation of the blunted ends creates a new restriction site (ClaI), which can be used to assess fill-in efficiency. After ligation, crosslinks are reversed to remove proteins from DNA. (D) Removal of Biotin (green lollipops) from un-ligated ends. DNA is fragmented to 200-300bp DNA fragments to enable paired-end sequencing. Numbers 1-4 indicate the different ligation products observed: 1: valid interaction; 2: partial digest; 3: dangling end; 4: self-circle. Size fractionation results in fragment size reduction, indicated by dotted lines (E) Enrichment of ligation junctions by using the high affinity of streptavidin-coated beads for the incorporated biotin allows for ligation product enrichment prior to adapter ligation. Numbering of fragment types is as in (D).
Cell lysis and chromatin digestion

52
We perform Hi-C on lysed cross-linked cells. We use a douncer to lyse the
cells in cold hypotonic buffer that is supplemented with protease inhibitors to
maintain Protein-DNA complexes. After two rounds of douncing we pellet the
material and wash twice with a cold buffer that we will use during digestion. At
this point an aliquot of ~ 5% volume can be taken to check the integrity of DNA
on an agarose gel.
Before digestion, we incubate the lysed cells in 0.1% of SDS to eliminate proteins
that are not cross-linked to DNA, and open the chromatin for a better and more
homogenous digestion. The reaction is terminated by addition of triton X-100 to a
1% final concentration. Now the DNA is accessible for digestion by an
endonuclease of choice (Fig. 2.1B). The restriction fragment size poses a hard
limit to the maximum resolution for 3C-based methods. We previously described
the use of HindIII, which has an average fragment length of ~4kb. Previous high
resolution Hi-C libraries have used MboI or DpnII ( Rao et al., 2014) to fragment
DNA with restriction endonucleases to an average length of ~500 bp. Alternative
ways of digestion include alternative enzymes, the use of micrococcal nuclease,
which digests in between nucleosomes (T. H. Hsieh et al., 2015), and random
breakage by sonication. Here an endonuclease is used that leaves a 5’overhang,
which allows marking the sites of digestion with a biotinylated
deoxyribonucleotide during overhang fill-in.

53
Both DpnII and MboI recognize and digest GATC, and leave a 5’-GATC
overhang. We prefer the use of DpnII for eukaryotes, because unlike MboI it is
insensitive to CpG methylation. The GATC sequence is frequently found
genome-wide and should theoretically result in a median digestion into ~256
base pairs fragments for the 3x10⁹ base pair (bp) human genome. To ensure
maximal digestion, chromatin is incubated with DpnII overnight in a thermocycler
with interval agitation. After digestion DNA forms a smear of 400-3000 bp on
agarose gel (Fig. 2.2A). Digestion is terminated by heat inactivation of the
restriction enzyme at 65˚C for 20 minutes.
Marking of DNA ends with biotin
DNA digestion generates a 5’overhang that is then filled in with
deoxyribonucleotides. By strategically replacing one of the deoxyribonucleotides
with a biotin-conjugated variant, we can mark the site of digestion and enable
enrichment for those sites in a later step. It is this specific fill-in that separates Hi-
C from other chromosome conformation capture based methods. For DpnII, we
incorporate biotin-14-dATP (Fig. 2.1C). Although the incorporation of biotinylated
dCTP is theoretically possible, we have found that this incorporation of a
biotinylated nucleotide at the end the overhang leads to less efficient ligation
(below).
Klenow fragment of DNA polymerase I is used to fill in the 5’ overhang for 4
hours at 23°C. This low temperature is crucial for efficient incorporation of the

54
large biotinylated dATP and decreases 3’ 5’exonuclease activity. Not all
overhangs will be filled to completion; therefore, not all digested fragments can
be properly ligated. In a later step, after DNA purification, unligated biotinylated
ends are removed in a “dangling end removal” step to enrich for proper ligations.
In situ Ligation of proximal ends
Before starting ligation a 10 µl aliquot is taken that will be used to assess
digestion efficiency on an agarose gel (Fig. 2.2A, middle lane panel2). The size
of the digested DNA is then compared to DNA that was kept aside after lysis
before digestion and the DNA that is to be isolated from our ligated Hi-C library.
While previous protocols used SDS to inactive the restriction enzyme prior to
ligation, here we use an “in situ” ligation protocol (T Nagano et al., 2013; Takashi
Nagano, Várnai, et al., 2015; Rao et al., 2014; Splinter et al., 2012), which leaves
out this step and inactivates the restriction enzyme by heat. Leaving out this SDS
step has previously been shown to better preserve nuclear structure and reduces
random ligation (Takashi Nagano, Várnai, et al., 2015). Chromatin is then ligated
for 4 hours at 16°C, which is efficient for most of Hi-C libraries. However, in some
cases increasing the ligation time to improve the ligation efficiency may be
needed. Note that prolonged ligation may increase random ligation. Ligation of
the 2 blunted ends creates a new restriction site that can be used to assess the
ligation efficacy (Fig. 2.1C).

55
This blunt end ligation can lead to specific chimeric ligation products between
ends that were in close spatial proximity. However, this process can also
generate circularized ligation products of single restriction fragments. These are
not informative and are not considered valid pairs (Fig. 2.3B-3).
Reversal of crosslinking and DNA purification
Now that interacting loci are ligated into chimeric pieces of DNA, proteins
that hold interacting fragments in close proximity can be removed. This is
achieved by thermal reversion of cross-links and incubation with proteinase-K.
After proteinase K treatment DNA is isolated using 2 steps of phenol:chloroform
(pH=7.9) and DNA is precipitated using a standard sodium acetate plus ethanol
protocol. An Amicon column is used to wash pelleted DNA with low EDTA, tris-
buffered water (TLE) to remove any excess of salt.
Quality Control of Hi-C ligation products
During the procedure described above, small aliquots were taken after
three key steps in the protocol: lysis, digestion and ligation. DNA isolated from
these aliquots can be run on an agarose gel to ascertain the intactness of the
DNA prior to digestion, the extent of digestion and efficiency of subsequent
ligation. The undigested genomic DNA typically runs as a tight band of over 20
Kb in size (Fig. 2.2A-1). After digestion, the DNA runs as a smear with a size
range specific for the applied restriction enzyme (Fig. 2.2A-2). Both of these
controls allow for a comparison with the actual library of DNA containing the

56
chimeric ligated ends. These ligated chimeras should have a higher molecular
weight than the digestion control and are most likely smaller in size than the
undigested control. For DpnII digestion we usually obtain sizes ranging between
3Kb and 10kb (Fig. 2.2A-2).
A second quality control involves quantification of the level of fill-in of overhangs
prior to ligation. This is done by PCR amplification of a specific ligation product
with primer pairs that were designed for 2 nearby digestion sites (e.g. adjacent
restriction fragments) followed by digestion of the PCR product with a restriction
enzyme that only cuts at the ligation junction when fill-in has occurred prior to
ligation.
Specifically, PCR reactions are set up to detect head-to-head ligation products
(Fig. 2.2B-C). Primers are designed near neighboring restriction sites that have a
high likelihood of being in close spatial proximity, which can only generate PCR
products when properly ligated chimeras are present (Fig. 2.2B). For some
endonucleases, including HindIII and DpnII, ligation of the 2 blunt ends generates
a new digestion site that can be used to quantify the ligation and fill-in efficiency
(NheI for HindIII and ClaI in the case of DpnII) (Fig. 2.1C, .2B). After PCR
amplification of a specific ligation product, the PCR product is digested with the
enzyme that recognizes this newly generated ligation product. Typically the
majority of the PCR product is cleaved indicating efficient fill-in (Fig. 2.2B).
Removal of Biotin from un-ligated ends

57
We have found that in most Hi-C experiments some digested sites will have
remained unligated. For example, if the fill-in of some overhangs was incomplete,
ligation to a proximal fragment will not occur and the overall ligation will not be
100% efficient. Such cases result in biotinylated but unligated ends. We prefer to
remove these “dangling” ends from the Hi-C library, because they would make
sequencing less efficient by generating uninformative reads (Fig. 2.1D). Some of
these uninformative reads can be readily recognized computationally as both
reads will map to a single restriction fragment, and can be easily removed from
the dataset (Fig. 2.3C). However, given that digestion in Hi-C is not complete,
sequencing of unligated but biotinylated partial digestion products can yield read
pairs that map to different restriction fragments and appear as valid interactions.
This can be a relatively large number of reads in a given library (below). These
apparent valid interactions will be interactions between adjacent restriction
fragments, and thus will contaminate very short-range interactions, and lead to
over-estimation of the number of intra-chromosomal interactions in general.
Experimentally removing these dangling ends of partial digestion products is
therefore important.
Our biotin removal step uses T4 DNA polymerase and a low concentration of
dNTPs to favor the 3’ to 5’ exonuclease activity over its 5’ to 3’ polymerase
activity. By only providing dATP and dGTP, which are complementary to the
inside of the 5’ overhang, the polymerase will not be able to complete re-filling
the overhang after removing filled in bases. Dangling end removal reduces the

58
level of unligated molecules (dangling ends at single, fully digested, fragments) in
the Hi-C library to as low as 0.1-1.5% of read pairs. The in situ Hi-C protocol [13]
also produces low amounts of such dangling ends (here 0.2-2.5%) (Fig. 2.4A),
but we note that this frequency can be more variable between experiments (Fig.
2.4A).
Sonication
In order to sequence both ends of ligation products, DNA is sonicated to
reduce their size to 200-300 bp in preparation for paired-end sequencing. We
prefer to use a Covaris sonicator because its reproducibility in generating a tight
range of DNA fragments. For sequenced reads to be mapped correctly, each end
of a read pair should not pass the chimeric ligation junction, since this will result
in a sequence that cannot be mapped to a reference genome. Fragments that
are 200-300 bp are likely to contain enough mappable sequence at each end
before reaching a ligation junction.
Size selection
Covaris sonication results in a relatively small size range of DNA
fragments. Therefore, additional size selection could be omitted, but we prefer to
use SPRI beads (AMpure) to create an even tighter distribution of fragments.
Ampure is a mixture of magnetic beads and polyethylene glycol (PEG-8000).
Adding AMpure to a DNA solution reduces the solubility of DNA, because PEG, a
crowding agent, will effectively occupy the hydrogen bonds of aqueous solutions.

59
As a result of this crowding, DNA will come out of the solution and bind to the
coated magnetic beads. Since larger DNA molecules will come out of solution
first, the final concentration of PEG can be used to generate a size cut‐off. After
sonication 2 consecutive size selections with Ampure are performed. The first
AMpure selection will precipitate DNA larger than 300 bp. Using a magnet, bead-
bound DNA is separated from the PEG supernatant, which contains fragments
smaller than 300 bp. This supernatant undergoes an additional AMpure selection
that precipitates DNA larger than 150 bp. Here after, the bead-bound DNA will be
narrowly sized to 150-300 base pairs.
End repair
The shearing of DNA by sonication will inevitably damage DNA ends. To
repair all the ends after sonication a mix of T4 and Klenow DNA polymerase is
used together with T4 polynucleotide kinase (PNK). The first 2 enzymes will
repair nicked DNA and single stranded ends, while T4 PNK phosphorylates 5’-
ends allowing subsequent A-tailing and adaptor ligation.
Biotin pulldown
To enrich for Hi-C ligation junctions, we use streptavidin-coated beads
with a high affinity for the incorporated biotin. This effectively eliminates any DNA
without biotin, i.e. DNA that wasn’t properly digested, filled-in and ligated (Fig.
2.1E).

60
As mentioned above, the step to remove biotin at DNA ends (see 2.3.1) reduces
the pulldown of a large fraction of unwanted unligated fragments (Fig. 2.1D-E).
However, some unwanted fragments might still be captured. These include self-
circled ligation products and other fragments that were insensitive to biotin
removal (Fig. 2.3B). For instance, during biotin incorporation, internally nicked
DNA could be repaired with biotinylated nucleotides and when too far away from
the DNA ends, these incorporated biotinylated nucleotides will not be removed by
T4 Polymerase in our biotin removal step. Some of these read pairs (e.g. self-
circles) can be removed during bioinformatic analysis of the data.
A-tailing and adaptor ligation
For DNA sequencing Illumina PE adaptors are ligated to both ends of the
size selected ligation products. The PE adaptors were generated from DNA
oligos, which after duplexing have a 5’-dTTP overhang. This overhang increases
ligation efficiency when presented with a free 3’Adenyl. The 3’end of the ligation
products are adenylated using dATP and a Klenow fragment lacking 3’ to 5’
exonuclease activity, and then adaptors are ligated using T4 DNA ligase.
Depending on whether the preferred sequencing protocol includes multiplexing,
one can either use indexed or non-indexed paired-end adapters. We have
successfully used paired-end single index adaptors to sequence multiple libraries
in a single lane. Strategically choosing the right combination of multiplex
adaptors, as suggested by Illumina, at this step is essential when multiplexing is
intended.

61
PCR titration and production
To obtain enough DNA for deep sequencing, the library of ligated
fragments is amplified by PCR, using primers designed to anneal to the PE
adaptors. Since over-amplification by PCR can result in reduced library
complexity, a PCR titration is performed on an aliquot to find the optimal amount
of PCR cycles. The smallest number of PCR cycles, producing enough DNA for
sequencing will be chosen (Fig. 2.2C). After PCR, the PCR product is separated
from the bead-bound DNA for a final AMpure cleanup. Generally, 6 to 10 PCR
cycles will successfully produce enough DNA for sequencing.
As a final quality control an aliquot of the amplified library is digested with ClaI
(Fig. 2.2C). Ligation of blunted DpnII sites creates a new ClaI site at the ligation
junction. When fill-in and ligation was successful and efficient one expects the
majority of the PCR products to be cleaved, resulting in a shift in size compared
to undigested PCR product which can be observed by running an aliquot of DNA
on an agarose gel (Fig. 2.2C).

62
(A.1) Quality control of intact genomic DNA after cell lysis and before digestion. (A.2) Hi-C DNA after digestion and ligation (+,+) compared to unligated, digested control (-,+) . Size is indicated by the 1Kb Molecular Weight Ladder from NEB (1 and 2). (B) PCR amplification of a specific ligation product to assess ligation efficiency. The PCR product (lane 1), PCR product digested with MboI (lane2), ClaI (lane3), or both ClaI and MobI (lane4). Only properly filled-in ligation products will be digested with ClaI (see cartoon). This allows for a qualitative comparison to MboI digestion, which cuts GATC sites that are present at the ligation junction of both properly filled-in and non-filled-in ligation products. Digestion of the PCR product using ClaI indicates efficient fill-in and the ClaI undigested fraction from the PCR can be used to estimate the fill-in efficiency (red arrow). The molecular weight ladder used is the Low Molecular Weight Ladder from NEB. (C) PCR titration of the final Hi-C library and quantification of the fill-in and ligation efficiency by ClaI digestion. PCR amplification is performed
Figure 2.2: Quality Control of Hi-C ligation products

63
with primers that recognize the PE adaptors that were ligated to the Hi-C library before sequencing. With 6-cycles of PCR amplification enough DNA was produced for sequencing (lane #1). The last lane shows a downward shift of the amplified library after digestion with ClaI, indicative of efficient fill-in.
Sequencing
We sequence Hi-C libraries using Illumina 50 bp or 100 paired-end
sequencing. Using longer paired end reads (e.g. 100 bp instead of 50 bp) will
increase the number of mappable reads. However, as a cautionary note we also
found that longer reads will disproportionally increase the number of read pairs
with inward read orientations leading to overestimation of very short-range
interactions. As mentioned above, such partial digestion products can appear as
valid interactions and cannot be filtered out computationally.
MAPPING AND BINNING PIPELINE
The paired end sequencing information can be downloaded from the
sequencing platform as standard fastq files. The reads are then mapped to a
reference genome and valid interaction pairs are identified using read orientation
(inward, outward, or same direction). Reads mapping to different fragments are
used to assemble the Hi-C dataset. All 4 read strand combinations are possible
and are expected to be observed in equal proportions (25% per combination).
However, inward read pairs could be the result of undigested restriction sites
(partial digests) (Lajoie, Dekker, & Kaplan, 2015). Reads mapping to a single

64
fragment are considered uninformative. There are several types of such
uninformative single fragment read pairs (Fig. 2.3C): self-ligations (self-circles),
unligated fragments (dangling ends) and error pairs. These can be identified by
the read orientation, as shown in Figure 2.3C. Inward pointing reads are
considered unligated fragments (dangling ends). Outward pointing reads are
classified as self-ligated fragments (‘‘self-circles’’). Same-strand reads are
classified as ‘‘error pairs’’ as these products are a result of either a mis-mapping,
random break, or an incorrect genome assembly products (Lajoie et al., 2015)
(Fig. 2.3). Improper ligations can be detected and filtered out by evaluating read
orientation of the paired ends and whether the reads map to the same fragment
(Lajoie et al., 2015). However, one particular type of improper interaction that is
derived from dangling ends cannot be accounted for by computational analysis
alone because the two reads map to two (adjacent) restriction fragments.
Dangling ends flanking an undigested restriction fragment (partial digest) will
computationally be indistinguishable from a valid pair interaction with an inward
orientation (Fig. 2.3C). Such read pairs increase in frequency with decreasing
restriction fragment size (i.e. when using more frequently cutting enzymes such
as DpnII) (Fig. 2.4A). We find that such “inward” read pairs are overrepresented
in most Hi-C datasets (i.e. they occur more frequently than the expected 25%),
and they represent almost all valid interactions between adjacent restriction
fragments. A dangling end removal step can remove a subset of such
problematic read pairs by removing unligated partial digest products.

65
Figure 2.3:Possible products generated by Hi-C
(A) Two fragments: A (red) and B (blue), are spatially separated in the linear genome (gray dotted line) or neighboring (red and blue to gray fading). (B) If fragment A and B are in close spatial proximity they can become cross-linked and ligated during the Hi-C procedure (1). Partial digests result from undigested neighboring fragments that were biotinylated (2). Other possible, non-valid

66
products can be derived from non-ligated DNA (dangling-end; 3) or single fragments that have become circularized after ligation (self-circles; 4). The gray arrow indicate the orientation of the paired-end reads in the Hi-C library (C) Dangling ends can be removed from the Hi-C library prior to sequencing, as described in this protocol. Any remaining dangling-ends and self-circles can be filtered out from the sequenced library computationally after mapping and assessing the orientation of the DNA reads. After mapping, valid reads locate to different fragments in the reference genome and are either inward or outward oriented, or directed in the same direction (both pointing left or both pointing right) (1). Unligated partial digestion products cannot be distinguished from valid reads because the two reads will map to two (neighboring) restriction fragments. This category is characterized by an inward read orientation (2). Invalid reads have mapped to the same fragment in the reference genome and can be either inward (dangling ends; 3), outward (self-circles; 4) or same direction (error; 5). Gray arrows indicate the read orientation in the reference genome.
Bias in inward read orientation
Unligated partial digestion products will always produce “inward” read
pairs mapping to adjacent or very nearby restriction fragments (genomic distance
<500 bp). We compared data we obtained with Hi-C 2.0 to the data published by
Rao et al. ( Rao et al., 2014) obtained with in situ Hi-C without dangling end
removal (Fig. 2.4A). We find that data obtained with both protocols display a
bias in detection of interactions with inward read orientation (average 30-35% of
all interactions). There can be quite a large experiment-to-experiment variation
in the frequency of the inward read pairs. The number of inward reads between
sites separated by less than 500 bp can represent up to 20% of all valid
interactions in some datasets. Almost all such short-range interactions are in fact
of the inward type, indicating that the general bias for inward read orientation is
driven to a large extent by very short-range interactions. The experiment-to-
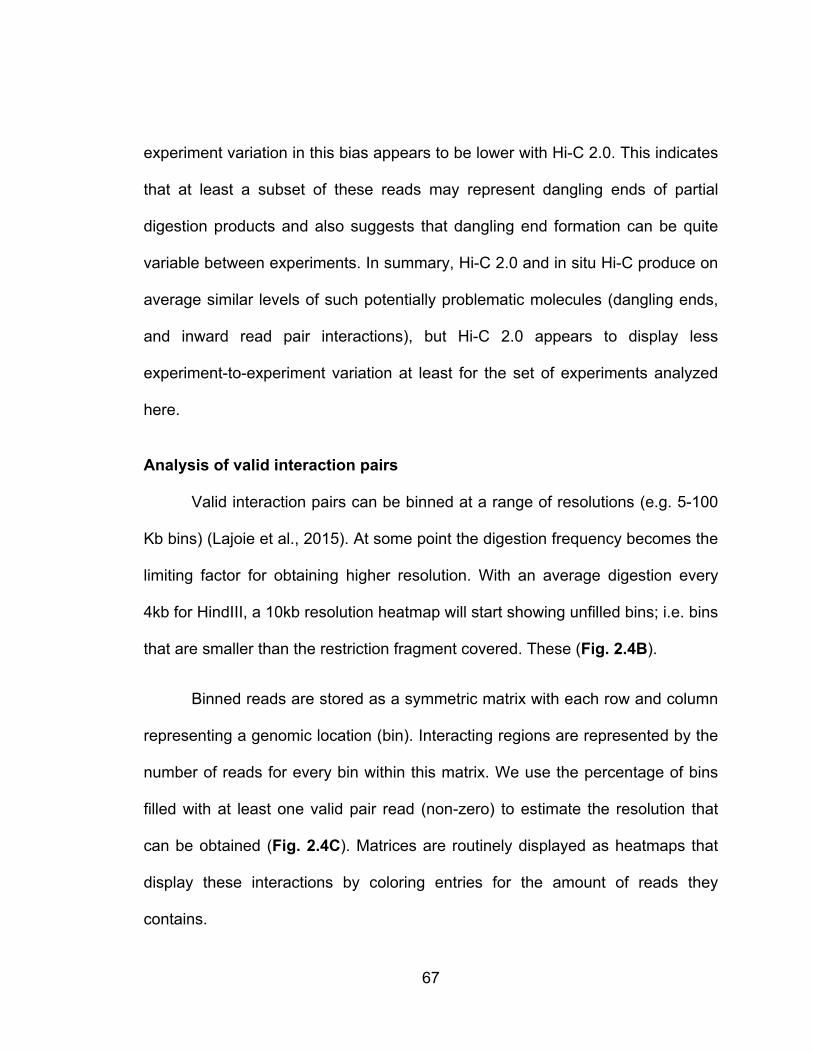
67
experiment variation in this bias appears to be lower with Hi-C 2.0. This indicates
that at least a subset of these reads may represent dangling ends of partial
digestion products and also suggests that dangling end formation can be quite
variable between experiments. In summary, Hi-C 2.0 and in situ Hi-C produce on
average similar levels of such potentially problematic molecules (dangling ends,
and inward read pair interactions), but Hi-C 2.0 appears to display less
experiment-to-experiment variation at least for the set of experiments analyzed
here.
Analysis of valid interaction pairs
Valid interaction pairs can be binned at a range of resolutions (e.g. 5-100
Kb bins) (Lajoie et al., 2015). At some point the digestion frequency becomes the
limiting factor for obtaining higher resolution. With an average digestion every
4kb for HindIII, a 10kb resolution heatmap will start showing unfilled bins; i.e. bins
that are smaller than the restriction fragment covered. These (Fig. 2.4B).
Binned reads are stored as a symmetric matrix with each row and column
representing a genomic location (bin). Interacting regions are represented by the
number of reads for every bin within this matrix. We use the percentage of bins
filled with at least one valid pair read (non-zero) to estimate the resolution that
can be obtained (Fig. 2.4C). Matrices are routinely displayed as heatmaps that
display these interactions by coloring entries for the amount of reads they
contains.

68
Binned interaction matrices are corrected for intrinsic biases in Hi-C such
as read mappability, restriction site density and GC- content. Several
approaches have been developed for bias removal. Yaffe and Tanay developed
a computational approach to estimate each of these biases and then remove
them (Yaffe & Tanay, 2011). We use an iterative correction approach, developed
by Imakaev and co-workers to balance the matrix of interactions such that the
sum of all interactions genome-wide for each bin adds up to the same number
(Imakaev et al., 2012). This correction should remove both known and unknown
biases, such as potential cross-linking differences. We note that such balancing
methods often exclude very short-range interactions (i.e. the first diagonal of a
Hi-C interaction map) from analysis because these are contaminated with a
variety of problematic read pairs, as we have outlined above. This reduces the
ability to detect short-range interactions.
There are several public pipelines for processing Hi-C data, e.g. HOMER
(Heinz et al., 2010), HiCPro (Servant et al., 2015a), HiCUP (Wingett et al., 2015)
and Juicer (Durand et al., 2016). For a more detailed description of mapping and
binning of data using our pipeline, we refer to in Lajoie et al., Methods (2015)
(Lajoie et al., 2015). A high quality Hi-C library for mammalian genomes typically
has 50-70% of interactions mapping to intra-chromosomal interactions, less than
2 % dangling ends, less than 1% self-ligated circles, and less than 5% PCR
redundant interactions per 400 million reads. We note that with the Illumina
HiSeq 4000 platform additional apparently redundant reads on the flow cell can

69
be produced that are not due to PCR amplification but the result of sample
loading. Additional washing of libraries (on AMpure beads) and optimization of
loading has helped us reduce such artifacts. Finally, these numbers can depend
on biological state and therefore are only general guidelines for assessment of
library quality.

70
Figure 2.4: Dangling end removal and to increase valid pair reads
(A) Comparison of frequency of dangling ends, total valid pairs, valid pairs with inward read orientation for short range interactions between nearby fragments (separated by less than 500 bp), and frequency of total inward reads for datasets obtained with in situ Hi-C (SRR1658706, SRR1658593, SRR1658712, SRR1658671, SRR1658648) (Rao et al. ( Rao et al., 2014)) and for datasets obtained with Hi-C 2.0. All datasets were analyzed by 100 bp paired end reads. Datasets from Rao et al. were selected solely based on their read depth that was comparable to datasets obtained with Hi-C 2.0 (100-200 million reads). All data were analyzed through our Hi-C mapping pipeline (available in Github: https://github.com/dekkerlab/cMapping). Hi-C 2.0 and removal of dangling ends results in a more consistent percentage of valid reads. Within the set of valid pair

71
reads, we see a reduction in experiment-to-experiment variation of total amount of inward read pairs. The overrepresentation of inward reads appears due to a large extent to the fact that almost all read pairs between neighboring restriction fragments (separated by less than 500 bp) are inward and this category can be 10-20% of all valid pairs. Hi-C 2.0 reduces the experiment-to-experiment variation of interactions between fragments separated by less than 500 bp. This suggests that at least a subset of interactions between adjacent fragments (interactions separated by less than 500 bp) represent dangling ends. (B) A 10 kb resolution heatmap for chromosome 11 (hg19: 2,540,996-9,878,496 bp) derived from 2 libraries with 300M reads. Libraries were generated with HindII (top triangle) or DpnII (bottom triangle). Color scales are normalized and bins without reads are visualized as gray lines. More unfilled bins (gray) in HindIII are caused by larger fragment sizes (C) An increase in valid pair reads, scored as bins containing at least 1 read (i.e. non-zero), allows for analyses at a higher resolution. The plot compares 2 libraries generated with the same protocol, but with different numbers of valid pair reads (blue: 215 million; red: 140 million). Double arrows indicate that at a higher resolution (smaller bins), adding more valid pair reads (by deeper sequencing) becomes important. These libraries were binned with 20kb as the highest resolution from where dotted lines (red, blue) start extrapolating the data to higher resolutions.

72
Recent research has shown that the genome is composed of several
layers of structure, ranging from compartments to topologically associating
domains (TADs) and loops (Fig. 2.5). We will briefly describe how those features
can be measured. For more details we refer to Lajoie et al., Methods (2015)
(Lajoie et al., 2015).
Compartments
Compartments are defined as groups of domains, located along the same
chromosome or on different chromosomes that display increased interactions
with each other. In heatmaps generated from 100Kb bins, this is visible as a
specific plaid pattern. These alternating blocks of high and low interaction
frequencies represent A and B compartments (Lieberman-Aiden et al., 2009).
Principal component analysis (PCA) readily identifies these compartments that
tend to be captured by the first component. The active “A” compartments are
gene-dense euchromatic regions, whereas the inactive “B”-compartments are
gene-poor heterochromatic regions (Fig. 2.5)
Topologically associated domains (TADs)
TADs are contiguous regions that display high levels of self-association
and that are separated from adjacent regions by distinct boundaries (J R Dixon et
al., 2012; Nora et al., 2012). The locations of TADs can be determined when
interaction data is binned at 40 Kb or less. There are several computational

73
approaches to identify the locations of TAD boundaries including the
directionality index (J R Dixon et al., 2012) or an insulation score algorithm
(Crane et al., 2015) to determine the location of TADs (Fig. 2.5).
Point to point interactions (loops)
Many point-to-point interactions or loops appear as off-diagonal “dots” in a
heatmap. Typically, a 10Kb resolution or higher is required for identifying looping
interactions. Mapping to smaller bins will allow for more specific interactions, but
this comes at the cost of a decreased number of reads per bin. Specific
interactions between for instance pairs of CTCF sites are expected to show up as
increased signal compared to their surrounding area ( Rao et al., 2014). Rao et
al describe a useful approach to detect such dots using a local background
model ( Rao et al., 2014). Other types of local interactions, e.g. lines in the
heatmap can be detected using global background models (Jin et al., 2013; A
Sanyal, Lajoie, Jain, & Dekker, 2012). Using HiCUP, we have observed loops at
10 kb resolution with a library containing 300M valid reads.
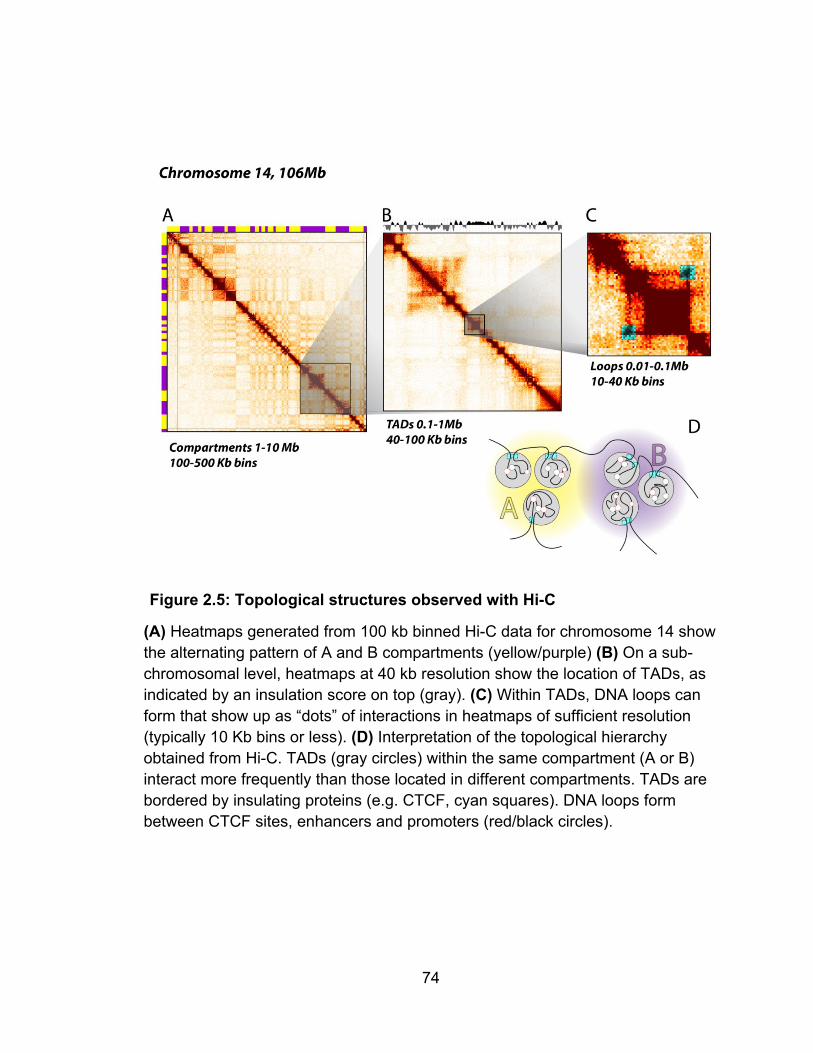
74
Figure 2.5: Topological structures observed with Hi-C
(A) Heatmaps generated from 100 kb binned Hi-C data for chromosome 14 show the alternating pattern of A and B compartments (yellow/purple) (B) On a sub-chromosomal level, heatmaps at 40 kb resolution show the location of TADs, as indicated by an insulation score on top (gray). (C) Within TADs, DNA loops can form that show up as “dots” of interactions in heatmaps of sufficient resolution (typically 10 Kb bins or less). (D) Interpretation of the topological hierarchy obtained from Hi-C. TADs (gray circles) within the same compartment (A or B) interact more frequently than those located in different compartments. TADs are bordered by insulating proteins (e.g. CTCF, cyan squares). DNA loops form between CTCF sites, enhancers and promoters (red/black circles).

75
CONCLUSION This Hi-C 2.0 protocol combines in situ ligation with dangling end
removal to produce Hi-C libraries enriched in intra-chromosomal valid interaction
pairs. This protocol can effectively be used to visualize chromosome
conformation at Kb resolution genome-wide.
.

76
CHAPTER III: CBFβ-SMMHC Inhibition Triggers Apoptosis by
Disrupting MYC Chromatin Dynamics in Acute
Myeloid Leukemia
PREFACE The content of this chapter is a part of the following publication:
John Anto Pulikkan,1 Mahesh Hegde,1 Hafiz Mohd Ahmad,1 Houda
Belaghzal,2 Anuradha Illendula,3 Jun Yu,1 Kelsey O’Hagan,1 Jianhong Ou,1
Carsten Muller-Tidow,4 Scot A. Wolfe,1 Lihua Julie Zhu,1 Job Dekker,2 John
Hackett Bushweller,3 and Lucio Hernān Castilla1. Cell 174, 172–186, June 28,
2018
SUMMARY
Some cancer cells form through oncogenes or mutations in tumor
suppressor genes., and a subset of these alter transcription factors and
chromatin-associated elements. In blood-associated cell types, these factors
often drive leukemia initiation and maintenance. Specifically, in acute myeloid
leukemia (AML) MYC is up-regulated after its repressor RUNX1 is inhibited by
the fusion oncoprotein CBFβ-SMMHC. The treatment of AML cells with small
molecule AI-10-49 blocks RUNX1 binding to CBFβ-SMMHC. As a result, RUNX1
availability at the MYC regulatory elements decreases MYC expression and AML
cell viability. In this study, an assessment of overall epigenetic and genomic
changes in 4Mb around MYC in AML cells before and after AI-10-49 treatment

77
was conducted. AI-10-49 treatment induces a 7-fold increase in RUNX1
occupancy in regulatory elements downstream of MYC, 10-fold decrease of MYC
expression, and induction of apoptosis. To further investigate how RUNX1
binding to MYC regulatory elements ME1, ME2, and BDME after treatment
induces a 10-fold decrease in MYC expression, we applied
chromosome conformation capture carbon copy 5C for 4Mb around the MYC
gene. This experiment provides a critical piece of evidence that the MYC
promoter physically interacts with RUNX1-associated enhancers ME1, ME2, and
E3 in AML cells before and after treatment with AI-10-49. These results
demonstrate that, at an established loop, changes in transcription factor
occupancy in regulatory elements are sufficient to replace the activating
chromatin complexes for repressive complexes at the target gene in order to
disrupt its expression.
INTRODUCTION
The genome-wide association study, GWAS revealed that the majority of
the variants fall in noncoding regions of the genome and lack a defined target
gene (Variation et al., 2012). A lot of these disease-specific variants alter the
association of transcription factors and repressor at regulatory elements
(Variation et al., 2012). In acute lymphoblastic leukemia (ALL) of T-cell type “T-
ALL cell lines”, the MYC promoter interacts with the Notch-dependent MYC
enhancer element “NDME”, which is found 1.3 Mb (Yashiro-ohtani et al., 2014).

78
The NDME binds Notch transcription complexes to activates reporter genes in
(ALL) of T-cell type. The survival and aberrant self-renewal potential of acute
myeloid leukemia (AML) RN2 cells require the mammalian SWI/SNF chromatin
remodeling complex, recruited to the MYC promoter by a cluster of enhancers
located 1.7 Mb downstream (Shi et al., 2013). Similarly, in acute myeloid
leukemia (AML) ME-1 cells MYC promoter is enriched by transcription activating
SWI/SNF chromatin remodeling complex.
MYC expression is critical for the survival of leukemia cells
MYC regulates the balance between self-renewal and differentiation of
HSCs (Wilson et al., 2004), and is essential for lymphoid (Alboran et al., 2001)
(Douglas, Jacobs, Bothwell, & Hayday, 2001) and megakaryocytic-erythroid
development (Y. Guo et al., 2019). MYC expression however, needs to be
downregulated during myeloid differentiation since MYC repression promotes
granulopoiesis, while its ectopic expression blocks granulopoiesis (Gowda,
Koler, & Jr, 1986) (Holt, Redner, & Nienhuis, 1988) (Johansen et al., 2001). The
accumulation of polycomb-repressive complexes (PRC1 and PRC2) in MYC
downstream target enhancers induces tri-methylation of lysine-27 in histone H3
(H3K27me3), thereby promoting local compaction of the chromatin structure
around enhancers and silencing the expression of target genes (Croce & Helin,
2013). Emerging evidence indicates that the epigenetic regulation of enhancer
activity plays a critical role in myeloid differentiation and leukemia. The SWI/SNF
and BRD4 complexes regulate expression of the proto-oncogene MYC from the
79
distal super-enhancer BDME (BRD4-dependent MYC enhancer). BDME is
located 1.7 megabases downstream from its transcription start site (TSS) (Shi
et al., 2013). The regulation of MYC expression can be controlled by different
distal enhancers in a cell type-specific manner. The BDME super-enhancer is
composed of five enhancer elements and is occupied by a number of
transcription factors with roles in myeloid differentiation. The SWI/SNF ATPase
subunit Brahma related gene 1 (BRG1) is required for normal granulopoiesis
and associates with BDME to maintain MYC levels in mixed-lineage leukemia
cells (Shi et al., 2013) (Vradii et al., 2005). Finally, MYC is up-regulated after
its repressor RUNX1 is inhibited by the fusion oncoprotein CBFβ-SMMHC in
AML B cells (ME-1 cells).
RUNX1 recruits transcription factors at its target sites
RUNX1 associates with chromatin-modifying proteins, including histone
deacetylases (Vanden-eynden, Xie, & Lutterbach, 2006) (H. Guo & Friedman,
2011), acetyl-transferases (Kitabayashi, Yokoyama, Shimizu, Ohki, & Pebp,
1998)(Kitabayashi, Aikawa, Nguyen, & Yokoyama, 2001) and methyl-
transferases (X. Zhao et al., 2008) (Vanden-eynden et al., 2006) (Vu et al.,
2013) in hematopoiesis. These proteins interactions regulate RUNX1 affinity to
DNA, transcriptional activity, and modulate its association with activating and
repressing chromatin complexes (Lichtinger, Hoogenkamp, Krysinska, Ingram, &

80
Bonifer, 2010). RUNX1 is less accessible to its specific DNA target sites in
inv(16)(p13;q22) acute myeloid leukemia (AML), as a consequence of its high
binding affinity to the oncoprotein CBFβ-SMMHC. However, how depletion of
chromatin-binding RUNX1 leads to survival of AML cells and what modulates
leukemia maintenance is poorly understood.
The inhibitory role of CBFβ-SMMHC oncoprotein
The transcription factor complex core-binding factor (CBF) is a
heterodimer composed of the stabilizing subunit CBFβ and the DNA-binding
subunit RUNX (encoded by three genes: RUNX1, RUNX2, and RUNX3). The
RUNX1/CBFβ complex regulates pathways associated with proliferation, survival,
and differentiation (Blyth, Cameron, & Neil, 2005). The genes encoding CBFβ
and RUNX1 are frequent targets of mutations in hematologic malignancies. The
chromosome inversion inv(16)(p13;q22), found in 8% of acute myeloid leukemia
(AML), disrupts and fuses the CBFβ and MYH11 genes to produce the leukemia
oncoprotein CBFβ-SMMHC (Fig. 3.1A) (P. Liu et al., 1993). This fusion protein
out-competes CBFβ from the WT allele in vitro since CBFβ-SMMHC has
significantly higher affinity and altered stoichiometry for RUNX1 relative to the
native CBFβ (Fig. 3.1B) (Cao et al., 1997) (Lukasik et al., 2002). During
development, CBFβ-SMMHC expression blocks definitive hematopoiesis and
embryos die at mid-gestation (Castilla 1996). A similar phenotype is seen when
Runx1 and Cbfβ are knocked out in embryos (Castilla et al., 1996). These
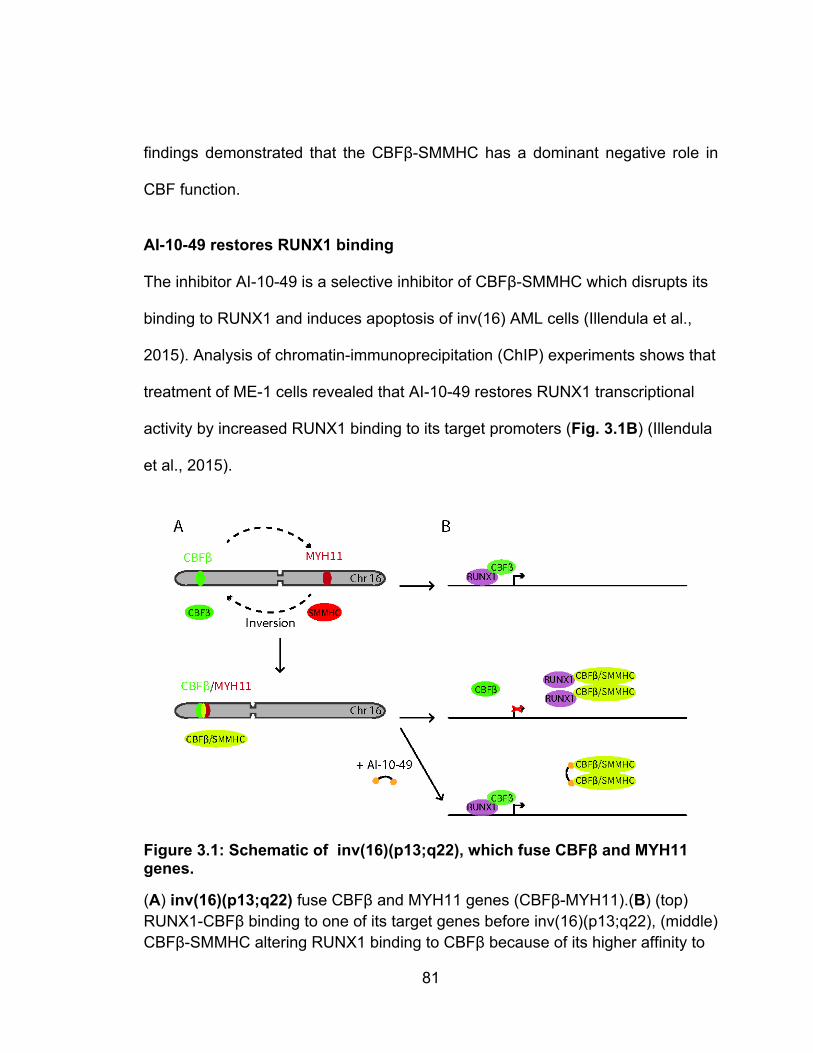
81
findings demonstrated that the CBFβ-SMMHC has a dominant negative role in
CBF function.
AI-10-49 restores RUNX1 binding
The inhibitor AI-10-49 is a selective inhibitor of CBFβ-SMMHC which disrupts its
binding to RUNX1 and induces apoptosis of inv(16) AML cells (Illendula et al.,
2015). Analysis of chromatin-immunoprecipitation (ChIP) experiments shows that
treatment of ME-1 cells revealed that AI-10-49 restores RUNX1 transcriptional
activity by increased RUNX1 binding to its target promoters (Fig. 3.1B) (Illendula
et al., 2015).
Figure 3.1: Schematic of inv(16)(p13;q22), which fuse CBFβ and MYH11 genes.
(A) inv(16)(p13;q22) fuse CBFβ and MYH11 genes (CBFβ-MYH11).(B) (top) RUNX1-CBFβ binding to one of its target genes before inv(16)(p13;q22), (middle) CBFβ-SMMHC altering RUNX1 binding to CBFβ because of its higher affinity to

82
RUNX1. (bottom) AI-10-49 binding to oncoprotein CBFβ-SMMHC, which restores RUNX1 transcriptional activity.
In this study, we combined pharmacologic, genomic, and genetic
approaches to define the mechanism by which RUNX1 binding to CBFβ-SMMHC
inhibition drives apoptosis in inv(16) AML cells. This effort uncovered a RUNX1-
mediated mechanism of MYC regulation at distal enhancers by the replacement
of activating chromatin complexes for repressive complexes.
MATERIALS AND METHODS
Cell growth
The inv(16) AML ME-1 cells (40 years old male) were cultured in RPMI
1640 with 20% fetal bovine serum, 25 mM HEPES, 100 U/mL Penicillin, 100
mg/mL Streptomycin and 1ml/mL Plasmocin
Assay for Transposase-Accessible Chromatin with sequencing (ATAC-seq)
To profile for accessible chromatin regions, we used ATAC-seq as
described elsewhere (Buenrostro et al., 2015) with the following modifications:
ME-1 cells (50,000) were treated with DMSO or AI-10-49 (1 mM) for 6 hr followed
by washing once with 1x PBS by centrifugation using 5 min at 500 g and 4�C
with low acceleration and brake settings. Cell pellets were re-suspended in
50mlof cold lysis buffer (10 mM Tris-HCl pH 7.4, 10 mM NaCl, 3 mM MgCl2,
0.1% IGEPAL CA-630) and nuclei were pelleted by centrifugation for 10 min at

83
500 g, 4C. Supernatant was discarded and nuclei were re-suspended in 25 ml
reaction buffer containing 2.5 ml of Tn5 transposase and 12.5 ml of TD buffer
(Nextera Sample preparation kit, Illumina). The reaction was incubated at 37�C
for 45 min. Imme-diately following transposition, tagmented DNA was purified
using a QIAGEN MiniElute PCR Purification Kit. For library amplification, two
sequential PCRs were conducted with indexing primers included in the Nextera
Index kit and NEBNext High-Fidelity 2x PCR Master Mix. After the first PCR, the
libraries were enriched for fragments less than 600 by using Agencourt AMPure
XP 5 mL Kit (Beckman Coulter). A second PCR was conducted with the similar
settings followed by size enrichment by Agencourt AMPure XP 5 mL Kit. DNA
was eluted and concentration was measured with a Qubit fluorometer (Life
Technologies) and library quality evaluated using 2100 Bioanalyzer (Agilent
Technologies). The libraries where sequences in 100 bp paired-end on an
Illumina HiSeq2000. ATAC-seq data analysis
The preprocessing of ATAC-seq data was followed as reported (Buenrostro et
al., 2013). Briefly, the adaptors were removed using cutadapt program v 1.3, and
reads were mapped onto the human genome hg19 assembly using Bowtie2
(Langmead and Salzberg, 2012). The standard default settings were modified to
allow mapped paired-end fragments up to 2 kb. Only the reads with mapping
quality greater than 20 were kept, and the duplicated reads were removed using
Picard tools v1.96 (https://broadinstitute.github.io/picard/), the reads from
mitochondria were also removed. To visualize the mapped reads, the bigwig files

84
were generated using deepTools2. Quality assessment of ATAC-seq data was
performed using ATACseqQC (Ou et al., 2017). Reads enrichment were called
by MACS2 v2.1.0 (Zhang et al., 2008) with default parameters using the reads
with insert size less than 100 bp as nucleosome-free regions.
ATAC-qPCR
For ATAC-qPCR, ME-1 cells were nucleofected with CRISPR/Cas9
plasmids with sgRNAs that delete a 275 bp segment including the RUNX1
binding site, sorted by flow cytometry 24 hr later and cultured overnight. ATAC
libraries were prepared from three independent biological replicates as described
above. 5% of non-transposed genomic DNA was taken as input. Enrichment of
open chromatin in the ATAC samples over input was performed by qPCR using
primers for each regulatory element, and a region centromeric from the deleted
E3 segment.
CRISPR/Cas9 – mediated deletion of the enhancer regions
The sgRNAs specific for 5’ to the region of interest were cloned in
pLentiCRISPRv2 (Addgene #52961). sgRNAs corresponding to 3’ to the region
of interest were cloned in pDecko-mCherry (Addgene #78534). The puromycin
resistance cassette in pLentiCRISPRv2 was replaced by a GFP gene using
standard cloning techniques. All sgRNA cloning was done in respective plasmids
using standard guide RNA cloning method. Briefly, top and bottom strand guide
RNA oligos were phosphorylated using T4 Polynucleotide Kinase, annealed and

85
inserted into the vectors at BsmB1 site. Guide RNA’s cloned inside the
pLentiCRISPRv2GFP were transfected into 293T/17 cells using the FuGENE 6
method according to the manufactures instructions. 48 hr after transfection,
genomic DNA was isolated and PCR was carried out to amplify the region of
interest. PCR product was re-annealed and treated with T7 endonuclease
according to the manufactures instruction. The reaction was later resolved on 2%
agarose gel and the product was analyzed. 2-3x10⁶ ME-1 cells were
nucleofected with CRISPR/Cas9 plasmids (2mg each) using Nucleofector
Technology with the program X-01 and Amaxa Cell Line Nucleofector Kit V.
Samples were sorted by flow cytometry 24 hr later. Cells were cultured overnight
and dead cells were eliminated by dead cell removal kit.
5C experimental design
3C libraries were generated as described before (Hnisz et al., 2016)
(Ferraiuolo et al., 2012), with the following modifications: 1) After HindIII digestion
no SDS was added for restriction enzyme inactivation. 2) The ligation volume as
1.2 mL for 5 million cells and a total of 20 -30 million cells were used per 5C
library preparation. 5C was carried out as previously described (Dostie et al.,
2006) (Dostie et al., 2006; (Ferraiuolo et al., 2012) (Lajoie, Berkum, Sanyal, &
Dekker, 2009), with one modification: gel purification after adapter ligation was
replaced by an Ampure step to remove unligated DNA. 5C primers were
designed for a 3.98 Mb region (chr8: 127,753,661 – 131,737,521) around the
MYC locus. 5C primers were designed at HindIII restriction sites using publicly

86
available 5C primer design tools published previously (Lajoie et al., 2009).
Primers were designed according to a double alternating scheme exactly as
described before (Hnisz et al., 2016). We designed two primers for each HindIII
fragment: one primer designed on the 5’ end of the fragment, and one on the 3’
end. For a fragment, we either designed a right 5’ forward (FOR) and a left 3’
reverse (LREV) primer, or a right 5’ reverse (REV) and a left 3’ forward (LFOR)
primer (Fig. 3.2). These two primer designs alternate along with consecutive
fragments throughout the entire region of interest. This design allows
interrogation of all pairwise interactions among all fragments, which is not
possible with a more simple alternating design used previously (Lajoie et al.,
2009).
Figure 3.2: Double alternating design for 5C probes.
F: right 5’ forward (FOR), LR: left 3’ reverse (LREV), R: right 5’ reverse (REV), LF: left 3’ forward (LFOR).

87
Primer settings
Primers settings were: U-BLAST, 3; S-BLAST, 50, 15-MER, 800,
MIN_FSIZE, 100; MAX_FSIZE, 50,000; OPT_TM, 65; OPT_PSIZE, 40. The 5C
primer tails were: FOR/LFOR: T7 sequence 5’-TAATACGACTCACTATAGCC-3’;
REV/LREV: T3 sequence 5’-TCCCTTTAGTGAGGGTTAATA-3’. The full length
of all FOR/LFOR primers was 60 bases; the length of all REV/LREV was 61
bases. In total we designed 359 forward (FOR), 367 left forward (LFOR), 367
reverse (REV) and 367 left reverse (LREV) primers that combined interrogate
532,158 long-range chromatin interactions. Primers sequences are listed in
(GEO: GSE109764).
Generation of 5C libraries
A 5C multiplex primer annealing reaction was performed overnight at
50°C. Pairs of annealed 5C primers were ligated at the same temperature using
Taq DNA ligase for 1h. Seven ligation reactions were performed to generate 5C
libraries, except for the second biological replicate for AI-10-49-treated cells,
where 14 ligation reactions were performed. Each ligation contained 600,000
genome copies, except for the second biological replicate for AI-10-49-treated
cells, which contained 400,000 genome copies. Each primer was added to a
final amount of 0.325 fmoles. Ligated 5C primer pairs, which represent a specific
ligation junction in the 3C library and thus a long-range interaction between the
two corresponding loci, were then amplified using 20 cycles of PCR with T7 and

88
T3R universal tail primers that recognize the common tails of the 5C forward and
reverse primers. Four separate amplification reactions were carried out for each
annealing reaction described above and all the PCR products of each library
were pooled together. This pool constitutes the 5C library. The libraries were
concentrated using Amicon Ultra Centrifugal filters - 0.5ml 30K (Millipore) and
purified with Qiaquick PCR purification kit.
5C read mapping
5C libraries were sequenced on an Illumina HiSeq 4000 instrument, reads
were mapped (with Novoalign mapping algorithm V3.02.00) and 5C interactions
assembled exactly as described before (Lajoie et al., 2009) (Amartya Sanyal et
al., 2012). Data from the two biological replicates were pooled, producing a
single interaction map for DMSO treated, and AI-10-49 treated cells. Each library
has approximately 90 million valid reads.
5C filtering and analysis
5C matrices were processed using previously described methods (Lajoie et al.,
2009) (Amartya Sanyal et al., 2012). And as describe
https://github.com/dekkerlab/5C-CBFβ-SMMHC-
Inhib/blob/master/data_processing_steps.md.
Briefly, first, we removed 5C interactions that represent self-ligated
restriction fragments. Second, in 5C PCR can lead to over amplification of
individual pair-wise interactions (outliers). To remove these we first calculated

89
the average interaction frequency, and standard deviation, of all pair-wise
interactions as a function of their genomic distance using LOWESS smoothing,
as described in (Amartya Sanyal et al., 2012). This average value represents the
expected interaction frequency for a pair of loci. We then calculated the
observed/expected ratio for each interaction and expressed this as a z-score
[(observed-expected)/standard deviation] (Amartya Sanyal et al., 2012). Outliers
were then defined as those interactions with a Z-score greater than 20 in each
dataset. We then took the union of all outliers identified in the four 5C datasets
and removed these interactions from all four datasets. Third, some primers
strongly over or underperform leading to strongly enriched or depleted rows of
interactions. To identify these primers we calculated to sum of all interactions
detected with each of the 5C primers. We then defined over- and
underperforming primers as those with a sum that is outside the 1.5 times the
interquartile range (of the distribution of all row/col sums). We then took the union
of all flagged primers across the four 5C matrices and removed these from all
four datasets. Fourth, we scaled the four matrices to the same number of total
reads (50,000,000). Fifth, the matrices were balanced according to the ICE
method so that the sum of each row and each column is equal (Imakaev et al.,
2012) .Sixth, data were binned at 20kb (median) with a sliding window with 2.5
kb steps, or at 15 kb (median) with a sliding window with 2.5 kb steps when data
was plotted as interaction profiles of single loci (4C-style plots). Seventh,
matrices were balanced again after binning.

90
4C-style plots
To display the interaction profiles (4C-style plots) of selected loci we
extract rows for corresponding bins that overlap the MYC Promoter, ME1- ME2-
and E3 enhancers from the 15 Kb binned 5C interaction matrix. We also
calculated and plotted the LOWESS smoothed average plus and minus 1
standard deviation of the 5C signal as a function of genomic distance
(representing the expected 5C signal).
RESULTS
Inhibition of CBFβ-SMMHC Activity by AI-10-49 Represses MYC Expression
Gene expression analysis in the AI-10-49-treated inv(16) AML cell line
ME-1, identified 591 up- and 696 downregulated genes (>2-fold change; false
discovery rate [FDR] < 0.01). MYC was one of the most repressed genes, with
over 10-fold repression compared to untreated (Fig. 3.3A-B). Next, we
determined whether MYC levels regulate survival in inv(16) AML cells. We
quantified the cells viability of ME-1 MYC knockdown cells using small hairpin
RNAs (shRNAs). Compared to scrambled control MYC knockdown reduced the
viability of ME-1 cells by 66% (Fig. 3.3C). This suggests that MYC is required for

91
the maintenance of inv(16) leukemic cells and that reduced MYC levels mediated
by AI-10-49 treatment induced cell death.
Figure 3.3: MYC transcript level in response to AI-10-49 treatment.
(A) MYC transcript levels in ME-1 cells treated with DMSO (D) or AI-10-49 (49), estimated by RT-PCR. (B) MYC nascent transcript levels in treated ME-1 cells, estimated by RT-PCR. (C) Viability analysis (annexin V/7AAD assay) in ME-1, cells transduced with control or MYC shRNAs. Each data point represents the mean of triplicate experiments.
AI-10-49 enhances genome-wide RUNX1 DNA binding

92
ChIP-seq analysis for RUNX1 revealed that AI-10-49 treatment induces a
7-fold increase in RUNX1 binding to its target regulatory elements (Fig. 3.4A-B).
Analysis of peak distribution indicated a relative enrichment for promoter regions
(Fig. 3.4C). Runx1 recruits polycomb-repressive complexes (PRC1 and PRC2)
to its DNA target, which induces tri-methylation of lysine-27 in histone H3
(H3K27me3), thereby promoting local compaction of the chromatin structure.
Therefore, we evaluated whether AI-10-49 can modulate chromatin accessibility
in ME-1 cells by using an assay for transposase accessible chromatin with high-
throughput sequencing (ATAC-seq) (Buenrostro, Giresi, Zaba, Chang, &
Greenleaf, 2013). Analysis of ATAC-seq data in cells treated with DMSO or AI-
10-49 revealed that AI-10-49 induced a general reduction in chromatin
accessibility (Fig. 3.4D). These results suggest that AI-10-49 inhibits CBFβ-
SMMHC / RUNX1 binding, and increases the occupancy of RUNX1 to its targets,
especially the gene promoters. Once RUNX1 is bound, it triggers a global
reduction in the activity of promoters and enhancers by decreasing DNA
accessibility.

93
Figure 3.4: RUNX1 binding in response to AI-10-49 treatment.
(A, B, and C) RUNX1 ChIP-seq peaks in ME-1 cells. (A) Venn diagram of peak distribution for RUNX1. (B) Aggregated peak signal from peak center treated with DMSO (black) or AI-10-49 (red). (C) Gene distribution RUNX1 peaks in ME-1 cells treated with DMSO (left) or AI-10-49 (right). (D) Scatterplot representing open chromatin peaks by ATAC-seq analysis in DMSO- and AI-10-49-treated cells.
RUNX1 represses MYC expression through binding at downstream enhancers
Active enhancers regulate elements associated with oncogene expression
in cancer including tumor-type-specific distal enhancers that regulate oncogenic
MYC expression in solid tumors (Sigova et al., 2013) (Croce & Helin, 2013)

94
(Hoke et al., 2013)(America et al., 2009). We hypothesized that AI-10-49
mediated RUNX1 function represses MYC expression by perturbing the active
distal enhancers. To test this hypothesis, we analyzed a 4 Mb genomic region
surrounding the MYC-TSS. Analysis of the 2 Mb downstream region revealed no
significant changes to chromatin accessibility (by ATAC-seq) and a small
reduction in H3K27ac mark in AI-10-49 treated cells (Fig. 3.5A). Moreover,
analysis of RUNX1 ChIP-seq peaks identified three elements with an increase in
AI-10-49 treated cells. The primary RUNX1 peak was within the BDME super-
enhancer (BRD4-mediated MYC enhancer), located 1.7 Mb downstream of the
MYC-TSS (Fig. 3.5A-B). The BDME associates with the SWI/SNF, BRG1, and
BRD4 proteins to regulate MYC expression in myeloid cells and in mixed-lineage
leukemia (Shi et al., 2013). After AI-10-49 treatment the primary RUNX1 peak
was located at element 3 and 5 (E3, E5) of the 5 conserved elements of the
BDME (Fig. 3.5A-B). The two other RUNX1 peaks at MYC enhancer 1 and 2
(ME1 and ME2) were located at 0.18 Mb and 0.5 Mb, respectively, which are
downstream of the MYC TSS. Surprisingly, RUNX1 peaks were not increased at
the MYC promoter (Fig. 3.5A-B). We evaluated if AI-10-49 treatment would alter
binding of the transcription activator p300 in the MYC locus, using ChIP-PCR
(Fig. 3.5C). And p300 was significantly reduced in ME1 and ME2 and in the 5
elements of BDME (p < 0.05). These data suggest that the association of RUNX1
with MYC regulatory elements ME1, ME2, and E3 enhancers may induce the
reduction in MYC expression in inv(16) AML cells treated with AI-10-49.

95
Figure 3.5: RUNX1 binding to MYC downstream enhancers.
(A) Analysis of ATAC-seq, H3K27ac, and RUNX1 ChIP-seq profiles, (top) in a 2-Mb genomic region downstream of MYC, the three enhancer regions (ME1, ME2, and BDME) are depicted in green, (bottom) zoom in at the +1.7 Mb BDME super-enhancer. Five previously reported enhancer regions (E1 to E5) are depicted below the profile. (B-C) ChIP-qPCR analysis in ME-1 cells for RUNX1 in DMSO- or AI-10-49-treated cells (B), and for p300 in DMSO or AI-10-49-treated (C).

96
ME1, ME2, and E3 enhancers physically interact with the MYC promoter
Since genes are regulated in the context of topologically associating
domains (TADs) ( Nora et al., 2012) (Jesse R Dixon et al., 2012), we were
interested to determine whether AI-10-49 repressed MYC expression by
modulating TAD and/or chromatin loop formation around the MYC locus.
A critical determinant of enhancer activity in the regulation of MYC
expression is the identification of physical interaction between regulatory
elements. Considering that distant MYC enhancers have been reported up and
downstream of MYC in a variety of cancers (Yashiro-ohtani et al., 2014), we
analyzed the DNA interactions in a 4 Mb region around the MYC locus. This
region includes 1 Mb upstream and 3 Mb downstream of the MYC TSS and was
captured by utilizing carbon copy chromosome conformation capture (5C) in ME-
1 cells treated with DMSO or AI-10-49. We designed 727 forward probes and
733 reverse probes to investigate a total of 532,891 interactions along the 4 Mb
region. The connectivity heatmap maps between treatment conditions identified
three major TADs. Importantly the second TAD contained the MYC gene and
downstream enhancers ME1, ME2 and E3 (Fig. 3.6A). The second TAD is
comprised of three smaller TADs (Fig. 3.6A, arrows), wherein the first sub-TAD
included MYC, ME1, and ME2, and the third sub-TAD included the BDME super-
enhancer with E3. Notably, the TADs and CTCF binding were generally
weakened by AI-10-49 treatment (Fig. 3.6A, right panel). Analysis of the

97
interaction between these elements using 4C plots anchored at the MYC
promoter revealed its interaction with ME1, ME2 and E3/E5 enhancers (Fig.
3.6B, top). The MYC promoter also displays prominent interactions with other
elements of the BDME super-enhancer containing CTCF (Fig. 3.6B, top,
arrowhead). and these interactions become less prominent in AI-10-49 treated
cells. Similar analysis with anchoring at ME1, ME2 or E3 confirmed the
interactions between the four regulatory elements (Fig. 3.6B). Furthermore,
analysis of DMSO and AI-10-49 4C plots determined that AI-10-49 treatment did
not significantly alter these interactions (Fig. 3.6B). These experiments provide
critical evidence that the MYC promoter physically interacts with the three
RUNX1-associated enhancers ME1, ME2 or E3 in inv(16) AML cells before and
after treatments with AI-10-49. Which strengthen the hypothesis that MYC
expression and Viability of inv(16) AML cells depend on the Activity of ME1,
ME2, and E3/E5 Enhancers, which recruits the active elements at MYC
promoter. Furthermore, these results bridge the effect of RUNX1 on decreasing
MYC expression by binding to its four regulatory elements of ME1, ME2, and
E3/E5 after AI-10-49 treatment.

98
Figure 3.6: Three enhancers downstream of MYC interact directly with MYC promoter.
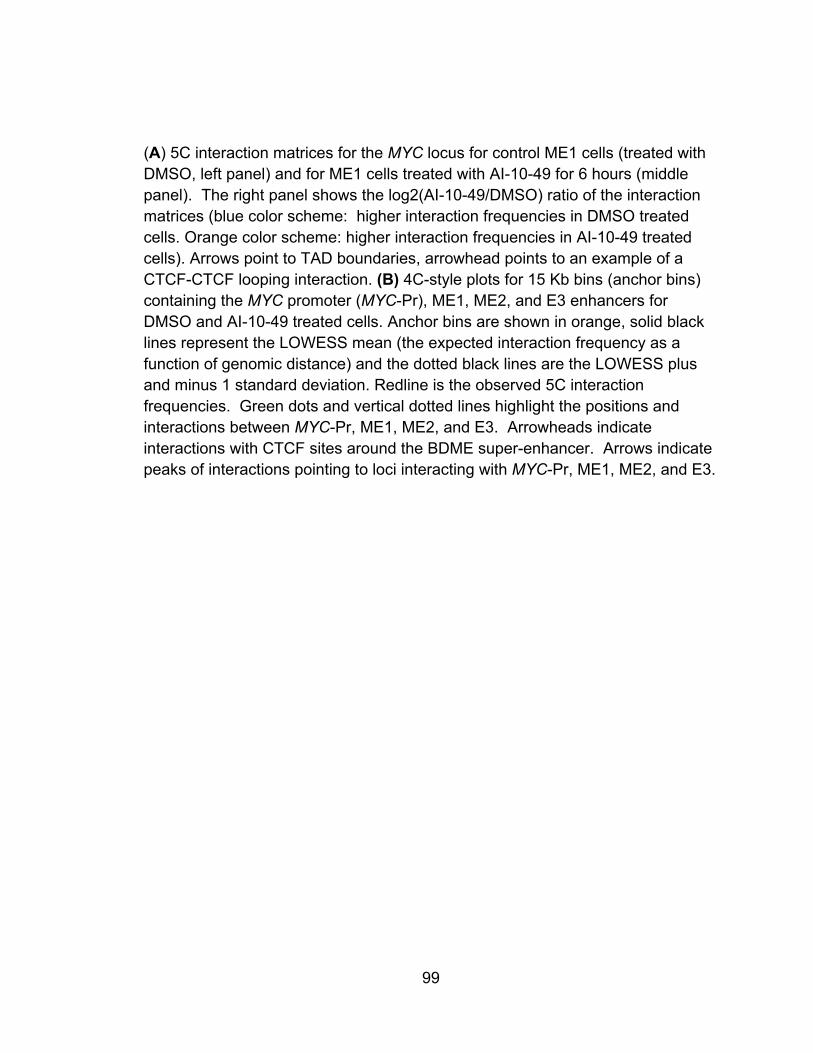
99
(A) 5C interaction matrices for the MYC locus for control ME1 cells (treated with DMSO, left panel) and for ME1 cells treated with AI-10-49 for 6 hours (middle panel). The right panel shows the log2(AI-10-49/DMSO) ratio of the interaction matrices (blue color scheme: higher interaction frequencies in DMSO treated cells. Orange color scheme: higher interaction frequencies in AI-10-49 treated cells). Arrows point to TAD boundaries, arrowhead points to an example of a CTCF-CTCF looping interaction. (B) 4C-style plots for 15 Kb bins (anchor bins) containing the MYC promoter (MYC-Pr), ME1, ME2, and E3 enhancers for DMSO and AI-10-49 treated cells. Anchor bins are shown in orange, solid black lines represent the LOWESS mean (the expected interaction frequency as a function of genomic distance) and the dotted black lines are the LOWESS plus and minus 1 standard deviation. Redline is the observed 5C interaction frequencies. Green dots and vertical dotted lines highlight the positions and interactions between MYC-Pr, ME1, ME2, and E3. Arrowheads indicate interactions with CTCF sites around the BDME super-enhancer. Arrows indicate peaks of interactions pointing to loci interacting with MYC-Pr, ME1, ME2, and E3.

100
MYC expression and viability of inv(16) AML cells depend on ME1, ME2, and E3 enhancers
After confirming the direct physical contact between MYC and the three
regulatory elements ME1, ME2, and E3, we wanted to establish the functional
significance of the three enhancers identified in inv(16) AML cells by single
deletion of each enhancer utilizing CRISPR/Cas9 technology. We asked whether
single deletions are sufficient to alter MYC expression. ME-1 cells were
transfected with Cas9 and two guide RNAs for each enhancer, in order to
produce deletions for each of the three enhancers. Analysis of sequencing
results determined that sites within the enhancers showed frequent deletion of 41
bp (ME1), 67 bp (ME2), and 275 bp (within the approximately 2,800 bp of E3),
with the overall frequency of deleted RUNX binding site alleles ranging from 77 to
99%. Furthermore, these single deletions resulted in 40% to 50% reduction in
MYC expression (Fig. 3.7B) and a reduction of cell viability (60% to 70%) (Fig.
3.7C). Taken together, these data demonstrate that ME1, ME2, and E3 function
as enhancers to maintain MYC expression levels and the viability of inv(16)
AML.However, deletion of N-Me did not affect MYC expression, which interacts
and regulate MYC In acute lymphoblastic leukemia (ALL) of T-cell type “T-ALL
cell lines”. (Yashiro-ohtani et al., 2014)

101
Figure 3.7: Deletion of Three RUNX1-Associated MYC Enhancer Elements Impairs MYC Expression and Viability of inv(16) AML
(A) Schematic of CRISPR/Cas9-mediated deletion of MYC enhancer elements (top) and frequency of deletions with RUNX1 binding site (RBS, bold) loss and of wild-type (WT) alleles at each element by sequencing analysis (bottom); PAM sequences are underlined. (B and C) MYC expression analysis by qRT-PCR (B) and viability (Annexin V-/7AAD-) analysis (C) of ME-1 cells edited for single MYC enhancers, using CRISPR/Cas9.

102
AI-10-49 induces a switch of SWI/SNF active to PRC-repressive complexes at the AML-associated MYC enhancers
RUNX1 associates with chromatin-modifying proteins, including histone
deacetylases to modulate its association with activating and repressing
chromatin complexes active chromatin complexes. Therefore, we assessed AI-
10-49-mediated changes in chromatin complex BRG1 occupancy a component
of the SWI/SNF complex that participates in BDME-mediated MYC expression
(Shi et al., 2013). ChIP-qPCR analysis in ME-1 cells revealed that BRG1 is
displaced from the MYC promoter, ME1, ME2, and BDME elements after AI-10-
49 treatment (Fig. 3.8A). In addition, the active enhancer-specific histone mark
histone H3 Lys 4 mono-methylation (H3K4me1) was significantly reduced at
ME1, ME2, and ME3, but not at the MYC promoter (p < 0.05) after AI-10-49
treatments (Fig. 3.8B). Similarly, SMARCA4 knockdown (the BRG1 gene)
reduced MYC levels (p < 0.005) (Fig. 3.8C). These results suggest that inhibition
of CBFβ-SMMHC binding to RUNX1 leads to an increase of RUNX1 binding at
MYC distal enhancers, which causes the removal of SWI/SNF-activating
complexes. On the other hand, after AI-10-49 treatment RING1B binding and
H3K27me3 marks significantly increased at the MYC promoter and distal
enhancers (Fig. 3.8D-E). Similarly, MYC expression was partially rescued by
RNF2 knockdown (the RING1B gene) in treated inv(16) AML cells (Fig. 3.8F). To
define the dynamics of chromatin complex replacement associated with AI-10-49
treatment in inv(16) AML, we performed time-course ChIP-qPCR for RUNX1,
RING1B, and BRG1 at E3 in ME-1 cells AI-10-49 treated for 6 hr (Fig. 3.8G).

103
RUNX1 and RING1B binding show a similar pattern, increasing at approximately
2.5 hr, and reaching 90% occupancy by 5 hr. Conversely, BRG1 binding was
reduced between 4 and 6 hr of treatment (Fig. 3.8G). In addition, we evaluated
the interaction between RUNX1 and BRG1 or RING1B at E3 utilizing ChIP-re-
ChIP technique. This analysis revealed that RUNX1 specifically interacts with
RING1B, but not with BRG1 at E3 and that this interaction is induced by AI-10-49
treatment (Fig. 3.8H).
These results indicate that AI-10-49 induces RUNX1 mediated repression
of MYC expression by RUNX1 directing the recruitment of PRC-repressive
complexes to the MYC enhancers, thereby evicting the SWI/SNF activating
complexes.

104
Figure 3.8: AI-10-49 Induces a Switch of Activation for Repressive Marks at RUNX1-Associated MYC Enhancers.
(A and B) ChIP-qPCR analysis of treated ME-1 cells at the promoter (PR) and eight MYC enhancers (ME1, ME2, N-Me, and BDME elements E1 to E5) for BRG1 (A) and H3K4me1 (B). (C) MYC transcript level analysis in ME-1 cells transduced with scramble (Scr) or SMARCA4 shRNAs (sh3 and sh4), estimated by qRT-PCR. (D and E) ChIP-qPCR analysis of treated ME-1 cells at MYC

105
promoter and MYC enhancers for RING1B (D) and H3K27Me3 mark (E). (F) MYC transcript level analysis in ME-1 cells transduced with scramble (Scr) or RNF2 shRNAs (sh2 and sh4) and treated with DMSO (D) or AI-10-49 (49), estimated by qRT-PCR. (G) Time-course ChIP-qPCR analysis of RUNX1, RING1B, and BRG1 binding at E3 in treated ME-1. (H) Quantitative ChIP-re-ChIP of treated ME-1 ChIPed for RUNX1 or immunoglobulin G (IgG) and re-ChIPed for IgG (red), RING1B (violet), or BRG1 (blue), at the E3 enhancer.
CONCLUSION
Transcription factor function can determine leukemia maintenance
In the present study, we have investigated the mechanism underlying the
dependency of inv(16) AML cells on the function of the fusion protein CBFβ-
SMMHC. We demonstrate that acute release of the RUNX1 transcription factor
from CBFβ-SMMHC directs the replacement of chromatin remodeling complexes
at three MYC distal enhancer elements, which decrease MYC expression and
induces cell death in inv(16) AML cells. Our study provides new insights on how
transcription factor function can determine leukemia maintenance. We
demonstrate that one mechanism by which CBFβ-SMMHC maintains inv(16)
AML cell viability is by blocking RUNX1 repression of MYC expression.
The direct role of RUNX1 in MYC repression
The balance between SWI/SNF and PRC epigenetic complexes
modulates enhancer activity. SWI/SNF has an oncogenic function in AML (Shi et
al., 2013) and rapidly evicts PRC1 from chromatin in a BRG1 dependent manner
(Stanton et al., 2016). Therefore, the competition between BRG1 and RING1B

106
activities seem to be critical for inv(16) AML survival. We found that inhibition of
RUNX1 binding to CBFβ-SMMHC does not increase RUNX1 binding at MYC
promoter, but does increase RUNX1 occupancy at three distal enhancers
downstream of MYC.. Therefore, RUNX1 binding at the distal enhancers
promotes the disassociation of the BRG1 and association of RING1B, which
provides a mechanistic explanation for the observed phenotype. Analysis of our
results provide evidence to strengthen the direct role of RUNX1 in MYC
repression. First, the results from 5C assays indicate that the three RUNX1-
bound enhancers physically interact with each other and with the MYC promoter
in inv(16) AML cells. Second, the deletion of discrete DNA regions that include
the RUNX1 binding sites in each of these enhancers is sufficient to reduce MYC
expression, alter chromatin marks in the region, and induce cell death. Third,
ChIP-re-ChIP assays indicate that RUNX1 directly binds to RING1B at E3 after
treatment. Therefore, acute RUNX1 activity, probably in consort with other
cofactors, may direct the eviction of SWI/SNF complexes and binding of PRC
repressive complexes at the distal enhancers.
Enhancers can modulate the expression of their targets gene in a pair-wise manner
5C data indicate that RUNX1-mediated replacement of chromatin
complexes and subsequent repression of MYC expression took place without
altering the architecture of the locus. This suggests that disruption of enhancer-

107
promoter looping may not be required to repress target gene expression. Instead,
changes in transcription factor availability and subsequent association with
chromatin complexes at pre-established loops may be more efficient to disrupt
target gene expression. Interestingly, RUNX1 has not been directly associated
with MYC expression in hematopoiesis and may suggest that the looping
interactions detected between MYC gene ME1, ME2, and E3/E5 distal
enhancers in ME-1 are not established in hematopoietic stem cell, which
delineates RUNX1 binding in the enhancers from MYC expression.

108
CHAPTER IV: Compartment-dependent chromatin interaction dynamics revealed by liquid chromatin Hi-C
The content of this chapter is a manuscript in the process of submission.
Houda Belaghzal1*, Tyler Borrman2*, Andrew D. Stephens3, Denis L.
Lafontaine1, Sergey Venev1, Zhiping Weng2, John F. Marko3,4, Job Dekker1
SUMMARY
Chromosomes are folded so that active and inactive chromatin domains
are spatially segregated to form a variety of sub-nuclear neighborhoods.
Compartmentalization is thought to occur through polymer phase/microphase
separation mediated by interactions between loci of similar type. The nature and
dynamics of these interactions are not known. We developed liquid chromatin Hi-
C to map the stability of associations between loci genome-wide. Before fixation
and Hi-C, chromosomes are fragmented removing the strong polymeric
constraint to enable detection of intrinsic locus-locus interaction stabilities and
chromatin mobility. Nuclear compartmentalization is stable when fragments are
over 10-25 kb in length. Fragmenting chromatin into pieces smaller than 6 kb led
to a gradual loss of spatial genome organization. Dissolution kinetics of
chromatin interactions vary widely for different chromatin domains, with lamin
associated domains being most stable, and speckle-associated loci most
dynamic. The polycomb-enriched B1 subcompartment also displayed highly
109
unstable interactions. Cohesin-mediated loops dissolve after fragmentation,
possibly because cohesin rings can slide off nearby DNA ends. Liquid chromatin
Hi-C provides a genome-wide view of chromosome interaction dynamics,
revealing a remarkable diversity in conformational stability at different sub-
nuclear structures
INTRODUCTION
The spatial organization of chromosomes plays roles in many aspects of
genome function, including gene regulation, DNA replication, DNA repair, and
chromosome compaction and segregation. Genomic and imaging approaches
are producing high-resolution descriptions of the conformation of chromosomes
in cell populations, in single cells, across the cell cycle, and during development
(Kind et al., 2013) (Bonev & Cavalli, 2016) (Job Dekker & Mirny, 2016)(Chen et
al., 2018)(Lieberman-aiden et al., 2009)(Job Dekker & Misteli, 2015b) (Job
Dekker, 2014)(Wang et al., 2016b)( Rao et al., 2014).
Major new questions revolve around the molecular and biophysical
processes by which different aspects of chromosome conformation form.
Significant progress has been made in developing and testing mechanistic
models for TAD and loop formation. The model that currently has most
experimental support proposes that TADs and loops form via loop extrusion
performed by the cohesin complex (Alipour & Marko, 2012)(Fudenberg et al.,
2015) (Sanborn et al., 2015) (Bouwman & Laat, 2015) (Nichols & Corces,
110
2015)(Schwarzer et al., 2017). Much less is known about the processes that
determine nuclear compartmentalization. Mechanisms of compartmentalization
are distinct from the formation of TADs and loops, as mutations in CTCF or
cohesin disrupt TADs but not compartmentalization per se (Nora et al., 2017)
(Nuebler et al., 2018) (Haarhuis et al., 2017) (Extension et al., 2017) (Glenn et
al., 2017) (Schwarzer et al., 2017)(Wutz et al., 2017). Compartmentalization has
been proposed to be the result of polymer phase separation driven by attractions
between chromatin domains of the same or similar status (Lieberman-aiden et
al., 2009) (Pieroo et al., 2016) (Falk et al., 2019) (Erdel & Rippe, 2018) (Jost et
al., 2014) (Michieletto et al., 2016) (Nuebler et al, 2018) (L. Liu et al., 2018)(Shin
et al., 2018). Polymer models simulating such attractions can reproduce the plaid
pattern characteristic of Hi-C interaction maps (Jost et al., 2014) (Michieletto et
al., 2016) (Pieroo et al., 2016) (Falk et al., 2019). However, the molecular and
biophysical basis of these attractions is unknown. Possibly these attractions
result from co-association of domains with sub-nuclear bodies that themselves
appear to form by a process of liquid-liquid phase separation (Feric et al., 2016)
(Larson et al., 2017) (Marzahn et al., 2016) (Strom & Alexander, 2017). An
example is the interaction between heterochromatic loci driven by multivalent
interactions among HP1 proteins and between HP1 proteins and H3K9me3-
modified chromatin domains (Larson et al., 2017) (Strom & Alexander, 2017).
Hi-C contact maps readily reveal global spatial separation of active and inactive
chromatin domains, and Hi-C sub-compartments suggest the presence of a

111
number of different types of sub-nuclear neighborhoods. However, Hi-C
interaction maps are population-averaged, steady-state datasets and do not
reveal the biophysical nature of the interactions that lead to this diverse set of
nuclear neighborhoods or the dynamic mobility of loci within these
compartments. For instance, A and B compartments appear equally prominent in
Hi-C datasets, but whether the forces that lead to their formation are equally
strong, frequent, or dynamic is not known.
Live-cell imaging studies have shown that loci are constrained in their motion and
that there are substantial variations in the dynamics and mobility of different loci,
e.g. euchromatic vs. heterochromatic loci and loci tethered to the nuclear
periphery vs. loci located in the nuclear interior (Foisner & Garini, 2015) (Hediger
et al., 2002) (Marshall et al., 1997) (Nagashima et al., 2019) (Shinkai, Nozaki,
Maeshima, & Togashi, 2016) (Thakar, Gordon, & Csink, 2006). Such differences
can be reproduced in coarse-grained simulations of chromatin (L. Liu et al.,
2018). Imaging-based studies have been instrumental in uncovering aspects of
chromatin interactions and dynamics, but are limited in scale, i.e. only one or a
few specific loci can be studied at one time. In addition, when whole genome
dynamics is analyzed microscopically (Zidovska, Weitz, & Mitchison, 2013),
positions of specific sequences have not as yet been determined.
New approaches are required to identify and quantify the molecular processes
and biophysical forces that drive chromosome and nuclear compartmentalization

112
and to characterize the dynamics and mobility of loci within these compartments.
Here we describe liquid chromatin Hi-C, a Hi-C variant that quantifies the stability
of chromosome conformation and chromatin interactions between loci genome-
wide. We find that different types of nuclear sub-compartments differ in stability
of chromatin interactions. The results suggest that compartmentalization is
mainly due to strong and stable heterochromatic interactions, while associations
between open regions at and around nuclear speckles, and between loci in the
B1 sub-compartment enriched in polycomb binding, are more dynamic.
MATERIALS AND METHODS
Digestion, cross-linking and copolymer architecture and hetero/euchromatin phase separation
We have found that moderate digestion leads to formation of stronger
inter-
compartment interactions in Hi-C. While this may seem somewhat paradoxical at
first glance, this effect is rather straightforward to explain if we remember two
basic physical facts about chromatin in the G1 nucleus. First, individual
chromosomes have a "blocky" structure, with hundreds of kilobase-scale
stretches of alternatingly heterochromatin-like and euchromatin-like character
along their length. Second, the chromatin is in a state of quite extensive
“crosslinking” (i.e., noncovalent chromatin-chromatin interactions mediated by

113
proteins including gene regulatory factors such as cohesin, and heterochromatin
linkers such as HP1α.
Therefore, chromatin in the G1 nucleus can be considered as a set of
blocks of euchromatin and heterochromatin (the A and B compartments
consisting of regions of predominantly euchromatin vs heterchromatin,
respectively), which are constrained to be near each other by being part of the
same linear chromosomes, i.e., effectively being long many-block copolymers.
We suppose that the A and B heterochromatin/
euchromatin monomers have a weak tendency to repel one another (or
equivalently that A-A or B-B attract one another, for example via protein-
mediated nucleosome-nucleosome interactions acting preferentially on
euchromatin or heterochromatin, or even via physio-chemical effects such as
relative hydrophobicity of more methylated nucleosomes).
If we suppose the A and B blocks to be on average N monomers long
(roughly nucleosomes for the sake of this discussion), then under melt-like
conditions the standard Flory theory of polymer phase separation predicts that if
we were to cut the polymers into pure A and B blocks at the block boundaries
(i.e., at a spacing of N monomers commensurate with the block sizes), they
would phase separate for a segment-segment interaction strength stronger than
chi* = 2/N. Note that this level of interaction (given approximately in k_B T units)
is proportional to 1/N where N is crudely in nucleosome units; for 200 kilobase
blocks, we have approximately N=1000, indicating that small fractions of a k_B T

114
in effective A/B repulsion or A-A or B-B attraction is sufficient to drive strong
euchromatin/heterochromatin phase separation (Marshall et al., 1997)
Now if we were to instead cut less frequently than this, say at every second block
boundary, so as to arrive at a system of AB linear diblock copolymers each of
length 2N (N monomers of A followed by N monomers of B), the constraint that
the A and B blocks be connected suppresses phase separation, increasing the
critical interaction (all other factors held constant) to chi* = 5.3/N (Leiblerf, 1980).
In this case bulk phase separation cannot occur, but instead local, or
"microphase separation" occurs, with formation of micelle-like or layered phase-
separated structures. Nevertheless, for chi >> chi*, strong segregation of the A
and B monomers can still occur.
If we were to not cut at all, but rather to suppose that the chromosomes
are very long multiblock copolymers, with many blocks each of N monomers
alternating between A and B ("ABABABAB... multiblock copolymers"), the critical
interaction strength will rise with increasing number of blocks, approaching the
limit chi* = 7.5/N for many blocks {Matsen, 1994 #1534}. Therefore, starting from
this limit, the tendency for chromosome domains to phase separate will be
enhanced by cutting the chromosomes up into successively smaller pieces: as
chromatin cutting increases from no cutting, we expect to see intensification of
A/B compartment contrast in the Hi-C map.

115
Now, if we cut too frequently, when the cuts become spaced smaller than
the block size (cut spacing M < N monomers), we will have the situation that the
critical interaction strength will become chi* = 2/M > 2/N, i.e., the cuts are
frequent enough to suppress phase separation by decreasing the amount of
interaction enthalpy per polymer "molecule". Therefore we expect that overly
frequent cutting will cause a reduction in A/B compartment Hi-C map contrast,
i.e., for some intermediate level of cutting similar to the sizes of the A and B
blocks, one will see a maximum level of A/B compartment contrast.
There is also likely an effect of “crosslinking” ("chromatin cross-bridging"),
which provides an additional level of constraint suppressing phase separation,
above the linear-multiblock architecture of chromosomes. For example, taking
linear diblock copolymers (N A monomers followed by N B monomers) and
circularizating them raises the critical interaction for microphase separation from
5.3/N to 8.9/N, nearly a factor of 2 (Separation & Rings, 1993)
Similarly, if we start with A and B homopolymers each of length N,
constraining them to have their ends at a flat surface, thus forcing them to mix at
the surface, increases the critical interaction for phase separation from 2/N up to
4.5/N {Marko, 1991 #1536}, with microphase separation again occurring in the
constrained case. Releasing chromatin crosslinking/cross-bridging constraints
(which also will occur for chromatin cutting) will in general also reduce the
interaction strength needed to drive phase separation, increasing A/B
compartment contrast in Hi-C maps.

116
In conclusion, basic polymer phase separation theory predicts that
gradually increasing the cleavage of chromatin will gradually increase the
intensity of A/B compartment contrast in Hi-C maps until the cuts are spaced by
approximately one A or B block; further cutting will reduce the intensity of phase
separation and A/B compartment contrast. Notably, the nature of the segregation
can be expected to be "microphase segregation" rather than bulk phase
separation, until the number of cuts is sufficient to liberate A or B "homopolymer"
segments.
K562 nuclei purification
Three sucrose cushions were made before starting nuclei purification. 30
mL of 30% sucrose [10 mM PIPES pH 7.4, 10 mM KCl, 2 mM MgCl2, pH
adjusted to 7.4 using 1 N KOH, 30% sucrose, 1 mM DTT (added prior to use),
1:100 protease inhibitor (Thermo Fisher 78438) (added prior to use)] was
transferred to a 50 mL tube, then 5 mL of 10% sucrose [10 mM PIPES pH 7.4, 10
mM KCl, 2 mM MgCl2, 10% Sucrose, 1 mM DTT (added prior to use), 1:100
protease inhibitor (added prior to use)] was slowly loaded in top of 30% sucrose,
and the tubes were incubated at 4°C until needed. K562 cell pellets (100 million
cells) were lysed using the following nuclear isolation procedure. After the cells
were spun, the pellets were washed twice with 10 mL HBSS, then pelleted after
each wash at 300 rpm for 10 min at 4°C. Cell pellets were dissolved in 15 mL
nuclear isolation buffer [10 mM PIPES PH 7.4, 10 mM KCl, 2 mM MgCl2, 1 mM
DTT (added prior to use), 1:100 protease inhibitor (added prior to use)], pH

117
adjusted to 7.4 using 1 M KOH]. Then, cells were lysed on ice in a 15 mL Dounce
homogenizer with pestle A (KIMBLE Kontes 885002-0015) by moving the pestle
slowly up and down 20 times, followed by incubation on ice for 20 min and
another 20 strokes. Next, each 5 mL of lysed extract was loaded slowly on top of
a sucrose cushion prepared earlier. Then the tubes were spun for 15 min at 800
g at 4°C. The supernatant was removed carefully for a good recovery of the
nuclei pellet in the bottom of the tube. Nuclei pellets were resuspended in 1 mL
of HBSS, then spun for 5 min at 5,000 g at 4°C using a benchtop refrigerated
centrifuge. Then, the nuclei pellet was resuspended in 3 mL HBSS, and 1 µL was
taken to quantify the nuclei before the 3 mL was split over two microfuge tubes
and spun for 5 min at 5,000 g at 4°C using a benchtop refrigerated centrifuge.
Finally, the nuclei pellet was dissolved into an adequate total volume to obtain 1
million nuclei per 0.1 mL of Nuclei storage buffer (NSB) [10 mM PIPES pH 7.4,
10 mM KCl, 2 mM MgCl2, 50% glycerol, 8.5% sucrose, 1 mM DTT (added prior
to use), 1:100 protease inhibitor (added prior to use)]. Each 0.5 mL of NSB
containing 5 million nuclei was transferred to a microfuge tube and stored at -
80ºC.
3C (Chromosome Conformation Capture)
3C was performed as described in “From cells to chromatin: Capturing
snapshots of genome organization with 5C technology” (Dostie et al., 2006).
Crosslinking: 1.25 mL of 37% formaldehyde was added to 40 mL of
HBSS. 50 million cells or nuclei were washed twice using 20 mL of HBSS and

118
then pelleted at 500 g for 10 min. The pellet was resuspended in 5 mL HBSS and
then added to 41.25 mL of HBSS and formaldehyde (final formaldehyde
concentration was 1% ). The sample was incubated at RT for 10 min on a
rocking platform. Afterward, to stop cross-linking 2.5 mL of 2.5 M glycine was
added and samples were incubated at RT for 5 min on a rotating platform. To
pellet the crosslinked cells or nuclei the sample was centrifuged at 800 g for 10
min at 4°C. After discarding the supernatant the pellet was washed twice using
HBSS. Next, the pellet was either processed immediately as described below or
was stored at -80 ºC after flash freezing using liquid nitrogen.
Cell lysis: (This step was included when cells are used, but was skipped
for 3C with purified nuclei).Cells were lysed by adding 2 mL of cold lysis buffer
[10 mM Tris-HCl (pH=8.0), 10 mM NaCl, 0.2% Igepal CA-630 (NP40)] and 20 µL
of 100x Protease inhibitors. The sample was incubated on ice for 15 min to let
the cells swell. The cells were lysed on ice using the homogenizer with pestle A
(KIMBLE Kontes 885300-0002) by moving the pestle slowly up and down 30
times and incubating on ice for 1 min followed by another 30 strokes. The sample
was transferred to two 1.5 mL microcentrifuge tubes, spun at 5,000 g at RT for 5
min using a benchtop centrifuge.
Digestion: each pellet was washed using 1 mL cold 1X NEBuffer 2.1, then
spun at 5,000 g for 5 min at RT using a benchtop centrifuge, afterward each
pellet was resuspended in 250 µL of 1X NEB2.1 buffer, and the two pellets were
pooled (~ 500 µL). 50 µL aliquots of the suspension were transferred to 10 new

119
1.5 mL microfuge tube and 292 µL of 1x NEBuffer 2.1 was added to each tube.
Next, 38 µL of 1% SDS was added per tube and mixed well, the samples were
incubated at 65ºC for 10 min, then placed on ice. 44 µL of 10% Triton X-100 was
added to each tube to quench SDS. Finally, 400 U of EcoRI (NEB R0101L) was
added per tube and incubated at 37ºC overnight on a thermocycler (with 900 rpm
for 30 sec every 4 min).
Ligation: 86 µL of 10% SDS was added to the digested samples and the
samples were then incubated at 65ºC for 30 min for EcoRI inactivation after
which the tubes were placed on ice. Each sample was then transferred to a 15
mL conical tube and 7.69 mL of ligation mix was added [820 µL 10% Triton X-
100, 820 µL 10x ligation buffer (500 mM Tris-HCl pH7.5, 100 mM MgCl2, 100mM
DTT), 82 µL 10 mg/mL BSA, 82 µL 100 mM ATP and 5.886 µL ultrapure distilled
water]. Finally, 10 U of T4 ligase (Invitrogen 15224090) was added per tube
before incubation at 16ºC for 2 hr on a thermocycler (with 900 rpm for 30 sec
every 4 min).
Reverse Crosslinking: 50 μL of 10 mg/mL proteinase K (Fisher BP1750I-
400) was added per tube, the sample was incubated at 65°C for 4 hr followed by
a second addition of 50 μL 10 mg/mL Proteinase K and overnight incubation at
65°C on a thermocycler (with 900 rpm for 30 sec every 4 min).
DNA purification: Tubes were cooled at room temperature, at this stage
each tube contains ~ 8.21 mL final volume. The samples from every two tubes
were combined to a 50 mL conical tube (~16,42 mL) to have five tubes in total.

120
DNA was extracted by adding an equal volume of 17 mL of saturated phenol
pH8.0: chloroform (1:1) (Fisher BP1750I-400) and vortexing for 3 min. Then the
mix was transferred to a 15 mL phase-lock tube (Quiagen 129073) followed by
spinning tubes at 5,000 g for 10 min. The upper phase was taken to a 50 mL
tube to start the second extraction. We added an equal volume of 17 mL
saturated phenol pH 8.0: chloroform (1:1), vortexing for 1 min. Then the upper
phase was transferred to a 15 mL phase-lock tube, and tubes were centrifuged at
5,000 g for 10 min. We pooled all the upper phases from all 5 tubes ~ 85 mL into
a single 300 mL high-speed centrifuge tube to precipitate the DNA. 8.5 mL (1/10
volume) of 3M sodium acetate pH 5.2 was added and brief vortexing was
performed, then 212 mL (2.5 volumes) of ice-cold 100% ethanol was added, and
the tube was inverted slowly several times and incubated at -80° C for 1 hr.
Afterward, the DNA was pelleted at 16,000 g for 30 min at 4°C. The supernatant
was discarded and the pellet was dissolved in 500 µL 1X TLE and transferred to
a 0.5 mL AMICON Ultra Centrifuge filter (UFC5030BK EMD Millipore). The
column was centrifuged for 5 min at 14,000 g and the flow-through was
discarded. The column was washed 4 times using 450 µL of 1X TLE for desalting
DNA. After the final wash, the library remaining in the column (~50 µL) was
eluted in 30 µL of 1XTLE, the column was flipped upside down into a new tube to
collect DNA by centrifugation for 3 min at 4,000 g. RNA was degraded by adding
1 µL of 10 mg/mL RNAase A and incubation for 30 min at 37°C.

121
Quality control assessment: to test the quality of the 3C library we used
PCR to amplify a specific ligation product formed by two nearby restriction
fragments, using the following primers:
GPF33: GACCTCTGCACTAGGAATGGAAGGTTAGCC
GPF23: GACTAATTCCTGACACTACTTGAGGGATAC
The amplicon was digested with EcoRI to assess the efficiency of 3C ligation.
BAC library for 3C-PCR
BAC DNA was generated as described (Dostie et al., 2006). A control
ligation library covering the Beta-globin locus (ENCODE region ENm009) was
generated using BACs overlapping the region. Starting with a mixture of DNA of
seven BACs (CTC-775N13, RP11-715G8, CTD-3048C22, CTD3055E11, CTD-
2643I7, CTD-3234J1, and RP11-589G14) (Invitrogen), mixed in equimolar ratios,
we used the same steps described in the 3C protocol above starting from the
digestion step. BAC clones were digested with EcoRI, then randomly ligated, and
the DNA was purified. The BAC ligation library reflects random ligation of EcoRI
fragments throughout the beta-globin locus, so any difference in PCR signal for
3C primer pairs along the beta-globin locus due to differences in primer efficiency
can be corrected by normalizing the amount of PCR product obtained with the 3C
library to the amount obtained with the BAC ligation library.
Chromosome Conformation Capture Carbon Copy (5C)

122
Experimental design : Probes were designed as described (Dostie et al.,
2006).213 5C probes were designed for a ~1 Mb region (chr11:4730996 -
5729937; hg18) around the Beta-globin locus at EcoRI restriction sites using
publicly available 5C primer design tools (Lajoie et al., 2009). Probes were
designed according to a single alternating scheme exactly as described before
(Lajoie et al., 2009) and the genomic uniqueness of all primers was verified with
the SSAHA algorithm. For each EcoRI fragment at the 1 Mb target region a
primer was designed. 104 5’ forward (FOR) and 109 5’ reverse (REV) primers
were designed.
Generation of 5C libraries :5C libraries were generated as described
before (Ferraiuolo et al., 2012) with three modifications. First, we skipped the gel
purification after the adaptor ligation and replaced this with a 1:1 Ampure step to
remove unligated DNA and adaptors. Second, barcoded Illumina adaptors were
used. Third, we performed the final PCR using TruSeq DNA LT kit Set A (REF
15041757).
Annealing: The 5C probes were pooled and combined with the 3C
template each reaction contained 800,000 genome copies of 3C template and
0.2 fmol per 5C probe [800,000 genome copies of 3C template, 2 µL of 10X
NEB4 (NEB B7004S), 2.75 µL of Salmon Sperm DNA (250 ng; (Invitrogen™
15632011), 0.25 µL of 1 fmol/µL probes , up to 20 µL ultrapure distilled water].
We set up 8 annealing reactions for each library in a 96-well PCR plate. We then
123
incubated the samples in a PCR machine and ran the following program [95°C
for 9 min, Ramp 0.1°C/sec to 55 C, then keep at 55°C for 12 hr].
Ligation: We ligated 5C probe pairs, which represent a specific ligation
junction in the 3C library, by adding 20 µL of ligation mix [2 µL of [10X Taq DNA
ligase buffer (NEB B0208S), 0.25 µL Taq DNA ligase (NEB M0208S), 17.75 uL
ultrapure distiller water] while the samples are kept in the PCR block at 55°C. We
then incubated the reactions for 1 hr at 55°C followed by a 10 min incubation at
65°C; samples were then cooled to 4°C. Negative controls (no ligase, no
template, no 5C oligonucleotide) were included to ensure the absence of any
contamination.
PCR amplification: Universal emulsion primers were used for
amplification of the ligated product by using 5C forward and reverse emulsion
primers [Forward_primer: CCTCTCTATGGGCAGTCGGTGAT. Reverse_primer :
CTGCCCCGGGTTCCTCATTCTCT] for 25 PCR cycles [6 µL of ligation product,
2.5 µL of 10XPCR (600 mM Tris-SO4, pH 8.9, 180 mM (NH4)2SO4), 1.8 mM
MgCl2, 0.2 mM dNTP, 0.5 µL F-emulsion primer (80 µM), 0.5 µL R-emulsion
primer (80 µM), 0.225 µL AmpliTaqÒ Gold DNA polymerase, ultrapure distilled
water to bring volume up to 25 µL]. We then amplified DNA using this PCR
program: [95° 9 min, 25 cycles (95°C 30 s, 65°C 30 s, 72° 30 s), 95°C 30 s, 65°C
30 s, 72°C 8 min, 4°C].
We pooled all the PCR reactions for the same library together and concentrated
the DNA to 50 µL using 0.5 mL AMICON Ultra Centrifuge filter (UFC5030BK

124
EMD Millipore). DNA was then loaded on a 2% agarose gel, along with a low
molecular weight ladder, and the gel was run in a 4°C room at 200 volts for 90
min. The 150 bp DNA that corresponded to the ligated 5C probes was isolated
from the gel using the QIAquick Gel Extraction Kit Protocol (QIAGEN 28115).
DNA was finally eluted in 32 µL of 1XTLE.
A-tailing: A dATP was added to the 3’ ends of the 5C library by adding 18
µL of A-tailing mix [5 µL NEB buffer 2.1, 10 µl of 1 mM dATP, 3 µL Klenow exo
(NEB M0212S)] to the 32 µL of DNA sample from the previous step. The reaction
was then incubated in a PCR machine [at 37°C for 30 min, then at 65°C for 20
min, and finally cooled down to 4°C]. Next, the tube was placed on ice
immediately. 1:1 Ampure was used to remove unligated adaptors. The DNA was
finally eluted in 40 µL 1X T4 DNA Ligase buffer (Invitrogen).
Illumina adapter ligation and paired-end PCR: For this step, we used the
TruSeq DNA LT kit Set A (REF 15041757). 10 µL of ligation mix [5 µL Illumina
paired-end adapters, 3 µL T4 DNA ligase Invitrogen, 2 µL 5x T4 DNA ligase
buffer (Invitrogen 5X)] was added to the 40 µL sample from the previous step.
The ligation sample was then incubated at RT for 2 hours on a tube rotator.
Afterward, the sample was run on a 2% agarose gel in a cold room 4°C at 150
volts for 120 min along with a low molecular weight ladder. The 270 bp band that
corresponds to 5C products (150 bp) ligated to the two adaptors (64 bp) was
extracted from the gel and isolated using the QIAquick Gel Extraction Kit
(QIAGEN 28115). DNA was finally eluted in 30 µL 1XTLE.
125
Pre-digestion of nuclei (liquify chromatin)
Purified nuclei as described above (K562 nuclei purification) were
placed on ice and 1 mL of HBSS was added to each 0.5 mL of 5 million frozen
nuclei. After thawing, nuclei were centrifuged 5 min at 5,000 g. The nuclei pellet
was washed twice with 1XNEB3.1 for nuclei that would be digested with DpnII or
1XNEB2.1 for nuclei that would be digested with HindIII. The nuclei were pelleted
for 5 min at 5,000 g after each wash.
Isolated nuclei: a sample of 5 million nuclei was resuspended in 1,250 µL
of 1X NEB3.1 as control, and then processed immediately for Hi-C starting at the
crosslinking step (see below Hi-C 2.0 protocol).
Undigested nuclei: Each sample of two million nuclei was resuspended in
500 µL of 1X NEB3.1 on ice, as and control for the pre-digestion and then treated
as described immediately below.
DpnII pre-digestion: Each sample of two million nuclei was resuspended in
500 µL of 1X NEB3.1 on ice. Next, 120 U of DpnII (NEB R0543S) was added to
the sample in order to obtain 10 U DpnII/µg DNA and then treated as described
immediately below.
HindIII pre-digestion: Each sample of two million nuclei was resuspended
in 500 µL of 1X NEB2.1 on ice. Next, 600 U of HindIII (NEB R0104T) was added
to the sample in order to obtain 50 U HindIII/µg of DNA and then treated as
described immediately below.

126
Next, control and pre-digestion samples were incubated at 37°C on a
thermocycler (900 rpm for 30 sec every 4 min) for 5 min up to 16 h. Afterward,
samples were placed on ice for 10 min.For DpnII-seq and assessment of
fragmentation level , a final volume of 10 mM of EDTA was added to inactivate
the endonuclease, followed immediately by the DpnII-seq protocol (details of
protocols below. DpnII-Seq) or DNA purification for fragment analyzer analysis.
For Hi-C, we proceeded immediately to the first step of the protocol (crosslinking
as described below). For microscopy, nuclei samples were cross-linked with a
4% final concentration of paraformaldehyde.
Hi-C 2.0
Hi-C was performed as described (Belaghzal, Dekker, & Gibcus, 2017)
and in Method of chapter II with some modifications in the crosslinking and lysis
step as described below.
Crosslinking: isolated, undigested, and pre-digested (with liquified
chromatin) nuclei were not pelleted after the pre-digestion step above but were
crosslinked immediately as follows: for each sample 1,250 µL volume of nuclei in
the digestion buffer was transferred to a 21.875 mL mix [625 μL of 37%
formaldehyde + 21.25 mL of HBSS]. For intact cells: 5 million K562 cells or nuclei
were washed twice with 15 mL of HBSS and pelleted at 300 g for 10 min, then

127
resuspended in 2.5 mL of HBSS. The sample was transferred to 20.625 mL
crosslinking mix [625 μL of 37% formaldehyde + 20 mL of HBSS]. All samples
were incubated at RT for 10 min on a rocking platform. Next, to stop cross-linking
1.25 mL of 2.5 M glycine was added to each sample and the mix was incubated
at RT for 5 min on a rocking platform. To pellet the crosslinked cells/nuclei, the
sample was centrifuged at 1,000 g for 10 min at 4°C. The supernatant was
discarded and the pellet was washed twice with HBSS before going to the next
step or storing samples at -80°C.
Cells lysis: This step is not needed for isolated, undigested, and pre-
digested (with liquified chromatin) nuclei. For Hi-C with intact cells: the 5 million
crosslinked cells were lysed by adding 1 mL cold lysis buffer [10 mM Tris-HCl
(pH=8.0), 10 mM NaCl, 0.2% Igepal CA-630 (NP40)] and 10 µL of 100X
Protease inhibitors. The sample was incubated on ice for 15 min to let the cells
swell. The cells were lysed on ice using a dounce homogenizer with pestle A
(KIMBLE Kontes 885300-0002) by moving the pestle slowly up and down 30
times and incubating on ice for 1 min followed by another 30 strokes. The sample
was transferred to a new 1.5 mL microcentrifuge tube, and the sample was
centrifuged at 5,000 g at RT for 5 min.
DpnII-Seq
For each DpnII-Seq library, 10 million nuclei were used right after the pre-
digestion procedure described above (Pre-digestion of nuclei). The pre-digested
nuclei were then treated as follows:
128
Proteinase K: 50 μL of 10 mg/mL proteinase K (ThermoFisher # 25530)
was added to each 500 µL pre-digested nuclei sample (2 million nuclei) (See
Methods: Pre-digestion) and the 5 tubes were incubated at 65°C for 3 hours.
DNA purification: Tubes were cooled to room temperature and all 5
samples were pooled in a single 15 mL tube (2.75 mL total volume). The DNA
was extracted by adding an equal volume of 2.75 mL of saturated phenol pH8.0:
chloroform (1:1) (Fisher BP1750I-400), followed by vortexing for 1 min. The
sample (5.5 mL) was transferred to a 15 mL phase-lock tube (Quiagen #129065)
followed by centriguation at 5,000 g for 10 min. The upper phase was transferred
to a 15 mL tube to start the second extraction. An equal volume of 2.75 mL
saturated phenol pH8.0: chloroform (1:1) was added, followed by vortexing for 1
min. Then the mix was transferred to a 15 mL phase-lock tube (Quiagen
#129065) followed by centrifugation at 5,000 g for 10 min. The upper phase of ~
2.75 mL was transferred to a 15 mL tube (high speed), 1/10 volume (275 μL) 3M
sodium acetate pH 5.2 was added followed by brief vortexing and then 2.5
volumes of ice-cold 100% ethanol (6.875 mL) were added. The tube was inverted
slowly several times, incubated at -80°C for 1 hr and then DNA was pelleted by
centrifugation at 16,000 g for 30 min at 4°C. The supernatant was discarded and
the pellet was dissolved in 500 µL 1X NEB3.1 and transferred to a 0.5 mL
AMICON Ultra Centrifuge filter (UFC5030BK EMD Millipore). The column was
centrifuged for 5 min at 14,000 g and the flow-through was discarded. The
column was washed 4 times using 450 µL of 1X NEB3.1 for desalting of DNA.

129
After the final wash, the library remaining in the column (~50 µL) was eluted in
450 µL of 1XNEB3.1; the column was flipped upside down into a new tube to
collect DNA and centrifuged for 3 min at 4,000 g. ~500 µL of DNA was
recovered. RNA was degraded by adding 1 µL of 10 mg/mL RNAase A and
incubation for 30 min at 37°C. The amount of DNA was estimated by running an
aliquot on a 1% Agarose gel along with a 1kb ladder (NEB#N3232s).
Biotin Fill-in: 1XNEB3.1 was added the reaction to a final volume of 680
µL, and then the 680 µL was split over 2 1.5 mL tubes. DNA ends were filled in
and marked with biotin-14-dATP. To each tube 60 μL of biotin fill-in master mix
was added: [1xNEB2.1, 0.25 mM dCTP, 0.25 mM dGTP, 0.25 mM dTTP, 0.25
mM biotin-dATP (ThermoFisher#19524016), 50 U Klenow polymerase
Polymerase I (NEB M0210L)]. Samples were incubated at 37°C in a
Thermocycler for 75 mins. Next, the tubes were placed on ice immediately for 15
mins, and samples from the 2 tubes were combined to obtain a final volume ~800
µL. Amicon filters were used to reduce the volume of the final sample from 801
µL to 130 µL.
Sonication: DNA was sonicated to a size of 100 – 300 bp using a Covaris
instrument (Duty Cycle 10%, Intensity 5, Cycles per Burst 200, set Mode
Frequency sweeping, continuous degassing, process time 60 sec, Number of
cycles) for 4 cycles. The 130 µL of sonicated DNA was transferred to a 1.5 mL
tube and 1XTLE was added to a total volume of 500 µL. DNA fragment size was
130
determined by running 2 µL of DNA along with low molecular ladder (NEB) on a
2% agarose gel.
Size fractionation using AMpure XP: 500 µL AMpure beads (Beckman
Coulter A63881) were added to a 1.5 mL tube labeled as 1.1X. The tube was
placed on the MPS for 5 min, and the supernatant was removed. Beads were
resuspended in 150 µL AMpure mixture in order to make 1.1X. 400 µL of AMpure
mixture was added to 500 µL of sonicated DNA from the previous step and the
tube was labeled 0.8X. The sample was vortexed and centrifuged briefly using a
tabletop small centrifuge followed by incubation at RT for 10 min on a rocking
platform. Then the tube was placed on the MPS for 5 min at RT. The 0.8X
supernatants were collected and added to the 1.1X tube, the tube was briefly
vortexed and centrifuged followed by incubation at RT for 10 min on a rocking
platform. The tube was placed on the MPS for 5 min at RT, and the supernatant
discarded. Beads in the 0.8X and 1.1X tubes were washed twice with 1 mL 70%
ethanol, reclaiming beads against the MPS for 5 min. Beads on the MPS were
then dried until ethanol had evaporated completely. Next, 51 µL of 1XTLE was
added to the 0.8X and 1.1X tubes to elute DNA from the beads. Tubes were
incubated at RT on a rocking platform for 10 min. The 0.8X and 1.1X tubes were
placed on the MPS for 5 min. Finally, the supernatants were transferred to 1.7
mL tubes labeled 0.8X and 1.1X. The 1.1X sample contains DNA that ranges in
size from 100-300 bp. The DNA in the 0.8X sample was kept in case more DNA
was required, in which case the DNA would be sonicated using 2 cycles followed

131
by a similar round of size fractionation as described above. The amount of DNA
from both samples 0.8X and 1.1X was quantified by running 1 µL on a 2%
agarose gel along with a titration of low molecular weight DNA ladder (100 ng,
200 ng, 400 ng).
End Repair: 50 µL from the 1.1X sample was transferred to a PCR tube,
and 20 µL of end repair mix was added: [3.5X NEB ligation buffer (NEB B0202S),
0.875 mM dNTP mix, 0.375 U/µL T4 DNA polymerase, 1.25 U/µL T4
polynucleotide kinase, 0.125 U/µL Klenow DNA polymerase]. The 70 µl total
volume reaction was incubated for 30 min at 20°C in a PCR machine and then
placed on ice. The DNA was purified by 1:2 Ampure, by adding 140 µL 2X
Ampure solution to the 70 µL DNA sample followed by incubation for 5 min at RT.
The tube was placed on the MPS for 4 min to reclaim the beads and the
supernatant was discarded. The beads were washed twice with 1 mL of 70%
ethanol while on the MPS. After beads were dried DNA was eluted in 32 µL TLE
(pH 8.0) and incubation for 10 min at RT. The supernatant was transferred to a
1.5 mL tube.
A-tailing: A dATP was added to the 3’ ends by adding 18 µL of A-tailing
mix [5 µL NEB buffer 3.1, 10 µL of 1 mM dATP, 3 U Klenow exo (NEB M0212S)]
to the 32 µL of DNA sample from the previous step. The reaction was then
incubated in a PCR machine at 37°C for 30 min followed by incubation 65°C for
20 min and cooling down to 4°C. The tube was placed on ice. The volume was
brought to 100 µL by adding 1X NEB2.1. The DNA was then purified by adding

132
1:2 Ampure mix ( 200 µL of Ampure was added to the 100 µL final DNA volume).
Finally, the DNA was eluted in 40 µL of 1X T4 DNA ligase buffer (Invitrogen 5X).
Illumina adapter ligation and paired-end PCR: For this step we used the
TruSeq DNA LT kit Set A (REF#15041757). 50 µL of ligation mix [25 µL Illumina
paired-end adapters, 15 µL T4 DNA ligase Invitrogen, 10 µL 5X T4 DNA ligase
buffer (Invitrogen 5X)] was added to the 40 µL sample from the previous step.
The ligation sample was then incubated at RT for 2 hours on a rotator. Next, the
DNA was purified by adding 1:1 Ampure solution (180 µL of Ampure mix was
added to the 90 µL sample), the supernatant was discarded and beads were
washed twice with 1 mL of 70% ethanol. After the last wash step, the beads were
resuspended in 400 µL of 1X TLE and incubated at RT on a rocking platform for
10 mins. The tube was placed on the MPS for 4 mins. Finally, the 400 µL
supernatant was transferred to a new tube.
Biotin pull-down: All the following steps are done using 1.5 mL loBind tube
(Eppendorf 22431021). 15 µL of MyOne streptavidin C1 beads mix (Thermo
Fisher 65001) was transferred to a 1.5 mL tube. The beads were washed twice
with 400 µL of TWB [5 mM Tris-HCl pH8.0, 0.5 mM EDTA, 1 M NaCl, 0.05%
Tween20] by incubation for 3 min at RT. After each wash, the tube was placed
on the MPS for 1 min and the supernatant was removed. After the washes, the
beads were resuspended in 400 µL of 2X Binding Buffer (BB) [10 mM Tris-HCl
pH8.0, 1 mM EDTA, 2 M NaCl] and mixed with the 400 µL DNA from the
previous step in a new 1.5 mL. The mixture was incubated for 15 min at RT with

133
rotation. The tube was then placed on the MPS for 1 min and the supernatant
was removed. The DNA bound to the beads was washed first by adding 400 µL
of 1X BB and transferring to a new tube. The beads were reclaimed against the
MPS for 1 min, and the supernatant discarded. 100 µL of 1X TLE was added and
the beads were reclaimed against the MPS for 1 min, then the supernatant was
discarded. Finally, the DNA bound to the beads was eluted in 32.5 µL of 1X TLE.
PCR optimization: The Illumina Truseq Kit (DNA LT kit Set A
(REF#15041757)) was used for PCR amplification of DNA for DpnII-Seq. The
trial PCR reaction was set up as follows: [2.5 µL DNA bound to beads, 2 µL of
Primers mix (Truseq kit), 10 µL Master Mix (Truseq kit), 10.5 µL of ultrapure
distilled water (Invitrogen)]. The 25 µL was split over four PCR tubes (5 µL/per
tube). Each of the four samples was incubated for different PCR cycles (6, 8, 10,
or 12 cycles): [30 sec at 98°C, n cycles of (30 sec at 98°C, 30 sec at 65°C, 30
sec at 72°C), 7 min at 72°C, hold at 10°C]. The optimal PCR cycle number
needed to get enough DNA for sequencing was determined by running the 4
PCR reactions on a 2% agarose gel along with low molecular ladder titration (100
ng, 200 ng, 400 ng). Three PCR reactions of 50 µL volume were then performed:
[5 µL DNA bound to beads, 4 µL of Primers mix (Truseq kit), 20 µL Master Mix (
Truseq kit), 21 µL of ultrapure distilled water (Invitrogen)]. The 3 PCR reactions
were pooled together to obtain 150 µL total volume. The samples were reclaimed
against the MPS for 1 min, then the PCR products (supernatant) were taken to
new 1.5 mL tubes. 1:1 Ampure was performed for removal of primer dimers (150

134
µL of Ampure and 150 µL DNA sample). Finally, beads were resuspended in 35
µL of TLE to elute the DNA. DNA that remained bound to beads was saved after
a first wash using TBW followed by two washes with 1X TLE and then
resuspended in 30 µL of 1X TLE.
Lamin A Immunofluorescence and DAPI
For nuclei immunofluorescence, we prepared a coverslip by adding 1 mL of 0.1%
Poly-L-lysine solution (Sigma SLBQ5716V) for 10 min, then coverslips were dried
using Whatman papers. Each coverslip was transferred to a single well of an
eight wells plate. The coverslips were washed twice using PBS. Next 500 µL of
30% sucrose with 1 mM DTT was added on top of the coverslips to protect nuclei
from an abrupt contact with coverslip during spinning. 1 million control nuclei or
nuclei after chromatin digestion were crosslinked for 20 min using a 4% final
concentration of Paraformaldehyde immediately after pre-digestion. Next, nuclei
were added slowly on top of he sucrose solutions on the coverslips and spun for
15 mins at 2,500 g at 4°C. Next, nuclei were assumed to be attached to the
coverslips which were then transferred to a new 8 well plate. The coverslips were
washed five times with 1% PBS. Next, non-specific binding of the primary
antibody was blocked by adding 500 µL of the blocking buffer [3% BSA, 1X PBS,
0.1% Triton X-100 (Sigma 9002-93-1)] and incubating for 60 min at RT.
Afterward, lamin A antibody (ab 26300) was diluted 1:1000 in blocking buffer,
and the coverslip was incubated face-down on top of a 250 µL of lamin A
antibody droplet that was placed on parafilm for 120 min at RT. Then, the

135
coverslip was placed back in the well of a new plate face-up and washed five
times with washing buffer (1X PBS, 0.1% Triton X-100). The secondary antibody
Goat Anti-Rabbit (ab150077) was diluted 1:1000 in blocking buffer, and the
coverslip was incubated face-down on top of a 250 µL droplet of the secondary
antibody (Goat Abti-Rabbit (ab150077) that was placed on parafilm for 60 min at
RT. Next, the coverslip was placed back in the well of a new plate face-up and
washed five times with washing buffer (1X PBS, 0.1% Triton X-100) and twice
with 1X PBS. The slide was mounted and sealed using 10 µL antifade mountant
with DAPI (Invitrogen P36931).
For image acquisition, we used a Nikon Eclipse Ti microscope. Imaging was
performed using an Apo TIRF, N.A. 1.49, 60X oil immersion objective (Nikon),
and a Zyla sCMOS camera (Andor). Z-series of 0.2 μm slices were acquired
using Nikon Elements software (Version 4.4).
Chromatin fractionation assay
Chromatin-bound proteins were isolated and separated from free proteins. A
sample of 2 million control nuclei or pre-digested nuclei (obtained as described
above “Pre-digestion of nuclei”) was centrifuged at 5,000 g for 5 min at 4°C. The
supernatant was transferred to an Amicon column to reduce the volume from 500
µL to 100 µL by centrifugation for 4 min at 14,000 g. This sample contains the
free protein fraction. Next, 26 µL of glycerol and 1.3 µL of 100X protease inhibitor
cocktail were added to the 100 µL free proteins sample. The pellet containing the
nuclei was resuspended in 100 µL of nuclei purification buffer with Triton (10 mM

136
PIPES pH 7.4, 10 mM KCl, 2 mM MgCl2, 0.25% Triton, 1% Protease inhibitor,
1mM DTT) and incubated for 10 min on ice. Then, in order to protect protein
structure during sonication, 25 µL of glycerol was added to the 100 µL pellet
sample to have 20% final glycerol concentration. The sample was sonicated
using a Covaris instrument at 4°C as follows: (Duty Cycle 10%, Intensity 5,
Cycles per Burst 200, set Mode Frequency sweeping, continuous degassing,
process time 60 sec, 4 cycles). The pellet sample contains chromatin-bound
proteins, was transferred to a 1.5 mL tube. All samples were stored at -20. These
samples contain the protein bound CTCF and cohesin. Note: when these
samples were centrifuged after the triton solubilization, we found that no SMC3
or CTCF could be detected in the supernatant. These results indicate that non-
chromatin-bound proteins exit the nuclei and were recovered in the supernatant
prior to triton solubilization step.
For analysis of CTCF and SMC1 chromatin binding: 15 µL from each protein
sample (supernatant or pellet) was mixed with 5 µL of 5X Lane Marker Reducing
Sample Buffer (Thermo Fisher 39000), then the mix was boiled for 10 min. The
samples were cooled down to RT before loading them on a 3-8% Tris-Acetate
Protein Gels (Invitrogen EA0375PK2). Next, the gel was run in 1X Tris-Acetate
SDS Running Buffer (Invitrogen LA0041) for 75 min at 150V. For Histone H3: 1
µL of protein sample was mixed with 14 µL of PBS containing 1% Protease
inhibitor, 5 µL of 5X Lane Marker Reducing Sample Buffer was added to the mix
and boiled for 10 min. The samples were cooled down to RT before loading them

137
in Tris-Base 4-12% (Invitrogen NP0322BOX), then the gel was run in 1X MES-
SDS running buffer (Invitrogen B0002) for 60 min at 150V. The proteins were
transferred from the gel to nitrocellulose membrane using 1X western blot
transfer buffer (Thermo science 35040). The transfer was 120 min for SMC1 and
CTCF and 75 min for H3. The nitrocellulose membranes were washed using 1X
TBST [50 mM Tris-Cl, pH 7.6; 150 mM NaCl, 0.1 mL of Tween 20], then Blocked
for 120 min using 5% milk (1 g milk in 20 mL 1X TBST). The membrane when
then incubated overnight at 4°C with primary antibody diluted in 5% milk [1:1000
CTCF antibody cell signaling (activeMotif 61311), 1:2000 SMC1 (Bethyl
Antibody, A300-055A), 1:4000 H3 Abcam (ab1791)] . Next, the membranes were
washed 6 times for 10 min per wash using 1X TBST. The secondary antibody
anti-rabbit IgG HRP from cell signaling was diluted using 5% milk for CTCF and
SMC1 [1:1000 for CTCF, 1:2000 SMC1] and in 1% milk for H3 1:5000 dilution.
Membranes were incubated for 120 min at RT. Finally, membranes were washed
6 times for 10 min using 1X TBST. Finally, the membranes were developed using
luminol-based enhanced chemiluminescence(Thermo science 34076).
Micromanipulation force measurement and treatments of an isolated nuclei
Micromanipulation force measurements were conducted as described previously
(Stephens, Banigan, Adam, Goldman, & Dunn, 2017). K562 cells were grown in
microscope slide wells and treated with 1 µg/mL latrunculin A (Enzo Life
Sciences) for ~45 min before single nucleus isolation. The nucleus was isolated
by using small amounts of detergent (0.05% Triton X-100 in PBS) locally sprayed

138
onto a living cell via an “isolation” micropipette. This gentle lysis allows the use of
a second micropipette to retrieve the nucleus from the cell, using slight aspiration
and non-specific adherence to the inside of the micropipette. A third micropipette
was then attached to the opposite end of the nucleus in a similar fashion. This
last “force” micropipette was pre-calibrated for its deflection spring constant,
which is on the order of 2 nN/µm. A custom computer program written in LabView
was then run to move the “pull” micropipette and track the position of both the
“pull” and “force” pipettes. The “pull” pipette was instructed to move 5 µm at 45
nm/sec. The program then tracked the distance between the pipettes to provide a
measure of nucleus extension ~3 µm. Tracking the distance that the “force”
pipette moved/deflected multiplied by the pre-measured spring constant provides
a calculation of force exerted. Calculations were done in Excel (Microsoft) to
produce a force-extension plot from which the best-fit slope of the line would
provide a spring constant of the nucleus (nN/µm). Isolated nuclei were measured
twice initially to establish the native spring constant prior to treatment. After 50 uL
of buffer only (control), 100 units DpnII (|GATC) with NEB buffer 3.1, or 100 units
HindIII (A|AGCTT) with NEB buffer 2.1 was added to the 1.5 mL imaging well and
mixed gently. Force measurements were performed 5 min, 30 min, and 60 min
post-treatment
3C-PCR
The human β-globin locus is an ideal region to examine looping interactions
between enhancers and genes because of the strong looping interactions

139
between the LCR and HBG globin gene in the erythroleukemia cell line K562,
which highly expresses the globin genes (Dostie et al., 2006).3C libraries were
generated from: (1) K562 cells that have an LCR-HBG interaction, (2) GM12878
cells in which the LCR-HBG looping interaction is absent, and (3) beta-globin
BAC (ENm009) control to normalize for primer bias. To investigate the interaction
between the LCR and HBG gene, 3C primers from {Dostie, 2006 #593} were
used. 16 forward primers of 28-33 bp length were designed 40-60 bp upstream of
each EcoRI site throughout a 110 kb region around the Beta Globin locus (chr11:
5221788- 5337325). The EcoRI fragment overlapping with the LCR (HS3,4,5)
was used as an anchor to detect the interaction frequencies between the LCR
and EcoRI fragments throughout the -globin locus. For each primer pair,
triplicate PCR reactions were set up, and the mean of the three was normalized
to the BAC signal for the same primer pair before plotting normalized interaction
frequency in the y-axis, the distance from EcoRI fragment overlapping with LCR
to neighboring EcoRI fragments is plotted in the x-axis. Error bars are the
standard error of the mean (SEM).
5C data processing
The fastq files for 5C sequencing data were processed as described in
https://github.com/dekkerlab/5C-CBFb-SMMHC-
Inhib/blob/master/data_processing_steps.md
The Fastq files were mapped using novoalign to a reference genome built from
the pool of all 277 probes. After mapping, we combined the read-pairs. The
140
results were then transferred to a matrix format, and interactions were filtered as
previously described (Lajoie et al., 2009) (Amartya Sanyal et al., 2012).First,
interactions that belong to the same EcoRI fragment were removed. Second,
outliers that are overrepresented as a result of overamplification were also
removed. Outliers were defined as the interactions with a Z-score greater than 20
in all datasets. Third, probes that strongly over or underperform which leads to
strongly enriched or depleted interactions in a whole row of interactions, were
also removed. The four matrices were then scaled to the same number of total
reads. Finally, data were binned at 20 Kb (median) with a sliding window with 2.5
Kb steps.
Hi-C data processing
Hi-C read mapping, filtering, binning and matrix normalization were performed
using the cMapping pipeline available at https://github.com/dekkerlab/cMapping
(Lajoie et al., 2015). In brief, Hi-C reads were mapped to reference human
genome assembly hg19 using an iterative mapping strategy and Bowtie 2.
Successfully mapped reads were then filtered to remove reads mapping to the
same restriction fragment and to remove PCR duplicates. Interaction frequency
versus distance plots displayed high variance for interactions below 1 kb for all
samples. Hence, after mapping of valid pair, we removed all pairs with a genomic
distance less than 1 kb. The remaining valid read pairs were then binned to 500
kb, 40 kb, and 10 kb resolution matrices. Outlier bins of these matrices with low
signal were assigned values of NA. Then as a bias correction step, matrices

141
were normalized such that the sum of interactions in each row/column are
approximately equivalent via an iterative correction procedure (ICE) (Imakaev et
al., 2012). Lastlly, for comparison between samples, matrices were scaled such
that the total interactions for a genome-wide matrix equals one billion for each
sample. These ICEd scaled matrices were used for subsequent analyses.
A/B compartments
All reads from Hi-C in control K562 samples were pooled to identify A (active)
and B (inactive) compartments in K562 cells. A/B compartments were identified
at 40 kb resolution following the procedure described in {Lieberman-Aiden, 2009
#771} using matrix2compartment.pl in https://github.com/dekkerlab/cworld-
dekker. Briefly, each cis interaction matrix was first transformed into a z-score
matrix followed by transformation into a correlation matrix. PCA was performed
on the correlation matrix and the first eigenvector (PC1) of the PCA analysis was
used to identify compartments for each chromosome. A/B compartments were
assigned based on gene density such that the A-compartment was more gene-
dense than the B-compartment. Positive PC1 values indicate gene-rich A
compartments and negative PC1 values indicate gene-poor B compartments. For
chromosome 9 the compartments were called for each chromosome arm
separately as PC1 captured preferences for interactions within the same arm as
opposed to canonical compartment preferences.
LOS and half-life calculation

142
To measure the 3D structure changes resulting from DpnII or HindIII pre-
digestion we quantified the amount of cis interactions lost or gained in a 6 Mb
window centered at every 40 kb bin genome wide. For each 40 kb bin, the
percent of interactions occurring within its 6 Mb window (corresponding to
interactions less than or equal to 3 Mb in distance either upstream or
downstream from 40 kb bin) out of total interactions for the 40 kb bin (cis and
trans) was calculated. These 6 Mb cis percentages were calculated for control,
DpnII pre-digested, and HindIII-pre-digested nuclei. The change in 3D structure
relative to control using these cis percentages was given by the following loss of
structure (LOS) metric:
𝐿𝐿𝐿𝐿𝐿𝐿 = 𝐶𝐶𝐶𝐶𝐶𝐶𝐶𝐶𝐶𝐶𝐶𝐶𝐶𝐶𝐶𝐶𝐶𝐶𝐶𝐶% − 𝑃𝑃𝐶𝐶𝑃𝑃𝑃𝑃𝑃𝑃𝑃𝑃𝑃𝑃𝑃𝑃𝐶𝐶𝐶𝐶𝐶𝐶𝐶𝐶%
𝐶𝐶𝐶𝐶𝐶𝐶𝐶𝐶𝐶𝐶𝐶𝐶𝐶𝐶𝐶𝐶𝐶𝐶𝐶𝐶%
Hence, LOS values in the range (0, 1) represent a loss in short range contacts
after pre-digestion; LOS values < 0 represent an increase in short range contacts
after pre-digest, and an LOS equal to zero would indicate no change in structure
after pre-digestion. A window of 6 Mb was chosen as we sought here to quantify
interactions disrupted by pre-digestion. Many longer range interactions increased
after pre-digestion, potentially due to random ligations of cut fragments that start
to mix. Differences noted in A and B stability was preserved when LOS was
calculated using cis percents for entire chromosomes as opposed to a 6 Mb

143
window, however, the size of chromosomes did bias results by giving 40 kb bins
in small chromosomes greater LOS.
To quantify the timing of disrupted interactions we generated a half-life
track utilizing the Hi-C matrices from the DpnII timecourses. For each 40 kb bin
we fit a curve to the LOS of each timepoint following an exponential decay of the
form (Fig. 4.8C):
𝐿𝐿𝐿𝐿𝐿𝐿 = 𝑎𝑎 − (𝑏𝑏 × 𝑃𝑃−𝑐𝑐 × 𝑚𝑚𝐶𝐶𝑚𝑚𝑚𝑚𝑚𝑚𝑚𝑚𝐶𝐶)
such that 𝑎𝑎, 𝑏𝑏 and 𝑐𝑐 are parameters to fit.The half-life, t1/2, was defined as the
time required to reach half saturation, saturation being the 16 hour timepoint
where maximal cis interactions have been lost. Half-life values were then
computed for every 40 kb bin genome wide. To remove noisy and less reliable
t1/2 data, we first removed all extreme outliers bins where the sum of squared
residuals (SSR) for the exponential fit was greater than 0.1. Then all bins with an
SSR greater than two standard deviations from the mean was deemed an outlier
and also removed from analyses.
As LOS and t1/2 are both dependent on digestion efficiency we also generated
residual LOS and t1/2 tracks to account for bin to bin variation in digestion

144
efficiency. We used a moving average approach to calculate residuals for LOS
as a function of DpnII-seq signal and also t1/2 as a function of DpnII-seq signal
since the relationships between these variables were non-linear (Fig. 4.5F left,
Fig. 4.5C). For both stability metrics LOS and t1/2, a sliding window of 200 DpnII-
seq signal with a step size of one was used to calculate mean LOS or t1/2 signal
for each DpnII-seq signal increment (Fig. 4.5F left). Window and step size were
selected by manual inspection of moving averages and compromising between
over and underfitting. These moving averages were used to calculate residuals
such that a positive LOS residual indicates more structure loss than expected by
given digestion efficiency and a negative LOS residual indicates less structure
loss than expected. As t1/2 is inversely related to LOS, positive t1/2 residuals
indicate less structure loss than expected and negative t1/2 residuals indicate
more structure loss than expected. Moving averages were also used to generate
residuals for DpnII-seq as a function of PC1 and LOS as a function of PC1 (Fig.
4.5G, right)
DpnII-seq data analysis
Sequenced reads were mapped to the genome using the Bowtie read aligner
https://doi.org/10.1186/gb-2009-10-3-r25] and reads mapping to multiple sites of
the genome were removed. As expected, a high percentage of reads mapped
precisely to their associated restriction cut site (Fig. 4.6C). To remove potential
artificial biases, we filtered out paired-end reads from fragments whose start or
145
end coordinate was more than three nucleotides from an appropriate restriction
cut site. Filtered reads were then binned to 500 kb or 40 kb resolutions. The
K562 cell line has a primarily triploid karyotype with regions of the genome in
diploid and tetraploid states. Copy number state assignments for each 500 kb or
40 kb bin were assigned using publicly available K562 copy number data from
the Catalogue of Somatic Mutations In Cancer (COSMIC) database
(https://cancer.sanger.ac.uk/cell_lines/download). Copy number segments in the
COSMIC dataset were identified by PICNIC analysis of Affymetrix SNP6.0 array
data (PMID:19837654). Read coverage files at 500 kb and 40 kb were corrected
to a genome wide diploid state using the copy number state assignments and
dividing coverage by appropriate correction value (diploid = 1, triploid =1.5,
tetraploid = 2, etc.) per bin. (Fig. 4.6D, Fig. 4.6E). Final copy number corrected
coverage files were used for all downstream analysis and are available . DpnII-
seq computational workflow is maintained at https://github.com/tborrman/DpnII-
seq
Subcompartments
Rao et al. ( Rao et al., 2014) divided the canonical A/B compartments into five
primary subcompartments A1, A2, B1, B2, B3 based on each subcompartment’s
preferential Hi-C interactions in GM12878 cells. Subcompartments were
annotated using high resolution (~1 kb) Hi-C data and were shown to display
unique genomic and epigenomic profiles. K562 subcompartments were
annotated in (Xiong & Ma, 2018) via the method SNIPER using lower resolution

146
Hi-C data. In short, SNIPER infers subcompartments via a neural network
approach to accurately annotate subcompartments using Hi-C datasets with
moderate coverage (~500 million mapped read pairs). Xiong et al.’s K562
SNIPER subcompartments showed a substantial conservation with GM12878
annotations from Rao et al. ( Rao et al., 2014)and were also enriched in similar
epigenetic features, hence we utilized these SNIPER annotations to compare
subcompartment status with chromatin stability. K562 SNIPER subcompartments
were annotated at 100 kb resolution. To compare with our 40 kb resolution liquid
chromatin Hi-C data, we binned the 100 kb subcompartment annotations to 40kb
such that any 40 kb bin overlapping a boundary of two separate
subcompartments was assigned a value of NA. Upon piling up K562
subcompartment boundaries, we also found enrichment and depletion of various
chromatin features consistent with those described in ( Rao et al., 2014) and
(Xiong & Ma, 2018)
Sub-nuclear structures
To assess the effect of sub-nuclear structures on chromatin stability we
utilized the extensive genetic and epigenetic data publicly available for K562
cells.
Fold change over control ChIP-seq tracks for histone modifications, chromatin
remodellers, and other various proteins were downloaded from the ENCODE
Portal. To compare ChIP-seq data with t1/2, or residuals of t1/2 after correction for
DpnII-signal, we binned the ChIP-seq signal tracks into 40 kb such that each 40

147
kb bin represented the mean signal found across the bin. Bins with no
overlapping signal were designated a value of NA.
To examine the association between methylation state and t1/2 or residuals
of t1/2 after correction for DpnII-signal, we downloaded methylation state at CpG
Whole-Genome Bisulfite Sequencing (WGBS) tracks from ENCODE. As the
methylation data was mapped to hg38, we used the UCSC LiftOver program to
convert coordinates to hg19. Then percentage methylation at CpG sites was
binned to 40 kb resolution using the mean.
As there is currently no nucleolus associated domains (NADs) data
available for K562, we analyzed a binary NADs state track for the human
embryonic fibroblast IMR90 cell line . Dillinger et al. annotated NADs via a two-
state hidden Markov model of aCGH data from DNA of isolated nucleoli. Using
these annotated NADs, coverage of each 40 kb bin for NADs was assessed and
used for all our downstream analyses.
Mapping of nuclear speckle, nuclear lamina and PolII associated loci for
K562 cells was accomplished recently via the TSA-seq protocol (Chen et al.,
2018). Signal tracks of log2(pull-down/input) were downloaded from GEO and
binned to 40 kb as previously described for ChIP-seq files. Microarray data for
LaminB1 associated domains identified through the DamID protocol was also
available from that study. We used the UCSC LiftOver program to convert
coordinates from hg18 to hg19. We then binned the log2(Dam-LaminB1/Dam)
signal to 40 kb bins as previously described for ChIP-seq files.

148
To analyze cell cycle relationship with chromatin stability we downloaded
Repli-seq data for K562 cells from ENCODE. Actively replicating regions are
quantified as a percentage normalized signal for FACS sorted cells in G1 phase,
four stages of S phase (S1-S4) and G2 phase. Signal tracks for Repli-seq data
were binned to 40 kb as previously described for ChIP-seq files.
Binning of data was performed using the bedtools/v2.26.0 software. To
assess the quality of the publicly downloaded data we generated the spearman
correlation matrix of all binned signal tracks (Fig. 4.10A). Hierarchical clustering
of rows of the correlation matrix position heterochromatic marks (H3K9me3,
HP1α, HP1β, NADs, and LADs) near one another as expected. The majority
active marks form a larger cluster, with the markers for polycomb regions
(H3K27me3, CBX8, BMI1, RNF2, and SUZ12) representing facultative
heterochromatin clustered together segregating active from inactive marks.
Gene Expression
To assess the effect of gene expression on chromatin stability we utilized
processed gene expression quantifications of total RNA-seq for K562 cells
available from ENCODE (Accession ID: ENCFF782PCD). Gene locations were
mapped using the hg19 ensGene table from UCSC Table Browser. To compare
expression values with 40 kb resolution t1/2 or residuals of t1/2 after correction for
DpnII-signal tracks, fragments per kilobase million (FPKM) values for each gene
were binned to 40 kb such that each 40 kb bin represented the mean FPKM for
all genes overlapping that bin. Bins without any genes were assigned a value of

149
NA. Binned FPKM >=1 was determined to be a reasonable cutoff for expression
by inspection of the full distribution of FPKM values.
Compartmentalization saddle plots
Saddle plot was adapted from cool tools (https://github.com/hms-dbmi/hic-
data-analysis-bootcamp/tree/master/notebooks/04_analysis_cooltools-
eigenvector-saddle.ipynb).
To measure the strength of compartments the average intra-chromosomal
interactions frequencies between 40 kb bins were normalized by genomic
distance (observed/expected Hi-C maps). Then, in a 50 by 50 bin matrix, the
distance corrected interaction bins were sorted based on their PC1 value in
increasing order. Finally, all intra-chromosomal interactions with similar PC1
values were aggregated to obtain compartmentalization saddle plots. In these
plots, preferential B-B interactions are in the upper left corner, and preferential A-
A interactions are in the lower right corner.
Homotypic interaction saddle plots
The average intra-chromosomal interactions frequencies between 40 kb
bins were normalized by genomic distance (observed/expected Hi-C maps).
Then, in a 50 by 50 bin matrix, the distance corrected interaction bins were
sorted based on their signal value (TSA-seq, DamID) for a given factor (SON,
Lamin). Finally, all intra-chromosomal interactions with similar signal values were
aggregated to obtain homotypic interaction saddle plots. In these plots, pair-wise

150
interactions between loci enriched in factor binding are shown in the lower right
corner, and pair-wise interactions between loci not bound by the factor are shown
in the upper left corner.
Scaling plot
The script to generate scaling plots was adapted from cooltools Genome-
wide curves of normalized contact frequency P(s) is plotted as a function of
genomic distance for all intra-chromosomal interactions. Each library was
normalized by total valid interactions
Mean z-score heatmap
Each genome wide 40kb signal vector for a sub-nuclear structure was
cleaned for outliers above three standard deviations of the vector’s mean. Each
cleaned vector was z-score transformed and then partitioned based on the
different t1/2 residual intervals for associated bins. The mean z-score for all bins
within a given t1/2 residual interval is plotted as a square in the heatmap.
Code availability
All code for data processing and analysis, described in detail in the Methods, is
available through the following GitHub accounts:
https://github.com/dekkerlab/5C-CBFb-SMMHC-Inhib
https://github.com/dekkerlab/cMapping
https://github.com/dekkerlab/cworld-dekker

151
https://github.com/tborrman/DpnII-seq
https://github.com/tborrman/digest-Hi-C
https://github.com/hms-dbmi/hic-data-analysis-bootcamp
RESULTS
Measuring the stability of chromatin interactions that maintain nuclear
compartmentalization
As we discuss in chapter I, Flory-Huggins polymer theory predicts that
spatial segregation will occur when the product of the length of the blocks (N, the
number of monomers that make up blocks) and their effective preferential
homotypic interaction strength (א, a parameter that represents the difference in
the strength of homotypic interactions as compared to heterotypic (A-B)
interactions) is larger than a critical value C ( Fig. 1.2) (Leiblerf, 1980) (Matsen &
Schick, 1994). The dependence of microdomain formation on the product of
block size and interaction strength suggests an experimental approach to
quantify the strengths and dynamics of interactions between individual loci that
drive chromosome compartmentalization. One can start with a
compartmentalized state of the genome and fragment the chromosomes, e.g., by
in situ restriction digestion, and then identify conditions where chromatin
fragments become so short that the chromatin interaction strength between the
segments is not sufficient to maintain a phase- or microphase-separated state.

152
As a result, chromosomal domains and compartments will disassemble over time
and the chromosomal fragments of different type (e.g., As and Bs) will become
mixed, i.e. chromatin becomes liquid-like as opposed to a glassy state for intact
chromosomes (L. Liu et al., 2018). The kinetics of this dissolution and mixing
process can then be assessed genome-wide by Hi-C at different times after
chromatin fragmentation. Domains formed by strong, stable, and abundant
interactions will dissociate more slowly than domains formed by weak, unstable,
or infrequent interactions (Fig. 4.1). Such approach will identify the minimum
length of the blocks of monomers required for phase separation, the strength and
stability of chromatin interactions, the dissolution kinetics of initially phase-
separated sub-nuclear domains upon fragmentation, and how these parameters
vary along the genome. Here we describe such strategy that we call liquid
chromatin Hi-C.
Figure 4.1: Approach for measuring chromatin interaction stability
Workflow to determine the stability of chromatin interactions genome-wide, DNA (black), varying chromatin features or proteins maintaining DNA conformation (grey ovals).

153
Chromosome conformation in isolated nuclei
To facilitate enzymatic fragmentation of chromosomes, we isolated nuclei
from K562 cells, a cell line with extensive public data on chromosome
conformation and chromatin state through efforts of the ENCODE project
(Consortium, 2012). We performed four analyses to demonstrate that
chromosome conformation in isolated K562 nuclei was the same as that in intact
cells. First, DAPI staining and imaging showed that nuclei were intact with Lamin
A as a ring at the nuclear periphery (Fig. 4.3A). Second, we performed 3C (Job
Dekker et al., 2002) to assess known looping interactions between the beta-
globin locus control region and the expressed gamma-globin genes (Chien et al.,
2011) (Dostie et al., 2006). These interactions were readily detected in purified
nuclei, as they were in intact cells (Fig. 4.2). Third, 5C analysis (Dostie et al.,
2006) of a 1 Mb region surrounding the beta-globin locus showed that known
CTCF-mediated interactions were also preserved (Fig. 4.2). Fourth, genome-
wide Hi-C analysis (Belaghzal et al., 2017) (Lieberman-aiden et al., 2009)
confirmed that chromosome territories, compartments (determined by principle
component analysis, with compartments captured by the first principle
component (PC1) (Belaghzal et al., 2017) (Lieberman-aiden et al., 2009). TADs,
and CTCF-CTCF loops were intact in isolated nuclei and quantitatively similar to
those in intact cells (Fig. 4.2). We conclude that chromosome conformation and
nuclear compartmentalization as detected by 3C-based assays are intact in
purified nuclei.

154
Figure 4.2: Chromosome conformation in isolated nuclei

155
(A) Hi-C 2.0 intra-chromosomal interaction maps for K562 cells display
chromosomal compartments and TADs. Top: cells. Bottom: purified nuclei.(B) 5C
interaction map of 1 Mb region surrounding the beta-globin locus in K562 cells.
Top: cells. Bottom: purified nuclei. CTCF-mediated interactions are preserved in
purified nuclei. Red circles: positions of CTCF sites, purple square Beta-globin
locus control region (LCR). (C) 3C-PCR for a 44120 kb region surrounding the
beta-globin LCR on chromosome 11, detects at high resolution the known
looping interactions between the LCR and the expressed gamma-globin genes
(HBE1, HBG2) in K562 cells. Looping interactions are not detected in GM12878
cells that do not express these genes. Top: cells. Bottom: purified nuclei. (D) Compartmentalization saddle plots: average intra-chromosomal interaction
frequencies between 100 kb bins, normalized by genomic distance. Bins are
sorted by their PC1 value derived from Hi-C data obtained with K562 cells. In
these plots preferential B-B interactions are in the upper left corner, and
preferential A-A interactions are in the lower right corner. Numbers in the corners
represent the strength of AA interactions as compared to AB interactions and BB
interactions over BA interactions. Left: cells. Right: purified nuclei. (E) Spearman
correlation (ρ) of PC1 in cells vs PC1 in nuclei for chromosome 2 at 100kb
resolution (ρ= 0.99).

156
Extensive chromatin fragmentation leads to the formation of liquid chromatin
Next, we determined the effect of different levels of chromatin
fragmentation on overall nuclear organization. We incubated purified nuclei for
four hours with restriction enzymes that digest chromatin with different
frequencies. To quantify the extent of digestion, DNA was purified, and the size
distribution of DNA fragments was determined using an Agilent Fragment
Analyzer. Digestion with HindIII resulted in fragments that ranged in size from
~10-25 kb (Fig. 4.3B). A minority of molecules was over 25 kb (<15%), indicating
that most of the genome was fragmented to a similar extent. Digestion with DpnII
resulted in fragments that ranged in size between ~1 and ~6 kb, with less than
6% of fragments >6 kb (Fig. 4.3B). Microscopic inspection of nuclear morphology
by DAPI and Lamin A immunofluorescence staining showed that fragmentation of
chromatin with HindIII had only minor effects on nuclear morphology (Fig. 4.3A).
We did occasionally notice some small amounts of DNA emerging as tiny
droplets from the nuclear periphery, suggesting that HindIII digestion led to some
solubilization of chromatin. In contrast, fragmentation of chromatin with DpnII led
to large-scale alteration of nuclear morphology as detected by DAPI staining, and
large droplets of apparently liquid chromatin (not surrounded by Lamin A)
emerged from the nuclear periphery (Fig. 4.3A, arrow).

157
We next tested whether different chromatin fragmentation levels had an
effect on nuclear stiffness, which reflects the integrity of chromosome
conformation and chromatin interactions inside the nucleus. We previously
showed that single-nucleus isolation and whole-nucleus extension via
micromanipulation with micropipettes provides a reliable and robust way to
measure the stiffness of the nucleus (Stephens et al., 2017) K562 cells were
pre-treated with the actin depolymerizing drug latrunculin A to allow isolation of
the nucleus. Isolated nuclei were attached to two micropipettes at opposite
ends, and the whole nucleus was extended by moving an extension
micropipette. The deflection of a force micropipette multiplied by its
premeasured spring constant provides a measure of the force (Fig. 4.3C). This
data provides a force vs. extension plot (Fig. 4.3D, plots on the left), in which
the slope of the line fitted to the data is the nuclear spring constant in nN/um
(Fig. 4.3D, bar plots on the right). Extension between 0 – 30% strain
measures the chromatin-dominated regime of nuclear force response
(Stephens et al., 2017) (Stephens, Liu, Banigan, Almassalha, & Misteli, 2018) ,
and simulations of nuclear mechanics suggest chromosomal interactions
contribute to this regime (Banigan, Stephens, & Marko, 2017) . Isolated single
nuclei were measured for their native spring constant before treatment with a
restriction endonuclease and then re-measured 60 minutes post-treatment.
Nuclei treated with control conditions (only restriction buffer added to the media)
showed a slight stiffening of the nucleus (Fig. 4.3D). Treatment of nuclei with

158
HindIII did not significantly decrease the stiffness compared to controls. In sharp
contrast, DpnII-treated nuclei displayed a significant decrease (~75%) in
stiffness, consistent with previous experiments treating nuclei isolated from
mouse embryonic fibroblasts with AluI (Stephens et al., 2017). We conclude that
global chromosome and nuclear organization can tolerate genome-wide
fragmentation to 10-25 kb segments, indicating that sufficient numbers of
relatively stable chromatin interactions are maintained between these large
fragments throughout the genome to maintain nuclear stiffness. In contrast,
fragmenting the genome to smaller than 6 kb segments results in extensive loss
of chromatin morphology, loss of chromatin-mediated stiffness, and the
appearance of a liquid-like state of chromatin.

159
Figure 4.3: Extensive fragmentation of chromatin leads to liquefied chromatin
(A) Nuclear and chromatin morphology before and after chromatin fragmentation. Top row: control nuclei in restriction buffer, middle row nuclei digested for 4 hours with HindIII. Bottom row: nuclei digested for 4 hours with DpnII. Nuclei were stained with DAPI (left column), with antibodies against Lamin A (middle column). The right column shows the overlay of the DAPI and Lamin A stained images. HindIII digestion did not lead to major alteration in nuclear morphology and chromatin appearance, while DpnII digestion led to the appearance of DAPI stained droplets (arrow) exiting the nuclei. (B) Top: DNA purified from

160
undigested nuclei, and nuclei pre-digested with DpnII and HindIII was run on a Fragment Analyzer. Bottom: cumulative DNA length distributions calculated from the Fragment Analyzer data. (C) Micromanipulation of single nuclei. Isolated nuclei were attached to two micropipettes at opposite ends. Nuclei were extended by moving the right micropipette (Extension micropipette) and the force required was calculated from the deflection of the calibrated “force” (left) pipette. Blue and orange lines indicate the position of the force pipette before and after extension for control nuclei. After digestion of nuclei with DpnII (bottom) extension required less force as indicated by the much smaller deflection of the force pipette as compared to control nuclei (see also Supplemental Movies 1 and 2). (D) Force-extension plots (left) for control nuclei before and 60 minutes after incubation in restriction buffer (pre- and post control), for nuclei before and after digestion with DpnII, and for nuclei before and after HindIII digestion. Right panel: relative change in nuclear spring constants, calculated from the slopes of the force-extension plots shown on the left. Bars indicate standard error of the mean (n = 5 DpnII pre-digested nuclei, and n = 4 HindIII pre-digested nuclei).
Liquid chromatin Hi-C analysis reveals that compartmental segregation requires chromatin fragments larger than 6 kb
To determine how chromosome folding and nuclear compartmentalization
across the genome is altered as a function of chromatin fragmentation level, we
applied Hi-C before (conventional Hi-C) and after chromatin liquefication (liquid
chromatin Hi-C). Nuclei were incubated with only restriction buffer (control) for 4
hours or were digested with either HindIII or DpnII for 4 hours followed by
formaldehyde fixation and Hi-C analysis (Fig. 4.4A). Liquid chromatin Hi-C
interaction maps obtained from nuclei that were pre-digested with HindIII were
remarkably similar to those obtained with nuclei that were not pre-digested (Fig.
4.5A). The relationship between interaction frequency and genomic distance was
largely unaffected, with only a slight redistribution to longer-range interactions

161
(Fig. 4.5B). The ratio of intra- vs. inter-chromosomal interactions was also highly
similar to that in untreated nuclei (Fig. 4.5B). Compartments (Fig. 4.5D) were
readily detectable as a plaid pattern in Hi-C interaction maps. This pattern is
captured by the first principle component (PC1). Compartment positions were
unaffected (Spearman R= 0.99).
Chromosome compartment strength can be visualized and quantified by
plotting interaction frequencies between pairs of 40 kb loci arranged by their
values along the first eigenvector (PC1) to obtain compartmentalization saddle
plots (Fig. 4.5C). In these plots the upper left quadrant represents B-B
interactions and the lower right corner represents A-A interactions. Interestingly,
in nuclei pre-digested with HindIII, the strength of preferential A-A and B-B
interactions (Fig. 4.5C; Fig. 4.4C) was somewhat increased, indicating stronger
segregation of A and B compartments. This observation, puzzling at first, is in
fact readily understood when chromosomes fold as block co-polymers. Polymer
theory predicts that very mild fragmentation of a copolymer can enhance phase
(or microphase) separation by removing covalent linkages between A and B
blocks as long as the fragments are still large enough to sufficiently attract each
other. Our results show that chromatin fragments of 10-25 kb are long enough to
allow stable segregation of A and B compartments genome-wide.
Much more extensive changes in chromosome conformation were
observed when nuclei were pre-digested for 4 hours with the frequent cutting

162
enzyme DpnII (Fig. 4.5A) followed by formaldehyde fixation and Hi-C analysis.
We observed a considerable loss in shorter range (<10 Mb) intra-chromosomal
interactions, with a gain of longer range (>10 Mb) interactions and inter-
chromosomal interactions (Fig. 4.5B). The gain in inter-chromosomal interactions
appeared to be the result of random mixing of As and Bs as the preference for
interchromosomal A-A and B-B interactions decreased. Moreover, compartment
strength in cis was greatly reduced with a greater relative reduction evident in the
A compartment (Fig. 4.5C). This more prominent loss of A-A interactions
compared to B-B interactions is also apparent from direct visual inspection of the
Hi-C interaction maps: while in Hi-C maps from undigested nuclei a plaid
interaction pattern is clearly visible with two alternating patterns of chromatin
interactions (representing A and B compartments), in liquid chromatin Hi-C maps
from DpnII-pre-digested nuclei one of these two patterns is weakened more or
lost (corresponding to the A compartment). Combined, these observations show
that fragmentation in <6 kb fragments leads to loss of spatial segregation of A
and B compartments and dissolution of chromosome conformation genome-wide
but with more extensive loss of the A compartment.
Quantification of chromosome conformation dissolution upon chromatin fragmentation
Loss of chromosome conformation and dissolution of chromosomal
compartments will result in randomly mixing of previously spatially separated loci
both in cis and in trans. In Hi-C this will be apparent by loss of short-range
163
interactions and gain in longer range and inter-chromosomal interactions. We
used this phenomenon to quantify for each locus along the genome the extent of
loss of chromosome conformation upon chromatin fragmentation. Specifically,
using Hi-C data binned at 40 kb resolution we developed a metric which
represents the percentage change in short range intra-chromosomal interactions
(up to 6 Mb) for each fragmentation condition relative to control nuclei, which we
call loss of structure (LOS) (Fig. 4.4B).
We first calculated LOS after 4 hours for chromatin fragmented with
HindIII. We observe that in general short-range interactions are only somewhat
reduced, consistent with the above observation that interactions are somewhat
redistributed to longer-range interactions (Fig. 4.5B). When LOS is plotted along
chromosomes (Fig. 4.5D), we observed that LOS is not uniform: some regions
display more loss of short-range interactions than others. To determine how the
loss of interactions is related to A and B compartments, we compared LOS to the
PC1 value that captures compartmentalization (Lieberman-aiden et al., 2009)
and observed that LOS was positively correlated with PC1 (Fig. 4.5D; Fig. 4.5E
left panel): ~3 - 12% loss for loci in A and <5% loss for loci in B (Fig. 4.5E). We
note that this effect is very small and close to technical variation between
replicates. Thus, chromosome conformation and compartmentalization are intact
in nuclei pre-digested with HindIII (Fig. 4.4C for a replicate).

164
We performed the same analysis for nuclei pre-digested with DpnII for 4
hours followed by formaldehyde fixation and Hi-C. Consistent with the
micromechanical measurements described above, we find an extensive loss of
chromosome conformation, with LOS generally >80%. LOS varies along
chromosomes and is strongly positively correlated with PC1 with loci in the A
compartment displaying the largest loss (Fig. 4.5D; Fig. 4.5E right panel). These
results again show that chromatin fragmentation to <6 kb fragments leads to
extensive genome-wide dissolution of chromosome conformation, random mixing
of loci, and loss of spatial segregation of A and B compartments, with the A
compartment affected to the largest extent.
Independent contributions of compartment status and fragmentation level to chromatin dissolution
As outlined above, phase segregation of polymers is predicted to depend
on both the length of fragments and the attractive forces between them.
Therefore, one explanation for the greater effect of fragmentation on chromatin
interactions and chromosome conformation in the A compartment could be solely
that DpnII cuts more frequently in the open and potentially more accessible A
compartment. To assess this, we determined the cutting frequency of DpnII in
isolated nuclei across the genome (DpnII-seq; Fig. 4.6). Nuclei were digested
with DpnII for 4 hours, and free ends were filled in with biotinylated nucleotides.
After shearing, biotin-containing fragments were isolated, DNA was sequenced
and reads were mapped to the genome. The frequency of fragments mapping

165
with one end at a DpnII restriction site was calculated along chromosomes at 40
kb resolution and compared to PC1. We find that digestion frequency is positively
correlated with PC1 and with LOS (Fig. 4.5D; Fig. 4.5F left panel; Fig. 4.4D).
To determine whether the correlation between LOS and PC1 is only due
to the fact that DpnII digestion is correlated with PC1 we calculated the partial
correlation between LOS and PC1 after correcting for the correlations of PC1 and
LOS with DpnII digestion frequency. We find that the residuals of PC1 and LOS
are still highly correlated (Spearman R = 0.46 for chromosome 2; Fig. 4.5G). To
illustrate the correlation between LOS and PC1 independent of fragmentation
level directly we selected a set of loci along chromosome 2 that are all cut to the
same extent (1000-1100 reads in the DpnII-seq dataset). When we plot LOS vs.
PC1 for this set we find a strong correlation (Fig. 4.5F right panel, Spearman R =
0.55). We also determined the partial correlation between LOS and DpnII-seq
signal after correcting for their correlations with PC1. We find that after this
correction LOS and DpnII-seq signal show remain correlated (Spearman R =
0.17, Fig. 4.5G right panel). We conclude that when generally digested to <6 kb
fragments both compartment status (PC1) and fragment size independently
contribute to LOS. Importantly, this implies that the interaction strength between
chromatin segments is related to their compartment status.

166
Figure 4.4: Chromosome conformation dissolution upon chromatin fragmentation

167
(A) Workflow for Liquid chromatin Hi-C.(B) Illustration of loss of structure metric using a pre-digested sample and a control.(C) Hi-C interaction maps and compartmentalization saddle plots for a second replicate of control nuclei (incubated for 4 hours in restriction buffer) and nuclei pre-digested with HindIII for 4 hours.(D) Top: Spearman correlation of DpnII restriction digestion efficiency (DpnII-seq) and PC1 for chromosome 2 at 40 kb resolution. Bottom: Partial correlation of LOS (LOS residuals) with PC1 after controlling for restriction efficiency (DpnII-seq), for chromosome 2 at 40kb resolution. Spearman correlation is indicated.

168
Figure 4.5: Hi-C analysis reveals chromosome disassembly upon chromatin liquefication

169
(A) Hi-C interaction maps of chromosome 2 binned at 500 kb. Left: interaction map for control nuclei in restriction buffer prior to pre-digestion. Middle: nuclei pre-digested for 4 hours with HindIII prior to Hi-C. Right: nuclei digested for 4 hours with DpnII prior to Hi-C (see Figure 4.4A). (B) Left: genome-wide interaction frequency as function of genomic distance for control nuclei (dark blue), nuclei pre-digested with HindIII (red), and nuclei pre-digested with DpnII (cyan). Right: percentage of inter-chromosomal (trans) interaction frequencies. (C) Compartmentalization saddle plots: average intra-chromosomal interaction frequencies between 40 kb bins, normalized by expected interaction frequency based on genomic distance. Bins are sorted by their PC1 value derived from Hi-C data obtained with control nuclei. In these plots preferential B-B interactions are in the upper left corner, and preferential A-A interactions are in the lower right corner. Numbers in corners represent the strength of AA interactions as compared to AB interaction and BB interactions over BA interactions (Figure 4.8B). (D) Top plot: Eigenvector 1 values (PC1, 40 kb resolution) across a section of chromosome 2, representing A (red) and B (blue) compartments. Second plot: Loss of pair-wise interactions “LOS” (Methods and Figure 4.4B) along chromosome 2 at 40 kb resolution for nuclei pre-digested with HindIII. Third plot: LOS for nuclei pre-digested with DpnII. Fourth plot: DpnII-seq signal along chromosome 2 at 40 kb resolution. Bottom plot: LOS-residuals for nuclei pre-digested with DpnII after correction for DpnII signal. (E) Correlation between LOS for nuclei pre-digested with DpnII (left) or HindIII (right) and PC1 (for chromosome 2, Spearman correlation values are indicated). (F) Left: correlation between LOS for nuclei pre-digested with DpnII and DpnII-seq signal (for chromosome 2). Grey line indicates moving average used for residual calculation. Right: correlation between LOS for nuclei pre-digested with DpnII and PC1 for loci cut to the same extent by DpnII (1000-1100 DpnII-seq reads/ 40 kb bin; for chromosome 2). Spearman correlation values are indicated. (G) Left: partial correlation between residuals of LOS for nuclei pre-digested with DpnII and residuals of PC1 after correcting for correlations between LOS and DpnII-seq and PC1 and DpnII-seq signal. Right: partial correlation between residuals of LOS for nuclei pre-digested with DpnII and residuals of DpnII-seq signal after correcting for correlations between LOS and PC1 and DpnII-seq signal and PC1. Spearman correlation values are indicated.

170
Figure 4.6: Experimental protocol and computational workflow for DpnII-seq

171
(A) Schematic of DpnII-seq experimental protocol for recovering DNA fragments
digested by the restriction enzyme DpnII. (B) Directed graph of DpnII-seq
computational pipeline. (C) Histogram of distance to nearest DpnII recognition
site for each recovered DpnII digested fragment. (D) Raw DpnII-seq signal
displaying multiple copy number states (2N, 3N, 4N) within chromosome 3 (data
binned at 40 kb). (E) Copy number corrected DpnII-seq signal displaying single
copy number state (2N) across chromosome 3.
Dissociation kinetics of chromatin interactions and compartments
The observation that pre-digestion of chromatin with DpnII produces
chromatin fragments that are too small to maintain segregation of chromatin in A
and B compartments allowed us to measure the dissociation kinetics of
compartments and stability of chromatin interactions as loci become mobile and
start to mix. We first determined the kinetics of chromatin fragmentation (Fig.
4.8A). We digested nuclei with DpnII for different amounts of time, ranging from 5
minutes to 16 hours. At each time point, we isolated DNA to determine the extent
of digestion (Fig. 4.7A). After 5 minutes the size range of fragments was
between 3 and 15 kb (80% of fragments). After one hour 80% of DNA fragments
were smaller than 7 kb and during the subsequent hours of digestion the
fragments became gradually shorter. After 16 hours of digestion 85% of
fragments were smaller than 3.5 kb. We again sequenced DNA ends to
determine the distribution of DpnII cuts across the genome (Fig. 4.7B). We find
that at all timepoints the number of DpnII cuts per 40 kb bins was correlated with
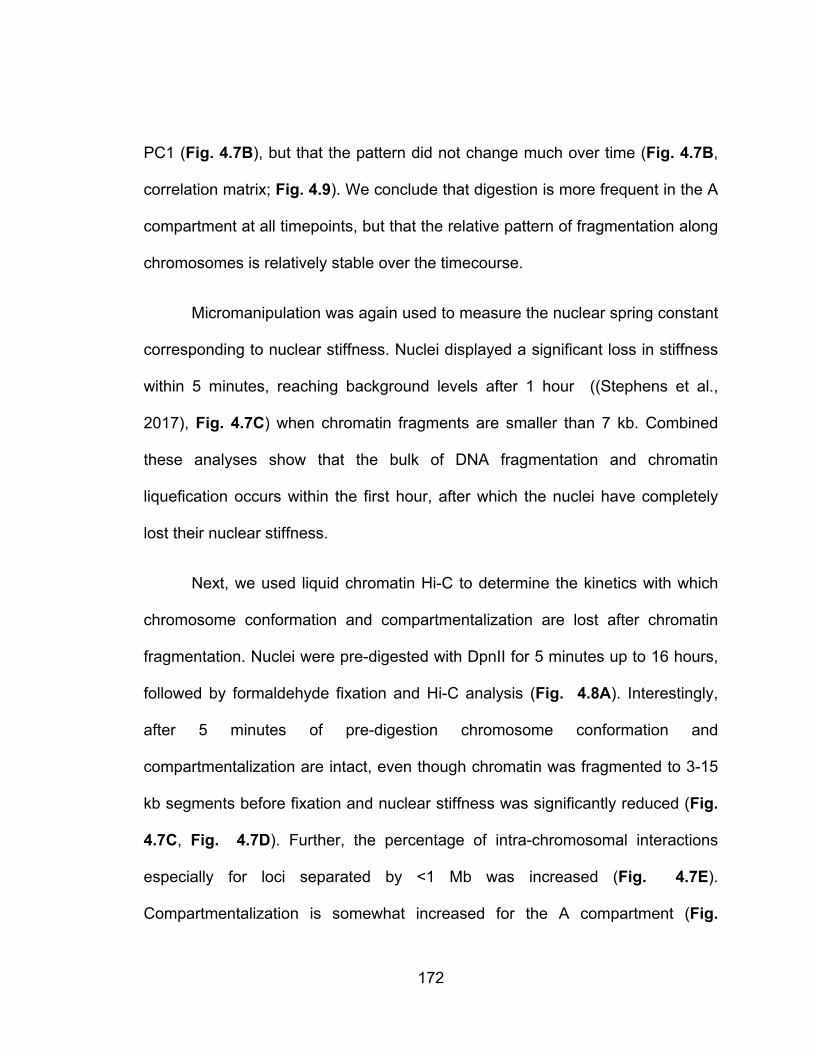
172
PC1 (Fig. 4.7B), but that the pattern did not change much over time (Fig. 4.7B,
correlation matrix; Fig. 4.9). We conclude that digestion is more frequent in the A
compartment at all timepoints, but that the relative pattern of fragmentation along
chromosomes is relatively stable over the timecourse.
Micromanipulation was again used to measure the nuclear spring constant
corresponding to nuclear stiffness. Nuclei displayed a significant loss in stiffness
within 5 minutes, reaching background levels after 1 hour ((Stephens et al.,
2017), Fig. 4.7C) when chromatin fragments are smaller than 7 kb. Combined
these analyses show that the bulk of DNA fragmentation and chromatin
liquefication occurs within the first hour, after which the nuclei have completely
lost their nuclear stiffness.
Next, we used liquid chromatin Hi-C to determine the kinetics with which
chromosome conformation and compartmentalization are lost after chromatin
fragmentation. Nuclei were pre-digested with DpnII for 5 minutes up to 16 hours,
followed by formaldehyde fixation and Hi-C analysis (Fig. 4.8A). Interestingly,
after 5 minutes of pre-digestion chromosome conformation and
compartmentalization are intact, even though chromatin was fragmented to 3-15
kb segments before fixation and nuclear stiffness was significantly reduced (Fig.
4.7C, Fig. 4.7D). Further, the percentage of intra-chromosomal interactions
especially for loci separated by <1 Mb was increased (Fig. 4.7E).
Compartmentalization is somewhat increased for the A compartment (Fig.

173
4.7D). These increases may be due to the fact that fragments are on average
around 10 kb long, only somewhat shorter than after HindIII digestion, but longer
than after 4 hours of DpnII digestion (Fig. 4.3, Fig. 4.5). As discussed above mild
fragmentation of a block copolymer is predicted to enhance both microphase or
phase separation, depending on the cut frequency (see Methods at the first
section).
At subsequent time points, when most chromatin fragments are <7 kb long
and nuclear stiffness is completely lost, we observe increased loss of intra-
chromosomal interactions and concomitant increased inter-chromosomal
interactions genome-wide (Fig. 4.7D, Fig. 4.7E). Compartmentalization, as
quantified by the preference of A-A and B-B interactions over A-B interactions, is
progressively lost (Fig. 4.7D, lower row of heatmaps, Fig. 4.8B). A-A
interactions disappear faster than B-B interactions. After 16 hours, only a low
level of preferential B-B interaction remains. This analysis shows that chromatin
fragmentation transiently leads to more frequent intra-chromosomal interactions
and stronger compartmentalization due to partial digestion which is then followed
by progressive genome-wide dissolution of chromosome conformation as
fragments become too short, and interactions between these fragments too weak
to maintain compartmentalization.
Quantification of the half-life of chromosome conformation across the genome

174
To quantify the kinetics of loss of chromosome conformation and
compartmentalization, we calculated LOS genome-wide for each time point (Fig.
4.7F). At t = 5 minutes, LOS is generally negative indicating a gain in chromatin
interactions: on average ~25% gain of intra-chromosomal interactions between
loci separated by <6 Mb, consistent with the initial increase in overall intra-
chromosomal interactions described above (Fig. 4.7E). LOS is inversely
correlated with PC1, indicating that loci located within A compartments gain more
intra-chromosomal interactions than loci located within B compartments
(Spearman R = -0.53 for chromosome 2, Spearman R = -0.49 genome-wide). At
subsequent time points, LOS is increasingly positive as intra-chromosomal
interactions are progressively lost and non-specific inter-chromosomal
interactions are gained. LOS is the highest for loci located in the A compartment.
At t = 16 hours, LOS is generally as high as 90%, intra-chromosomal interactions
are low (<20% of total), and only preferential B-B interactions are still observed in
the Hi-C interaction map (Fig. 4.7D). Very similar results were obtained with an
independent replicate of this time course experiment (see below). In that
experiment, we again observed an initial transient gain in intra-chromosomal
interactions after 5 minutes of pre-digestion, followed by a progressive loss of
chromosome conformation genome-wide, but especially in the A compartment.
Now that we measured LOS as a function of time after chromatin
fragmentation, we could calculate the dissociation rates of chromatin interactions
genome-wide. LOS as a function of time for each 40 kb locus was fitted to an

175
exponential curve, which was then used to calculate the time at which each locus
lost 50% of its intra-chromosomal (<6 Mb) interactions (Fig. 4.8C). We refer to
this time as the half-life t1/2 (minutes) of chromatin interactions at each locus (Fig.
4F). A short t1/2 represents unstable interactions, while more stably interacting
loci will have longer t1/2 values. Examining t1/2 along chromosomes, we observe a
strong inverse correlation with PC1 (Spearman R = -0.87; Fig. 4.8F): interactions
in the A compartment dissolve relatively fast (t1/2 = 40-80 minutes) while
interactions in the B compartment dissolve slower (t1/2 = 60-120 minutes; Fig.
4.8D). We also calculated t1/2 genome-wide for the second independent time
course experiment and find a strong correlation between t1/2 calculated from the
two datasets (Spearman R = 0.78 for chromosome 2; Spearman R = 0.76
genome-wide; Fig. 4.8E). The value of t1/2 is proportional to the dissociation rate
constant and thus independent of the initial level of intra-chromosomal
interactions for a given locus. Indeed, t1/2 remains highly correlated with PC1
even after correcting for correlations between the initial level of intra-
chromosomal (<6 Mb) interactions and t1/2 and between the level of intra-
chromosomal interactions and PC1 (Spearman R = -0.82, Fig. 4.8F, Fig. 4.8G).
We can also estimate the half-life of compartmentalization directly by
calculating the rate of loss of preferential A-A and B-B interactions specifically
from the compartmentalization saddle plots shown in Figure 4.7D. Using this
metric, similar values of t1/2 were observed: 50% loss of preferential A-A

176
interactions was observed after ~60 minutes, while a 50% loss of preferential B-B
interactions occurred after ~115 minutes.

177
Figure 4.7: Kinetics of chromatin fragmentation and chromatin dissolution

178
(A) DNA purified from undigested nuclei, and nuclei pre-digested with DpnII for different time points were run on a Fragment Analyzer. (B) Left: DpnII-seq signals along chromosome 2 binned at 40 kb resolution after digestion for 5 minutes, 1 hour and 2 hours. Right: correlation between DpnII-seq signals and PC1 and between DpnII-seq signals at different time points. (C) Relative change in nuclear spring constant (nN/µm) after DpnII fragmentation at different time points. Spring constant is significantly decreased after 5 minutes and at background level by 1 hour (p = 0.002, two-tailed t-test). (D) Top row: Hi-C interaction maps of chromosome 2 binned at 500 kb. Control: nuclei in restriction buffer for 4 hours. Pre-digest DpnII: nuclei were pre-digested with DpnII for 5 minutes up to 16 hours. (Figure 4.8A). Bottom row: compartmentalization saddle plots for the corresponding conditions. Numbers indicate strength of A-A and B-B interactions. (E) Top: genome-wide interaction frequency as function of genomic distance for Hi-C data shown in panel (C). Bottom: percentage of inter-chromosomal (trans) interactions genome-wide for control nuclei and for nuclei pre-digested with DpnII for up to 16 hours. (F) Top: PC1 along a section of 120 Mb of chromosome 2. Second plot: LOS along chromosome 2 at 40 kb resolution for all time points (Figure 4.4B). Third plot: half-life (t1/2) values derived from the exponential fit of the six time-points for every 40 kb bin (Figure 4.8C). Bottom plot: residuals of t1/2 after correcting for correlations between t1/2 and DpnII-seq (DpnII-seq data for t = 1 hour).

179
Figure 4.8: Liquid chromatin-Hi-C protocol and quantification of loss of structure after chromatin pre-digestion

180
(A) Workflow for Liquid chromatin Hi-C timecourse. CL = cross-linking step. (B) Compartment strength derived from compartment saddle plots (See Methods). Left: Diagram depicting compartment strength calculation for B-B interactions. Plot to the right of diagram: B-B interaction strength as a function of bin number for all timepoints of the time course. Right: Diagram depicting compartment strength calculation for A-A interactions. Plot to the right of diagram: A-A interaction strength as a function of bin number for all time points of the time course. (C) Top: LOS signal across a 40 Mb region on chromosome 2 calculated for indicated timepoints in the digestion timecourse. Line colors as in Figure 4.8 E. Bottom: Exponential curve fit to LOS timepoints for a single 40kb bin. t1/2 (dashed vertical blue line) representing time elapsed to reach half saturation of LOS signal. (D) Left: Density distributions of t1/2 for A and B compartments. Right: t1/2 saddle plots: average intra-chromosomal interaction frequencies between 40 kb bins, normalized by genomic distance. Bins are sorted by their t1/2 value derived from digestion timecourse. Bins with high t1/2 preferentially interact (bottom right of heatmap) and bins with low t1/2 preferentially interact (top left of heatmap). (E) Scatterplot of t1/2 vs t1/2 for two timecourse replicates (R1 and R2) on chromosome 2. Regression line (red). Spearman correlation is indicated. (F) Scatterplot of PC1 vs t1/2 for chromosome 2. A compartment (red); B compartment (blue). (G) Left: Scatterplot of percent interactions occurring in cis within a 6 Mb distance out of total genome wide interactions for each 40 kb bin in control Hi-C map (Cis %) vs PC1. Middle: Cis% vs t1/2. Right: Scatterplot of partial correlation between PC1 and t1/2 controlled by Cis %. A compartment (red); B compartment (blue). Solid red lines are regression lines. Spearman correlations are indicated.

181
Independent contributions of compartment status and fragmentation level to the half-life of chromatin interactions
Similar to LOS, t1/2 is correlated with DpnII digestion frequency at all
timepoints (Fig. 4.9A). We again determined the individual contributions of
compartment status and fragmentation level to t1/2. We calculated the partial
correlation between t1/2 and PC1 after correcting for correlations between PC1
and t1/2 with DpnII cutting frequency. We find that t1/2 and PC1 remain strongly
correlated (Fig. 4.7F), regardless of which DpnII fragmentation dataset (t = 5 min
up to t = 16 hours) was used for the calculation of the partial correlation (Fig.
4.9A, Fig. 4.9B). We also calculated the partial correlation between t1/2 and
fragmentation level after correcting for their correlations with PC1 and find that
fragmentation level also contributes to t1/2 but to a smaller extent (genome wide
Spearman R = -0.48, chromosome 2 Spearman R = -0.31 ). We conclude that
after digestion with DpnII dissolution kinetics are determined by both the
compartment status of loci and their fragmentation level.
Finally, we considered whether we could have overestimated the t1/2 for
loci in the B compartment because fragmentation of these loci could be slower
than for loci in the A compartment. We reasoned that because after 1 hour
incubation with DpnII digestion is largely complete, calculation of LOS using the
Hi-C data at t = 1 hour as starting condition would provide an estimate of
dissolution kinetics starting at a timepoint when A and B compartments are both
extensively fragmented. We find that LOS, and t1/2 calculated this way are still

182
strongly correlated with PC1, and this correlation remains strong after correcting
for fragmentation level (Fig. 4.9D, Fig. 4.9E, Fig. 4.9F).

183
Figure 4.9: Variations in Half-life and LOS are not explained by DpnII digestion kinetics.

184
(A) DpnII-seq signals along chromosome 2 after indicated times of digestion.
Spearman correlations between DpnII-seq and t1/2 at each timepoint is indicated.
(B) t1/2 residuals along chromosome 2 after correcting t1/2 values by the
correlation between t1/2 and DpnII-seq signals shown on the left obtained after the
indicated times of digestion. Spearman correlation between t1/2 residuals and
PC1 residuals are indicated. (C) Genome wide scatterplot of t1/2 versus 1 hour
DpnII-seq signal. Gray line: moving average. (D) Top: LOS along chromosome
2 at the indicated timepoints of digestion and calculated by comparison to Hi-C
data obtained after 1 hour of digestion. Middle: calculation of t1/2 from LOS at
different timepoints. Bottom: t1/2 along chromosome 2. This t1/2 is calculated using
the Hi-C data obtained after 1 hour of pre-digestion as starting point. (E) Partial
correlation between LOS and PC1 after correcting for their correlations with
DpnII-seq. LOS (at 2 hours) is calculated as in panel D using the Hi-C data
obtained after 1 hour of pre-digestion as starting point . (F) Partial correlation
between t1/2 and PC1 after correcting for their correlations with DpnII seq. t1/2 is
calculated as in panel D using the Hi-C data obtained after 1 hour of pre-
digestion as starting point. Spearman correlations are indicated.
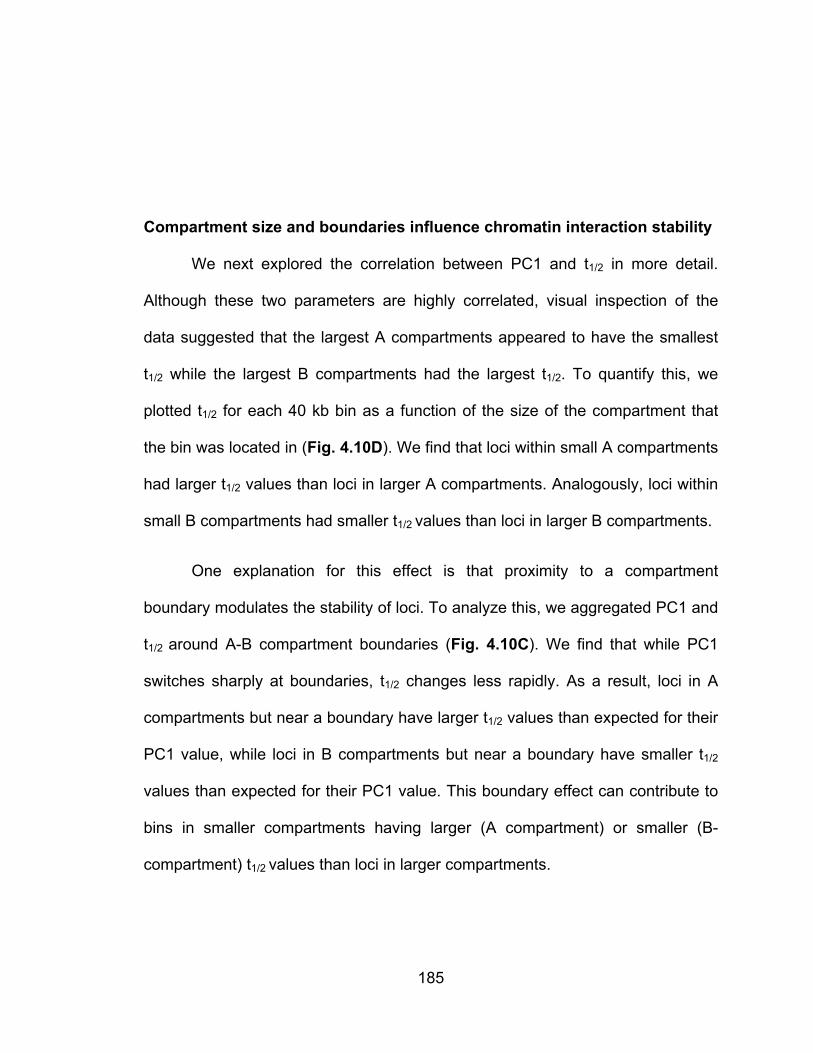
185
Compartment size and boundaries influence chromatin interaction stability
We next explored the correlation between PC1 and t1/2 in more detail.
Although these two parameters are highly correlated, visual inspection of the
data suggested that the largest A compartments appeared to have the smallest
t1/2 while the largest B compartments had the largest t1/2. To quantify this, we
plotted t1/2 for each 40 kb bin as a function of the size of the compartment that
the bin was located in (Fig. 4.10D). We find that loci within small A compartments
had larger t1/2 values than loci in larger A compartments. Analogously, loci within
small B compartments had smaller t1/2 values than loci in larger B compartments.
One explanation for this effect is that proximity to a compartment
boundary modulates the stability of loci. To analyze this, we aggregated PC1 and
t1/2 around A-B compartment boundaries (Fig. 4.10C). We find that while PC1
switches sharply at boundaries, t1/2 changes less rapidly. As a result, loci in A
compartments but near a boundary have larger t1/2 values than expected for their
PC1 value, while loci in B compartments but near a boundary have smaller t1/2
values than expected for their PC1 value. This boundary effect can contribute to
bins in smaller compartments having larger (A compartment) or smaller (B-
compartment) t1/2 values than loci in larger compartments.
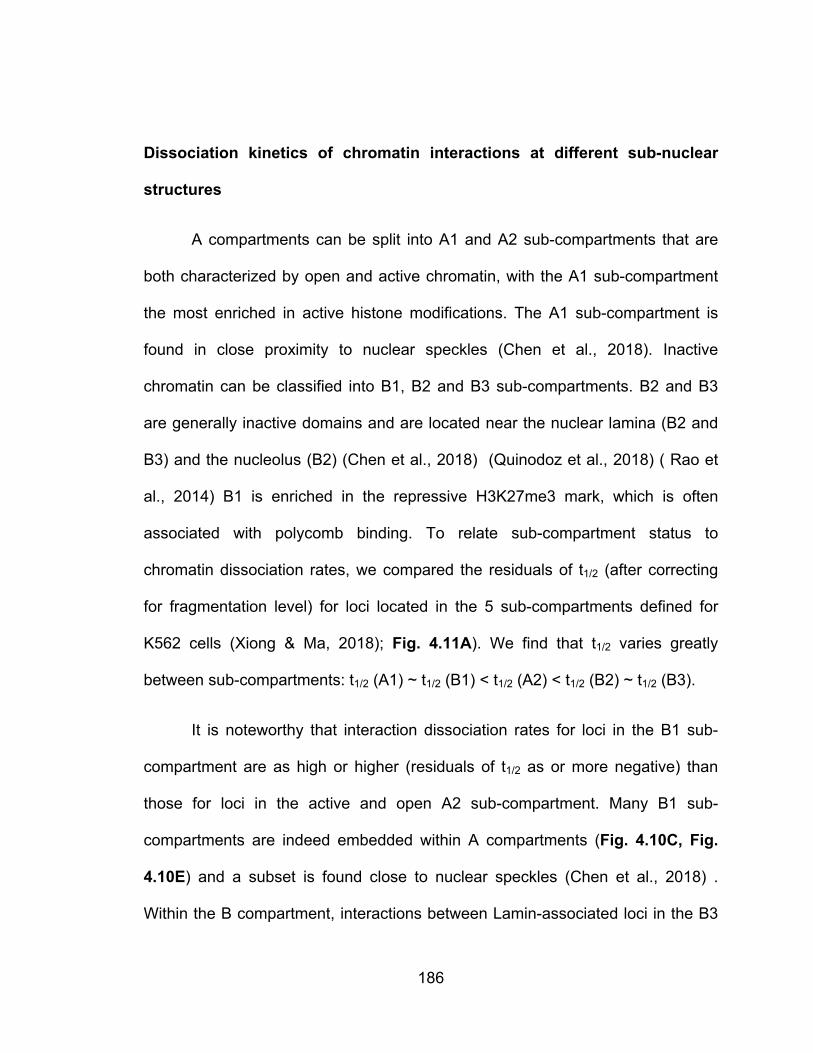
186
Dissociation kinetics of chromatin interactions at different sub-nuclear
structures
A compartments can be split into A1 and A2 sub-compartments that are
both characterized by open and active chromatin, with the A1 sub-compartment
the most enriched in active histone modifications. The A1 sub-compartment is
found in close proximity to nuclear speckles (Chen et al., 2018). Inactive
chromatin can be classified into B1, B2 and B3 sub-compartments. B2 and B3
are generally inactive domains and are located near the nuclear lamina (B2 and
B3) and the nucleolus (B2) (Chen et al., 2018) (Quinodoz et al., 2018) ( Rao et
al., 2014) B1 is enriched in the repressive H3K27me3 mark, which is often
associated with polycomb binding. To relate sub-compartment status to
chromatin dissociation rates, we compared the residuals of t1/2 (after correcting
for fragmentation level) for loci located in the 5 sub-compartments defined for
K562 cells (Xiong & Ma, 2018); Fig. 4.11A). We find that t1/2 varies greatly
between sub-compartments: t1/2 (A1) ~ t1/2 (B1) < t1/2 (A2) < t1/2 (B2) ~ t1/2 (B3).
It is noteworthy that interaction dissociation rates for loci in the B1 sub-
compartment are as high or higher (residuals of t1/2 as or more negative) than
those for loci in the active and open A2 sub-compartment. Many B1 sub-
compartments are indeed embedded within A compartments (Fig. 4.10C, Fig.
4.10E) and a subset is found close to nuclear speckles (Chen et al., 2018) .
Within the B compartment, interactions between Lamin-associated loci in the B3

187
sub-compartments dissociate the slowest while interactions between loci in the
B2 sub-compartment dissociate somewhat faster. These observations indicate
that loci associated with different sub-nuclear structures display a range of
interaction stabilities. We also noted that A2 sub-compartments are frequently
found near A-B boundaries (Fig. 4.10C) and that A2 and B2 sub-compartments
tend to be located in smaller A and B compartments respectively (Fig. 4.10E),
providing an additional explanation for the compartment size effect on t1/2
described above.
Consistent with the relation between chromatin state, sub-compartment status,
and DNA replication timing ( Rao et al., 2014), we find a strong correlation
between t1/2 residuals and replication timing. We split the genome into 10 bins,
where each bin corresponds to sets of loci that share the same t1/2 residual
interval. We then explored the enrichment for varying chromatin features for each
t1/2 residual interval (Fig. 4.11B, Fig. 4.11D). Chromatin interactions for early
replicating domains had short half-lives, while interactions for loci in later
replicating domains were more stable (Fig. 4.11B). Interestingly, loci with the
shortest t1/2 replicate in the middle of S-phase, which correlate with enrichment of
polycomb bound chromatin.
The strong correlation between active chromatin and relatively unstable
chromatin interactions led us to examine the role of transcription in more detail

188
(Fig. 4.11C). For each sub-compartment, we split loci into expressed (FPKM>=1)
or not expressed (FPKM<1) categories. We find that sub-compartment status is
the major determinant of chromatin interaction stability, irrespective of
transcriptional status. However, transcriptional status modulates t1/2 to some
extent: in general, loci located in B2 and B3 sub-compartments are engaged in
relatively stable chromatin interactions, but interactions that involve loci that are
expressed have shorter half-lives. Conversely, the expression status of loci
located in the A1, A2 sub-compartments had only very minor effect of t1/2.
Expressed loci in A1 or A2 sub-compartments had slightly longer and shorter
residual t1/2 values. Although statistically significant, the average fold difference
was small (A1: fold change = 0.84; A2: fold change = 1.72).
To explore the relationship between chromatin interaction stability,
chromatin state, and association at and around sub-nuclear structures in more
detail, we leveraged the wealth of chromatin state data available for K562 cells
(Fig. 4.11D, Fig. 4.10A, Fig. 4.10B). Chen et al. mapped loci in K562 cells that
are localized near nuclear speckles using the recently developed TSA-seq
method (Chen et al., 2018). We find that loci near the speckle-associated protein
pSC35 are engaged in the most unstable interactions in the genome. A similar
result was obtained for an independent TSA-seq dataset for the speckle
associated protein SON. Similarly, transcriptionally active loci, identified by ChIP-
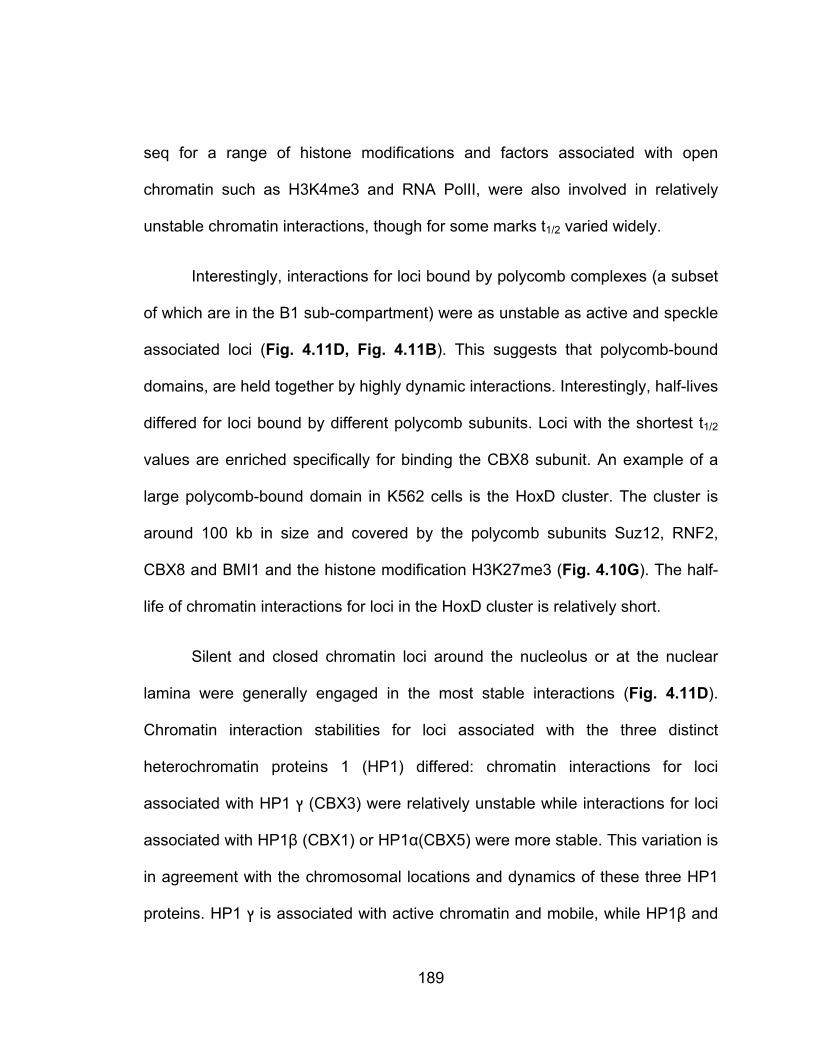
189
seq for a range of histone modifications and factors associated with open
chromatin such as H3K4me3 and RNA PolII, were also involved in relatively
unstable chromatin interactions, though for some marks t1/2 varied widely.
Interestingly, interactions for loci bound by polycomb complexes (a subset
of which are in the B1 sub-compartment) were as unstable as active and speckle
associated loci (Fig. 4.11D, Fig. 4.11B). This suggests that polycomb-bound
domains, are held together by highly dynamic interactions. Interestingly, half-lives
differed for loci bound by different polycomb subunits. Loci with the shortest t1/2
values are enriched specifically for binding the CBX8 subunit. An example of a
large polycomb-bound domain in K562 cells is the HoxD cluster. The cluster is
around 100 kb in size and covered by the polycomb subunits Suz12, RNF2,
CBX8 and BMI1 and the histone modification H3K27me3 (Fig. 4.10G). The half-
life of chromatin interactions for loci in the HoxD cluster is relatively short.
Silent and closed chromatin loci around the nucleolus or at the nuclear
lamina were generally engaged in the most stable interactions (Fig. 4.11D).
Chromatin interaction stabilities for loci associated with the three distinct
heterochromatin proteins 1 (HP1) differed: chromatin interactions for loci
associated with HP1 ץ (CBX3) were relatively unstable while interactions for loci
associated with HP1β (CBX1) or HP1α(CBX5) were more stable. This variation is
in agreement with the chromosomal locations and dynamics of these three HP1
proteins. HP1 ץ is associated with active chromatin and mobile, while HP1β and

190
HP1α are typically found in constitutive heterochromatin near (peri) centromeres
and much less mobile (Dialynas et al., 2007). Further indications that
heterochromatic loci can display a range of chromatin interaction stabilities
dependent upon their precise chromatin composition comes from the observation
that stability is modulated by the ratio of HP1α binding and lamin association:
interactions for loci that display high levels of HP1α binding but low levels of
lamin association are not as stable as those for loci with lower levels of HP1α
binding and higher lamin association (Fig. 4.10H).
The differential stability of pair-wise chromatin interactions at different sub-
nuclear structures can be directly visualized and quantified by plotting interaction
frequencies between pairs of 40 kb loci arranged by their level of factor binding to
obtain homotypic interaction saddle plots (Fig. 4.11F). In these plots, pair-wise
interactions between loci enriched in factor binding are shown in the lower right
corner, and pair-wise interactions between loci not bound by the factor are shown
in the upper left corner. For instance, we observe preferential interactions
between pairs of loci near speckles, as determined by SON TSA-Seq (Chen et
al., 2018). After chromatin fragmentation with DpnII, we observe a progressive
loss of preferential interactions between speckle associated loci, while
preferential interactions between non-speckle associated loci can be observed
even after 16 hours. Conversely, after chromatin fragmentation, we find that
preferential interactions between lamin-associated loci remain detectable even at

191
late time points, while preferential interactions between loci not at the lamina
disappear relatively fast.

192
Figure 4.10: Associations between sub-nuclear structures, compartment characteristics and chromatin interaction stability

193
(A) Spearman correlation matrix between signals for various chromatin state
markers of various sub-nuclear structures, chromatin remodellers and histone
modifications with row order determined by hierarchical clustering. (B) The
genome was split into 16 bins, where each bin corresponds to sets of loci that
share the same t1/2 interval. For each t1/2 interval the mean z-score signal
enrichment for various markers of sub-nuclear structures, chromatin remodellers
and histone modifications was calculated and shown as a heatmap. Row order
determined by hierarchical clustering. (C) Top: Stacked barplot displaying
percentages for each of five sub-compartments within 1 Mb of A to B boundary
switches with flanking A/B compartments larger than 1 Mb. Bottom: Transitions
of mean t1/2 (blue) and mean PC1 (black) at same A to B boundary switches. (D) Left: Scatterplot of t1/2 vs size of A compartment containing t1/2 bin. Right: t1/2 vs
size of B compartment containing t1/2 bin. (E) Left: Stacked barplot displaying
percentages for each of five sub-compartments across and within A
compartments of a specific size. Right: Stacked barplot displaying percentages
for each of five sub-compartments across and within B compartments of a
specific size. (F) Transitions of mean t1/2 (blue) and mean chromatin feature
(black) across various sub-compartment boundary switches. (G) 3 Mb region
surrounding HoxD locus. Top: Hi-C contact map for K562 control nuclei showing
the position of the HoxD locus. Tracks: ChIP-seq tracks for polycomb subunits
(cyan) and the polycomb associated histone modification H3K27me3 (green).
t1/2 (blue). Minus strand and plus-strand signal of total RNA-seq (red). Refseq
Genes (blue/black). The polycomb-bound domain displays shorter half-life
compared to expressed genes in flanking regions. (H) Boxplots of t1/2 stratified
by bins enriched in HP1α and depleted in LADs (left) and bins depleted in HP1α
and enriched in LADs (right). The more LAD signal compared to HP1α singal a
bin has the longer it’s t1/2.

194
Figure 4.11: Dissociation kinetics of chromatin interactions at different sub-nuclear structures

195
(A) Cumulative distributions of residuals of t1/2 (in minutes) for each of the five annotated sub-compartments. (B) Heatmap of mean z-score signal enrichment for Repli-Seq data in different phases of the cell cycle G1, S1-4, G2 and stratified by t1/2 residual intervals (bottom). Histogram of t1/2 residual distribution (top). Top: the genome was split into 10 bins, where each bin corresponds to sets of loci that share the same t1/2 residual interval. Bottom: For each t1/2 residual interval the mean z-score signal of Repli-Seq data in different phases of the cell cycle G1, S1-4, G2 . (C) Boxplot of t1/2 residuals for bins with expressed genes (mean FPKM > 1) and bins with low or no expression (mean FPKM <=1) stratified by sub-compartment. Significance determined by two-sample two tailed t-test *(p < 3.0 x 10⁻¹²). (D) Heatmap of mean z-score signal enrichment for various markers of sub-nuclear structures (See Methods) stratified by t1/2 residual intervals (top of panel B). For loci in each t1/2 residual interval the mean z-score was quantified for different chromatin features. (E) Homotypic interaction saddle plots for loci ranked by their association with speckles (as detected by SON-TSA-seq, top (Chen et al., 2018) and by their association with the nuclear lamina. Preferential pair-wise interactions between loci associated with the lamina can still be observed after several hours, whereas preferential pair-wise interactions between loci associated with speckles are lost more quickly.

196
Chromatin loops dissociate upon chromatin fragmentation
Enriched point-to-point looping interactions are detected as “dots” in Hi-C
interaction maps. The majority of these represent interactions between pairs of
convergent CTCF sites ( Rao et al., 2014). We were interested in determining
the fate of such loops after chromatin fragmentation. We aggregated Hi-C data
for purified nuclei at pairs of sites that had previously been shown to engage in
looping interactions in K562 cells ( Rao et al., 2014b). We readily detected these
loops in intact purified nuclei (Fig. 4.12A). After fragmentation with HindIII for 4
hours, loops remained present and appeared to become slightly stronger.
However, fragmenting chromatin with DpnII resulted in loss of loops over time.
Although loops appeared somewhat increased at t = 5 minutes after DpnII
digestion, they were greatly reduced at t = 1 hour and at later timepoints.
Chromatin loops are thought to be formed by loop extrusion mediated by
cohesin that is blocked at convergent CTCF sites. Therefore, we assessed
whether CTCF and cohesin binding to chromatin is affected by chromatin
fragmentation. We fractionated proteins in chromatin-bound and soluble fractions
using the previously described chromatin binding assay ((Liang & Stillman,
1997), Materials and Methods). In intact nuclei, most of the CTCF and cohesin is
associated with chromatin (Fig. 4.12B, Fig. 4.12 C). Digesting chromatin with
HindIII did not lead to dissociation of CTCF or cohesin. However, fragmenting
chromatin with DpnII led to dissociation of cohesin after 1 hour, while CTCF

197
binding was only weakly affected. We conclude that DNA fragmentation to <6 kb
fragments, but not to 10-25 kb fragments, leads to loss of cohesin binding and
loss of looping interactions. These results are consistent with earlier observations
that showed that in yeast stable chromatin binding by cohesin requires intact
DNA (Ciosk et al., 2000). These data can be interpreted in the context of the
model where cohesin rings encircle DNA (pseudo-) topologically (Srinivasan et
al., 2018). This model of binding predicts that when DNA is fragmented, the
cohesin ring can slide off nearby free ends. Our observation that cohesin binding
and loops are disrupted when chromatin is fragmented to <6 kb fragments
suggest that loops are maintained by the encirclement of cohesin rings around
the loop bases bound by CTCF.
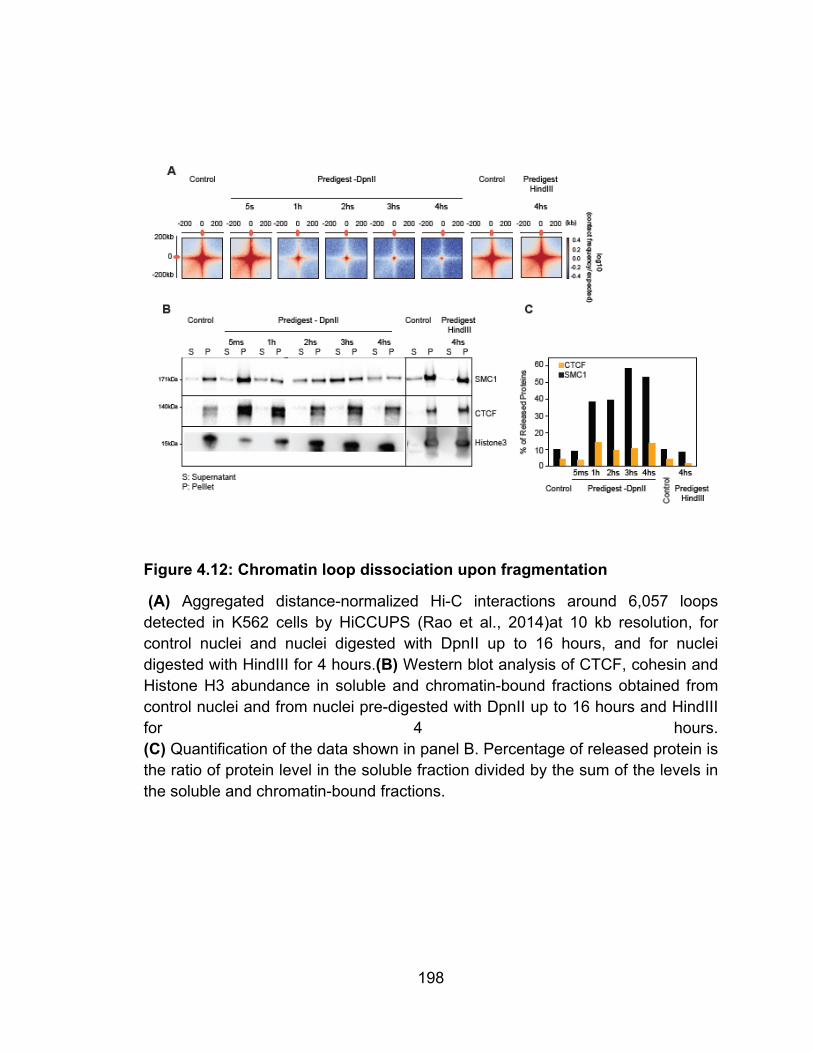
198
Figure 4.12: Chromatin loop dissociation upon fragmentation
(A) Aggregated distance-normalized Hi-C interactions around 6,057 loops detected in K562 cells by HiCCUPS (Rao et al., 2014)at 10 kb resolution, for control nuclei and nuclei digested with DpnII up to 16 hours, and for nuclei digested with HindIII for 4 hours.(B) Western blot analysis of CTCF, cohesin and Histone H3 abundance in soluble and chromatin-bound fractions obtained from control nuclei and from nuclei pre-digested with DpnII up to 16 hours and HindIII for 4 hours. (C) Quantification of the data shown in panel B. Percentage of released protein is the ratio of protein level in the soluble fraction divided by the sum of the levels in the soluble and chromatin-bound fractions.

199
DISCUSSION Hi-C interaction maps represent population-averaged folding of
chromosomes but do not reveal whether individual pair-wise contacts are
dynamic or stable. Liquid chromatin Hi-C reveals chromatin interaction stabilities
genome-wide. In liquid chromatin Hi-C chromatin is fragmented prior to fixation.
After fragmentation, Hi-C is then used at different time points to determine the
extent to which the initially compartmentalized conformation of chromosomes is
lost and the formerly spatially separated loci become mixed.
We observe an initial strengthening of A/B compartmentalization following
partial digestion. This result supports a “block copolymer” model of chromatin in
the interphase nucleus, where B regions of chromosomes tend to cluster
together, and A regions cluster together. Partial DNA digestion leads to a
strengthening of compartmentalization by removing covalent linkages between A
and B blocks, as long as the fragments are still large enough so that attractive
forces between them are sufficient for phase segregation.
Further fragmentation of chromatin into pieces that are too short to
maintain the phase-separated state leads to the progressive dissolution of
chromatin conformation. The kinetics of this dissolution process provides insights
into the attractive forces between chromatin segments, the intrinsic mobility of
loci, the dynamics of nuclear organization, and the protein factors that can
mediate chromatin interaction stability.

200
CHAPTER V: Discussion
3C-based technologies
3C-based technologies allow the conversion of information based on the
linear genome into 3D regulatory DNA networks. Within the last decade, we have
witnessed an unprecedented number of studies addressing genome folding, that
have advanced our understanding on how the genome folds and how variants in
DNA sequence translate to a rewiring of genome folding that leads to gene
misregulation (Visel & Mundlos, 2015) (Hnisz et al., 2016) (P. Nora et al., 2017).
It is likely that studies within the next decade will give us an insight into the
molecular mechanisms governing the establishment of the genome folding.
A substantial reduction in sequencing costs and an increase in
sequencing throughput has tremendously contributed to improving Hi-C
resolution. Indeed, recent in-situ Hi-C studies have increased the resolution of Hi-
C to 1 kb, which made it possible to detect CTCF-CTCF looping interactions
between TAD boundaries as well as some promoter-enhancer interactions in
very high coverage Hi-C maps. Our Hi-C 2.0 protocol discussed in chapter II is
an adaptation of in-situ Hi-C with extra steps that eliminate uninformative outputs
of Hi-C like unligated ends. In addition to technical and experimental
innovations, many Hi-C data analysis and visualization platforms have been
developed, including the 3dgenome browser (http://www.3dgenome.org) from

201
Feng Yue, the Juicebox tool (http://www.aidenlab.org/juicebox/) from the Aiden
lab, Hi-C-Pro (https://github.com/nservant/HiC-Pro) (Servant et al., 2015b), and
HiGlass, (https://higlass.io/) from Nils Gehlenborg lab (Kerpedjiev et al., 2018).
Hi-C 2.0 can still be improved. In particular, a better signal to noise ratio in Hi-C
contact probability matrices could be obtained by modifying some of the key
steps such as cross-linking, digestion, and ligation, which would produce
sharper structures in Hi-C heatmaps. The improvement of signal to noise will
enable detection of very infrequent interactions, such as the long-range
interactions between promoters and enhancers. Another important effort will be
to successfully scale down the number of cells needed for informative Hi-C
experiments in order to enable the use of Hi-C to investigate genome structure
from pure cell populations sorted by FACS, as well as in normal and disease-
related patient tissues,
The optimization of Hi-C also relies on robust bioinformatics pipelines to
validate the quality and assess the different optimization protocols. For example,
the development of an analysis pipeline enabling the detection of Hi-C noise, and
a pipeline to improve the resolution for a low cells input Hi-C. In a similar vein,
new data standards are needed for assessing the quality of chromatin-interaction
maps. One proposition for quality control would entail comparison a subset of
robust pair-wise interactions that have been rigorously assessed in different cell
types.

202
Promoter-enhancer interactions
The genomic community used to consider that coding DNA and active
genes are the most important for study because their perturbation leads to
disease (Misteli, 2007). However, the genome-wide association study, GWAS,
aimed at identifying disease-related SNPs, revealed that the majority of the
variants fall in noncoding regions of the genome and lack a defined target gene
(Variation et al., 2012). Most of these disease-specific variants systematically
alter the association of transcription factors at the altered target, suggesting that
they are regulatory elements (Variation et al., 2012). Regulatory elements often
interact with genes that are not nearest them in the linear genome (Amartya
Sanyal et al., 2012) (Sahlén et al., 2015), which makes it harder to delineate the
gene target for each variant. Chromosome conformation-based method is
necessary to connect each variant to its target gene, in order to explain the
phenotype. For example, a SNP in an intron leading to aberrant enhancer-
promoter contacts, as detected by 5C has recently linked a new target gene to
obesity (Norton & Cremins, 2017) (Aneas et al., 2014). Additionally
investigations of chromosome conformation using Capture Hi-C around 14
203
colorectal cancer risk loci in cancer cell lines (Migliorini et al., 2015), and around
variants linked to four autoimmune disorders in human B and T cell lines (Martin
et al., 2015) (Jäger et al., 2015; Martin et al., 2015) were each able to connect
numerous disease variants to their target genes.
In the last decade, an unprecedented number of studies have investigated
the functionality and mechanistic establishment of TADs. Topologically
associating domains (TADs) were found to be functional blocks of the chromatin
because alteration of a TAD boundary rewires the proximal gene-enhancer
interactions leading to alterations in gene expression (Hnisz et al., 2016) (P. Nora
et al., 2017) (Visel & Mundlos, 2015) (Wutz et al., 2017)(Gassler et al., 2017)
(Sanborn et al., 2015) (Fudenberg et al., 2015). On the other hand, not much is
known about the establishment and maintenance of promoter-enhancer
interactions.
The majority of gene-enhancer interactions are intra-TAD, though some of
these interactions resist the insulation at TAD boundaries. In acute lymphoblastic
leukemia (ALL) of T-cell type “T-ALL cell lines”, the MYC promoter interacts
with the Notch-dependent MYC enhancer element “NDME”, which is found 1.3
Mb downstream (Yashiro-ohtani et al., 2014). In AML (ME-1) cells, the MYC
gene is involved in a hub of interactions with three enhancers; ME1, ME2 ( found
within the same TAD with MYC gene), and E3 (1.7 Mb away from the promoter in
a different neighboring Sub-TAD with MYC gene). One very important result in

204
chapter III is the fact that promoter-enhancer interactions remain after MYC
inactivation, which contradicts the concept that active genes interact with their
enhancers to ensure efficient recruitment of transcription factors. For example,
looping between the LCR enhancer and β-globin locus only occurs when the
gene is active in fetal liver and this loop is not established in the brain where the
β-globin gene is inactive (Tolhuis, Palstra, Splinter, Grosveld, & Laat, 2002). A
similar result for the same regulatory element LCR was shown in K562 cells
when it is active, and in GM12879 when it is inactive (Dostie et al., 2006).
However, interactions between super-enhancers and genes have been found to
occur in small domains within TADs enriched for CTCF, cohesin, and mediator.
Importantly, these super-enhancer domains remain even when the constituent
genes are silenced, although mediator is switched with polycomb (Mifsud,
Tavares-cadete, et al., 2015). Similarly, we have shown that the binding of the
transcription factor RUNX1 to the ME1, ME2, E3 enhancers but not to the
promoter, efficiently induced a switch from the transcription activator complex
BRG1 to the transcription repressor RING1B at MYC promoter and at the ME1,
ME2, E3 enhancers. The hub of interactions that is maintained between these
elements independently of gene activation status facilitates the efficient
recruitment of the transcription repressor RING1B upon AI-10-49 treatment , and
it is possible that this hub facilitates the recruitment of transcription activator
complex BRG1 when MYC is still active before AI-10-49 treatment. These results
further validate the concept that promoter-enhancer interactions are important for

205
the recruitment of regulatory elements to the appropriate promoters. Importantly,
the depletion of any of the three enhancers ME1, ME2, E3 altered MYC
expression up to 70%, which indicates the direct role of each of the enhancers
for expression of the target gene ( Figure 3.7). One experiment that was not
explored in chapter III is performing 5C experiments after depletion of each
single enhancer to check whether the interaction hub is maintained between the
two remaining enhancers and the MYC promoter, in order to determine whether
loss of the hub interactions is causing the alteration of MYC expression in ME-1
cancer cells. These data will also determine whether all three regulatory
elements are involved in establishing this hub of interactions.
Based on this study in chapter III, extending the detection of enhancer-promoter
interactions in different disease states, will enable a better understanding of the
mechanism underlying a particular disease phenotype. Additionally, this
information will help to identify more promising candidates for targeted
therapeutics that could, for example, employ endonuclease-deficient Cas9 to
recruit silencing regulatory elements to the enhancer in order to deactivate a
gene and vice versa. There are still many unanswered questions regarding the
establishment of promoter-enhancer interactions, including how an enhancer
recognizes its specific target gene.
For intra-TAD gene-enhancer interactions, I and others have speculated
that the TAD blocks are fundamental and are built first and that there is a
hierarchical structure between TAD and gene-enhancer interactions. In such a

206
model, the TAD blocks bring genes and promoters in very close proximity in 3D
space, then looping interaction is driven by attractions of promoters and
enhancers with similar epigenetic status
Enhancers are embedded between CTCF factors, as we have seen for the
E3 enhancer ( Figure 3.6) and promoters interact strongly with CTCF clusters as
they tend to fall near TAD boundaries. I hypothesize that for long-range
interactions > 1 Mb this hub of CTCF enrichment brings the enhancer in close
3D proximity to its target promoter where they attract one another based on their
epigenetic compatibility. This hypothesis can be tested using genome editing to
translocate the enhancer, that is surrounded by CTCF and engaged in a long-
rage interaction, distantly 100~ 200 kb downstream of the surrounding CTCF
hubs present in the non-diseased state. If the specific CTCF hub is important, the
change in the enhancer position will alter the promoter interactions.
Endonuclease-deficient Cas9 could also be used to change the epigenetic marks
of an enhancer that engaged in long-range interaction during the exit from
mitosis before the establishment of the loop (Huangfu & Raya, 2017), in order to
determine whether the enhancer still recognizes its target promoter after the
CTCF hub brings them in a close 3D proximity.
A combination of genomic, epigenetic, chromosome conformation and
genome engineering approaches are necessary to connect the SNPs defined by
GWAS studies with the phenotype for each associated disease. I propose that
207
we first need to map all interactions between promoters and enhancers for
different tissue-appropriate control and diseased cells, by investigating
chromosome conformation at high-resolution 3-4 Mb (using 5C or capture Hi-C)
around all SNP non-coding DNA found by GWAS. Once candidate gene-targets
have been defined based on 3D interactions for each regulatory element
containing a variant, the DNA condensation status can be more routinely verified
in a large number of individuals using ATAC-Seq, which can be done in 500
hundreds of cells (Buenrostro et al., 2013). As we have seen in chapter III, the
switch from active regulatory elements to inactive elements binding the MYC
promoter and the three enhancers ME1, ME2, and E3 lead to a condensed
chromatin state at the promoter and enhancers that can be detected by ATAC
seq (Figure 3.5). Finally, ChIP of activator and repressor elements could be
performed for a couple of cases in order to validate the ATAC-Seq data.
liquid chromatin Hi-C
Hi-C interaction maps represent population-averaged folding of
chromosomes but do not reveal whether individual pair-wise contacts are
dynamic or stable. Liquid chromatin Hi-C reveals chromatin interaction stabilities
genome-wide. In liquid chromatin Hi-C chromatin is fragmented prior to fixation.
After fragmentation, Hi-C is then used at different time points to determine the
208
extent to which the initially compartmentalized conformation of chromosomes is
lost and the formerly spatially separated loci become mixed.
We observe an initial strengthening of A/B compartmentalization following
partial digestion. This result supports a “block copolymer” model of chromatin in
the interphase nucleus, where B regions of chromosomes tend to cluster
together, and A regions cluster together. Partial DNA digestion leads to a
strengthening of compartmentalization by removing covalent linkages between A
and B blocks, as long as the fragments are still large enough so that attractive
forces between them are sufficient for phase segregation.
Further fragmentation of chromatin into pieces that are too short to
maintain the phase-separated state leads to the progressive dissolution of
chromatin conformation. The kinetics of this dissolution process provides insights
into the attractive forces between chromatin segments, the intrinsic mobility of
loci, the dynamics of nuclear organization, and the protein factors that can
mediate chromatin interaction stability. Using liquid chromatin Hi-C we obtain a
view of the dynamics of chromatin interactions throughout the nucleus and the
genome (Fig. 5.1A). We find that chromatin dissolution is dependent on both
chromatin state and fragmentation level. After correcting for fragmentation level
we observe that chromatin interactions at different sub-nuclear structures differ in
their stability, with lamin-associated loci engaged in the most stable interactions
and speckle and polycomb associated loci being most dynamic. Further, we find

209
support for the model that CTCF-CTCF loops are stabilized by cohesin rings that
encircle loop bases (Fig. 5.1B).
Loci that are part of longer intact chromosomes display sub-diffusive
dynamics, and their mobility is strongly constrained by the polymeric nature of
chromatin and its folded state. In addition, their mobility is modulated by
attractive interactions with other loci by factors that themselves are dynamic, and
by local chromatin density. Live-cell imaging experiments have examined locus
motion extensively and found differences in mobility and constrained diffusion
dependent on sub-nuclear position and chromatin state and activity (Foisner &
Garini, 2015) (Hediger et al., 2002) (Marshall et al., 1997) (Nagashima et al.,
2019) (Shinkai et al., 2016) (Thakar et al., 2006). In such experiments, the
movement detected is strongly constrained by the fact that loci are part of very
long chromosomes. A previous key study, which inspired the current work, aimed
to determine the factors that determine intrinsic locus-locus interactions and
locus mobility by explicitly removing the strong polymeric constraint due to
linkage (Gartenberg et al., 2004). In that work, the mobility of an individual locus
and its preference for association with sub-nuclear structures was measured by
imaging after excising the locus from its normal genomic location so that it was
freed from the polymeric constraint (Gartenberg et al., 2004). Specifically, a
silent locus was excised from a yeast chromosome and its intrinsic preference for
association with other silent loci and the nuclear periphery was assessed and
found to depend on specific protein complexes bound to these loci that are

210
involved in gene silencing. In our liquid chromatin Hi-C experiments, we digest
DNA in situ and the polymeric constraint on movement is removed for all loci
simultaneously, in effect performing a genome-wide variant of the experiments
performed by (Gartenberg et al., 2004) After fragmentation, dynamics of locus
mixing is mostly determined by interactions of individual chromatin fragments
with each other and with sub-nuclear structures mediated by local chromatin-
associated factors, histone modifications, and chromatin density.
We show that chromosomal compartmentalization can tolerate genome-
wide fragmentation with HindIII in >10-25 kb fragments. Our micro-mechanical
elasticity measurements also show that chromosomes remain mechanically fully
connected in those conditions. These results indicate that interactions between
10-25 kb fragments are stable enough to maintain the initially phase- or
microphase- separated state of the nucleus, at least for several hours. This is in
agreement with recent independent locus-specific experiments. First, previous
studies had suggested that regions of several hundred kb were long enough to
correctly position themselves in vivo according to their chromatin state in the
corresponding compartment (Werken et al., 2017) . Second, super-enhancers
that typically range in size between 10 and 25 kb were found to associate both in
cis and in trans, especially in the absence of cohesin (Glenn et al., 2017),
indicating that interactions between these 10-25 kb elements are stable enough
to facilitate their clustering. Third, high-resolution Hi-C analysis in Drosophila
indicates that domains ~25 kb in size can phase separate according to their

211
chromatin status (Bonev & Cavalli, 2016). Similarly, in Drosophila, polycomb-
bound loci can cluster together at polycomb bodies when these loci are at least
tens of kilobases long (Organization et al., 2017) (Rowley et al., 2019) .
Combining all these data with our liquid chromatin Hi-C results, we conclude that
chromatin phase segregation can occur when domains of a particular chromatin
state are at least 10 kb. Notably, digestion studies indicate that mitotic
chromosomes are also constrained by stable chromatin interactions spaced by
approximately 15 kb (Poirier & Marko, 2002)
Our results obtained with DpnII digestion where the genome is fragmented
in <6 kb fragments show that these fragments are too short to maintain stable
phase-segregated domains. We find that the stability of interactions between <6
kb fragments, and the rate of mixing of initially segregated loci depends on their
chromatin state and association with sub-nuclear structures: interactions at the
nuclear lamina are relatively stable, those near nuclear speckles and polycomb
complexes are highly unstable, while interactions for loci associated with different
heterochromatin proteins and the nucleolus displayed a range intermediate
stabilities. The dynamics of associations between loci are therefore determined
by chromatin-associated factors, and may also be determined directly by the
biochemical properties of histone tail modifications. For instance, in recent
studies, the Rosen lab found that chromatin fragments can form droplets in vitro
and that the dynamics of chromatin fragments within these droplets are
dependent upon both H1 binding and histone acetylation (Francisco & Francisco,

212
2019): acetylation of histones resulted in more mobility of fragments and reduced
droplet formation, while binding of H1 led to stable droplet with strongly reduced
mobility of chromatin fragments. These results are consistent with the dynamics
we observe here for active and inactive chromatin fragments within liquid
chromatin.
Generally, heterochromatic loci are engaged in the most stable
interactions. This implies that these associations play a dominant role in spatial
compartmentalization of the nucleus, consistent with predictions made by
simulations (Falk et al., 2019). However, there is a range of stabilities correlating
with different types of heterochromatin. Interactions between loci at the nuclear
lamina are the most stable, suggesting that these loci are firmly tethered to the
lamina meshwork. Imaging experiments showed that loci near the lamina can
become embedded within the lamina meshwork, and that lamin proteins
themselves are also stably localized within the lamina (Broers et al., 1999) .
Loci associated with the three different HP1 proteins display different
dissociation kinetics. Interestingly, these differences correlate with different
dynamics and sub-nuclear locations of the HP1 proteins in the nucleus. HP1 ץ
(CBX3) binds relatively transiently to euchromatin, which may explain the
dynamic nature of chromatin interactions between loci bound by this protein
(Dialynas et al., 2007). On the other hand, interactions between loci enriched in
HPα (CBX5) are more stable, which likely is the result of more stable HP1α

213
binding to heterochromatin (Strom & Alexander, 2017). Further, the clustering of
heterochromatic loci bound by HP1α may be related to condensate formation by
HP1α proteins at and around heterochromatic loci (Strom & Alexander, 2017).
Polycomb bound regions of DNA are domains of facultative
heterochromatin critical to proper vertebrate and invertebrate development.
These regions spatially cluster together to form polycomb bodies visible in cell
nuclei (Saurin et al., 1998). Polycomb bodies are shown to compact their
associated chromatin as a potential mechanism for gene repression (Boettiger et
al., 2016) (Francis, Kingston, & Woodcock, 2004) (Grau et al., 2011).
Interestingly, liquid chromatin Hi-C showed differences in chromatin interaction
stability between facultative heterochromatic domains marked by polycomb and
constitutive heterochromatin domains marked by lamina association or binding of
HP1α/HP1α proteins. While many chromatin contacts in constitutive
heterochromatin were maintained even after 16 hours of digestion, the half-life
for chromatin contacts at polycomb-bound regions was short, on a scale similar
to more open and active regions of the genome. The compacted states of
polycomb and HP1α bound chromatin appear to form via a similar phase-
separation mechanism mediated by multivalent interactions between specific
CBX homologs. In vitro and in vivo, both CBX2 (polycomb subunit) and CBX5
(HP1α) are capable of forming condensates of polycomb bodies and constitutive
heterochromatin, respectively (Larson et al., 2017). Our data indicate that these
different structures associated chromatin have very different properties. Both are

214
dynamic with regards to the exchange of proteins and both have a fraction of
stably bound proteins (Strom & Alexander, 2017) (Youmans, Schmidt, & Cech,
2018), but the stability of interactions between loci mediated by these factors is
distinct, possibly related to differences in affinity between CBX proteins and
chromatin: the binding affinity of CBX5 (Hp1α) for its preferential histone
modification H3K9me3 is much stronger than the affinity of CBX2 for its
preferential mark H3K27me3 . Highly dynamic interactions occurred between
loci associated with speckles. This is interesting because previous work had
identified speckles to be one of two structural anchors, the other one being the
lamina, that determine the organization of the nucleus (Chen et al., 2018)
(Quinodoz et al., 2018) Our data indicate that these structures differ greatly in
how they anchor chromosome conformation: associations at the lamina involve
stable interactions while anchoring at speckles is driven by more dynamic
interactions.
The dynamics we observe for loci after chromatin fragmentation is likely
related to the intrinsic dynamics of those loci while being part of full-length
chromosomes. This is confirmed by the fact that active and inactive chromatin
are both dynamic and mobile as assessed by both live cell imaging and liquid
chromatin Hi-C. However, it is important to point out that during the liquid
chromatin Hi-C procedure, some chromatin factors may dissociate from the
nucleus, and this could affect the locus mixing behavior we observe. This will
likely be the case for proteins that rapidly dissociate. As we discussed above,

215
protein binding dynamics, e.g., of HP1 proteins, may determine the stability of
chromatin interactions as well. An example of proteins that dissociate from
chromatin upon fragmentation is the cohesin complex, possibly due to the way it
binds chromatin by encircling chromatin fiber(s). However, the cohesin complex
is not involved in compartment formation (P. Nora et al., 2017) (Nuebler et al.,
2018) (Haarhuis et al., 2017) (Extension et al., 2017) (Glenn et al., 2017)
(Schwarzer et al., 2017)(Wutz et al., 2017) , and thus its dissociation may not
influence the stability of phase separation-driven chromatin interactions detected
by liquid chromatin Hi-C.
Our current work suggests that the status of chromatin condensation (e.g.
DNA bound by polycomb or bound by HP1α) and status of chromatin anchoring
(e.g. anchoring at speckles or anchoring at nuclear lamina) are not strong
predictors of chromatin conformation stability. Furthermore, we have shown that
the stability of a locus correlates with its histone marks and enrichment for bound
proteins. For example, enrichment for the H3K9me3 histone mark and for binding
of the protein HP1α is indicative of highly stable interactions. However, it is not
clear whether binding of HP1α to DNA is dictating chromatin conformation
stability. To answer this question, an appropriate experiment would be to perform
liquid chromatin Hi-C on HP1α knockout cells. If HP1α knockout alone
destabilizes the genomic loci that were bound by HP1α in wildtype, we could
assume that indeed chromatin conformation stability is controlled by the bound
proteins

216
The current work analyzed the intrinsic chromatin interaction strengths
and dissolution kinetics of chromosome conformation within otherwise inactive
nuclei and how these measurements along chromosomes relate to chromatin
state and chromosomal compartmentalization. Future work can focus on how
these kinetic properties change in cells or nuclei, where active processes such as
transcription, replication, chromatin compaction and condensation, and loop
extrusion are also acting, and on determining the roles of RNAs, protein
complexes, and histone modifications in modulating the attractive forces between
loci and the dynamics of genome folding in general.
Performing liquid chromatin Hi-C demands 35 million nuclei for the seven-
time points: control, 5mins, 1h, 2hs, 3hs, 4hs, and 16hs (since 5 million nuclei are
needed for each time point). Additionally, to correct for the digestion bias we
performed DpnII-Seq using 10 million nuclei for each time point. In order to
optimize liquid chromatin Hi-C, we can perform fewer Hi-C library controls (1h,
3hs, 16hs) as a single control timepoint is used to extract the half-life genome-
wide. For the current work, we corrected for biases in our half-life metric using
different time point of DpnII-Seq (Fig. 4.9B). Results were only modestly altered
after bias correction via DpnII-seq with the greatest differences occurring before
1h pre-digestion. It follows, performing a single DpnII-seq library using 1h pre-
digest appears reasonable to correct half-life for the digestion bias.

217
The fractal globule is a polymer module that describes the static
chromosome conformation capture we detected using conventional Hi-C
(Lieberman-aiden et al., 2009). Development of a simulated fragmented fractal
globule would allow testing of whether this polymer model can mimic the
dissociation kinetics we observe in liquid chromatin Hi-C. Aggregating results
from simulated polymer models and liquid chromatin Hi-C will prove essential for
further understanding of the heterogeneous biophysical properties that maintain
genome organization.
Figure 5.1: Illustration of chromatin interaction dynamics in the nucleus and model for cohesin loss after chromatin digestion
(A) Left: Schematic representation of varying chromatin interactions dynamics at
different sub-nuclear domains. Shortest half-life reflects the least stable
interactions (yellow), while the longest half-life reflects the most stable
interactions (dark orange). Nuclear subdomains differ greatly in their stability.

218
Top right: Chromatin anchored at speckles is driven by the most dynamic
interactions. Bottom right: Chromatin anchored at the nuclear lamina involves the
most stable interactions. (B) Model for how cohesin rings stabilize CTCF-CTCF
loops by encircling loop bases. Top: Cohesin ring encircles loop bases at
convergent CTCF sites. Middle: Pre-digestion with DpnII cuts loop into chromatin
fragments <6 kb, and the cohesin ring can slide off nearby ends. Bottom: CTCF
remains bound to digested chromatin fragments but interactions between CTCF-
bound sites are lost.

219
BIBLIOGRAPHY
Alboran, I. M. De, Malynn, B., Davidson, L., Rickert, R., Rajewsky, K., Depinho, R. A., & Alt, F. W. (2001). Analysis of C-MYC Function in Normal Cells via Conditional Gene-Targeted Mutation ´ na. Immunity, 14, 45–55.
Alexander, J. M., Guan, J., Li, B., Maliskova, L., Song, M., Shen, Y., … Lomvardas, S. (2019). Live-cell imaging reveals enhancer- dependent Sox2 transcription in the absence of enhancer proximity. ELife, 1–42. https://doi.org/https://doi.org/10.7554/eLife.41769
Alipour, E., & Marko, J. F. (2012). Self-organization of domain structures by DNA-loop-extruding enzymes. Nucleic Acids Research, 40(22), 11202–11212. https://doi.org/10.1093/nar/gks925
Allahyar, A., Vermeulen, C., Bouwman, B. A. M., Krijger, P. H. L., Verstegen, M. J. A. M., Geeven, G., … Laat, W. De. (2018). Enhancer hubs and loop collisions identified from single-allele topologies. Nature Genetics, 50(August). https://doi.org/10.1038/s41588-018-0161-5
America, N., Pomerantz, M. M., Ahmadiyeh, N., Jia, L., Herman, P., Verzi, M. P., … Freedman, M. L. (2009). The 8q24 cancer risk variant interaction with MYC in colorectal cancer. Nature Genetics, 41(8), 882–884. https://doi.org/10.1038/ng.403
Andrey, G., Montavon, T., Mascrez, B., Gonzalez, F., Noordermeer, D., Leleu, M., … Duboule, D. (2013). RESEARCH ARTICLE SUMMARY Domains Underlies HoxD Genes Collinearity in Mouse Limbs. Science, 340(June). https://doi.org/10.1038/nrg3207
Aneas, I., Sobreira, R., Wasserman, N. F., Lee, J. H., Puviindran, V., Tam, D., & Shen, M. (2014). Obesity-associated variants within FTO form long-range functional connections with IRX3 ´. Nature. https://doi.org/10.1038/nature13138
Banigan, E. J., Stephens, A. D., & Marko, J. F. (2017). Article Mechanics and Buckling of Biopolymeric Shells and Cell Nuclei. Biophysj, 113(8), 1654–1663. https://doi.org/10.1016/j.bpj.2017.08.034
Barbieri, M., Chotalia, M., Fraser, J., Lavitas, L., Dostie, J., & Pombo, A. (2012). Complexity of chromatin folding is captured by the strings and binders switch model. 109(40), 16173–16178. https://doi.org/10.1073/pnas.1204799109
Beagrie, R. A., Scialdone, A., Schueler, M., Kraemer, D. C. ., Chotalia, M., Xie, S. Q., … Pombo, A. (2017). Complex multi-enhancer contacts captured by Genome Architecture Mapping ( GAM ). Nature, 543(7646), 519–524.

220
https://doi.org/10.1038/nature21411.Complex
Belaghzal, H., Dekker, J., & Gibcus, J. H. (2017). Hi-C 2.0: An optimized Hi-C procedure for high-resolution genome-wide mapping of chromosome conformation. Methods, 123. https://doi.org/10.1016/j.ymeth.2017.04.004
Belton, J. M., McCord, R. P., Gibcus, J. H., Naumova, N., Zhan, Y., & Dekker, J. (2012). Hi-C: A comprehensive technique to capture the conformation of genomes. Methods, 58(3), 268–276. https://doi.org/10.1016/j.ymeth.2012.05.001
Benedetti, F., Dorier, J., Burnier, Y., & Stasiak, A. (2014). Models that include supercoiling of topological domains reproduce several known features of interphase chromosomes. Nucleic Acids Research, 42(5), 2848–2855. https://doi.org/10.1093/nar/gkt1353
Bernardi, G. (2015). Chromosome Architecture and Genome Organization. PloS One, 10(11), e0143739. https://doi.org/10.1371/journal.pone.0143739
Bintu, B., Mateo, L. J., Su, J., Sinnott-armstrong, N. A., Parker, M., Kinrot, S., … Zhuang, X. (2018). Super-resolution chromatin tracing reveals domains and cooperative interactions in single cells. Science, 1783. https://doi.org/10.1126/science.aau1783
Blyth, K., Cameron, E. R., & Neil, J. C. (2005). THE RUNX GENES : GAIN OR LOSS OF FUNCTION IN CANCER. Nature Reviews Cancer, 5(May), 376–387. https://doi.org/10.1038/nrc1607
Boettiger, A. N., Bintu, B., Moffitt, J. R., Wang, S., Beliveau, B. J., Fudenberg, G., … Zhuang, X. (2016). chromatin folding for different epigenetic states. Nature, 529(7586), 418–422. https://doi.org/10.1038/nature16496
Bonev, B., & Cavalli, G. (2016). genome. Nature Genetics, 17, 661–678. https://doi.org/10.1038/nrg.2016.112
Bouwman, B. A. M., & Laat, W. De. (2015). Getting the genome in shape : the formation of loops , domains and compartments. Genome Biology, 1–9. https://doi.org/10.1186/s13059-015-0730-1
Branco, M. R., & Pombo, A. (2006). Intermingling of Chromosome Territories in Interphase Suggests Role in Translocations and Transcription-Dependent Associations. PLOS Biology, 4(5). https://doi.org/10.1371/journal.pbio.0040138
Broers, J. L. V, Machiels, B. M., Eys, G. J. J. M. Van, Kuijpers, H. J. H., Manders, E. M. M., Driel, R. Van, & Ramaekers, F. C. S. (1999). Dynamics of the nuclear lamina as monitored by GFP-tagged A-type lamins. Journal of Cell

221
Science, 3475, 3463–3475.
Buck, L., & Axel, R. (1991). A Novel Multigene Family May Encode Odorant Receptors : A Molecular Basis for Odor Recognition. Cell, 65, 175–187.
Buenrostro, J. D., Giresi, P. G., Zaba, L. C., Chang, H. Y., & Greenleaf, W. J. (2013). Transposition of native chromatin for fast and sensitive epigenomic profiling of open chromatin , DNA-binding proteins and nucleosome position. Nature Methods, 10(12). https://doi.org/10.1038/nmeth.2688
Cao, W., Britos-bray, M., Claxton, D. F., Kelley, C. A., Speck, N. A., Liu, P. P., & Friedman, A. D. (1997). CBF b -SMMHC , expressed in M4Eo AML , reduced CBF DNA-binding and inhibited the G1 to S cell cycle transition at the restriction point in myeloid and lymphoid cells. Oncogene, 15, 1315–1327.
Castilla, L. H., Wijmenga, C., Wang, Q., Stacy, T., Speck, N. A., Eckhaus, M., … Liu, P. P. (1996). Failure of Embryonic Hematopoiesis and Lethal Hemorrhages in Mouse Embryos Heterozygous for a Knocked-In Leukemia Gene CBFB – MYH11. Cell, 87, 687–696.
Chambeyron, S., & Bickmore, W. A. (2004). Chromatin decondensation and nuclear reorganization of the HoxB locus upon induction of transcription. GENES & DEVELOPMENT, 18, 1119–1130. https://doi.org/10.1101/gad.292104.tional
Chen, Y., Zhang, Y., Wang, Y., Zhang, L., Brinkman, E. K., Adam, S. A., … Ma, J. (2018). Mapping 3D genome organization relative to nuclear compartments using TSA-Seq as a cytological ruler. JCB, 1–32. https://doi.org//10.1083/jcb.201807108 1
Chien, R., Zeng, W., Kawauchi, S., Bender, M. A., Santos, R., Gregson, H. C., … Yokomori, K. (2011). Cohesin Mediates Chromatin Interactions That Regulate Mammalian Beta globin Expression. Journal of Biological Chemistry, 286(20), 17870–17878. https://doi.org/10.1074/jbc.M110.207365
Ciosk, R., Shirayama, M., Shevchenko, A., Tanaka, T., Toth, A., Shevchenko, A., & Nasmyth, K. (2000). Cohesin ’ s Binding to Chromosomes Depends on a Separate Complex Consisting of Scc2 and Scc4 Proteins. Molecular Cell, 5, 243–254.
Consortium, T. E. P. (2012). An integrated encyclopedia of DNA elements in the human genome. Nature, 489(57–74). https://doi.org/10.1038/nature11247
Cook, P. R. (2002). Predicting three-dimensional genome structure from transcriptional activity. Nature Genetics, 32(november), 347–352.

222
Crane, E., Bian, Q., McCord, R. P., Lajoie, B. R., Wheeler, B. S., Ralston, E. J., … Meyer, B. J. (2015). Condensin-driven remodelling of X chromosome topology during dosage compensation. Nature, 523(7559), 240–244. https://doi.org/10.1038/nature14450
Cremer, T, & Cremer, C. (2001). CHROMOSOME TERRITORIES , NUCLEAR ARCHITECTURE AND GENE REGULATION IN MAMMALIAN CELLS. Nature Reviews Genetics, 2(April), 292–301.
Cremer, T, Cremer, C., Baumann, H. I., Luedtke, E., Sperling, K., Teuber, V., & Zorn, C. (1982). Rabl ’ s Model of the Interphase Chromosome Arrangement Tested in Chinese Hamster Cells by Premature Chromosome Condensation and Laser-UV-Microbeam Experiments. Human Genetics, 60, 46–56.
Cremer, Thomas, & Cremer, M. (2010). Chromosome Territories. Cold Spring Harbor Perspectives in Biology, 1–22. https://doi.org/10.1101/cshperspect.a003889
Croce, L. Di, & Helin, K. (2013). RE V IE W Transcriptional regulation by Polycomb group proteins. Nature Publishing Group, 20(10), 1147–1155. https://doi.org/10.1038/nsmb.2669
Dekker, J, Rippe, K., Dekker, M., & Kleckner, N. (2002). Capturing chromosome conformation. Science, 295(5558), 1306–1311. https://doi.org/10.1126/science.1067799
Dekker, Job. (2014). Two ways to fold the genome during the cell cycle : insights obtained with chromosome conformation capture. Epigenetics and Chromatin, 1–12.
Dekker, Job, & Heard, E. (2015). Structural and functional diversity of Topologically Associating Domains. Federation of European Biochemical Societies., 589, 2877–2884.
Dekker, Job, & Mirny, L. (2016). Perspective The 3D Genome as Moderator of Chromosomal Communication. Cell, 164(6), 1110–1121. https://doi.org/10.1016/j.cell.2016.02.007
Dekker, Job, & Misteli, T. (2015a). Long-Range Chromatin Interactions. Cold Spring Harbor Perspectives in Biology. https://doi.org/10.1101/cshperspect.a019356
Dekker, Job, & Misteli, T. (2015b). Long-Range Chromatin Interactions. Cold Spring Harbor Perspectives in Biology.
Dekker, Job, Rippe, K., Dekker, M., & Kleckner, N. (2002). Capturing Chromosome Conformation. Science, 295(February), 1306–1312.

223
https://doi.org/10.1126/science.1067799
Dialynas, G. K., Terjung, S., Brown, J. P., Aucott, R. L., Baron-luhr, B., Singh, P. B., & Georgatos, S. D. (2007). Plasticity of HP1 proteins in mammalian cells. Journal of Cell Science, 120, 3415–3424. https://doi.org/10.1242/jcs.012914
Dixon, J R, Selvaraj, S., Yue, F., Kim, A., Li, Y., Shen, Y., … Ren, B. (2012). Topological domains in mammalian genomes identified by analysis of chromatin interactions. Nature, 485(7398), 376–380. https://doi.org/10.1038/nature11082
Dixon, Jesse R, Selvaraj, S., Yue, F., Kim, A., Li, Y., Shen, Y., … Ren, B. (2012). identified by analysis of chromatin interactions. Nature, 485(7398), 376–380. https://doi.org/10.1038/nature11082
Dostie, J., Richmond, T. A., Arnaout, R. A., Selzer, R. R., Lee, W. L., Honan, T. A., … Dekker, J. (2006). Chromosome Conformation Capture Carbon Copy ( 5C ): A massively parallel solution for mapping interactions between genomic elements. Genome Research, 16, 1299–1309. https://doi.org/10.1101/gr.5571506.1
Douglas, N. C., Jacobs, H., Bothwell, A. L. M., & Hayday, A. C. (2001). Defining the specific physiological requirements for c-Myc in T cell development. Nature Immunology, 2(4), 307–315.
Dowen, J. M., Fan, Z. P., Hnisz, D., Ren, G., Abraham, B. J., Zhang, L. N., … Young, R. A. (2014). Control of Cell Identity Genes Occurs in Insulated Neighborhoods in Mammalian Chromosomes. Cell, 159(2), 374–387. https://doi.org/10.1016/j.cell.2014.09.030
Dryden, N. H., Broome, L. R., Dudbridge, F., Johnson, N., Orr, N., Schoenfelder, S., … Fletcher, O. (2014). Unbiased analysis of potential targets of breast cancer susceptibility loci by Capture Hi-C. Genome Research, 24, 1854–1868. https://doi.org/10.1101/gr.175034.114.
Durand, N. C., Shamim, M. S., Machol, I., Iterative correction of Hi-C data reveals hallmarks of chromosome organization, S. S. P., Huntley, M. H., Lander, E. S., & Aiden, E. L. (2016). Juicer Provides a One-Click System for Analyzing Loop-Resolution Hi-C Experiments. Cell Systems, 3(1), 95–98. https://doi.org/10.1016/j.cels.2016.07.002
Erdel, F., & Rippe, K. (2018). Biophysical Perspective Formation of Chromatin Subcompartments by Phase Separation. Biophysical Journal, 114, 2262–2270. https://doi.org/10.1016/j.bpj.2018.03.011
Extension, C. L., Weide, R. H. Van Der, Blomen, V. A., Brummelkamp, T. R., Wit, E. De, & Rowland, B. D. (2017). The Cohesin Release Factor WAPL

224
Restricts Chromatin Loop Extension. Cell, 169, 693–707. https://doi.org/10.1016/j.cell.2017.04.013
Falk, M., Feodorova, Y., Naumova, N., Imakaev, M., Lajoie, B. R., Leonhardt, H., … Mirny, L. A. (2019). Heterochromatin drives compartmentalization of inverted and conventional nuclei. Nature, 570, 395–399. https://doi.org/10.1038/s41586-019-1275-3
Feric, M., Vaidya, N., Harmon, T. S., Kriwacki, R. W., Pappu, R. V, Brangwynne, C. P., … Brangwynne, C. P. (2016). Coexisting Liquid Phases Underlie Nucleolar Coexisting Liquid Phases Underlie Nucleolar Subcompartments. Cell, 165(7), 1686–1697. https://doi.org/10.1016/j.cell.2016.04.047
Ferraiuolo, M. A., Sanyal, A., Naumova, N., Dekker, J., & Dostie, J. (2012). From cells to chromatin : Capturing snapshots of genome organization with 5C technology. Methods, 58(3), 255–267. https://doi.org/10.1016/j.ymeth.2012.10.011
Finn, E. H., Pegoraro, G., Dekker, J., Mirny, L., Misteli, T., Valton, A., … Misteli, T. (2019). Extensive Heterogeneity and Intrinsic Variation in Spatial Genome Organization. Cell, 176, 1502–1515. https://doi.org/10.1016/j.cell.2019.01.020
Foisner, R., & Garini, Y. (2015). dynamics in the nuclear interior. Nature Communications, 6, 1–9. https://doi.org/10.1038/ncomms9044
Francis, N. J., Kingston, R. E., & Woodcock, C. L. (2004). Chromatin Compaction by a Polycomb Group Protein Complex. Science, 306(November), 1574–1578.
Francisco, S., & Francisco, S. (2019). Organization and Regulation of Chromatin by Liquid-Liquid Phase Separation.
Fudenberg, G., Imakaev, M., Lu, C., Goloborodko, A., Abdennur, N., & Mirny, L. A. (2015). Formation of Chromosomal Domains in Interphase by Loop Extrusion.
Fullwood, M J, Han, Y., Wei, C. L., Ruan, X., & Ruan, Y. (2010). Chromatin interaction analysis using paired-end tag sequencing. Curr Protoc Mol Biol, Chapter 21, Unit 21 15 1-25. https://doi.org/10.1002/0471142727.mb2115s89
Fullwood, M J, Liu, M. H., Pan, Y. F., Liu, J., Xu, H., Mohamed, Y. B., … Ruan, Y. (2009). An oestrogen-receptor-alpha-bound human chromatin interactome. Nature, 462(7269), 58–64. https://doi.org/10.1038/nature08497
Fullwood, Melissa J, Han, Y., Wei, C., Ruan, X., & Ruan, Y. (2010). Chromatin

225
Interaction Analysis Using Paired-End Tag Sequencing. Molecular Biology, 1–25. https://doi.org/10.1002/0471142727.mb2115s89
Gartenberg, M. R., Neumann, F. R., Laroche, T., Blaszczyk, M., Gasser, S. M., Ansermet, Q. E., & Geneva, C.-. (2004). Sir-Mediated Repression Can Occur Independently of Chromosomal and Subnuclear Contexts. Cell, 119, 955–967.
Gassler, J., Brandão, H. B., Imakaev, M., Flyamer, I. M., Ladstätter, S., Bickmore, W. A., … Tachibana, K. (2017). A mechanism of cohesin-dependent loop extrusion organizes zygotic genome architecture. EMBO Journal, 36(24). https://doi.org/10.15252/embj.201798083
Gavrilov, A., Razin, S. V, & Cavalli, G. (2015). In vivo formaldehyde cross-linking: it is time for black box analysis. Briefings in Functional Genomics, 14(2), 163–165. https://doi.org/10.1093/bfgp/elu037
Gibcus, J. H., & Dekker, J. (2013). Review The Hierarchy of the 3D Genome. Molecular Cell, 49(5), 773–782. https://doi.org/10.1016/j.molcel.2013.02.011
Glenn, B., Hilaire, S., Casellas, R., Lander, E. S., & Aiden, E. L. (2017). Cohesin Loss Eliminates All Loop Domains. Cell, 171(2), 305-309.e24. https://doi.org/10.1016/j.cell.2017.09.026
Gorski, S., & Misteli, T. (2005). Systems biology in the cell nucleus. Journal of Cell Science, 118. https://doi.org/10.1242/jcs.02596
Gowda, S. D., Koler, R. D., & Jr, G. C. B. (1986). Regulation of C-myc expression during growth and differentiation of normal and leukemic human myeloid progenitor cells . Find the latest version : The Journal of Clinical Investigation, 77(1), 271–278.
Grau, D. J., Chapman, B. A., Garlick, J. D., Borowsky, M., Francis, N. J., & Kingston, R. E. (2011). Compaction of chromatin by diverse Polycomb group proteins requires localized regions of high charge. Gene and Development, 25, 2210–2221. https://doi.org/10.1101/gad.17288211.Lys
Guo, H., & Friedman, A. D. (2011). Phosphorylation of RUNX1 by Cyclin-dependent Kinase Reduces Direct Interaction with HDAC1 and HDAC3 *. Journal of Biological Chemistry, 286(1), 208–215. https://doi.org/10.1074/jbc.M110.149013
Guo, Y., Niu, C., Breslin, P., Tang, M., Zhang, S., Wei, W., … Zhang, J. (2019). c-Myc – mediated control of cell fate in megakaryocyte-erythrocyte progenitors. HEMATOPOIESISAND STEM CELLS, 114(10), 2097–2107. https://doi.org/10.1182/blood-2009-01-197947.

226
Haarhuis, J. H. I., Der, W. R. H. Van, Blomen, V. A., Yanez-Cuna, J. O., Amendola, M., Ruiten, M. S. van, … Rowland, B. D. (2017). Article The Cohesin Release Factor WAPL Restricts Chromatin Loop Extension. Cell, 169, 693–707. https://doi.org/10.1016/j.cell.2017.04.013
Hediger, F., Neumann, F. R., Houwe, G. Van, Dubrana, K., Gasser, S. M., & Geneva, C.-. (2002). Live Imaging of Telomeres : yKu and Sir Proteins Define Redundant Telomere-Anchoring Pathways in Yeast. Current Biology, 12(02), 2076–2089.
Heinz, S., Benner, C., Spann, N., Bertolino, E., Lin, Y. C., Laslo, P., … Glass, C. K. (2010). Simple combinations of lineage-determining transcription factors prime cis-regulatory elements required for macrophage and B cell identities. Molecular Cell, 38(4), 576–589. https://doi.org/10.1016/j.molcel.2010.05.004
Hnisz, D., Weintraub, A. S., Day, D. S., Valton, A., Bak, R. O., Li, C. H., … Young, R. A. (2016). Activation of proto-oncogenes by disruption of chromosome neighborhoods. Science, 351(6280), 3812–3814.
Hoke, H. A., Lin, C. Y., Lau, A., Orlando, D. A., Vakoc, C. R., Bradner, J. E., … Young, R. A. (2013). Selective Inhibition of Tumor Oncogenes by Disruption of Super-Enhancers. Cell, 153, 320–334. https://doi.org/10.1016/j.cell.2013.03.036
Holt, J. T., Redner, R. L., & Nienhuis, A. W. (1988). An Oligomer Complementary to c-myc mRNA Inhibits Proliferation of HL-60 Promyelocytic Cells and Induces Differentiation. Molecular and Cellular Biology, 8(2), 963–973.
Hsieh, T.-H. S., Fudenberg, G., Goloborodko, A., & Rando, O. J. (2016). Micro-C XL: assaying chromosome conformation from the nucleosome to the entire genome. Nature Methods. https://doi.org/10.1038/nmeth.4025
Hsieh, T. H., Weiner, A., Lajoie, B., Dekker, J., Friedman, N., & Rando, O. J. (2015). Mapping Nucleosome Resolution Chromosome Folding in Yeast by Micro-C. Cell, 162(1), 108–119. https://doi.org/10.1016/j.cell.2015.05.048
Huangfu, D., & Raya, A. (2017). Protocol Review CRISPR / Cas9-Based Engineering of the Epigenome. Cell Stem Cell, 21, 431–447. https://doi.org/10.1016/j.stem.2017.09.006
Hughes, J. R., Roberts, N., McGowan, S., Hay, D., Giannoulatou, E., Lynch, M., … Higgs, D. R. (2014). Analysis of hundreds of cis-regulatory landscapes at high resolution in a single, high-throughput experiment. Nat Genet, 46(2), 205–212. https://doi.org/10.1038/ng.2871
Illendula, A., Pulikkan, J. A., Zong, H., Grembecka, J., Xue, L., Sen, S., … Bushweller, J. H. (2015). A small-molecule inhibitor of the aberrant

227
transcription factor CBF β -SMMHC delays leukemia in mice. Science, 347(6223), 779–785.
Imakaev, M., Fudenberg, G., Mccord, R. P., Naumova, N., Goloborodko, A., Lajoie, B. R., … Mirny, L. A. (2012). Iterative correction of Hi-C data reveals hallmarks of chromosome organization. Nature Methods, 9(10). https://doi.org/10.1038/NMETH.2148
Ivanov, D., & Nasmyth, K. (2005). A Topological Interaction between Cohesin Rings and a Circular Minichromosome. Cell, 122, 849–860. https://doi.org/10.1016/j.cell.2005.07.018
Jin, F., Li, Y., Dixon, J. R., Selvaraj, S., Ye, Z., Lee, A. Y., … Ren, B. (2013). A high-resolution map of the three-dimensional chromatin interactome in human cells. Nature. https://doi.org/10.1038/nature12644
Johansen, L. M., Iwama, A., Lodie, T. A., Sasaki, K., Felsher, D. W., Golub, T. R., & Tenen, D. G. (2001). c-Myc Is a Critical Target for C / EBP ␣ in Granulopoiesis. Molecular and Cellular Biology, 21(11), 3789–3806. https://doi.org/10.1128/MCB.21.11.3789
Jost, D., Carrivain, P., Cavalli, G., & Vaillant, C. (2014). Modeling epigenome folding : formation and dynamics of topologically associated chromatin domains. Nucleic Acids Research, 42(15), 9553–9561. https://doi.org/10.1093/nar/gku698
Kagey, M. H., Newman, J. J., Bilodeau, S., Zhan, Y., Orlando, D. A., Berkum, N. L. Van, … Young, R. A. (2010). Mediator and cohesin connect gene expression and chromatin architecture. Nature, 467(7314), 430–435. https://doi.org/10.1038/nature09380
Kerpedjiev, P., Abdennur, N., Lekschas, F., Mccallum, C., Dinkla, K., Strobelt, H., … Gehlenborg, N. (2018). HiGlass : web-based visual exploration and analysis of genome interaction maps. Genome Biology, 1–12.
Kind, J., Pagie, L., Ortabozkoyun, H., Boyle, S., Vries, S. S. De, Janssen, H., … Steensel, B. Van. (2013). Single-Cell Dynamics of Genome-Nuclear Lamina Interactions. Cell, 153(1), 178–192. https://doi.org/10.1016/j.cell.2013.02.028
Kitabayashi, I., Aikawa, Y., Nguyen, L. A., & Yokoyama, A. (2001). Activation of AML1-mediated transcription by MOZ and inhibition by the MOZ ± CBP fusion protein. EMBO Journal, 20(24).
Kitabayashi, I., Yokoyama, A., Shimizu, K., Ohki, M., & Pebp, C. (1998). Interaction and functional cooperation of the leukemia-associated factors AML1 and p300 in myeloid cell differentiation. EMBO Journal, 17(11), 2994–

228
3004.
Lajoie, B. R., Berkum, N. L. Van, Sanyal, A., & Dekker, J. (2009). My5C : web tools for chromosome conformation capture studies. Nature Methods, 6(10), 690–691. https://doi.org/10.1038/nmeth1009-690
Lajoie, B. R., Dekker, J., & Kaplan, N. (2015). The Hitchhiker’s guide to Hi-C analysis: Practical guidelines. Methods, 72(C), 65–75. https://doi.org/10.1016/j.ymeth.2014.10.031
Larson, A. G., Elnatan, D., Keenen, M. M., Trnka, M. J., Johnston, J. B., Burlingame, A. L., … Narlikar, G. J. (2017). phase separation in heterochromatin. Nature Publishing Group, 547(7662), 236–240. https://doi.org/10.1038/nature22822
Leiblerf, L. (1980). Theory of Microphase Separation in Block Copolymers. Macromolecules, 1602–1617. https://doi.org/10.1021/ma60078a047
Liang, C., & Stillman, B. (1997). Persistent initiation of DNA replication and chromatin-bound MCM proteins during the cell cycle in cdc6 mutants. GENES & DEVELOPMENT, 11, 3375–3386.
Lichtinger, M., Hoogenkamp, M., Krysinska, H., Ingram, R., & Bonifer, C. (2010). Blood Cells , Molecules , and Diseases Chromatin regulation by RUNX1. Blood Cells, Molecules, and Diseases, 44(4), 287–290. https://doi.org/10.1016/j.bcmd.2010.02.009
Lieberman-aiden, E., Berkum, N. L. Van, Williams, L., Imakaev, M., Ragoczy, T., Telling, A., … Dekker, J. (2009). Comprehensive Mapping of Long-Range Interactions Reveals Folding Principles of the Human Genome. Science, 33292(October), 289–294. https://doi.org/10.1126/science.1178746
Lieberman-Aiden, E., van Berkum, N. L., Williams, L., Imakaev, M., Ragoczy, T., Telling, A., … Dekker, J. (2009). Comprehensive mapping of long-range interactions reveals folding principles of the human genome. Science, 326(5950), 289–293. https://doi.org/10.1126/science.1181369
Liu, L., Shi, G., Thirumalai, D., & Changbong Hyeon. (2018). Chain organization of human interphase chromosome determines the spatiotemporal dynamics of chromatin loci. PLOS Computational Biology, 1–20. https://doi.org/10.1371/journal.pcbi.1006617 December
Liu, P., Tarle, S. A., Hajra, A., Claxton, D. F., Mariton, P., Freedman, M., … Collins, F. S. (1993). Fusion Between Transcription Factor CBFP / PEBP2I3 and a Myosin Heavy Chain in Acute Myeloid Leukemia. Science, 261, 1041–1044.

229
Lomvardas, S., Barnea, G., Pisapia, D. J., Mendelsohn, M., Kirkland, J., & Axel, R. (2006). Interchromosomal Interactions and Olfactory Receptor Choice. Cell, 126, 403–413. https://doi.org/10.1016/j.cell.2006.06.035
Lukasik, S. M., Zhang, L., Corpora, T., Tomanicek, S., Li, Y., Kundu, M., … Bushweller, J. H. (2002). letters Altered affinity of CBF  -SMMHC for Runx1 explains its role in leukemogenesis. Nature Structural Biology, 9(9). https://doi.org/10.1038/nsb831
Ma, W., Ay, F., Lee, C., Gulsoy, G., Deng, X., Cook, S., … Duan, Z. (2014). Fine-scale chromatin interaction maps reveal the cis-regulatory landscape of human lincRNA genes. Nature Methods, 12(1), 71–78. https://doi.org/10.1038/nmeth.3205
Markenscoff-papadimitriou, E., Allen, W. E., Colquitt, B. M., Goh, T., Murphy, K. K., Monahan, K., … Lomvardas, S. (2014). Article Enhancer Interaction Networks as a Means for Singular Olfactory Receptor Expression. Cell, 159(3), 543–557. https://doi.org/10.1016/j.cell.2014.09.033
Marshall, W. F., Straight, A., Marko, J. F., Swedlow, J., Dernburg, A., Belmont, A., … Sedat, J. W. (1997). Interphase chromosomes undergo constrained diffusional motion in living cells. Current Biology, 7(12), 930–939.
Martin, P., Mcgovern, A., Orozco, G., Duffus, K., Yarwood, A., Schoenfelder, S., … Eyre, S. (2015). Capture Hi-C reveals novel candidate genes and complex long-range interactions with related autoimmune risk loci. Nature Communications, 6, 1–7. https://doi.org/10.1038/ncomms10069
Marzahn, M. R., Marada, S., Lee, J., Nourse, A., Kenrick, S., Zhao, H., … Mittag, T. (2016). Higher-order oligomerization promotes localization of SPOP to liquid nuclear speckles. The EMBO Journal, 35(12), 1254–1275.
Matsen, M. W., & Schick, M. (1994). Melt. Macromolecules, 7157–7163. https://doi.org/10.1021/ma00102a025
Michael Rubinstein, & Colby-standand, R. H. (n.d.). Polymer Physics. In Oxford University Press.
Michieletto, D., Orlandini, E., & Marenduzzo, D. (2016). Polymer model with Epigenetic Recoloring Reveals a Pathway for the de novo Establishment and 3D Organization of Chromatin Domains. American Physical Society, 041047(16), 1–15. https://doi.org/10.1103/PhysRevX.6.041047
Mifsud, B., Tavares-cadete, F., Young, A. N., Sugar, R., Schoenfelder, S., Ferreira, L., … Osborne, C. S. (2015). Mapping long-range promoter contacts in human cells with high-resolution capture Hi-C. Nature Publishing Group, 47(6), 598–606. https://doi.org/10.1038/ng.3286

230
Mifsud, B., Tavares-Cadete, F., Young, A. N., Sugar, R., Schoenfelder, S., Ferreira, L., … Osborne, C. S. (2015). Mapping long-range promoter contacts in human cells with high-resolution capture Hi-C. Nature Genetics, 47(6), 598–606. https://doi.org/10.1038/ng.3286
Migliorini, G., Henrion, M., Kandaswamy, R., Speedy, H. E., Heindl, A., Whiffin, N., … Houlston, R. S. (2015). Capture Hi-C identifies the chromatin interactome of colorectal cancer risk loci. Nature Communications, 1–9. https://doi.org/10.1038/ncomms7178
Misteli, T. (2007). Review Beyond the Sequence : Cellular Organization of Genome Function. Cell, 128, 787–800. https://doi.org/10.1016/j.cell.2007.01.028
Nagano, T, Lubling, Y., Stevens, T. J., Schoenfelder, S., Yaffe, E., Dean, W., … Fraser, P. (2013). Single-cell Hi-C reveals cell-to-cell variability in chromosome structure. Nature, 502(7469), 59–64. https://doi.org/10.1038/nature12593
Nagano, Takashi, Lubling, Y., Stevens, T. J., Schoenfelder, S., Yaffe, E., Dean, W., … Fraser, P. (2013). variability in chromosome structure. Nature, 502(7469), 59–64. https://doi.org/10.1038/nature12593
Nagano, Takashi, Lubling, Y., Yaffe, E., Wingett, S. W., Dean, W., Tanay, A., & Fraser, P. (2015). Single-cell Hi-C for genome-wide detection of chromatin interactions that occur simultaneously in a single cell. Nature Protocols, 10(12), 1986–2003. https://doi.org/10.1038/nprot.2015.127
Nagano, Takashi, Várnai, C., Schoenfelder, S., Javierre, B.-M., Wingett, S. W., & Fraser, P. (2015). Comparison of Hi-C results using in-solution versus in-nucleus ligation. Genome Biology, 16(1), 175. https://doi.org/10.1186/s13059-015-0753-7
Nagashima, R., Hibino, K., Ashwin, S. S., Babokhov, M., Fujishiro, S., Imai, R., … Tamura, S. (2019). Single nucleosome imaging reveals loose genome chromatin networks via active RNA polymerase II. JCB.
Nichols, M. H., & Corces, V. G. (2015). A CTCF Code for 3D Genome Architecture. Cell, 162(4), 703–705. https://doi.org/10.1016/j.cell.2015.07.053
Noordermeer, D., Wit, E. De, Klous, P., Werken, H. Van De, Simonis, M., Lopez-jones, M., … Laat, W. De. (2011). Variegated gene expression caused by cell-specific long-range DNA interactions. Nature Cell Biology, 13(8), 944–951. https://doi.org/10.1038/ncb2278
Nora, E., Lajoie, B. R., Schulz, E. G., Giorgetti, L., Okamoto, I., Servant, N., …

231
Heard, E. (2012). Spatial partitioning of the regulatory landscape of the X-inactivation centre `. Nature, 485, 381–385. https://doi.org/10.1038/nature11049
Nora, E. P., Lajoie, B. R., Schulz, E. G., Giorgetti, L., Okamoto, I., Servant, N., … Heard, E. (2012). Spatial partitioning of the regulatory landscape of the X-inactivation centre. Nature, 485(7398), 381–385. https://doi.org/10.1038/nature11049
Nora, P., Goloborodko, A., Valton, A., Dekker, J., Mirny, L. A., Bruneau, B. G., … Abdennur, N. (2017). Targeted Degradation of CTCF Decouples Local Insulation of Chromosome Domains from Genomic Compartmentalization. Cell, 169, 930–944. https://doi.org/10.1016/j.cell.2017.05.004
Norton, H. K., & Cremins, J. E. P. (2017). Crossed wires : 3D genome misfolding in human disease. JCB, 216(11), 3441–3452.
Nuebler et al. (2018). Chromatin organization by an interplay of loop extrusion and compartmental segregation. PNAS, 115. https://doi.org/10.1073/pnas.1717730115
Nuebler, J., Fudenberg, G., Imakaev, M., Abdennur, N., & Mirny, L. A. (2018). Chromatin organization by an interplay of loop extrusion and compartmental segregation. PNAS, 115(9), E6697–E6706. https://doi.org/10.1073/pnas.1717730115
Organization, C., Rowley, M. J., Nichols, M. H., Lyu, X., Wang, P., Ruan, Y., … Hermetz, K. (2017). Evolutionarily Conserved Principles Predict 3D Article Evolutionarily Conserved Principles Predict 3D Chromatin Organization. Molecular Cell, 67(5), 837-852.e7. https://doi.org/10.1016/j.molcel.2017.07.022
Parada, L. A., Mcqueen, P. G., & Misteli, T. (2004). Tissue-specific spatial organization of genomes. Genome Biology, 1–9. https://doi.org/10.1186/gb-2004-5-7-r44
Parada, L. A., Mcqueen, P. G., Munson, P. J., & Misteli, T. (2002). Conservation of Relative Chromosome Positioning in Normal and Cancer Cells. Current Biology, 12(02), 1692–1697. https://doi.org/S0960-9822(02)01166-1
Phair, R. D., Scaffidi, P., Elbi, C., Vecerova, J., Dey, A., Ozato, K., … Misteli, T. (2004). Global Nature of Dynamic Protein-Chromatin Interactions In Vivo : Three-Dimensional Genome Scanning and Dynamic Interaction Networks of Chromatin Proteins. Molecular and Cellular Biology, 24(14), 6393–6402. https://doi.org/10.1128/MCB.24.14.6393
Phillips-cremins, J. E., Sauria, M. E. G., Sanyal, A., Gerasimova, T. I., Lajoie, B.

232
R., Bell, J. S. K., … Corces, V. G. (2013). Architectural Protein Subclasses Shape 3D Organization of Genomes during Lineage Commitment. Cell, 153(6), 1281–1295. https://doi.org/10.1016/j.cell.2013.04.053
Pieroo, M. Di, Zhang, B., Lieberman, E., Wolynes, P. G., & Onuchic, J. N. (2016). Transferable model for chromosome architecture. PNAS, 113(43). https://doi.org/10.1073/pnas.1613607113
Poirier, M. G., & Marko, J. F. (2002). Mitotic chromosomes are chromatin networks without a mechanically contiguous protein scaffold. PNAS, 99(24), 15393–15397.
Politi, A., Moné, M. J., Houtsmuller, A. B., Hoogstraten, D., Vermeulen, W., Heinrich, R., & Driel, R. Van. (2005). Mathematical Modeling of Nucleotide Excision Repair Reveals Efficiency of Sequential Assembly Strategies. Molecular Cell, 19, 679–690. https://doi.org/10.1016/j.molcel.2005.06.036
Quinodoz, S. A., Ollikainen, N., Tabak, B., Mcdonel, P., Garber, M., Guttman, M., … Cheng, C. (2018). Higher-Order Inter-chromosomal Hubs Shape 3D Genome Organization in the Nucleus. Cell, 744–757. https://doi.org/10.1016/j.cell.2018.05.024
Rao, S. S., Huntley, M. H., Durand, N. C., Stamenova, E. K., Bochkov, I. D., Robinson, J. T., … Aiden, E. L. (2014). A 3D map of the human genome at kilobase resolution reveals principles of chromatin looping. Cell, 159(7), 1665–1680. https://doi.org/10.1016/j.cell.2014.11.021
Rao, S. S. P., Huntley, M. H., Durand, N. C., Stamenova, E. K., Bochkov, I. D., Robinson, J. T., … Aiden, E. L. (2014a). 3D Map of the Human Genome at Kilobase Resolution Reveals Principles of Chromatin Looping. Cell, 159(7), 1665–1680. https://doi.org/10.1016/j.cell.2014.11.021
Rao, S. S. P., Huntley, M. H., Durand, N. C., Stamenova, E. K., Bochkov, I. D., Robinson, J. T., … Aiden, E. L. (2014b). 3DMap of the Human Genome at Kilobase Resolution Reveals Principles of Chromatin Looping. Cell, 156(7), 1–16. https://doi.org/10.1016/j.cell.2014.11.021
Rowley, M. J., Lyu, X., Rana, V., Ando-kuri, M., Karns, R., Bosco, G., … Bosco, G. (2019). Condensin II Counteracts Cohesin and RNA Polymerase II in the Establishment of 3D Chromatin Condensin II Counteracts Cohesin and RNA Polymerase II in the Establishment of 3D. CellReports, 26(11), 2890-2903.e3. https://doi.org/10.1016/j.celrep.2019.01.116
Sahlén, P., Abdullayev, I., Ramsköld, D., Matskova, L., Rilakovic, N., Lötstedt, B., … Sandberg, R. (2015). Genome-wide mapping of promoter-anchored interactions with close to single-enhancer resolution. Genome Biology, 1–13.

233
https://doi.org/10.1186/s13059-015-0727-9
Sanborn, A. L., Rao, S. S. P., Huang, S., Durand, N. C., & Huntley, M. H. (2015). Chromatin extrusion explains key features of loop and domain formation in wild-type and engineered genomes. PNAS. https://doi.org/10.1073/pnas.1518552112
Sanders, M. A., Hoogenboezem, R., Wit, E. De, Bouwman, B. A. M., Erpelinck, C., Velden, V. H. J. Van Der, … Delwel, R. (2014). A Single Oncogenic Enhancer Rearrangement Causes Concomitant EVI1 and GATA2 Deregulation in Leukemia. Cell, 369–381. https://doi.org/10.1016/j.cell.2014.02.019
Sanyal, A, Lajoie, B. R., Jain, G., & Dekker, J. (2012). The long-range interaction landscape of gene promoters. Nature, 489(7414), 109–113. https://doi.org/10.1038/nature11279
Sanyal, Amartya, Lajoie, B. R., Jain, G., & Dekker, J. (2012). The long-range interaction landscape of gene promoters. Nature, 489, 109–113. https://doi.org/10.1038/nature11279
Saurin, A. J., Shiels, C., Williamson, J., Satijn, D. P. E., Otte, A. P., Sheer, D., & Freemont, P. S. (1998). The Human Polycomb Group Complex Associates with Pericentromeric Heterochromatin to Form a Novel Nuclear Domain. The Journal of Cell Biology, 142(4), 887–898.
Schoenfelder, S., Furlan-magaril, M., Mifsud, B., Tavares-cadete, F., Sugar, R., Javierre, B., … Fraser, P. (2015). The pluripotent regulatory circuitry connecting promoters to their long-range interacting elements. Genome Research, 25, 1–16. https://doi.org/10.1101/gr.185272.114.Freely
Schwarzer, W., Abdennur, N., Goloborodko, A., Pekowska, A., Fudenberg, G., & Loe-mie, Y. (2017). Two independent modes of chromatin organization revealed by cohesin removal. Nature Publishing Group, 551(7678), 51–56. https://doi.org/10.1038/nature24281
Separation, M., & Rings, C. (1993). Microphase Separation of Block Copolymer Rings. American Chemical Society, 93(5), 1442–1444. https://doi.org/10.1021/ma00058a038
Servant, N., Varoquaux, N., Lajoie, B. R., Viara, E., Chen, C.-J., Vert, J.-P., … Barillot, E. (2015a). HiC-Pro: an optimized and flexible pipeline for Hi-C data processing. Genome Biology, 16, 259. https://doi.org/10.1186/s13059-015-0831-x
Servant, N., Varoquaux, N., Lajoie, B. R., Viara, E., Chen, C., Vert, J., … Barillot, E. (2015b). HiC-Pro : an optimized and flexible pipeline for Hi-C data

234
processing. Genome Biology, 1–11. https://doi.org/10.1186/s13059-015-0831-x
Shi, J., Whyte, W. A., Zepeda-mendoza, C. J., Milazzo, J. P., Shen, C., Roe, J., … Vakoc, C. R. (2013). Role of SWI / SNF in acute leukemia maintenance and enhancer-mediated Myc regulation. Gene and Development, 27, 2648–2662. https://doi.org/10.1101/gad.232710.113.
Shin, Y., Chang, Y., Lee, D. S. W., Berry, J., Sanders, D. W., Ronceray, P., … Brangwynne, C. P. (2018). Liquid Nuclear Condensates Mechanically Sense and Restructure the Genome. Cell, 175(6), 1481-1491.e13. https://doi.org/10.1016/j.cell.2018.10.057
Shinkai, S., Nozaki, T., Maeshima, K., & Togashi, Y. (2016). Dynamic Nucleosome Movement Provides Structural Information of Topological Chromatin Domains in Living Human Cells. PLOS Computational Biology, 1–16. https://doi.org/10.1371/journal.pcbi.1005136
Sigova, A. A., Hnisz, D., Abraham, B. J., Lee, T. I., Lau, A., Saint-andre, V., … Young, R. A. (2013). Resource Super-Enhancers in the Control of Cell Identity and Disease. Cell, 155. https://doi.org/10.1016/j.cell.2013.09.053
Simonis, M., Klous, P., Splinter, E., Moshkin, Y., Willemsen, R., de Wit, E., … de Laat, W. (2006). Nuclear organization of active and inactive chromatin domains uncovered by chromosome conformation capture-on-chip (4C). Nat Genet, 38(11), 1348–1354. https://doi.org/10.1038/ng1896
Smith, E. M., Lajoie, B. R., Jain, G., & Dekker, J. (2016). Invariant TAD Boundaries Constrain Cell-Type-Specific Looping Interactions between Promoters and Distal Elements around the CFTR Locus. American Journal of Human Genetics, 98(1), 185–201. https://doi.org/10.1016/j.ajhg.2015.12.002
Spilianakis, C. G., Lalioti, M. D., Town, T., Lee, G. R., & Flavell, R. A. (2005). Interchromosomal associations between alternatively expressed loci. Nature, 435(June), 637–645. https://doi.org/10.1038/nature03574
Splinter, E., de Wit, E., van de Werken, H. J., Klous, P., & de Laat, W. (2012). Determining long-range chromatin interactions for selected genomic sites using 4C-seq technology: From fixation to computation. Methods. https://doi.org/10.1016/j.ymeth.2012.04.009
Srinivasan, M., Scheinost, J. C., Petela, N. J., Hu, B., Costanzo, V., Nasmyth, K. A., … Nasmyth, K. A. (2018). The Cohesin Ring Uses Its Hinge to Organize DNA Using Non-topological as well as Topological Article The Cohesin Ring Uses Its Hinge to Organize DNA Using Non-topological as well as

235
Topological Mechanisms. Cell, 173(6), 1508-1510.e18. https://doi.org/10.1016/j.cell.2018.04.015
Stanton, B. Z., Hodges, C., Calarco, J. P., Braun, S. M. G., Ku, W. L., Kadoch, C., … Crabtree, G. R. (2016). Smarca4 ATPase mutations disrupt direct eviction of PRC1 from chromatin. Nature Publishing Group, 49(2), 282–288. https://doi.org/10.1038/ng.3735
Stephens, A. D., Banigan, E. J., Adam, S. A., Goldman, R. D., & Dunn, A. R. (2017). Chromatin and lamin A determine two different mechanical response regimes of the cell nucleus. Molecular Biology of the Cell. https://doi.org/10.1091/mbc.E16-09-0653
Stephens, A. D., Liu, P. Z., Banigan, E. J., Almassalha, L. M., & Misteli, T. (2018). Chromatin histone modifications and rigidity affect nuclear morphology independent of lamins. Molecular Biology of the Cell, 29, 220–223. https://doi.org/10.1091/mbc.E17-06-0410
Strom, A. R., & Alexander, V. (2017). formation. Nature Publishing Group, 547(7662), 241–245. https://doi.org/10.1038/nature22989
Symmons, O., Uslu, V. V., Tsujimura, T., Ruf, S., Nassari, S., Schwarzer, W., & Ettwiller, L. (2014). Functional and topological characteristics of mammalian regulatory domains. Genome Research, 24, 390–400. https://doi.org/10.1101/gr.163519.113.
Terakawa, T., Bisht, S., Eeftens, J. M., Dekker, C., & Haering, C. H. (2017). The condensin complex is a mechanochemical motor that translocates along DNA. Science, 358(November), 672–676.
Thakar, R., Gordon, G., & Csink, A. K. (2006). Dynamics and anchoring of heterochromatic loci during development. Journal of Cell Science, 119(20), 4165–4175. https://doi.org/10.1242/jcs.03183
Tolhuis, B., Palstra, R., Splinter, E., Grosveld, F., & Laat, W. De. (2002). Looping and Interaction between Hypersensitive Sites in the Active  -globin Locus. Molecular Cell, 10, 1453–1465.
Valton, A.-L., & Dekker, J. (2016). TAD disruption as oncogenic driver. Current Opinion in Genetics & Development, 36, 34–40. https://doi.org/10.1016/j.gde.2016.03.008
Vanden-eynden, S. K., Xie, J., & Lutterbach, B. (2006). RUNX1 associates with histone deacetylases and SUV39H1 to repress transcription. Npg, (May), 5777–5786. https://doi.org/10.1038/sj.onc.1209591
Variation, D., Maurano, M. T., Humbert, R., Rynes, E., Thurman, R. E., Haugen,

236
E., … Sunyaev, S. R. (2012). Systematic Localization of Common Disease-Associated Variation in Regulatory DNA Matthew. Science, 337(September), 1190–1196.
Visel, A., & Mundlos, S. (2015). Disruptions of Topological Chromatin Domains Cause Pathogenic Rewiring of Gene-Enhancer Interactions. Cell, 1012–1025. https://doi.org/10.1016/j.cell.2015.04.004
Vradii, D., Zaidi, S. K., Lian, J. B., Wijnen, A. J. Van, Stein, J. L., & Stein, G. S. (2005). Point mutation in AML1 disrupts subnuclear targeting , prevents myeloid differentiation , and effects a transformation-like phenotype. PNAS, 102(20).
Vu, L. P., Perna, F., Wang, L., Voza, F., Figueroa, M. E., Tempst, P., … Liu, Y. (2013). Article PRMT4 Blocks Myeloid Differentiation by Assembling a Methyl-RUNX1-Dependent Repressor Complex. Cell Reports, 5, 1625–1638. https://doi.org/10.1016/j.celrep.2013.11.025
Wang, S., Su, J., Beliveau, B. J., Bintu, B., Moffitt, J. R., Wu, C., & Zhuang, X. (2016a). single chromosomes. Science, 353(6299). https://doi.org/10.1126/science.aaf8084
Wang, S., Su, J., Beliveau, B. J., Bintu, B., Moffitt, J. R., Wu, C., & Zhuang, X. (2016b). Spatial organization ofchromatin domains and compartments in single chromosomes. Science, 353(6299). https://doi.org/10.1126/science.aaf8993
Werken, H. J. G. Van De, Haan, J. C., Feodorova, Y., Bijos, D., Weuts, A., Theunis, K., … Joffe, B. (2017). Small chromosomal regions position themselves autonomously according to their chromatin class. Genome Research, 27, 922–933. https://doi.org/10.1101/gr.213751.116.
Wilson, A., Murphy, M. J., Oskarsson, T., Kaloulis, K., Bettess, M. D., Oser, G. M., … Trumpp, A. (2004). c-Myc controls the balance between hematopoietic stem cell self-renewal and differentiation. GENES & DEVELOPMENT, 2747–2763. https://doi.org/10.1101/gad.313104.and
Wingett, S., Ewels, P., Furlan-Magaril, M., Nagano, T., Schoenfelder, S., Fraser, P., & Andrews, S. (2015). HiCUP: pipeline for mapping and processing Hi-C data. F1000Research, 4, 1310. https://doi.org/10.12688/f1000research.7334.1
Wu, C., Bassett, A., & Travers, A. (2007). A variable topology for the 30-nm chromatin fibre. EMBO Reports, 8(12), 8–13. https://doi.org/10.1038/sj.embor.7401115
Wutz, G., Várnai, C., Nagasaka, K., Cisneros, D. A., Stocsits, R. R., Tang, W., …

237
Peters, J. (2017). Topologically associating domains and chromatin loops depend on cohesin and are regulated by CTCF , WAPL , and PDS 5 proteins. The EMBO Journall, 36(24), 3573–3599. https://doi.org/10.15252/embj.201798004
Xiong, K., & Ma, J. (2018). Revealing Hi-C subcompartments by imputing high-resolution inter-chromosomal chromatin interactions.
Yaffe, E., & Tanay, A. (2011). Probabilistic modeling of Hi-C contact maps eliminates systematic biases to characterize global chromosomal architecture. Nat Genet, 43(11), 1059–1065. https://doi.org/10.1038/ng.947
Yashiro-ohtani, Y., Wang, H., Zang, C., Arnett, K. L., Bailis, W., & Ho, Y. (2014). Long-range enhancer activity determines Myc sensitivity to Notch inhibitors in T cell leukemia. PNAS. https://doi.org/10.1073/pnas.1407079111
Youmans, D. T., Schmidt, J. C., & Cech, T. R. (2018). Live-cell imaging reveals the dynamics of PRC2 and recruitment to chromatin by SUZ12-associated subunits. Gene and Development, 32, 794–805. https://doi.org/10.1101/gad.311936.118.the
Zhao, X., Jankovic, V., Gural, A., Huang, G., Pardanani, A., Menendez, S., … Nimer, S. D. (2008). Methylation of RUNX1 by PRMT1 abrogates SIN3A binding and potentiates its transcriptional activity. GENES & DEVELOPMENT, 640–653. https://doi.org/10.1101/gad.1632608.RUNX1c
Zhao, Z., Tavoosidana, G., Sjolinder, M., Gondor, A., Mariano, P., Wang, S., … Ohlsson, R. (2006). Circular chromosome conformation capture (4C) uncovers extensive networks of epigenetically regulated intra- and interchromosomal interactions. Nat Genet, 38(11), 1341–1347. https://doi.org/10.1038/ng1891
Zidovska, A., Weitz, D. A., & Mitchison, T. J. (2013). Micron-scale coherence in interphase chromatin dynamics. PNAS, (16). https://doi.org/10.1073/pnas.1220313110
Copyright © 2022 FDOKUMEN