
TRACE: transcription factor footprinting using chromatin ...
21
TRACE: transcription factor footprinting using chromatin accessibility data and DNA sequence Ningxin Ouyang 1 and Alan P. Boyle 1,2* 1 Department of Computational Medicine and Bioinformatics, 2 Department of Human Genetics University of Michigan, Ann Arbor, MI, 48109 * To whom correspondence should be addressed: Alan P. Boyle, Ph.D. Department of Computational Medicine and Bioinformatics University of Michigan Medical School 2049A Palmer Commons 100 Washtenaw Ave. Ann Arbor, MI 48109 [email protected] Keywords: Gene regulation, Transcription factors, Footprinting, TFBSs, Machine learning Cold Spring Harbor Laboratory Press on June 23, 2022 - Published by genome.cshlp.org Downloaded from
-
Upload
khangminh22 -
Category
Documents
-
view
2 -
download
0
Transcript of TRACE: transcription factor footprinting using chromatin ...

TRACE: transcription factor footprinting using chromatin accessibility data and
DNA sequence
Ningxin Ouyang1 and Alan P. Boyle1,2*
1Department of Computational Medicine and Bioinformatics, 2Department of Human Genetics
University of Michigan, Ann Arbor, MI, 48109
* To whom correspondence should be addressed:
Alan P. Boyle, Ph.D.
Department of Computational Medicine and Bioinformatics
University of Michigan Medical School
2049A Palmer Commons
100 Washtenaw Ave.
Ann Arbor, MI 48109
Keywords:
Gene regulation,
Transcription factors,
Footprinting,
TFBSs,
Machine learning
Cold Spring Harbor Laboratory Press on June 23, 2022 - Published by genome.cshlp.orgDownloaded from

Abstract
Transcription is tightly regulated by cis-regulatory DNA elements where transcription factors can bind.
Thus, identification of transcription factor binding sites (TFBSs) is key to understanding gene expression
and whole regulatory networks within a cell. The standard approaches used for TFBS prediction, such as
position weight matrices (PWMs) and chromatin immunoprecipitation followed by sequencing (ChIP-
seq), are widely used, but have their drawbacks including high false positive rates and limited antibody
availability, respectively. Several computational footprinting algorithms have been developed to detect
TFBSs by investigating chromatin accessibility patterns, however these also have limitations. We have
developed a footprinting method to predict Transcription factor footpRints in Active Chromatin Elements
(TRACE) to improve the prediction of TFBS footprints. TRACE incorporates DNase-seq data and PWMs
within a multivariate Hidden Markov Model (HMM) to detect footprint-like regions with matching motifs.
TRACE is an unsupervised method that accurately annotates binding sites for specific TFs automatically
with no requirement for pre-generated candidate binding sites or ChIP-seq training data. Compared to
published footprinting algorithms, TRACE has the best overall performance with the distinct advantage of
targeting multiple motifs in a single model.
Introduction
Identification of cis-regulatory elements where transcription factors (TFs) bind remains a key goal in
deciphering transcriptional regulatory circuits. Standard approaches to identify sets of active transcription
factor binding sites (TFBSs) include the use of position weight matrices (PWMs) (Stormo et al. 1982) and
ChIP-seq (Barski et al. 2007). While these methods have been successful, both suffer from drawbacks that
limit their usefulness. PWMs are able to identify high-resolution binding sites but are prone to extremely
high false positive rates in the genome. On the other hand, while ChIP-seq binding measurements are
highly specific and have a significantly reduced false positive rate, the resolution is comparatively low,
labor intensive, and depends on suitable antibodies that are only available for a limited number of TFs.
Cold Spring Harbor Laboratory Press on June 23, 2022 - Published by genome.cshlp.orgDownloaded from

Newer experimental techniques for identification of DNA-bound protein binding sites, such as ChIP-exo
(Rhee and Pugh 2012) and CUT&RUN (Skene and Henikoff 2017), have the advantage of high resolution
and cost efficiency, but still share the same labor intensive and limited antibody availability disadvantages
as ChIP-seq.
To complement these approaches, another experimental method has been developed using data from
high-throughput sequencing after DNase I digestion (DNase-seq) (Boyle et al. 2008). DNase-seq
identifies stretches of open regions of chromatin where DNase I cuts at a higher frequency. Within these
regions, TFBSs can be identified at nucleotide resolution by searching for footprint-like regions with low
numbers of DNase I cuts embedded in high-cut peaks.
Hesselberth et al. (2009) first proposed a DNase-seq signal based computational method to detect
footprints at base pair resolution in Saccharomyces cerevisiae. Since then, several computational
footprinting algorithms have been developed to detect TFBSs by investigating chromatin accessibility
patterns, which can be categorized as de novo (the Boyle method, DNase2TF, HINT, PIQ and Wellington)
and motif-centric (DeFCoM, BinDNase, CENTIPEDE, FLR) (Boyle et al. 2011; Gusmao et al. 2016;
Kähärä and Lähdesmäki 2015; Piper et al. 2013; Pique-Regi et al. 2011; Quach and Furey 2016;
Sherwood et al. 2014; Sung et al. 2014; Yardımcı et al. 2014). De novo methods detect footprints across
input regions based on their DNase digestion pattern. However, most of these methods were not designed
to distinguish between binding sites for specific TFs, and cannot automatically label TF-specific binding
sites of interest. In contrast, motif-centric methods can predict TF-specific sites, but require pre-generated
candidate binding sites for TFs and assess their probability of being TF-bound (active binding sites). This
limits their performance as these methods are unable to detect additional regions of candidate binding
sites. Moreover, some of these methods are supervised, requiring ChIP-seq data to generate positive and
negative training sets, and can only be applied to TFs with high-quality antibodies. This is a constraint as
only a minority of TFs have ChIP-seq data available (Wang et al. 2012).
In addition to DNase digestion patterns, more detailed modeling of sequence preference information
has been used in TFBSs identification. Hoffman and Birney (2010) have previously proposed a Hidden
Cold Spring Harbor Laboratory Press on June 23, 2022 - Published by genome.cshlp.orgDownloaded from

Markov Model (HMM)-based method, termed Sunflower, to predict TFBSs based solely on sequence
data. Instead of scanning for motif sequences directly, this model takes into consideration the competition
between multiple TFs to provide a binding profile for all factors included in the model. While Sunflower
still suffers from sequence-only method limitations for identifying TFBSs, it has a greater ability to
distinguish the specific TF that binds at each predicted site.
We have developed an unsupervised footprinting method, TRACE, based on a HMM framework
(Rabiner 1989; Durbin et al. 1998) and inspired by the success of Sunflower and other existing
footprinting methods. TRACE predicts footprints and label binding sites for a set of desired TFs by
integrating both DNase-seq data and PWMs. Our method is not dependent on pre-generated candidate
binding sites or available ChIP-seq data, making it more flexible and broadly applicable compared to
previous methods.
Results
The TRACE Model
TRACE is an HMM-based unsupervised method with the number of hidden states dependent on the
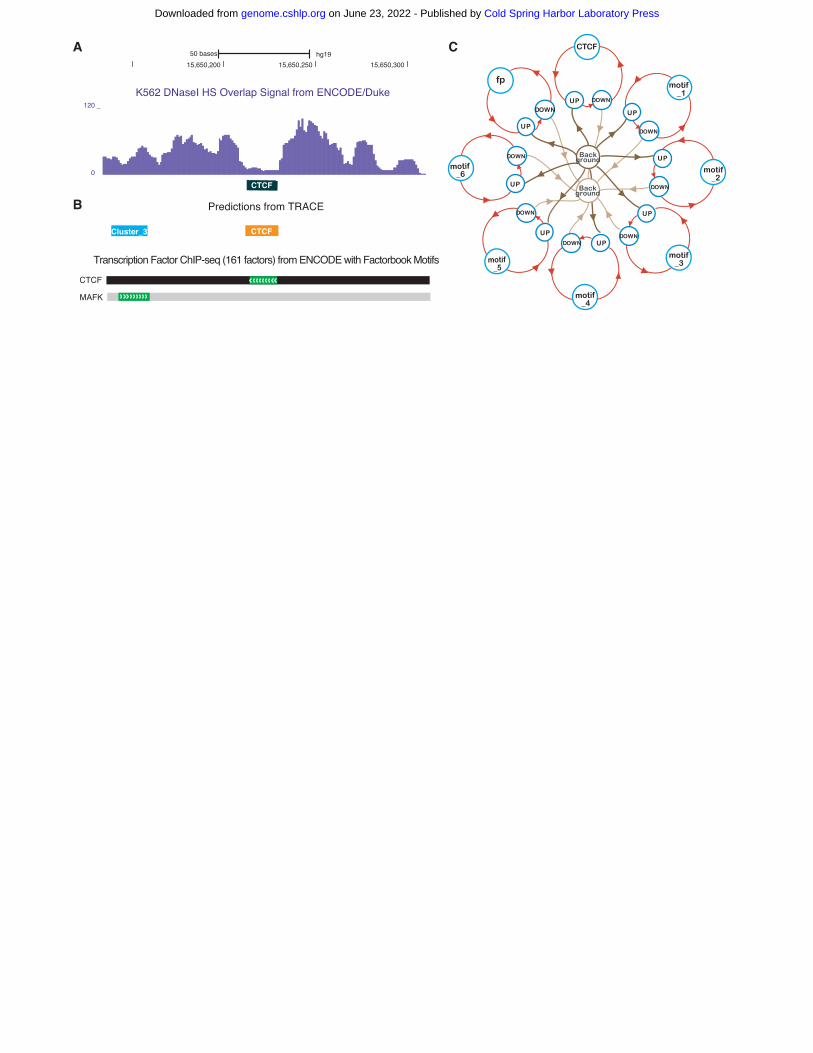
numbers and lengths of included PWMs (Fig. 1). The basic structure of our model includes two
Background states (the start and end of each open chromatin region delineated by DNase I cut sites), a
target TF state (Fig. 1C, CTCF), a generic footprint state (Fig. 1C, fp), and a series of bait motif states
(Fig. 1C, motif_1-motif_6). Each of the non-background states is surrounded by a set of UP, TOP and
DOWN states (upslope, summit, and downslope of small peaks surrounding each footprint). Target TF
states and bait motif states contain a number of discrete chains of states representing binding sites for
each motif included in the model. The generic footprint state represents the regions that have a footprint-
like digestion pattern, but do not match any PWMs in the model. TRACE includes a series of bait motifs
representing commonly co-occurring motifs that significantly increase the performance of the model. For
example, the 7-motif CTCF model in Fig. 1C includes a CTCF binding site state chain, 6 additional bait
motifs (motif_1, motif_2, …, motif_6), and generic footprints whose sequences do not match any of the
Cold Spring Harbor Laboratory Press on June 23, 2022 - Published by genome.cshlp.orgDownloaded from

included motifs. For each of these motifs, our model can distinguish its TF-bound states from unbound
states based on the distinct DNase-seq digestion patterns of the motif sites (Supplemental Fig. S1).
TRACE takes PWMs and DNase-seq signals as inputs and models the emission distribution as a
multivariate normal distribution using cut count signal and its derivative, and PWM scores at each
genomic position. Each binding site (footprint) is expected to be in a region of low sequence density
surrounded by a peak of density to either side with a high PWM score (Fig. 1A, 1B).
TRACE outperforms existing methods
To evaluate the performance of TRACE relative to published computational footprinting methods, we
tested 9 methods (DeFCoM, BinDNase, CENTIPEDE, FLR, DNase2TF, HINT, PIQ, Wellington, and a
PWM-only comparison) on 99 TFs. For a fair comparison across all methods, de novo methods were
applied to DNase-seq peaks containing the same sets of motif sites that were assessed by motif-centric
methods. Receiver operating characteristic curve area under the curve (ROC AUC), and Precision-Recall
(PR) AUC of predictions of each TF were computed for each method based on the P-values or scores
provided, and ranked across all methods (Fig. 2A, Supplemental Fig. S2, S3).
Previous studies evaluating computational footprinting methods focus on ROC AUC as a
measurement of performance. Although this is a decent classification performance assessment, the
number can be inflated by false positive predictions. For example, the ROC AUC statistic might imply a
relatively favorable classification if the method tends to call most samples as positive hits when the data
is highly unbalanced, as is the case for many of TFs tested. In addition, partial ROC AUC (ROC pAUC)
were computed at a 5% false positive rate (FPR) cutoff. PR AUC was also included in the evaluations as
it provides a better assessment of false positives. Compared with other footprinting methods, TRACE has
the best overall performance based on average rank in both ROC pAUC and PR AUC across the 99 tested
TFs (Fig. 2C, 2D). It ranked first overall for 25.5% of TFs and in the top 5 for 96.9% of TFs. Compared
to other unsupervised methods, TRACE ranked first for 87.7% of TFs. TRACE also outperformed
supervised approaches including DeFCoM and BinDNase. TRACE can predict TF footprints with
Cold Spring Harbor Laboratory Press on June 23, 2022 - Published by genome.cshlp.orgDownloaded from

performance equal to or better than the best published methods without the requirement of positive and
negative training datasets.
Bait motifs improve footprinting prediction accuracy
TRACE provides identification of binding sites for any desired TFs at nucleotide resolution. By
incorporating DNase-seq data and PWM information, it can detect footprints with an anticipated DNase
digestion pattern and matching motifs (Fig. 1B). One important feature of our model is that states for
different motifs are independent of each other, enabling its ability to distinctly label binding sites for
multiple TFs. In addition, adding extra motifs to the model for a specific TF can potentially increase the
accuracy of identifying TF-specific binding sites. These additional motifs as baits, discouraging the
prediction of weakly matching sites and introducing competition, thus decreasing false positive rates
(Hoffman and Birney 2010). However, including PWMs with similar sequence preference does not
provide useful information and could decrease our model’s ability to distinguish between binding sites of
different motifs. To avoid this, only root motifs from each motif cluster in the JASPAR CORE vertebrates
clustering were used (Khan et al. 2018) and the cluster that contains the TF of interest was excluded
(Supplemental Methods). Each root motif encompasses all of the position-specific scoring matrices
(PSSMs) of a cluster generated by the RSAT matrix-clustering tool (Castro-Mondragon et al. 2017). In a
N-motif model, the root motifs from N-1 clusters with the greatest number of occurrences were selected.
These N-1 motifs provide additional information, making the model more sensitive to identifying binding
sites for the TF of interest.
Overall, the addition of bait motifs to the model yielded significant improvements over our original
method, which had a similar HMM structure but did not include motif information (an option provided in
TRACE) (Boyle et al. 2011). Using a 10-motif model (the TF of interest plus 9 extra motifs), the average
PR AUC from TRACE increased by 0.20 (63.1%) over our original method and ROC pAUC improved by
20%.
Cold Spring Harbor Laboratory Press on June 23, 2022 - Published by genome.cshlp.orgDownloaded from

By comparing models containing different numbers of extra motifs, we found that additional TFs
can increase the quality of TFBS identification in most cases. However, this was at the expense of
considerably increased computational time (Supplemental Table S3). We determined that an optimal
trade-off between performance increase and computational time was the 10-motif model, which is used in
the remainder of this study.
TRACE can be applied accurately across cell lines
Cross cell-line validation was performed using models trained from K562 DNase-seq data and
subsequently applied to GM12878 to test their performance compared to models trained on GM12878.
Due to less available validation data in GM12878, this comparison utilized 52 TFs. The results indicated
that TRACE can provide accurate predictions in one cell line using a model trained from another cell line,
and that intra-cell line and inter-cell line predictions have comparable overall performance (Fig. 2B). This
suggests that the data processing steps can successfully capture the signature information of DNase
digestion and diminish between-dataset variance to a degree sufficient for effective prediction across cell
lines. It also indicates that the DNase digestion pattern of binding sites is preserved for most TFs across
cell types. Some exceptions were observed however, for example ESRRA had
significantly better performance in the inter-cell line test compared to the intra-cell line test. This TF has
far fewer active binding sites in GM12878 (7.6% prevalence) than K562 (31.3% prevalence), and
TRACE may not be able to learn an accurate model from the GM12878 data. This suggests that the model
should be trained using high quality and most representative of the true genome-wide binding datasets,
and the trained model can be applied across all cell types of interest.
TRACE’s cross-cell line application allows for fast and large-scale TFBSs prediction using existing
models without repetitive model training, which is the most time-consuming step. It also shows TRACE’s
advantage over supervised methods’ limited usage as only a very small fraction of TFs have ChIP-seq
data available (Supplemental Fig. S4). To further showcase this flexibility, we have generated models for
526 JASPAR motifs and made them available through our GitHub site.
Cold Spring Harbor Laboratory Press on June 23, 2022 - Published by genome.cshlp.orgDownloaded from

TRACE calls accurate footprints using ATAC-seq data
ATAC-seq provides chromatin accessibility information (Buenrostro et al. 2013) and has been proposed
to be useful in footprinting analyses. TRACE was tested using ATAC-seq and OMNI-ATAC-seq data
(Supplemental Methods) to evaluate the performance of our model compared to other models designed to
work with this particular data type. The results were compared with HINT-ATAC (Li et al. 2019) and
DeFCoM, as their original publications included ATAC-seq-based evaluation, and showed similar
improvement in performance as in the case of DNase data.
Overall, TRACE maintains the best performance among these three methods, as it ranked first for
both PR AUC and ROC pAUC (Fig. 3A, Supplemental Fig. S5). Prediction accuracy for TRACE was
compared using DNase-seq and ATAC-seq data for each TF in GM12878 (Fig. 3B, Supplemental Fig.
S6). This analysis showed that ATAC-seq data provides comparable TFBS identification potential as
DNase-seq, but that TRACE works slightly better comparing PR AUCs using DNase-seq data (60% of
TFs). TFs that showed significant lower PR AUC using DNase-seq were caused by training data
imbalances from GM12878 DNase-seq peaks. For example, training sets from ATAC-seq data for
FOXK2, ZNF384, CEBPB and TBP all have at least 100% increase of prevalence compared to DNase-
seq training sets. To determine that the performance difference between these two datasets was not due to
the deeper sequencing depth of DNase-seq, TRACE was performed on a DNase-seq dataset that had
comparable and/or fewer reads than ATAC-seq. This had minimal effect on TRACE’s performance and
similar results were obtained (Supplemental Fig. S12). We further downsampled our datasets and found
that footprinting performance would drop significantly if number of reads was below 50 million.
DNase footprinting has stable performance despite variable levels of data imbalance
It has been noted that not all TFs have accurately predicted active binding sites by computational
footprinting, regardless of the algorithm applied. Our evaluation of existing footprinting methods
indicates that all methods share similar performance trends across all TFs (Fig. 4A left panel,
Cold Spring Harbor Laboratory Press on June 23, 2022 - Published by genome.cshlp.orgDownloaded from

Supplemental Fig. S9). This pattern also exists when assessing candidate binding sites by PWM scores
alone (Fig. 4A right panel). The footprinting performance gain against PWMs is only marginal for some
TFs, and using PWM scores alone can even outperform all footprinting methods for 2 TFs among the 99
TFs tested here (Fig. 4B).
The poor performance from footprinting might be partially due to the imbalance of positive (P) and
negative (N) examples in data sets, as evaluation statistics of prediction for each TF were shown to be
associated with its prevalence (fraction of positive samples, P/(P+N), see Methods) (Fig. 4A). Data
imbalance affects the quality of model training and, if the data distribution is too skewed, training quality
will likely be diminished. Some poor performing models were associated with too few positive examples,
due to their inability to distinguish active and inactive states in model training. However, this only
accounts for a small subset and cannot explain the general trend of poor performance in TFBSs
predictions. Comparing final models for each TF did not reveal significant correlation between prediction
accuracies and statistics from different models.
To further explore how computational footprinting may be limited by data imbalance, the best
footprinting performance for each TF was compared with a matched-imbalance permutation test of
labeled sites (Fig. 4C, Supplemental Fig. S7, S8, S10). To complement this, simulations were performed
with different levels of classification skill and varying imbalance to estimate how PR AUC and ROC
AUC values reflect the classifier performance (Supplemental Fig. S7). As imbalance changes within a
classification skill, we can expect the PR AUC will change correspondingly, but ROC AUC and ROC
pAUC will stay the same (Saito and Rehmsmeier 2015). However, ROC curve often provides an overly
optimistic assessment caused by true negatives used in false positive rate calculation, especially when
there is a large skew in the data distribution (Davis and Goadrich 2006).
Instead of comparing AUCs across TFs directly, their performance improvement over random labels
(baseline) was measured. To examine the general performance gain using computational footprinting,
max PR AUCs or ROC AUCs were collected from all existing methods, including TRACE, and then
AUCs were subtracted from the corresponding permutation test. This number was used as a measurement
Cold Spring Harbor Laboratory Press on June 23, 2022 - Published by genome.cshlp.orgDownloaded from

of footprinting performance advantage over randomly predicted labels. The regression line of PR AUC
increase against baseline has a skewed bell-like shape, consistent with the shape of simulated
performance generated from a steady model skill (Fig. 4C, Supplemental Fig S7, S10). This suggests that
the performance of footprinting is roughly at a stable level and not associated with data imbalance. A
higher evaluation statistic does not necessarily mean a better classification quality for that TF in some
cases. Although prevalence may affect evaluation statistic values, no evidence was found that the true
classification quality is determined by this data imbalance. Instead, there tends to be a stable level of
footprinting classification performance increase compared to random across all TFs.
Discussion
Incorporating DNase-seq data and PWM information enables TRACE to detect footprints with the desired
DNase digestion pattern and matching motifs. By including multiple motifs in the same model, our
method provides a better overall TFBS prediction than other existing computational footprinting methods.
Since different motifs are treated as separate states in our model, TRACE also has the potential of
targeting multiple TFs in a single model. Our method annotates binding sites for the desired TFs across
input regions automatically, without requiring pre-generated candidate binding sites or additional motif
matching steps. In addition, as an unsupervised algorithm, its application is not limited to TFs with
available ChIP-seq data.
Although computational footprinting has demonstrated the ability to predict TFBSs at an
approximately consistent level, variation in evaluation statistics is still observed across TFs. A previous
study showed that not all TFs will leave clear footprint-like nuclease cleavage patterns, and their
protection of DNA from cleavage is correlated with residence time (Sung et al. 2014). For some TFs, this
can result in footprinting methods being unable to detect a consistent footprint-like DNase digestion
pattern, and might fail to correctly label its binding sites. However, there is only limited residence time
data available for a small number of TFs, and no comprehensive examination on residence time’s impact
on footprinting quality has been completed. Although residence time is known to be associated with
Cold Spring Harbor Laboratory Press on June 23, 2022 - Published by genome.cshlp.orgDownloaded from

enzymatic digestion patterns, it is also correlated with the number of active binding sites. GR, AP-1 and
CTCF were tested by Sung et al. (2014) as TFs or TF subunits with short, intermediate and long residence
time, respectively. For those TFs included in our test (NR3C1 as GR group, JUN, JUNB, JUND as AP-1
group, and CTCF), we observed that TFs with longer residency time tend to have a greater prevalence and
a better PR AUC from footprinting (Supplemental Fig. S11). However, neither ROC AUC nor ROC
pAUC of these TFs were correlated with residence time. This indicates the possibility that the association
between residence time and footprinting ability might be caused by the correlation between performance
evaluation statistics and TFBS prevalence. The observed performance disparity may only reflect the
changes in fraction of active binding sites among all putative motif sites.
Our evaluation on all footprinting methods indicates that there might be a limited classification
accuracy gain that computational footprinting achieves, as the best performance for different TFs all
centered at a certain level of classification quality. Our analysis suggests that evaluation statistics of
classification from footprinting may be largely influenced by TFBS prevalence, and comparing them
directly across TFs may be misleading. Computational footprinting in general might have a maximum
potential for how well it can detect TFBSs and only very limited improvement can be achieved beyond
this point.
Methods
Data and software
DNase-seq data in BAM and BED formats and ChIP-seq data in BED format were retrieved from the
ENCODE download portal (Supplemental Table S1). ATAC-seq data for GM12878 cells using the
standard ATAC-seq protocol were obtained from GSE47753 (Buenrostro et al. 2013). Omni-ATAC-seq
data were obtained from the Sequencing Read Archive (SRA) with the BioProject accession
PRJNA380283 (Corces et al. 2017). 129 PWMs and cluster information (Supplemental Table S2) were
downloaded from the JASPAR database (Khan et al. 2018). Motif sites were identified using FIMO
Cold Spring Harbor Laboratory Press on June 23, 2022 - Published by genome.cshlp.orgDownloaded from

(MEME v5.0.3) with default parameters (Grant et al. 2011). Evaluation statistics were generated using the
Python package scikit-learn (Pedregosa FABIANPEDREGOSA et al. 2011).
Data processing
After bias correction based on model and bias values reported in He et al. (2014), we first counted the
number of DNase-seq reads at each location using the 5’ end of the reads, which is the DNase I digestion
site. These cut counts were then normalized by (a/the?) non-zero mean of the surrounding 10k bp window
(within data set normalization) as well as the percentile and standard deviation from the entire region
(between data set normalization) (Supplemental Methods). Normalized signals were then smoothed using
the local regression method R (R Core Team 2018) function LOESS (Cleveland et al. 1992) and their
derivatives were calculated using the savitzky-golay filter in the Python package Scipy (Jones et al. 2014).
The first derivatives represent the slope of the processed signal curve and their signs indicate the increase
or decrease data changes. UP, TOP and DOWN states in the peak have positive, zero and negative slopes,
respectively.
Evaluation
To assess the performance of TRACE and existing computational footprinting tools, we evaluated
DeFCoM, BinDNase, CENTIPEDE, FLR, PWM score only, DNase2TF, HINT, PIQ and Wellington
based on scores or P-values provided by each method. Candidate binding sites (motif sites) that
overlapped with DNase-seq peaks confirmed by ChIP-seq were used as the positive set, and those not in
ChIP-seq peaks but still overlapping DNase-seq peaks made up the negative set. Prevalence was
calculated as number of active binding sites (positive set) divided by total number of motif sites (positive
set and negative set).
To provide a fair comparison across all methods, we applied de novo methods to DNase-seq peaks
(with 100bp flanking regions to each side) containing the same sets of motif sites that were included in
motif-centric methods tests. For de novo methods, only the predictions overlapping with motif sites of
Cold Spring Harbor Laboratory Press on June 23, 2022 - Published by genome.cshlp.orgDownloaded from

tested TFs were included in our evaluation; candidate binding sites that were missing from their
predictions were also included with an assigned minimum score. For motif-centric methods and PWM
only evaluations, only candidate binding sites provided are assessed, thus all predictions were included in
the evaluation (Supplemental Methods). Annotations and corresponding scores or P-values were used to
calculate the ROC AUC, ROC pAUC at a 5% FPR cutoff and PR AUC values for all TFs.
Permutation tests were performed by shuffling labels from footprinting prediction results. Multiple
simulation tests were also included based on different levels of positive and negative samples
separation(s?) and different positive example fractions. Scores for positive and negative groups were
randomly drawn from the normal distribution of different means and standard deviations.
Software availability
TRACE is an open source software; the source code, trained models, and predictions are available on
GitHub at https://github.com/Boyle-Lab/TRACE and as Supplemental Code.
Acknowledgments
NO and APB were supported by NIH U41 HG009293.
Competing interest statement
The authors declare no competing interests.
References Barski A, Cuddapah S, Cui K, Roh T-Y, Schones DE, Wang Z, Wei G, Chepelev I, Zhao K.
2007. High-Resolution Profiling of Histone Methylations in the Human Genome. Cell 129: 823–837.
Boyle AP, Davis S, Shulha HP, Meltzer P, Margulies EH, Weng Z, Furey TS, Crawford GE. 2008. High-Resolution Mapping and Characterization of Open Chromatin across the Genome. Cell 132: 311–322.
Boyle AP, Song L, Lee B-K, London D, Keefe D, Birney E, Iyer VR, Crawford GE, Furey TS.
Cold Spring Harbor Laboratory Press on June 23, 2022 - Published by genome.cshlp.orgDownloaded from

2011. High-resolution genome-wide in vivo footprinting of diverse transcription factors in human cells. Genome Res 21: 456–464.
Buenrostro JD, Giresi PG, Zaba LC, Chang HY, Greenleaf WJ. 2013. Transposition of native chromatin for fast and sensitive epigenomic profiling of open chromatin, DNA-binding proteins and nucleosome position. Nat Methods 10: 1213–8.
Castro-Mondragon JA, Jaeger S, Thieffry D, Thomas-Chollier M, van Helden J. 2017. RSAT matrix-clustering: dynamic exploration and redundancy reduction of transcription factor binding motif collections. Nucleic Acids Res 45: e119–e119. https://academic.oup.com/nar/article/45/13/e119/3862068 (Accessed February 19, 2020).
Cleveland WS, Grosse E, Shyu WM. 1992. Local Regression Models. In Statistical Models in S (ed. J.M. Chambers and T.J. Hastie), pp. 309–376, Wadsworth & Brooks/Cole, New York.
Corces MR, Trevino AE, Hamilton EG, Greenside PG, Sinnott-Armstrong NA, Vesuna S, Satpathy AT, Rubin AJ, Montine KS, Wu B, et al. 2017. An improved ATAC-seq protocol reduces background and enables interrogation of frozen tissues. Nat Methods 14: 959–962.
Davis J, Goadrich M. 2006. The relationship between Precision-Recall and ROC curves. In Proceedings of the 23rd international conference on Machine learning - ICML ’06, pp. 233–240, ACM Press, New York, New York, USA.
Durbin R, Eddy SR, Krogh A, Mitchison G. 1998. Biological sequence analysis. Cambridge University Press, Cambridge.
Grant CE, Bailey TL, Noble WS. 2011. FIMO: scanning for occurrences of a given motif. Bioinformatics 27: 1017–8.
Gusmao EG, Allhoff M, Zenke M, Costa IG. 2016. Analysis of computational footprinting methods for DNase sequencing experiments. Nat Methods 13: 303–309.
He HH, Meyer CA, Hu SS, Chen M-W, Zang C, Liu Y, Rao PK, Fei T, Xu H, Long H, et al. 2014. Refined DNase-seq protocol and data analysis reveals intrinsic bias in transcription factor footprint identification. Nat Methods 11: 73–78.
Hesselberth JR, Chen X, Zhang Z, Sabo PJ, Sandstrom R, Reynolds AP, Thurman RE, Neph S, Kuehn MS, Noble WS, et al. 2009. Global mapping of protein-DNA interactions in vivo by digital genomic footprinting. Nat Methods 6: 283–9.
Hoffman MM, Birney E. 2010. An effective model for natural selection in promoters. Genome Res 20: 685–92.
Jones E, Oliphant T, Peterson P. 2014. {SciPy}: Open source scientific tools for {Python}. Kähärä J, Lähdesmäki H. 2015. BinDNase: a discriminatory approach for transcription factor
binding prediction using DNase I hypersensitivity data. Bioinformatics 31: 2852–2859. Khan A, Fornes O, Stigliani A, Gheorghe M, Castro-Mondragon JA, van der Lee R, Bessy A,
Chèneby J, Kulkarni SR, Tan G, et al. 2018. JASPAR 2018: update of the open-access database of transcription factor binding profiles and its web framework. Nucleic Acids Res 46: D260–D266.
Li Z, Schulz MH, Look T, Begemann M, Zenke M, Costa IG. 2019. Identification of transcription factor binding sites using ATAC-seq. Genome Biol 20: 45.
Pedregosa FABIANPEDREGOSA F, Michel V, Grisel OLIVIERGRISEL O, Blondel M, Prettenhofer P, Weiss R, Vanderplas J, Cournapeau D, Pedregosa F, Varoquaux G, et al. 2011. Scikit-learn: Machine Learning in Python Gaël Varoquaux Bertrand Thirion Vincent Dubourg Alexandre Passos PEDREGOSA, VAROQUAUX, GRAMFORT ET AL. Matthieu Perrot.
Piper J, Elze MC, Cauchy P, Cockerill PN, Bonifer C, Ott S. 2013. Wellington: a novel method
Cold Spring Harbor Laboratory Press on June 23, 2022 - Published by genome.cshlp.orgDownloaded from

for the accurate identification of digital genomic footprints from DNase-seq data. Nucleic Acids Res 41: e201–e201.
Pique-Regi R, Degner JF, Pai AA, Gaffney DJ, Gilad Y, Pritchard JK. 2011. Accurate inference of transcription factor binding from DNA sequence and chromatin accessibility data. Genome Res 21: 447–455.
Quach B, Furey TS. 2016. DeFCoM: analysis and modeling of transcription factor binding sites using a motif-centric genomic footprinter. Bioinformatics btw740.
R Core Team. 2018. R: A Language and Environment for Statistical Computing. R Found Stat Comput https://www.R-project.org. http://www.r-project.org.
Rabiner LR. 1989. A Tutorial on Hidden Markov Models and Selected Applications in Speech Recognition. Proc IEEE 77: 257–286.
Rhee HS, Pugh BF. 2012. ChiP-exo method for identifying genomic location of DNA-binding proteins with near-single-nucleotide accuracy. Curr Protoc Mol Biol 0 21.
Saito T, Rehmsmeier M. 2015. The precision-recall plot is more informative than the ROC plot when evaluating binary classifiers on imbalanced datasets. PLoS One 10.
Sherwood RI, Hashimoto T, O’Donnell CW, Lewis S, Barkal AA, van Hoff JP, Karun V, Jaakkola T, Gifford DK. 2014. Discovery of directional and nondirectional pioneer transcription factors by modeling DNase profile magnitude and shape. Nat Biotechnol 32: 171–178.
Skene PJ, Henikoff S. 2017. An efficient targeted nuclease strategy for high-resolution mapping of DNA binding sites. Elife 6.
Stormo GD, Schneider TD, Gold L, Ehrenfeucht A. 1982. Use of the “Perceptron” algorithm to distinguish translational initiation sites in E. coli. Nucleic Acids Res 10: 2997.
Sung M-H, Guertin MJ, Baek S, Hager GL. 2014. DNase Footprint Signatures Are Dictated by Factor Dynamics and DNA Sequence. Mol Cell 56: 275–285.
Wang J, Zhuang J, Iyer S, Lin X, Whitfield TW, Greven MC, Pierce BG, Dong X, Kundaje A, Cheng Y, et al. 2012. Sequence features and chromatin structure around the genomic regions bound by 119 human transcription factors. Genome Res 22: 1798–812.
Yardımcı GG, Frank CL, Crawford GE, Ohler U. 2014. Explicit DNase sequence bias modeling enables high-resolution transcription factor footprint detection. Nucleic Acids Res 42: 11865–78.
Cold Spring Harbor Laboratory Press on June 23, 2022 - Published by genome.cshlp.orgDownloaded from
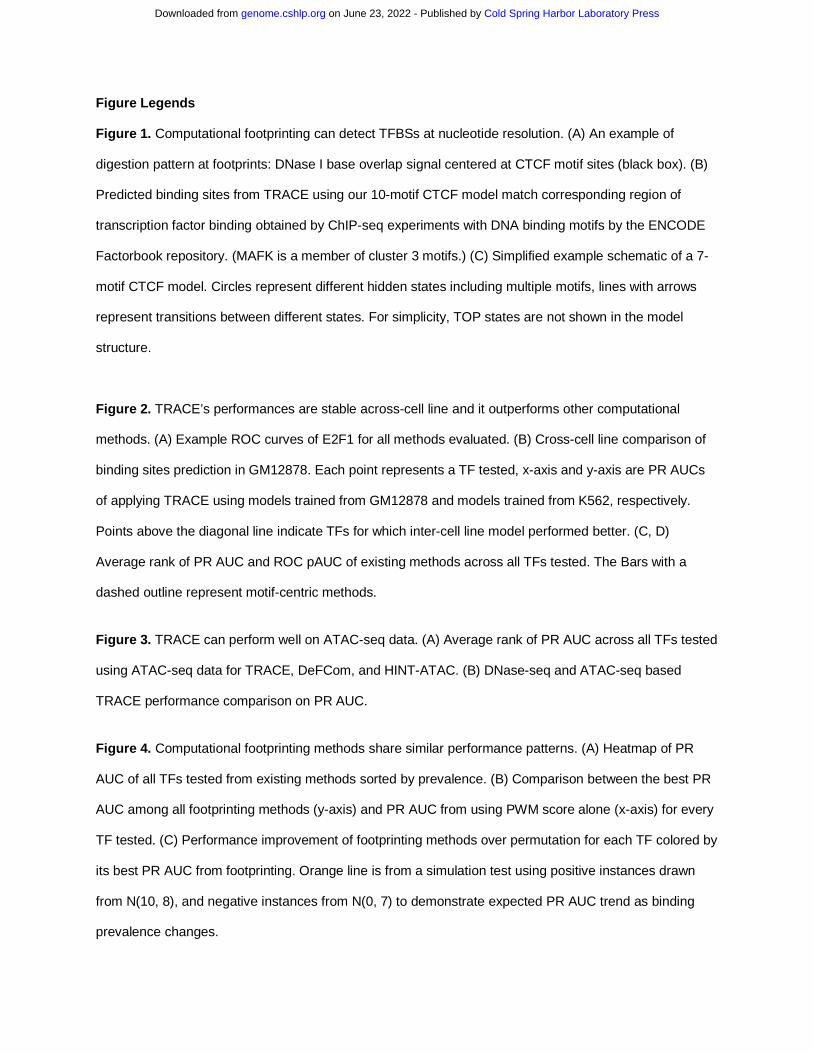
Figure Legends Figure 1. Computational footprinting can detect TFBSs at nucleotide resolution. (A) An example of
digestion pattern at footprints: DNase I base overlap signal centered at CTCF motif sites (black box). (B)
Predicted binding sites from TRACE using our 10-motif CTCF model match corresponding region of
transcription factor binding obtained by ChIP-seq experiments with DNA binding motifs by the ENCODE
Factorbook repository. (MAFK is a member of cluster 3 motifs.) (C) Simplified example schematic of a 7-
motif CTCF model. Circles represent different hidden states including multiple motifs, lines with arrows
represent transitions between different states. For simplicity, TOP states are not shown in the model
structure.
Figure 2. TRACE’s performances are stable across-cell line and it outperforms other computational
methods. (A) Example ROC curves of E2F1 for all methods evaluated. (B) Cross-cell line comparison of
binding sites prediction in GM12878. Each point represents a TF tested, x-axis and y-axis are PR AUCs
of applying TRACE using models trained from GM12878 and models trained from K562, respectively.
Points above the diagonal line indicate TFs for which inter-cell line model performed better. (C, D)
Average rank of PR AUC and ROC pAUC of existing methods across all TFs tested. The Bars with a
dashed outline represent motif-centric methods.
Figure 3. TRACE can perform well on ATAC-seq data. (A) Average rank of PR AUC across all TFs tested
using ATAC-seq data for TRACE, DeFCom, and HINT-ATAC. (B) DNase-seq and ATAC-seq based
TRACE performance comparison on PR AUC.
Figure 4. Computational footprinting methods share similar performance patterns. (A) Heatmap of PR
AUC of all TFs tested from existing methods sorted by prevalence. (B) Comparison between the best PR
AUC among all footprinting methods (y-axis) and PR AUC from using PWM score alone (x-axis) for every
TF tested. (C) Performance improvement of footprinting methods over permutation for each TF colored by
its best PR AUC from footprinting. Orange line is from a simulation test using positive instances drawn
from N(10, 8), and negative instances from N(0, 7) to demonstrate expected PR AUC trend as binding
prevalence changes.
Cold Spring Harbor Laboratory Press on June 23, 2022 - Published by genome.cshlp.orgDownloaded from
A
B
C50 bases hg1915,650,200 15,650,250 15,650,300
K562 DNaseI HS Overlap Signal from ENCODE/Duke
Transcription Factor ChIP-seq (161 factors) from ENCODE with Factorbook Motifs
120 _
0 _
CTCF
Cluster_3
MAFK
Predictions from TRACE
UP
CTCF
UP
UP
UP
UP
UP
UP
UP
DOWN
DOWN
DOWN
DOWN
DOWN
DOWN
DOWN
UP
DOWN
motif _1
motif _2
motif _3
motif _4
motif _5
motif _6
fp
Background
Background
CTCF
CTCF
CTCF
Cold Spring Harbor Laboratory Press on June 23, 2022 - Published by genome.cshlp.orgDownloaded from

A B
C D
ROC Curves of E2F1
K562 PR AUC Rank K562 ROC pAUC Rank
GM12878 PR AUC
NR2F1
ELK1 MAX
NFYA
GABPA
SPI1
SRF
ZNF143
USF1
YY1
ETS1
ZEB1
STAT1
REST
CTCF
EBF1
NFIC
BHLHE40
CEBPB
E2F4
ELF1
JUNB
JUND
MAFK
MEF2C
NFYB
NR2C2
NRF1
RFX5
RXRA
TCF12
USF2
ZBTB33
ESRRA
CREM
NFATC1
NFATC3
ETV6
MEF2B
TBX21
ZBED1
CUX1
PKNOX1
ATF7
E2F8
FOXK2
MXI1
PBX3
RELB
ZNF24
ZNF384
IRF3
0.00
0.25
0.50
0.75
1.00
0.00 0.25 0.50 0.75 1.00intra−cell line
inte
r−ce
ll lin
e
0.00
0.25
0.50
0.75
1.00
0.00 0.25 0.50 0.75 1.00FPR
Sens
itivi
ty
ROC AUCTRACE: 0.83DNase2TF: 0.67Wellington: 0.51PIQ: 0.71Centipede: 0.4HINT: 0.68BinDNase: 0.77DeFCoM: 0.77FLR: 0.46
0
3
6
9
TRACE
DeFCoM
BinDNase FLR
Wellington
DNase2TF
CentipedePIQ
HINTBoyl
ePWM
permutation
Aver
age
Rank
TRACE
DeFCoM
BinDNase FLRHINT
Wellington
DNase2TF
CentipedePIQ
PWMBoyl
e
permutation
Aver
age
Rank
0
3
6
9
Cold Spring Harbor Laboratory Press on June 23, 2022 - Published by genome.cshlp.orgDownloaded from

ATAC-seq PR AUC rank ATAC-seq vs. DNase-seqA B
0
1
2
TRACE
DeFCoM
HINT−
ATAC
Aver
age
Ran
k
PAX5
NR2F1
ELK1
MAX
NFYA
GABPASPI1
SRF
ZNF143
USF1
YY1
ETS1
ZEB1
TBPSTAT1
REST
CTCF
EBF1
NFIC
BHLHE40
CEBPB
E2F4
ELF1
JUNB
JUND
MAFK
MEF2C
NFYB
NR2C2
NRF1
RFX5RXRA
TCF12
USF2
ZBTB33
ESRRA
CREM
NFATC1
NFATC3
ETV6
MEF2B
TBX21
ZBED1
CUX1PKNOX1
ATF7
E2F8
FOXK2
MXI1 PBX3
RELB
ZNF24
ZNF384
IRF30.00
0.25
0.50
0.75
1.00
0.00 0.25 0.50 0.75 1.00
DNase−seqAT
AC−seq
Cold Spring Harbor Laboratory Press on June 23, 2022 - Published by genome.cshlp.orgDownloaded from

A B
C
de novo
PWM
Prevale
nce
0
0.2
0.4
0.6
0.8
motif-centricNR3C1ZNF282SREBF1IRF9NEUROD1MYBL2TCF7L2RFX5NR4A1THAP1HINFPKLF16ZBED1E2F8E2F7FOXJ2TBPTCF12ZBTB33TEAD2CREB3RUNX1HES1FOXA1ZNF263NR2F2SOX6CUX1STAT1NFICETV6HMBOX1MXI1ZNF384LEF1IRF2E2F1KLF13TEAD4PKNOX1MEF2AMEIS2ZNF143ETS1CREB3L1JUNBNFYAELK1GATA1NR2C2MEF2DE2F6FOXK2JUNRESTPBX2NR2F1GMEB1ZFXZBTB7AGATA2ESRRAATF3NFE2NR2F6TFDP1CTCFLSP1MNTMYCMAFGETV1NFYBIRF1USF2ATF1ELF4MAFKMAFFYY1ZNF740CREMGABPABHLHE40MAXELF1USF1ZNF24CEBPGRFX1MITFJUNDATF7CEBPBNRF1EGR1ATF4CTCF
Prevalence
ΔPR
AU
C
0.75
0.50
0.25
PR AUC fromfootprinting
TRACEHINT
DNase2
TF
Welling
ton PIQ
DeFCoM
BinDNas
eFLR
Centip
ede
PR AUC Using PWM Score
Best
PR
AU
C b
y Fo
otpr
intin
g
Best methodTRACEBoyleWellingtonHINTBinDNaseDeFCoM
RUNX1
NR2F1E2F1
ELK1GATA1 GATA2
IRF1
IRF2
MEF2A
MAX
NFYA
GABPA
SP1
ZNF143
USF1YY1
ETS1TBP
NR3C1
HINFP
STAT1
RESTCTCF
ZFX
MYC
FOXA1
NFIC
EGR1
BHLHE40
CEBPB
E2F6
ELF1
FOSL1
JUN
JUNB
JUND
MAFFMAFK
NFYB
NR2C2
NRF1
RFX1
RFX5
SOX6
TCF12
TCF7L2
USF2
ZBTB33
ZNF263
ESRRA
SREBF1
THAP1
ATF1
ATF3
CREM
FOXJ2
GMEB1
MITF
CREB3
ELF4
ETV6
IRF9
KLF13
MAFG
NR2F6
KLF16
ZBED1
ZBTB7A
ZNF740
CUX1
E2F7
ETV1
LEF1
MEF2D MEIS2
MYBL2
PKNOX1TEAD4
MNTATF4
ATF7
CEBPG
CREB3L1
NFE2
E2F8
HMBOX1HES1
CTCFL
FOXK2
MXI1
NEUROD1
NR2F2
NR4A1
PBX2
TEAD2
TFDP1
ZNF24
ZNF384
ZNF282
0.00
0.25
0.50
0.75
1.00
0.00 0.25 0.50 0.75 1.00
RUNX1
NR2F1
E2F1
ELK1GATA1
GATA2
IRF1IRF2
MEF2A
MAX
NFYAGABPA
SP1
ZNF143
USF1
YY1
ETS1
TBP
NR3C1
HINFP
STAT1
REST
CTCF
ZFXMYC
FOXA1
NFIC
EGR1
BHLHE40
CEBPB
E2F6
ELF1
JUN
JUNB
JUNDMAFF
MAFK
NFYB
NR2C2
NRF1RFX1
RFX5
SOX6
TCF12
TCF7L2
USF2
ZBTB33
ZNF263
ESRRA
SREBF1
THAP1
ATF1
ATF3
CREM
FOXJ2 GMEB1
MITF
CREB3
ELF4
ETV6IRF9
KLF13
MAFG
NR2F6
KLF16
ZBED1
ZBTB7A
ZNF740
CUX1
E2F7
ETV1
LEF1 MEF2DMEIS2
MYBL2
PKNOX1
TEAD4
MNT
ATF4
ATF7CEBPG
CREB3L1
NFE2
E2F8
HMBOX1
HES1
CTCFL
FOXK2MXI1
NEUROD1
NR2F2
NR4A1
PBX2
TEAD2 TFDP1
ZNF24
ZNF384
ZNF282
0.0
0.2
0.4
0.6
0.00 0.25 0.50 0.75 1.00
Cold Spring Harbor Laboratory Press on June 23, 2022 - Published by genome.cshlp.orgDownloaded from

10.1101/gr.258228.119Access the most recent version at doi: published online July 6, 2020Genome Res.
Ningxin Ouyang and Alan P Boyle accessibility data and DNA sequenceTRACE: transcription factor footprinting using chromatin
Material
Supplemental
http://genome.cshlp.org/content/suppl/2020/07/17/gr.258228.119.DC1
P<P
Published online July 6, 2020 in advance of the print journal.
Manuscript
Accepted
manuscript is likely to differ from the final, published version. Peer-reviewed and accepted for publication but not copyedited or typeset; accepted
License
Commons Creative
.http://creativecommons.org/licenses/by-nc/4.0/described at a Creative Commons License (Attribution-NonCommercial 4.0 International), as
). After six months, it is available underhttp://genome.cshlp.org/site/misc/terms.xhtmlfirst six months after the full-issue publication date (see This article is distributed exclusively by Cold Spring Harbor Laboratory Press for the
ServiceEmail Alerting
click here.top right corner of the article or
Receive free email alerts when new articles cite this article - sign up in the box at the
https://genome.cshlp.org/subscriptionsgo to: Genome Research To subscribe to
Published by Cold Spring Harbor Laboratory Press
Cold Spring Harbor Laboratory Press on June 23, 2022 - Published by genome.cshlp.orgDownloaded from