
Modelling of a calcium-looping fluidized bed reactor system ...
Chemical Engineering Science 64 (2009) 1249 -- 1259
Contents lists available at ScienceDirect
Chemical Engineering Science
journal homepage: www.e lsev ier .com/ locate /ces
Experimental study on drop formation in liquid–liquid fluidized bed
Zhengbiao Penga,∗, Zhulin Yuana, XuanWua, Jie Caia, Fengxian Fana, Li Tiea, Geng Fana, Chen Pana,Kunfeng Liangb
aDepartment of Energy and Environment, Thermal Engineering Research Institute, Southeast University, Nanjing 210096, PR ChinabThermal Energy and Power Institute, College of Vehicle and Motive Power Engineering, Henan University of Science and Technology, Luoyang 471003, PR China
A R T I C L E I N F O A B S T R A C T
Article history:Received 2 April 2008Received in revised form 4 November 2008Accepted 8 November 2008Available online 24 November 2008
Keywords:Multiphase flowDrop formation regimeJet length pulsationInstability dynamicsDrop size distribution
Drop formation in liquid–liquid fluidized bed was investigated experimentally. The normal water wasinjected via a fine-capillary spray nozzle into the co-flowing No. 25 transformer oil with jet directedupwards in a vertical fluidized bed. Experiments under a wide variety of conditions were conducted toinvestigate the instability dynamics of the jet, the size and size distribution of the drops. Details of dropformation, drop flow patterns and jet evolution were monitored in real-time by an ultra-high-speed digitalCCD (charge couple device) camera. The Rosin–Rammler model was applied to characterize experimentaldrop size distributions. Final results demonstrate that drop formation in liquid–liquid system takes placeon three absolutely different developing regimes: bubbling, laminar jetting and turbulent jetting, de-pending on the relative Reynolds number between the two phases. For different flow domains, dynamicsof drop formation change significantly, involving mechanism of jet breakup, jet length pulsation, meansize and uniformity of the drops. The jet length fluctuates with time in variable and random amplitudesfor a specified set of operated parameters. Good agreement is shown between the drop size and theRosin–Rammler distribution function with the minimum correlation coefficient 0.9199. The mean dropdiameter decreases all along with increasing jet flow rate. Especially after the relative Reynolds numberexceeds a certain value about 3.5× 10⁴, the jet disrupts intensely into multiple small drops with a diam-eter mainly ranging from 1.0 to 1.5mm and a more and more uniform size distribution. The turbulentjetting regime of drop formation is the most preferable to the dynamic ice slurry making system.
© 2008 Elsevier Ltd. All rights reserved.
1. Introduction
The ice slurry technology (Egolf, 2004; Egolf and Kauffeld, 2005;Meewisse, 2004; Pronk, 2006) has been studied for approximatelytwo decades and has already been accepted as a promising workingfluid due to its technical merits, such as excellent cold heat capaci-ties, good flow ability, quick response to the thermal load demand,safe, environment-friendly and highly efficient. So far, ice slurry hasbeen widely applied in several fields, just as by Wang and Kumusoto(2001) exemplified in the application to multifunctional buildings.
The liquid–liquid circulating fluidized bed (LLCFB) for ice slurryproduction is a newly proposed ice making system using the tech-nology of two-fluid drop formation in conjunction with the highefficient fluidization theory (Haid et al., 1994; Jamialahmadi et al.,1997), as shown in Fig. 1. Multiple small droplets formed by a spe-cially designed atomizer flow upwards together with the ambientchilled liquid (No. 25 transformer oil) in the vertical fluidized bed
∗ Corresponding author. Tel.: +862585886060; fax: +862557714489.E-mail addresses: [email protected], [email protected] (Z. Peng).
0009-2509/$ - see front matter © 2008 Elsevier Ltd. All rights reserved.doi:10.1016/j.ces.2008.11.012
and freeze out quickly by direct contact heat transfer. These smalldrops formed in liquid–liquid jet systems result in large interfacialarea and enhance heat and mass transfer strikingly. More detailsabout this dynamic ice slurry making system can review the previouswork given by our group (Liang et al., 2006; Peng et al., 2007).
It is evident that the stage of drop formation plays a key role in thewhole ice slurry making system. The mean size and size distributionof the drops have a direct effect on the quality of the ice crystals,which shows a great sensitivity to the rheological properties of iceslurry (Kitanovski et al., 2005). On the other hand, the contact areabetween two phases, a prime factor to enhance the heat transferefficiency, relates intimately to the drop size. Thereby, the knowledgeof drop formation in liquid/liquid systems is of great significanceand in pressing need for the development of this new ice slurrygenerator.
Free surface flows involving drop formation either with or with-out liquid jets in another immiscible viscous liquid have been widelystudied for more than a century. Much of the earlier literature hasbeen reviewed by Shi et al. (1994), Richards et al. (1993,1994,1995),and more recently by Carsten et al. (2004), Milosevic and Longmire(2002) and Doshi (2003).

1250 Z. Peng et al. / Chemical Engineering Science 64 (2009) 1249 -- 1259
Ice/oilseperator
Water tank
Spray nozzle
Fluidized bed
Temperature sensor
Pressure sensorFlow meter
Control valvePump
Oil
Water
Refrigeration cycle
Application
Oil flow
Oil tank/evaporator
Fig. 1. Schematic diagram of LLCFB for ice slurry production.
Meister and Scheele (Meister, 1966; Meister and Scheele,1967,1969a,b; Scheele and Meister, 1968) worked initially to de-velop an understanding of the jet and drop formation in liquid/liquidsystems both experimentally and theoretically. Although most ofthem are only for the case of a quiescent continuous phase, theresult makes a great contribution. Moreover, they tried to performan overall force balance on the drop as it detached from the noz-zle, starting with the fundamental and pioneering studies (Harkinsand Brown, 1919; Christiansen and Hixson, 1957), based on whichthey also developed an expression for the drop size and presenteda correlation for prediction of the transition point from drippingto jetting. Chen et al. (2001) carried out experiments by injectingaqueous solutions of NaCl and AlCl3 into a pool of n-dodecane, inorder to achieve a correct estimation of drop size in liquid–liquiddrop formation from flat tip nozzles. They have found that the meandeviation of the correlation of Scheele and Meister (1968) can bereduced to a few percents if different characteristic diameters areused in the computation. Moreover, Carsten et al. (2004) demar-cated the dripping regime of drop formation from the jetting oneby studying the influence of the material and process parameterson the transition point. Additionally, they pointed out that smalldroplets were obtained at high velocities of the continuous phaseand at low interfacial tensions.
In order to examine the effect of the external flow, Kitamura et al.(1982) experimentally varied the motion of the continuous phase tobe either faster, the same as, or slower than the jet down to the caseof a stagnant continuous phase. They found that the jet shortened asthe absolute value of the continuous phase velocity relative to the jetincreased from zero. For the same objectives, Anna et al. (2003) useda flow-focusing geometry which was introduced by Ganan-Calvo andGordillo (2001) to study drop breakup where the disperse phase wasinjected into a co-flowing continuous phase and both liquids wereforced to flow through an orifice. It was shown that the size of thegenerated droplets is much smaller than the orifice diameter and thesize distribution is a function of the flow rates or flow rate ratios ofboth phases.
With respect to numerical simulation approaches, Richards et al.(1995) compared several methods (Georgiou et al., 1988; Schulkes,1994a,b; Shan and Chen, 1993) and finally developed a dynamicsimulation method based on the VOF/CSF numerical technique toinvestigate the 2-D full transient of liquid drop and jet formation un-der the conditions corresponding to liquid flow rates near and abovethe formation of a jet with the Reynolds number exceeding 400.
Results of their numerical simulations showed significantly moreaccuracy than previously simplified analyses in predicting the jetdynamics, including the jet evolution, velocity distribution, and vol-ume of drops. Wilkes et al. (1999) were the first to solve the full,axisymmetric Navier–Stroke equation for the formation of drop ofNewtonian liquid at finite Reynolds numbers. Although recognizingthat VOF is a powerful technique for simulating complex free sur-face flows with liquid breakup and coalescence, they preferred touse the finite element method (FEM) because of its long and dis-tinguished track record in simulating complex, steady free surfaceflows. Analogous to investigations on dripping into air (Zhang andBasaran, 1995), Zhang and Stone (1997) used the boundary integralmethod for Strokes flow in numeral simulation and found that theviscosity ratio has virtually no effect on the primary drop volumebut influences significantly the necking and breakup behavior ofthe separating drop. However, because of the considerable compu-tation times in those days, the previous numerical investigationswere either performed in one-dimension (Eggers and Dupont, 1994;Ambravaneswaran et al., 2002) or in two-dimension (Schulkes,1994a,b; Zhang and Stone, 1997; Zhang, 1999a,b; Wilkes et al.,1999; Richards et al., 1993,1994,1995; Doshi et al., 2003).
Although the previously cited studies of liquid–liquid drop for-mation have captured some of the gross features of the phenomenon,particular knowledge for the new application to generate ice slurrywas wondrously inadequate. The major goal of the present workis to obtain quantitative information on the dynamics of drop for-mation based on the platform of LLCFB, focusing mainly on dropflow patterns, jet length pulsation, mean size and size distributionof the drops. Further, three absolutely different mechanisms of dropformation were addressed and investigated. As a consequence, thewell-defined conditions of drop formation for the dynamic ice slurrygenerating system were discussed.
2. Experimental set-up and methods
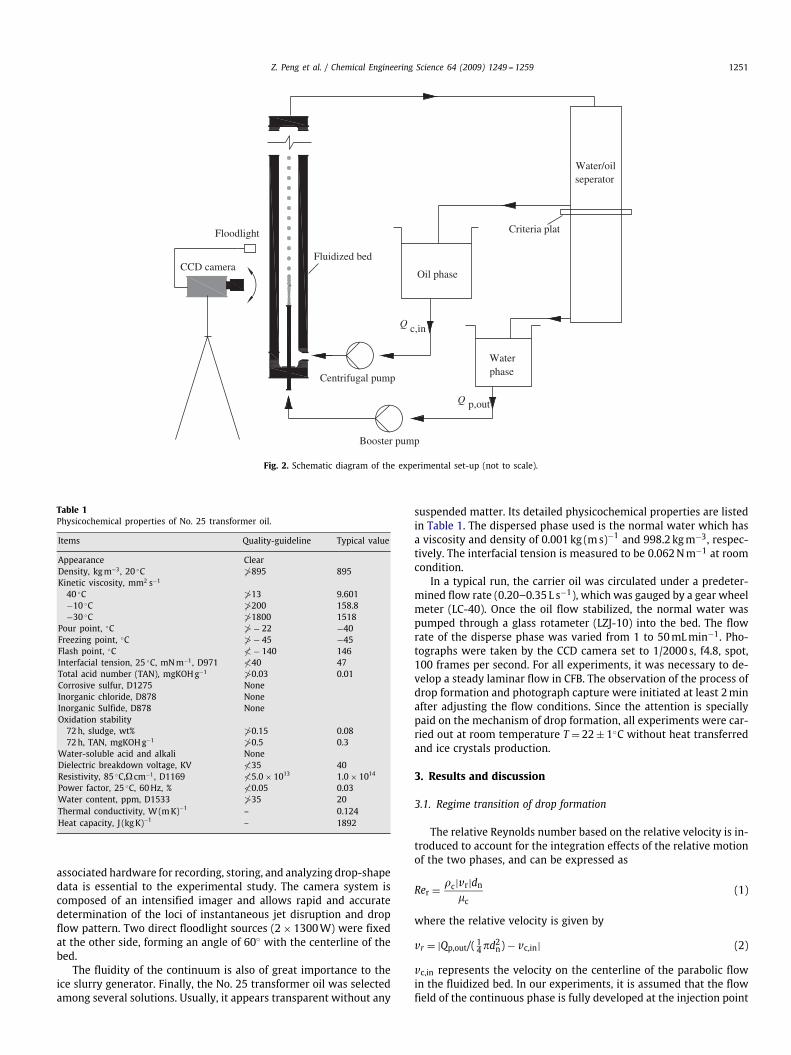
Fig. 2 shows the schematic diagram of experimental set-up, amodified and simplified version of Fig. 1. It consists essentially of afine-capillary spray nozzle through which the liquid used to formdrops is delivered at a constant volumetric flow rate by meansof a booster bump (12WZ-8, the maximum volumetric flowrate:20 Lmin−1). The inner diameter (ID) of the spray nozzle useduniformly in experiments is 0.12mm and the outer diameter is0.3mm. It is fixed at the tip of a copper jet-pipe of nominal ID5mm and height 350mm, which is located vertically at the bottomof the fluidized bed with spray directed upwards and on the cen-terline where the continuum velocity is at a maximum. A steady,non-pulsating flow of the continuous phase was generated usinga centrifugal pump (YG50-100), which covers a flow rate range0.01 L s−1�Qc,in�6.19 L s−1, and finally entered the vertical flu-idized bed having a sufficiently large inner radius as compared withthe nozzle radius with their ratio Rf /R = 200 so that the ambientwall effects can be neglected (Zhang, 1999b). The continuum entersthe fluidized bed horizontally, about 300mm below the spray noz-zle head. The arrangement of the location of the spray nozzle canfirstly provide the steady, fully developed, laminar hydrodynamicflow of the continuous phase around the injection point. When thetwo phases flow co-currently, the radial motion of the continuum israther weak, so is the collision between the dispersed drops. Drop-coalescing is thus alleviated favorably to focus the investigationson the mechanism of drop formation. Secondly, the residence timeof the drops in the system circuit is prolonged to obtain fine icecrystals frozen thoroughly at the outlet.
An ultra-high-speed digital CCD (charge couple device) cameraby NIKON (Japan) was employed to monitor in real-time the processof drop formation and drop flow patterns in the fluidized bed. The
Z. Peng et al. / Chemical Engineering Science 64 (2009) 1249 -- 1259 1251
Oil phase
Waterphase
Booster pump
Centrifugal pump
CCD camera
Floodlight
Water/oilseperator
Criteria plat
Fluidized bed
Q c,in
Q p,out
Fig. 2. Schematic diagram of the experimental set-up (not to scale).
Table 1Physicochemical properties of No. 25 transformer oil.
Items Quality-guideline Typical value
Appearance ClearDensity, kgm−3, 20 ◦C �895 895Kinetic viscosity, mm2 s−1
40 ◦C �13 9.601−10 ◦C �200 158.8−30 ◦C �1800 1518
Pour point, ◦C � − 22 −40Freezing point, ◦C � − 45 −45Flash point, ◦C � − 140 146Interfacial tension, 25 ◦C, mNm−1, D971 �40 47Total acid number (TAN), mgKOHg−1 �0.03 0.01Corrosive sulfur, D1275 NoneInorganic chloride, D878 NoneInorganic Sulfide, D878 NoneOxidation stability
72h, sludge, wt% �0.15 0.0872h, TAN, mgKOHg−1 �0.5 0.3
Water-soluble acid and alkali NoneDielectric breakdown voltage, KV �35 40Resistivity, 85 ◦C,� cm−1, D1169 �5.0 × 10¹³ 1.0 × 10¹⁴
Power factor, 25 ◦C, 60Hz, % �0.05 0.03Water content, ppm, D1533 �35 20Thermal conductivity, W (mK)−1 – 0.124Heat capacity, J (kgK)−1 – 1892
associated hardware for recording, storing, and analyzing drop-shapedata is essential to the experimental study. The camera system iscomposed of an intensified imager and allows rapid and accuratedetermination of the loci of instantaneous jet disruption and dropflow pattern. Two direct floodlight sources (2 × 1300W) were fixedat the other side, forming an angle of 60◦ with the centerline of thebed.
The fluidity of the continuum is also of great importance to theice slurry generator. Finally, the No. 25 transformer oil was selectedamong several solutions. Usually, it appears transparent without any
suspended matter. Its detailed physicochemical properties are listedin Table 1. The dispersed phase used is the normal water which hasa viscosity and density of 0.001kg (ms)−1 and 998.2 kgm−3, respec-tively. The interfacial tension is measured to be 0.062Nm−1 at roomcondition.
In a typical run, the carrier oil was circulated under a predeter-mined flow rate (0.20–0.35 L s−1), which was gauged by a gear wheelmeter (LC-40). Once the oil flow stabilized, the normal water waspumped through a glass rotameter (LZJ-10) into the bed. The flowrate of the disperse phase was varied from 1 to 50mLmin−1. Pho-tographs were taken by the CCD camera set to 1/2000 s, f4.8, spot,100 frames per second. For all experiments, it was necessary to de-velop a steady laminar flow in CFB. The observation of the process ofdrop formation and photograph capture were initiated at least 2minafter adjusting the flow conditions. Since the attention is speciallypaid on the mechanism of drop formation, all experiments were car-ried out at room temperature T = 22± 1◦C without heat transferredand ice crystals production.
3. Results and discussion
3.1. Regime transition of drop formation
The relative Reynolds number based on the relative velocity is in-troduced to account for the integration effects of the relative motionof the two phases, and can be expressed as
Rer = �c|vr|dn�c
(1)
where the relative velocity is given by
vr = |Qp,out/( 14�d2n) − vc,in| (2)
vc,in represents the velocity on the centerline of the parabolic flowin the fluidized bed. In our experiments, it is assumed that the flowfield of the continuous phase is fully developed at the injection point

1252 Z. Peng et al. / Chemical Engineering Science 64 (2009) 1249 -- 1259
10mm
Fig. 3. Developing regimes of drop formation with increasing Rer (×104,vc,in = 0.27ms−1, dn = 0.12mm, Po = 2MPa) (a) 0.11; (b) 0.29; (c) 0.38; (d) 0.8; (e) 1.3; (f) 1.7; (g)2.1; (h) 2.5; (i) 3.0; (j) 3.5; (k) 4.4.
of the disperse phase. Additionally, the sufficiently large ratio of thebed width and the nozzle outer diameter allows the negligible effectsof the effluent boundary. Therefore, vc,in is given as
vc,in = 1.5 · vc,in = 1.5 · Qc,in14�D2
f
(3)
where Qc,in is the volumetric flow rate of the continuous phase; Dfis the ID of the fluidized bed, 40mm.
In order to see the evolution of regimes of drop formationwhen varying the operated parameters, experiments were carriedout by increasing stepwise the relative Reynolds number betweenphases, either increasing the continuum flow rate while keepingother parameters fixed or increasing the jet flow rate only. Processof drop formation and corresponding flow patterns in the regionabout 50mm above the nozzle head were captured continuouslyby the CCD camera with interval of 0.01 s. Fig. 3 shows the de-tail of experimental results which are selected and representative,composed of four successive images at different relative Reynoldsnumbers between phases. It can be seen that the mechanism ofdrop formation, jet length and drop size are evolving in time dy-namically even at the same condition. Moreover, it is clear inFig. 3 that drop formation takes place on three absolutely differentdeveloping regimes depending on the relative Reynolds number,
with the dynamics changing significantly. For Rer�0.3× 10⁴, singledrop forms, grows, and detaches from the nozzle at regular intervals,called “bubbling” regime in this paper. When Rer exceeds a certainvalue (�0.4× 10⁴), a stable laminar jet forms at the nozzle. The jetrises to a certain height and then breaks up into drops, which moveup nearly in a line. This pattern is named “laminar jetting”. At evenhigher (�3.5 × 10⁴), the jet becomes fully turbulent and eventu-ally disrupts intensely into a large number of smaller drops, risingupwards dispersedly. This regime is named “turbulent jetting”. For1.7 × 104�Rer�3.0 × 10⁴, the regime is located in the transitiondomain. Similar results have been revealed and already publishedby several researchers (Meister, 1966; Clift et al., 1978; Richards etal., 1993,1994,1995). However, the third regime of drop formationin liquid/liquid jet systems has been investigated rarely as yet.
3.2. Data acquisition
A primary driving force behind the separation of drops is surfacetension, which by definition specifies the energy per unit area. Sur-face tension thus favors configurations with a minimum surface area,i.e. spherical drops. Just for this reason, drops formed in this two-fluid flow system for ice generation are assumed to be “equivalentsphere”.

Z. Peng et al. / Chemical Engineering Science 64 (2009) 1249 -- 1259 1253
Fig. 4. Jet length pulsation under various Rer (×104, vc,in = 0.27ms−1, dn = 0.12mm, Po = 2MPa). (a) 0.8; (b) 1.3; (c) 1.7; (d) 2.1; (e) 2.5; (f) 3.0; (g) 3.5; (h) 4.4.
1254 Z. Peng et al. / Chemical Engineering Science 64 (2009) 1249 -- 1259
Relative information about jet length and drop size is acquiredby image processing numerically. When the image processed on thecomputer, the pixels occupied by a drop assumed initially to be el-lipsoidal, in the horizontal direction �Xi and in the vertical direction�Yi as well as the jet length �L were obtained. Based on �X the pix-els of internal diameter Df of the fluidized bed, the actual values ofdrop diameter dp,i and jet length Lj can be obtained by
dp,i =1�
√�Xi�Yi�X
Df (4)
Lj =1�
�L�X
Df (5)
where � is the amplification ratio of the images, and �=1.35 in thiswork.
3.3. Jet length
3.3.1. Jet length pulsationThe jet length, Lj, defined as the vertical distance from the upper
tip of the drop going to depart from the injection to the flat of spraynozzle (Richards et al., 1995), was obtained for each experimentalcase in which Rer exceeds the critical value to form a jet. Fig. 4illustrates the evolution in time of jet length under various relativeReynolds numbers. It is noting that for all experimental cases shownin the figure, the jet length fluctuates with time in variable andrandom amplitudes. At long times it is periodic, but complex. Thegeneral pattern is a rise to a certain length, analogical to the peak ofa “saw-tooth”, successive detachment of two or three drops, with asubsequent repeated buildup in length for the next cycle. The vari-ation in both amplitude and period generally is irregular with thefluctuations becoming more and more random. The similar result ofthe dynamic evolution of jet length was also reported by Richardset al. (1994) via a numerical simulation approach by injectingn-heptane into water. After the jet forms at the nozzle, the mecha-nism dominating drop formation is the nonlinear instability dynam-ics (Christiansen and Hixson, 1957), which was affected primarily bythe initial disturbance amplitude and asymmetric disturbance fromfluctuations in the axial or radius velocity originating at the nozzle.In the work given by Cheong and Howes (2005), it was presentedthat the parameters of the disturbance controlling the instabilityare its frequency and initial disturbance amplitude, and describedin application as
vv0
= 1 + �v sin(K t
v0r0
)(6)
where v is the is the nozzle velocity K is the dimensionless fre-quency, t is the flow time, r0 is the nozzle radius and v0 is the ini-tial undisturbed axial velocity, �v is the initial amplitude of velocityfluctuations at the nozzle. The description of the applied disturbancein forms similar to Eq. (6) is commonly used in numerical mod-els of capillary jet instability. Since the applied perturbation on itsown is a sinusoidal function, the occurring of jet disruption and itslength in reality are pulsing and of largely uncertain. At higher Rer,jet breakup is dominated mainly by the complicated hydrodynam-ics of the turbulent jet flow, in which the radial and axial momen-tum is exchanged acutely and the radial velocity rises sharply (Liuand Reitz, 1993). Moreover, interaction between phases is also in-tensified. The jet becomes very unsteady and the mechanism in jetdisruption and subsequent drop formation turns to be complex. Jetdisintegrates dynamically and randomly with a variable length.
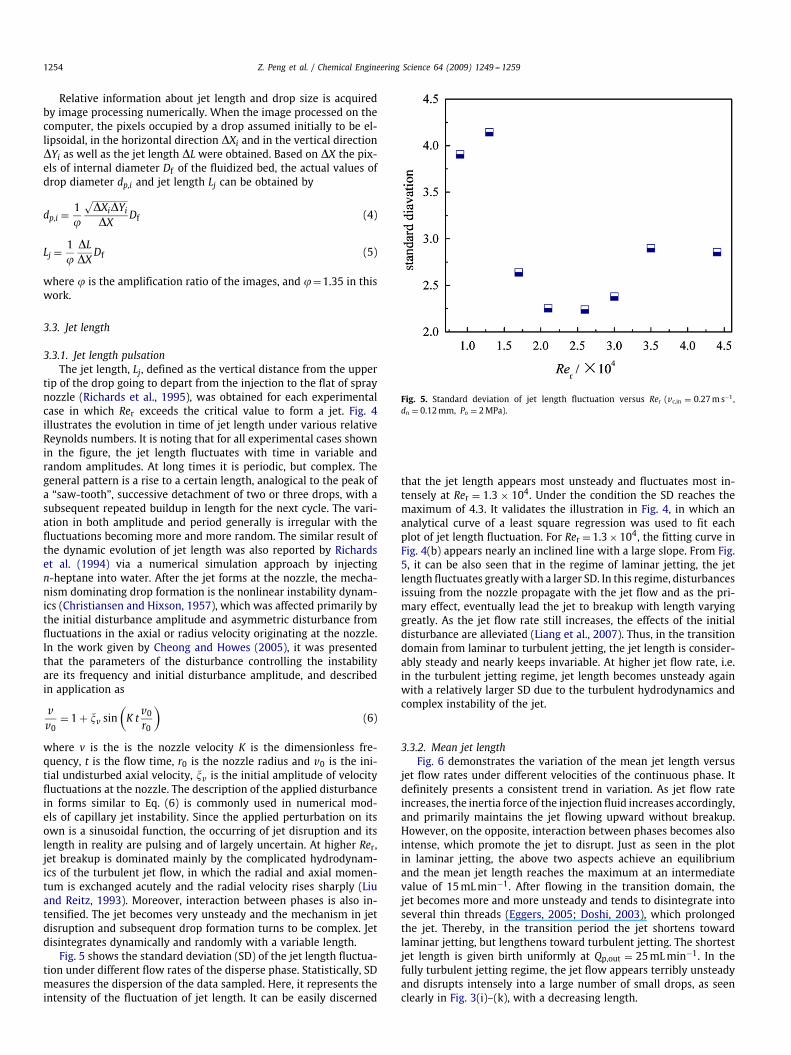
Fig. 5 shows the standard deviation (SD) of the jet length fluctua-tion under different flow rates of the disperse phase. Statistically, SDmeasures the dispersion of the data sampled. Here, it represents theintensity of the fluctuation of jet length. It can be easily discerned
Fig. 5. Standard deviation of jet length fluctuation versus Rer (vc,in = 0.27ms−1,dn = 0.12mm, Po = 2MPa).
that the jet length appears most unsteady and fluctuates most in-tensely at Rer = 1.3 × 10⁴. Under the condition the SD reaches themaximum of 4.3. It validates the illustration in Fig. 4, in which ananalytical curve of a least square regression was used to fit eachplot of jet length fluctuation. For Rer = 1.3× 10⁴, the fitting curve inFig. 4(b) appears nearly an inclined line with a large slope. From Fig.5, it can be also seen that in the regime of laminar jetting, the jetlength fluctuates greatlywith a larger SD. In this regime, disturbancesissuing from the nozzle propagate with the jet flow and as the pri-mary effect, eventually lead the jet to breakup with length varyinggreatly. As the jet flow rate still increases, the effects of the initialdisturbance are alleviated (Liang et al., 2007). Thus, in the transitiondomain from laminar to turbulent jetting, the jet length is consider-ably steady and nearly keeps invariable. At higher jet flow rate, i.e.in the turbulent jetting regime, jet length becomes unsteady againwith a relatively larger SD due to the turbulent hydrodynamics andcomplex instability of the jet.
3.3.2. Mean jet lengthFig. 6 demonstrates the variation of the mean jet length versus
jet flow rates under different velocities of the continuous phase. Itdefinitely presents a consistent trend in variation. As jet flow rateincreases, the inertia force of the injection fluid increases accordingly,and primarily maintains the jet flowing upward without breakup.However, on the opposite, interaction between phases becomes alsointense, which promote the jet to disrupt. Just as seen in the plotin laminar jetting, the above two aspects achieve an equilibriumand the mean jet length reaches the maximum at an intermediatevalue of 15mLmin−1. After flowing in the transition domain, thejet becomes more and more unsteady and tends to disintegrate intoseveral thin threads (Eggers, 2005; Doshi, 2003), which prolongedthe jet. Thereby, in the transition period the jet shortens towardlaminar jetting, but lengthens toward turbulent jetting. The shortestjet length is given birth uniformly at Qp,out = 25mLmin−1. In thefully turbulent jetting regime, the jet flow appears terribly unsteadyand disrupts intensely into a large number of small drops, as seenclearly in Fig. 3(i)–(k), with a decreasing length.

Z. Peng et al. / Chemical Engineering Science 64 (2009) 1249 -- 1259 1255
Fig. 6. Mean jet length under different jet flow rates and velocities of the continuousphase (dn = 0.12mm, Po = 2MPa).
3.4. Drop size distribution (DSD)
Just as in other applications, for example, the classical techniqueof ink-jet printing (Le, 1998), production of highly monodisperseemulsions (Basaran, 2002; Umbanhowar et al., 2000), it is very im-portant to accurately control the size and uniformity of the dropsin the dynamic ice slurry making systems. Smaller size and moreuniform size distribution of the drops are preferred.
3.4.1. Rosin–Rammler modelWhen particle size data can be represented closely by a math-
ematical expression, the maximum of useful information can berevealed. Also, it allows ready graphical representation and of-fers opportunities for interpolation, extrapolation, and comparisonamong particle/particulate systems. Various two-parameter mathe-matical models and expressions have been developed, ranging fromthe well-established normal and log-normal distributions to theRosin–Rammler and the Gates–Gaudin–Schumann models (Hussinand Jan, 2005). Numerous 3 and 4 parameter models have also beenproposed for greater accuracy in describing particle size distribu-tions. But, these widespread applications have been limited due totheir greater mathematical complexity. For particles generated bygrinding, milling, crushing operations and spray, the Rosin–Rammlermodel described by Djamarani and Clark (1997) proves particu-larly suited and efficient. The Rosin–Rammler distribution function(RRDF) is expressed as
F(d) = 1 − exp[−(d/dm)n] (7)
F(d) is the retained weight fraction (%), d is the particle size (mm),dm is the median particle size (mm), and n is a measure of the spreadof particle sizes. The applicability of RRDF can be determined by acurve fitting the actual sieve size data of particles of a sample. A leastsquare regression analysis can be carried out to fit the data pointsand the correlation coefficient can be used to estimate the goodnessof the fit.
From Eq. (7), it is clear that when n and dm are specified, the solesize distribution of the drops is given birth. Eq. (7) can be varied asa logarithmic form as follows:
ln{− ln[1 − F(d)]} = n lnd − n lndm (8)
It can be seen from Eq. (8) that the regression will be a line in thelnd–ln {− ln[1 − F(d)]} coordinates provided that drop size satisfiesRRDF. The exponent n and the median diameter dm can be specifiedas the slope and the intercept of the inclined line, respectively.
The density function of DSD can be written as the differentialcoefficients of Eq. (7):
f (d) = ndnm
× dn−1 exp[−(d/dm
)n] (9)
From Eq. (9), it is easy to obtain the cumulative percent of massof the drops with a diameter between two arbitrary representativevalues d1, d2:
F(d2) − F(d1) =∫ d2
d1f (d)d(d) (10)
3.4.2. Size distribution of the dropsGenerally, 100 drops sampled for each condition were measured,
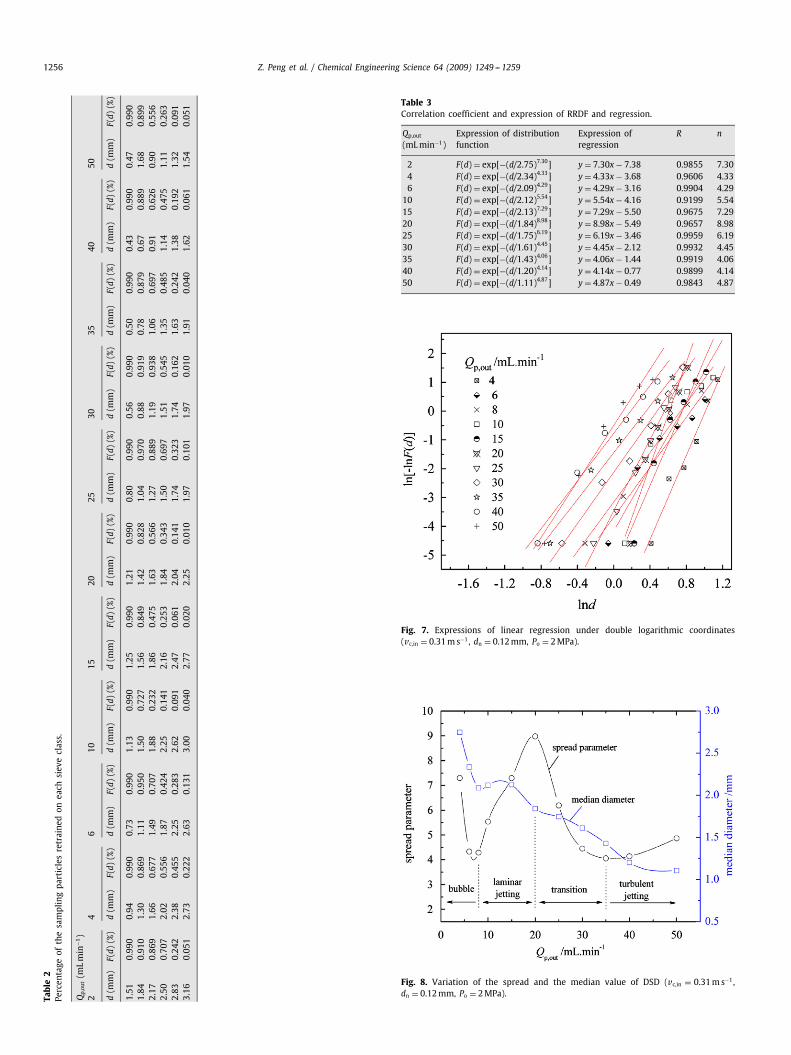
and the percentage of particles F(d) retrained on each sieve class dis shown in Table 2. Table 3 shows the corresponding expressions ofRRDF and linear regression, the correlation coefficients R of DSD, andthe exponent n of RRDF for different experimental conditions. Fig. 7illustrates the graphic size distribution of the drops interpolated byRRDF under double logarithmic coordinates.
It can be seen that the drop size shows good agreement withRRDF. Most correlation coefficients stay above 0.96 except R=0.9199for Qp,out = 10mLmin−1. In can also be found out from Table 3 andFig. 7 that in the bubbling regime of drop formation, the slope for thelinear regression decreases with increasing Qp,out. Then, in the lam-inar jetting regime, the slope increases. As Qp,out keeps to increases,after entering the transition domain, the slope decreases again. Andin the regime of turbulent jetting, the slope alters to increase. Rela-tive explanation and analyses for the trend in variation of the slopeare given below.
3.4.3. Spread and median value of DSDFig. 8 shows the variation of dispersion and median value of DSD
versus Qp,out covering the entire developing regimes from bubblingto turbulent jetting. Qp,out is varied while keeping vc,in constant. It isshown that the median drop diameter decreases all along with risingQp,out. The same result has been obtained by Carsten et al. (2004),who paid special attention only on the regime of dripping, equivalentto the bubbling one in this study, and the transition point from drip-ping to jetting. When Qp,out decreases, the jet length decreases in thelaminar jetting regime to switch to the bubbling regime, as clearlyillustrated in Fig. 3. The drop detachment rate declines abruptly andas a consequence, the drop diameter increases. Further, the thresh-old between the bubbling and the laminar jetting is detected wherethe curve of the drop diameter in Fig. 8 shows a discontinuity atQp,out ≈ 8mL s−1. After a liquid jet exits the nozzle, the drop diam-eter decreases as Qp,out increases, especially in the turbulent jettingregime, decreasing sharply due to an enhanced generation of satel-lite drops, which can be easily observed in Fig. 3(i)–(k).
The spread of DSD is represented by the slope n of the linearregression. From Eq. (8), it can be concluded easily that bigger nimplies smaller lnd and smaller d. In other words, bigger n rep-resents a more uniform DSD. At low jet flow rate, drop formationis determined mainly by the balances mechanism of major forces(Scheele and Meister, 1968; Chen et al., 2001): inertia, buoyancy,interfacial tension and viscous. The first two terms direct upwards,assisting to drop detachment and formation; the other two termsdirect downward, suppressing the process. When the four forcesachieve the equilibrium, drop detaches and forms from the nozzleat a regular interval, which gives rise to a uniform DSD. However, asQp,out increases, the disturbance originating in the nozzle is enlarged
1256 Z. Peng et al. / Chemical Engineering Science 64 (2009) 1249 -- 1259
Table2
Percen
tage
ofthesamplingpa
rticlesretraine
don
each
siev
eclass.
Qp,ou
t(m
Lmin
−1)
24
610
1520
2530
3540
50
d(m
m)
F(d)
(%)
d(m
m)
F(d)
(%)
d(m
m)
F(d)
(%)
d(m
m)
F(d)
(%)
d(m
m)
F(d)
(%)
d(m
m)
F(d)
(%)
d(m
m)
F(d)
(%)
d(m
m)
F(d)
(%)
d(m
m)
F(d)
(%)
d(m
m)
F(d)
(%)
d(m
m)
F(d)
(%)
1.51
0.99
00.94
0.99
00.73
0.99
01.13
0.99
01.25
0.99
01.21
0.99
00.80
0.99
00.56
0.99
00.50
0.99
00.43
0.99
00.47
0.99
01.84
0.91
01.30
0.86
91.11
0.95
01.50
0.72
71.56
0.84
91.42
0.82
81.04
0.97
00.88
0.91
90.78
0.87
90.67
0.88
91.68
0.89
92.17
0.86
91.66
0.67
71.49
0.70
71.88
0.23
21.86
0.47
51.63
0.56
61.27
0.88
91.19
0.93
81.06
0.69
70.91
0.62
60.90
0.55
62.50
0.70
72.02
0.55
61.87
0.42
42.25
0.14
12.16
0.25
31.84
0.34
31.50
0.69
71.51
0.54
51.35
0.48
51.14
0.47
51.11
0.26
32.83
0.24
22.38
0.45
52.25
0.28
32.62
0.09
12.47
0.06
12.04
0.14
11.74
0.32
31.74
0.16
21.63
0.24
21.38
0.19
21.32
0.09
13.16
0.05
12.73
0.22
22.63
0.13
13.00
0.04
02.77
0.02
02.25
0.01
01.97
0.10
11.97
0.01
01.91
0.04
01.62
0.06
11.54
0.05
1 Table 3Correlation coefficient and expression of RRDF and regression.
Qp,out
(mLmin−1)Expression of distributionfunction
Expression ofregression
R n
2 F(d) = exp[−(d/2.75)7.30] y = 7.30x − 7.38 0.9855 7.304 F(d) = exp[−(d/2.34)4.33] y = 4.33x − 3.68 0.9606 4.336 F(d) = exp[−(d/2.09)4.29] y = 4.29x − 3.16 0.9904 4.29
10 F(d) = exp[−(d/2.12)5.54] y = 5.54x − 4.16 0.9199 5.5415 F(d) = exp[−(d/2.13)7.29] y = 7.29x − 5.50 0.9675 7.2920 F(d) = exp[−(d/1.84)8.98] y = 8.98x − 5.49 0.9657 8.9825 F(d) = exp[−(d/1.75)6.19] y = 6.19x − 3.46 0.9959 6.1930 F(d) = exp[−(d/1.61)4.45] y = 4.45x − 2.12 0.9932 4.4535 F(d) = exp[−(d/1.43)4.06] y = 4.06x − 1.44 0.9919 4.0640 F(d) = exp[−(d/1.20)4.14] y = 4.14x − 0.77 0.9899 4.1450 F(d) = exp[−(d/1.11)4.87] y = 4.87x − 0.49 0.9843 4.87
Fig. 7. Expressions of linear regression under double logarithmic coordinates(vc,in = 0.31ms−1, dn = 0.12mm, Po = 2MPa).
Fig. 8. Variation of the spread and the median value of DSD (vc,in = 0.31ms−1,dn = 0.12mm, Po = 2MPa).

Z. Peng et al. / Chemical Engineering Science 64 (2009) 1249 -- 1259 1257
Fig. 9. Cumulative mass percent of drops with a diameter below a specified level(vc,in = 0.31ms−1, dn = 0.12mm, Po = 2MPa).
to provoke the generation of a jet (Clanet and Lasheras, 1999). Addi-tionally, the inertia force of the injected fluid increases. Diminutivesatellite drop is generated during the formation of drops of normalsize (barely visible in Fig. 3), which was also detected by Carstenet al. (2004). Consequently, DSD becomes non-uniform and thespread parameter decreases accordingly. While Qp,out exceeds thecritical value, 8mLmin−1 in Fig. 8, a jet streams from the nozzle,then disrupting into droplets one by one, and hereafter the jetstability dynamics determine the drop size (Richards et al., 1995;Scheele and Meister, 1968). As shown in the plot, in the laminarjetting regime, the spread parameter increases as Qp,out increases.The most probable cause for the variation is the weakened distur-bances stirred by the external flow as Qp,out increases. It gives riseto a more uniform DSD. On the opposite, as Qp,out increases moredrops are generated to satisfy the mass conservation law, just asseen clearly in Fig. 3(f)–(h). However, the inertia force of these dis-persed drops is not large enough to diffuse in the ambient timelyand consequently some large drops emerge due to the phenomenonof drop-coalescing. As a result, in the transition domain, the spreaddiameter decreases with a more and more non-uniform DSD. AsQp,out keeps to increase to achieve the turbulent jetting regime, aselucidated before, the mechanism of jet disruption and subsequentdrop formation is very complicated. Enhanced interaction betweenphases, drastic momentum exchanging within the turbulent jetflow, and other stipulates inherent in the complicated multiphaseflow all favorthe intense jet disruption and tempestuous generationof a large number of small drops. Moreover, the increasing inertiaforce drive the drops to diffuse quickly, as seen in Fig. 3(i)–(k),which greatly weakens drop-coalescing. Consequently, DSD changesto be more and more uniform in the turbulent jetting regime.
3.4.4. Cumulative percentage of drop massThe heat transfer coefficient of multiphase flow in the fluidized
bed is affected intensely by the size of the disperse phase (Chenet al., 2001). In the work given by Liang et al. (2006) with respectto the new technique for ice slurry generation, the drop size shouldbe no more than 1.0mm. By use of Eqs. (9) and (10), the cumulativepercentages of drop mass can be obtained when the drop size isbelow a specified value, just as shown in Fig. 9. It can be seen thatin the bubbling regime of drop formation, mass percentage of the
drops with a diameter below 1.5mm is less than 20%, below 1.0mmis less than 10%, below 0.8mm is no more than 5%. However, in theturbulent jetting regime of drop formation, the percentage increasesdrastically. ForQp,out=50mLmin−1, the percentage reaches 99%, 77%,46% for the drop size below 1.5, 1.2 and 1.0mm, respectively. Further,it is also noting that for the drop size below 0.5mm, the percentageis only 2%. In this situation, the drop size mainly congregates in therange of 1.0–1.5mm.
3.5. Discussion
In the turbulent jetting regime of drop formation with Rer�3.5×10⁴, the jet flows in fully turbulent and eventually disrupts intenselyinto multiple small drops with a diameter mainly ranging from 1.0to 1.5mm and a more and more uniform DSD. In the work given byLiang et al. (2007) especially focused on ice slurry generation undercold conditions with heat transferred between phases, it was pre-sented that the small drops could firstly alleviate the phenomenonof drop-coalescing, and most importantly allow the higher oper-ated temperature in the fluidized bed, which arises the coefficientof performance of the refrigeration cycle greatly. Combined with theresults regarding the size and uniformity of the particles requiredin the ice slurry technology (Egolf, 2004; Egolf and Kauffeld, 2005;Kitanovski et al., 2005; Meewisse, 2004; Pronk, 2006), it thereforecan be concluded that the turbulent jetting regime of drop formationis the most preferable to its new application of ice slurry generation.
4. Conclusions
Systematic experiments have been conducted to investigate thedynamics of drops formation in the application to generate ice slurry.The following preliminary conclusions were drawn within the pa-rameter range covered in the present study:
(1) Drop formation in liquid–liquid system takes place on three ab-solutely different developing regimes: bubbling, laminar jettingand turbulent jetting, depending on the relative Reynolds num-ber between the two phases. For different flow domains, dynam-ics of drop formation change significantly, involving mechanismof jet breakup, jet length pulsation, mean size and uniformity ofthe drops.
(2) The jet length fluctuates with time in variable and random am-plitudes for a specified set of operated parameters. In the tran-sition domain, the transient jet length varies slightly. The meanjet length decreases toward laminar jetting but increases towardturbulent jetting. In laminar jetting, it reaches the maximum atan intermediate value of 15mlmin−1. It decreases as jet flow rateincreases in turbulent jetting. Both in the regimes of laminar andturbulent jetting, the jet length pulses drastically with time.
(3) The drop size shows a good agreement with the RRDF with theminimum correlation coefficient 0.9199. The median drop diam-eter decreases all along with increasing jet flow rate, especiallyin the turbulent jetting regime, decreasing sharply due to an en-hanced generation of satellite drops.
(4) At low jet flow rate, drop forms from the nozzle at a regularinterval with a uniform DSD. But the spread of drop size increaseas jet flow rate increases because of the amplification of thedisturbance originating at the nozzle. In laminar jetting, the DSDbecomes more uniform with a steady jet flow. In the transitiondomain, drop size distribution turns to be non-uniform due tothe increasing generation rate of drops, which cannot diffusetimely in the ambient and enhances drop-coalescing. In turbulentjetting, the jet disrupt intensely into a large number of smalldrops with a more and more uniform size distribution.

1258 Z. Peng et al. / Chemical Engineering Science 64 (2009) 1249 -- 1259
(5) In the turbulent jetting regime, cumulative percentage of dropmass increases drastically and reaches 99%, 77%, 46%, respec-tively, for the drops of size below 1.5, 1.2, 1.0mm when the jetflow rate is at the maximum of 50mLmin−1. In this situation,the drop size mainly congregates in the range of 1.0–1.5mm.
(6) The turbulent jetting regime of drop formation is themost prefer-able to its new application to generate ice slurry.
Notation
ccp heat capacity of the carrier fluid, J (kgK)−1
d particle size, mmdm median particle size, mmdn diameter of the spray nozzle, mmdp,i physical diameter of drop i, mmDf feasible diameter of the fluidized bed, mmF retained weight fraction, %kc thermal conductivity, W(mK)−1
Lj jet length, mmn measure of the spread of particle sizesPo pressure of the ambient liquid outside of the injection
point, MPaQc,in flow rate of the carried fluidwhen entering the fluidized
bed, L s−1
Qp,out flow rate of the disperse phase, mLmin−1
R outer radius of the spray nozzle, mmRf inner radius of the fluidized bed, mmRer relative Reynolds number between the two phasesTc,con condensation point of the carried fluid, ◦Cvc,in velocity of the carrier fluid when entering the fluidized
bed, ms−1
vr relative velocity between the two phases, ms−1
Greek letters
�L pixels occupied by the jet length�X pixels occupied by the fluidized bed diameter�Xi pixels occupied by drop i in the horizontal direction�Yi pixels occupied by drop i in the vertical direction�c dynamic viscosity of the carried fluid, kg (ms)−1
�c density of the carried fluid, kgm−3
�d density of the dispersed phase, kgm−3
�s surface tension coefficient, Nm−1
� amplification ratio through the liquid medium
Acknowledgments
This work was supported financially by the Major State Ba-sic Research Development Program of China (973 Program:2004CB217707) and Research Fund for the Doctoral Program ofHigher Education of China (20060286034).
References
Ambravaneswaran, B., Wilkes, E.D., Basaran, O.A., 2002. Drop formation from acapillary tube: comparison of one-dimensional and two-dimensional analysesand occurrence of satellite drops. Physics of Fluids 14, 2606–2621.
Anna, S., Bontoux, N., Stone, H., 2003. Formation of dispersions using “flow focusing”in microchannels. Applied Physics Letters 82, 364–366.
Basaran, O., 2002. Small-scale free surface flows with breakup: drop formation andemerging applications. A.I.Ch.E. Journal 48, 1842–1848.
Carsten, C., Peter, F., Erich, J.W., 2004. Drop formation in a co-flowing ambient fluid.Chemical Engineering Science 59, 3045–3058.
Christiansen, M., Hixson, A.N., 1957. Breakup of a liquid jet in a denser liquid.Industrial and Engineering Chemistry 49, 1017.
Chen, T.C., Maa, J.R., Yang, Y.M., Chang, C.H., 2001. Drop formation from flat tipnozzles in liquid–liquid system. International Communications in Heat and MassTransfer 28, 681–692.
Cheong, B.S., Howes, T., 2005. Effect of initial disturbance amplitude in gravityaffected jet break-up. Chemical Engineering Science 60, 3715–3719.
Clanet, C., Lasheras, J., 1999. Transition from dripping to jetting. Journal of FluidMechanics 383, 307–326.
Clift, R., Grace, J.R., Weber, M.E., 1978. Bubbles, Drops, and Particles. Academic Press,New York.
Djamarani, K.M., Clark, I.M., 1997. Characterization of particle size based on fineand coarse fractions. Powder Technology 93, 101–108.
Doshi, P., 2003. Deformation and breakup of liquid–liquid threads, jets, and drops.Ph.D. Thesis, Purdue University, USA.
Doshi, P., Suryo, R., Yildirim, O.E., 2003. Scaling in pinch-off of generalized Newtonianfluids. Journal of Non-Newtonian Fluid Mechanics 113, 1–27.
Eggers, J., 2005. Drop formation—an overview. Z. Angew. Math. Mech. 85, 400–410.Eggers, J., Dupont, T., 1994. Drop formation in a one-dimensional approximation of
the Navier–Stokes equation. Journal of Fluid Mechanics 262, 205–221.Egolf, P.W., 2004. Ice slurry: a promising technology. Technical Notes of Refrigerating
Technologies, International Institute of Refrigeration, Paris, France.Egolf, P.W., Kauffeld, M., 2005. From physical properties of ice slurries to industrial
ice slurry applications. International Journal of Refrigeration 28, 4–12.Ganan-Calvo, A., Gordillo, J., 2001. Perfectly monodisperse microbubbling by capillary
flow focusing. Physical Review Letters 8727, art. no.-274501.Georgiou, G.C., Papanastasiou, T.C., Wilkes, J.O., 1988. Laminar Newtonian jets at
high Reynolds number and high surface tension. A.I.Ch.E. Journal 34, 1559–1562.Haid, M., Martin, H., Muller-Steinhagen, H., 1994. Heat transfer to liquid–solid
fluidized beds. Chemical Engineering and Processing 33, 211–225.Harkins, W., Brown, F., 1919. The determination of surface tension (free surface
energy), and the weight of falling drops: the surface tension of water andbenzene by the capillary height method. Journal of the American ChemicalSociety 41, 499–524.
Hussin, A.M.A., Jan, D., 2005. Two-dimensional fractal linearization of distributioncurves. Physicochemical Problems of Mineral Processing 39, 129–139.
Jamialahmadi, M., Malayeri, M.R., Muller-Steinhagen, H., 1997. Prediction of heattransfer to liquid–solid fluidized beds. Canadian Journal of Chemical Engineering73, 444–455.
Kitamura, Y., Mishima, H., Takahashi, T., 1982. Stability of jets in liquid–liquidsystems. Canadian Journal of Chemical Engineering 60, 723–731.
Kitanovski, A., Vuarnoz, D., Ata-Caesar, D., Egolf, P.W., Hansen, T.M., Doetsch, C.,2005. The fluid dynamics of ice slurry. International Journal of Refrigeration 28,37–50.
Le, H., 1998. Progress and trends in ink-jet printing technology. Journal of ImagingScience and Technology 42, 49–62.
Liang, K.F., Peng, Z.B., Yuan, Z.L., 2006. Energy analysis of ice-making process forliquid–liquid circulating fluidized bed. Journal of Southeast University (NaturalScience Edition) 36, 774–779.
Liang, K.F., Peng, Z.B., Yuan, Z.L., 2007. Liquid–liquid atomized jet-flow characteristicsand particle diameter distribution. Journal of Engineering for Thermal Energyand Power 22, 326–331.
Liu, A.B., Reitz, R.D., 1993. Mechanism of air assisted liquid atomization. AtomizationSprays 3, 55–75.
Meewisse, J.W., 2004. Fluidized bed ice slurry generator for enhanced secondarycooling systems. Ph.D. Thesis, Delft University of Technology, Delft.
Meister, B.J., 1966. The formation and stability of jets in immiscible liquid systems.Ph.D. Thesis, Cornell University, Ithaca, New York.
Meister, B.J., Scheele, G.F., 1967. Generalized solution of the Tomotika stabilityanalysis for a cylindrical jet. A.I.Ch.E. Journal 13, 682–688.
Meister, B.J., Scheele, G.F., 1969a. Predictions of jet length in immiscible liquidsystems. A.I.Ch.E. Journal 15, 689–699.
Meister, B.J., Scheele, G.F., 1969b. Drop formation from cylindrical jets in immiscibleliquid systems. A.I.Ch.E. Journal 15, 700.
Milosevic, I.N., Longmire, E.K., 2002. Pinch-off modes and satellite formation inliquid–liquid jet systems. International Journal of Multiphase Flow 28, 1853–1869.
Peng, Z.B., Liang, K.F., Yuan, Z.L., 2007. Numerical simulation and experimental studyof liquid–liquid jet-flow atomization. Journal of Engineering for Thermal Energyand Power 22, 205–212.
Pronk, P., 2006. Fluidized bed heat exchangers to prevent fouling in ice slurry systemsand industrial crystallizers. Ph.D. Thesis, Delft University of Technology, Delft.
Richards, J.R., Beris, A.N., Lenhoff, A.M., 1993. Steady laminar flow of liquid–liquidjets at high Reynolds numbers. Physics of Fluids A5, 1703–1717.
Richards, J.R., Lenhoff, A.M., Beris, A.N., 1994. Dynamic breakup of liquid–liquid jets.Physics of Fluids 6, 2640–2655.
Richards, J.R., Beris, A.N., Lenhoff, A.M., 1995. Drop formation in liquid–liquid systemsbefore and after jetting. Physics of Fluids 11, 2617–2630.
Scheele, G., Meister, B., 1968. Drop formation at low velocities in liquid–liquidsystems. A.I.Ch.E. Journal 14, 9–15.
Schulkes, R.M., 1994a. The evolution and bifurcation of a pendant drop. Journal ofFluid Mechanics 278, 83–100.
Schulkes, R.M., 1994b. The evolution of capillary fountains. Journal of Fluid Mechanics261, 223–252.
Shan, X.W., Chen, H.D., 1993. Lattice Boltzmann model for simulating flows withmultiple phases and components. Physical Review E 47, 1815–1819.
Shi, X.D., Brenner, M.P., Nagel, S.R., 1994. A cascade of structure in a drop fallingfrom a faucet. Science 265, 219–222.
Umbanhowar, P.B., Prasad, V., Weitz, D.A., 2000. Monodisperse emulsion generationvia drop break off in a co-flowing stream. Langmuir 16, 347–351.

Z. Peng et al. / Chemical Engineering Science 64 (2009) 1249 -- 1259 1259
Wang, M.J., Kumusoto, N., 2001. Ice slurry based thermal storage in multifunctionalbuildings. Heat and Mass Transfer 37, 597–604.
Wilkes, E., Phillips, S., Basaran, O., 1999. Computational and experimental analysisof dynamics of drop formation. Physics of Fluids 11, 3577–3598.
Zhang, D., Stone, H., 1997. Drop formation in viscous flows at a vertical capillarytube. Physics of Fluids 9, 2234–2242.
Zhang, X., 1999a. Dynamics of drop formation in viscous flows. Chemical EngineeringScience 54, 1759–1774.
Zhang, X., 1999b. Dynamics of growth and breakup of viscous pendant drops intoair. Journal of Colloid Interface Science 212, 107–122.
Zhang, X., Basaran, O., 1995. An experimental-study of dynamics of drop formation.Physics of Fluids 7, 1184–1203.
Copyright © 2022 FDOKUMEN