Mixed-mode Surveys: When and Why
148
Mixed Mode Surveys Professor Edith D. de Leeuw PPSM Short Course Series Bremen 8 May 2009 Copyright Edith D. de Leeuw
-
Upload
independent -
Category
Documents
-
view
4 -
download
0
Transcript of Mixed-mode Surveys: When and Why

Mixed Mode SurveysProfessor Edith D. de Leeuw
PPSM Short Course SeriesBremen 8 May 2009
Copyright Edith D. de Leeuw

Introduction:Instructor
ParticipantsTopic

InstructorEdith Desiree de Leeuw is a professor of survey methodology at the Department of Methodology & Statistics of the University of Utrecht. She is a fellow of the Netherlands Interuniversities Joint Institute for Psychometrics and Sociometrics (IOPS), associate editor of Journal of Official Statistics (JOS) and member of the editorial board of Sociological Methods and Research, Field Methods, and MDA. She has edited books on methodology and statistics, including the recently published International Handbook of Survey Methodology, and has more than 20 years experience in survey research. See also http://www.xs4all.nl/~edithl/

AcknowledgementsBill BlythDon DillmanMartin FrenkelJoop HoxMichael LinkLars Lyberg

Modes of Data CollectionRespondent Participation Required
Interviewer-administered ModesFace-to-face interviews (PAPI or CAPI)Telephone Interviews (PAPI or CATI)
Self-administeredPostal or mail surveySelf-administered with interviewer present
PAPI or CASI Web or Internet Survey IVR (Interactive Voice Response)

Modes of Data Collection 2
No respondent participation involvedEnumerator needed
Direct Observation of BehaviourCounting (e.g., traffic), etc
No enumerator neededAdministrative RecordsScanning, data miningElectronic Data Exchange (EDI)TV-usage, ‘people meters’

Participants’ Experience
Hands-on Experience?
Face-to-face interviews (PAPI or CAPI)Telephone Interviews (PAPI or CATI)Postal or mail surveyWeb or Internet Survey IVR (Interactive Voice Response)
Mixed Mode Surveys

Mixed Mode SurveyCombine two or more communication modes
ContactData collection
ContactScreening or convincing
ESS allows for appointments made by telephone, Actual interview face-to-face
Data CollectionNonresponse follow-up by different methodSAQ-module during face-to-face interviewWeb + telephone (PPSM)

A New Trend“Mixed mode surveys, that is, surveys that combine the use of
telephone, mail, and/or face-to-face interview procedures to collect data for a single survey project are occurring with increasing frequency. A second, or in some cases even a third, method to collect data for a single survey is being used throughout the world…. Indeed, mixed mode is becoming one of the survey buzz words of the late 20th century”
Dillman & Tarnai, 1988
Important issues in mixed mode identified by Dillman & Tarnai are a.o.
Data comparabilityQuestionnaire construction and pretesting

Mixed-Mode the Norm“In general, data collection systems do not
consist of one mode only, since mixed-mode surveys are the norm these days.”
Biemer & Lyberg, 2003
“An emerging new breed of survey software is starting to make this
[combine CATI/CAWI]possible” Macer, 2004
“Mixed-Mode: The only fitness regime.”Blyth, 2008

Why Mix Modes?Increase in Online Surveys
CoverageSpecial groups
Response/nonresponse problemsEffort to increase responseInvestigating bias
Increase in International SurveysDifferent tradition in countriesDifferent coverage

Mixed Mode SurveysWhich Mode to Choose
Web, telephone, face-to-face, mail?Which Mix to Chooses
Face-to-face / TelephoneMail / Telephone?Internet / Mail?CATI / CAWI????
Why? Consequences?

TerminologyMixed ModeMulti ModeMultiple Mode
Often used interchangeablyMixed ModeMixed Mode
Any combination of surveysurvey data collection data collection methods (modes)methods (modes)In any part of the data collection process
Note: Term mixed methods used in qualitative studies

Mixed Mode SurveysA Road Map
New adventurous continentMixed Mode Territory
How to plan the tripWhere to visit?What to pack?
Short course Road mapItinerary

Why Mix Modes?Total Survey Error
Perspective

Why Mixed-Mode?Choosing the Optimal Data Collection Method
Best data collection procedure givenResearch questionPopulation
Reduce total survey error
Respect survey ethics/privacyWithin available timeWithin available budget
Biemer & Lyberg, 2003Biemer & Lyberg, 2003

Best Affordable MethodMixed-mode explicit trade-off
Survey ErrorsCosts
Example: Nonresponse follow-up Mail surveyTelephone follow-upFace-to-face for sub-sample of remaining nonrespondents

Costs & Errors
Coverage
Nonresponse
Sampling
Measurement
Costs
Groves, 1989Groves, 1989

Survey Errors
Coverage
Nonresponse
Sampling
Measurement
Costs
Coverage

Coverage ErrorSampling frame must include all units of population of interest (once), if not:Frame Coverage Errors
Non-sampling errorErrors arising from construction of sampling frame
OmissionsErroneous inclusionsDuplications

Coverage Error and ModeSampling frame must include all units of population of interest (once)
Are all intended covered by mode or is there danger of undercoverage?
TelephoneTelephone penetration
Landlines vs mobile (cell) phones
WebInternet penetration differs per country

Web Surveys and Coverage
Mid year 2008Mid year 2008Miniwatts Marketing GroupMiniwatts Marketing Group

Europe Diverse PictureEuro Barometer Data: face-to-face survey!Internet Access at Home Adults 15 + (2008)
Holland: 86%, Sweden: 83%, Denmark: 81%, Finland: 73%Germany: 58% overall
Former West Germany: 61%Former East Germany: 48%
Romania: 11 %, Turkey 15%, Bulgaria 21% Positive trend over time: Growth 2005 to 2008
Between 1% (Holland) and 21%(Bulgaria0→21%)10% (UK: 53→63; Estonia 48→58%)
Blyth, May 2008Blyth, May 2008

% Individuals with Internet Access at Home
0%
10%
20%
30%
40%
50%
60%
70%
80%
90%
100%
EL HU SK LT PT LV IT PL CY CZ ES FR IE AT EE DE SI UK BE LU FI DK SE NL
20082005
Source: Eurobarometer Source: Eurobarometer 20052005 & & 20082008
Slide Blyth, 2008

% Individuals with a Telephone (of any sort)
0%
10%
20%
30%
40%
50%
60%
70%
80%
90%
100%
CY DK LU EL FI FR UK AT BE DE IE IT SI CZ ES EE HU SK LV PT LT PL MT TR MK BG RO
2005 2008Slide Blyth, 2008
Source: Eurobarometer Source: Eurobarometer 20052005 & & 20082008

% Individuals with a Mobile (Cell) Phone
0%
10%
20%
30%
40%
50%
60%
70%
80%
90%
100%
FI LU CZ DK SI IE EE IT UK BE AT SK CY ES FR DE LT LV PT HU EL PL MT TR BG MK RO
2005 2008
Slide Blyth, 2008
Source: Eurobarometer Source: Eurobarometer 20052005 & & 20082008

% Individuals Mobile onlyNo Fixed (land)line
-20%
0%
20%
40%
60%
80%
100%
SE NL LU DE CY UK EL SI DK FR IE PL BE ES AT IT HU EE PT SK LV CZ FI LT
20082005
Slide Blyth, 2008
Source: Eurobarometer Source: Eurobarometer 20052005 & & 20082008

Country CodesBE Belgium, BG Bulgaria, CZ Czech Rep, DK DenmarkDE Germany, D-W West Germany, D-E East GermanyEE Estonia, EL Greece, ES Spain, FR FranceIE Ireland, IT Italy, CY Cyprus, LV Latvia, LT LithuaniaLU Luxemburg, HU Hungary, MT Malta, NL NetherlandsAT Austria, PL Poland, PT Portugal, RO RomaniaSI Slovenia, SK Slovakia, FI Finland, SE SwedenUK United Kingdom, HR Croatia, TR Turkey

Survey Errors
Coverage
Nonresponse
Sampling
Measurement
Costs
Sampling

Sampling ErrorOccurs because only a sample of the population is invited to participate in a survey in stead of the total population
Statistic of interest is computed on sample Provided a probabilityprobability sample is used
Each element in the population has a known and non-zero probability of selection from the sampling frame
Provide protection against selection bias (e.g. self-selection)Give a means of quantifying sampling error

Sampling Error 2Statistic of interest is computed on sample Statistical procedures to accommodate this
Standard error, p-value, statistical tests, etcStandard software assumes Simple Random SamplingBut there are more complicated sampling schemes (e.g., stratified, cluster) This needs more complicated statistics
Multilevel analysis, Sudaan, etc

Types of SamplesInformation from whole population, that is, NO sampling: A Census ☺☺Probability Sampling
Random selection, random samplingAllows for statistical theory, inference ☺☺
Non probability SamplingSelection probability unknown
No known probabilities of inclusion in sampleNo statistical theory
No p-values, no margins of error

Survey Errors
Coverage
Nonresponse
Sampling
Measurement
Costs
Nonresponse

Non-response ErrorNonresponse / Missing Data
Inability to obtain data on all questionnaire items from all persons: Missing Data
Unit non-responseWhole unit fails to provide data
Sampling unit, data collection unit, or analysis unit

Non-response Error 2Quantification (Non) Response Figures
Response Rate, Refusal Rate, etc
Standardization response figuresWWW.AAPOR.ORG section survey methods, standards and best practice
RDD telephone, in person household, mail and internet surveys of specifically named persons
WWW.ESOMAR.ORG professional codes and guidelines for guidelines on internet research including non response categories that have to be reported

Nonresponse InternationallyInternational Comparison Official Statistics
Longitudinal data statistical offices around the worldInternationally nonresponse increased over time, both noncontact and refusalCountries differ in overall response rateIn general a negative trend over timeSpeed of increasing nonresponse differ from country to country
Source De Leeuw & De Heer (2002)

From Ineke Stoop, 2005From Ineke Stoop, 2005

Non-Response Error 3Beware Nonresponse Error is more than nonresponse!
Nonresponse error I. Nonresponse occursII. Respondents and non-respondents differ on variable of interest (key variable study)
Nonresponse figures as such uninformativeHigh nonresponse but little or no error (or vice versa)Need nonresponse studies / diagnostics

Nonresponse Rate vs. BiasFigure 2. Percentage absolute relative nonresponse bias of 235 respondent means by nonresponse rate from 30 different methodological studies (Groves, 2006 POQ)

Survey Errors
Coverage
Nonresponse
Sampling
Measurement
Costs
Measurement

Measurement Error Measurement Error
Nonsampling error or error of observation.
Measurement errors are associated with the data collection process itself.
Measurement error occurs when a respondent’s answer to a question is inaccurate,
In other words when answer departs from the ‘true’value

Measurement Error 2Measurement errors are associated with the data collection process itself
There are three main sources of measurement error:
Questionnaire RespondentMethod of data collection
When interviewers are used for data collection, the interviewer is a fourth source of error

Mixed Mode SurveysA Solution to ProblemsIllustrated with Some
Special Cases

How do Modes Differ?Practical advantages & disadvantages
Personal needed, time, equipment, etcDifferences coverageDifferences samplingDifferent cost structureDifferences measurement

Known Coverage ProblemsFace-to-face coverage:
Available household lists not completeNeed to manually count and list
Telephone coverage:Households with no telephones Cell phone only households No directory of cell phone numbers (country specific)Number portability and erosion of geographic specificity
Mail coverage:Depends on good mailing list.
Country specific Registers or postal lists
Email coverage:No systematic directory of addresses
Note: general population coverage problems

Solution Web CoverageConcurrent Mixed Mode
Coverage
Nonresponse
Sampling
Measurement
Costs
Coverage
Measurement

Declining Response RatesResponse rates decreasing significantly in the last 20 years.
Decline has occurred for most types of surveys— particularly telephone and in-person interviewsEvidence of trends for mail surveys not as clear
Web surveys are too new to provide good trend data.But, in general lower than comparable mail surveysAnd other modes
Lozar Manfreda et al, 2008; Shih & Fan,2008
Increase in nonresponse is a global problem
No single or clear explanation for these trends.Several theories on nonresponse

Nonresponse SolutionSequential Mixed Mode
Coverage
Nonresponse
Sampling
Costs
MeasurementMeasurement

Sequential Mixed ModeSequential
Different modes for successive phases of interactions (contact phase, data collection phase, follow-up phase)
Screen or contact by phone,collect data by face-to-face interview
Different modes in sequence during data collection phase
American Community SurveyMail, telephone, face-to-face
Balden, 2004

American Community SurveySponsor: U.S. Census BureauTarget population: Households in U.S.
2.9M addresses sampledFocus: social, housing, & economic characteristicsFrame: Census Master Address FileModes (sequential):
MailTelephone follow-upIn-person follow-up
Field period: 3 monthsResponse rates: 97.3% (for 2005)
1.9M interviews completedFrankel & Link, 2007Frankel & Link, 2007

International SurveysConcurrent Mixed Mode
Nonresponse
SamplingCoverage
Measurement
CostsCostsCosts
Coverage Sampling
Nonresponse Measurement

Concurrent Mixed ModeConcurrent
Multiple modes are used simultaneously for data collection: implemented at same time
Asthma awareness studyInvitation postcard offering choice
Establishment and business surveysDual frame surveysInternational surveys
Balden, 2004

To Mix or Not to MixMixing modes has advantages, but
Will the answers provided by respondents differ by mode?
Can data that are collected through different modes be combined in one study?
Cross-sectional?Longitudinal?
Can data that are collected through different modes be compared over studies or countries?

Taxonomy of Mixed Mode Surveys I
Multi(ple) Mode Contacts

Multi Mode Survey SystemsSurvey more than data collection
Communication with Respondent Contact Phase
Pre-notificationScreeningInvitation
PPSM
Data collectionFollow-up
Reminders

Terminology RevisitedMultiple Mode In General
Communication with Respondent Contact Phase
Pre-notificationScreening/Invitation
Follow-upReminders
Mixed ModeData collection itself
Data collected with more than one mode At same time (concurrent)One after another (sequential)

One Survey System: Multiple Modes of Communication
Example Nielsen media research Multiple modes of contact in 7 steps
1. Pre-recruitment postcard2. Recruitment phone call3. Advance postcard announcing diary4. Diary survey package5. Reminder postcard6. Reminder phone call7. Reminder postcard Bennett & Trussel, 2001
Trussell & Lavrakas, 2004

Contact Phase
Rationale
Correct sampling frameRaise response rateEnhance legitimacy and trustSend incentive in advance
Effect on Quality
Reduce coverage and nonresponse errorNo threats to measurement if data collection itself is in singlesingle-modemode (= data are collected with one method only)
Advance Notification/ScreeningDifferent Mode from Data Collection

Contact Phase
Why? Reduce coverage and nonresponse error
Effect on measurementNo threats to measurement if data collection itself is in one singlesingle--modemode
Telephone invitation for IVRNielsen media study: data collection diary
Potential threats if data collection is multiplemultiple--modemodePostcard invitation for Web/CATI offering choice of mode to respondent
Invitation in Different Mode from Data Collection Itself

Follow-up Phase
Rationale
Simple reminder, such as postcard, short telephone call, etc has low costs Raise response rate
Effect on Quality
Reduce nonresponse errorIf pure reminder (data collection singlesingle-mode) no threats to measurement
Reminder(s) in Different Modefrom Data Collection Itself

Follow-up Phase
Rationale
Simple reminder, such as short telephone call, has low costs Raise response rateAt low additional cost ask extra questions
Effect on Quality
Reduce nonresponse errorIf reminder plus additional questions, then multiplemultiple-mode
Part of data collection different from main mode
Threat to measurement
Reminder(s) in Different Modefrom Data Collection Itself + Questions

In Sum: MM &Contact PhasesSecond or third method for interactioninteraction with respondent No actual data are collected with additional modes (e.g. only encouraging people to respond)
Data quality enhanced ☺☺Generally more costlyMore complicated logistics
Second or third mode for data collectiondata collection too (e.g., some respondents by one, other by second mode (mail with telephone follow-up)
Potential threats to data integrity

Taxonomy of Mixed Mode Surveys II:
Measurement Error

Data Collection PhaseMixed mode for interaction with respondent in Contact Phase and Follow-up Phase mostly Win-Win situation!More complicated in Data Collection Phase
Threats to data integrityOne big exception: win-win situation in mixing interview mode with SAQ for sensitive questions
Some questions by one mode, other questions by another mode, but same procedure for all respondentsE.g. CAPI/CASI
Interviewer guidance for non sensitive questionsMore privacy, less social desirability sensitive questions

Implications Mixed Modein Data Collection Phase
Potential RiskIntroducing mode effects in data set
Result:Increasing measurement error
However:Reduction of other errors
E.g., Coverage / nonresponse
Careful consideration neededCareful design for optimal mixed mode

Recap Sequential vs. ConcurrentData Collection PhasePhase
SequentialDifferent modes in sequence during data collection phase
Example: American Community SurveyMail, telephone, face-to-face
Example: LFS SwedenLongitudinal face-to-face, telephone
ConcurrentMultiple modes are used simultaneously for data collection: implemented at same time
Example: Asthma awareness studyInvitation postcard offering choice of modes
Example: Using more private method for sensitive questions

Data Collection Phase: Concurrent Mixed Mode 1Multiple modes implemented at same time
For sub setsub set of questions onlyReduce Social Desirability Bias
Sensitive questions in more ‘private’ modeCAPI - (A)CASI mixTelephone - IVR (or T-CASI) mixFace-to-face – paper SAQ mix
Example: US National Survey on Drug Use and Health (NSDUH)Win-win situation ☺
Warning: Beware of concurrent mixed mode for totalquestionnaires when sensitive topics are studied!!!
Different groups get different modes

Data Collection Phase: Concurrent Mixed Mode 2
Multiple modes implemented at same time For all questionsall questions, full questionnaire, one population
Reducing Coverage Error at reasonable costsDual frame sampling
Dangers concurrent mixed-modeMeasurement differences
E.g., social desirability, recency effectsOften, difficult to entangle as (self-)selection and mode effect are confoundedPPSM: random allocation makes it possible to study mode effects
Reduced coverage error at the price of increased measurement error

Remember Web CoverageConcurrent Mixed Mode
Coverage
Nonresponse
Sampling
Measurement
Costs
Coverage
Measurement

Data Collection Phase: Concurrent Mixed Mode 3Multiple modes implemented at same time
For all questionsall questions, full questionnaireDifferent populations offered different mode
International SurveysRegional comparisonsMultiple cultures
Practical considerationsOnly way to get data for certain groups/countriesExample ISSP
Danger: measurement errorPopulation and mode effects confounded

International Surveys
Nonresponse
SamplingCoverage
Measurement
CostsCostsCosts
Coverage Sampling
Nonresponse Measurement

Data Collection Phase : Concurrent Mixed Mode 4
Multiple modes implemented at same time For all questionsall questions, full questionnaire, one populationRespondent is offered choice of mode
Rationale: be client centered in order to reduce nonresponse and save costsDangers
Measurement differences confounded with self-selection groupsHigher nonresponse in household surveys!!!
1-9% Dillman (2008). More effective in establishment surveys by official statistics
Need more empirical data

Respondents Viewpoint:Offering A Choice Makes Life More Difficult
Researcher’s viewpointClient centered to reduce nonresponse Respondent friendly, establish good-will
BUT Respondent’s viewpoint is differentMore information to read and process
Higher ‘costs’ in social exchangeIncreased cognitive burden
Two decisions to make in stead of oneFrom “will I participate” to “will I participate and what method do I want to use”Harder task so simplest thing is opt-out
May concentrate on choice, not on surveyDistracts from message and arguments on why to cooperate
Weakens saliency

Sequential Mixed Mode Nonresponse Reduction
Sequential mixed-mode approach may be more effective than giving respondents a choiceSequential for nonresponse reduction better than concurrentBut, concurrent a good solution for coverage problemsSequential approach for nonresponse reduction
Different modes in sequence during data collection phase
Example: American Community SurveyMail, telephone, face-to-face

Data Collection Phase: Sequential Mixed Mode 1Multiple modes implemented in sequence one time period / cross-sectional study
Successful for nonresponse reductionInexpensive mode first main modeMore expensive mode as follow-up
Potential measurement errorBeware for using data of sequential mixed mode for assessment of nonresponse bias
Mode and nonrespondents may be confounded Ideally assessment of nonresponse bias by small sub sample same mode

Nonresponse SolutionSequential Mixed Mode
Coverage
Nonresponse
Sampling
Costs
MeasurementMeasurement

Data Collection Phase: Sequential Mixed Mode 2Multiple modes implemented in sequence, one sample Multiple time points / longitudinal study
Cost reduction and practical considerationsMore expensive mode
Selection and screening for panelBase-line study
Next waves less expensive studyLabor force survey many countries
Face-to-face first wave, later waves telephone Web panel selection by face-to-face or phone, Sometimes ABBAB design
A=Mode 1, B=Mode 2Example NESTOR study on aging Holland
Potential measurement errorTime and mode may be confounded

In Sum Mixing ModesData Collection Phase
Some questions by one mode, other questions by another mode, but the same procedure for all respondents
Sensitive questions by SAQ, rest other modeData quality enhanced ☺☺
Selection and biographics first wave longitudinal/panel by one mode, next waves other modes
Mostly win-win
Beware of confounding mode vs. time effects longitudinal
Some respondents by one mode, other respondents by another
Nonrespondents by another modeOffering choice of modeCross-national
Potential threats to data integrity

In Sum: Problems MM Data Collection Phase
Incomparability Different subgroups different modes (e.g. nonresponse follow-up, or telephone survey in city A, mail survey in city R)
ConfoundingAre groups different (more crime in R)Or is it mode effect (e.g., Soc. Des.)
Different samples, different modes (e.g.,comparative research, international)
More social isolation in country X than Y or different survey methods (& associated social desirability)?

In Sum: Types of Mixed Mode
Two major distinctions:Different contact methods are used in different survey phases (e.g., recruitment, screening, questionnaire administration, etc.)
Mostly win-win situation, no threat to measurement if data collection is done in one single mode
Different methods used for data collectionConcurrent mixed mode:
Offer two or more modes at same timeSequential mixed mode
Assign modes sequentially during life of the survey

To Mix is to DesignMixing data collection modes has advantages in reducing noncoverage and nonresponse errors, butMixing methods may enhance measurement errorsSo,
I. Design for Mixed Mode SurveysDesign equivalent questionnaires!
II. If possible, measure potential mode effectsIII. Adjust

Diagnosis/Adjustment:Design for Mix
Build in overlap Method 1 Method 2
Group X Main Data Collection
Some Data
Group Y Some Data Main Data Collection

Why and How Modes DifferSelf-Administered vs. Interviewer-Guided
Visual vs. AuralMedia-related customs

Modes & MeasurementMeasurement error occurs when a respondent’s answer to a question is inaccurate (departs from the “true” value)Modes vary in terms of:
Interviewer versus self-administered questionnairesInterviewer impact
Stimuli / manner in which survey question is conveyed to respondent (and response is recorded)
Information transmissionKnowledge about mode, usage, social customs
Media related factors

How Modes DifferOverviews: De Leeuw 1992, 2005 and Dillman & Christian, 2005
Empirical Evidence Interviewer ImpactMore social-desirability in interview
E.g., drinking, fraudMore open in self-administered modes
More positive in interviewLess lonely, better health in interview
More acquiescence in interviewTendency to agreeEasier to agree than disagree with another person
Less missing data/more detailed answers open questions in interview
In general interviewer probes help

How Modes Differ 2Empirical Evidence Medium Impact
Few systematic studies (Overviews De Leeuw, 1992, 2005) indicate advantage of self-pacing
Self-administered more consistent answersSAQ higher psychometric reliability on scales
BUT all Paper SAQ vs. interview!
Internet as medium still different (cf. Krug, 2006)Multi-taskingScanningSatisficing (close enough in stead of optimal)

Internet as MediumEmpirical Evidence Medium Impact
Hardly any systematic studiesSatisficing (less differentiation in web, Fricker et al, 2005)
Psychological testingEquivalence when no time pressure (De Leeuw et al, 2003)
Conveying sincerity of purpose and trust more difficultMore research needed on nonresponse
Web on average 11% lower (meta-analysis Lozar Manfreda, et al, 2008)
Research needed on response to sensitiveresponse to sensitive questionsInfluence of SPAMTrustworthiness web
Panel should have advantage vs. one time web surveyExisting relationship vs one-time

How Modes Differ 3Information transmission: visual vs aural; spoken vs written vs typed; question by question or blocks (page)Some evidence recency effect in telephone surveys
More often last offered answer category is chosenContext and order effects less likely in self-administered (paper) than interview
Overview / segmentationNo empirical studies including web surveys
Visual presentation & design & qualityGrowing body of evidence that respondents use all information including visual cues to decide what answer they are going to report
Cf Dillman, 2007; Toepoel, 2008; Couper 2009

Good news, but….Literature reports that there are some mode difference
Not largeExcept for more sensitive questions
But….All empirical evidence is based on
Well conducted experimentsControlling/adjusting population differencesEquivalent questions and questionnaires!Equivalent questions and questionnaires!

Lesson LearnedTo minimize mode effects one should:
Control/adjust for population differencesE.g., More younger, higher educated in web and more elderly, lower educated phone
Use equivalent questions and questionnaires!
Ensure measurement equivalence

Questionnaire DesignTraditional Designs for Specific Modes and the Implications for
Mixed-Mode Surveys

Traditional Design F2FFace-to-face: Visual + Aural
Show cards with answer choicesLong lists of answers, long scales with each point labelled
Pictures may be usedOpen-ended questions on wide variety of topics
Trained interviewers are carefully instructed to probe in order to get detailed and complete information
No opinion etc not explicitly offered, but accepted when given. Interviewers often trained to accept ‘no answer’ only after a standard ‘probe’Transitional texts to guide interviewer and respondent to next block of questions

Traditional Design TelTelephone: Aural only
Shorter answer scales (2-5 point scales)Often only anchored end-points
On a scale from 1 to 5 with 1 being not at all satisfied and 5 being completely satisfied
Visual analogue questionsImagine a ladder with 7 stepsImagine a thermometer with a scale from 0 to 100
Unfolding for longer scalesSatisfied, dissatisfied or somewhere in the middleCompletely, mostly, somewhat (dis)satisfied

Traditional Design Tel2Telephone design
Difference with face-to-face In general breaking up questions in parts to accommodate loss of visual channel
Like face-to-faceOpen-ended questions and probesNo opinion / no answer not explicitly offered
But is accepted after probe by well-trained interviewer

Traditional Design PostalMail survey: Visual only, no interviewer present
In general, no breaking up of questions in partsBut, use longer list of response categories in steadFully labelled scalesCheck all that apply instead of yes/no answersOnly ‘no answer’ when person skipped question, in stead of interviewer coded ‘refused, do not know, no opinion’Go back and forth: more context availableUse illustrations / visuals

Example Mail vs Telephone
MailIs the home in which you live
Owned free & clearOwned with a mortgageRentedOccupied under some arrangement
TelephoneDo you own or rent a home?
Follow-ups accordingly, e.g. when owns a homeDo you have a mortgage or is it owned free and clear
Dillman & Christian, 2005Dillman & Christian, 2005

Example Face to FaceFace-to-face using show card with response
categoriesIs the home in which you live
Owned free & clearOwned with a mortgageRentedOccupied under some arrangement
Or when quick doorstep only auralDo you own or rent a home?
Follow-ups accordingly, e.g. when owns a homeDo you have a mortgage or is it owned free and clear

Traditional Design WebWeb survey:
Visual only, but audio potentialNo interviewer, but intelligent computer system
Many similarities with mailDifferences
More sequential offering of questionsCheck all that apply almost standard format
Radio buttons (but…)Evidence Christian et al (2008) check-all-that apply not optimal
Grids often used for groups of questionsWhat is best visual design?

Traditional Design Web2
Web survey many similarities with mail plus some additional features, such as,
Visual only, but audio potentialNo interviewer, but intelligent computer system
Also many differences in question design Special formats
Slider bars Drop down menus
Open questions influenced by box size, dynamic space (cf Dillman)

Visual IllustrationsVisual Illustrations are attractiveMay motivate respondent
Cover mail survey positive on response (e.g. Dillman’s work)
Help question/word meaningBUT: May influence respondent’s answer!!
Example ”How often do you eat out ”Illustration 1: couple, candlelight, rose in vase Illustration 2: picture of MacDonald
Visuals/illustrations and their influence (Couper, 2007,2009)

Designing for Mixed-ModeTwo Cases

Naively Mixing Enhances Measurement Errors
Different modes have a tradition of different formats, and question format has effect on response distributionConsequence: Designers may routinely enhance unwanted mode effects in mixed-mode survey
E.g. unfolding in one mode, full presentation of all response options in other mode
What to do?Design Questionnaire for MixedDesign Questionnaire for Mixed--ModeMode
How?
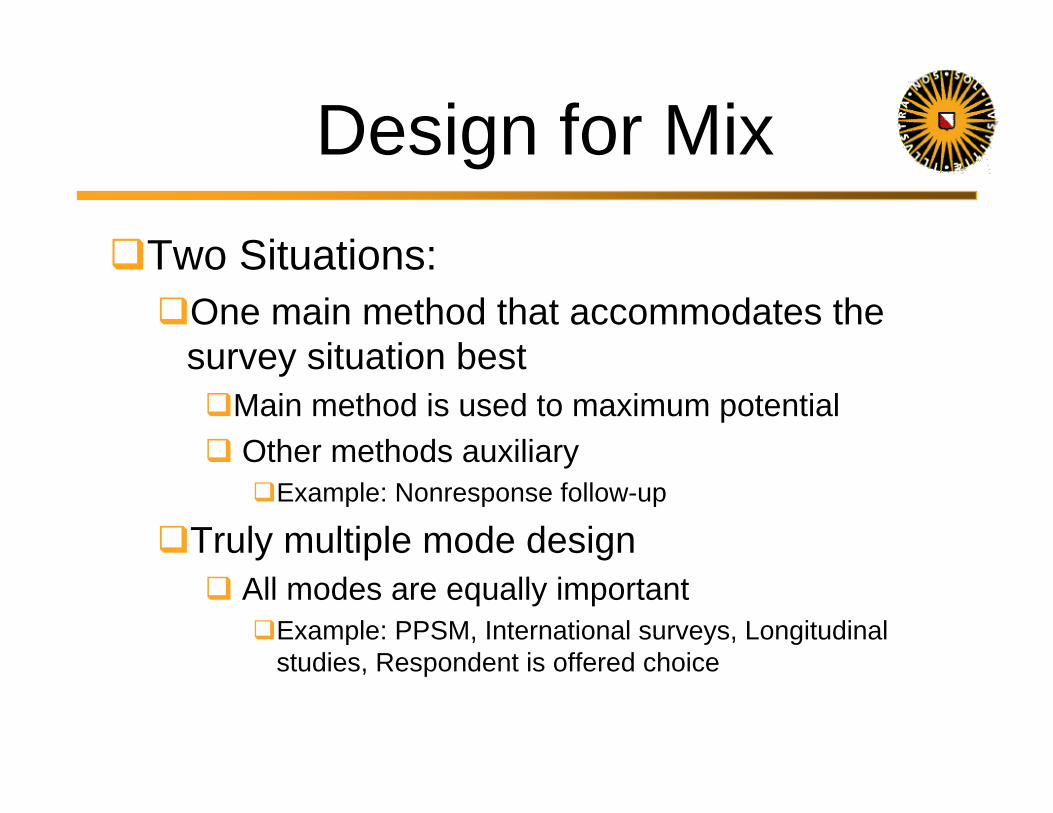
Design for MixTwo Situations:
One main method that accommodates the survey situation best
Main method is used to maximum potentialOther methods auxiliary
Example: Nonresponse follow-up
Truly multiple mode designAll modes are equally important
Example: PPSM, International surveys, Longitudinal studies, Respondent is offered choice

Design for Optimal Mix 1One Main Method, other methods auxiliary (cfBiemer&Lyberg 2003)Identify main method
Use main method optimal and to its maximum potentialAuxiliary methods designed equivalent equivalent
To avoid measurement errorMay be perhaps sub-optimal for auxiliary method
Example: less response categories
Note: Dillman et al (2009) coined this ‘mode-enhancement-construction’

Example LFSLongitudinal face-to-face & telephone
Identify main methodMain method not necessary first method
Main method telephoneFace-to-face auxiliary from longitudinal point of view
Main design for telephone interviewcf. Biemer & Lyberg, 2003cf. Biemer & Lyberg, 2003

Example LFS cont
Design longitudinallongitudinal questions for telephone useNot full potential face-to-face used in face-to-face interview
No visuals, no show cardsShorter scales, unfolding Open questions
Design oneone--timetime recruitment questions for face-to-face use (full potential visual)
Ensure data integritydata integrity for longitudinal use!

One Main MethodTelephone with Face-to-Face Mixes
If telephone main methodRelatively easy to design mix optimally
Interviewer assistance in both modesDo not use the ‘extra’ visual channel in face-to-face
If face-to-face main methodAbsence of visuals makes it more complicated
Carefully balance pro and consOptimize for one? (preferred-mode specific design, aka mode-enhancement construction)Or use ‘uni-mode’ design?
Implement a small experiment within one mode if possible!

One Main Method 2Self-Administered Questionnaires and Interviewer MixesSAQ or Interview Main Method?
Complexity of questionnaire Big issue in mixes with paper-mail not in mixes interview with web
Are visuals essential?Face-to-face in mix may accommodate visuals, phone does not
CAWI-CATI may have problems, CAWI-CAPI not
Sensitive questionsSocial desirability differences, interviewer influence
Is interviewer probing essential or not?Paper mail problems, but web can emulate some probes
NCES example

Example NCESRTI surveys for National Center for Educational Statistics
TSMII-paper Wine et al at www.rti.orgOriginal studies were done by telephoneSwitch to Web with telephone follow-up
Highly Internet savvy populationSo web good choice, but…

Example NCES 2Switch to Web with telephone follow-up
But, researcher did not want to lose advantages interviewer
(Non)Response conversionClarification, solving inconsistencies, coding, etc
Blend best features of both modes

Example NCES 3Start with web survey ‘enriched’
Offer incentive for early completionHelp desk with
Specially trained telephone interviewersTelephone prompts by phone by trained interviewers help-desk instead of standard e-mail reminders
Directly or on answering machineReminding of early completion incentive

Example NCES 4Questionnaire equivalence
Field testedSome adaptation to web questionnaire To make situation more equivalent to telephone interview
Changes in web-questionnaireNo answer option equivalence with interview
Continue button in stead of explicit ‘no answer’But generic pop-up after 3 consecutive no answers to remind of importanceKey-items redisplayed with tailored text
Sensitive questions and SAQRevision finance items to be less sensitive
Help text designed for web also helped interviewers

Truly Multiple Mode Surveys:Modes are Equivalent
Three Approaches in Design

Modes Are EquivalentThree schools of thought
Method MaximizationOptimize each mode separatelyseparately
Unified Mode Design or Uni-mode designProvide the same stimulus (question format) in each mode, same offered offered stimulus
Generalized Mode DesignPurposively constructing questions to be different to achieve cognitive equivalence, same perceivedperceived stimulusThis can be seen as a sophisticated form of mode specific design (cf Dillman et al 2009)

I. Method Maximization
Optimize each method individually as far as possible
If one method has an extra use itRationale
Reduces overall errorBest of all possible worlds
AssumptionSame concept is measured in both modes but with different accuracy onlyDifferences between methods only affect random error! (no systematic bias)

Reliability and ValidityImagine an English County Fair and ….
Variance vs Bias or Systematic ErrorVariance vs Bias or Systematic Error

Low vs. High Reliability

Low vs. High Validity

Method Maximization continued
Optimize each method individuallyBeware of Assumptions:
Differences between methods only affect random error!M1: T+e1 e1≠ e2
M2: T+e2 e1,e2 randomBut is this feasible?How about systematic error, bias?
Danger of question format effectsExample: check al that apply vs.. yes/noExample: offer all response categories vs unfolding
Burden of proof on designer

II. Unified Mode DesignTo minimize data integrity problems Dillman (2000) proposes UNI-mode design for all modesUni-mode design. From unified or uniform mode design; designing questions and questionnaires to provide the same stimulusprovide the same stimulus in all survey modes in order to reduce differences in the way respondents respond to the survey questions in the different modes.
Write and present questions the same or almost the sameSame offered stimulus in each mode
How to do this, see Dillman (2000, 2006)

Uni Mode Design continued
Unified or UNI-mode design for All ModesAvoid inadvertently changing the basic question structure across modes in ways that change the stimulus.Make all response options the same across modes and incorporate them into the stem of the survey question.Reduce the number of response categories to achieve mode similarity.
(Dillman 2000, 2006, Chapter 6)

Uni Mode Design cont
Unified or UNI-mode design for all modesUse the same descriptive labels for response categories instead of depending on people’s vision to convey the nature of a scale concept.Develop equivalent instructions for skip patterns that are determined by answers to several widely separated items.Reverse the order in which categories are listed in half the questionnaires to avoid recency/primacy effectsEvaluate interviewer instructions carefully for unintended response effects and consider their use for other modes.
(Dillman 2000,2006, Chapter 6)

Uni Mode Design cont
Dillman, 200, 2006, chapter 6:“Avoid question structures that unfold “
Comment:Comes from paper mail survey-outlook.One can and may unfold in both modes in CAWI-CATI designOr in CAPI-CATI Or in … any mix (but not in a mix with PAPI: paper mail)

Example UNI Mode DesignMail, Telephone and Face-to-face interview
Early attempt De Leeuw 1992, chap 4, p 37http://www.xs4all.nl/~edithl/pubs/disseddl.pdf
Response options the same across modesSame descriptive labels for response categoriesReduced number of response categories
Maximum 7 pushing the limit for phoneBut, used show cards in face-to-face
Equivalent with visual presentation mail
Used simple open questionsInterviewer instructions and instructions in mail questionnaire equivalent

In Sum: Uni-mode Design Designing for Mixed modes
Unified (uni-) mode questions to reduce mode effectsQuestion formatResponse formatInstruction
Uni-mode design for Mixed modes also impliesBesides questionnaire development Questionnaire lay-outImplementation procedures
Meeting the Challenge of Mixed-Mode Surveys
Unified (uni-) mode questions to reduce mode effectsTake it one step further, then designing questionnaire ….Do not think in traditions.
Example 1: RTI-Wine et all, 2006 Use telephone interviewers after training
for web survey help-desk and for reminders

Do Not Think in TraditionsExample
Question about employmentIn CATI split up in two questions
Were you working for either pay or profit during the week of XXX?If ‘no’ follow-up question: Were you not working for any of the following reasons: you were a student on paid work study, you were self-employed and did not get paid that week, you were on vacation from work or travelling while employed, you were on paid sick leave, personal leave or other temporary leave, or you were on a job that did not pay but had other benefitsFollow-up question was to make sure the respondent counted these experiences as employment

Do Not Think in Traditions continued
Question about employmentTo improve understanding CATI split up in two questions
Were you working for either pay or profit during the week of XXX? + follow-up questionFollow-up question was to make sure the respondent counted these experiences as employment
Paper/Web traditionally no follow-up questionPaper/Web often incorporate the definition of employed in an instruction
But people do not read instructions and definitions carefullyFollow-up questions perhaps be better solution?

Meeting the Challenge of Mixed-Mode Surveys 2
Step:1 unified (uni-) mode questions to reduce mode effects
Step 2: Do not think in traditions
Step 3: From unified to an integrated mode design?

III. Generalized Mode Design
From unified (uni) mode design to an integrated, generalized mode design
Generalized mode design.Purposively constructing questions and questionnaires to be different in different modes with the goal of achieving cognitive equivalenceachieving cognitive equivalence of the perceived stimuli, thereby resulting in equivalent answers across modes.The samesame offered stimulus is not necessarily the same perceivedperceived stimulus!

Generalized Mode Design continued
Prerequisites integrated, generalized mode design
Designer understands How differences between modes affect the question-answer process How they affect the way respondents perceive the question, process the information and select and communicate the response
Designer does not think in traditionsBurden on the researcher to demonstrate that
different questions elicit equivalent responses.

Understand What HappensTo reach cognitive equivalence
Check with respondents, because Medium May Change MeaningSame worded question can be perceived differently in different modes
Wording may be adequate in one medium and awkward in another
Example Pierzchala et al, 2003CATI: Are you {name}?Web: Is your name {name}?

Example Generalized Mode Design
Christian, Dillman & Smyth (2005)CATI
When did you start attending WSU, when did you get your degree, etcInterviewer probed for desired format
First Web-design Same question text “When did you start attending WSU” ,“ When was your degree granted”, etcWith write in standard programming: mmyyyy
Too many errors

Example continuedGeneralized Mode Design
In CATIInterviewer probed for desired formatInterviewer is intelligent system
Web Can Be Intelligent System too!Try to emulate interviewer
Christian, Dillman & Smyth (2005)http://survey.sesrc.wsu.edu/dillman/papers/Month%20Year%20Technical%20Report.pdfRedesigned size boxes, graphical language, symbols
Equivalence needed more than the same question wording!

Example continuedGeneralized Mode Design Web Can Be Intelligent System too!
Try to emulate interviewerChristian et al (2005) redesigned size boxes, graphical language, symbols
In stead of
Equivalence needed more than the same question wording

Meeting the Mixed Mode Challenge Needs Investment
Designing for Mixed modesQuestionnaire constructionSampling
Embedding small experiments / mode comparisons
Provide data to estimate mode effectUsing these data for empirically based adjustment
WeightingPropensity score adjustment

Embedded Experiments and/Adjustment
Build in overlap Method 1 Method 2
Group X Main Data Collection
Some Data
Group Y Some Data Main Data Collection

Logistics Mixed Mode Surveys

Why Mixing Modes?Balance Costs & Errors
Coverage
Nonresponse
Sampling
Measurement
CostsCosts

ConsequencesMixed Mode Strategy
Coverage
Sampling
Costs
Nonresponse Measurement
Logistics
Coverage
Nonresponse
Sampling
Costs
Measurement
Logistics

LogisticsNeed for field reports
Not much literatureBut, increasing
E.g., US Bureau of the Census website
Lessons learnedMixed mode studies
Past mode changesInternational studiesSoftware developers
Emerging experienceConference papersE.g., methodological mixed-mode projects UK, Holland, USA

Main Issues In-House ExpertiseCommunication Implementation and Timing Data ProcessingQuality ControlPara informationCost
Many of these issues well-known in International and Comparative Research
See for example CSDI International Workshop on Comparative Survey Design and Implementation &Cross-cultural survey guidelines at http://ccsg.isr.umich.edu/

Total Quality Approach Total survey designDocument informationDisseminate informationInformation on:
Survey process & qualityMethodologies SoftwarePara data

Future“Survey organizations are going to
have to change dramatically in some ways in order to do effective surveys as we bring new technologies online and still use our other technologies where they work”
Dillman, 2000

Mixed Mode Surveys Survey research history of changes
Forced by changes in society and technologyIncreased knowledge
Remember first face-to-face interviewsShort & simple questions Later one of the most flexible methods ☺☺
Mixed mode has many challengesWe will meet those and learn ☺☺ ☺☺ ☺☺

Suggested ReadingsIntroduction Mixed-Mode
Edith D. De Leeuw (2005). To mix or not to mix data collection methods in surveys. JOS, Journal of Official Statistics, 21,2, 233-255 (also available on www.jos.nu)
On quality, data collection, writing questions, online research, mixed-mode, analysis
De Leeuw, Hox & Dillman (2008). International Handbook of survey Methodology. New York: Lawrence Erlbaum/Psychology Press, Taylor and Francis Group

Suggested WebsitesDon A. Dillman’s homepage
http://survey.sesrc.wsu.edu/dillman/Papers
Edith de Leeuw homepagehttp://www.xs4all.nl/~edithl/
Additional material and readings accompanying the International Handbook of survey methodology
University of Michigan-ISR http://ccsg.isr.umich.edu/
Guidelines for best practice in cross-cultural studies
US Bureau of the Censushttp://www.census.gov/srd/mode-guidelines.pdf
Guidelines on developing demographic questions for administration in different modes

Suggested Websites 2Journal of Official Statistics
http://www.jos.nuAll articles that appeared in JOS online available, simple search menu
Survey Practice (AAPOR)http://www.surveypractice.org
Short practical articlesAutumn 2009, theme propensity score adjustment
European Survey Research Associationhttp://www.surveymethodology.eu/journal/
Online journal on survey methodology


![kkt_6_dan_7_pemupukan_2014 [Compatibility Mode]](https://static.fdokumen.com/doc/165x107/6322b43c28c445989105e2db/kkt6dan7pemupukan2014-compatibility-mode.jpg)