A consistency assessment of coupled cohesive zone models for mixed-mode debonding problems
18
R. Dimitri et alii, Frattura ed Integrità Strutturale, 29 (2014) 266-283; DOI: 10.3221/IGF-ESIS.29.23 266 Focussed on: Computational Mechanics and Mechanics of Materials in Italy A consistency assessment of coupled cohesive zone models for mixed-mode debonding problems R. Dimitri, M. Trullo, G. Zavarise Department of Innovation Engineering, University of Salento, Lecce, Italy [email protected], marco.trullo @unisalento.it, [email protected] L. De Lorenzis Institut für Angewandte Mechanik, Technische Universität Braunschweig, Germany [email protected] ABSTRACT. Due to their simplicity, cohesive zone models (CZMs) are very attractive to describe mixed-mode failure and debonding processes of materials and interfaces. Although a large number of coupled CZMs have been proposed, and despite the extensive related literature, little attention has been devoted to ensuring the consistency of these models for mixed-mode conditions, primarily in a thermodynamical sense. A lack of consistency may affect the local or global response of a mechanical system. This contribution deals with the consistency check for some widely used exponential and bilinear mixed-mode CZMs. The coupling effect on stresses and energy dissipation is first investigated and the path-dependance of the mixed-mode debonding work of separation is analitically evaluated. Analytical predictions are also compared with results from numerical implementations, where the interface is described with zero-thickness contact elements. A node-to-segment strategy is here adopted, which incorporates decohesion and contact within a unified framework. A new thermodynamically consistent mixed-mode CZ model based on a reformulation of the Xu-Needleman model as modified by van den Bosch et al. is finally proposed and derived by applying the Coleman and Noll procedure in accordance with the second law of thermodynamics. The model holds monolithically for loading and unloading processes, as well as for decohesion and contact, and its performance is demonstrated through suitable examples. KEYWORDS. Cohesive zone modeling; Contact; Debonding; Thermodynamics. INTRODUCTION ohesive zone models (CZMs) as proposed by Dugdale [1] and Barenblatt [2], have been widely used in the last decades as numerical tool to study mixed-mode delamination, debonding, and more generally, crack propagation and/or initiation at material interfaces or within quasi-brittle materials. This is due to the computational efficiency of these models and their versatility for numerical implementation in many areas of Computational Mechanics. Despite the large number of cohesive models proposed, little attention has been devoted to ensuring their consistency for mixed-mode conditions, primarily in a thermodynamical sense, whereas the relative performance of different models has rarely been the subject of a comparative assessment. For many of these models, traction-separation laws have been C
Transcript of A consistency assessment of coupled cohesive zone models for mixed-mode debonding problems

R. Dimitri et alii, Frattura ed Integrità Strutturale, 29 (2014) 266-283; DOI: 10.3221/IGF-ESIS.29.23
266
Focussed on: Computational Mechanics and Mechanics of Materials in Italy
A consistency assessment of coupled cohesive zone models for mixed-mode debonding problems R. Dimitri, M. Trullo, G. Zavarise Department of Innovation Engineering, University of Salento, Lecce, Italy [email protected], marco.trullo @unisalento.it, [email protected] L. De Lorenzis Institut für Angewandte Mechanik, Technische Universität Braunschweig, Germany [email protected]
ABSTRACT. Due to their simplicity, cohesive zone models (CZMs) are very attractive to describe mixed-mode failure and debonding processes of materials and interfaces. Although a large number of coupled CZMs have been proposed, and despite the extensive related literature, little attention has been devoted to ensuring the consistency of these models for mixed-mode conditions, primarily in a thermodynamical sense. A lack of consistency may affect the local or global response of a mechanical system. This contribution deals with the consistency check for some widely used exponential and bilinear mixed-mode CZMs. The coupling effect on stresses and energy dissipation is first investigated and the path-dependance of the mixed-mode debonding work of separation is analitically evaluated. Analytical predictions are also compared with results from numerical implementations, where the interface is described with zero-thickness contact elements. A node-to-segment strategy is here adopted, which incorporates decohesion and contact within a unified framework. A new thermodynamically consistent mixed-mode CZ model based on a reformulation of the Xu-Needleman model as modified by van den Bosch et al. is finally proposed and derived by applying the Coleman and Noll procedure in accordance with the second law of thermodynamics. The model holds monolithically for loading and unloading processes, as well as for decohesion and contact, and its performance is demonstrated through suitable examples. KEYWORDS. Cohesive zone modeling; Contact; Debonding; Thermodynamics.
INTRODUCTION
ohesive zone models (CZMs) as proposed by Dugdale [1] and Barenblatt [2], have been widely used in the last decades as numerical tool to study mixed-mode delamination, debonding, and more generally, crack propagation and/or initiation at material interfaces or within quasi-brittle materials. This is due to the computational efficiency
of these models and their versatility for numerical implementation in many areas of Computational Mechanics. Despite the large number of cohesive models proposed, little attention has been devoted to ensuring their consistency for mixed-mode conditions, primarily in a thermodynamical sense, whereas the relative performance of different models has rarely been the subject of a comparative assessment. For many of these models, traction-separation laws have been
C

R. Dimitri et alii, Frattura ed Integrità Strutturale, 29 (2014) 266-283; DOI: 10.3221/IGF-ESIS.29.23
267
directly postulated in an ad hoc manner, which may lead to unphysical dissipation behavior. A comparative assessment of pure-mode CZMs can be found, for example, in [3-6] who investigated the influence of the shape of pure-mode relationships on the macroscopic mechanical response of material systems. A consistency check was performed by van den Bosch et al. [7] for the exponential model by Xu and Needleman [8], which was shown to describe unrealistically the mixed mode decohesion unless the energy release rates of both modes were assumed to be equal. This assumption, however, is not generally realistic, as already observed experimentally. Thereby, an adjusted non-potential-based exponential model was proposed through a modification of the coupling between normal and shear modes, to correct the unphysical behavioral features of the original model in the description of mixed-mode decohesion. However, several other mixed-mode models frequently used in numerical applications have never been analyzed in a similar fashion. A parametric analysis on the effect of the coupling parameters on stress distributions and energy dissipation can be useful to evaluate possible physical inconsistencies of a model, such as local abnormalities in the coupled elastic or softening mechanical response of the interface, incomplete dissipation of the fracture energy during decohesion, residual load-carrying capacity in normal or tangential traction after complete failure, etc. Advantages and/or shortcomings of each cohesive model, if explicitly assessed, may also justify the adoption of one model or another for numerical implementations. In this paper we analyze the improved Xu and Needleman (XN) mixed-mode exponential model proposed by [7], a model recently proposed by McGarry et al. [9], as well as two widely used linear mixed-mode CZMs (Högberg [10], Camanho et al. [11]). The basic question is whether these models realistically predict a mixed-mode debonding process, and whether they are consistent in both stress and energy terms. A parametric analysis on the effect of the coupling parameters on stress distributions and energy dissipation is performed in order to evaluate physical inconsistencies. Analytical predictions are also compared with results of numerical finite element models, where the interface is described with zero-thickness contact elements. A node-to-segment strategy incorporating decohesion and contact within a unified framework is here adopted [12]. A simple patch test is analyzed for the numerical prediction of mixed-mode interface debonding. The formulations are implemented and tested using the finite element code FEAP. In the second part of the paper, a new thermodynamically consistent mixed-mode CZM is proposed based on a modification of the XN improved model [8] proposed by van den Bosch [7]. Based on a predefined Helmoltz energy, the interface model is derived by applying the Coleman and Noll procedure, in accordance with the second law of thermodynamics, whereby the inelastic nature of the decohesion process is accounted for by means of damage variables. The model accounts monolithically for loading and unloading conditions, as well as for decohesion and contact. In order to verify the computational implementation, simple modes I and II are first introduced and mixed-mode tests are then employed to examine the fracture process under mixed-mode conditions. In the last case, a simple patch test and a matrix-fiber debonding test are provided as computational examples. STATE OF THE ART REVIEW - COHESIVE ZONE MODELS
his section describes the mixed-mode coupled cohesive laws chosen for the analytical and numerical comparative investigation. As already mentioned, tractions in the normal and tangential directions are linked to each other by means of a coupling parameter and/or an effective opening displacement. Traction and shear relate the normal
and the tangential stresses, pN and pT respectively, with both the relative normal and tangential displacements, gN and gT, whereas the main parameters defining the traction-separation laws affect the initiation and steady-state propagation behavior. We start our study analyzing the improved XN exponential model [7] (henceforth denoted as CZM1), which has been already verified to be physically consistent, and herein considered as benchmark law for our comparative assessments between CZMs. This model is not derived from a potential and coincides with the original model in [8] only when the ratio between the tangential and the normal work of separation, denoted as q, is equal to one, with independent scaling factors applied to the normal and tangential equations to account for differences in the mode I and mode II interface strengths. The analytical expression of the interfacial stresses in the normal and tangential directions can be written in the following form
2
2max max max max
exp(1) exp expN N N T
N N N T
p g g g
p g g g
(1)
T
R. Dimitri et alii, Frattura ed Integrità Strutturale, 29 (2014) 266-283; DOI: 10.3221/IGF-ESIS.29.23
268
2
2max max max max max
2exp(1) 1 exp expN NT T T
T T N N T
g gp g g
p g g g g
(2)
where gNmax and gTmax are the normal and tangential displacements corresponding to the normal and tangential cohesive
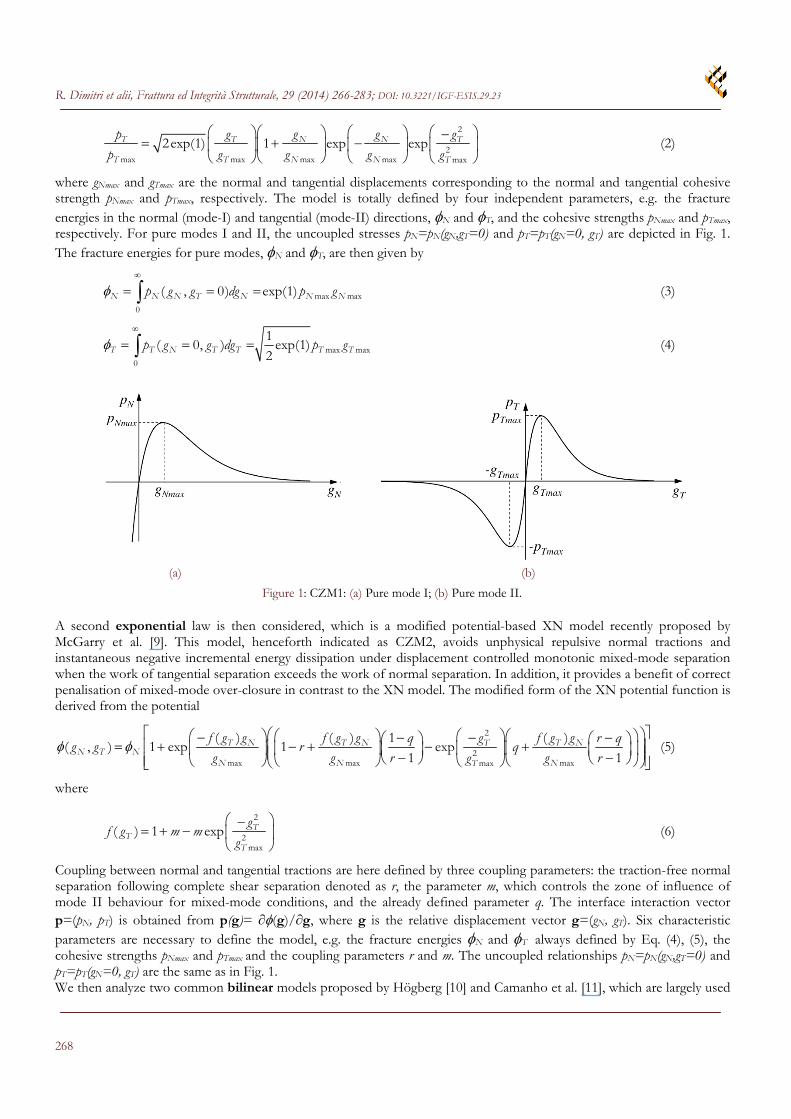
strength pNmax and pTmax, respectively. The model is totally defined by four independent parameters, e.g. the fracture energies in the normal (mode-I) and tangential (mode-II) directions, N and T, and the cohesive strengths pNmax and pTmax, respectively. For pure modes I and II, the uncoupled stresses pN=pN(gN,gT=0)
and pT=pT(gN=0, gT)
are depicted in Fig. 1.
The fracture energies for pure modes, N and T, are then given by
max max
0
( , 0) exp(1)N N N T N N Np g g dg p g
(3)
max max
0
1( 0, ) exp(1)
2T T N T T T Tp g g dg p g
(4)
(a) (b)
Figure 1: CZM1: (a) Pure mode I; (b) Pure mode II.
A second exponential law is then considered, which is a modified potential-based XN model recently proposed by McGarry et al. [9]. This model, henceforth indicated as CZM2, avoids unphysical repulsive normal tractions and instantaneous negative incremental energy dissipation under displacement controlled monotonic mixed-mode separation when the work of tangential separation exceeds the work of normal separation. In addition, it provides a benefit of correct penalisation of mixed-mode over-closure in contrast to the XN model. The modified form of the XN potential function is derived from the potential
2
2max max maxmax
( ) ( ) ( )1( , ) 1 exp 1 exp
1 1T N T N T NT
N T NN N NT
f g g f g g f g gq g r qg g r q
g g r g rg
(5)
where
2
2max
( ) 1 exp TT
T
gf g m m
g
(6)
Coupling between normal and tangential tractions are here defined by three coupling parameters: the traction-free normal separation following complete shear separation denoted as r, the parameter m, which controls the zone of influence of mode II behaviour for mixed-mode conditions, and the already defined parameter q. The interface interaction vector p=(pN, pT) is obtained from p(g)= ∂(g)/∂g, where g is the relative displacement vector g=(gN, gT). Six characteristic parameters are necessary to define the model, e.g. the fracture energies N and T always defined by Eq. (4), (5), the cohesive strengths pNmax and pTmax and the coupling parameters r and m. The uncoupled relationships pN=pN(gN,gT=0)
and
pT=pT(gN=0, gT) are the same as in Fig. 1.
We then analyze two common bilinear models proposed by Högberg [10] and Camanho et al. [11], which are largely used

R. Dimitri et alii, Frattura ed Integrità Strutturale, 29 (2014) 266-283; DOI: 10.3221/IGF-ESIS.29.23
269
for various applications in the literature for debonding problems. The cohesive law proposed in [10], herein indicated as CZM3, is not derived from a potential and is characterized by an effective opening displacement as coupling parameter defined as
2 2
1N T
Nu Tu
g g
g g
(7)
gNu, and gTu being the critical separations in mode I and II, after which the stresses are equal to zero, i.e. the surfaces are not locally held together. This cohesive law is defined by six characteristic parameters of the interface, i.e. the fracture energies, N and T , the cohesive strengths pNmax and pTmax, and their corresponding displacements gNmax and gTmax. The analytical laws in both directions can be expressed as follows
max
10
11
1
NP
P NuN
NNP
P Nu
gfor
gpgp forg
(8)
max
10
11
1
TP
P TuT
TTP
P Tu
gfor
gpgp forg
(9)
where P is the effective opening displacement at which the softening behavior of the interface begins, and is given by
2 2 2 2
max max
N NT TP
Nu Tu N T
g gg gg g g g
(10)
The fracture energies for pure modes I and II are computed as
max0 0
1( )
2
Nug
N N N N N NugT
p g dg p g
(11)
max0 0
1( )
2
Tug
T T T T T TugN
p g dg p g
(12)
whereas the uncoupled stresses in pure modes are depicted in Fig. 2.
(a) (b)
Figure 2: CZMs 3 and 4: (a) Pure mode I; (b) Pure mode II. . The last analyzed model is the bilinear cohesive law proposed by Camanho et al. [11], denoted as CZM4. This model is

R. Dimitri et alii, Frattura ed Integrità Strutturale, 29 (2014) 266-283; DOI: 10.3221/IGF-ESIS.29.23
270
not derived from a potential and is characterized by a mixed-mode relative displacement gm expressed as
2 2m N Tg g g
(13)
and a mode mixity ratio =gT/gN. Single-mode loading conditions are again given by Fig. 2 and defined as
max
max(1 )
0
i i i i
i i i i i i iu
i iu
K g for g g
p d K g for g g g
for g g
(14)
with
max
max
( ), , ; [0,1]
( )iu i i
i ii iu i
g g gd i N T d
g g g
(15)
and Ki as the initial stiffnesses in modes I or II, used to hold the top and bottom faces of the debonding interfaces together in the linear elastic range. In order to avoid interpenetration of the crack surfaces, the following condition is also considered in mode I under compression
, 0N N N Np K g g
(16)
The mixed-mode relative displacement corresponding to the onset of softening is computed as
2
max max 2 2 2,max max max
max
10
0
N T Nm N T
T N
g g for gg g g
g for g
(17)
according to a quadratic failure criterion of the type
2 2
max max
1N T
N T
p p
p p
(18)
while the debonding propagation under mixed-mode loading is predicted by applying the power law (PL) criterion [13] or the Benzeggagh and Kenane (BK) criterion [14] defined in terms of the mode-I and mode-II work of separation WN, and WT, and fracture energies N and T. The expressions for the two criteria are given respectively as follows
1N T
N T
W W
(19)
for the first criterion, with as a constant material-dependent parameter, and
withTN T N N T
WW W W
W
(20)
for the second criterion, with as the mixed-mode fracture energy, and as a parameter obtained experimentally for varying materials and mixed-mode ratios. Based on Eq. (19) or (20), the ultimate value of the mixed-mode relative displacement is expressed as
1/2 2
.,max
2(1 ) N Tm u
m N T
K Kg
g
(21)
R. Dimitri et alii, Frattura ed Integrità Strutturale, 29 (2014) 266-283; DOI: 10.3221/IGF-ESIS.29.23
271
or alternatively as
2 2
2 2. ,max
2(1 )0
( )
0
TN T N N
m u N T m N T
Tu N
Kfor g
g K K g K K
g for g
(22)
Seven independent parameters describe the model, e.g. the fracture energies N and T, the cohesive strengths pNmax and pTmax, the relative separations gNmax and gTmax, and the material parameters or depending on the debonding criterion chosen for propagation. ANALYTICAL ASSESSMENT OF THE COUPLING EFFECTS
his section analyzes the mixed-mode debonding behaviour as predicted by the aforementioned coupled CZMs. A detailed assessment of the influence of the coupling on stresses and energy dissipation is performed to more deeply understand the performance of each model. As mentioned earlier, an adequate coupling between the
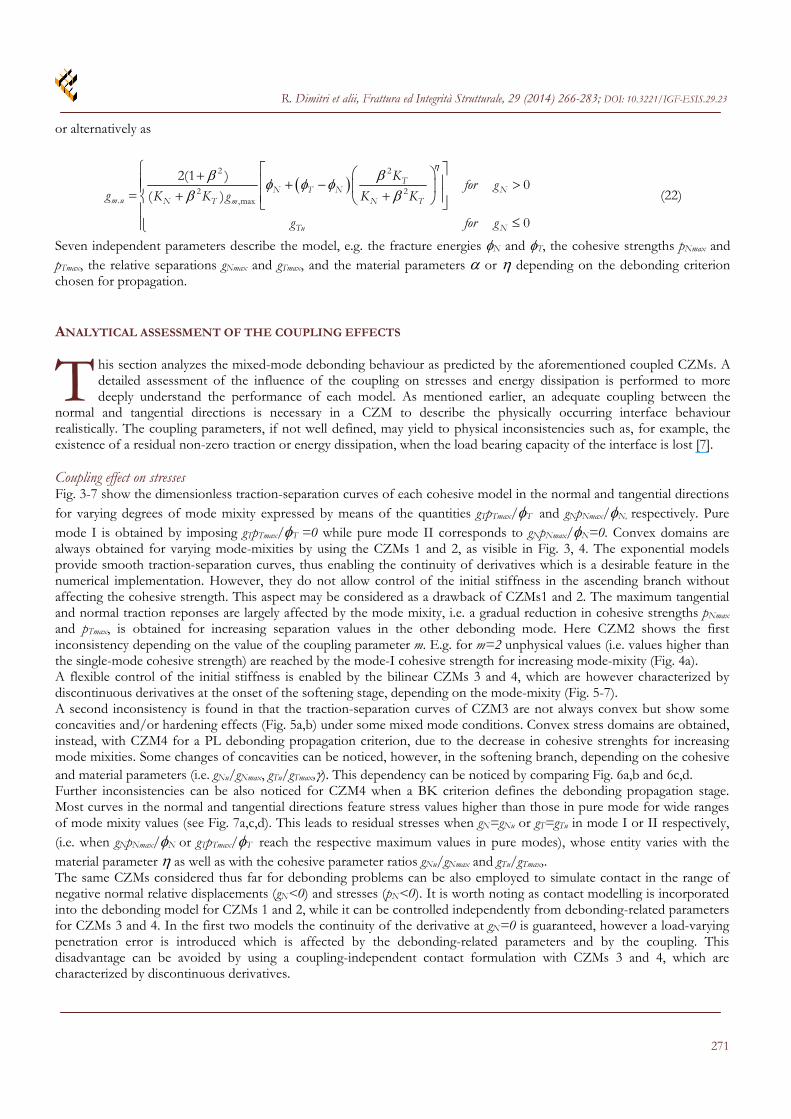
normal and tangential directions is necessary in a CZM to describe the physically occurring interface behaviour realistically. The coupling parameters, if not well defined, may yield to physical inconsistencies such as, for example, the existence of a residual non-zero traction or energy dissipation, when the load bearing capacity of the interface is lost [7]. Coupling effect on stresses Fig. 3-7 show the dimensionless traction-separation curves of each cohesive model in the normal and tangential directions for varying degrees of mode mixity expressed by means of the quantities gTpTmax/T and gNpNmax/N, respectively. Pure mode I is obtained by imposing gTpTmax/T =0 while pure mode II corresponds to gNpNmax/N=0. Convex domains are always obtained for varying mode-mixities by using the CZMs 1 and 2, as visible in Fig. 3, 4. The exponential models provide smooth traction-separation curves, thus enabling the continuity of derivatives which is a desirable feature in the numerical implementation. However, they do not allow control of the initial stiffness in the ascending branch without affecting the cohesive strength. This aspect may be considered as a drawback of CZMs1 and 2. The maximum tangential and normal traction reponses are largely affected by the mode mixity, i.e. a gradual reduction in cohesive strengths pNmax and pTmax, is obtained for increasing separation values in the other debonding mode. Here CZM2 shows the first inconsistency depending on the value of the coupling parameter m. E.g. for m=2 unphysical values (i.e. values higher than the single-mode cohesive strength) are reached by the mode-I cohesive strength for increasing mode-mixity (Fig. 4a). A flexible control of the initial stiffness is enabled by the bilinear CZMs 3 and 4, which are however characterized by discontinuous derivatives at the onset of the softening stage, depending on the mode-mixity (Fig. 5-7). A second inconsistency is found in that the traction-separation curves of CZM3 are not always convex but show some concavities and/or hardening effects (Fig. 5a,b) under some mixed mode conditions. Convex stress domains are obtained, instead, with CZM4 for a PL debonding propagation criterion, due to the decrease in cohesive strenghts for increasing mode mixities. Some changes of concavities can be noticed, however, in the softening branch, depending on the cohesive and material parameters (i.e. gNu/gNmax, gTu/gTmax,). This dependency can be noticed by comparing Fig. 6a,b and 6c,d. Further inconsistencies can be also noticed for CZM4 when a BK criterion defines the debonding propagation stage. Most curves in the normal and tangential directions feature stress values higher than those in pure mode for wide ranges of mode mixity values (see Fig. 7a,c,d). This leads to residual stresses when gN=gNu or gT=gTu in mode I or II respectively, (i.e. when gNpNmax/N or gTpTmax/T reach the respective maximum values in pure modes), whose entity varies with the material parameter as well as with the cohesive parameter ratios gNu/gNmax and gTu/gTmax,. The same CZMs considered thus far for debonding problems can be also employed to simulate contact in the range of negative normal relative displacements (gN<0) and stresses (pN<0). It is worth noting as contact modelling is incorporated into the debonding model for CZMs 1 and 2, while it can be controlled independently from debonding-related parameters for CZMs 3 and 4. In the first two models the continuity of the derivative at gN=0 is guaranteed, however a load-varying penetration error is introduced which is affected by the debonding-related parameters and by the coupling. This disadvantage can be avoided by using a coupling-independent contact formulation with CZMs 3 and 4, which are characterized by discontinuous derivatives.
T

R. Dimitri et alii, Frattura ed Integrità Strutturale, 29 (2014) 266-283; DOI: 10.3221/IGF-ESIS.29.23
272
(a) (b)
Figure 3: Coupling effect on stresses for CZM 1: (a) Normal direction; (b) Tangential direction.
(a) (b)
Figure 4: Coupling effect on stresses for CZM 2. m=2, q=0.5, r=0: (a) Normal direction; (b) Tangential direction.
(a) (b)
Figure 5: Coupling effect on stresses for CZM 3. gNu/gNmax=2exp(1) for pure mode I, gTu/gTmax=2√exp(1) for pure mode II: : (a) Normal direction; (b) Tangential direction.
R. Dimitri et alii, Frattura ed Integrità Strutturale, 29 (2014) 266-283; DOI: 10.3221/IGF-ESIS.29.23
273
(a) Normal direction (b) Tangential direction
(c) Normal direction (d) Tangential direction
Figure 6: Coupling effect on stresses for CZM 4, PL criterion:. gNu/gNmax=2exp(1), gTu/gTmax=2√exp(1) for pure modes I and II (a), (b); gNu/gNmax=exp(1), gTu/gTmax=√exp(1) for pure modes I and II (c), (d). =0.5.
(a) Normal direction (b) Tangential direction
(c) Normal direction (d) Tangential direction
Figure 7: Coupling effect on stresses for CZM 4, BK criterion:. gNu/gNmax=2exp(1), gTu/gTmax=2√exp(1) for pure modes I and II (a), (b); gNu/gNmax=exp(1), gTu/gTmax=√exp(1) for pure modes I and II (c), (d). =1.75.

R. Dimitri et alii, Frattura ed Integrità Strutturale, 29 (2014) 266-283; DOI: 10.3221/IGF-ESIS.29.23
274
Coupling effect on energy dissipation The behaviour of the coupled CZMs is now studied by analyzing the normal, the tangential and the total work of separation, WN, WT, and W, respectively, for different loading paths. A similar evaluation was performed by van den Bosch [7] when evaluating the consistency of the exponential model by Xu and Needleman [8]. Two non-proportional loading paths are taken into account. In path 1, the interface is first loaded in the normal direction up to a maximum normal displacement g*N, and subsequently is loaded in the tangential direction up to total failure (Fig. 8a). Conversely, in path 2, the interface is first loaded in the tangential direction up to g*T, and then completely broken in the normal direction (Fig. 8b). In each case, the total work-of-separation is computed as
( , ) ( , )N T N N T N T N T TW W W p g g dg p g g dg
(23)
where is the selected separation path.
(a) (b)
Figure 8: Loading paths for debonding process: (a) Path 1; (b) Path 2.
Analytical predictions are also compared with finite element results, as described in detail in the following Section. In the analytical and numerical studies, all the models are assumed to be characterized by the same fracture energy, cohesive strength, and peak relative displacement in both directions. Three examples are here analyzed for different combinations of fracture energies (i.e. N<T, N=T, N>T), whereas the fracture energies are set to 100 N/m or 200 N/m. The cohesive strength is arbitrarily set to 6N/mm2 in both directions, but it does not affect significantly the behaviour of CZMs, as often emphasized in the literature. The values of gNmax and gTmax in CZMs 3,4 are such that the secant stiffness at the peak defined by CZM 1 is maintained constant. This means that gNmax=0.006mm, gTmax=0.020mm when N =100N/m, T=200N/m; gNmax=0.006mm, gTmax=0.010mm when N =T=100N/m; gNmax=0.012mm, gTmax=0.010mm when N =200N/m, T=100N/m. Within the CZM4, a coupling parameter =0.5 or =1.75 is assumed for debonding propagations dictated by a PL- or BK-criterion, respectively. These values agree with results of experimental investigations on composite materials [11]. Example 1 (N<T) The normal, the tangential and the total work of separation as computed analytically by means of each model under non-proportional loading paths are shown in Fig. 9,10, along with the respective numerical results. When the CZM1 is applied, the limiting cases (failure in pure modes I and II) are consistently captured for each loading path and the transition in between is smooth and monotonic, as expected due to the corrections already applied by van den Bosch et al. [7] (Fig. 9a, 10a). For non-proportional path 1, this means that W=WT=T when g*N=0 (i.e. the loading is completely driven by shear), and W=WN=N when g*N tends to an infinite value (i.e. when the loading is completely driven by normal separation). A monotonic decrease of W from T to N is correctly observed for intermediate values of g*N (Fig. 9a). Conversely, for path 2, W=WN=N when g*T=0 and W=WT=T when g*T tends to an infinite value, while W smoothly increases from T to N for intermediate values (Fig. 10a). By repeating the same analytical investigation for CZMs 2, 3, and 4, some unphysical results can be observed under some mixed-mode loading conditions. The pure-mode cases are consistently captured by the three models but the transition is not always smooth and monotonic (see Fig. 9c, 10c for CZM3, and Fig. 9d, 10d for CZM4-PL criterion), whereas monotonic variations of W are obtained for CZM2 under path 1 (Fig. 9b), as well as for CZM4-BK criterion under paths 1,2 (Fig. 9e and 10e). For CZM2 with path 2, WN changes from N to zero with increasing values of g*T from zero up to a certain value *T , while WT monotonically increases from zero to T for the same values of g*T (Fig. 10b). As a result, W is constant for g*T values up to *T and afterwards follows the pure tangential contribution.

R. Dimitri et alii, Frattura ed Integrità Strutturale, 29 (2014) 266-283; DOI: 10.3221/IGF-ESIS.29.23
275
(a) (b) (c)
(d) (e)
Figure 9: Work of separation under non proportional Path 1 (N<T): (a) CZM1; (b) CZM2; (c) CZM3; (d) CZM4-PL criterion; (e) CZM4-BK criterion.
(a) (b) (c)
(d) (e)
Figure 10: Work of separation under non proportional Path 2 (N<T): (a) CZM1; (b) CZM2; (c) CZM3; (d) CZM4-PL criterion; (e) CZM4-BK criterion. Example 2 (N=T) In the second example the same value for N and T is assumed, as usually considered in the literature when there is a lack of experimental evidence to do otherwise. The normal, the tangential and the total work of separation as computed by means of each model under non-proportional loading paths 1 and 2 are shown in Fig. 11 and 12, respectively. CZMs 1 and 2 lead to symmetric answers in terms of energy dissipation, which can depend (Fig. 11a, 12a) or not (Fig. 11b, 12b) on the applied loading path. This means that both WN and WT vary by the same quantities for varying values of g*N (path 1),

R. Dimitri et alii, Frattura ed Integrità Strutturale, 29 (2014) 266-283; DOI: 10.3221/IGF-ESIS.29.23
276
or g*T (path 2) for each loading path, while the total work of separation W remains constant. Once again, inconsistent results are achieved for CZMs 3 and 4, due to the non-monotonic transition of W between the limiting cases, as already explained in the previous example (see Fig. 11c and 12c for CZM3, Fig. 11d and 12d for CZM4 with the PL criterion, and Fig. 11e and 12e for CZM4 with the BK criterion).
(a) (b) (c)
(d) (e)
Figure 11: Work of separation under non proportional Path 1 (N=T): (a) CZM1; (b) CZM2; (c) CZM3; (d) CZM4-PL criterion; (e) CZM4-BK criterion.
(a) (b) (c)
(d) (e)
Figure 12: Work of separation under non proportional Path 2 (N=T): (a) CZM1; (b) CZM2; (c) CZM3; (d) CZM4-PL criterion; (e) CZM4-BK criterion.
R. Dimitri et alii, Frattura ed Integrità Strutturale, 29 (2014) 266-283; DOI: 10.3221/IGF-ESIS.29.23
277
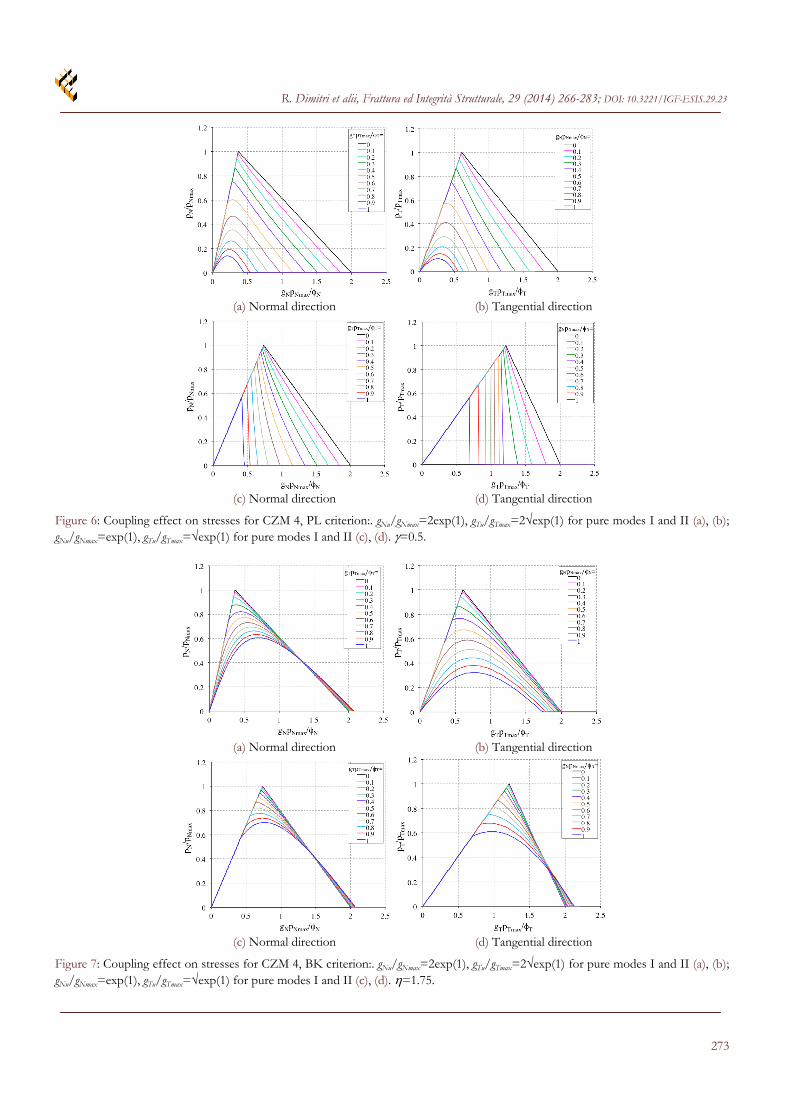
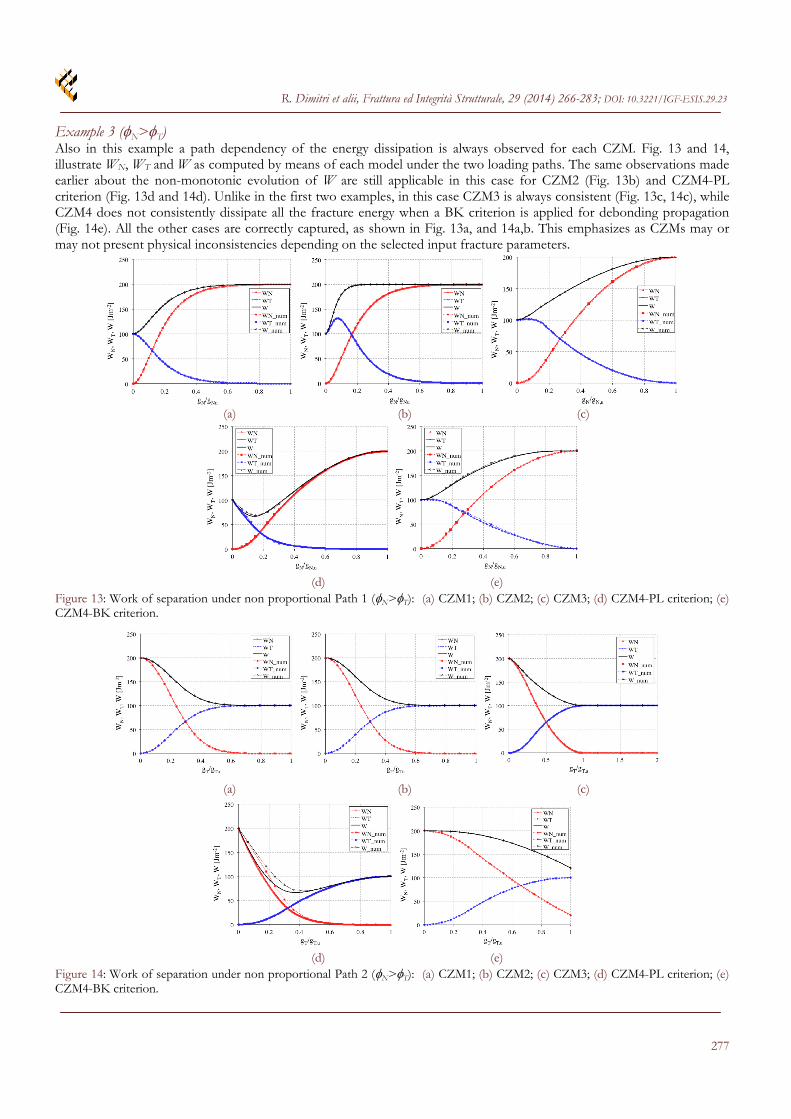
Example 3 (N>T) Also in this example a path dependency of the energy dissipation is always observed for each CZM. Fig. 13 and 14, illustrate WN, WT and W as computed by means of each model under the two loading paths. The same observations made earlier about the non-monotonic evolution of W are still applicable in this case for CZM2 (Fig. 13b) and CZM4-PL criterion (Fig. 13d and 14d). Unlike in the first two examples, in this case CZM3 is always consistent (Fig. 13c, 14c), while CZM4 does not consistently dissipate all the fracture energy when a BK criterion is applied for debonding propagation (Fig. 14e). All the other cases are correctly captured, as shown in Fig. 13a, and 14a,b. This emphasizes as CZMs may or may not present physical inconsistencies depending on the selected input fracture parameters.
(a) (b) (c)
(d) (e)
Figure 13: Work of separation under non proportional Path 1 (N>T): (a) CZM1; (b) CZM2; (c) CZM3; (d) CZM4-PL criterion; (e) CZM4-BK criterion.
(a) (b) (c)
(d) (e)
Figure 14: Work of separation under non proportional Path 2 (N>T): (a) CZM1; (b) CZM2; (c) CZM3; (d) CZM4-PL criterion; (e) CZM4-BK criterion.

R. Dimitri et alii, Frattura ed Integrità Strutturale, 29 (2014) 266-283; DOI: 10.3221/IGF-ESIS.29.23
278
NUMERICAL IMPLEMENTATION
he results illustrated thus far were found analytically. Only the integrals in eq. (23) were computed numerically. This section is devoted to the numerical verification, which is performed through the finite element simulation of a simple mixed-mode debonding problem, i.e. a mixed-mode patch test (see Fig. 15). A 10x10 mm2 plate is pulled
apart by applying uniform vertical and horizontal displacements (v and u) to the top and right sides, respectively, until complete failure. The normal, tangential and total works of separation are evaluated once again for non proportional loading paths 1 and 2, by varying the mixed-mode conditions between pure modes, or equivalently the loading time histories, in terms of u and v. In the numerical model, all the interface laws analytically described in the previous sections have been implemented into a contact element based on the node-to-segment strategy as employed in [12] and generalized to handle cohesive forces in both the normal and tangential directions. Each element contribution for the cohesive/contact forces is added to the global virtual work equation as follows
C N N T TW F g F g (24)
where WC is the interface contribution to the virtual work, and FN and FT denote, respectively, the normal and tangential cohesive/contact force. Plane-stress four-nodes isoparametric elements have been used to model the two adherends which are characterized by an elastic modulus E=150GPa and a Poisson’s ratio =0. The cohesive strengths and fracture energies are the same as in the analytical investigation. The non-linear problem is solved with an iterative Newton-Raphson procedure, where the global tangent stiffness matrix is properly obtained by the consistent linearization of Eq. (24). The discretization is refined appropriately to yield mesh-independent results. The model is implemented in the finite element code FEAP (courtesy of Prof. R.L. Taylor). A good agreement between the analytical and numerical results is always obtained in terms of tangential, normal and total energies, as visible from Fig. 9-14, confirming all the physical inconsistencies previously discussed, and the path dependency of the energy dissipation.
(a) (b) (c)
Figure 15: Geometry of mode I (a), mode II (b) and mixed mode (c) patch test. THERMODYNAMICALLY CONSISTENT REFORMULATION OF THE CZM1 MODEL Fundamentals
s shown in the previous sections, the CZM1 model is the only one not leading to inconsistencies in the behavior of interfaces subjected to mixed-mode loading. This law allows for different values of the fracture energy in the normal and tangential directions, as measured experimentally. However, the law as formulated originally from van
den Bosch et al. [7] is not based on a potential. As shown in [15], non-potential-based models do not satisfy the symmetry requirements for the tangent matrix which has to be verified at least for elastic unloading between interfaces, and introduce independent models for loading and unloading (in fact, unloading was not explicitly dealt with in [7]). The last feature is in contrast with thermodynamical requirements, for which loading and unloading are uniquely defined by means of the same Helmholtz energy [16]. Therefore, belonging to the category of non-potential based laws, CZM1 should be not thermodynamically consistent. In this second part of the paper, a suitable reformulation of the CZM1 is elaborated. Through this reformulation, it is demonstrated that this model is indeed thermodynamically consistent, which also agrees
T
A
R. Dimitri et alii, Frattura ed Integrità Strutturale, 29 (2014) 266-283; DOI: 10.3221/IGF-ESIS.29.23
279
with the findings from the previous analysis. Moreover, the reformulation is convenient for the numerical implementation, as it allows for the introduction of a unique model for loading and unloading, as well as for debonding and contact conditions, which is not possible with the original formulation. In this reformulation, a predefined Helmoltz energy is introduced, and the inelastic nature of the decohesion process is accounted for by means of damage variables. We first assume an additive decomposition of the elastic energy e at the interface into a normal and tangential contributions, i.e.
( ) ( )eN N T Tg g
(25)
where each contribution is associated with one characteristic deformation mode (i.e. with the displacement jump or, equivalently, the gap g in the normal or tangential directions). The material damage is also suitably approximated through a set of scalar-valued damage parameters, where different damage mechanisms are coupled multiplicatively. Accordingly, the total Helmoltz energy of the interface reads
1 1 ( ) 1 1 ( )N T N TN N N N T T T Td d g d d g
(26)
where the damage variables [0;1]jid , with i=N,T and j=N,T.
By applying the Coleman and Noll procedure the traction vector T becomes
( ) ( )1 1 1 1N T N TN N T T
N N T Tg g
d d d d
Tg g
(27)
Based on a quadratic assumption for the elastic energies, N and T in Eq. (25) can be expressed as
21( )
2N N N Ng K g
(28a)
21( )
2T T T Tg K g
(28b)
which yields the following equations for the derivatives of the normal and tangential elastic energies
( )N NN N
gK g
n
g (29a)
( )T TT T
gK g
t
g (29b)
The combination of Eq. (27) and (29a, b) gives
1 1 1 1N T N TN N N N T T T Td d K g d d K g T n t
(30)
or equivalently
N Tp p T n t
(31)
From a comparison between Eq. (30) and (31) the normal and tangential tractions are expressed as
1 1N TN N N N Np d d K g
(32a)
1 1N TT T T T Tp d d K g
(32b)
Based on this general formulation, a new thermodynamically consistent version for the improved exponential model [7] can be obtained straightforwardly as follows. From a comparison between Eq. (1), (2) and (32a,b), the evolution of the damage variables in the normal and tangential directions is governed by the following equations
2 2max max
2,N T
N TN T
K Kg g
(33)

R. Dimitri et alii, Frattura ed Integrità Strutturale, 29 (2014) 266-283; DOI: 10.3221/IGF-ESIS.29.23
280
max max max
1 exp , 1 1 expN NN N NN T
N N N
g g gd d
g g g
(34)
2
2max
1 expT TT T
T
gd d
g
(35)
The damage variables given by Eq. (34,35) increase monotonically from zero, in the undamaged case, up to 1, which corresponds to the fully damaged case. By imposing that the damage variables are non-decreasing, loading and unloading are automatically dealt with monolithically. A further problem is the monolithic handling of decohesion and contact. With the damage approach, an unloading path in the shear or normal direction follows the secant stiffness to the origin of the traction-separation diagram in its associated mode. If the same damage variable was kept under normal compression, the contact penalty stiffness would continuously decrease as the degree of damage under decohesion increases, so that high (and thus unacceptable) interpenetrations would be allowed in the normal direction under contact. Therefore, the Helmoltz energy is decomposed to distinguish between energy contributions from decohesion and closure of crack surfaces, as follows
1 1 1 1N T N T
N N N N T T Td d d d (36)
where
21
2N N NK g (37)
221
2N P N NK g g (38)
and T always given by Eq. (28b). KN in the last two equations refers to the undamaged stiffness of the spring for gN>0, while KP is the penalty stiffness for gN<0. The degradation acts only on the separation part N such that the resistance to the crack closure is maintained during interface failure. Based on the modified Helmoltz energy, the normal pressure becomes
1 1N TN N N N N P N Np d d K g K g g (39)
while pT is always defined by Eq. (32b). Numerical implementation and results In the numerical finite element model, the thermodynamically consistent cohesive law illustrated above has been implemented into a generalized contact element based on the node-to-segment strategy illustrated earlier. Two numerical examples are presented hereafter to demonstrate the performance of the improved exponential cohesive algorithm: a patch test, and a matrix-fiber debonding test.
- Patch test As first example, we reconsider the patch test of Fig. 15, which is verified in pure modes I, II, and different mode-mixities. A 10x10 mm2 plate is elongated and compressed at the top and the right sides up to fixed values of horizontal and vertical displacements u and v, respectively, which are then applied in opposite directions during unloading and reversed again during reloading until complete failure. Reference values of 0.05 mm are considered for horizontal and vertical displacements in pure modes I and II, while proportional values between horizontal and vertical displacement components are differently considered for varying mode mixities. An elastic isotropic behaviour is assumed for the plate, with material properties E=200GPa and =0. Different cohesive strenghts pNmax, pTmax, are assumed in the normal and tangential directions, equal to 0.1N/mm2 and 0.233N/mm2 respectively, whereas KN=pNmax/gNmax=100N/mm3 and KT=pTmax/gTmax=233N/mm3 corresponding to maximum separations in the normal and tangential directions gNmax=gTmax=10e-3mm. The plate is discretized with 4-node isoparametric plane stress elements, and the cohesive/contact elements are introduced along the diagonal direction. Fig. 16a shows the interfacial normal stresses pN as a function of the

R. Dimitri et alii, Frattura ed Integrità Strutturale, 29 (2014) 266-283; DOI: 10.3221/IGF-ESIS.29.23
281
relative normal displacement gN for mode I, where the specimen is first loaded while following the exponential law up to a value pN=0.9N/mm2, then linearly unloaded and then reloaded along the secant stiffness to the origin for displacements values ranging between 0.0006mm and 0.0022mm, then unloaded again along the secant stiffenss, continuing in the compressive regime up to gN=-0.0002mm along the virgin stiffness. The specimen is finally reloaded up to the complete failure conditions. Local pressures in mode II and varying mixed-modes (i.e. varying u/v ratios) are evaluated in a similar fashion for which a complete cycle of loading, unloading up to compression, and reloading up to failure is globally considered (see Fig. 16b,c,d). As also shown in the traction-separation curves of Fig. 16a,b, the maximum normal and tangential tractions pNmax and pTmax are correspondingly attained at the characteristic separations gNmax and gTmax, whereas a clear reduction in pure-mode interface strengths is visible in Fig. 16c,d due to the non-zero separation history value in the other debonding mode.
(a) (b)
(c) (d)
Figure 16: Computational results in mode I (a), mode II (b) and mixed mode (c, d).
- Matrix-fiber mixed debonding The second example considers a matrix-fiber debonding process caused by transverse loads under the assumption of plane stress. The problem geometry is reduced in the plane perpendicular to the fiber axis, to a circular fiber with radius a surrounded by a matrix perfectly bonded along its interface, see Fig. 17a. Both matrix and fiber are assumed to be linear elastic materials, with material properties Ef=5GPa, f=0 for the fiber, and Em=500MPa, m=0.25 for the matrix. The fiber volume fraction f is associated with the unit cell size b and the radius of the fiber a. A regular packing is considered with a high volumetric fiber content equal to 78.5% leading to b/a=2, see the geometry modeled in the FEM simulation in Fig. 17a. The fiber-matrix interface debonding is modeled by the mixed exponential CZM describing the nonlinear behaviour of the interface, in terms of normal and tangential cohesive tractions (pN, pT), where the adjectives normal and tangential refer to the local axes of the curvilinear reference system along the interface. Correspondingly, a normal and tangential relative separation gN and gT are admitted. The cohesive parameters are the same as in the previous example. Horizontal displacements are imposed on the vertical boundaries of the unit square cell as shown in Fig. 17, and the homogenized stress-strain response is numerically computed. The average stress is determined as the sum of the horizontal reactions divided by the length of the vertical cell side b, while the average strain is evaluated as the imposed relative displacement 2u divided by the original length of the horizontal side of the cell b. Fig. 17b shows the deformed mesh at the last time step, along with the contours of the shear stress, as well as the local and the global reactions, whereas the stress-strain history curve is reported in Fig. 18. In the initial loading phase, the fiber and matrix are perfectly bonded throughout the

R. Dimitri et alii, Frattura ed Integrità Strutturale, 29 (2014) 266-283; DOI: 10.3221/IGF-ESIS.29.23
282
interface and the slope of the curve corresponds to the stiffness of the whole domain (matrix+fiber). Soon thereafter debonding starts taking place, leading to a strongly nonlinear behaviour. This is associated to the progressive decohesion of the interface leading to two separate debonding regions, which are symmetric with respect to the x2-axis as shown in Fig. 17b. A gradual unloading is then applied by reversing the boundary displacements with a subsequent behaviour returning to linearity along the secant stiffness to the origin (for gN>0), and the virgin tangent stiffness to the origin (for gN<0). A further reloading is finally applied until complete failure between the fiber and the surrounding matrix. In the final steps a linear behaviour is observed but the stiffness corresponds to that of the matrix alone, now fully detached from the fiber.
(a) (b)
Figure 17: Computational scheme (a) and numerical stresses (b).
Figure 18: Homogenized stress-strain curves.
CONCLUSIONS
his paper presents a consistency check for some widely used exponential and bilinear mixed-mode CZMs. A parametric analysis on the effect of the coupling parameters on stress distributions and energy dissipation is performed in order to evaluate physical inconsistencies in the coupled elastic or softening mechanical response of
the interface. The path-dependence of the mixed-mode debonding work of separation is additionally evaluated. Analytical predictions are also compared with results from numerical finite element models, where the interface is described with zero-thickness contact elements based on the node-to-segment strategy. The analyses reveal that all models, except for the XN model as modified by van den Bosch et al., present energetic inconsistencies due to incomplete dissipations or nonmonotonic variations of the total work of separation. The XN model modified by van den Bosch, on the other hand, is not derived from a potential and therefore, in the current formulation, presents the drawbacks that loading and
T

R. Dimitri et alii, Frattura ed Integrità Strutturale, 29 (2014) 266-283; DOI: 10.3221/IGF-ESIS.29.23
283
unloading are defined independently. Actually, neither unloading nor the transition to the contact regime were tackled in the original presentation of the model [7]. Moreover, it is not clear whether thermodynamical consistency can be formally proved. Thus, in the second part of the paper, a reformulated and improved version of the model is presented in a rigorous thermodynamical framework. Based on a predefined Helmoltz energy, the interface model is derived by applying the Coleman and Noll procedure, in accordance with the second law of thermodynamics, whereby the inelastic nature of the decohesion process is accounted for by means of damage variables. The model accounts monolithically for loading and unloading conditions, as well as for decohesion and contact. Its performance is demonstrated through suitable examples such as the diagonal patch test, and the matrix/fiber debonding test under mixed-mode conditions. ACKNOWLEDGEMENTS
he authors have received funding for this research from the European Research Council under the European Union’s Seventh Framework Programme (FP7/2007-2013), ERC Starting Researcher Grant “INTERFACES”, G.A. n° 279439.
REFERENCES [1] Dugdale, D.S., Yielding of Steel Sheets Containing Slits, J. Mech. Phys. Solids., 8 (1960) 100–104. [2] Barenblatt, GI., The formation of equilibrium cracks during brittle fracture. General ideas and hypotheses. Axially-
symmetric cracks, J. Appl. Math. Mech. (PMM), 23(3) (1959) 622–36. [3] Chandra, N., Li, H., Shel, C., Ghonem H., Some issues in the application of cohesive zone models for metal–ceramic
interfaces, Int. J. Solids Struct., 39(10) (2002) 2827–55. [4] Volokh, KY., Comparison between cohesive zone models, Commun. Numer. Methods Eng., 20 (2002) 845-856. [5] Alfano, G., On the influence of the interface law on the application of cohesive-zone models, Compos. Sci. Technol.,
66 (2006) 723-730. [6] Alfano, M., Furgiuele, F., Leonardi, A., Maletta, C., Paulino, G. H., Mode I fracture of adhesive joints using tailored
cohesive zone models, Int. J. Fract., 157 (2009) 193–204. [7] van den Bosch, M.J., Schreurs, P.J.G., Geers M.G.D., An improved description of the exponential Xu and
Needleman cohesive zone law for mixed-mode decohesion, Eng. Fract. Mech., 73 (2006) 1220–1234. [8] Xu, X.P., Needleman, A., Void nucleation by inclusions debonding in a crystal matrix, Model. Simul. Mater. Sc.
Engng., 1 (1993) 111–132. [9] McGarry, J.P., Máirtín, É.Ó., Parry, G., Beltz, G.E., Potential-based and non-potential-based cohesive zone
formulations under mixed-mode separation and over-closure. Part I: Theoretical analysis, J. Mech. Phys. Solids, 63 (2014) 336–362.
[10] Högberg, J.L., Mixed mode cohesive law, Int. J. Fract., 141 (2006) 549–559. [11] Camanho, P.P., Dàvila, C.G., De Moura, M.F., Numerical simulation of mixed-mode progressive delamination in
composite materials, J. Compos. Mater., 37(16) (2003) 1415–1438. [12] Wriggers, P., Zavarise, G., Zohdi, T.I., A computational study of interfacial debonding damage in fibrous composite
materials, Comput. Mater. Sci., 12 (1998) 39–56. [13] Wu, E.M., Reuter, Jr. R.C., Crack Extension in Fiberglass Reinforced Plastics, T. & AM Report No. 275, University of
Illinois (1965). [14] Benzeggagh, M.L., Kenane, M., Measurement of Mixed-Mode Delamination Fracture Toughness of Unidirectional
Glass/Epoxy Composites With Mixed-Mode Bending Apparatus, Compos Sci Technol, 56 (1996) 439–449. [15] Mosler, J., Scheider, I., A thermodynamically and variationally consistent class of damage-type cohesive models. J.
Mech. Phys. Solids, 59 (2011) 1647–1668. [16] Simo, J.C., Numerical analysis of classical plasticity. In: Ciarlet, P.G., Lions, J.J. (Eds.), Handbook for Numerical
Analysis, Elsevier, Amsterdam, 4 (1998).
T