Effect of curing time on shear strength of cohesive soils ...
Upload
khangminh22Category
view
1download
0
Information 3
Evaluatian of shear strength in cohesive soils with special reference
to Swedish practice and experience
ROLF LARSSON
ULF BERGDAHL
LEIF ERIKSSON
STATENS GEOTEKNISKA INSTITUT
EVALUATlON OF SHEAR STRENGTH IN COHE8shyIVE SOILS WITH SPECIAL REFERENCE TO SWEshyDISH PRACTICE AND EXPERIENCE
In this publication information is given on how different test results and empirical experience can be weighted and combined to give the best possible estimation of the shear strength propershyties in cohesive soils
The procedure described has evolved during the continuing work at SGI as research results and practical experience from the Institute as weil as others have been obtained and taken into conshysideration
The publication describes how the Institute curshyrently proceeds in the evaluation of shear strength in cohesive soils The intention has aiso been to bring about a more unified and objective proceshydure t han that has been used up to now
Valuable views on this work have been given by colleagues in and outside the Institute
Linkoumlping November 1984
Rolf Larsson Ulf Bergdahl Leif Eriksson
CONTENTS
INTRODUCTION 2
AND SLIGHTLY OVERCONSOLIDATED SOILS
obtained by vane shear tests and fall cone tests
of Hansbos relation
basis of results from other soundings
basis of laboratory tests and empirical relashytions for undrained shear strength
consolidation
DEFINITIONs AND SYMBOLS 3
UNDRAINED SHEAR STRENGTH IN NORMALLY CONSOLIDATED 4
eorrection of values of undrained shear strength 4
Estimatian of shear strength values on the basis 5
Estimatian of corrected shear strengths on the 6
Estimatian of corrected shear strengths on the 6
Selection of undrained shear strength 8
Estimatian of increase in shear strength at 8
SHEAR STRENGTH IN DRY CRUST OVEReONSOLIDATED CLAY AND IN 9 CONNECTION WITH LAYERS WITH HIGH PORE W ATER PRESSURES
VALUES OF SHEAR STRENGTH OBTAINED BY VANE SHEAR TESTS AND F ALL CONE TESTS
failures in the field
values obtained by vane shear tests and fall cone tests
recommended correction
DRAINED SHEAR STRENGTH 9
CHOICE OF DRAINED OR UNDRAINED SHEAR STRENGTH 10
EXAMPLE 10
REFERENCES 19
APPENDIX BACKGROUND TO THE NEW RECOMMENDATION FOR CORRECTION OF 21
Introduction 22
Historical development up to 1969 22
SGI correction factors of 1969 23
Bjerrums correction factors 23
Later studies of correction factors 23
Results from research on vane shear tests 25
Empirical relations for undrained shear strength 27
earrelations between empirical relations and full scale 29
earrelations between empirical relations and shear strength 29
eompilation of results and comparison with the new 30
l
INTRODUCTION
In Sweden calculation of stability in cohesive soil is mainly based on shear strength values determishyned by vane shear tests or fall cone tests These values of shear strength have to be corrected beshyfore they are used in calculations An engineershying judgement must also be made as to the relshyevancy of these corrected strengths to the parshyticular case
An empirical knowledge of how the shear strength varies with plasticity preconsolidation pressure and overconsolidation ratio has evolved from reshysults from other types of tests such as triaxial tests and direct shear tests
A new sounding method the combined cone penshyetration test and pore pressure sounding (CPTVshytest) has also come into use This method gives a good picture of stratigraphy and variation in shear strength although it cannot yet be conshysidered to give good enough numerical values of the shear strength
In this publication a recommendation is given for how the shear strength values obtained by vane shear tests and fall cone tests should be corshyrected Guidance is also given for how other test results empirical knowledge and results from soundings can be incorporated in the engineering evaluation of real shear strength
The recommendation for correction of shear strength values obtained by vane shear tests and fall cone tests given here does not involve any larger differences in the end result campared to the old SGI recommendation from 1969 The new procedure however is more precise and objecshytive
The recommendation and the guidelines are mainshyly based on experience of Scandinavian soils and cannot be applied directly to soils from other geoshylogical regions
Part of the historical development and research that has led to the present recommendation and the empirical relations that are used is presented in an appendix
2
DEFINITIONs AND SYMBOLS
c CRS-test
FB k
J a c
a
T
T f u Tfd TACTIVE
shear strength parameter oedometer test with eonstant rate of strain calculated factor of safety at failure eonstant point resistance in cone penetration tests time to failure reference time liquid limit (wL in equations is given in decimal numbers) coefficient increase in preconsolidation pressure increase in undrained shear strength shear strength parameter correction factor for shear strength values obtained by vane shear tests and fall cone tests existing overburden pressure effective normal stress preconsolidation pressure existing effective overburden pressure shear stress uncorrected value of shear strength obtained by vane shear test uncorrected value of shear strength obtained by fall cone test undrained sh ear strength drained shear strength undrained shear strength at active shear
TDIRECT SHEAR undrained shear strength at direct shear TPASSIVE undrained shear strength at passive shear TeR mobilized shearstress in passive triaxial tests at
a deformation corresponding to the deformation at failure in active triaxial tests average undrained shear strengthTAVERAGE (TACTIVE + TDIRECT SHEAR +T PASSIVE)3 ~VERAGE from laboratory tests value of shear strength obtained by vane shear test with a waiting time of 5 minutes between installation and start of the test value of shear strength obtained by vane shear test with a waiting time of 24 hours between installation and start of the test value of shear strength obtained by vane shear test with standard rate of rotation value of shear strength obtained by vane shear test with a rate of rotation giving the time to failure
3
UNDRAINED SHEAR STRENGTH IN NORMALL Y CONSOLIDATED AND SLIGHTLY OVERCONSOLIDATED SOILS
Correction of values of undrained shear strength obtained by vane shear tests and fall cone tests
The correction that was previously recomshymended by SGI dated 1969 and consequently did not include the research results obtained during the last 15 years 1t implied a pre shytreatment of the measured values which was subjective and also differed from what is customary in other countries
New building codes new methods for statisshytical treatment of measured data and also the need for compilation and comparison of experiences demand a uniform treatment of the measured data This also calls for an according actjustment of SGPs correction factors 1t is therefore now recommended that s hear strength values obtained by vane shear tests and fall cone tests be corrected with respect to the liquid limit of the soil in accordance with
TfU= JA bull Ty
TfU =JAbull Tk
where T f u= undrained shear strength l1 = correction factor Tv = shear strength value
obtained by vane shear test
Tk = shear strength value obshytained by fall cone test
13 l
l l
12
s__ 11
l
0 o l-u 1Olt( LL
z 09o l shy
u ~ w 0
08 0 o u 07 ~
K IL
The correction factor l1 is a function of the liquid limit w1 and can be calculated from
043 045 JA = (- l - ) l ~o 5
WL l
or taken from Fig l
w1 in the equation is expressed as a decishymal number
Correction factors higher than 12 ought not to be used without supporting evidence from complementary investigations
Each shear strength value ought to be corshyrected using a correction factor calculated from the appropriate liquid limit For corshyrection of a shear strength value obtained by vane shear test a determination of the liquid limit at the same point is thus norshymally required
The corrected shear strengths are then plotshyted as a shear strength profile versus depth In slopes created by erosion the strengths are normally plotted versus elevation An engineering evaluation of the corrected strengths considering all other known proshyperties of the soil is then made After evenshy
~06 l--1----r- shy05
o 20 40 60 80 100 120 140 160 180 200 LIQUID LIMIT wl
Fig 1 Recommended coJUte mon 6actoJL nOfL 6 hecuz 6Vl eng-th vatuu o b-tained bf vane 6hecuz -tuu oL t)att con e -tut
4
tual exclusion supplementation or modifi shycation of values considered erroneous on the basis of the following guidelines avershyages of the corrected shear strengths are then used in the caleulations
The correction factors are based on arithshymetic averages of measured shear strength values and consequently arithmetic averages of corrected shear strengths must be used when more than one shear strength value from the same level is taken into considershyation
In cases where only a few determinations of shear strength have been made this deshyficiency should be accounted for by the reshyquired calculated factor of safety
Estimatian of shear strength values on the basis of Hansbos relation
The correction factors are mainly derived from comparisons between averages of measured shear strength values and mobilishyzed shear stress at failure in full scale fail shyures in the field Comparisons of averages of shear strength values obtained by vane shear tests and fall cone tests in relation to averages of shear strength values from direct shear tests and active and passive triaxial tests have been used as compshylements These comparisons have naturally resulted in a certain spread and the correcshytion factors represent averages
A condition for these correction factors to give shear strengths of use is that the vane shear test and the fall cone test give results
10
e 08 bull
bullbull o obull
o C) o
o o
02 o
20 40 60 80 100 120 140
which are normal for the type of soil in question The typical result in normally conshysolidated and slightly overconsolidated Scandinavian soils is that the shear strength values obtained by vane shear tests and fall cone tests mainly follow Hansbos relation
Tvk =oc middot 045 wL (Hansbo 1957)
where Tv= uncorrected shear strength
value from vane shear tests
Tk = uncorrected shear strength value from fall cone test
ac = preconsolidation pressure
WL = liquid limit
A compilation of a number of shear strength values obtained by vane shear tests in Scanshydinavian soils is shown in relation to preconshysolidatian pressure and liquid limit in Fig 2
As can be observed in the figure the spread is considerable In the figure a number of cases where the shear strength values obshytained by the vane shear tests have been unusually high or low have been specially marked In these cases the recommended correction factors have also proved to be too high or too low respectively
As a simple estimation in this way can be made of the reasonableness of the shear strength values a comparison with Hansbos relation ought to be made If the shear strength value is unusually high there is a great risk that it must be reduced more than
o o
o
o
o
160 180 200 220 240 260 280 300 wl
bull Lower correction factor than usual Higher correction factor than usual
Fig z The JL elat_on Tv o M a )uncAA_on o) uquid tbnit )oL a numbeJL o) s~andinavian ~o~
5
the general correction factor specifies and if it is unusually low supplementary invesshytigations will probably give higher values of the shear strength
No further conclusions can be drawn and the empirical relation can never replace real tests
Estimatian of corrected shear strengths on the basis of results from other soundings
The use of vane shear tests and fall cone tests invalves certain probleJYls which may effect the measured values of shear strength In undisturbed sampling a stratishygraphy with a stiffer layer overlying softer soil often entails that the samples in the upper part of the soft soil become disturbed This problem almost always occurs at the lower boundary of the dry crust but can here be avoided by preboring through the crust Varying stiffness at greater depths is more difficult to handle which is often reflected in the results from fall cone tests Sampling invalves an unloading and redistribution of stresses in the samples which also affects the results from fall cone tests Based on experience shear strength values measured in samples from greater depths than 10 to 15 m e tres are t hus often too low
Disturbance effects at the transition from stiffer to softer soil also occur in vane shear tests When a vane apparatus type SGI with a casing for the vane is used this disturbance is confined to the first test level below the stiffer layer In very layered or varved soil a conutinous disturbance may occur When a vane apparatus without casing is used the risk of disturbance is greater as soil from an overlying stiffer layer may stick to the vane and all of the underlying softer clay profile may then be disturbed at the installation of the vane
Occurrence of dense layers of silt and other strata may in some cases give too high values of shear strength In other cases with for example layers of loose silt the shear strength values may be too lo w
For estimation of the reasonableness of the corrected shear strengths support may therefore have to be sought from other observations and empirical relations
An important complement is the combined cone penetration test and pore pressure sounding The equipments for this type of testing used in Sweden today are too coarse for a direct evaluation of the shear strength Besides there is no generally accepted
method for evaluation yet The development is promising though and some conclusions can be drawn from the test results From the curves it can be seen whether the stiffness of the soil increases decreases or is eonstant with depth It can also be seen whether there are any layers From the point resistance it can be observed whether the layers are stiff or loose and from the pore pressure it can often be concluded what kind of soil the layers contain
If low shear strength values are thus obtained from vane shear tests andor fall con e tests a t a certain level and a lo os e layer is detected at the same level by cone penetration testing the existence of the layer can be considered confirmed If the cone penetration test does not register any loose layer at the level the existence of a layer is more doubtful and if the test results show that an overlying stiffer layer has just been passed disturbance is often a probable explanation for the low shear strength values Low values of shear strength can also be measured in connection with silt layers with high pore water pressures especially in vane shear tests
Estimation of corrected shear strengths on the basis of laboratory tests and empirical relations for undrained shear strength
In order to obtain a broader basis for the estimation of the reasonableness of correcshyted values of undrained shear strength from vane shear tests and fall cone tests earrelations can be made with empirical relations between undrained shear strength preconsolidation pressure and liquid lim i t if necessary after supplementary more qualified laboratory tests Effects of anisotropy cause these relations to vary with loading case The loading cases are normally divided into active shear direct shear and passive shear These cases can be simulated in the laboratory in active triaxial tests direct shear tests and passive triaxial tests Fig 3
Compilations of test results from Scandinashyvian inorganic clays have given empirical relations for the way in which the undrained shear strength in the different cases varies with preconsolidation pressure and liquid limit Fig 4 A corresponding empirical relation for arganie clays is not yet at hand
The undrained shear strength that should be campared to the corrected shear strength values from vane shear tests and fall cone tests is the shear strength at direct shear in a harizontal slip surface This relations
see Fig 196
The effects of anisotropy are largest in low plastic clays and in these clays large differences in evaluated undrained shear strength may occur depending on whether anisotropy is considered or not (Fig 4)
l--0shy
Passive zone Zone of d irect Active zone Passive shear Act i ve triaxial test Direct shear test triaxial test
Fg 3 vvUon on toac)_ng cagtegt and JLUevance on taboJLatotLIJ tuu to c()_ n n eJLent toac()_ng Cagt egt
( ACTIVE
( AVERAGE
031-----------------r---------~- ( DIRECT SHEAR
( PASSIVE
0+---~---4---+---~----0 25 50 75 100
LIQUID LIMITwl
Fg 4 Emp~cat JLUation6 between pLecon6oudation pLeJgtOUJLe and undLuned oheaJL otJLength noJL Scanc)_navan nshyOJLgaMc daljO
gives shear strength values which are diretly applicable to calculations of slope stability where the inclination of the slip surface is small and which gives results that are someshywhat on the safe side when applied to steeper slip surfaces In calculations of stability of embankments on harizontal ground the average shear strength (TA VERA GE) should preferably be used but campared with the difference the shear strength a t dire c t sh ear is small
Active triaxial tests generally give the highshyest value of undrained shear strength but these values are applicable only to zones with active shear Passive triaxial tests give the lowest values and these may be relevant in cases with passive shear
For estimation of the shear strength the preconsolidatian pressure o cmust be known This value is normally determined by oedometer tests
In for example investigations of the stability conditions in larger areas a general picture of the preconsolidation in the whole area can often be obtained by performing a number of oedometer tests and by linking the evaluated preconsolidation pressures to the geological history of the area This is especially valuable in areas with such stratigraphies that vane shear testing as well as fall cone testing invalves problems
If no oedometer tests have been performed the empirical relations in Fig 4 can be used tagether with the existing effective overburden pressure A lower boundary value of the undrained shear strength is hereby obtained In this procedure however the risk of nonhydrostatic pore water pressures must be considered when the existing effective overburden pressure is estimated
There is of course a certain spread in the empirical relations for undrained shear strength and the relations can never substitute for other tests but only be complementary to them A special case where the empirical relations may overestimate the shear strength is in low plastic and highly sensitive clays In these soils however vane shear tests and fall cone tests give low values of shear strength and low values of point resistance are also registered in cone penetration tests In such cases the low values ought to be used and the empirical values should be disregarded A lower boundary value of Tfu ~ 012oc may be considered though Undrained shear strengths lower than this value have not as far as known been found for Scandinavian soils in either direct shear tests in laboratory or by back calculation of full scale failures in the field (Liquefaction as well as thawing of frozen masses is disregarded)
7
Selection of undrained shear strength This increase in shear strength can be
When the undrained shear strength to be used in calculation is selected an estimate has as described above to be made as to the reasonableness and the relevancy of the measured shear strengths and the applicabil shyity of the empirical relations whereupon obviously erroneous or irrelevant values can be eliminated Thereafter the remaining values can be weighted and combined into an undrained shear strength t hat can be used in the calculations
In this evaluation the corrected values from vane shear tests are very weighty uniess they significantly deviate from Hansbos relation Corrected values from fall cone tests are also often considered relevant with the same limitation In samples taken at greater depths than 10 to 15 metres the shear strength values from fall cone tests often are too low Results from qualified laboratory tests are of very great weight provided that they are relevant to the particular loading case Empirical relations between shear strength and preconsolidation pressure can be used to support and supplement determinations of the shear strength Results from cone penetration tests can so far only be used to study the trend for shear strength evolution with depth and to evaluate the occurrence of layers
Estimatian of increase in shear strength at consolidatian
When normally consolidated clay is loaded and consolidates the preconsolidation pressshyure and thereby the undrained shear strength increase The increase in shear strength can be assumed to follow the increase in preconsolidation pressure in accordance with relations determined by tests or by empirical relations LTfu =kmiddotLo c where k depends on the loading case (See Fig 4)
utilized in stage construction where the load is applied in steps with intervals for consolidatian as well as in old constructions where the increase in strength beneath the construction can be utilized when these are to be added or enlarged
Direct measurement of this increase of shear strength often involves difficulties as well as expense Holes have to be made through the construction and the shear strengths vary laterally if the construction has a limited width A simplified way to estimate the increase of shear strength below for example an old road embankment is to make the assumption that the shear strength increase is confined to the extent of the embankment and that the increase follows the empirical relations Fig 5 In this context it should be considered that the change in preconsolidation pressure is different in different parts below the embankment The increase in vertical stress 6acxz should be calculated according to theory of elasticity Purthermare it must be confirmed that the loading really has brought a change in preconsolidation pressure that is that the soil has Consolidated for the load increase
As criterion of consolidatian of the soil observations showing that the settlements have stopped can be used Alternatively pore pressure measurements can be made In this case the pore pressures should be measured in the middle of the layers where an increase of the preconsolidation pressure is expected
The empirical relations are valid only for inorganic soils and if the same procedure is to be used in organic soils the relations between undrained shear strength and preconsolidation pressure must be determined by laboratory tests for the particular case
( _ 1 DIRECT SHEAR a 11 fu- bull 11 Cxz oc
Fig 5 Simpunied utimaUon on inCJLealle in oheCUL oblength due to conooudaUon betow an embankment
8
SHEAR STRENGTH IN DRY CRUST OVERCONSOLIDATED CLAY AND IN CONNECTION WITH LAYERS WITH HIGH PORE WATER PRESSURES
The undrained shear strength is often regarded as a eonstant although tests have shown that it decreases when the effective pressure decreases and the overconsolidation ratio increases (eg Ladd et al 1977)
However when the shear strength is selected the drained shear strength also has to be considered When the latter becomes lower than the undrained shear strength it also becomes the strength that should be used in caleulations except in a very short time aspect Drained shear strength becomes lower than the undrained shear strength at an overconsolidation ratio of about 2 At this overconsolidation ratio the decrease in undrained shear strength in relation to the normally Consolidated state is small The decrease in shear strength with increasing overconsolidation ratio thus normally becomes of limited interest Fig 6
DRAINED SHEAR STRENGTH
The drained shear strength fd is expressed c1by the shear strength parameters and ltJ 1
in such a way that T f d = C1 + 0 1 tan ltJ 1 where
0 1 is the effective stress perpendieular to the shear surface As a lower boundary value for drained shear strength in overconsolidated soils the shear strength parameters C1 = O and ltJ 1 = 30 o can be used provided that the undrained shear strength is not hereby exceeded These values can be used for dry crust and overconsolidated clays whereby the influence of eraeks and fissures is taken into account They can also be used for silt at stress changes which cause a decrease in effective stresses in the silt eg at increasing pore pressures in silt layers In calculations of stability of natural slopes the shear strength in the cracked dry crust in the active zone is assumed to be zero In unfissured overconsolidated clay the shear strength parameters c1 = 003 dc and ltJ 1 = 30deg may be used
The values given above have been selected with caution If comprehensive testing has indicated other values the test values may naturally be used
The angle of frietian in coarser soils is selected from test results or on the basis of particle size distribution and relative density from Table l
9
04 Undroined silear stre th u
02
~Drained shear strength (td
0~----------~r----r----r-------
0 02 04 o6 oe 10 el o~ l 1 l l l l l Overconsalishy
oo 50 25 20 15 125 10 dation Ratio
Fig 6 VaUation in oheaJt otflength wdh ovVLconooudation tratio at ditrect oheaJt
TABLE 7 Apptroximate vatueo 6otr angte o6 6triction in coheoionteoo ooil
Re l a t i ve Type of soil densit
Silt Sand Grave l Sandy G ra ve l- Maea-Rock t i 11 ly t i 11 dam f i 11
Loo se 26deg 28deg 30deg 35deg 38deg 30deg 40deg Den se 33deg 35deg 3]0 42deg 45deg 38deg 45deg
Relative density for natural soils is normally estimated from results from sounding (eg SGI Information 2)
In loose silt the undrained shear strength must also be considered This shear strength is normally determined by vane shear tests and the relevancy of the corrected must be estimated as described above
CHOICE OF DRAINED OR UNDRAINED SHEAR STRENGTH
Consideration to the overconsolidation ratio is automatically taken at the choice of shear strength if a combined analysis is made (see SGI Report No 19) In other cases the nundrained shear strengthn in the undrained analysis must be modified by a manual comparison between drained and undrained shear strength in the different parts along the shear surface and selection of the lowest strength for each part In this comparison the effective stress state existing after a change in the leading situation should be considered This nundrainedn analysis should also be controHed by a completely drained analysis
EXAMPLE
As an example a section in a larger investigation of slope stability along the river Norsaumllven has been chosen Section IX drawing Nos 8 and 9 The soil consists of a 3 to 5 m thick layer of silt and sand which covers a varved clay with frequent silt layers The layer of varved clay extends to great depths
In the section the following have been performed undisturbed sampling with standard piston sampler sampling with auger vane shear tests weight sounding static penetration testing cone penetration testing pore pressure sounding and pore pressure measurements The investigations are thus fairly comprehensive As it was known already that the stability of the area was poor and that the investigations due to the stratigraphy of the soil would involve some difficulties the field investigations have been performed with special care and most of the different ways of estimating the shear strength have been used In addition to the routine tests a large number of oedometer tests have been performed in order to establish the preconsolidation in various parts of the section
Geologically the ground surface in the section was probably originally mainly horizontal The river has then eroded downwards so that the bottom of the river is now 13 metres below the surrounding ground surface
In Connection with the erosion the ground water level which was originally close to the ground surface has been lowered so that at the time of the measurements it was situated just above the lower boundary of the silt and sand layer The lowest seasonal ground water level will probably be at this boundary This general picture is supported by the results from the oedometer tests Figs 7 and 8 The general picture is further supported by the results from the other sections in the investigation
Fig 7 shows the test results from point 00615 in Section IX The preconsolidation pressures from the oedometer tests show a certain spread which can be expected considering the difficulties in taking undisturbed samples in such a stratigraphy The general trend supports the assumption of a soil normally consolidated for a ground water level at the lower boundary of the silt and sand layer In the figur e the corrected values of undrained shear strength obtained by vane shear tests and fall cone tests are shown together with empirical shear strengths The latter are based on the curve for the variation of preconsolidation pressure with depth and measured liquid limits The relation for the case of direct shear has been used The trend for shear strength variation obtained by cone penetration testing is also shown The shear strengths from vane shear tests and fall cone tests are equal down to a depth of 13 metres from where the fall cone values consistently become lower than the values from vane shear tests The shear strength values indicate a weaker layer at the +34 m to +35 m level but a comparison with the cone penetration test the static penetration test and the pore pressure sounding shows that this is probably an effect of passing a stiffer silt layer at the +35 m level so that the +35 m to +34 m layer has become disturbed There is nothing in the other soil parameters such as sensitivity or liquidity index that indicates anything special at this level Like the trend obtained from cone penetration testing the shear strengths obtained by vane shear tests increase from the +38 m level and downwards The results show a certain spread at greater depths but when the empirical shear strength values are added a considerably broader basis is obtained for the evaluation of the undrained shear strength
lO
The evaluated undrained shear strength is thus mainly based on the corrected shear strength values from vane shear tests The empirical shear strengths and the results from the cone penetration test are used to support the trend in shear strength development versus depth and to even out the spread in the corrected shear strength values from the vane shear tests
In Fig 8 the corresponding results from point -0036 are shown This point is situated close to the middle of the river At this point only weight sounding and standard piston sampling have been performed The results from the oedometer tests have been compared to maximum previous overburden pressure with the assumption that the soilprofile originally was identical to that of the surrounding ground The comparison shows that the soil is normally consolidated for a ground surface level with the surrounding ground surface and a ground water level about 2 m below this ground surface This is in good agreement with the results from the rest of the area
The figure shows the corrected shear strength values from fall cone tests and the empirical shear strength for direct shear from preconsolidation pressures and liquid limits The two sets of shear strength values are close down to a depth of l O m below the river bottom Below this level the values from fall cone tests consistently become lower As there is nothig special in terms of sensitivity or other properties or comparisons with the results from vane shear tests at point 0009 indicates that any weaker layers the empirical shear strengths are considered as most relevant
Due to the erosion the upper layers of the clay are heavily overconsolidated A comparison between the undrained shear strength and the empirically estimated drained shear strength shows that the drained shear strength is lower than the undrained down to a depth of about 6 metres below the river bottom
The evaluated 11real11 shear strength to be used in the stability calculations for this point thus differs somewhat from the results of the only direct determinations of shear strength that have been made here In the upper layers the shear strength is estimated to be lower than the undrained shear strength determined by fall cone tests due
to the overconsolidation ratio and at great depths it is estimated to be higher than the corrected values from fall cone tests due to the effect of stress relief and redistribution at sampling at greater depths That an estimated shear strength higher than the measured values from fall cone tests may be used at this point without supporting investigations is due to the comprehensive investigations in the surrounding areas Without this support the presented evaluation could not have been made
11
Vim v v tt tO Kv St n Skr Vim Vim +45
81-07-30
~ ~ ~~~s ~--075050 _o0
Y-11 -
050
l 015
025 l
015 025
o 025 075075 - -shy - 050
075 l
050 +40
l l ~ 075
+35
+30
015
l 025
~1 so l
025
050
------------------------shyVattenkvot bull tf kPo l ore d) 21------o- ~~o o 10 20 30 tO~S middot
L Il L Il
~~ - ~ - -- - V- liJj(rrJ) Il _ l -shyl ~ o bull vmj~lml Il
bull lol ~l vmjLQ)jiQ)f Il ~ vm]Ul Il
- l - vmjU[ll -shy
o
015
~-75
l 050
l 075
l 050
l
l 100
lgt +35
30
~ Vffijl(p) 075
~ r-shy
lt vmjliIKIl]
vmjlill)
~ l
+25
075 050
075 l
middot~n
rshy
6
r-shy
f-shy
r--shy
f
l ~ -
-
Vmjl(fl)
vmjl l l l
vmj l l f l
vmjlllll
-shy + 25
10 20 30 hv020m 05 10 15 20
Sk r ymdensi ~e t 9 tlm5 h o o sa-so
Se nsitivit et St w~_
102030 hv020 m gt
+20 1---100 + 20 10 20
hv020 m
+15 -0076 - 01070 -0060 -0050 -0040 - 0030 -0020 -0010
15 01000
KAR LSTAD KOMMUN STATENS GEOTEKNISKAJ NORSAumlLVEN- STABILITETSUTREDNING INSTITUT
FACK 58101 UNKOPIN G 1 TEL 013middot1 51 00
VAringLBERG SEKTION IX GEOTEKNISK UNDERSOumlKNING13
1100 22 ~ - ~middot0481~1 8-~ -L_________________________ _____________________ _________________________________________ _ _____________________ - ----------------~~------~---------C--------~--~ 1
Q~middot5101 RtRIRf oumlkbull5109 Vb
+50
W 1 0
F===-0-t------middot--middotmiddotmiddot-middot---middotmiddotmiddot-middotmiddot-middotmiddotmiddotmiddotmiddot- shy
GWmiddot L6 57 81 shy 08-28
GW bull L68L 81-0 -2
-middot
middot-shy -
--shy
middot-shy
- ---shy
middot---shy
-shy
-shy-
-shy -
-shy-
-shy
-shy
-~ 81-03- 28
-----shy
GW L811 81-08-28
~ 81- 08 -28
o
---shy
o
o
( kPa ( oredJ
10 2 30shy
l
- ~
l
J -
l
1
- ))
Lo
o 60 00
sensitivitet s
Vatt enkvot bull 20 LO 60 80
j -Mjvx mJM mJM __ mJM mJ M
mjM
mj M
mjM
l v mj LJlj
~ vmjLrni
il vmjl(lljl
vmj LI[j)
l~ u vmjlllllflj l
i vmj l (Jlj)
vmjL
l vmjL mil
~ vmjl
f~
L lmj l (~JJj)
l miUIlXJDil
l
vLIjlf1
vlt rni l l vLIIl j l
vll mil
vLf( fD j )
i 05 ID lS 20
vLIIil
Skrymdensitiet 9 tm3
Kv S t I Sk e Te
--=_
_==
rshy
l ~l
T t b i l~
l l
l ll
l 1 l l l l _-
l ( l l l
l l - ~l
l ~ l
s
Te P
-Te -- 1 (b middotshy-shy l l
Skrf60 Fb
~--shy- MAX IMALT
SKRIVARVAumlROE
h ~~
1--- SPE TSTRYCK
-
--~--------- - middot PORTRYC K
middot-----shy
middotmiddot( ~ MAX UTSLAG
~ 11 mvp
r-shy
l (-shymiddot-shyl
l
L__~~ [
--middotmiddot t= i==l _ ~ y P bull
middotmiddotshy -middot______ ~l
-------------middotl
- -----+---_j MAX UTSLAG 51 mvp
l
-+---shy- middot l - 1shy______~--
l FEL R PAPPER Sshy
M(TIINF ll middot- -~-
-middot -~middot -
+50
+45
40
35
+30
~-~-t--------- -----middot-middot--1 2 3 L s 6 7 8 g
VR
10MPa 05 1 15 2 25 3 35 L L5 5 55 6 65 7 MPa L 8 12 16 20 21 28 32 35 40 tJ 18 52 56 mvp 0
+ 25
P===--(shy--shy-middotshy ---shy 0 N I V~bull3500UTJAumlM NAT PORTRYCK 12 TIM 1~13L1mp middot-shy NIVA+ 2760 l 81-08-25 ) UTJAMNAT PORTRYCK l 14 T IM) = 20 94 mvp
-middotshy
middot vR g 10 MPa
+20
+15 ~------------------------------------------------------------ 01000 0010 0020 01030 0040 0050 0060 01070
+15
l l
KARL5TA D KO MMUN
~ STATENS GEOTEKNISKA
middot INSTITUT NORSAumlLVEN shy 5TABILITETSUTREDNING
15 KG J G HULT GEOTEKNISK UNDERSOumlKNING
l 1bull100
o
+40
E -J LU gt LU J
+30
+20
Section IX
00615
SHEAR STRENGTH l PRECONSOLIDATION PRESSURE
50 100 150 200 kPa
lowest ground water leve l
bull bull bull
bull bull
l Oense layers of silt
bull bull
bull bull
v ttu fall cone corrected u= ( Ow4L3 ) 045 X (fu vane shear test corrected r o t empirical direct shearfu
L tu con e penetration - porepressure sound i ng test as ( = Qc- Oo( evaluated according to Lunne amp Kleven 1982
tu 19 Evaluated shear strength
bull 0~ from CRS- test
F_g 7 Te6t Jte6uLt6 and evaluated oheaJt otJtength at po_nt 0 0675
17
Section IX
-0036 SHEAR STRENGTH l PRECONSOLIDATION PRESSURE
o 50 100 150 200 250 kPa
+50+-~--------~--------~----------~--------~-----------L--
+40
= t E -==- -~ =- ~=-- = ~- = =-7-=~ =----~-==Y~
E -
_J UJ
gt UJ _J
bull+30
bull bull
v n- j
45 ~ v Lfu fall cone corrected jl-=(~43) 0
+20 o Lfu empirical direct shear L bullOC from CRS-test Evaluated shear strength
U g 8 Trut L el uLt6 and evaJuated o heaL otLength at point 0 036
18
REFERENCES
Aas G 1976 Totalspaumlnningsanalyser pnns1pp grunnlag Norske Sivilingenimers Forening Kurs i Jordartsegenskaper - bestemmelse og anvenshydelse Gol 20-225
Aas G Lacasse S Lunne T och Madshus C 1984 In situ testing - new developments Nordiska Geoteknikermoumltet i Linkoumlping 1984
Andreasson L 1974 Foumlrslag till aumlndrade reduktionsshyfaktorer vid reduktion av vingborrbestaumlmd skjuvshyharingllfasthet med ledning av flytgraumlnsvaumlrdet Intern rapport Chalmers Tekniska Houmlgskola lnst foumlr geoteknik
Bergdahl U 1984 Geotekniska undersoumlkningar i faumllt Statens geotekniska institut Information nr 2
Bjerrum L 1972 Embankments on soft ground Proceedings ASCE Speciaity Conference on Performance of Earth and Earth-supported Strucshytures Purdue University Lafayette IN Vol 2 PP 1-54
Bjerrum L 1973 Problems of soil mechanics and construction on soft clays and structurally unstable soils State-of-the-art Report Session 4 Proceedshyings 8th International Conference on Soil Meshychanics and Foundation Engineering Moscow Vol 3 pp 111-159
Cadling L och Odenstad S 1950 The vane borer An apparatus for determining the shear strength of clay soils directly in ground statens geotekshyniska institut Proc No 2
Caldenius C 1938 Naringgra roumln fraringn grundundersoumlkshyningar i Goumlteborg roumlrande fasthetens variation inom lerorna Teknisk Tidskrift V o V 68(12)137-142
Dascal 0 and Tournier JP 1975 Embankments on soft and sensitive cia y foundations ASCE Journal of the Geotechnical Engineering Division 101(GT3A pp 297-314
Fellenius W 1918 Kaj- och jordrasen i Goumlteborg Teknisk Tidskrift V o V 4817-19
Fellenius W 1919 Utredning betraumlffande kajbyggshynader foumlr Trondhjems hamn Teknisk Tidskrift v o v 491-19
Fellenius W 1926 Jordstatiska beraumlkningar med friktion och kohesion foumlr cirkulaumlrcylindriska glidshyytor Kungl Vaumlg- och Vattenbyggarkaringrens 75-aringrsshyskrift
Fellenius W 1927 Erdstatische Berechnung mit Reibung und Kohaumlsion (Adhaumlsion) und unter Anshynahme krieszylindrischerGieitflaumlcken Ernst Berlin
Fellenius W 1929 Jordstatiska beraumlkningar foumlrvertishykal belastning paring horisontal markyta under antashygande av cirkulaumlrcylindriska glidytor Teknisk Tidskrift V o V 5957-63 och 75-80
Fellenius B 1936 Discussion on soil properties Proc 1 st lnt Conf on Soil Mech and Found Engng Cambridge Mass Vol III
Fellenius B 1938 Provbelastning av i lera nedpresshysade jaumlrnroumlr Teknisk Tidskrift 68(1938)10
Flodin N and Broms B 1981 Historical development of civil engineering in soft clay Soft Clay Engng Elsevier Amsterdam Oxford New York
Hansbo S 1957 A new approach to the determinashytion of the shear strength of clay by the fall-cone test statens geotekniska institut Proc No 14
Helenelund KV 1977 Methods for reducing unshydrained shear strength of soft clay statens geotekshyniska institut Rapport No 3
Hultin S 1916 Grusfyllningar foumlr kajbyggnader Bidrag till fraringgan om deras stabilitet Teknisk Tidshyskrift V o V 46(36)292-294
Hultin T 1937 Foumlrsoumlk till bestaumlmning av Goumlteborgsshylerans haringllfasthet Tekn Samfundets Handlingar No 2
Jacobson B 1946 Kortfattat kompendium i geotekshynik Statens geotekniska institut Meddelande No 1
Kallstenius T 1963 studies on clay samplestaken with standard piston sampler statens geotekshyniska institut Proc No 21
Karlsson R and Vi berg L 1967 Ratio ep in relation to liquid limit and plasticity index with special reference to Swedish clays Proceedings Geoshytechnical Conference Oslo Vol 1 pp 43-47
Kjellman W 1942 Vaumlg- och Vattenbyggnadsstyrelshysens geotekniska laboratorium Teknisk Tidskrift v o v 72(8)105-116
Kjellman W 1950 Testing the shear strength of clay in Sweden Geotechnique 2225-232
Ladd CC et al1977 stress-deformation and strength characteristics state-of-the-art report Proc IX ISSFME Tokyo Vol 2
Ladd CC and Foott R 1974 New design procedure for stability of soft clays ASCE Journal of the Geotechnical Engineering Division 100(GT7) pp 763-786
Larsson R 1977 Basic behaviour of Scandinavian soft clays statens geotekniska institut Rapport No 4 Linkoumlping
Larsson R 1980 Undrained s hear strength in stability calculation of embankments and foundations on soft clays Ganadian Geotechnical Journal Vol 17 No4
Larsson R 1982 a Jords egenskaper Statens geoshytekniska institut Information No 1
Larsson R 1982 b Naringgra praktiska konsekvenser av resultaten fraringn forskning i vingsondering Geotekshyniknytt No 3 1982
Larsson R 1983 Slaumlntstabilitetsberaumlkningar i lera Statens geotekniska institut Rapport No 19 Linkoumlping
Olsson J 1925 Kolvborr Ny borrtyp foumlr upptagning av lerprov Teknisk Tidskrift V o V 52(2)13-16
Olsson J 193637 Angaringende (om) inre friktion (och kohesion) i lera Teknisk Tidskrift V o V 66(5)60 och 67(2)21 -23
19
Petterson K E 1916 Kajraset i Goumlteborg den 5 mars 1916 Teknisk Tidskrift V o V 46(52)471-478
Petterson KE 1933 Foumlrbaumlttrad apparat foumlr upptagshyning av lerprov uordprov~ Teknisk Tidskrift V o V 6385-87
Pilot G 1972 Study of five embankment failures on soft soils Proceedings ASCE Speciaity Conshyferenes on Performance of Earth and Earth-supportshyed Structures Purdue University Lafayette IN Vol1 (Part 1) pp 81-99
Skaven-Haug S 1931 Skjaerfasthetsfors0k med leire Norges Statsbaner Meddelande 6(6) pp 101-105
Skempton AW 1948 Vane tests in the alluvial plain of the river Forth Geotechnique 1(2) pp 111-124
Skempton AW 1954 Discussion of the structure of inorganic soil ASCE Proceedings 80 Separate No 478 pp 19-22
Slunga E 1983 On the influence of arganie content ontheshear strength of fine grained soil Vaumlg- och Vattenbyggaren No 78 1983
statens Geotekniska Institut (SGI) 1970 Reducering av skjuvharingllfasthet med avseende paring finlekstal och sulfidhalt Sammandrag av teknisk traumlff 1969-12-11
Statens Jaumlrnvaumlgars Geotekniska Kommission 1914-1922 slutbetaumlnkande statens Jaumlrnvaumlgar stockholm Geotekn iska Meddelanden Nr 2 1922
Svenska Geotekniska Foumlreningens (SGF) Kolvborrshykommitte 1962 Tolkning av fallkonprov paring provshykroppar av lera tagna med standardkolvborr
Torstensson BA 1977 Time dependent effects in the field vane test Proceedings lnt Symp on Soft Clay Bangkok
~ndel E 1900 Om profbelastning paring paringlar med tillaumlmpning deraf paring grundlaumlggningsfoumlrharingllanden i Goumlteborg Tekn Samfundets Handlingar No 7
20
APPENDIX
BACKGROUND TO THE NEW RECOMMENDATION FOR CORRECTION OF VALUES OF SHEAR STRENGTH OBTAINED BY VANE SHEAR TESTS AND FALL CONE TESTS TOGETHER AND TO EMPIRIGAL RELATIONS FOR UNDRAINED SHEAR STRENGTH
21
Introduction
In Sweden undrained shear strength is mainly estimated by fall cone tests and vane shear tests From the values obtained the geotechshynician makes a judgement of what can be reshygarded as safe measured values and these values are then corrected with the SGI corshyrection factors from 1969 These correction factors have now been used for 15 years
Provided that the corrected shear strength is used in the normal way together the appropriate safety factors the procedure works fairly well However the user must be aware of the development that has led to the SGI correction factors and how these are intended to be used
The use of primarily the vane shear test has spread all over the world N e w research reshysults have been obtained and a number of difshyferent correction factors have been suggesshyted To enable a separation of real differenshyces in results and soil properties from differshyences in treatment of the test results the background and prerequisites for correction factors must be taken into account In recent years other types of estimations of the unshydrained shear strength than fall cone tests and vane shear tests have come into use for example cone penetration pore pressure sounding and pressorneter tests in the field and triaxial tests and direct shear tests in the laboratory This is primarily the case abroad but is valid also in Sweden
Statistical methods of estimating the avershyages of results are used more and more and partial safety factors are now planned to be introduced in geotechnics If statistical avershyages and partial safety factors are to be used correction factors which themselves imply another treatment of the test results cannot be used In these cases new correction facshytors based on averages of measured strength values must be used
In view of this there is reason for noting the historical development which has led to the SGI correction factors from 1969 and the way in which they were supposed to be used as well as for providing recommendations on the correction factors to be used befor cal-
Historical development up to 1969
Estimation of shear strength and stability started in Sweden in connection with the work of the Geotechnical Commission of the Swedish State Railways and the Committee on stability Problems in Gothenburg Harbour
These led to the method of calculating stabshyility with the Swedish Slip Circle Method (Hultin 1916 Pettersson 1916 and Fellenius 1918 1919 1926 1927 1929) and to the fall cone test which was developed by John Olsson (The Commission of the Swedish State Railways Final Report 1922)
The fall cone test was calibrated by tests on samples taken with a newly constructed sampler for undisturbed samples which were compared to results from a series of load tests on piles made by Wendel in 1900 The strength values from fall cone tests were also compared to landslides which were backshycalculated with the use of undrained shear strength and slip circles and this testing proshycedure was recommended in the final report from the commission
The sampling technique was improved and piston samplers came into use (Olsson 1925 Pettersson 1933 Caldenius 1938) The fall cone test was recalibrated for these improved samples versus various tests for determinshyation of strength in the field load tests in full scale full scale failures and landslides and later on also direct shear tests in the laboratory These calibrations also led to the first correction factors for undrained shear strength measured by fall cone tests in organic and high-plastic clays (Skaven- Haug 1931 Olsson 1936-37 Fellenius 1938 Caldenius 1938) In the calibration of the fall cone test versus landslides also other types of failure surfaces than slip circles were used It was also made clear that the strength was dependent on the preconsolidation pressure (Fellenius 1936)
The corrected undrained shear strength from fall cone tests was used in all types of stabishylity problems such as excavations earth pressures and stability of road berms with and without loading berms (Jakobson 1946)
A new type of shear apparatus was construcshyted in 1936 by Kjellman (1942 1950) for unshydrained as well as drained tests Triaxial tests have also been used in Sweden since 1940
The vane apparatus for determination of unshydrained shear strength in the field was introshyduced in its present shape by Cadling and Odenstad in 1950 This apparatus was calishybrated versus a number of slides that had ocshycurred and versus on e load test A t first the values from the vane shear tests were used without any correction At the end of the 1950s new and improved samplers were developed which led to the new standard piston sampler (Kallstenius 1963) Hansbo (1957) recalibrated the fall cone test on the
22
new samples versus the vane shear test This new evaluation differed sernewhat from the previous method but not very significantly Earlier experience had shown that strength values measured by the fall cone test must be corrected with regard to liquid limit The realization that undrained shear strength from vane tests had to be corrected in the same way as the fall cone values also spread with time
The correction factors have like the evaluashytion of the undrained shear strength varied with the times according to the kind of samshypling equipment used To sum up experience after the introduction of the standard piston sampler in 1963 and to obtain uniform correcshytion factors for modern sampling technique a technical meeting was held at the Swedish Geotechnical Institute in Stockholm in 1969 (SGI 1970)
SGI correction factors of 1969
At the meeting at SGI a recommendation was made as to the correction factors that should be used for undrained shear strength values estimated by fall cone tests and vane shear tests The correction factors were based on the liquid limit of the soil Fig 9
LIQUID LIMIT wl
o 50 100 150 200 L 10
0 o tshy(_)
ltt 08 u_
z g tshy(_)
06 LJJ 0 0 o (_) 04
Fig 9 Co~eetion naeton4 ~ecommended by SGI 7969
Many participants at the meeting wanted to recommend lower correction factors (greater reduction) The question was resolved by applying the recommended correction factors at cautiously selected values or low estimshyates of averages of the measured strength values
SGI correction factors of 1969 thus imply that a further reduction is made of the real averages of corrected strength values
This means that the correction factors must be lower than those given in Fig 9 when the strength is based on statistical averages of evaluated shear strength
The corrected strength was intended to be used in all types of calculations and strength anisotropy was not considered If strength anisotropy has been considered a t all in Sweden the required safety factor has been modified for different leading cases
Bjerrums correction factors
Bjerrum (1972 and 1973) made a comprehenshysive compilation of failures and landslides based on what had been reported in the literature and on the experience of the Norshywegian Geotechnical Institute from Norway and Bangkok After analysis of this material Bjerrum suggested new correction factors These were based on averages of the shear strength values measured by the vane shear tests and related to the plasticity index lpmiddot
In Bjerrums studies a great number of low plastic clays from Norway and clays with varying plasticity from mainly Europe and North America were included No high plasshytic or organic soil from Seandinavia was inshycluded in the study The correction factors for this type of soil were mainly based on investigations of organic Bangkok clay Howshyever comparisons with Swedish soils with corresponding plasticity show that the proshyperties of the Bangkok clay do not earrespond to those normal for Swedish conditions
Andreasson (197 4) recalculated Bjerrums values to obtain corresponding correction factors based on the liquid limit instead of the plastic index A comparison with the SGI recommendation from 1969 showed that with the Bjerrum correction factors the strength was reduced more for low plastic clays but less for high plastic organic clays Taking into consideration the proposed use of the SGI correction factors together with cautshyiously selected shear strength values the final result was that the evaluated shear strength was almost the same except for orshyganic clays The Bjerrum and Andreasson studies did not therefore lead to any change in the SGI recommendations
Later studies of correction factors
The use of the vane apparatus spread and new suggestions for correction factors were made for example Pilot 1972 Dascal and Tournier
23
x
1975 In 1976 Aas made a suggestion for how the vane shear values could be corrected in Norwegian clays with respect to the relation between the measured strength value and the existing overburden pressure
An extensive review of the different correcshytion factors which also included some cases from Sweden not earlier taken into account was made in 1977 by Helenelund who at that time was visiting research worker at SGI Based on this material a correction factor in the order of
ll 145 l+w1
was suggested
This correction essentially earresponds to the Bjerrum correction but the correction of the measured strength becomes greater for organic high plastic soils
1 l
l
14 ix)
~ 12
Il
LLm 10 o
08
06 20 50 100 150 200
wl
o Data from Andreasson 1974
(v l LLAB Slunga 1983
bull Lv l( LAB organic so il (SGI)
-- Andreassons suggestion for correction 1974
45---fl= 1 middot ( Helenelund 1977)1+Wl
--fl-= r-~~3) 045
Fig 7O EvaluMed oajety jactoM M ja_f_UJLe FB = 1ll a-6 a ju~ctio~ oj liquid LUrlit compCVLed to ouggeoted cotcshytcectio~ jactoM
By inserting the Hansbo relation T v = ocmiddot045 w1 Helenelunds suggested correction can als o be wri tten
145 l +222 Tv jo b
Recently an extensive investigation of the properties of organic soil has been completed in Finland (Slunga 198 3) and a si m ilar investi shygation is in progress at SGI
Purther results from Norway have also been presented by Aas et al 1984
All the compilations of test results involve a spread and suggested correction factors become an adaption to the curves for avershyages
bull20
18 bull _ x
16 o o ~
4~1-shy Il
p~Q
~v o A
lLID 12 o
~ 1o
o
o 8
t v
)
vj o
o
o 02 04 06 08 lvO~ aU(vfO~
o Data from Helenelund 1977 x 1v l 1LAB Slunga 1983 bull 1v l 1LAB organ ic so il (SGI )
1 45 ---~ = i( lO ( Helenelund 1977)1+ 2 22 l v c
-~ = [0193middot] 045 1vl0c
Fig 77 EvaluMed oajety jactoM M ja_f_UJLe FB = 1ll ao a ju~ctio~ oj the tcelashytio~ betwee~ the ottce~gth value meaoWLed by va~ e -6 heCVL teot-6 a~d the ptcecoMotidatio~ ptce-6-0WLe (al shytetc~ativety e j j edive OvetcbWLde~ ptce-6-0WLe) compCVLed to -6 ug g eoted coMeetio~ jactoM
24
Fig l O shows the values evaluated by Andreasson 197 4 supplemented with relations between results from vane shear tests and qualified laboratory tests (averages from dishyrect shear tests and active and passive tri shyaxial tests) from Slunga 1983 and from reshysearch at SGI In the figure the curves earshyrespanding to the corrections suggested by Andreasson 197 4 and Helenelund 1977 are inserted tagether with the correction now recommended by SGI
25
x20 --x bull
15 bullbull ------ ---shy
-x x o~
10 l o~ ~~ () 5 o
gm o
o o 01 02 03 04 05 06 07 08 09 1 o
tJO~ (( 0~ l
bull Full scale failure o earrelation with qualified loborotory investigation
x earrelation with qualified loborotory investigation
for arganie so il ( Slunga 1983 SGl )
_ P= [omiddot 193 middot) o45 LV OC
Fi g 72 E vatwaringe_d o aJ ety nacAoM at J aUULe_ (Aao et at vatue_o ) comptete_d w-U h vatue_o fJ Lom M ganic 6 oili compMe_d to coMe_ction fJacAoM L ecommended by SGI
Fig 11 shows the values evaluated by Heleneshylund 1977 supplemented in the same way as the values evaluated by Andreasson in Fig l O w i t h values from organic soils Helenelund presented his values as calculated safety facshytors at failure FB = 1 ll versus bullvo0 As bullv is dependent on ob this presentation gives an unnecessarily large spread since the values from normally consolidated and overconsoli shydated clays are mixed To the extent that information has been available the values have therefore been converted and existing effective overburden pressure o0 has been replaced by the preconsolidation pressure ob Some cases where investigation has shown that the drained strength has been lower than the undrained strength or complementary information is missing have been excluded Curves corresponding to the correction suggested by Helenelund 1977 and the correcshytion now recommended by SGI (both rewritten with the Hansbo relation bullv = obmiddot045 w1) a re inserted in Fig 11
At the Nordie Geotechnical Meeting (NGM) in Linkoumlping 1984 Aas et al presented a comshypilation of comparisons for the relation beshytween FB and bullvo 0 Fig 12 The compilation included comparisons with full scale failures in the field as well as comparisons with quali shyfied laboratory investigations The points in the figure originate from normally Consolishydated and slightly overconsolidated clays and a certain displacement of the points to the left in the figure would occur if all points could be calculated versus ob To complete the picture the points for organic soils from Slunga 1983 and SGI have been inserted
Results from research on vane shear tests
During the 196Os and the beginning of the 1970s extensive research was carried out to determine which factors influence the results from vane shear tests The factors investi shygated were shape and construction of the vane waiting time after installation before strength testing starts and tagether speed of rotation during the test
The shape and construction of the vane proved to have great importance for the reshysults In Sweden however vanes with the rela tionship 21 between height and width of the biades are alwa ys used and the empir shyical experience is based on this type of vane In Sweden two types of vane shear equipment are used today vane shear equipment of the SGI type where the vane is withdrawn in a protective casing during most of the driving and vane shear equipment of the NilconGeoshytech typewhere the vane is driven directly into the soil As the latter vane is unprotecshyted during driving the design must be made samewhat more robust than for the SGI equipment In the SGI vane shear equipment the vane rod is also encased Torstensson (1977) has found that at rotation speeds reshycommended by the manufacturer failure occurs approximately three times faster with the NilconGeotech apparatus than with the SGI apparatus The results often seem to be compatible
The SGI apparatus is a relatively heavy piece of equipment while the NilconGeotech apshyparatus is very easy to handle On the other hand the SGI apparatus would normally disturb the soil less and in addition the vane is scraped clean after each test With the NilconGeotech apparatus there is a risk that clay from a firmer layer can stick to the vane and accompany the vane into looser layers with disturbance of the soil as a result Preshyboring through the dry crust is therefore al shy
25
ways recommended when using the Nilcon Geotech apparatus Even then problems can occur in layered or varved so il sensiti ve to disturbance
Through studies of the influence on the wait shying time between installation of the vane and the shear tests i t has appeared that the longer the waiting time the higher the measured shear strength is up to a certain waiting time (lt l day) after w hi ch the value becomes constant The increase in strength with waiting time could be due to reconsoli shydation after the disturbance occurring at inshystallation of the vane Recommended proceshydure is that the strength test be started withshyin 5 minutes after installation Within this period no significant increase of the strength value occurs
Compilation of the relations between measured strength after one day of waiting T lD and measured strength according to the standard procedure T 0 shows that the relashytion TlDI T0 increases considerably at deshycreasing liquid limit which means that the disturbance at installation of the vane is normally greatest in low plastic clays The spread also increases at decreasing liquid limit Fig 13
In studies of the influence of speed of rotashytion on measured strength values a connecshytion between measured strength values and speed of rotation has in most cases been found This can be written
where Tt = measured strength value at a rotashy
tion speed which gives the time t to failure
Tl =reference strength value measured at a rotation speed which gives time t1 to failure
t1 = reference time Usually 1-3 minshyutes corresponding to recommendshyed procedure
13 = coefficient
24
23
22
21
2
19
18 l
19
16
l15 14
bull
13 ~
12 bull 11 bull 10+-----~--------------------------
0 50 100 150 200 LIQUID L l MIT wl
e Average
D Spread at ene site
Fig 73 Comp~on b~een ~~ength valuu mealJUJLed by vane ~heM tuu aJtVL one day oJ waiting T JV and valuu meUJLed accOLdtng to the ~tandMd pLo cedUJLe T 0 bull
Fig 14 shows measured values of the coefshyficient from vane shear tests supplemented by amp-values from other types of tests on orshyganic soil collected from Slunga 1983
As is shown in Fig 14 the rate effect decreases somewhat at decreasing plasticity
In a summary of the results from research on vane shear tests Torstensson (1977) showed that if both disturbance and rate efshyfects are taken into account for time to fail shyure of about one week strength values are obtained that are about the same as the strength values measured by the standard procedure and corrected according to Bjershyrums recommendation of 1973
26
o o
~ 006 bull f-z 005 bull bull bull UJ loJ004 bullu LL 003 bullLL UJ o 002 u
001
o o 50 100 150 200 LIQUID LIMIT wL
bull Data from Larsson 1982 b o Data from Slunga 1983
F~g 74 Th~ ~o~t)t)~ci~nt ~ ~ a t)un~on at) liq~d LUnd
17 l16 l
15 l 1 110 0~14
13
- 12
11
100 15 0 200 10
09
08
07
06
05
04
F~g 75 CoM~~on t)actofL ll t)ofL JJtfL~ngth valueo m~~ufL~d
a~~ofL~ng to JJtandatLd pLoshy~~dUfL~ by van~ c h~atL teotJ ~n~u~ng ~tltl~~ at) ~shytUtLban~~ at ~nctalt~on at) th~ van~ and fLat~ ~tlb~~ t)ofL ~~ to t)~UtL~ at) 7 w~~k to 7 month
If the correction for disturbance at installashytion obtained in Fig 13 is corrected for rate effects so that instead of applying to a time to failure of 1- 3 minutes it earresponds to more normal times to failure of l week to l month a total correction for the measured strength according to the standard procedure is obtained Fig 15 The correcti9~ factor ll has been caleulat ed as ll = l O O O O middot Tl DiT 0 and has been assumed to follow the relation in Fig 14
As the disturbance has been found to be greatest in low plastic clays where the rate effects are smallest the final result is that the strength values measured by the normal procedure in low plastic clays are not be reshyduced and that the correction factor may even be greater than l The higher the plasti shycity is the smaller is the disturbance and the greater the rate effects become Conseshyquently the correction factor decreases with increasing plasticity
Empirical relations for undrained shear strength
Different values of the undrained shear strength are obtained in di f f e rent tests deshypending on the loading case The shear strength is thus anisotropic A hypothesis for the variation of the shear strength with the loading case in inorganic clays was presented by Larsson in 1977
The undrained shear strength is usually divishyded into shear strengths in three main types of loading active shear when the vertical stress is the largest principal stress passive shear when the harizontal stress is the largest principal stress and direct shear where the normal stress towards the harizontal slip surshyface is constant but the shear stresses inshycrease In the laboratory the three loading cases can be simulated by active and passive triaxial tests and direct shear tests Fig 16
Results from active and passive triaxial tests and direct shear tests on Seandinavian clays reported in the literature tagether with conshysistency limits and preconsolidation pressures were compiled tagether with unpublished data from investigations at SGI in 1980 (Larsson 1980) Since then additional data have beem obtained and is included in Fig 17
There are no corresponding empirical relashytions for organic clays as yet but research on the properties of these soils is going on The results from direct shear tests are close to the average of active and passive triaxial tests and direct shear tests
27
l l-~o- c=)
Pass i ve zon e Zene of d irect Active zone Passive s hear Act i ve triaxial test Direct sheor test triaxial test
Fig 76 Main typvo ofi toading ca~gteA with JteApect to Mil arUotJtopy and coJtJteAponding taboJtatoJty tvoU
x x
- -- ---X-------- ---- shyx x x
x 03 x x x
x
x Ltu ACTIVEx
bull ffu DIRECT SHEAR
o ffu PASSIVEo D fCR PASSIVE02
- ftu AVERAGE
D 01 D
D D
D
o o 20 40 60 80 100
Fig 77 UndJtained oheaJt otJtength in Scandinavian inOJtganic ctayo all a fiuncUon ofi the pJteconooUdation pJteAOUJte and the Uquid LUnd TCRbull coJtJteApondo to the oheaJt otJtength mobitized at a defioJtmation coJtJteAponding to defioJtmation at fiailUJte n acUve tvoU TheJtefioJte the otJtength ofi fiailUJte TPASSIVE io oomewhat higheJt than TCRmiddot Vata main-ty fiJtom LaJtMon 7 980
28
-----
Correlations between empirical relations and full scale failures in the field
The relevance for undrained shear strength determined by qualified laboratory investi shygation has been continuously shown in the investigations primarily made by the Norweshygian Geotechnical Institute (NGI) NGI has developed the ADP-analysis (active-direct shear-passive) and this analysis is used in all qualified investigations Aas 1976 Normally no earrelation with the preconsolidation pressure is made
Corresponding analysis has also been develshyoped at the Massachusetts Institute of Techshynology (MIT) but here all shear strengths are normalized according to the SHANSEP proceshydure (Ladd amp Foott 197 4)
A compilation of full scale failure reported in literature tagether with information on plasticity mobilized shear strength and preshyconsolidatian pressure was made in 1980 (Larsson 1980) Fig 18
rtutoc bull EMBANKMENTS o FOUNDATIONS a LOADI NG TESTS
05 x DATA FROM SKEMPTON 1948 bull LONG SLOPES
04 o bull
03 ~~tu AVERAGE _--_ bull o02 l-
01
o o 50 100 150
Fg 78 Mob~zed uncAcU_ned -6 heaJL JJtJLength at J ~LULe a-6 a Junction oJ the uqud -Umt ( L(()L6JJ on 7980)
The compilation includes failures of road emshybankments failures under silos and oil storshyage tanks results from test embankments and other load tests and some slope failures Fig 18 shows that the results spread someshywhat but apart from some landslides in low plastic sensitive clay the empirical value for the average shear strength from labratory tests correlated weil to the strength that could be mobilized in the field
Correlations between empirical relations and shear strength values obtained by vane shear tests and fall cone tests
Direct shear tests usually give shear strengths directly compatible to strength values from vane shear tests and fall cone tests corrected according to this recommenshydation This is as expected if the empirical relation for shear strength and Hanbos relashytion Tv =o cmiddot 045 w1 is valid Fig 19
04 Empirical rbulllation for _ - shy
03 ~-02
01 Corrected whlls from vane shear tests ond fall con~ tests
O O 20 40 60 80 100 120 140 160 180
LIOUID LIMIT wl
Fg 79 CoMelation-6 baween empUUcat -6 heaJL JJtJLength cvt cUJcect -6 heaJL and coMected van e -6 hecUL and JaLf cone vatuu catculcvted by Han-6bo -6 JLelation T v = o ~ middot O 45 wL and new JLecommended coMection
This means that campared to the corrected strength determined by vane shear tests and fall cone tests active triaxial tests normally give higher shear strengths and passive tri shyaxial tests normally give lower undrained shear strengths Averages of the undrained shear strength from active and passive tri shyaxial tests and direct shear tests are someshywhat higher than the corrected strength from vane shear tests and fall cone tests The difshyference increases with decreasing plasticity
Fig 20 shows correction factors for strength values measured by vane shear tests and fall cone tests which would normally have to be used to obtain a complete correspondence both to results from direct shear tests and also to averages of active and passive triaxial tests and direct shear tests
29
06
05
Fig ZO Co~ection fiaeto~ fio~ ~tnength vatuu detvunined by vane ~heM tuu and naLe cone tuu ~equined to co~upond to a ~eet ~heM tuu b avvwqu n~om active
paM-ive tnaxJat tuu and and
~eet ~heM tuu
Compilation of results and comparison with the new recommended correction
The results from all the above mentioned inshyvestigations since 1969 are fairly unanimous Different correction factors suggested or indirectly derived are compiled in Fig 21
The correction factor p= 145(1 +wL) suggesshyted by Helenelund in 1977 gives a relatively good correspondence to all other results However it gives a flatter curve than the other relations in Fig 21 and therefore a sernewhat low correction factor for very low plastic clays a sernewhat high correction factor for medium plastic clays and a someshywhat low correction for very high plastic orshyganic soils Andreassons suggestion from 1974 agrees well with other results for low and medium plastic soils but gives relatively high correction factors for high plastic and organic soils As mentioned earlier no Seanshydinavia n very high plastic clays or organic soils were included in the basic data for Andreassons suggestion
Swedish experience is that in soils with high liquid limit considerably lower correction factors must be used than those in Andreasshysons suggestion According to the SGI recommendations from 1969 a correction facshytor of 05 should be used for all soils with a liquid limit over 180 and according to reshycommendations from the Swedish Road Adshyministation correction should be made for organic content according to lJ= 08 wL The Swedish National Road Administration also uses 05 as the lowest correction factor but on the other hand it considers that a higher calculated factor of safety against failure is required in very high plastic soils
The numerical base for correction factors for Scandinavian organic soils with very high liquid limits is however very deficient and is mainly limited to the earrelations with qualified laboratory investigations reported by Slunga 1983 and findings from current reshysearch at SGI
The mathematical expression for the correcshytion factor best corresponding to the correcshytion factors which have emerged from differshyent investigations is shown in Fig 22
= (043) 045 Aring WL
This relation gives an upper limit of Aringmax 13 when applied to Scandinavian clays and organic soils Clays with a lower liquid limit than about 2496 hardly occur in this region Owing to the great sensitivity of the correction factor for small changes in the liquid limit and the great spread in shear strength values often found in low plastic soils no correction factors higher than 12 should be used without support from complementary investigations
Norwegian experience (Aas et al 1984) and the curve for average shear strength from Larsson (1977 1980) indicate that for stabshyility calculations of embankments on harizontal ground the strength could be increased further for very low plastic clays On the other hand anisotropy is neither in Sweden nor abroad determined from this type of strength test but a value intended to be used generally is produced It can hardly be regarded as acceptable to use a test procedure where the obtained strength value should be increased by more than 20 before it is used In these extreme cases it can be observed that neither vane shear tests nor cone tests work sufficiently well and that if higher strengths are to be utilized other test procedures such as direct shear tests and triaxial tests should be used
30
)l
bull bull bull bull Andreasson 197417 )l 11 u ~lt Corredion for disturbance
ettects and rate etteds16 at vane shear tests
--- Helenelund 197715 Correction according to correlation
with ~ualitied loborotory invest igot ions14 Correction for high liquid limits according to SGI 196913
12
11 100 150 200 WL 0o101+---------t-+------+-----+-----+-------=--shy
09
08
07
06
05 -~--tf- ---)(-shy04 --~
Fig 21 CoJUtetattoYL-6 betwe_e_n cU_-66eAent coJUtection iacAoM ioJt JdJtength valueJ dueAmine_d by vane_ gtheM teJtlgt and iloLt cone_ teJtlgt
31
11
04
The following is therefore recommended as a general correction factor for vane shear test values and cone test values applied to averages of the strength values obtained
043 045 1-1 = (V L) Q5
with the reservation that correction factors higher than 12 should not be used without complementary investigations
As was concluded from earrelations between Bjerrums correction factors and SGIs recommendation from 1969 (Andreasson 1974) this new procedure does not imply any greater difference in evaluated undrained shear strength campared with the earlier procedure with cautiously selected strength values and SGIs correction from 1969 The corrected strength for very low plastic clays becomes however samewhat higher according to the new suggestion
The intention with the new procedure is primarily an adaption to a different and more uniform evaluation of the measured data
-p= [~~3] 045
10-+----------lll-+--------+----+------+-------shy
13 --Other correction factors from
Fig20
12
100 150 200 W 0o
09
O
07
06
05
F-ig 22 CoJULUatioU beXween -the JLUation JJ (O 43) O 45 and o-theJL ouggeo-ted coMeruon 6ac-toM WL
32
STATENS GEOTEKNISKA INSTITUT Besoumlksadress Olaus Magnus Vaumlg 35
Postadress 58101 Linkoumlping Telefon013-115100
T~yck-Cente~ AB Linkoumlping 1985
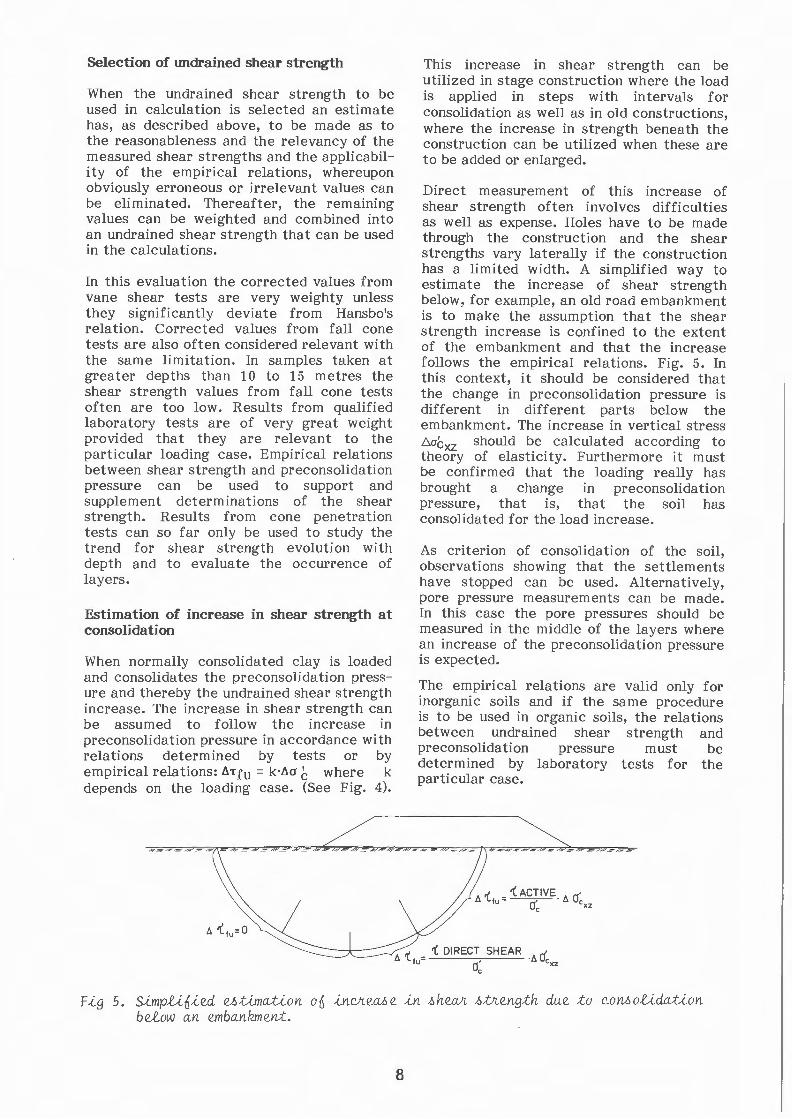

o
+40
E -J LU gt LU J
+30
+20
Section IX
00615
SHEAR STRENGTH l PRECONSOLIDATION PRESSURE
50 100 150 200 kPa
lowest ground water leve l
bull bull bull
bull bull
l Oense layers of silt
bull bull
bull bull
v ttu fall cone corrected u= ( Ow4L3 ) 045 X (fu vane shear test corrected r o t empirical direct shearfu
L tu con e penetration - porepressure sound i ng test as ( = Qc- Oo( evaluated according to Lunne amp Kleven 1982
tu 19 Evaluated shear strength
bull 0~ from CRS- test
F_g 7 Te6t Jte6uLt6 and evaluated oheaJt otJtength at po_nt 0 0675
17
Section IX
-0036 SHEAR STRENGTH l PRECONSOLIDATION PRESSURE
o 50 100 150 200 250 kPa
+50+-~--------~--------~----------~--------~-----------L--
+40
= t E -==- -~ =- ~=-- = ~- = =-7-=~ =----~-==Y~
E -
_J UJ
gt UJ _J
bull+30
bull bull
v n- j
45 ~ v Lfu fall cone corrected jl-=(~43) 0
+20 o Lfu empirical direct shear L bullOC from CRS-test Evaluated shear strength
U g 8 Trut L el uLt6 and evaJuated o heaL otLength at point 0 036
18
REFERENCES
Aas G 1976 Totalspaumlnningsanalyser pnns1pp grunnlag Norske Sivilingenimers Forening Kurs i Jordartsegenskaper - bestemmelse og anvenshydelse Gol 20-225
Aas G Lacasse S Lunne T och Madshus C 1984 In situ testing - new developments Nordiska Geoteknikermoumltet i Linkoumlping 1984
Andreasson L 1974 Foumlrslag till aumlndrade reduktionsshyfaktorer vid reduktion av vingborrbestaumlmd skjuvshyharingllfasthet med ledning av flytgraumlnsvaumlrdet Intern rapport Chalmers Tekniska Houmlgskola lnst foumlr geoteknik
Bergdahl U 1984 Geotekniska undersoumlkningar i faumllt Statens geotekniska institut Information nr 2
Bjerrum L 1972 Embankments on soft ground Proceedings ASCE Speciaity Conference on Performance of Earth and Earth-supported Strucshytures Purdue University Lafayette IN Vol 2 PP 1-54
Bjerrum L 1973 Problems of soil mechanics and construction on soft clays and structurally unstable soils State-of-the-art Report Session 4 Proceedshyings 8th International Conference on Soil Meshychanics and Foundation Engineering Moscow Vol 3 pp 111-159
Cadling L och Odenstad S 1950 The vane borer An apparatus for determining the shear strength of clay soils directly in ground statens geotekshyniska institut Proc No 2
Caldenius C 1938 Naringgra roumln fraringn grundundersoumlkshyningar i Goumlteborg roumlrande fasthetens variation inom lerorna Teknisk Tidskrift V o V 68(12)137-142
Dascal 0 and Tournier JP 1975 Embankments on soft and sensitive cia y foundations ASCE Journal of the Geotechnical Engineering Division 101(GT3A pp 297-314
Fellenius W 1918 Kaj- och jordrasen i Goumlteborg Teknisk Tidskrift V o V 4817-19
Fellenius W 1919 Utredning betraumlffande kajbyggshynader foumlr Trondhjems hamn Teknisk Tidskrift v o v 491-19
Fellenius W 1926 Jordstatiska beraumlkningar med friktion och kohesion foumlr cirkulaumlrcylindriska glidshyytor Kungl Vaumlg- och Vattenbyggarkaringrens 75-aringrsshyskrift
Fellenius W 1927 Erdstatische Berechnung mit Reibung und Kohaumlsion (Adhaumlsion) und unter Anshynahme krieszylindrischerGieitflaumlcken Ernst Berlin
Fellenius W 1929 Jordstatiska beraumlkningar foumlrvertishykal belastning paring horisontal markyta under antashygande av cirkulaumlrcylindriska glidytor Teknisk Tidskrift V o V 5957-63 och 75-80
Fellenius B 1936 Discussion on soil properties Proc 1 st lnt Conf on Soil Mech and Found Engng Cambridge Mass Vol III
Fellenius B 1938 Provbelastning av i lera nedpresshysade jaumlrnroumlr Teknisk Tidskrift 68(1938)10
Flodin N and Broms B 1981 Historical development of civil engineering in soft clay Soft Clay Engng Elsevier Amsterdam Oxford New York
Hansbo S 1957 A new approach to the determinashytion of the shear strength of clay by the fall-cone test statens geotekniska institut Proc No 14
Helenelund KV 1977 Methods for reducing unshydrained shear strength of soft clay statens geotekshyniska institut Rapport No 3
Hultin S 1916 Grusfyllningar foumlr kajbyggnader Bidrag till fraringgan om deras stabilitet Teknisk Tidshyskrift V o V 46(36)292-294
Hultin T 1937 Foumlrsoumlk till bestaumlmning av Goumlteborgsshylerans haringllfasthet Tekn Samfundets Handlingar No 2
Jacobson B 1946 Kortfattat kompendium i geotekshynik Statens geotekniska institut Meddelande No 1
Kallstenius T 1963 studies on clay samplestaken with standard piston sampler statens geotekshyniska institut Proc No 21
Karlsson R and Vi berg L 1967 Ratio ep in relation to liquid limit and plasticity index with special reference to Swedish clays Proceedings Geoshytechnical Conference Oslo Vol 1 pp 43-47
Kjellman W 1942 Vaumlg- och Vattenbyggnadsstyrelshysens geotekniska laboratorium Teknisk Tidskrift v o v 72(8)105-116
Kjellman W 1950 Testing the shear strength of clay in Sweden Geotechnique 2225-232
Ladd CC et al1977 stress-deformation and strength characteristics state-of-the-art report Proc IX ISSFME Tokyo Vol 2
Ladd CC and Foott R 1974 New design procedure for stability of soft clays ASCE Journal of the Geotechnical Engineering Division 100(GT7) pp 763-786
Larsson R 1977 Basic behaviour of Scandinavian soft clays statens geotekniska institut Rapport No 4 Linkoumlping
Larsson R 1980 Undrained s hear strength in stability calculation of embankments and foundations on soft clays Ganadian Geotechnical Journal Vol 17 No4
Larsson R 1982 a Jords egenskaper Statens geoshytekniska institut Information No 1
Larsson R 1982 b Naringgra praktiska konsekvenser av resultaten fraringn forskning i vingsondering Geotekshyniknytt No 3 1982
Larsson R 1983 Slaumlntstabilitetsberaumlkningar i lera Statens geotekniska institut Rapport No 19 Linkoumlping
Olsson J 1925 Kolvborr Ny borrtyp foumlr upptagning av lerprov Teknisk Tidskrift V o V 52(2)13-16
Olsson J 193637 Angaringende (om) inre friktion (och kohesion) i lera Teknisk Tidskrift V o V 66(5)60 och 67(2)21 -23
19
Petterson K E 1916 Kajraset i Goumlteborg den 5 mars 1916 Teknisk Tidskrift V o V 46(52)471-478
Petterson KE 1933 Foumlrbaumlttrad apparat foumlr upptagshyning av lerprov uordprov~ Teknisk Tidskrift V o V 6385-87
Pilot G 1972 Study of five embankment failures on soft soils Proceedings ASCE Speciaity Conshyferenes on Performance of Earth and Earth-supportshyed Structures Purdue University Lafayette IN Vol1 (Part 1) pp 81-99
Skaven-Haug S 1931 Skjaerfasthetsfors0k med leire Norges Statsbaner Meddelande 6(6) pp 101-105
Skempton AW 1948 Vane tests in the alluvial plain of the river Forth Geotechnique 1(2) pp 111-124
Skempton AW 1954 Discussion of the structure of inorganic soil ASCE Proceedings 80 Separate No 478 pp 19-22
Slunga E 1983 On the influence of arganie content ontheshear strength of fine grained soil Vaumlg- och Vattenbyggaren No 78 1983
statens Geotekniska Institut (SGI) 1970 Reducering av skjuvharingllfasthet med avseende paring finlekstal och sulfidhalt Sammandrag av teknisk traumlff 1969-12-11
Statens Jaumlrnvaumlgars Geotekniska Kommission 1914-1922 slutbetaumlnkande statens Jaumlrnvaumlgar stockholm Geotekn iska Meddelanden Nr 2 1922
Svenska Geotekniska Foumlreningens (SGF) Kolvborrshykommitte 1962 Tolkning av fallkonprov paring provshykroppar av lera tagna med standardkolvborr
Torstensson BA 1977 Time dependent effects in the field vane test Proceedings lnt Symp on Soft Clay Bangkok
~ndel E 1900 Om profbelastning paring paringlar med tillaumlmpning deraf paring grundlaumlggningsfoumlrharingllanden i Goumlteborg Tekn Samfundets Handlingar No 7
20
APPENDIX
BACKGROUND TO THE NEW RECOMMENDATION FOR CORRECTION OF VALUES OF SHEAR STRENGTH OBTAINED BY VANE SHEAR TESTS AND FALL CONE TESTS TOGETHER AND TO EMPIRIGAL RELATIONS FOR UNDRAINED SHEAR STRENGTH
21
Introduction
In Sweden undrained shear strength is mainly estimated by fall cone tests and vane shear tests From the values obtained the geotechshynician makes a judgement of what can be reshygarded as safe measured values and these values are then corrected with the SGI corshyrection factors from 1969 These correction factors have now been used for 15 years
Provided that the corrected shear strength is used in the normal way together the appropriate safety factors the procedure works fairly well However the user must be aware of the development that has led to the SGI correction factors and how these are intended to be used
The use of primarily the vane shear test has spread all over the world N e w research reshysults have been obtained and a number of difshyferent correction factors have been suggesshyted To enable a separation of real differenshyces in results and soil properties from differshyences in treatment of the test results the background and prerequisites for correction factors must be taken into account In recent years other types of estimations of the unshydrained shear strength than fall cone tests and vane shear tests have come into use for example cone penetration pore pressure sounding and pressorneter tests in the field and triaxial tests and direct shear tests in the laboratory This is primarily the case abroad but is valid also in Sweden
Statistical methods of estimating the avershyages of results are used more and more and partial safety factors are now planned to be introduced in geotechnics If statistical avershyages and partial safety factors are to be used correction factors which themselves imply another treatment of the test results cannot be used In these cases new correction facshytors based on averages of measured strength values must be used
In view of this there is reason for noting the historical development which has led to the SGI correction factors from 1969 and the way in which they were supposed to be used as well as for providing recommendations on the correction factors to be used befor cal-
Historical development up to 1969
Estimation of shear strength and stability started in Sweden in connection with the work of the Geotechnical Commission of the Swedish State Railways and the Committee on stability Problems in Gothenburg Harbour
These led to the method of calculating stabshyility with the Swedish Slip Circle Method (Hultin 1916 Pettersson 1916 and Fellenius 1918 1919 1926 1927 1929) and to the fall cone test which was developed by John Olsson (The Commission of the Swedish State Railways Final Report 1922)
The fall cone test was calibrated by tests on samples taken with a newly constructed sampler for undisturbed samples which were compared to results from a series of load tests on piles made by Wendel in 1900 The strength values from fall cone tests were also compared to landslides which were backshycalculated with the use of undrained shear strength and slip circles and this testing proshycedure was recommended in the final report from the commission
The sampling technique was improved and piston samplers came into use (Olsson 1925 Pettersson 1933 Caldenius 1938) The fall cone test was recalibrated for these improved samples versus various tests for determinshyation of strength in the field load tests in full scale full scale failures and landslides and later on also direct shear tests in the laboratory These calibrations also led to the first correction factors for undrained shear strength measured by fall cone tests in organic and high-plastic clays (Skaven- Haug 1931 Olsson 1936-37 Fellenius 1938 Caldenius 1938) In the calibration of the fall cone test versus landslides also other types of failure surfaces than slip circles were used It was also made clear that the strength was dependent on the preconsolidation pressure (Fellenius 1936)
The corrected undrained shear strength from fall cone tests was used in all types of stabishylity problems such as excavations earth pressures and stability of road berms with and without loading berms (Jakobson 1946)
A new type of shear apparatus was construcshyted in 1936 by Kjellman (1942 1950) for unshydrained as well as drained tests Triaxial tests have also been used in Sweden since 1940
The vane apparatus for determination of unshydrained shear strength in the field was introshyduced in its present shape by Cadling and Odenstad in 1950 This apparatus was calishybrated versus a number of slides that had ocshycurred and versus on e load test A t first the values from the vane shear tests were used without any correction At the end of the 1950s new and improved samplers were developed which led to the new standard piston sampler (Kallstenius 1963) Hansbo (1957) recalibrated the fall cone test on the
22
new samples versus the vane shear test This new evaluation differed sernewhat from the previous method but not very significantly Earlier experience had shown that strength values measured by the fall cone test must be corrected with regard to liquid limit The realization that undrained shear strength from vane tests had to be corrected in the same way as the fall cone values also spread with time
The correction factors have like the evaluashytion of the undrained shear strength varied with the times according to the kind of samshypling equipment used To sum up experience after the introduction of the standard piston sampler in 1963 and to obtain uniform correcshytion factors for modern sampling technique a technical meeting was held at the Swedish Geotechnical Institute in Stockholm in 1969 (SGI 1970)
SGI correction factors of 1969
At the meeting at SGI a recommendation was made as to the correction factors that should be used for undrained shear strength values estimated by fall cone tests and vane shear tests The correction factors were based on the liquid limit of the soil Fig 9
LIQUID LIMIT wl
o 50 100 150 200 L 10
0 o tshy(_)
ltt 08 u_
z g tshy(_)
06 LJJ 0 0 o (_) 04
Fig 9 Co~eetion naeton4 ~ecommended by SGI 7969
Many participants at the meeting wanted to recommend lower correction factors (greater reduction) The question was resolved by applying the recommended correction factors at cautiously selected values or low estimshyates of averages of the measured strength values
SGI correction factors of 1969 thus imply that a further reduction is made of the real averages of corrected strength values
This means that the correction factors must be lower than those given in Fig 9 when the strength is based on statistical averages of evaluated shear strength
The corrected strength was intended to be used in all types of calculations and strength anisotropy was not considered If strength anisotropy has been considered a t all in Sweden the required safety factor has been modified for different leading cases
Bjerrums correction factors
Bjerrum (1972 and 1973) made a comprehenshysive compilation of failures and landslides based on what had been reported in the literature and on the experience of the Norshywegian Geotechnical Institute from Norway and Bangkok After analysis of this material Bjerrum suggested new correction factors These were based on averages of the shear strength values measured by the vane shear tests and related to the plasticity index lpmiddot
In Bjerrums studies a great number of low plastic clays from Norway and clays with varying plasticity from mainly Europe and North America were included No high plasshytic or organic soil from Seandinavia was inshycluded in the study The correction factors for this type of soil were mainly based on investigations of organic Bangkok clay Howshyever comparisons with Swedish soils with corresponding plasticity show that the proshyperties of the Bangkok clay do not earrespond to those normal for Swedish conditions
Andreasson (197 4) recalculated Bjerrums values to obtain corresponding correction factors based on the liquid limit instead of the plastic index A comparison with the SGI recommendation from 1969 showed that with the Bjerrum correction factors the strength was reduced more for low plastic clays but less for high plastic organic clays Taking into consideration the proposed use of the SGI correction factors together with cautshyiously selected shear strength values the final result was that the evaluated shear strength was almost the same except for orshyganic clays The Bjerrum and Andreasson studies did not therefore lead to any change in the SGI recommendations
Later studies of correction factors
The use of the vane apparatus spread and new suggestions for correction factors were made for example Pilot 1972 Dascal and Tournier
23
x
1975 In 1976 Aas made a suggestion for how the vane shear values could be corrected in Norwegian clays with respect to the relation between the measured strength value and the existing overburden pressure
An extensive review of the different correcshytion factors which also included some cases from Sweden not earlier taken into account was made in 1977 by Helenelund who at that time was visiting research worker at SGI Based on this material a correction factor in the order of
ll 145 l+w1
was suggested
This correction essentially earresponds to the Bjerrum correction but the correction of the measured strength becomes greater for organic high plastic soils
1 l
l
14 ix)
~ 12
Il
LLm 10 o
08
06 20 50 100 150 200
wl
o Data from Andreasson 1974
(v l LLAB Slunga 1983
bull Lv l( LAB organic so il (SGI)
-- Andreassons suggestion for correction 1974
45---fl= 1 middot ( Helenelund 1977)1+Wl
--fl-= r-~~3) 045
Fig 7O EvaluMed oajety jactoM M ja_f_UJLe FB = 1ll a-6 a ju~ctio~ oj liquid LUrlit compCVLed to ouggeoted cotcshytcectio~ jactoM
By inserting the Hansbo relation T v = ocmiddot045 w1 Helenelunds suggested correction can als o be wri tten
145 l +222 Tv jo b
Recently an extensive investigation of the properties of organic soil has been completed in Finland (Slunga 198 3) and a si m ilar investi shygation is in progress at SGI
Purther results from Norway have also been presented by Aas et al 1984
All the compilations of test results involve a spread and suggested correction factors become an adaption to the curves for avershyages
bull20
18 bull _ x
16 o o ~
4~1-shy Il
p~Q
~v o A
lLID 12 o
~ 1o
o
o 8
t v
)
vj o
o
o 02 04 06 08 lvO~ aU(vfO~
o Data from Helenelund 1977 x 1v l 1LAB Slunga 1983 bull 1v l 1LAB organ ic so il (SGI )
1 45 ---~ = i( lO ( Helenelund 1977)1+ 2 22 l v c
-~ = [0193middot] 045 1vl0c
Fig 77 EvaluMed oajety jactoM M ja_f_UJLe FB = 1ll ao a ju~ctio~ oj the tcelashytio~ betwee~ the ottce~gth value meaoWLed by va~ e -6 heCVL teot-6 a~d the ptcecoMotidatio~ ptce-6-0WLe (al shytetc~ativety e j j edive OvetcbWLde~ ptce-6-0WLe) compCVLed to -6 ug g eoted coMeetio~ jactoM
24
Fig l O shows the values evaluated by Andreasson 197 4 supplemented with relations between results from vane shear tests and qualified laboratory tests (averages from dishyrect shear tests and active and passive tri shyaxial tests) from Slunga 1983 and from reshysearch at SGI In the figure the curves earshyrespanding to the corrections suggested by Andreasson 197 4 and Helenelund 1977 are inserted tagether with the correction now recommended by SGI
25
x20 --x bull
15 bullbull ------ ---shy
-x x o~
10 l o~ ~~ () 5 o
gm o
o o 01 02 03 04 05 06 07 08 09 1 o
tJO~ (( 0~ l
bull Full scale failure o earrelation with qualified loborotory investigation
x earrelation with qualified loborotory investigation
for arganie so il ( Slunga 1983 SGl )
_ P= [omiddot 193 middot) o45 LV OC
Fi g 72 E vatwaringe_d o aJ ety nacAoM at J aUULe_ (Aao et at vatue_o ) comptete_d w-U h vatue_o fJ Lom M ganic 6 oili compMe_d to coMe_ction fJacAoM L ecommended by SGI
Fig 11 shows the values evaluated by Heleneshylund 1977 supplemented in the same way as the values evaluated by Andreasson in Fig l O w i t h values from organic soils Helenelund presented his values as calculated safety facshytors at failure FB = 1 ll versus bullvo0 As bullv is dependent on ob this presentation gives an unnecessarily large spread since the values from normally consolidated and overconsoli shydated clays are mixed To the extent that information has been available the values have therefore been converted and existing effective overburden pressure o0 has been replaced by the preconsolidation pressure ob Some cases where investigation has shown that the drained strength has been lower than the undrained strength or complementary information is missing have been excluded Curves corresponding to the correction suggested by Helenelund 1977 and the correcshytion now recommended by SGI (both rewritten with the Hansbo relation bullv = obmiddot045 w1) a re inserted in Fig 11
At the Nordie Geotechnical Meeting (NGM) in Linkoumlping 1984 Aas et al presented a comshypilation of comparisons for the relation beshytween FB and bullvo 0 Fig 12 The compilation included comparisons with full scale failures in the field as well as comparisons with quali shyfied laboratory investigations The points in the figure originate from normally Consolishydated and slightly overconsolidated clays and a certain displacement of the points to the left in the figure would occur if all points could be calculated versus ob To complete the picture the points for organic soils from Slunga 1983 and SGI have been inserted
Results from research on vane shear tests
During the 196Os and the beginning of the 1970s extensive research was carried out to determine which factors influence the results from vane shear tests The factors investi shygated were shape and construction of the vane waiting time after installation before strength testing starts and tagether speed of rotation during the test
The shape and construction of the vane proved to have great importance for the reshysults In Sweden however vanes with the rela tionship 21 between height and width of the biades are alwa ys used and the empir shyical experience is based on this type of vane In Sweden two types of vane shear equipment are used today vane shear equipment of the SGI type where the vane is withdrawn in a protective casing during most of the driving and vane shear equipment of the NilconGeoshytech typewhere the vane is driven directly into the soil As the latter vane is unprotecshyted during driving the design must be made samewhat more robust than for the SGI equipment In the SGI vane shear equipment the vane rod is also encased Torstensson (1977) has found that at rotation speeds reshycommended by the manufacturer failure occurs approximately three times faster with the NilconGeotech apparatus than with the SGI apparatus The results often seem to be compatible
The SGI apparatus is a relatively heavy piece of equipment while the NilconGeotech apshyparatus is very easy to handle On the other hand the SGI apparatus would normally disturb the soil less and in addition the vane is scraped clean after each test With the NilconGeotech apparatus there is a risk that clay from a firmer layer can stick to the vane and accompany the vane into looser layers with disturbance of the soil as a result Preshyboring through the dry crust is therefore al shy
25
ways recommended when using the Nilcon Geotech apparatus Even then problems can occur in layered or varved so il sensiti ve to disturbance
Through studies of the influence on the wait shying time between installation of the vane and the shear tests i t has appeared that the longer the waiting time the higher the measured shear strength is up to a certain waiting time (lt l day) after w hi ch the value becomes constant The increase in strength with waiting time could be due to reconsoli shydation after the disturbance occurring at inshystallation of the vane Recommended proceshydure is that the strength test be started withshyin 5 minutes after installation Within this period no significant increase of the strength value occurs
Compilation of the relations between measured strength after one day of waiting T lD and measured strength according to the standard procedure T 0 shows that the relashytion TlDI T0 increases considerably at deshycreasing liquid limit which means that the disturbance at installation of the vane is normally greatest in low plastic clays The spread also increases at decreasing liquid limit Fig 13
In studies of the influence of speed of rotashytion on measured strength values a connecshytion between measured strength values and speed of rotation has in most cases been found This can be written
where Tt = measured strength value at a rotashy
tion speed which gives the time t to failure
Tl =reference strength value measured at a rotation speed which gives time t1 to failure
t1 = reference time Usually 1-3 minshyutes corresponding to recommendshyed procedure
13 = coefficient
24
23
22
21
2
19
18 l
19
16
l15 14
bull
13 ~
12 bull 11 bull 10+-----~--------------------------
0 50 100 150 200 LIQUID L l MIT wl
e Average
D Spread at ene site
Fig 73 Comp~on b~een ~~ength valuu mealJUJLed by vane ~heM tuu aJtVL one day oJ waiting T JV and valuu meUJLed accOLdtng to the ~tandMd pLo cedUJLe T 0 bull
Fig 14 shows measured values of the coefshyficient from vane shear tests supplemented by amp-values from other types of tests on orshyganic soil collected from Slunga 1983
As is shown in Fig 14 the rate effect decreases somewhat at decreasing plasticity
In a summary of the results from research on vane shear tests Torstensson (1977) showed that if both disturbance and rate efshyfects are taken into account for time to fail shyure of about one week strength values are obtained that are about the same as the strength values measured by the standard procedure and corrected according to Bjershyrums recommendation of 1973
26
o o
~ 006 bull f-z 005 bull bull bull UJ loJ004 bullu LL 003 bullLL UJ o 002 u
001
o o 50 100 150 200 LIQUID LIMIT wL
bull Data from Larsson 1982 b o Data from Slunga 1983
F~g 74 Th~ ~o~t)t)~ci~nt ~ ~ a t)un~on at) liq~d LUnd
17 l16 l
15 l 1 110 0~14
13
- 12
11
100 15 0 200 10
09
08
07
06
05
04
F~g 75 CoM~~on t)actofL ll t)ofL JJtfL~ngth valueo m~~ufL~d
a~~ofL~ng to JJtandatLd pLoshy~~dUfL~ by van~ c h~atL teotJ ~n~u~ng ~tltl~~ at) ~shytUtLban~~ at ~nctalt~on at) th~ van~ and fLat~ ~tlb~~ t)ofL ~~ to t)~UtL~ at) 7 w~~k to 7 month
If the correction for disturbance at installashytion obtained in Fig 13 is corrected for rate effects so that instead of applying to a time to failure of 1- 3 minutes it earresponds to more normal times to failure of l week to l month a total correction for the measured strength according to the standard procedure is obtained Fig 15 The correcti9~ factor ll has been caleulat ed as ll = l O O O O middot Tl DiT 0 and has been assumed to follow the relation in Fig 14
As the disturbance has been found to be greatest in low plastic clays where the rate effects are smallest the final result is that the strength values measured by the normal procedure in low plastic clays are not be reshyduced and that the correction factor may even be greater than l The higher the plasti shycity is the smaller is the disturbance and the greater the rate effects become Conseshyquently the correction factor decreases with increasing plasticity
Empirical relations for undrained shear strength
Different values of the undrained shear strength are obtained in di f f e rent tests deshypending on the loading case The shear strength is thus anisotropic A hypothesis for the variation of the shear strength with the loading case in inorganic clays was presented by Larsson in 1977
The undrained shear strength is usually divishyded into shear strengths in three main types of loading active shear when the vertical stress is the largest principal stress passive shear when the harizontal stress is the largest principal stress and direct shear where the normal stress towards the harizontal slip surshyface is constant but the shear stresses inshycrease In the laboratory the three loading cases can be simulated by active and passive triaxial tests and direct shear tests Fig 16
Results from active and passive triaxial tests and direct shear tests on Seandinavian clays reported in the literature tagether with conshysistency limits and preconsolidation pressures were compiled tagether with unpublished data from investigations at SGI in 1980 (Larsson 1980) Since then additional data have beem obtained and is included in Fig 17
There are no corresponding empirical relashytions for organic clays as yet but research on the properties of these soils is going on The results from direct shear tests are close to the average of active and passive triaxial tests and direct shear tests
27
l l-~o- c=)
Pass i ve zon e Zene of d irect Active zone Passive s hear Act i ve triaxial test Direct sheor test triaxial test
Fig 76 Main typvo ofi toading ca~gteA with JteApect to Mil arUotJtopy and coJtJteAponding taboJtatoJty tvoU
x x
- -- ---X-------- ---- shyx x x
x 03 x x x
x
x Ltu ACTIVEx
bull ffu DIRECT SHEAR
o ffu PASSIVEo D fCR PASSIVE02
- ftu AVERAGE
D 01 D
D D
D
o o 20 40 60 80 100
Fig 77 UndJtained oheaJt otJtength in Scandinavian inOJtganic ctayo all a fiuncUon ofi the pJteconooUdation pJteAOUJte and the Uquid LUnd TCRbull coJtJteApondo to the oheaJt otJtength mobitized at a defioJtmation coJtJteAponding to defioJtmation at fiailUJte n acUve tvoU TheJtefioJte the otJtength ofi fiailUJte TPASSIVE io oomewhat higheJt than TCRmiddot Vata main-ty fiJtom LaJtMon 7 980
28
-----
Correlations between empirical relations and full scale failures in the field
The relevance for undrained shear strength determined by qualified laboratory investi shygation has been continuously shown in the investigations primarily made by the Norweshygian Geotechnical Institute (NGI) NGI has developed the ADP-analysis (active-direct shear-passive) and this analysis is used in all qualified investigations Aas 1976 Normally no earrelation with the preconsolidation pressure is made
Corresponding analysis has also been develshyoped at the Massachusetts Institute of Techshynology (MIT) but here all shear strengths are normalized according to the SHANSEP proceshydure (Ladd amp Foott 197 4)
A compilation of full scale failure reported in literature tagether with information on plasticity mobilized shear strength and preshyconsolidatian pressure was made in 1980 (Larsson 1980) Fig 18
rtutoc bull EMBANKMENTS o FOUNDATIONS a LOADI NG TESTS
05 x DATA FROM SKEMPTON 1948 bull LONG SLOPES
04 o bull
03 ~~tu AVERAGE _--_ bull o02 l-
01
o o 50 100 150
Fg 78 Mob~zed uncAcU_ned -6 heaJL JJtJLength at J ~LULe a-6 a Junction oJ the uqud -Umt ( L(()L6JJ on 7980)
The compilation includes failures of road emshybankments failures under silos and oil storshyage tanks results from test embankments and other load tests and some slope failures Fig 18 shows that the results spread someshywhat but apart from some landslides in low plastic sensitive clay the empirical value for the average shear strength from labratory tests correlated weil to the strength that could be mobilized in the field
Correlations between empirical relations and shear strength values obtained by vane shear tests and fall cone tests
Direct shear tests usually give shear strengths directly compatible to strength values from vane shear tests and fall cone tests corrected according to this recommenshydation This is as expected if the empirical relation for shear strength and Hanbos relashytion Tv =o cmiddot 045 w1 is valid Fig 19
04 Empirical rbulllation for _ - shy
03 ~-02
01 Corrected whlls from vane shear tests ond fall con~ tests
O O 20 40 60 80 100 120 140 160 180
LIOUID LIMIT wl
Fg 79 CoMelation-6 baween empUUcat -6 heaJL JJtJLength cvt cUJcect -6 heaJL and coMected van e -6 hecUL and JaLf cone vatuu catculcvted by Han-6bo -6 JLelation T v = o ~ middot O 45 wL and new JLecommended coMection
This means that campared to the corrected strength determined by vane shear tests and fall cone tests active triaxial tests normally give higher shear strengths and passive tri shyaxial tests normally give lower undrained shear strengths Averages of the undrained shear strength from active and passive tri shyaxial tests and direct shear tests are someshywhat higher than the corrected strength from vane shear tests and fall cone tests The difshyference increases with decreasing plasticity
Fig 20 shows correction factors for strength values measured by vane shear tests and fall cone tests which would normally have to be used to obtain a complete correspondence both to results from direct shear tests and also to averages of active and passive triaxial tests and direct shear tests
29
06
05
Fig ZO Co~ection fiaeto~ fio~ ~tnength vatuu detvunined by vane ~heM tuu and naLe cone tuu ~equined to co~upond to a ~eet ~heM tuu b avvwqu n~om active
paM-ive tnaxJat tuu and and
~eet ~heM tuu
Compilation of results and comparison with the new recommended correction
The results from all the above mentioned inshyvestigations since 1969 are fairly unanimous Different correction factors suggested or indirectly derived are compiled in Fig 21
The correction factor p= 145(1 +wL) suggesshyted by Helenelund in 1977 gives a relatively good correspondence to all other results However it gives a flatter curve than the other relations in Fig 21 and therefore a sernewhat low correction factor for very low plastic clays a sernewhat high correction factor for medium plastic clays and a someshywhat low correction for very high plastic orshyganic soils Andreassons suggestion from 1974 agrees well with other results for low and medium plastic soils but gives relatively high correction factors for high plastic and organic soils As mentioned earlier no Seanshydinavia n very high plastic clays or organic soils were included in the basic data for Andreassons suggestion
Swedish experience is that in soils with high liquid limit considerably lower correction factors must be used than those in Andreasshysons suggestion According to the SGI recommendations from 1969 a correction facshytor of 05 should be used for all soils with a liquid limit over 180 and according to reshycommendations from the Swedish Road Adshyministation correction should be made for organic content according to lJ= 08 wL The Swedish National Road Administration also uses 05 as the lowest correction factor but on the other hand it considers that a higher calculated factor of safety against failure is required in very high plastic soils
The numerical base for correction factors for Scandinavian organic soils with very high liquid limits is however very deficient and is mainly limited to the earrelations with qualified laboratory investigations reported by Slunga 1983 and findings from current reshysearch at SGI
The mathematical expression for the correcshytion factor best corresponding to the correcshytion factors which have emerged from differshyent investigations is shown in Fig 22
= (043) 045 Aring WL
This relation gives an upper limit of Aringmax 13 when applied to Scandinavian clays and organic soils Clays with a lower liquid limit than about 2496 hardly occur in this region Owing to the great sensitivity of the correction factor for small changes in the liquid limit and the great spread in shear strength values often found in low plastic soils no correction factors higher than 12 should be used without support from complementary investigations
Norwegian experience (Aas et al 1984) and the curve for average shear strength from Larsson (1977 1980) indicate that for stabshyility calculations of embankments on harizontal ground the strength could be increased further for very low plastic clays On the other hand anisotropy is neither in Sweden nor abroad determined from this type of strength test but a value intended to be used generally is produced It can hardly be regarded as acceptable to use a test procedure where the obtained strength value should be increased by more than 20 before it is used In these extreme cases it can be observed that neither vane shear tests nor cone tests work sufficiently well and that if higher strengths are to be utilized other test procedures such as direct shear tests and triaxial tests should be used
30
)l
bull bull bull bull Andreasson 197417 )l 11 u ~lt Corredion for disturbance
ettects and rate etteds16 at vane shear tests
--- Helenelund 197715 Correction according to correlation
with ~ualitied loborotory invest igot ions14 Correction for high liquid limits according to SGI 196913
12
11 100 150 200 WL 0o101+---------t-+------+-----+-----+-------=--shy
09
08
07
06
05 -~--tf- ---)(-shy04 --~
Fig 21 CoJUtetattoYL-6 betwe_e_n cU_-66eAent coJUtection iacAoM ioJt JdJtength valueJ dueAmine_d by vane_ gtheM teJtlgt and iloLt cone_ teJtlgt
31
11
04
The following is therefore recommended as a general correction factor for vane shear test values and cone test values applied to averages of the strength values obtained
043 045 1-1 = (V L) Q5
with the reservation that correction factors higher than 12 should not be used without complementary investigations
As was concluded from earrelations between Bjerrums correction factors and SGIs recommendation from 1969 (Andreasson 1974) this new procedure does not imply any greater difference in evaluated undrained shear strength campared with the earlier procedure with cautiously selected strength values and SGIs correction from 1969 The corrected strength for very low plastic clays becomes however samewhat higher according to the new suggestion
The intention with the new procedure is primarily an adaption to a different and more uniform evaluation of the measured data
-p= [~~3] 045
10-+----------lll-+--------+----+------+-------shy
13 --Other correction factors from
Fig20
12
100 150 200 W 0o
09
O
07
06
05
F-ig 22 CoJULUatioU beXween -the JLUation JJ (O 43) O 45 and o-theJL ouggeo-ted coMeruon 6ac-toM WL
32
STATENS GEOTEKNISKA INSTITUT Besoumlksadress Olaus Magnus Vaumlg 35
Postadress 58101 Linkoumlping Telefon013-115100
T~yck-Cente~ AB Linkoumlping 1985

x
1975 In 1976 Aas made a suggestion for how the vane shear values could be corrected in Norwegian clays with respect to the relation between the measured strength value and the existing overburden pressure
An extensive review of the different correcshytion factors which also included some cases from Sweden not earlier taken into account was made in 1977 by Helenelund who at that time was visiting research worker at SGI Based on this material a correction factor in the order of
ll 145 l+w1
was suggested
This correction essentially earresponds to the Bjerrum correction but the correction of the measured strength becomes greater for organic high plastic soils
1 l
l
14 ix)
~ 12
Il
LLm 10 o
08
06 20 50 100 150 200
wl
o Data from Andreasson 1974
(v l LLAB Slunga 1983
bull Lv l( LAB organic so il (SGI)
-- Andreassons suggestion for correction 1974
45---fl= 1 middot ( Helenelund 1977)1+Wl
--fl-= r-~~3) 045
Fig 7O EvaluMed oajety jactoM M ja_f_UJLe FB = 1ll a-6 a ju~ctio~ oj liquid LUrlit compCVLed to ouggeoted cotcshytcectio~ jactoM
By inserting the Hansbo relation T v = ocmiddot045 w1 Helenelunds suggested correction can als o be wri tten
145 l +222 Tv jo b
Recently an extensive investigation of the properties of organic soil has been completed in Finland (Slunga 198 3) and a si m ilar investi shygation is in progress at SGI
Purther results from Norway have also been presented by Aas et al 1984
All the compilations of test results involve a spread and suggested correction factors become an adaption to the curves for avershyages
bull20
18 bull _ x
16 o o ~
4~1-shy Il
p~Q
~v o A
lLID 12 o
~ 1o
o
o 8
t v
)
vj o
o
o 02 04 06 08 lvO~ aU(vfO~
o Data from Helenelund 1977 x 1v l 1LAB Slunga 1983 bull 1v l 1LAB organ ic so il (SGI )
1 45 ---~ = i( lO ( Helenelund 1977)1+ 2 22 l v c
-~ = [0193middot] 045 1vl0c
Fig 77 EvaluMed oajety jactoM M ja_f_UJLe FB = 1ll ao a ju~ctio~ oj the tcelashytio~ betwee~ the ottce~gth value meaoWLed by va~ e -6 heCVL teot-6 a~d the ptcecoMotidatio~ ptce-6-0WLe (al shytetc~ativety e j j edive OvetcbWLde~ ptce-6-0WLe) compCVLed to -6 ug g eoted coMeetio~ jactoM
24
Fig l O shows the values evaluated by Andreasson 197 4 supplemented with relations between results from vane shear tests and qualified laboratory tests (averages from dishyrect shear tests and active and passive tri shyaxial tests) from Slunga 1983 and from reshysearch at SGI In the figure the curves earshyrespanding to the corrections suggested by Andreasson 197 4 and Helenelund 1977 are inserted tagether with the correction now recommended by SGI
25
x20 --x bull
15 bullbull ------ ---shy
-x x o~
10 l o~ ~~ () 5 o
gm o
o o 01 02 03 04 05 06 07 08 09 1 o
tJO~ (( 0~ l
bull Full scale failure o earrelation with qualified loborotory investigation
x earrelation with qualified loborotory investigation
for arganie so il ( Slunga 1983 SGl )
_ P= [omiddot 193 middot) o45 LV OC
Fi g 72 E vatwaringe_d o aJ ety nacAoM at J aUULe_ (Aao et at vatue_o ) comptete_d w-U h vatue_o fJ Lom M ganic 6 oili compMe_d to coMe_ction fJacAoM L ecommended by SGI
Fig 11 shows the values evaluated by Heleneshylund 1977 supplemented in the same way as the values evaluated by Andreasson in Fig l O w i t h values from organic soils Helenelund presented his values as calculated safety facshytors at failure FB = 1 ll versus bullvo0 As bullv is dependent on ob this presentation gives an unnecessarily large spread since the values from normally consolidated and overconsoli shydated clays are mixed To the extent that information has been available the values have therefore been converted and existing effective overburden pressure o0 has been replaced by the preconsolidation pressure ob Some cases where investigation has shown that the drained strength has been lower than the undrained strength or complementary information is missing have been excluded Curves corresponding to the correction suggested by Helenelund 1977 and the correcshytion now recommended by SGI (both rewritten with the Hansbo relation bullv = obmiddot045 w1) a re inserted in Fig 11
At the Nordie Geotechnical Meeting (NGM) in Linkoumlping 1984 Aas et al presented a comshypilation of comparisons for the relation beshytween FB and bullvo 0 Fig 12 The compilation included comparisons with full scale failures in the field as well as comparisons with quali shyfied laboratory investigations The points in the figure originate from normally Consolishydated and slightly overconsolidated clays and a certain displacement of the points to the left in the figure would occur if all points could be calculated versus ob To complete the picture the points for organic soils from Slunga 1983 and SGI have been inserted
Results from research on vane shear tests
During the 196Os and the beginning of the 1970s extensive research was carried out to determine which factors influence the results from vane shear tests The factors investi shygated were shape and construction of the vane waiting time after installation before strength testing starts and tagether speed of rotation during the test
The shape and construction of the vane proved to have great importance for the reshysults In Sweden however vanes with the rela tionship 21 between height and width of the biades are alwa ys used and the empir shyical experience is based on this type of vane In Sweden two types of vane shear equipment are used today vane shear equipment of the SGI type where the vane is withdrawn in a protective casing during most of the driving and vane shear equipment of the NilconGeoshytech typewhere the vane is driven directly into the soil As the latter vane is unprotecshyted during driving the design must be made samewhat more robust than for the SGI equipment In the SGI vane shear equipment the vane rod is also encased Torstensson (1977) has found that at rotation speeds reshycommended by the manufacturer failure occurs approximately three times faster with the NilconGeotech apparatus than with the SGI apparatus The results often seem to be compatible
The SGI apparatus is a relatively heavy piece of equipment while the NilconGeotech apshyparatus is very easy to handle On the other hand the SGI apparatus would normally disturb the soil less and in addition the vane is scraped clean after each test With the NilconGeotech apparatus there is a risk that clay from a firmer layer can stick to the vane and accompany the vane into looser layers with disturbance of the soil as a result Preshyboring through the dry crust is therefore al shy
25
ways recommended when using the Nilcon Geotech apparatus Even then problems can occur in layered or varved so il sensiti ve to disturbance
Through studies of the influence on the wait shying time between installation of the vane and the shear tests i t has appeared that the longer the waiting time the higher the measured shear strength is up to a certain waiting time (lt l day) after w hi ch the value becomes constant The increase in strength with waiting time could be due to reconsoli shydation after the disturbance occurring at inshystallation of the vane Recommended proceshydure is that the strength test be started withshyin 5 minutes after installation Within this period no significant increase of the strength value occurs
Compilation of the relations between measured strength after one day of waiting T lD and measured strength according to the standard procedure T 0 shows that the relashytion TlDI T0 increases considerably at deshycreasing liquid limit which means that the disturbance at installation of the vane is normally greatest in low plastic clays The spread also increases at decreasing liquid limit Fig 13
In studies of the influence of speed of rotashytion on measured strength values a connecshytion between measured strength values and speed of rotation has in most cases been found This can be written
where Tt = measured strength value at a rotashy
tion speed which gives the time t to failure
Tl =reference strength value measured at a rotation speed which gives time t1 to failure
t1 = reference time Usually 1-3 minshyutes corresponding to recommendshyed procedure
13 = coefficient
24
23
22
21
2
19
18 l
19
16
l15 14
bull
13 ~
12 bull 11 bull 10+-----~--------------------------
0 50 100 150 200 LIQUID L l MIT wl
e Average
D Spread at ene site
Fig 73 Comp~on b~een ~~ength valuu mealJUJLed by vane ~heM tuu aJtVL one day oJ waiting T JV and valuu meUJLed accOLdtng to the ~tandMd pLo cedUJLe T 0 bull
Fig 14 shows measured values of the coefshyficient from vane shear tests supplemented by amp-values from other types of tests on orshyganic soil collected from Slunga 1983
As is shown in Fig 14 the rate effect decreases somewhat at decreasing plasticity
In a summary of the results from research on vane shear tests Torstensson (1977) showed that if both disturbance and rate efshyfects are taken into account for time to fail shyure of about one week strength values are obtained that are about the same as the strength values measured by the standard procedure and corrected according to Bjershyrums recommendation of 1973
26
o o
~ 006 bull f-z 005 bull bull bull UJ loJ004 bullu LL 003 bullLL UJ o 002 u
001
o o 50 100 150 200 LIQUID LIMIT wL
bull Data from Larsson 1982 b o Data from Slunga 1983
F~g 74 Th~ ~o~t)t)~ci~nt ~ ~ a t)un~on at) liq~d LUnd
17 l16 l
15 l 1 110 0~14
13
- 12
11
100 15 0 200 10
09
08
07
06
05
04
F~g 75 CoM~~on t)actofL ll t)ofL JJtfL~ngth valueo m~~ufL~d
a~~ofL~ng to JJtandatLd pLoshy~~dUfL~ by van~ c h~atL teotJ ~n~u~ng ~tltl~~ at) ~shytUtLban~~ at ~nctalt~on at) th~ van~ and fLat~ ~tlb~~ t)ofL ~~ to t)~UtL~ at) 7 w~~k to 7 month
If the correction for disturbance at installashytion obtained in Fig 13 is corrected for rate effects so that instead of applying to a time to failure of 1- 3 minutes it earresponds to more normal times to failure of l week to l month a total correction for the measured strength according to the standard procedure is obtained Fig 15 The correcti9~ factor ll has been caleulat ed as ll = l O O O O middot Tl DiT 0 and has been assumed to follow the relation in Fig 14
As the disturbance has been found to be greatest in low plastic clays where the rate effects are smallest the final result is that the strength values measured by the normal procedure in low plastic clays are not be reshyduced and that the correction factor may even be greater than l The higher the plasti shycity is the smaller is the disturbance and the greater the rate effects become Conseshyquently the correction factor decreases with increasing plasticity
Empirical relations for undrained shear strength
Different values of the undrained shear strength are obtained in di f f e rent tests deshypending on the loading case The shear strength is thus anisotropic A hypothesis for the variation of the shear strength with the loading case in inorganic clays was presented by Larsson in 1977
The undrained shear strength is usually divishyded into shear strengths in three main types of loading active shear when the vertical stress is the largest principal stress passive shear when the harizontal stress is the largest principal stress and direct shear where the normal stress towards the harizontal slip surshyface is constant but the shear stresses inshycrease In the laboratory the three loading cases can be simulated by active and passive triaxial tests and direct shear tests Fig 16
Results from active and passive triaxial tests and direct shear tests on Seandinavian clays reported in the literature tagether with conshysistency limits and preconsolidation pressures were compiled tagether with unpublished data from investigations at SGI in 1980 (Larsson 1980) Since then additional data have beem obtained and is included in Fig 17
There are no corresponding empirical relashytions for organic clays as yet but research on the properties of these soils is going on The results from direct shear tests are close to the average of active and passive triaxial tests and direct shear tests
27
l l-~o- c=)
Pass i ve zon e Zene of d irect Active zone Passive s hear Act i ve triaxial test Direct sheor test triaxial test
Fig 76 Main typvo ofi toading ca~gteA with JteApect to Mil arUotJtopy and coJtJteAponding taboJtatoJty tvoU
x x
- -- ---X-------- ---- shyx x x
x 03 x x x
x
x Ltu ACTIVEx
bull ffu DIRECT SHEAR
o ffu PASSIVEo D fCR PASSIVE02
- ftu AVERAGE
D 01 D
D D
D
o o 20 40 60 80 100
Fig 77 UndJtained oheaJt otJtength in Scandinavian inOJtganic ctayo all a fiuncUon ofi the pJteconooUdation pJteAOUJte and the Uquid LUnd TCRbull coJtJteApondo to the oheaJt otJtength mobitized at a defioJtmation coJtJteAponding to defioJtmation at fiailUJte n acUve tvoU TheJtefioJte the otJtength ofi fiailUJte TPASSIVE io oomewhat higheJt than TCRmiddot Vata main-ty fiJtom LaJtMon 7 980
28
-----
Correlations between empirical relations and full scale failures in the field
The relevance for undrained shear strength determined by qualified laboratory investi shygation has been continuously shown in the investigations primarily made by the Norweshygian Geotechnical Institute (NGI) NGI has developed the ADP-analysis (active-direct shear-passive) and this analysis is used in all qualified investigations Aas 1976 Normally no earrelation with the preconsolidation pressure is made
Corresponding analysis has also been develshyoped at the Massachusetts Institute of Techshynology (MIT) but here all shear strengths are normalized according to the SHANSEP proceshydure (Ladd amp Foott 197 4)
A compilation of full scale failure reported in literature tagether with information on plasticity mobilized shear strength and preshyconsolidatian pressure was made in 1980 (Larsson 1980) Fig 18
rtutoc bull EMBANKMENTS o FOUNDATIONS a LOADI NG TESTS
05 x DATA FROM SKEMPTON 1948 bull LONG SLOPES
04 o bull
03 ~~tu AVERAGE _--_ bull o02 l-
01
o o 50 100 150
Fg 78 Mob~zed uncAcU_ned -6 heaJL JJtJLength at J ~LULe a-6 a Junction oJ the uqud -Umt ( L(()L6JJ on 7980)
The compilation includes failures of road emshybankments failures under silos and oil storshyage tanks results from test embankments and other load tests and some slope failures Fig 18 shows that the results spread someshywhat but apart from some landslides in low plastic sensitive clay the empirical value for the average shear strength from labratory tests correlated weil to the strength that could be mobilized in the field
Correlations between empirical relations and shear strength values obtained by vane shear tests and fall cone tests
Direct shear tests usually give shear strengths directly compatible to strength values from vane shear tests and fall cone tests corrected according to this recommenshydation This is as expected if the empirical relation for shear strength and Hanbos relashytion Tv =o cmiddot 045 w1 is valid Fig 19
04 Empirical rbulllation for _ - shy
03 ~-02
01 Corrected whlls from vane shear tests ond fall con~ tests
O O 20 40 60 80 100 120 140 160 180
LIOUID LIMIT wl
Fg 79 CoMelation-6 baween empUUcat -6 heaJL JJtJLength cvt cUJcect -6 heaJL and coMected van e -6 hecUL and JaLf cone vatuu catculcvted by Han-6bo -6 JLelation T v = o ~ middot O 45 wL and new JLecommended coMection
This means that campared to the corrected strength determined by vane shear tests and fall cone tests active triaxial tests normally give higher shear strengths and passive tri shyaxial tests normally give lower undrained shear strengths Averages of the undrained shear strength from active and passive tri shyaxial tests and direct shear tests are someshywhat higher than the corrected strength from vane shear tests and fall cone tests The difshyference increases with decreasing plasticity
Fig 20 shows correction factors for strength values measured by vane shear tests and fall cone tests which would normally have to be used to obtain a complete correspondence both to results from direct shear tests and also to averages of active and passive triaxial tests and direct shear tests
29
06
05
Fig ZO Co~ection fiaeto~ fio~ ~tnength vatuu detvunined by vane ~heM tuu and naLe cone tuu ~equined to co~upond to a ~eet ~heM tuu b avvwqu n~om active
paM-ive tnaxJat tuu and and
~eet ~heM tuu
Compilation of results and comparison with the new recommended correction
The results from all the above mentioned inshyvestigations since 1969 are fairly unanimous Different correction factors suggested or indirectly derived are compiled in Fig 21
The correction factor p= 145(1 +wL) suggesshyted by Helenelund in 1977 gives a relatively good correspondence to all other results However it gives a flatter curve than the other relations in Fig 21 and therefore a sernewhat low correction factor for very low plastic clays a sernewhat high correction factor for medium plastic clays and a someshywhat low correction for very high plastic orshyganic soils Andreassons suggestion from 1974 agrees well with other results for low and medium plastic soils but gives relatively high correction factors for high plastic and organic soils As mentioned earlier no Seanshydinavia n very high plastic clays or organic soils were included in the basic data for Andreassons suggestion
Swedish experience is that in soils with high liquid limit considerably lower correction factors must be used than those in Andreasshysons suggestion According to the SGI recommendations from 1969 a correction facshytor of 05 should be used for all soils with a liquid limit over 180 and according to reshycommendations from the Swedish Road Adshyministation correction should be made for organic content according to lJ= 08 wL The Swedish National Road Administration also uses 05 as the lowest correction factor but on the other hand it considers that a higher calculated factor of safety against failure is required in very high plastic soils
The numerical base for correction factors for Scandinavian organic soils with very high liquid limits is however very deficient and is mainly limited to the earrelations with qualified laboratory investigations reported by Slunga 1983 and findings from current reshysearch at SGI
The mathematical expression for the correcshytion factor best corresponding to the correcshytion factors which have emerged from differshyent investigations is shown in Fig 22
= (043) 045 Aring WL
This relation gives an upper limit of Aringmax 13 when applied to Scandinavian clays and organic soils Clays with a lower liquid limit than about 2496 hardly occur in this region Owing to the great sensitivity of the correction factor for small changes in the liquid limit and the great spread in shear strength values often found in low plastic soils no correction factors higher than 12 should be used without support from complementary investigations
Norwegian experience (Aas et al 1984) and the curve for average shear strength from Larsson (1977 1980) indicate that for stabshyility calculations of embankments on harizontal ground the strength could be increased further for very low plastic clays On the other hand anisotropy is neither in Sweden nor abroad determined from this type of strength test but a value intended to be used generally is produced It can hardly be regarded as acceptable to use a test procedure where the obtained strength value should be increased by more than 20 before it is used In these extreme cases it can be observed that neither vane shear tests nor cone tests work sufficiently well and that if higher strengths are to be utilized other test procedures such as direct shear tests and triaxial tests should be used
30
)l
bull bull bull bull Andreasson 197417 )l 11 u ~lt Corredion for disturbance
ettects and rate etteds16 at vane shear tests
--- Helenelund 197715 Correction according to correlation
with ~ualitied loborotory invest igot ions14 Correction for high liquid limits according to SGI 196913
12
11 100 150 200 WL 0o101+---------t-+------+-----+-----+-------=--shy
09
08
07
06
05 -~--tf- ---)(-shy04 --~
Fig 21 CoJUtetattoYL-6 betwe_e_n cU_-66eAent coJUtection iacAoM ioJt JdJtength valueJ dueAmine_d by vane_ gtheM teJtlgt and iloLt cone_ teJtlgt
31
11
04
The following is therefore recommended as a general correction factor for vane shear test values and cone test values applied to averages of the strength values obtained
043 045 1-1 = (V L) Q5
with the reservation that correction factors higher than 12 should not be used without complementary investigations
As was concluded from earrelations between Bjerrums correction factors and SGIs recommendation from 1969 (Andreasson 1974) this new procedure does not imply any greater difference in evaluated undrained shear strength campared with the earlier procedure with cautiously selected strength values and SGIs correction from 1969 The corrected strength for very low plastic clays becomes however samewhat higher according to the new suggestion
The intention with the new procedure is primarily an adaption to a different and more uniform evaluation of the measured data
-p= [~~3] 045
10-+----------lll-+--------+----+------+-------shy
13 --Other correction factors from
Fig20
12
100 150 200 W 0o
09
O
07
06
05
F-ig 22 CoJULUatioU beXween -the JLUation JJ (O 43) O 45 and o-theJL ouggeo-ted coMeruon 6ac-toM WL
32
STATENS GEOTEKNISKA INSTITUT Besoumlksadress Olaus Magnus Vaumlg 35
Postadress 58101 Linkoumlping Telefon013-115100
T~yck-Cente~ AB Linkoumlping 1985
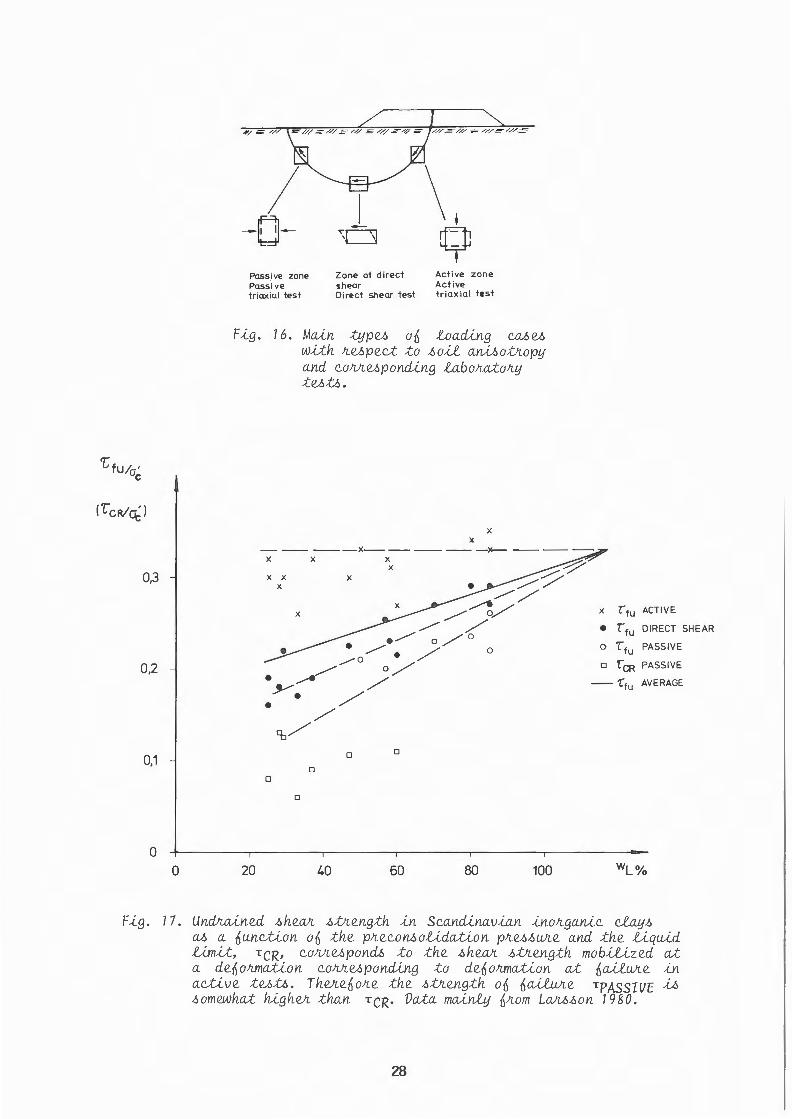
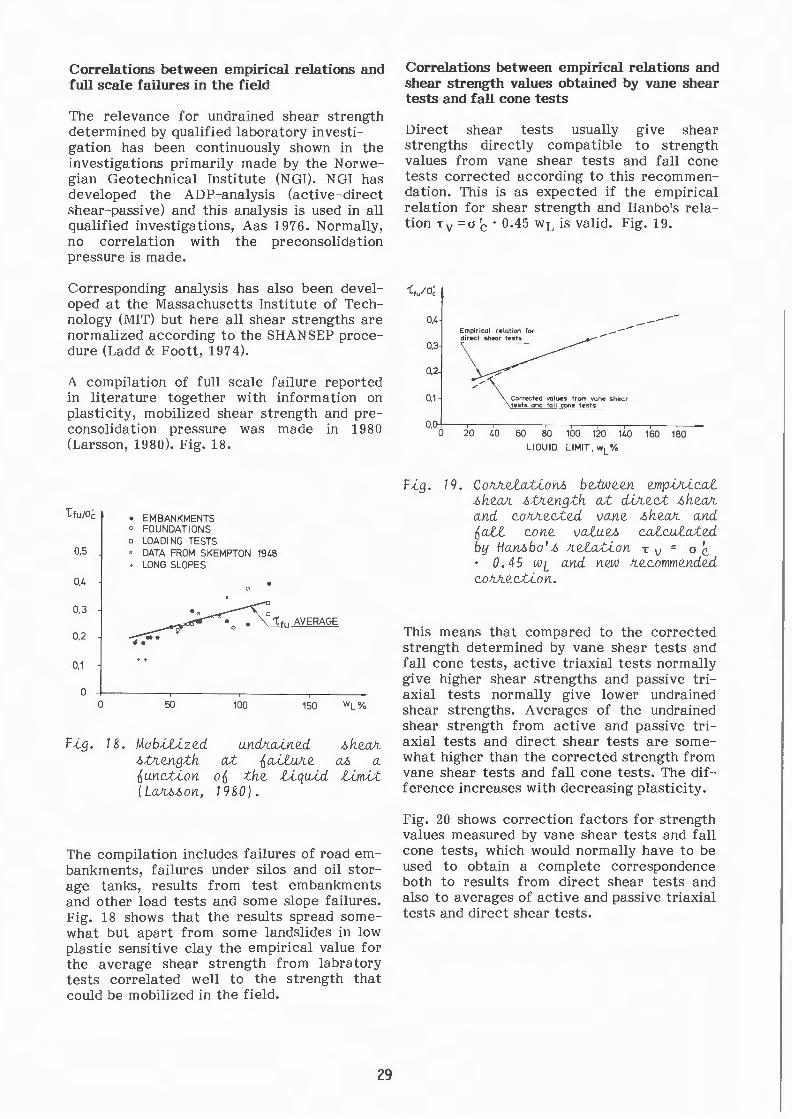
06
05
Fig ZO Co~ection fiaeto~ fio~ ~tnength vatuu detvunined by vane ~heM tuu and naLe cone tuu ~equined to co~upond to a ~eet ~heM tuu b avvwqu n~om active
paM-ive tnaxJat tuu and and
~eet ~heM tuu
Compilation of results and comparison with the new recommended correction
The results from all the above mentioned inshyvestigations since 1969 are fairly unanimous Different correction factors suggested or indirectly derived are compiled in Fig 21
The correction factor p= 145(1 +wL) suggesshyted by Helenelund in 1977 gives a relatively good correspondence to all other results However it gives a flatter curve than the other relations in Fig 21 and therefore a sernewhat low correction factor for very low plastic clays a sernewhat high correction factor for medium plastic clays and a someshywhat low correction for very high plastic orshyganic soils Andreassons suggestion from 1974 agrees well with other results for low and medium plastic soils but gives relatively high correction factors for high plastic and organic soils As mentioned earlier no Seanshydinavia n very high plastic clays or organic soils were included in the basic data for Andreassons suggestion
Swedish experience is that in soils with high liquid limit considerably lower correction factors must be used than those in Andreasshysons suggestion According to the SGI recommendations from 1969 a correction facshytor of 05 should be used for all soils with a liquid limit over 180 and according to reshycommendations from the Swedish Road Adshyministation correction should be made for organic content according to lJ= 08 wL The Swedish National Road Administration also uses 05 as the lowest correction factor but on the other hand it considers that a higher calculated factor of safety against failure is required in very high plastic soils
The numerical base for correction factors for Scandinavian organic soils with very high liquid limits is however very deficient and is mainly limited to the earrelations with qualified laboratory investigations reported by Slunga 1983 and findings from current reshysearch at SGI
The mathematical expression for the correcshytion factor best corresponding to the correcshytion factors which have emerged from differshyent investigations is shown in Fig 22
= (043) 045 Aring WL
This relation gives an upper limit of Aringmax 13 when applied to Scandinavian clays and organic soils Clays with a lower liquid limit than about 2496 hardly occur in this region Owing to the great sensitivity of the correction factor for small changes in the liquid limit and the great spread in shear strength values often found in low plastic soils no correction factors higher than 12 should be used without support from complementary investigations
Norwegian experience (Aas et al 1984) and the curve for average shear strength from Larsson (1977 1980) indicate that for stabshyility calculations of embankments on harizontal ground the strength could be increased further for very low plastic clays On the other hand anisotropy is neither in Sweden nor abroad determined from this type of strength test but a value intended to be used generally is produced It can hardly be regarded as acceptable to use a test procedure where the obtained strength value should be increased by more than 20 before it is used In these extreme cases it can be observed that neither vane shear tests nor cone tests work sufficiently well and that if higher strengths are to be utilized other test procedures such as direct shear tests and triaxial tests should be used
30
)l
bull bull bull bull Andreasson 197417 )l 11 u ~lt Corredion for disturbance
ettects and rate etteds16 at vane shear tests
--- Helenelund 197715 Correction according to correlation
with ~ualitied loborotory invest igot ions14 Correction for high liquid limits according to SGI 196913
12
11 100 150 200 WL 0o101+---------t-+------+-----+-----+-------=--shy
09
08
07
06
05 -~--tf- ---)(-shy04 --~
Fig 21 CoJUtetattoYL-6 betwe_e_n cU_-66eAent coJUtection iacAoM ioJt JdJtength valueJ dueAmine_d by vane_ gtheM teJtlgt and iloLt cone_ teJtlgt
31
11
04
The following is therefore recommended as a general correction factor for vane shear test values and cone test values applied to averages of the strength values obtained
043 045 1-1 = (V L) Q5
with the reservation that correction factors higher than 12 should not be used without complementary investigations
As was concluded from earrelations between Bjerrums correction factors and SGIs recommendation from 1969 (Andreasson 1974) this new procedure does not imply any greater difference in evaluated undrained shear strength campared with the earlier procedure with cautiously selected strength values and SGIs correction from 1969 The corrected strength for very low plastic clays becomes however samewhat higher according to the new suggestion
The intention with the new procedure is primarily an adaption to a different and more uniform evaluation of the measured data
-p= [~~3] 045
10-+----------lll-+--------+----+------+-------shy
13 --Other correction factors from
Fig20
12
100 150 200 W 0o
09
O
07
06
05
F-ig 22 CoJULUatioU beXween -the JLUation JJ (O 43) O 45 and o-theJL ouggeo-ted coMeruon 6ac-toM WL
32
STATENS GEOTEKNISKA INSTITUT Besoumlksadress Olaus Magnus Vaumlg 35
Postadress 58101 Linkoumlping Telefon013-115100
T~yck-Cente~ AB Linkoumlping 1985

STATENS GEOTEKNISKA INSTITUT Besoumlksadress Olaus Magnus Vaumlg 35
Postadress 58101 Linkoumlping Telefon013-115100
T~yck-Cente~ AB Linkoumlping 1985
Copyright © 2022 FDOKUMEN