PROBING THE BALANCE OF AGN AND STAR-FORMING ...
20
The Astrophysical Journal, 705:1336–1355, 2009 November 10 doi:10.1088/0004-637X/705/2/1336 C 2009. The American Astronomical Society. All rights reserved. Printed in the U.S.A. PROBING THE BALANCE OF AGN AND STAR-FORMING ACTIVITY IN THE LOCAL UNIVERSE WITH ChaMP Anca Constantin 1 , Paul Green 1 , Tom Aldcroft 1 , Dong-Woo Kim 1 , Daryl Haggard 2 , Wayne Barkhouse 3 , and Scott F. Anderson 2 1 Harvard-Smithsonian Center for Astrophysics, Cambridge, MA 02138, USA 2 Department of Astronomy, University of Washington, Seattle, WA, USA 3 Department of Physics and Astrophysics, University of North Dakota, Grand Forks, ND 58202, USA Received 2009 March 27; accepted 2009 September 29; published 2009 October 20 ABSTRACT The combination of the Sloan Digital Sky Survey (SDSS) and the Chandra Multiwavelength Project (ChaMP) currently offers the largest and most homogeneously selected sample of nearby galaxies for investigating the relation between X-ray nuclear emission, nebular line emission, black hole masses, and properties of the associated stellar populations. We provide X-ray spectral fits and valid uncertainties for all the galaxies with counts ranging from 2 to 1325 (mean 76, median 19). We present here novel constraints that both X-ray luminosity L X and X-ray spectral energy distribution bring to the galaxy evolutionary sequence H ii → Seyfert/Transition Object → LINER → Passive suggested by optical data. In particular, we show that both L X and Γ, the slope of the power law that best fits the 0.5–8 keV spectra, are consistent with a clear decline in the accretion power along the sequence, corresponding to a softening of their spectra. This implies that, at z ≈ 0, or at low-luminosity active galactic nucleus (AGN) levels, there is an anticorrelation between Γ and L/L edd , opposite to the trend exhibited by high z AGN (quasars). The turning point in the Γ–L/L edd LLAGN + quasars relation occurs near Γ ≈ 1.5 and L/L edd ≈ 0.01. Interestingly, this is identical to what stellar mass X-ray binaries exhibit, indicating that we have probably found the first empirical evidence for an intrinsic switch in the accretion mode, from advection-dominated flows to standard (disk/corona) accretion modes in supermassive black hole accretors, similar to what has been seen and proposed to happen in stellar mass black hole systems. The anticorrelation we find between Γ and L/L edd may instead indicate that stronger accretion correlates with greater absorption. Therefore, the trend for softer spectra toward more luminous, high redshift, and strongly accreting (L/L edd 0.01) AGNs/ quasars could simply be the result of strong selection biases reflected in the dearth of type 2 quasar detections. Key words: galaxies: active – galaxies: evolution – galaxies: nuclei – surveys – X-rays: galaxies Online-only material: color figures 1. INTRODUCTION: BH ACCRETION, THE LOW-LUMINOSITY AGN, AND X-RAY EMISSION Understanding the nuclear activity in nearby galaxies is essential for constraining the galaxy formation and evolution process. While energetically unimpressive, the nearby galactic nuclei offer the best-case scenario for (1) the most common state of accretion in the current universe, (2) the end-point of quasar evolution, or simply (3) their scaled-down version. Observationally, the low redshift z ≈ 0 accretion systems are the best testbeds for identifying the processes involved in triggering and further fuelling accretion onto the central black hole (BH) because they offer unique joint investigations of both the nuclear accretion and the properties of the host, i.e., the star formation (SF). Unlike the optically luminous quasars, which are radiating close to their Eddington limit (Kollmeier et al. 2006), and only for short (∼10 7 yr) times (Yu & Tremaine 2002), accretion activity in nearby galaxy centers appears extremely diverse, spanning >6 orders of magnitude in the Eddington ratio and (maybe consequently) a wide range in their duty-cycles (Heckman et al. 2004; Ho 2008). This variety provides empiri- cal constraints to model predictions linking the BH growth rate and the host bulge formation. The two are indeed connected: it is the younger galaxies that host the more rapidly growing BHs (Heckman et al. 2004; Cid Fernandes et al. 2005; Constantin et al. 2008). However, the exact physical mechanism responsi- ble for this link, and in general for the close interplay between SF and BH accretion, remains elusive. Simulations place im- portant constraints on different models for the way black holes are fueled and provide a quantitative and physical distinction between local, low-luminosity, weak (or quiescent) AGN ac- tivity, and violent, merger-driven bright quasars (e.g., Hopkins & Hernquist 2006, 2009). Environmental studies of the nearby active galactic nuclei (AGNs) are consistent with these ideas of non-merger-driven fueling for the weak BH growth observed in the nearby universe (Constantin & Vogeley 2006; Constantin et al. 2008). More recent analyses of the observed distribution of Eddington ratios as a function of the BH masses provides addi- tional constraints, suggesting that even at z ≈ 0 there might be two distinct regimes of BH growth, which are determined by the supply of cold gas in the host bulge. The BH regulates its own growth at a rate that is independent of the interstellar medium’s characteristics as long as the gas is plentiful, but when the gas runs out the BH’s growth will be regulated by the rate at which evolved stars lose their mass (Kauffmann & Heckman 2009). These different fueling modes at low luminosities must manifest differently at wavelengths outside the optical regime, allowing further means to constrain and discriminate among them. The most ubiquitous type of activity at z ≈ 0 that resem- bles that of quasars is identified at optical wavelengths as either a narrow-lined Low Ionization Nuclear Emission Re- gions (LINER, L) or a “transition” (T) object, whose properties border on the definition of a starburst galaxy and an AGN. 1336
-
Upload
khangminh22 -
Category
Documents
-
view
4 -
download
0
Transcript of PROBING THE BALANCE OF AGN AND STAR-FORMING ...

The Astrophysical Journal, 705:1336–1355, 2009 November 10 doi:10.1088/0004-637X/705/2/1336C© 2009. The American Astronomical Society. All rights reserved. Printed in the U.S.A.
PROBING THE BALANCE OF AGN AND STAR-FORMING ACTIVITY IN THE LOCAL UNIVERSEWITH ChaMP
Anca Constantin1, Paul Green
1, Tom Aldcroft
1, Dong-Woo Kim
1, Daryl Haggard
2, Wayne Barkhouse
3, and
Scott F. Anderson2
1 Harvard-Smithsonian Center for Astrophysics, Cambridge, MA 02138, USA2 Department of Astronomy, University of Washington, Seattle, WA, USA
3 Department of Physics and Astrophysics, University of North Dakota, Grand Forks, ND 58202, USAReceived 2009 March 27; accepted 2009 September 29; published 2009 October 20
ABSTRACT
The combination of the Sloan Digital Sky Survey (SDSS) and the Chandra Multiwavelength Project (ChaMP)currently offers the largest and most homogeneously selected sample of nearby galaxies for investigating therelation between X-ray nuclear emission, nebular line emission, black hole masses, and properties of the associatedstellar populations. We provide X-ray spectral fits and valid uncertainties for all the galaxies with counts rangingfrom 2 to 1325 (mean 76, median 19). We present here novel constraints that both X-ray luminosity LX andX-ray spectral energy distribution bring to the galaxy evolutionary sequence H ii → Seyfert/Transition Object→ LINER → Passive suggested by optical data. In particular, we show that both LX and Γ, the slope of thepower law that best fits the 0.5–8 keV spectra, are consistent with a clear decline in the accretion power alongthe sequence, corresponding to a softening of their spectra. This implies that, at z ≈ 0, or at low-luminosityactive galactic nucleus (AGN) levels, there is an anticorrelation between Γ and L/Ledd, opposite to the trendexhibited by high z AGN (quasars). The turning point in the Γ–L/Ledd LLAGN + quasars relation occurs nearΓ ≈ 1.5 and L/Ledd ≈ 0.01. Interestingly, this is identical to what stellar mass X-ray binaries exhibit, indicatingthat we have probably found the first empirical evidence for an intrinsic switch in the accretion mode, fromadvection-dominated flows to standard (disk/corona) accretion modes in supermassive black hole accretors, similarto what has been seen and proposed to happen in stellar mass black hole systems. The anticorrelation we findbetween Γ and L/Ledd may instead indicate that stronger accretion correlates with greater absorption. Therefore,the trend for softer spectra toward more luminous, high redshift, and strongly accreting (L/Ledd � 0.01) AGNs/quasars could simply be the result of strong selection biases reflected in the dearth of type 2 quasar detections.
Key words: galaxies: active – galaxies: evolution – galaxies: nuclei – surveys – X-rays: galaxies
Online-only material: color figures
1. INTRODUCTION: BH ACCRETION, THELOW-LUMINOSITY AGN, AND X-RAY EMISSION
Understanding the nuclear activity in nearby galaxies isessential for constraining the galaxy formation and evolutionprocess. While energetically unimpressive, the nearby galacticnuclei offer the best-case scenario for (1) the most commonstate of accretion in the current universe, (2) the end-pointof quasar evolution, or simply (3) their scaled-down version.Observationally, the low redshift z ≈ 0 accretion systems are thebest testbeds for identifying the processes involved in triggeringand further fuelling accretion onto the central black hole (BH)because they offer unique joint investigations of both the nuclearaccretion and the properties of the host, i.e., the star formation(SF).
Unlike the optically luminous quasars, which are radiatingclose to their Eddington limit (Kollmeier et al. 2006), and onlyfor short (∼107 yr) times (Yu & Tremaine 2002), accretionactivity in nearby galaxy centers appears extremely diverse,spanning >6 orders of magnitude in the Eddington ratio and(maybe consequently) a wide range in their duty-cycles(Heckman et al. 2004; Ho 2008). This variety provides empiri-cal constraints to model predictions linking the BH growth rateand the host bulge formation. The two are indeed connected: itis the younger galaxies that host the more rapidly growing BHs(Heckman et al. 2004; Cid Fernandes et al. 2005; Constantinet al. 2008). However, the exact physical mechanism responsi-
ble for this link, and in general for the close interplay betweenSF and BH accretion, remains elusive. Simulations place im-portant constraints on different models for the way black holesare fueled and provide a quantitative and physical distinctionbetween local, low-luminosity, weak (or quiescent) AGN ac-tivity, and violent, merger-driven bright quasars (e.g., Hopkins& Hernquist 2006, 2009). Environmental studies of the nearbyactive galactic nuclei (AGNs) are consistent with these ideas ofnon-merger-driven fueling for the weak BH growth observedin the nearby universe (Constantin & Vogeley 2006; Constantinet al. 2008). More recent analyses of the observed distribution ofEddington ratios as a function of the BH masses provides addi-tional constraints, suggesting that even at z ≈ 0 there might betwo distinct regimes of BH growth, which are determined by thesupply of cold gas in the host bulge. The BH regulates its owngrowth at a rate that is independent of the interstellar medium’scharacteristics as long as the gas is plentiful, but when the gasruns out the BH’s growth will be regulated by the rate at whichevolved stars lose their mass (Kauffmann & Heckman 2009).These different fueling modes at low luminosities must manifestdifferently at wavelengths outside the optical regime, allowingfurther means to constrain and discriminate among them.
The most ubiquitous type of activity at z ≈ 0 that resem-bles that of quasars is identified at optical wavelengths aseither a narrow-lined Low Ionization Nuclear Emission Re-gions (LINER, L) or a “transition” (T) object, whose propertiesborder on the definition of a starburst galaxy and an AGN.
1336

No. 2, 2009 PROBING THE BALANCE OF AGN AND STAR-FORMING ACTIVITY WITH ChaMP 1337
Emission-line ratio diagnostics (e.g., Baldwin et al. 1981;Veilleux & Osterbrock 1987; Kewley et al. 2006) that havebeen quite successful in identifying cases in which the dominantionization mechanism is either accretion onto a black hole (i.e.,Seyferts, Ss) or radiation from hot, young stars (i.e., H ii nuclei),remain inconclusive for the majority of Ls and Ts. The Ls thatexhibit quasar-like broad lines (L1s, by analogy with Seyfert 1s)are unambiguously accretion-powered sources; however, thoselacking these features (the L2s) could have lines generated byshocks, post-starbursts, or other processes unrelated with ac-cretion. Deciphering the underlying emission source(s) of theseambiguous nuclei is an ongoing struggle.
Recent analyses of the emission properties of the low-luminosity AGNs (LLAGNs) in relation to a wide variety ofcharacteristics of their hosts, together with considerations oftheir small and large scale environments, reveal a sequenceH ii → Seyfert/Transition Object → LINER → Passive (H ii
→ S/T → L → P) that these objects obey, at least in a statisti-cal sense (Constantin & Vogeley 2006; Schawinski et al. 2007;Constantin et al. 2008). This sequence traces trends in (1) in-creasing host halo mass, (2) increasing environmental density,(3) increasing central BH mass and host stellar mass, (4) decreas-ing BH accretion rate, (5) aging of the stellar population associ-ated with their nuclei, and (6) decreasing of the amount of dustobscuration, which might translate into a decrease in the amountof material available for star forming or accretion. This sequencetherefore suggests a process of transformation of galaxies fromSF via AGN to quiescence, which may be the first empiricalevidence for an analogous duty cycle to that of the high z brightsystems (i.e., quasars). State-of-the-art hydrodynamical mod-els provide clear support for such a scenario, by showing thatduring mergers, the BH accretion peaks considerably after themerger started and after the star-formation rate has peaked (e.g.,Di Matteo et al. 2005; Hopkins et al. 2006). Constraining the na-ture of this H ii → S/T → L sequence at z ≈ 0 will improve ourunderstanding of the degree to which the LLAGN phenomenonfits into the galactic BH accretion paradigm.
The X-ray emission is, arguably, the most sensitive test foraccretion and its intensity and efficiency, and thus, it is of greatinterest to test and validate this sequence against large homoge-neous X-ray-selected samples. The Chandra MultiwavelengthProject (ChaMP; Green et al. 2004) provides a unique oppor-tunity for this by providing the largest-area Chandra survey todate, which, when cross-matched with the Sloan Digital SkySurvey (SDSS), provides an unprecedented number of galaxiesin the local Universe for which we can combine and contrastmeasurements of the X-ray and optical emission. The sampleof ∼110 Chandra X-ray detected nearby galaxies (excludingbroad-line objects) analyzed in this study represents a signifi-cant improvement in both sample size and homogeneity for bothX-ray selection and optical spectral type coverage.
Previous studies of the relation between the X-ray nuclearemission, optical emission line activity, and black hole massesprovide important physical constraints to the LLAGN phe-nomenon. Almost invariably, the conclusions are that LLAGNsare probably scaled down versions of more luminous AGNs(e.g., Ho et al. 2001; Panessa et al. 2006) and that MBH is not themain driver of the (soft) X-ray properties (Greene & Ho 2007).The LLAGNs are claimed to be X-ray detected at relativelyhigh rates, and are found to be relatively unabsorbed, obscura-tion appearing to play only a minor role in their detection ratesand/or in classifying them as types 1 and 2 in X-rays (Roberts& Warwick 2000; Halderson et al. 2001; Miniutti et al. 2008;
Ho 2008), with the exception of those known to be Comptonthick. Nonetheless, the X-ray investigations of AGN activity atits lowest levels remain largely restricted to Ls and Ss.
Deciphering the ambiguous nature of Ls in particular hasbeen the target of many X-ray studies of LLAGNs focused onthese sources (Yaqoob et al. 1995; Ishisaki et al. 1996; Iyomotoet al. 1998, 2001; Terashima et al. 1998, 2000a, 2000b, 2002;Pellegrini et al. 2000a, 2000b, 2002; Georgantopoulos et al.2002; Ptak et al. 1996, 1999, 2004; Roberts et al. 2000). A hard,power-law AGN signal is generally spectrally resolved for themajority of them, however, the corresponding energy (photon)index is marginally steeper (softer) than that in (broad line) Ss;many of them require a soft thermal component that somehowdiffers from the blackbody soft excess commonly seen in Ss andquasars. The Fe Kα emission or the Compton reflection com-ponent is usually weak in these sources, indicating that X-rayreprocessing is not by material in an optically thick accretiondisk (Lightman & White 1988; George & Fabian 1991). Be-cause most of these studies are based on large-beam observa-tions, mostly ASCA or BeppoSAX, Ls’ emission has also quiteoften been attributed to stellar processes. Higher spatial resolu-tion Chandra and XMM-Newton observations (Bohringer et al.2001; Kim & Fabbiano 2003; Pellegrini et al. 2003; Terashima& Wilson 2003; Filho et al. 2004; Page et al. 2004; Starlinget al. 2005; Flohic et al. 2006; Gonzalez-Martin et al. 2006; So-ria et al. 2006) remain torn between these findings, as the stellarinterpretation persists for quite a number of these sources.
In this work we approach the LLAGN phenomenon via theH ii → S/T → L → Passive galaxy evolutionary sequencedescribed above. In particular, we test the validity of thesequence within X-ray-selected LLAGN via a large variety ofoptical emission properties, which first provided evidence forthe sequence, and also in their X-ray properties. We combine theChaMP X-ray detections with a sample of SDSS DR4 nearbygalaxies that excludes broad-line objects, creating a large sampleof galaxy nuclei that spans a range of spectral types, frompassive to actively line emitting systems, including the star-forming and accreting types, along with those of mixed orambiguous ionization. Through measurements of their X-rayspectra,4 fluxes, and luminosities, we characterize the sequencein terms of strength and mode of accretion. We provide here thefirst investigation of the relation between Γ and the Eddingtonratio L/Ledd at the lowest levels of accretion. We reveal a rathersurprising anticorrelation between these two measures, oppositeto what luminous AGNs and quasars exhibit. This finding revealsa turning point in the general Γ–L/Ledd relation followed byAGNs, which is identical (within the errors) to that shown bythe Γ–L/Ledd trends in black hole X-ray binaries (XRBs).
Throughout this work, we assume Ωm = 0.3, ΩΛ = 0.7, andH0 = 70h km s−1 Mpc−1.
2. THE CHaMP-BASED LLAGN SAMPLE
The sample of LLAGN employed in this study is obtainedby cross-matching the SDSS DR4 spectroscopic sample ofgalaxies with the X-ray-detected sources identified as part ofthe ChaMP. ChaMP is a wide-area serendipitous X-ray surveybased on archival X-ray images of the |b| > 20 deg sky,obtained with Chandra’s AXAF CCD Imaging spectrometer(ACIS). A summary of the survey is presented by Green et al.(2004, 2009), while ChaMP results and data can be found
4 That is, the shape of the spectral energy distribution quantified by thephoton index Γ that best fits a power law N (E) ∝ E−Γ.

1338 CONSTANTIN ET AL. Vol. 705
at http://hea-www.harvard.edu/CHAMP. The X-ray analysisextends to a total of 392 fields through Chandra Cycle 6 thatcovers a total of ∼30 deg2 of sky area.
We limit the investigation to the DR4 data set in orderto employ the measurements of absorption and emission linefluxes and equivalent widths (EW) drawn from the catalogbuilt by the MPA/JHU collaboration.5 Here the line emissioncomponent is separated and subtracted from the total galaxyspectrum based on fits of stellar population synthesis templates(Tremonti et al. 2004). The catalog does not include broad-line objects. To relate the central BH accretion activity to thehost properties, we employ stellar masses of galaxies and theHδA Balmer absorption-line index as a proxy for the age ofthe associated stellar population, as calculated and presented byKauffmann et al. (2003b). A detailed analysis of these propertiesand their relation to the AGN phenomenon revealed throughoptical signatures, are presented by Kauffmann et al. (2004).
The cross match of all ChaMP sky regions imaged by ACISwith the SDSS DR4 spectroscopic footprint results in a parentsample of 15,955 galaxies on or near a chip and a subset of 199sources that are X-ray detected. Among those, only 107 sourceshave an off-axis angle (OAA) θ < 0.2 deg and avoid ccd = 8due to high serial readout noise; these objects comprise themain sample we employ for this study. Subsequent subsectionspresent details of the X-ray spectral analysis, together witha presentation of their general optical and X-ray properties,the definition of the subsamples based on their optical spectralproperties, and a discussion of the selection effects associatedwith these samples.
2.1. X-ray Spectral Analysis
Chandra imaging with ACIS provides energy resolutionsufficient to constrain the X-ray spectral properties as well.To characterize the X-ray activity of the ChaMP-SDSS galaxiesincluded in our sample, we perform direct spectral fits to thecounts distribution using the full instrument calibration, knownredshift, and Galactic 21cm column6NGal
H . Source spectra areextracted from circular regions with radii corresponding toenergy encircled fractions of ∼90%, while the backgroundregion encompasses a 20′′ annulus, centered on the source,with separation 4′′, from the source region. Any nearby sourcesare excised, from both the source and the background regions.
The spectral fitting is done via yaxx7 (Aldcroft 2006), anautomated script that employs the CIAO Sherpa8 tool. Eachspectrum is fitted in the range 0.5–8 keV by two differentmodels: (1) a single power law plus absorption fixed at theGalactic 21cm value (model “PL”), and (2) a fixed power lawof photon index Γ = 1.9 plus intrinsic absorption of column NH(model “PLfix”). These fits use the Powell optimization methodand provide a robust and reliable one-parameter characterizationof the spectral shape for any number of counts. Spectra with lessthan 100 net counts were fit using the ungrouped data with Cashstatistics (Cash 1979), while those with more than 100 countswere grouped to a minimum of 16 counts per bin and fit usingthe χ2 statistic with variance computed from the data. For thenine objects with more than 200 counts, we employ a third
5 Publicly available at http://www.mpa-garching.mpg.de/SDSS/(Brinchmann et al. 2004a).6 Neutral Galactic column density NGal
H taken from Dickey & Lockman(1990) for the Chandra aimpoint position on the sky.7 http://cxc.harvard.edu/contrib/yaxx8 http://cxc.harvard.edu/sherpa
model in which both the slope of the power law and the intrinsicabsorption are free to vary (model “PL_abs”).
Many of the X-ray-detected galaxies in our sample haverelatively few net counts (mean 76, median 19). In such cases,instrumental hardness ratios are often used, in the belief thatgenuine spectra fitting is not warranted by the data quality. Westress, however, that spectral fitting provides the most consistentand robust estimates of the physical parameters of interest, thepower-law slope, and intrinsic absorption. Because the ChaMPX-ray exposures span a variety of intervening Galactic columns,include data from both back- and front-side ACIS CCDs, andspan six years of observations, the spectral response betweensources varies significantly. While constraints from spectralfitting may not be tight for low count sources, the use of unbinnedevent data and the appropriate response gives an optimal andunbiased estimate of the fit parameters and their uncertainties,especially important when absorption may be present at differentredshifts. A classical hardness ratio analysis, on the otherhand, amounts to grouping the data into two rather arbitrarybins, introducing potential biases and statistical complexity.Interpreting the hardness ratio value for ChaMP sources indisparate fields requires incorporating the instrument responsein any case, so we strongly prefer spectral fitting. Nevertheless,when there is only one free parameter, only the overall spectralshape is constrained.
This simple parametrization proves generally sufficient tomodel the 0.5–8 keV spectra of these objects. Comparisons of0.5–8 keV fluxes fx (and luminosities LX) obtained from thePL and PLfix models show good agreement, for the wholesample of galaxies, the average (median) of the difference inthese values being 0.07 (0.01) dex. We caution that the simplepower-law fits we use here could be misleading for objects inwhich the absorption is complex (i.e., a partial covering, withone or more absorber potentially being ionized). However, thedata quality is insufficient to show that the situation is morecomplex than a simple power law.
We compile a set of “best” measurements for Γ or NH, byusing the values obtained from the PL (intrinsic NH fixed atzero) and PLfix (Γ fixed at 1.9) models, respectively. Forobjects with more than 200 counts, we use the Γ and NH valuesobtained from the PL_abs. The mean Γ for the whole sampleof 107 galaxies is 2.03 ± 1.38, with a median of 2.04. Thelevel of intrinsic absorption is generally low. More than 85%of the sample exhibits NH < 1 × 1022 cm−2, while for 60%of the objects the spectral fits are consistent with zero intrinsicabsorption. Note that, given the simplified model used in fittingthe X-ray spectra, these values might not necessarily representthe true distribution of absorption in these objects. Individualmeasurements of all of these X-ray properties, together withtheir observational parameters, like the total number of X-raycounts, the exposure time, the off-axis angle, together with theircorresponding X-ray source ID, are listed in Table 1 for all 107objects.
Contribution from thermal emission is expected for some ofthe objects included in this sample of nearby galaxies, whetheror not they show line emission activity. Such a component mayprovide a reasonable contribution to the total (X-ray) emissioneven in objects in which the dominant ionization mechanism, asidentified optically, is a compact nuclear source, i.e., an AGN.LINERs, for instance, have frequently been associated withphotoionization by hot, young stars (Filippenko & Terlevich1992; Shields 1992; Barth & Shields 2000), clusters of planetarynebula nuclei (Taniguchi et al. 2000), or more recently (and
No.2,2009
PRO
BIN
GT
HE
BA
LA
NC
EO
FA
GN
AN
DSTA
R-FO
RM
ING
AC
TIV
ITY
WIT
HC
haMP
1339
Table 1X-ray Measurements of ChaMP–SDSS Galaxies
ObjID R.A. Decl. z srcid OAA Counts Exp. Targ. NGalH N Intr.
H Γ fx LX Opt. Class(1) (2) (3) (4) (5) (6) (7) (8) (9) (10) (11) (12) (13) (14) (15)
587722982300254964 233.296661 −0.756684 0.151 CXOMP J153311.1-004524 6.8 27.6 4.9 ... 6.39 6.9+3.6−2.4 −0.7+0.5
−0.6 218.41 42.94 S587722983362134277 206.118027 0.029700 0.135 CXOMP J134428.3+000146 2.4 5.7 8.7 ... 1.93 <0.8 2.1+1.3
−1.1 5.14 41.06 P587722984431026387 195.126404 1.046143 0.067 CXOMP J130030.3+010246 8.4 16.6 1.5 ... 1.63 <1.3 1.3+0.6
−0.6 152.65 42.05 T587725041163370794 174.768066 −1.980904 0.342 CXOMP J113904.3-015851 3.5 2.5 14.0 ... 2.56 <0.4 4.3+5.1
−2.5 1.03 40.50 P587725470127161548 118.935455 41.204029 0.074 CXOMP J075544.5+411214 10.1 33.9 7.2 ... 4.62 <0.0 3.0+0.7
−0.6 50.35 41.14 P587725550133117038 155.188263 63.196468 0.206 CXOMP J102045.1+631147 4.2 39.8 6.0 ... 1.03 <0.0 2.4+0.5
−0.4 51.62 42.38 T587725550136983727 174.983627 66.098259 0.376 CXOMP J113956.0+660553 5.6 15.0 114.6 ... 1.17 <0.3 2.8+1.0
−0.8 0.99 41.19 P587725551735996593 127.912956 52.701363 0.058 CXOMP J083139.1+524204 3.7 23.5 6.8 ... 3.91 <1.4 −0.4+0.5
−0.6 87.79 41.77 S587725591458414903 264.505035 58.503334 0.330 CXOMP J173801.2+583012 3.3 138.8 4.5 ... 3.56 <0.1 1.8+0.4
−0.4 192.16 43.55 T587725980689301524 128.116867 52.605656 0.016 CXOMP J083228.0+523620 11.6 41.7 9.0 ... 3.84 <0.0 2.9+0.6
−0.5 45.71 39.77 H ii
587726015607275687 183.399002 2.810350 0.132 CXOMP J121335.7+024837 2.2 11.4 18.0 ... 1.75 <0.8 1.6+0.8−0.8 7.37 41.31 L
587726015607275717 183.441772 2.811480 0.073 CXOMP J121346.0+024841 4.2 10.4 18.6 ... 1.75 <0.6 2.0+1.0−0.9 13.05 40.90 T
587726031729459313 220.677521 1.319711 0.033 CXOMP J144242.6+011910 8.1 119.7 10.9 ... 3.35 <0.2 1.6+0.7−0.5 106.12 41.22 L
587726033305338033 141.248947 2.241570 0.148 CXOMP J092459.7+021429 4.4 7.3 17.1 ... 3.73 <3.2 0.5+0.9−1.0 8.14 41.53 no-class
587726100949238048 219.718658 3.716406 0.291 CXOMP J143852.4+034259 9.0 22.6 54.6 ... 2.63 <0.1 3.7+1.1−0.9 5.71 41.28 P
587727179536138389 30.007231 −8.927990 0.052 CXOMP J020001.7-085540 4.8 29.9 34.2 ... 2.09 <0.2 2.0+0.6−0.5 8.64 40.43 S
587727213347209620 322.206177 −7.787057 0.070 CXOMP J212849.4-074713 10.1 12.7 19.5 ... 4.88 21.6+51.2−9.1 −1.3+1.4
−2.5 28.58 41.43 H ii
587727223009510128 325.644348 12.505494 0.276 CXOMP J214234.6+123019 2.6 5.0 14.0 ... 6.69 <1.3 2.0+1.3−1.1 2.70 41.49 P
587727227305394267 10.728508 −9.230717 0.076 CXOMP J004254.8-091350 7.3 13.4 9.6 ... 3.53 <0.1 4.0+1.2−1.0 19.63 40.24 L
587727227305394310 10.752554 −9.229577 0.076 CXOMP J004300.6-091346 7.7 63.5 9.6 ... 3.54 <0.1 2.5+0.4−0.4 69.02 41.50 L
587727884161581244 29.994183 −8.826961 0.392 CXOMP J015958.6-084937 2.1 19.3 34.8 ... 2.11 <2.1 1.3+0.6−0.6 7.32 42.35 H ii
587727884161581256 29.955580 −8.833209 0.405 CXOMP J015949.3-084959 1.6 917.4 34.8 I 2.10 <0.2 1.9+0.1−0.1 254.49 43.88 no-class
587727942420988082 144.690018 0.990713 0.171 CXOMP J093845.6+005926 1.7 16.9 1.2 ... 4.22 <0.4 1.4+0.6−0.6 114.19 42.76 T
587728307491897590 168.966110 1.498703 0.352 CXOMP J111551.8+012955 2.1 286.1 15.1 I 4.37 <0.2 2.1+0.3−0.2 168.98 43.52 T
587728905564258619 120.236748 36.056530 0.287 CXOMP J080056.8+360323 1.3 496.6 35.4 I 4.95 0.1+0.1−0.1 2.0+0.3
−0.3 90.87 43.10 no-class587729157893456002 196.494354 3.956814 0.023 CXOMP J130558.6+035724 3.0 55.1 112.0 ... 2.08 <0.1 1.3+0.4
−0.3 4.26 39.56 T587729157893456055 196.563110 3.931599 0.110 CXOMP J130615.1+035553 1.6 16.8 112.0 ... 2.08 <0.1 2.5+1.0
−0.8 0.76 39.91 T587729158440419656 219.591049 3.670265 0.224 CXOMP J143821.8+034012 3.6 37.0 56.2 I 2.61 <0.4 1.9+0.5
−0.5 7.36 41.74 no-class587729158440419712 219.609650 3.649648 0.235 CXOMP J143826.3+033858 2.3 19.6 56.2 ... 2.61 <0.1 3.8+1.0
−0.9 3.42 40.79 P587729388215337158 139.517227 51.687130 0.186 CXOMP J091804.1+514113 6.2 23.4 18.7 ... 1.48 12.1+7.3
−5.3 −0.6+0.6−0.7 43.52 42.41 T
587729751132667997 247.652924 40.131489 0.077 CXOMP J163036.7+400753 4.2 10.8 26.0 ... 0.88 <0.1 3.4+1.2−1.0 3.53 39.86 T
587729751132668135 247.629547 40.156597 0.077 CXOMP J163031.0+400923 2.7 20.6 24.8 ... 0.88 <0.1 3.4+1.0−0.9 3.56 39.83 T
587729752213815608 260.041504 26.625124 0.159 CXOMP J172009.9+263730 2.2 566.4 24.0 I 3.89 <0.2 2.1+0.3−0.2 209.66 42.84 T

1340C
ON
STAN
TIN
ET
AL
.V
ol.705
Table 1(Continued)
ObjID R.A. Decl. z srcid OAA Counts Exp. Targ. NGalH N Intr.
H Γ fx LX Opt. Class(1) (2) (3) (4) (5) (6) (7) (8) (9) (10) (11) (12) (13) (14) (15)
587729753280741824 250.473267 40.029160 0.466 CXOMP J164153.5+400144 2.5 23.4 45.3 I 1.02 <0.3 2.3+0.8−0.6 4.84 42.24 no-class
587730816826671317 340.846375 −9.518315 0.144 CXOMP J224323.1-093105 6.4 32.9 18.2 ... 4.33 3.0+1.6−1.1 0.1+0.4
−0.5 45.66 42.25 S587731185129816192 359.235931 −0.986925 0.032 CXOMP J235656.6-005912 1.2 9.2 17.9 ... 3.52 <0.3 2.1+1.3
−0.9 4.77 39.73 L587731186729550057 334.344727 0.351939 0.095 CXOMP J221722.7+002106 6.1 14.6 75.4 ... 4.61 <0.5 1.5+0.8
−0.7 2.23 40.51 T587731187277430877 359.432159 0.654831 0.023 CXOMP J235743.7+003917 7.4 147.9 11.9 ... 3.32 1.7+0.6
−0.5 0.9+0.2−0.2 438.43 41.62 S
587731187277430877 359.431946 0.655582 0.023 CXOMP J235743.6+003920 7.4 142.7 11.9 ... 3.32 1.9+0.7−0.6 0.5+0.3
−0.3 525.45 41.73 S587731187813253146 357.074768 1.104287 0.092 CXOMP J234817.9+010615 7.7 36.5 48.7 ... 3.96 <0.04 3.4+0.7
−0.6 6.36 40.25 P587731511532453955 19.723360 −1.002003 0.045 CXOMP J011853.6-010007 1.7 217.6 38.3 I 3.67 0.7+0.4
−0.3 5.7+2.0−1.5 28.49 40.62 no-class
587731512613404741 36.155399 −0.047232 0.127 CXOMP J022437.2-000250 0.8 12.0 86.7 ... 2.85 <0.6 1.7+0.9−0.7 1.21 40.47 T
587731513148571800 32.354515 0.399077 0.061 CXOMP J020925.0+002356 9.9 29.2 2.6 ... 2.79 <0.4 1.6+0.5−0.5 138.82 41.88 T
587731868557377700 168.673538 53.250507 0.106 CXOMP J111441.6+531501 4.8 23.4 16.8 ... 0.92 7.2+5.3−2.7 −0.6+0.6
−0.6 43.22 41.96 L587731873388101721 123.742249 36.890556 0.108 CXOMP J081458.1+365326 8.2 10.6 9.3 ... 5.02 <0.2 2.4+1.5
−1.1 10.99 41.09 S587731886272741666 123.901619 36.765156 0.174 CXOMP J081536.3+364554 6.1 9.3 8.8 ... 5.00 <0.3 3.1+1.3
−1.0 10.98 41.30 P587732050021318723 148.205582 51.884888 0.215 CXOMP J095249.3+515305 1.1 283.2 24.4 I 0.88 <0.5 2.6+0.6
−0.5 59.21 42.60 L587732135913521261 150.952209 47.631630 0.051 CXOMP J100348.5+473753 0.9 13.5 13.5 ... 0.93 <0.1 2.7+1.0
−0.8 4.57 39.90 T587732469851553889 131.364151 34.419083 0.025 CXOMP J084527.3+342508 4.3 4.6 4.0 ... 3.42 <0.3 2.6+2.2
−1.4 7.92 39.56 T587732482200371401 145.504807 41.440948 0.243 CXOMP J094201.1+412627 6.3 11.4 7.5 ... 0.95 <0.1 4.0+1.5
−1.2 6.62 41.01 P587732484351983843 156.306671 47.115517 0.060 CXOMP J102513.6+470655 10.0 5.8 2.1 ... 1.22 <1.0 1.9+1.3
−1.1 31.99 41.16 T587733397572747445 244.418823 35.004284 0.029 CXOMP J161740.5+350015 0.6 151.7 18.3 I 1.47 <0.02 2.7+0.4
−0.4 35.71 40.29 L587733603191161025 240.295242 43.194328 0.071 CXOMP J160110.8+431139 7.5 255.5 26.7 ... 1.31 <5.8 0.9+0.9
−0.8 294.80 42.47 S587733604801708195 241.492157 44.055454 0.044 CXOMP J160558.1+440319 3.6 1324.3 4.6 ... 1.15 <0.01 1.9+0.0
−0.0 1619.01 42.56 S587734304342212857 336.311615 −0.364847 0.142 CXOMP J222514.7-002153 7.5 6.2 3.1 ... 5.12 <0.5 2.5+1.5
−1.2 29.36 41.76 T587735348561051857 151.805237 12.787229 0.248 CXOMP J100713.2+124714 4.0 18.0 36.3 ... 3.68 <0.1 4.2+1.1
−1.0 2.60 40.55 no-class587735661546504321 143.357269 34.048050 0.027 CXOMP J093325.7+340252 2.5 33.6 33.6 I 1.47 <0.03 3.6+0.6
−0.6 9.81 39.24 L587735661546504414 143.272659 34.062729 0.277 CXOMP J093305.4+340345 6.8 23.1 33.6 ... 1.47 <0.4 1.5+0.6
−0.6 8.69 42.08 T587735662089666625 159.883911 39.836349 0.068 CXOMP J103932.1+395010 2.7 10.7 5.0 ... 1.43 <0.9 0.8+0.7
−0.7 25.60 41.33 T587735666377883763 206.114655 56.024902 0.070 CXOMP J134427.5+560129 7.5 45.1 43.5 ... 1.09 0.9+0.6
−0.4 0.8+0.4−0.4 16.90 41.19 no-class
587735666377883859 206.093246 55.951073 0.038 CXOMP J134422.3+555703 3.9 7.4 42.7 ... 1.09 <0.2 3.2+1.3−1.1 1.22 38.85 T
587735695377432678 214.062256 53.146236 0.114 CXOMP J141614.9+530846 5.7 8.1 60.5 ... 1.27 <22.5 −0.1+0.9−1.1 3.95 40.99 no-class
587735696440623133 171.764420 56.902294 0.055 CXOMP J112703.4+565408 3.3 7.8 38.3 ... 0.92 <0.5 1.5+1.3−1.0 2.26 40.02 no-class
587735696440623158 171.882370 56.876919 0.005 CXOMP J112731.7+565236 0.8 45.3 39.3 ... 0.90 <0.4 0.6+0.4−0.4 16.00 38.99 H ii
587735696440623212 171.780807 56.828369 0.175 CXOMP J112707.3+564942 3.8 12.0 38.3 ... 0.91 <0.1 3.8+1.6−1.1 2.48 40.32 P
587735696448880650 206.089798 55.856201 0.037 CXOMP J134421.5+555122 4.1 9.6 42.7 ... 1.08 <0.2 2.2+1.2−0.9 1.70 39.35 no-class
587735696451371138 215.187088 53.653847 0.117 CXOMP J142044.9+533913 6.4 126.2 4.9 ... 1.19 <0.1 1.9+0.4−0.3 167.86 42.48 S

No.2,2009
PRO
BIN
GT
HE
BA
LA
NC
EO
FA
GN
AN
DSTA
R-FO
RM
ING
AC
TIV
ITY
WIT
HC
haMP
1341
Table 1(Continued)
ObjID R.A. Decl. z srcid OAA Counts Exp. Targ. NGalH N Intr.
H Γ fx LX Opt. Class(1) (2) (3) (4) (5) (6) (7) (8) (9) (10) (11) (12) (13) (14) (15)
587735696979656747 180.807953 57.890541 0.034 CXOMP J120313.9+575325 5.9 93.9 57.8 ... 1.43 <0.2 1.9+0.3−0.2 19.12 40.43 H ii
587735744228753459 245.066696 29.488642 0.061 CXOMP J162016.0+292919 0.6 10.7 32.2 ... 2.74 <12.6 0.1+0.7−0.8 6.82 40.69 no-class
587736584961196166 205.136429 40.293945 0.171 CXOMP J134032.7+401738 1.2 47.2 43.1 I 0.80 <0.1 2.8+0.5−0.4 5.02 41.03 P
587736752468394214 241.406998 32.936256 0.053 CXOMP J160537.6+325610 7.7 18.7 19.9 ... 2.30 <0.2 1.9+0.8−0.7 10.33 40.53 T
587736752468394267 241.437714 32.872177 0.115 CXOMP J160545.0+325219 6.0 30.3 20.1 ... 2.31 <0.1 2.1+0.5−0.5 16.30 41.41 no-class
587736781993935128 236.260956 36.156464 0.060 CXOMP J154502.6+360923 3.2 9.8 18.8 ... 1.65 <0.1 3.3+1.2−1.0 2.61 39.55 no-class
587736781993935188 236.282913 36.146473 0.069 CXOMP J154507.8+360847 3.5 12.5 18.8 ... 1.65 <0.1 3.6+1.3−1.1 2.91 39.54 no-class
587736941445447871 216.464218 35.567928 0.186 CXOMP J142551.4+353404 3.2 7.8 50.3 ... 1.10 <0.2 3.5+1.8−1.6 1.20 40.22 S
588007004192637004 243.921677 47.186592 0.198 CXOMP J161541.2+471111 0.5 121.6 3.4 I 1.23 <0.1 1.7+0.4−0.3 239.03 43.18 T
588007004192637199 243.922241 47.167870 0.197 CXOMP J161541.3+471004 1.4 5.8 3.4 ... 1.23 <0.1 3.6+3.9−1.6 6.97 40.99 P
588007004694839559 119.126747 41.036259 0.072 CXOMP J075630.4+410210 3.3 109.5 6.2 ... 4.48 <0.04 2.5+0.5−0.4 102.97 41.65 L
588007005769957640 120.440094 44.110588 0.131 CXOMP J080145.6+440638 6.6 11.8 9.2 ... 4.73 <0.1 3.5+1.2−1.0 7.35 40.67 P
588010879292932251 173.027710 4.893930 0.150 CXOMP J113206.6+045338 3.4 6.5 6.3 ... 3.43 <0.2 3.2+2.4−1.4 4.43 40.68 no-class
588016891170914329 143.504242 33.990730 0.027 CXOMP J093401.0+335926 5.9 13.6 31.8 ... 1.47 <0.1 3.4+1.2−1.0 4.19 38.94 no-class
588017111297622182 189.892838 47.537556 0.131 CXOMP J123934.2+473215 9.1 82.4 4.5 ... 1.13 2.6+0.7−0.6 0.2+0.2
−0.3 434.23 43.15 S588017111298932927 194.301773 47.330669 0.131 CXOMP J125712.4+471950 2.3 31.3 49.8 ... 1.15 <0.1 2.2+0.6
−0.5 3.13 40.78 no-class588017111833968667 187.945435 47.927235 0.030 CXOMP J123146.9+475538 5.5 9.5 6.5 ... 1.17 <0.7 −0.2+0.9
−1.2 34.97 40.81 S588017567628591240 164.638321 12.720986 0.119 CXOMP J105833.1+124315 6.2 8.8 4.9 ... 2.13 <0.5 1.9+1.0
−0.9 29.98 41.76 T588017569779023967 201.370422 11.335633 0.086 CXOMP J132528.9+112008 5.5 75.7 4.4 ... 1.92 <0.2 1.9+0.3
−0.3 124.39 42.06 S588017604148133957 186.976318 44.363770 0.276 CXOMP J122754.3+442149 1.7 21.6 4.8 ... 1.34 <1.3 1.4+0.5
−0.5 48.44 42.83 T588017605772837051 228.612808 36.634247 0.161 CXOMP J151427.0+363803 2.5 21.0 43.5 ... 1.35 <0.2 2.4+0.8
−0.7 2.28 40.80 P588017625613795424 170.110840 43.255371 0.145 CXOMP J112026.6+431519 7.0 1.8 17.6 ... 1.96 <39.4 −0.7+2.1
−3.0 3.62 41.14 S588017720102813842 168.741943 40.603119 0.075 CXOMP J111458.0+403611 4.9 22.1 28.3 ... 1.94 <0.8 0.7+0.5
−0.5 10.14 41.03 S588017722259865662 198.026779 42.690838 0.179 CXOMP J131206.4+424127 3.2 15.4 80.6 ... 1.37 <2.2 −0.3+0.7
−1.0 4.76 41.44 no-class588017722259865691 198.164169 42.713638 0.111 CXOMP J131239.3+424248 3.0 64.5 90.7 ... 1.37 <0.3 1.6+0.3
−0.3 6.32 41.08 L588017947748139147 205.227905 40.109875 0.170 CXOMP J134054.6+400635 10.5 917.5 45.1 ... 0.79 0.04+0.0
−0.0 2.0+0.2−0.1 154.08 42.80 L
588018089466658843 231.747757 35.976982 0.055 CXOMP J152659.4+355837 0.6 22.4 9.1 I 1.56 <0.1 2.8+0.7−0.6 11.71 40.35 T
588295840714129492 185.380676 49.176918 0.184 CXOMP J122131.3+491036 4.4 17.2 72.2 ... 1.42 <0.1 3.1+1.0−0.9 1.97 40.60 T
588295840714129502 185.415253 49.332184 0.124 CXOMP J122139.6+491955 5.0 15.3 77.0 ... 1.44 <3.1 0.5+0.8−0.8 4.16 41.09 T
588295842853224515 156.433044 47.326378 0.062 CXOMP J102543.9+471934 5.7 2.9 1.9 ... 1.26 <0.3 3.7+2.6−2.0 12.03 40.00 P
588297863638089749 126.979630 29.449829 0.029 CXOMP J082755.1+292659 9.8 15.0 14.6 ... 3.73 <0.2 2.3+1.3−0.9 8.64 39.84 H ii
588848898846752926 197.902756 −0.922150 0.083 CXOMP J131136.6-005519 8.6 100.3 20.1 ... 1.78 7.3+5.2−3.9 0.2+0.7
−0.7 162.69 42.34 S588848898846818469 198.065002 −0.930759 0.081 CXOMP J131215.6-005550 4.0 3.6 20.7 ... 1.79 <0.2 4.2+2.8
−1.8 2.26 39.28 P588848899377529043 183.972015 −0.601967 0.119 CXOMP J121553.2-003607 3.0 8.1 42.0 ... 2.08 0.6+1.0
−0.6 1.4+0.9−0.9 2.38 40.75 L

1342C
ON
STAN
TIN
ET
AL
.V
ol.705
Table 1(Continued)
ObjID R.A. Decl. z srcid OAA Counts Exp. Targ. NGalH N Intr.
H Γ fx LX Opt. Class(1) (2) (3) (4) (5) (6) (7) (8) (9) (10) (11) (12) (13) (14) (15)
588848899377529068 184.006836 −0.625664 0.121 CXOMP J121601.6-003732 4.9 17.4 41.6 ... 2.09 <0.0 4.9+1.1−1.0 5.90 39.71 P
588848899387228268 206.030533 −0.475767 0.101 CXOMP J134407.3-002832 0.5 3.6 8.7 ... 2.02 <2.5 1.2+1.3−1.2 3.75 40.82 T
588848901519179802 170.660416 1.059925 0.075 CXOMP J112238.4+010335 3.4 69.2 18.5 ... 4.10 <0.1 1.8+0.3−0.3 39.08 41.46 T
588848901519179967 170.649841 1.116308 0.039 CXOMP J112235.9+010658 3.4 6.3 19.9 ... 4.11 <0.5 2.5+1.3−1.1 3.05 39.58 H ii
588848901528289406 191.438202 1.079846 0.106 CXOMP J124545.1+010447 1.1 9.7 6.3 ... 1.69 <0.1 3.5+1.3−1.1 6.31 40.35 T
588848901531107518 197.878723 1.184934 0.070 CXOMP J131130.8+011105 8.5 24.7 4.5 ... 1.97 15.1+8.5−5.8 −1.5+0.7
−0.8 270.20 42.40 S
Notes. (1) SDSS Object ID. (2) and (3) J2000 epoch. (4) spectroscopic redshift. (5) ChaMP X-ray source ID, expressed as CXOMP Jhhmmss.s+/-ddmmss, using the truncated X-ray source position. (6)Chandra off-axis angle in arcmin. (7) net 0.5–8 keV source counts. (8) Vignetting-corrected exposure time in ksec. (9) I = intended Chandra PI target. (10) Galactic column in units of 1020 cm−2. (11) Best-fitYAXX intrinsic column density in 1022 cm−2; upper limits are at 90% confidence level and errors represent 1-σ uncertainties. (12) Best-fit YAXX power-law index Γ; errors represent 1-σ uncertainties. (13)X-ray flux (0.5–8 keV) in units of 10−15 erg s−1 cm−2. (14) log X-ray luminosity (0.5–8 keV) in erg s−1. (15) Optical spectral classification, S = Seyfert, L = LINER, T = Transition Object, P = Passivegalaxy; see text for details. Note that only for objects with >200 counts, N Intr.
H , and Γ values are the result of fitting simultaneously a power law and absorption.

No. 2, 2009 PROBING THE BALANCE OF AGN AND STAR-FORMING ACTIVITY WITH ChaMP 1343
perhaps more consistent with their older stellar populations),by hot post-AGB stars and white dwarfs (Stasinka et al.2008).
We attempted fitting the 0.5–8 keV spectra with a Raymond–Smith (R-S) thermal plasma model, with the abundance fixed at0.5 solar. The choice of abundance level is inspired by previousinvestigations of LLAGNs (e.g., Ptak et al. 1999; Terashima et al.2002), even though in many cases the abundance remains poorlyconstrained. This R-S model fit results seem physically feasiblefor only about the third of the sample. Reasonable values, inagreement with previous findings, i.e., kT � 2 keV, are onlyfound for 35 sources. For another third the best fit kT > 10 keV.We discuss in more detail the results of fitting this model as afunction of the optical spectroscopic properties of these sourcesin Section 2.5.
As probably expected, it is the passive galaxies that showthe softest power-law slopes we measure (Γ > 3.5), suggestingthat, for these cases in particular, a power-law representationmay be incorrect. If we instead fit an R-S model, we derivereasonable typical temperatures near ∼0.7 keV. Nonetheless,since even these objects are likely to have some power-lawcontribution from X-ray binaries, the R-S model is perhaps nobetter a characterization of the true spectrum than a power law.The X-ray flux distribution we derive from the R-S model fitsto passive galaxies is not significantly different (±25%), so weprefer to retain the power-law fits everywhere to facilitate a moredirect comparison of the different spectral classes.
2.2. The Optical Spectral Classification
We identify and classify accretion sources and other typesof active systems in both the parent galaxy sample and theX-ray-detected subsample, based on their optical emission lineproperties. It has been argued (Ho et al. 1997a; Constantin& Vogeley 2006; Kewley et al. 2006) that the best way toseparate accretion sources from starbursts or other types ofactive systems is via a set of three diagnostic diagrams, whichemploy four line flux ratios: [O iii]λ5007/Hβ, [N ii]λ6583/Hα, [S ii]λλ6716, 6731/Hα, and [O i]λ6300/Hα. Thus, forboth samples, we first select a subset of strong emission-linesources that show significant emission in all six lines usedin the type classification (Hα, Hβ, [O iii], [N ii], [S ii], and[O i]), and a set of passive objects that show insignificantline emission activity. An emission feature is considered to besignificant if its line flux is positive and is measured with at least2σ confidence. Following Kewley et al. (2006) classificationcriteria, the emission-line objects are separated into Seyferts(Ss), LINERs (Ls), transition objects (Ts), and star-forming, orH ii galaxy nuclei.
This method of classifying low luminosity actively line-emitting galaxy nuclei has the disadvantage that it leaves unclas-sified a high fraction (∼40%) of galaxies, which show strongemission features, but not in all six lines considered here. Thecondition for strong emission in [O i] in particular is signifi-cantly restrictive. Moreover, another quite large (∼25%) frac-tion of the emission-line objects remains unclassified, as theirline ratios, although accurately measured, do not correspond toa clear spectral type in all three diagrams. In the majority ofsuch cases, while the [N ii]/Hα ratio shows relatively high,S-like values, the corresponding [S ii]/Hα and/or [O i]/Hαratios place them in the T- or H ii-like object regime; thus,because the [S ii] and [O i] emission lines are better AGN-diagnostics than [N ii], these systems are likely to be excludedfrom the AGN samples selected via these classifications. As a
consequence, our samples based on the six-line classification aresmall.
To enlarge our samples of galaxy nuclei of all spectral types,we also explored an emission-line classification based on onlythe [O iii]/Hβ versus [N ii]/Hα diagram, i.e., a four-line clas-sification method, for the X-ray-detected sources. Thus, theemission line galaxy samples comprise all objects showing atleast 2σ confidence in the line flux measurements of these fourlines only. The delimitation criteria of H ii’s and T’s remainunchanged, while Ss and Ls are defined to be all objects situ-ated above the Kewley et al. (2006) separation line, and with[O iii]/Hβ > 3 and < 3, respectively. The four-line and six-line classifications result in significantly different classes whenapplied to optically selected galaxies in general (Constantin &Vogeley 2006). In particular, true properties become heavilyblended into the dominant population of LINERs (or Ts, de-pending on the separation lines used in the diagnostic diagrams).Interestingly, however, when applied to the X-ray sample, thefour-line classes fall well within the six-line loci; although Ssand Ls are separated only by their [O iii]/Hβ line flux ratio,they remain clearly separated into the [S ii]/Hα and [O i]/Hαdiagrams as well. Figure 1 shows how the six-line (top) andthe four-line (bottom) classifications compare for the ChaMPX-ray-detected galaxies.
Although the sample of X-ray-detected galaxies is small, thiscomparison indicates that adding X-ray detection makes thefour-line classification more secure, and that the need for the(usually unavailable) [O iii]/Hβ versus [S ii]/Hα and [O iii]/Hβversus [O i]/Hα diagrams is not as stringent as in the casesin which only optical information is available. We will thusconsider for the analysis presented in this paper only the four-line classification.
2.3. The X-ray Detection Fraction of the LLAGNs
The “cleaning” role of the X-ray detection in finding anddefining LLAGNs is even more obvious when we compare thefractions of X-ray-detected objects by spectral type, relative toboth the parent sample of nearby optically selected objects andthe subsample of X-ray-detected galaxies. Table 2 lists thesepercentages, where for the parent optically selected sample weconsider only the SDSS galaxies on ACIS chips (excluding chipS4, ccd #8), and with off-axis angle θ < 0.2 deg, consistent withthe conditions used in compiling the X-ray samples. The firsttwo columns show the number (and fraction) that each spectraltype represents, among (1) the optical parent sample and (2)the X-ray-detected subsample. The third column lists the rawfraction of X-ray detections per spectral type.
That the X-ray detection is very efficient in finding LLAGNs,particularly Seyferts, is quite apparent. While narrow-line Ssusually make up only <2%–4% (Ho et al. 1997b; Constantin& Vogeley 2006) of the optically selected nearby galaxies, theX-ray detection increases the chances of finding them tenfold.Ts and Ls, where an AGN contribution to the total ionizationpower is expected, are also much better represented in theX-ray-detected sample of galaxies, their fractions being ∼3×larger than when only optical selection is employed. Some 65%of the optically defined Ss are detected in X-rays, while theother spectral types hardly reach an X-ray detection fractionof 20%. Ls are the second most X-ray active sources withinnearby galaxies, while Ts and the galaxies that show some/weak emission line activity account for less than 1/5th of thesample. As discussed in Section 2.5, only the luminous H iis aredetected in X-rays. While the X-ray detection rate of the H iis

1344 CONSTANTIN ET AL. Vol. 705
Figure 1. Diagnostic diagrams for all ChaMP galaxies that exhibit emission-line activity, with relatively high (>2) signal-to-noise line flux measurements in allsix lines (top) and in only [N ii], [O iii], Hβ, and Hα (bottom). The solid and dashed black curves illustrate the Kewley et al. (2001) and Kauffmann et al. (2003b)separation lines, while the diagonal lines illustrate the separation between Seyferts and LINERs by Kewley et al. (2006). The gray points correspond to galaxies inChaMP fields that fall on or near the ChaMP ACIS chips, but are not necessarily X-ray detected. Seyferts, Liners, Transition Objects, and H ii galaxies are shown asasterisks, open circles, blue squares, and triangles, respectively. The orange crosses are six-line nonclassified objects with a four-line class. It is quite apparent that thecombination of the four-line classification and X-ray detection is very efficient in distinguishing between different types of emission among LLAGNs, quantitativelyidentical to the six-line method.
(A color version of this figure is available in the online journal.)
Table 2Object Sample Statistics
Sample Nopt(fractiona,%) NX−raydet.(fractionb,%) NX−raydet./Nopt(%)
H ii 498 (27.6) 7 (6.5) 1.4 ± 4.5Seyfert 28 (1.5) 18 (16.8) 64.3 ± 18.9Transition 194 (10.7) 32 (29.9) 16.5 ± 7.2LINER 70 (3.9) 13 (12.1) 18.6 ± 11.9Some emission–no class 558 (31.1) 19 (17.8) 3.4 ± 4.2Passive 459 (25.4) 18 (16.8) 3.9 ± 4.6
Notes. The quoted errors represent standard deviations assuming Poisson statistics.a Fraction by type of all 1807 SDSS galaxies on ACIS chips, which excludes those falling on ccd = 8,and with θ > 0.2 deg.b Fraction of all 107 X-ray-detected SDSS galaxies.
is basically consistent with zero, when detected, their X-rayemission is moderately strong, LX = 1039–2.5 × 1041 erg s−1;half of the H ii detections show X-ray luminosities higher thanthe level that can be reached without contribution from AGNs(1040 erg s−1), suggesting once more that the nuclear emissionin these sources might not be completely driven by stellarprocesses.
The only previous studies that encompass the whole spectralvariety of LLAGNs are Roberts & Warwick (2000) and Parejkoet al. (2008), which employ ROSAT (HRI and RASS, respec-tively). Their search for X-ray emitting nearby galaxy nuclei,
optically characterized via the Palomar and SDSS surveys re-spectively, concluded in soft X-ray detection rates of ∼70% ofboth Ss and Ls (HRI), ∼70% of Ss and ∼60% of Ls (RASS),∼40% (HRI) and <10% (RASS) of H ii’s, and ∼30% of passivegalaxies (both cases). A comparison of these detection rates withours is problematic because of their softer instrument bandpass,lower sensitivity, but wider sky coverage.
Hard X-ray studies of homogeneously selected samples, in-cluding all spectral types of nearby active galaxies are practicallynonexistent. Ls, and particularly those found in the Palomarsurvey, have been clearly privileged in terms of X-ray targeting

No. 2, 2009 PROBING THE BALANCE OF AGN AND STAR-FORMING ACTIVITY WITH ChaMP 1345
(e.g., Ho et al. 2001). Their detection rates are found to be signif-icantly higher than what we report here based on the serendipi-tous ChaMP survey. Ho et al. (2001) reports a ∼70% detectionrate, while, when chosen for having a flat-spectrum radio core,Ls are found to be 100% X-ray active (Terashima & Wilson2003). Later studies claiming better accounting for selectionand classification as LINER (Satyapal et al. 2004; Dudik et al.2005; Pellegrini 2005; Satyapal et al. 2005; Flohic et al. 2006;Gonzalez-Martin et al. 2006) conclude with lower fractions,∼50%.
ChaMP has the distinct advantage of presenting a large,homogeneous serendipitous sample of LLAGNs. The detectionfraction is not an intrinsic property of galaxies, but rather aconvolution of galaxy properties with optical survey depth, andthe X-ray sensitivity versus sky area curve. As described byGreen et al. (2009), the ChaMP is characterizing the X-raysensitivity at the position of every SDSS galaxy, which willenable us to compile the unbiased fraction of galaxies by opticalspectral type (e.g., Ls) that fall in X-ray luminosity bins, fromsky volumes complete to those limits. We will present the resultsof such an investigation in a subsequent paper.
2.4. Selection Effects: The ChaMP X-ray Galaxy Sample isMinimally Biased
X-ray and optical emission are correlated. Thus, while theX-ray selection is one of the most powerful tools to exploit indetecting accretion sources, it is also expected that this selectionpicks up, selectively, the brightest (optical) sources. Due to itsserendipitous character, ChaMP should however reduce sucheffects. Note that, out of 107 X-ray detections that this ChaMPsample of galaxies provides, only 13 are targets.
In Figure 2, we explore the biases that X-ray detectionpotentially adds to our sample. Comparisons of the distributionsof redshift z, apparent and absolute r-band (SDSS) magnitudes,r and Mr respectively, and of the concentration index C9 as aproxy for the morphological type of these galaxies, both forthe whole optically and X-ray-selected samples (histograms onthe left panel) and separately per spectral type (the right panel)show, pleasingly, that biases are not strong.
However, H ii galaxies are of lower z and brighter Mr when de-tected in X-ray. As shown in the next section, the H iis are gener-ally weak X-ray sources. The tendency for X-ray-detected galax-ies to appear brighter in apparent magnitude (r, by ∼0.5 mag)seems to be caused by the large difference in r between theH ii galaxies alone, as all the other types of sources show verysimilar ranges, averages, or medians, when analyzed separately.
The concentration index C appears to be somewhat largerfor the X-ray objects. Several factors are likely to account forthis. The H iis are the least concentrated optically and have thelowest X-ray detection fraction. X-ray detection is sensitiveto the AGN activity, which is more prevalent in the early-type (massive bulge-dominated) galaxies (e.g., Ho et al. 2003;Kauffmann et al. 2004). Nuclear activity is also expected toincrease C simply by adding light to the core. Note that thereis no significant difference in this parameter in regard to Ss’X-ray selection. However, Ss make up for a tiny fraction ofz ≈ 0 galaxies, and the morphology of their hosts spans quite arange.
9 C = R50/R90, where R50 and R90 are the radii from the center of a galaxycontaining 50% and 90% of the Petrosian flux.
2.5. General X-ray Properties in Relation to OpticalSpectroscopic Classification
X-ray information about the nearby galaxy centers constrainsthe contribution of accretion-related processes to their opticalspectral characteristics. In this section, we present the distri-butions of a variety of X-ray properties for the whole sampleas well as for subsamples by optical spectral class. Figure 3shows the distributions of the X-ray counts, the 0.5–8 keV un-absorbed X-ray fluxes, the best-fit X-ray photon indices Γ, andthe intrinsic neutral hydrogen column densities NH. These mea-surements are shown for the whole sample of X-ray detectednearby galaxy nuclei (left column) and separately per spectraltype (right column).
For X-ray fluxes, we show the values derived using theprimary power-law fitting models discussed in Section 2.1: (1)a single power law with no intrinsic absorption and (2) a fixedpower law (Γ = 1.9) with absorption. The fx values are generallyconsistent with each other for the whole range of brightness andoptical spectral type. As expected, the X-ray brightest objectsare among Ss; however, even for this spectral type the range ofvalues remains pretty broad, spanning 3 orders of magnitude.Note also that the few H ii galaxies that are X-ray detected are,in general, brighter than the passive systems.
In terms of the X-ray spectral shape, the ChaMP nearbygalaxies are quite a diverse population. The mean photonindex per optical spectral type shows however a rather cleardependence on the spectral type: Ss show the hardest 0.5–8 keVspectral shape, becoming softer and softer from Ts to Ls tothe passive galaxies, which are clearly the softest. The H ii
galaxies are unexpectedly hard in average Γ = 1.46; however,two particularly hard detections clearly weight the subsamplein this direction. The Ts and Ls average at Γ ≈ 2.
The NH values are poorly constrained for this sample, andthere is no obvious correlation with the optical spectral type.It is, however, obvious that the Ss are the sources with thehighest fraction of nonzero absorption. Since all our Ss areof type 2, i.e., lack broad emission lines in their spectra, theunification paradigm predicts that many will show signature ofabsorption in X-rays. A typical unabsorbed power law Γ = 1.9requires a column density of NH = 8 × 1021 cm−2 to yieldan apparent Γ = 1 similar to the mean value found for our Ssubsample, which is consistent with the observed mean NH forthese particular systems.
3. PROBING THE SEQUENCE
The H ii → S/T → L evolutionary sequence proposes a com-prehensive picture for the coevolution of AGNs and their hostgalaxies. This scenario is supported by and strengthens previousstudies of AGNs, star formation activity, and their coevolution innearby galaxies (Kauffmann et al. 2004; Heckman et al. 2004),and may enhance our understanding of how AGNs work andevolve in relation to both their hosts and their environments(Constantin et al. 2008).
X-rays, as primary signatures of supermassive BH accretion,offer a critical verification of the proposed sequence. LX andspectral fits characterize the sequence in terms of strength andmode of accretion, especially the order of Ss and Ts withinthe H ii → S/T → L cycle. Both the bulge nebular propertiesand the small- and large-scale environments of Ss and Tsare very similar and remain intermediate between those ofH iis and Ls. The only parameters showing a “jump” in theotherwise smooth trends are Hα/Hβ Balmer decrements and

1346 CONSTANTIN ET AL. Vol. 705
Figure 2. Comparison of the optical properties of X-ray-detected galaxies and all optically selected (SDSS) galaxies on or near ChaMP fields/chips. Left: histogramsof redshift (z), apparent r-band magnitude (mr), absolute r-band magnitude (Mr), and the concentration index (C) for the full samples of SDSS galaxies on/nearChaMP fields and the ChaMP detections; median values are indicated by the vertical bars. Right: individual measurements of z, mr , Mr , and C are shown separatelyper galaxy spectral type; both average (squares) and median (circles) values are indicated here, for all types of objects. The bias caused by the X-ray detection criterionis clearly weak; the few X-ray-detected H ii’s dominate the observed difference in r and Mr distributions.
the nearest-neighbor distance d1nn (Constantin et al. 2008). Hα/Hβ provides a measure of absorption and perhaps also theamount of fuel available for accretion, which we can now testdirectly against both LX (accretion power) and X-ray spectralconstraints.
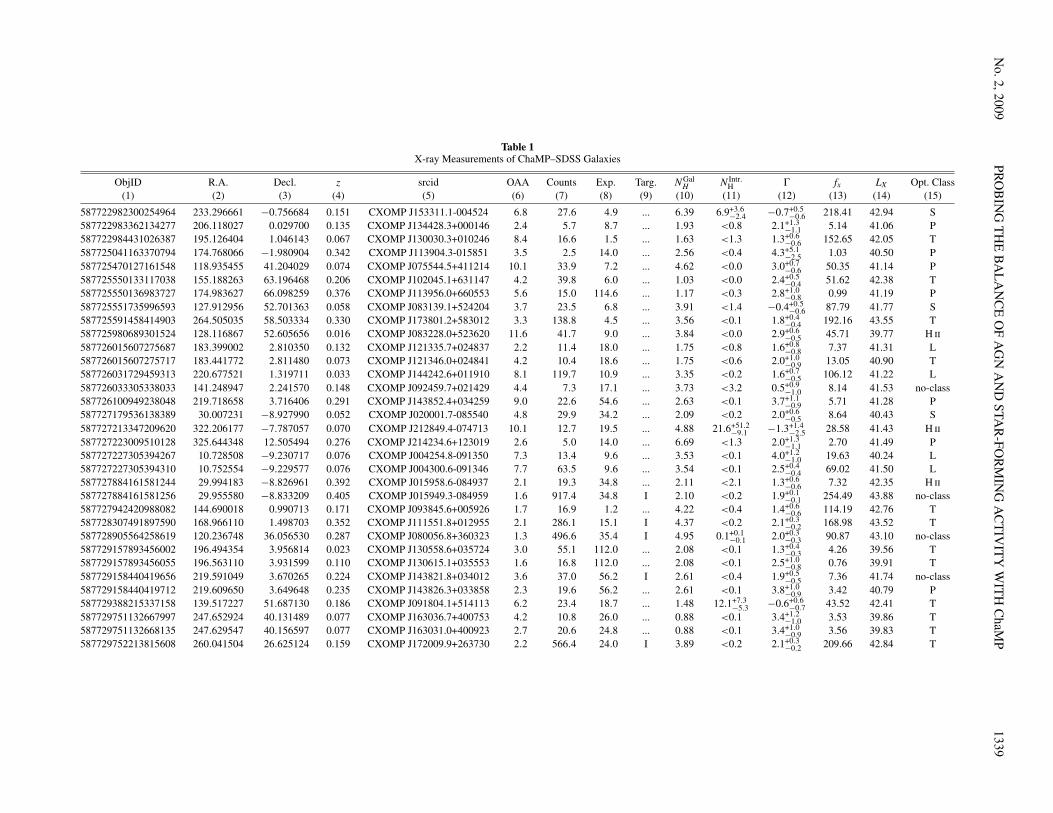
In Figure 4, we present a comparison of the degree towhich optically and X-ray-selected galaxies follow the proposedsequence in terms of the black hole mass MBH, obtained viaσ∗ measurements and the MBH–σ∗ relation (Tremaine et al.
2002), the (dust corrected) stellar mass M∗ (Kauffmann et al.2003a), the Balmer decrement Hα/Hβ as a proxy for dustextinction, the HδA Balmer absorption index as a measure ofthe age of the associated stellar population, L[O iii], and theaccretion rate expressed as L/Ledd, where L = Lbol = 600 ×L[O iii] for the bolometric correction (Heckman et al. 2004;Kauffmann & Heckman 2009) and the L[O iii] is extinction-corrected using the corresponding Balmer decrements and aτ ∝ λ−0.7 attenuation law (Charlot & Fall 2000). Given the

No. 2, 2009 PROBING THE BALANCE OF AGN AND STAR-FORMING ACTIVITY WITH ChaMP 1347
Figure 3. Distribution of X-ray properties of the ChaMP galaxies. Left: histograms of X-ray counts in the 0.5–8 keV regime, the X-ray flux fx (calculated via twofitting models: a power law with no intrinsic absorption and a fixed power law with variable absorption), the (best) X-ray photon index Γ, and the (best) NH (see text);median values are indicated by the vertical bars. Right: individual measurements of X-ray counts, fx, Γ, and NH shown separately per galaxy spectral type; averageand median values are indicated for all types of objects by squares and circles, respectively.
(spectral) definition of passive galaxies (i.e., lacking opticalemission line activity), there are no measurements of the Balmerdecrement, L[O iii], and L/Ledd for these sources. It is notable
that in all measures and for all types of sources, the X-ray andoptically selected sources are very similar and appear to obeythe S → T → L → P sequence.
1348 CONSTANTIN ET AL. Vol. 705
Figure 4. Comparison of median and average optical properties of X-ray-detected galaxies and all optically selected galaxies on or near ChaMP fields/chips, along theH ii → S → T → L → passive galaxies sequence. The plots show: the BH mass (based on MBH–σ∗ relation of Tremaine et al. 2002), the (dust corrected) stellar mass(log M∗/M), the Balmer decrement, the HδA Balmer absorption-line index, L[O iii], and the accretion rate expressed by Lbol/LEdd, where Lbol/L[O iii] = 600;average and median values are indicated by squares and circles, respectively.
If anything, the sequence appears stronger among theX-ray-selected galaxies, both in median/average values andin their distributions of individual measurements, which spansmaller ranges of values than those for the optically selectedobjects. Among the weakest accreting objects, Ls, and pas-sive galaxies, the X-ray selection tends to pick up more mas-sive objects, with heavier BHs, and older stellar populations;there is however no obvious difference in these parameters forthe other types of sources. As expected, these massive sys-tems also appear to have smaller [O iii] luminosities and ac-cretion rates, accentuating the sequential S to T to L dropin these parameters suggested by optically selected/definedobjects. Also, while the Balmer decrement distributions sug-gest that, in general, the X-ray selection is not strongly af-fected by dust, the slightly more obscured X-ray-detected H iisand less obscured X-ray-detected Ls make the sequence moreapparent.
Figure 5 illustrates how the 0.5–8 keV X-ray luminosity LXand the corresponding L/Ledd behave along the S → T → L→ P sequence. For the sake of comparison, we show LX values
obtained via two spectral fitting models: (1) a power law withno intrinsic absorption (only the Galactic one) and (2) a fixedpower law with Γ = 1.9 and with variable intrinsic absorptionadded to the Galactic level. The sequence is supported by bothtypes of measurements, albeit stronger when the simple power-law model is used. As discussed in Sections 2.1 and 2.5, the freepower law with no intrinsic absorption spectral model, whichseems to best characterize this sample of objects, makes thestatistical sequence even more probable. For the sequence inthe accretion rate, we calculate L/Ledd using L/LX = 16 forthe bolometric luminosity, as suggested by Ho (2008), and theBH masses estimated from their host stellar velocity dispersionσ∗ using Tremaine et al. (2002). We also contrast the X-raymeasurements with those where Lbol is derived from L[O iii];note that while LX and the derived L/Ledd are available for thewhole sample of 107 objects, only 69 of them exhibit strong 2-σ detectable, [O iii] line emission. The S → T → L → Pgalaxy sequence compares well in both optical and X-raymeasurements. The values of all these parameters decreasemonotonically in both median and average values, from Ss to

No. 2, 2009 PROBING THE BALANCE OF AGN AND STAR-FORMING ACTIVITY WITH ChaMP 1349
Figure 5. H ii → S → T → L → passive galaxies sequence in X-ray: theX-ray luminosities obtained via yaxx for two fitting models: (1) a power lawwith no intrinsic absorption and (2) a fixed power law with Γ = 1.9 withintrinsic absorption; the accretion rate values, expressed by L/LEdd, calculatedusing both Lbol/LX = 16 and Lbol/L[O iii] = 600 are compared; average andmedian values are indicated by squares and circles, respectively.
(A color version of this figure is available in the online journal.)
Ts, to Ls and passive galaxies, consistent with what opticalproperties of these sources put forward.
The H iis are the only apparent exception here. The smallnumber statistics for these galaxy nuclei preclude any strongconclusions. Given the expected high sensitivity to soft sourcesthat these measurements provide, it is all the more remarkablethat H ii galaxy spectra tend to be on the hard side. Obscuration isa notorious cause for spectral hardening and, thus, the possibilitythat these objects hide in their centers obscured BH accretion isstill not ruled out.
Note also that the power-law slope Γ that best fits the X-rayspectra increases from Ss to Ts, to Ls, in both median andaverage values, showing a tendency of softening of the spectrafrom Ss to passive galaxies along the proposed sequence(Figure 3). This is quite an interesting finding, as in otherAGNs, mostly the luminous type 1 AGNs, observations suggestan opposite trend: the stronger accreting (and more luminous)sources are the softer ones, most recently quantified by Kellyet al. (2008) and Shemmer et al. (2008). It is interesting to notethat a spectral softening with strengthening of the accretionprocess/rate is also a generally common feature of the XRBswith reasonably high L/Ledd (e.g., Kubota & Makishima 2004).Note however that, when the Eddington ratio is less than acritical value, L/Ledd � 0.01, i.e., XRBs are observed in theirlow/hard state, there is a clear trend for softening with furtherweakening of the accretion rate (Kalemci et al. 2005; e.g.,Yamaoka et al. 2005; Yuan et al. 2007). We investigate thisfinding in more detail in the following section and discuss theanalogy with the XRB phenomenon.
4. DEPENDENCE OF Γ ON L/Ledd
Investigations of how X-ray parameters depend on the ac-cretion rate relative to the Eddington rate are expected to offerimportant constraints on physical models of the AGN X-rayemitting plasma, particularly its geometry. A hot, optically thincorona that Compton up-scatters UV photons from the opticallythick disk (Shakura & Syunyaev 1973; Haardt & Maraschi 1991)seems to fit reasonably well the X-ray emission of the highlyaccreting systems, particularly when it is associated with a hot,possibly patchy and “skin”-like structure “sandwich”-ing thecold disk (Nayakshin 2000; Czerny et al. 2003). However, othergeometries remain viable, among them an accretion disk evapo-rating into a hot inner flow (Shapiro et al. 1976; Zdziarski et al.1999) or combinations of a hot inner flow and the patchy corona(Poutanen et al. 1997; Sobolewska et al. 2004). For LLAGNs,with L/Ledd < 10−9–10−5, the accretion flow has been hypoth-esized to originate from a geometrically thick and hot disk-likestructure that is inefficient at converting gravitational poten-tial energy into radiation, the radiatively inefficient accretionflow (RIAF) model (e.g., Narayan & Yi 1994; Blandford &Begelman 1999; Narayan et al. 2000). Models suggest that thereis a transition/switch from a standard disk to an advection-dominated accretion flow (ADAF; or, a radiatively inefficientaccretion flow, RIAF) when L/Ledd declines below a criticalvalue within a certain transition radius (Esin et al. 1997; Yuan &Narayan 2004; Lu et al. 2004). In either case, radiation pressuredriven outflows can also alter the physics of the corona (Proga2005). Because the efficiency in producing an X-ray accretionflow and in driving the outflows depends on the BH mass andits accretion rate, it is important to understand the interdepen-dence of these parameters on the X-ray properties, particularlythe shape of the X-ray spectrum, i.e., the X-ray photon index Γ.
The relationship between Γ and the Eddington ratio L/Ledd isrelatively well studied, and yet a controversial issue. These twoparameters seem to be positively correlated for objects accretingat relatively high Eddington ratios, i.e., quasars, luminous type1 Seyferts (Kelly et al. 2008; Shemmer et al. 2008), while forlow L/Ledd values the situation remains uncertain, mainly dueto the lack of quality data in that regime. The conclusion sofar seems to be that the shape of the hard X-ray power lawis largely controlled by L/Ledd. For the luminous, strongly/efficiently accreting sources, it is proposed that the corona actsas a “thermostat” by (Compton) cooling more efficiently whenthe disk emission increases, producing more soft photons, andthus steepening the hard X-ray spectrum. This scenario alsoaccounts nicely for the generally narrow range of L/Ledd andΓ values measured in (optically selected) quasars or luminousAGNs, in general [L/Ledd ∼ 0.3 with a typical dispersion of afactor of ∼5 (McLure & Dunlop 2004; Kollmeier et al. 2006;Netzer et al. 2007; Shen et al. 2008); Γ ∼ 1.5–2.5 (Vignaliet al. 2005; Shemmer et al. 2008)]. For LLAGNs, the Γ–L/Leddrelation remains only vaguely constrained.
4.1. Γ–L/Ledd Relation for Nearby AGNs/Galaxies
The relation between the X-ray photon index Γ and theEddington ratio for the ChaMP X-ray-detected galaxies is illus-trated in Figure 6. The Eddington luminosity Ledd is calculatedas indicated in Section 3, using MBH values estimated basedon stellar velocity dispersion σ∗ via Tremaine et al. (2002),while the bolometric luminosity is calculated based on LX , us-ing the average bolometric correction of Lbol/LX = 16 (Ho2008). There is a rather clear trend of spectral hardening with

1350 CONSTANTIN ET AL. Vol. 705
Figure 6. Distribution of the X-ray photon index as a function of L/Ledd,where L = Lbol is estimated using Lbol/LX = 16. There is clearly an apparentanticorrelation between these two measures; the symbols reflect the differentspectral optical classification. The solid and dotted lines reflect the best-fit linearrelations with the errors weighted and not weighted, respectively.
(A color version of this figure is available in the online journal.)
increasing accretion rate. Γ and L/Ledd are found to be nega-tively correlated.
Defining an accretion rate, i.e., calculating L/Ledd, for galax-ies with LX < 1042 erg s−1 may be misleading if the X-rayemission in these objects is dominated by X-ray sources otherthan an accreting super massive BH (e.g., individual compactbinaries or hot diffuse gas). Note, however, that the x-axis ofFigure 6 is simply the measure of LX/MBH (or better, LX/σ∗4),where both LX and the BH mass MBH (or σ∗) are measured inexactly the same manner for all of the objects involved, andthe trend remains even if this parameter is not interpreted as anaccretion rate. The strongest likely dilution to accretion emis-sion comes from contributions of the hot interstellar medium(ISM) in passive galaxies. Hot gas emission is soft and relativelystronger in more massive hosts, both of which would push thepassive galaxy points toward softer X-ray spectra (larger Γ) andlower LX/Mbh, which might spuriously accentuate the observedtrend even in the absence of significant accretion power. Indeed,the observed trend is weakened once the passive galaxies areremoved (Table 4). So, while we rule out significant extendedemission contributions in this sample, a more detailed exam-ination of such objects is warranted to determine the relativefractions of nuclear versus extended hot gas contributions.
We measure the significance of the Γ–L/Ledd anticorrelationusing the Spearman-rank test. The Spearman-rank coefficient,the chance probability, and the number of sources for eachcorrelation are listed in Table 3. We fit the anticorrelation pointswith a linear least-squares method for the whole sample and forthe subsamples of galaxies corresponding to different spectraltypes, using the mpfit10 routine, being able to account for theerrors in Γ. We show, for comparison, both the error weighted(continuous line) and the unweighted (dotted line) best fitsin Figure 6. The scatter around the best linear fit is large,and as expected the points with the largest error bars showthe largest deviation. However, within the errors, the resultsof the fit remain unchanged when we use only objects withsmall measurements errors (i.e., ΔΓ/Γ < 50%). The resultsfor the linear regression coefficients and the corresponding χ2
and degrees of freedom (dof) values are listed in Table 4. Forthe sake of considering “cleaner” AGN-like activity only, we
10 http://www.physics.wisc.edu/∼craigm/idl/fitting.html
Table 3Γ–L/Ledd Correlation Coefficients and Significance
Sample rs Prob. N
For LX = LX(0.5–8) keVAll −0.52 <1.0 × 10⁻³ 107Seyfert −0.18 0.43 18Transition −0.29 0.11 31LINER −0.39 0.18 13
For LX = LX(2–10) keVAll −0.75 <1.0 × 10⁻³ 107Seyfert −0.36 0.12 18Transition −0.52 2.3 × 10⁻³ 31LINER −0.56 4.4 × 10⁻² 13
Notes. The Spearman-rank test correlation coefficient, chance probability,and number of sources for each correlation/sample, respectively. The mostsignificant probabilities for anticorrelations (chance probability less than 5%)are shown in boldface.
Table 4Γ–L/Ledd Linear Regression Coefficients
Sample Slope Intercept χ2/dof
For LX = LX(0.5–8) keVAll −0.16 ± 0.04 1.36 ± 0.13 309/105All, no passive, no H ii −0.07 ± 0.05 1.51 ± 0.15 235/81All with LX � 1042 erg s−1 0.12 ± 0.12 2.09 ± 0.29 83/17Seyfert 0.94 ± 0.15 3.59 ± 0.35 89/16Transition −0.001 ± 0.11 1.88 ± 0.37 21/29LINER −0.20 ± 0.09 1.42 ± 0.34 29/11
For LX = LX(2–10) keVAll −0.27 ± 0.04 0.98 ± 0.13 274/105All, no passive, no H ii −0.21 ± 0.05 1.11 ± 0.15 219/81All with LX � 1042 erg s−1 −0.19 ± 0.14 1.28 ± 0.36 95/16Seyfert 0.42 ± 0.18 2.49 ± 0.43 119/16Transition −0.09 ± 0.10 1.57 ± 0.38 21/29LINER −0.25 ± 0.09 1.18 ± 0.34 26/11
Notes. The slope, intercept, χs , and degrees of freedom (dof) for the best error-weighted linear fits for the whole sample of X-ray-detected galaxies and perspectral type. Errors are at 1-σ confidence levels.
also list here the results of such a fitting technique to samplesthat exclude the passive galaxies and the H iis, and for samplesof luminous X-ray systems (LX � 1042 erg s−1) only, andindications of an anticorrelation, albeit weaker, remain.
The linear regression fits might appear at odds with the con-clusion of the Spearman test, which indicates that Γ and L/Leddare possibly anticorrelated for all the subsamples presented here.Note, however, that such a discrepancy appears for the subsam-ples in which the Spearman test remains rather inconclusiveas the probability that an anticorrelation appears by chance islarge. Moreover, the Spearman test ignores the errors, and thustests the unweighted data, for which linear regression fits arealways consistent with negative slopes. It is clear however thatfor Seyferts in particular, there is no evidence for either positiveor negative correlation between Γ and L/Ledd. This has beenseen in other samples as well (Winter et al. 2009), and it isan important result. Nevertheless, investigations of the LLAGNphenomenon should not be restricted to these types of sourcesonly.
In an attempt to provide some more physical insights intothe reality and significance of this new trend, we also explorehere the possible correlations between various X-ray measuresthat might influence (if not artificially create) it. In particular,we scrutinize the way our measured Γ relates to the number of

No. 2, 2009 PROBING THE BALANCE OF AGN AND STAR-FORMING ACTIVITY WITH ChaMP 1351
Figure 7. Relation between the 0.5–8 keV X-ray photon index and the total number of counts, the 0.5–8 keV flux fx, the 0.5–8 keV luminosity LX , and the BH mass.No relation appears to exist between Γ and X-ray counts, while there are rather weak apparent negative correlations with fx and LX ; MBH does not appear to correlatewith Γ.
(A color version of this figure is available in the online journal.)
counts, the X-ray flux, and luminosity. Some studies showedthat the photon index correlates with the X-ray luminosity,becoming softer in more luminous sources, whether measuredin soft, 0.2–2 keV (Forster & Halpern 1996; Lu & Yu 1999;Gierlinski & Done 2004; Williams et al. 2004), or hard, 2–10 keV (Dai et al. 2004; Porquet et al. 2004; Wang et al. 2004)bands only, or comprising the whole spectrum, and even asthey vary (Chiang et al. 2000; Petrucci et al. 2000; Vaughanet al. 2001). However, because many others have not found suchtrends, the idea that the choice of the sample involved in thesestudies may contribute to producing the correlations has alsobeen put forward. Interestingly, our ChaMP sample does notshow this correlation either. Figure 7 illustrates the dependenceof Γ measured in the 0.5–8 keV range as a function of the totalnumber of counts in this energy range, the X-ray flux, and theX-ray luminosity. As before, we emphasize the different opticalspectral classifications; the fact that, e.g., the various types ofgalaxies separate rather well from each other in diagrams likethis suggests that the correlation is physical, and most probablyrelated to the accretion physics in these nuclei, rather than anartificial effect of fitting various (simple) models to their X-rayspectra.
4.2. Comparison with High z QSOs
The anticorrelation between Γ and L/Ledd (or simply,LX/MBH) that we find to characterize the nuclear emissionof nearby galaxies is certainly surprising. This trend is oppo-site to what more luminous galaxy nuclei, i.e., quasars, ex-hibit: their X-ray spectra soften as they become more luminous.Figure 8 shows the Γ–L/Ledd anticorrelation followed by thelow-luminosity galaxy nuclei along with measurements of Γ andL/Ledd for a sample of SDSS quasars with optical spectra thatare ChaMP detected and X-ray analyzed in the same mannerwe handled our sample of nearby galaxy nuclei (Green et al.2009). The quasar L/Ledd values are obtained using the averagebolometric correction of L/LX = 83 estimated by Ho (2008),with no luminosity dependence, and the black hole masses fromShen et al. (2008).
To ease comparison with previous work on quasars, we usein this plot the 2–10 keV LX luminosity, which is obtained byextrapolating the measured unobscured L0.5−8keV value, usingthe best Γ measurements. Note that the anticorrelation between
Figure 8. Distribution of the X-ray photon index Γ as a function of L/Ledd,where L = Lbol is estimated using Lbol/LX = 16, with LX = LX(2–10 keV) calculated from LX(0.5–8 keV) using Γ. We show for comparisonthe measurements of Γ and L/Ledd for the ChaMP (high z) SDSS QSOs withspectra (Green et al. 2009), where both Γ and L/Ledd are calculated in the sameway as for the ChaMP galaxies/LLAGNs, with the difference that the bolometriccorrection for quasars is considered to be Lbol/LX = 83, independent of theirluminosity.
(A color version of this figure is available in the online journal.)
Γ and L/Ledd that nearby galaxy nuclei show is even morepronounced when the 2–10 keV LX is plotted against Γ. This isexpected, as softer objects will be less luminous in 2–10 keVthan those in the 0.5–8 keV range, while the hard objects willbe more luminous. The magnitude of this effect, i.e., the ratio ofthe two LX values, is a function of the photon index Γ as givenby
LX(2–10 keV) = LX(0.5–8 keV) × 102−Γ − 22−Γ
82−Γ − 0.52−Γ . (1)
The largest difference, and thus the most significant effecton the shape of the Γ–L/Ledd trend, is for the softest (Γ � 3)objects; however, it does not exceed ∼1 dex. Note that for theseparticular objects the measurement errors are also among thehighest, and hence contributed the least weight to the best-fitΓ–L/Ledd relation.
The ChaMP quasars fall well within the locus of valuesexpected based on previous work. The ChaMP quasars donot show, however, a clear Γ–L/Ledd positive correlation. The

1352 CONSTANTIN ET AL. Vol. 705
ChaMP quasars span a wide range in redshift and their L/Leddmeasurements reflect a mix of BH mass estimates based on allHβ, Mg ii, and C iv, which may add scatter to an underlyingcorrelation (Shen et al. 2008). We show for comparison theresults of linear regression fits of the Γ–L/Ledd correlationreported by Shemmer et al. (2008) and Kelly et al. (2008),with the results for the Hβ and C iv based estimates of theMbh shown separately. We use these data only for the purposeof global comparison of the quasar properties with those ofthe nearby galaxy nuclei, and do not attempt to improve uponthe previous work on the characterization or calibration of theΓ–L/Ledd relation for quasars.
Clearly, the quasar Γ’s are not negatively correlated withtheir Eddington ratios, even with the shift in LX produced by theenergy conversion mentioned above, which might contribute tosuch trend (the quasar X-ray data are analyzed and measuredvia the same techniques employed for the nearby galaxynuclei). Thus, over the whole L/Ledd range we explore hereby putting together luminous and weak AGNs, there is clearlya break in the Γ–L/Ledd correlation, which seems to happenat L/Ledd ≈ 10−2, and Γ � 1.5. It is important to note that,for the samples of quasars investigated by both Kelly et al.(2008) and Shemmer et al. (2008), the scatter in the claimedcorrelation between Γ and L/Ledd is largest as the samplesreach the weakest accretion rates (while hardly reaching theL/Ledd ≈ 10−2 level), and the hardest values ever measured forthe quasar photon index Γ � 1.5; while suggestive of a break,the quasar data alone cannot, however, be used to single it out.Other studies that include measurements of lower luminositymanaged to point out these types of deviations from the expectedcorrelation (e.g., Zhang et al. 2008; Green et al. 2009); however,the data remained sparse at those levels of accretion, leaving theeffect unquantified.
We note here that the comparison of the nearby galaxies’central X-ray emission with that of the high redshift QSOsmay be inadequate since X-rays from SF activity is not yetaccounted for in the former. We addressed this issue by includingin the modeling of the original X-ray spectrum (Section 2.1)a Γ = 2 component with the expected LX(SF). A powerlaw with Γ = 2 provides the best simple description of themix of hot gas and high mass X-ray binaries (HMXBs) thatcomprise the SF activity (e.g., Kim et al. 1992a, 1992b; Nandra& Pounds 1994; Ptak et al. 1999; George et al. 2000; Colbertet al. 2004; Reddy & Steidel 2004; Lehmer et al. 2005). Toestimate the potential LX(SF) in each galaxy, we use starformation rates (SFR) calculated and available for these objectsin the MPA/JHU catalog (Section 2; Brinchmann et al. 2004b),along with the LX–(SFR) correlation quantified by Gilfanovet al. (2004). There are 83 objects with total LX above the linedescribing the LX–(SFR) correlation, for which we modeledthe remaining—presumably AGN component. This reanalysisproduces significant deviations from the Γ–LX/Ledd correlationonly for 6% of the sample (five out of the 83 objects involved inthis analysis). The scatter and the error bars for both Γ and LXare only slightly increased. The slope of the correlation flattensbut remains consistent within the errors with our previousmeasurements.
4.3. The “Break” in the Γ–L/Ledd Correlation andComparison with XRBs
The X-ray photon index Γ and the Eddington ratio L/Leddshow a double-sloped relation, with positive and negativecorrelations above and below L/Ledd ≈ 0.01 and Γ � 1.5,
respectively. We see now that a given AGN spectral index Γmay correspond to two different luminosity levels, with theluminosity difference greater for sources characterized by softerspectra (Figure 8). This break in the Γ–L/Ledd relation, whenstudied over a large range of accretion power, fits well into thetheoretical ideas of a transition in the AGN accretion mode: astandard (Shakura & Syunyaev 1973) accretion disk/corona athigh Eddington rates, i.e., quasar phase, and an ADAF (e.g.,Narayan & Yi 1994) at low L/Ledd. This break we find in theΓ–L/Ledd relation may provide the best empirical evidence todate for such a transition.
The inflection point in the Γ–L/Ledd relation is dominated byTs, consistent with the optical nature of these systems. Whilehypothesized to be the result of mixed AGN and SF ionization(e.g., Ho et al. 2003, A. Constantin 2010, in preparation), theirAGN component could be either an S- or L-like. Ss appear to bethe low L quasar-like, efficiently accreting systems, while theLs are the ADAF objects, so T’s locus at the break region issuggestive of a switch in the accretion mode. The opticallydefined Ts are then transition systems that map the X-rayinflection as well.
Note that this idea of transition in the accretion mode, fromADAF to standard-disk as the accretion rates increases, has beenfirst proposed, and later developed, mainly based on results ofinvestigations of smaller BH mass accretors, i.e., stellar massblack-hole X-ray binaries, or XRBs; see Narayan & McClintock(2008) for a recent review. Interestingly, the relation between Γand L/Ledd that XRBs exhibit in the different phases of theirtemporal variability is also multivalued: a given spectral indexΓ may correspond to two different luminosity levels, with theluminosity difference greater for sources characterized by softerspectra. That is, the XRBs show a positive Γ–L/Ledd correlationwhile in their high/soft states (e.g., Kubota & Makishima 2004)and an anticorrelation while in their low/hard states (e.g.,Yamaoka et al. 2005). Several clear examples of such a turn(or convergence point) in the Γ–L/Ledd relation measured inXRBs are illustrated in, e.g., Yuan et al. (2007) and Wu & Gu(2008).
In terms of the physical phenomenology governing the blackhole accretion process over more than 10 orders of magnitude inthe Eddington ratio, the transition from an ADAF to a standarddisk accretion seems to adequately account for both the XRBand AGN emission properties. The ADAF scenario qualitativelyexplains the anticorrelation via Comptonization of thermalsynchrotron photons as the dominant cooling mechanism atlow L/Ledd ratios: the Compton y-parameter increases withincreasing of the optical depth, which is caused by increaseof the accretion rate, the X-ray spectrum becomes harder (Esinet al. 1997). Further increase in the accretion rate would causeboth an increase in the released energy and a decrease in theelectron temperature, weakening the corona, and consequentlythe optical depth, reducing the y-parameter, and leading tosofter spectra, and thus the positive Γ–L/Ledd correlation (e.g.,Janiuk & Czerny 2000). The ADAF scenario has been relativelysuccessful in explaining a variety of the LLAGN properties(Ho 2008), while the standard disk-corona model has beenwidely invoked to explain quasar emission. Our finding of anonmonotonic Γ–L/Ledd relation seems to provide the firstdirect empirical link between these two different types ofaccretion in AGNs.
The AGN–XRB physical analogy has been discussed ratherextensively (see Maccarone et al. 2005), and is particularlysupported by the two “fundamental planes” of the BH activity

No. 2, 2009 PROBING THE BALANCE OF AGN AND STAR-FORMING ACTIVITY WITH ChaMP 1353
on all mass scales, the Lradio − LX − Mbh (Merloni et al. 2003;Falcke et al. 2004) and the Lbol − Mbh − Tbreak (McHardy et al.2006). There was however not much evidence for existence ofspectral states in massive black holes, similar to those of thestellar black holes. Our discovery of an anticorrelation betweenΓ and L/Ledd, and thus the discovery of a turning point inthe Γ–L/Ledd relation for AGNs, provides this evidence, whichconstitutes an important empirical constraint to the idea thatthese systems are really the analogs of each other, in spite of thevast difference of scales.
5. CONCLUSIONS AND DISCUSSION
This study of serendipitous Chandra nearby sources bringstogether for the first time a large homogeneous sample ofactive and inactive galaxy nuclei selected and classified basedon their optical spectral properties. With a minimal selectionbias, we characterize the X-ray properties of low-luminosityAGNs via measurements of the X-ray spectral shape, fluxes, andluminosities. These measurements add important informationand provide new constraints to the proposed H ii → S/T →L → P galaxy evolutionary sequence. Optical observationsreveal that at least in statistical terms, along this sequence,(1) the host halo mass increases, (2) the environmental densityincreases, (3) both central BH mass and stellar mass increase,while (4) the rate of accretion onto the central BH decreases,(5) the stellar population ages, and (6) the material that couldbe used for accretion and/or star formation is less and lessavailable. The X-ray data support these evolutionary trends andbring surprising new insights into the nature of the LLAGNphenomenon.
There are two main results of this analysis that we want toemphasize here:
1. The (H ii →) Seyfert → Transition Object → LINER →Passive Galaxy sequence suggested by a large variety ofoptical measures is supported by X-ray measurements. Boththe spectral shape and the accretion power, as measuredby LX and the Eddington ratio L/Ledd, with L = Lbol =16 × LX, show a clear trend toward softer, less X-rayluminous and less actively accreting sources from Ss toTs, to Ls, and, at the end, the Passive galaxies. The ratherambiguous (in some optical properties) succession of Sand T phases is now significantly constrained by the X-rayactivity to follow in a sense of decreasing accretion power.
2. There is a rather strong anticorrelation between the shapeof the X-ray spectral energy distribution, quantified via thepower-law index Γ, and L/Ledd. This finding translates intoa break in the Γ–L/Ledd correlation exhibited by AGNsof all powers, with spectral softening on either side ofL/Ledd ≈ 0.01. The transition point is identical to thatwhere stellar mass BH accretors (XRBs) exhibit their turnin analogous Γ–L/Ledd trends.
The distribution of points within the observed Γ–L/Leddrelation exhibited by both weak and powerful AGNs mighthave other implications as well. The presence of some LLAGNsbelow the Γ � 1.5 turning point, which are mostly Seyferts,suggests that obscuration might also play a role in shaping theobserved Γ–L/Ledd trends at low and high z. These particularobjects’ rather hard photon indices must be the indication ofgas absorption of their 0.5–8 keV spectra. Their Eddingtonratios huddle near the 10−2 level, being generally weak whencompared with the luminous quasars, and among the strongestLLAGNs. Thus, the anticorrelation between Γ and L/Ledd
shown by the nearby galaxy nuclei may well be interpretedas a relation between absorption and accretion rates, the objectsaccreting at higher rates being more obscured.
The probably naive extrapolation of this idea at higherL/Ledd suggests then that more active AGNs are also moreabsorbed. Consequently, these increasingly absorbed systems,which would be the type 2 ones [according to the AGN“unification” scenario that separates (the observed appearanceof) AGNs in terms of orientation relative to the line of sight],would be decreasingly likely to be included in the (current)optically selected AGN/quasar samples. This interpretation iscertainly consistent with the general results of various questsfor type 2 quasars: their X-ray spectra are harder than theirtype 1 counterparts (Zakamska et al. 2004; Ptak et al. 2006),and they are highly obscured (Zakamska et al. 2005). The type2 quasars are definitely scarce compared with the type 1, andtheir fraction relative to that of the type 1 ones decreases withincreasing luminosity (Reyes et al. 2008). Thus, this may as wellbe the explanation for the dearth of type 2 quasars.
If the type 1–2 dichotomy and consequently the “unification”are only about the observing angle, the AGN–galaxy evolution-ary sequence suggested by the properties of the different typesof nearby galactic nuclei should be even stronger once incli-nation effects are removed, as we would have a clearer viewof the central engine. On the other hand, the 1–2 type separa-tion, and thus the unification, might be the result of evolution.Some simulations suggest that for the luminous quasars, thetype 1 (unobscured) phase comes after a phase of “blowing-out” circumnuclear matter, which might mean after the quasarswere observable as type 2. By adding type 1 LLAGNs to in-vestigations of the Γ–L/Ledd connection, we might be able tounderstand better the way the proposed evolutionary sequencedoes or does not challenge the unification scenario.
Also, the exact location of the turning point in the Γ–L/Leddrelation remains to be better quantified in terms of both param-eters. Of particular caution is combining the L/Ledd measure-ments of LLAGNs with those of quasars, mainly because themethods used in estimating their BH masses are not necessar-ily compatible. The BH masses of LLAGNs are based on theMbh–σ∗ relation, while the (usually high z) quasar BH massesare obtained from the widths of the optical broad emission linesvia scaling relations; the scaling relations are calibrated on Mbh–σ∗, which, recent work suggests, does not necessarily hold athigh z. Another way of refining the exact location of the breaklies of course in better estimates of Γ, i.e., higher quality (highersignal-to-noise ratio) X-ray measurements, and/or larger sam-ples. The latter alternative, in particular, seems to be feasible, aslarger and larger samples of well-characterized samples of opti-cally selected AGNs become available for cross-correlation withX-ray detections from, e.g., serendipitous surveys like ChaMP.
Future work (A. Constantin & ChaMP 2010, in preparation)will explore the multiwavelength properties of a large sampleof AGNs that brings together nearby LLAGNs of type 2 withnearby quasars (type 1 AGNs), thus attempting to reconcileboth the type 1–2 dichotomy and the problem of mixmatchingBH masses, along with providing larger statistics, and bettermeans of quantifying extrinsic effects such as absorption andnonthermal processes (i.e., Comptonized emission from the ac-cretion disk’s corona) that enable improved constraints to theanalogy with XRBs. We will also address in this work the biasesthat are potentially present in the previously claimed relation-ships between the LX and optical emission line luminosities forLLAGNs, together with the impact of using optical emission

1354 CONSTANTIN ET AL. Vol. 705
lines to estimate Lbol, and thus to the overall shape of the Γ–L/Ledd relation.
A.C. thanks Christy Tremonti for valuable discussions regard-ing the MPA/JHU catalog. Support for this work was providedby the National Aeronautics and Space Administration throughChandra Award Number AR7-8015A issued by the ChandraX-ray Observatory Center, which is operated by the Smithso-nian Astrophysical Observatory for and on behalf of the NationalAeronautics Space Administration under contract NAS8-03060.
REFERENCES
Aldcroft, T. L. 2006, BAAS, 38, 376Baldwin, J. A., Phillips, M. M., & Terlevich, R. 1981, PASP, 93, 5Barth, A., & Shields, C. J. 2000, PASP, 112, 753Blandford, R. D., & Begelman, M. C. 1999, MNRAS, 303, 1Bohringer, H., et al. 2001, A&A, 365, 181Brinchmann, J., Charlot, S., Heckman, T. M., Kauffmann, G., Tremonti, C., &
White, S. D. M. 2004a, arXiv:astro-ph/0406220Brinchmann, J., Charlot, S., White, S. D. M., Tremonti, C., Kauffmann, G.,
Heckman, T. M., & Brinkmann, J. 2004b, MNRAS, 351, 1151Cash, W. 1979, ApJ, 228, 939Charlot, S., & Fall, S. M. 2000, ApJ, 539, 718Chiang, J., Reynolds, C. S., Blaes, O. M., Nowak, M. A., Murray, N., Madejski,
G., Marshall, H. L., & Magdziarz, P. 2000, ApJ, 528, 292Cid Fernandes, R., Gonzalez Delgado, R. M., Storchi-Bergmann, T., Martins,
L. P., & Schmitt, H. 2005, MNRAS, 356, 270Colbert, E. J. M., Heckman, T. M., Ptak, A. F., Strickland, D. K., & Weaver, K.
A. 2004, ApJ, 602, 231Constantin, A., Hoyle, F., & Vogeley, M. S. 2008, ApJ, 673, 715Constantin, A., & Vogeley, M. S. 2006, ApJ, 650, 727Czerny, B., et al. 2003, A&A, 412, 317Dai, X., Chartas, G., Eracleous, M., & Garmire, G. P. 2004, ApJ, 605, 45Dickey, J. M., & Lockman, F. J. 1990, ARA&A, 28, 215Di Matteo, T., et al. 2005, Nature, 433, 604Dudik, R. P., Satyapal, S., Gliozzi, M., & Sambruna, R. M. 2005, ApJ, 620, 113Esin, A. A., McClintock, J. E., & Narayan, R. 1997, ApJ, 489, 865Falcke, H., Kording, E., & Markoff, S. 2004, A&A, 414, 895Filho, M. E., Fraternali, F., Markoff, S., Nagar, N. M., Barthel, P. D., Ho, L. C.,
& Yuan, F. 2004, A&A, 418, 429Filippenko, A. V., & Terlevich, R. 1992, ApJ, 397, 79Flohic, H. M. L. G., Eracleous, M., Chartas, G., Shields, J. C., & Moran, E. C.
2006, ApJ, 647, 140Forster, K., & Halpern, J. P. 1996, ApJ, 468, 565Georgantopoulos, I., Panessa, F., Akylas, A., Zezas, A., Cappi, M., & Comastri,
A. 2002, A&A, 386, 60George, I. M., & Fabian, A. C. 1991, MNRAS, 249, 352George, I. M., Turner, T. J., Yaqoob, T., Netzer, H., Laor, A., Mushotzky, R. F.,
Nandra, K., & Takahashi, T. 2000, ApJ, 531, 52Gierlinski, M., & Done, C. 2004, MNRAS, 349, 7Gilfanov, M., Grimm, H. J., & Sunyaev, R. 2004, MNRAS, 347, L57Gonzalez-Martin, O., Masegosa, J., Marquez, I., Guerrero, M. A., & Dultzin-
Hacyan, D. 2006, A&A, 460, 45Green, P. J., et al. 2004, ApJS, 150, 43Green, J. P., et al. 2009, ApJ, 690, 644Greene, J. E., & Ho, L. C. 2007, ApJ, 656, 84Haardt, F., & Maraschi, L. 1991, ApJ, 380, 51Halderson, E. L., Moran, E. C., Filippenko, A. V., & Ho, L. C. 2001, AJ, 122,
637Heckman, T. M., Kauffmann, G., Brinchmann, J., Charlot, S., Tremonti, C., &
White, S. D. M. 2004, ApJ, 613, 109Ho, L. C. 2008, ARA&A, 46, 475Ho, L. C., Filippenko, A. V., & Sargent, W. L. W. 1997a, ApJS, 112, 315Ho, L. C., Filippenko, A. V., & Sargent, W. L. W. 1997b, ApJ, 487, 568Ho, L. C., Filippenko, A. V., & Sargent, W. L. W. 2003, ApJ, 583, 159Ho, L. C., et al. 2001, ApJ, 549, L51Hopkins, P. F., & Hernquist, L. 2006, ApJ, 166, 1Hopkins, P. F., et al. 2006, ApJ, 652, 864Hopkins, P. F., & Hernquist, L. 2009, ApJ, 698, 1550Ishisaki, Y., et al. 1996, PASJ, 48, 237Iyomoto, N., Makishima, K., Matsushita, K., Fukazawa, Y., Tashiro, M., &
Ohashi, T. 1998, ApJ, 503, 168Iyomoto, N., Fukazawa, Y., Nakai, N., & Ishihara, Y. 2001, ApJ, 561, 69
Janiuk, A., & Czerny, B. 2000, New Astron., 5, 7Kalemci, E., Tomsick, J. A., Buxton, M. M., Rothschild, R. E., Pottschmidt, K.,
Corbel, S., Brocksopp, C., & Kaaret, P. 2005, ApJ, 622, 508Kauffmann, G., & Heckman, T. M. 2009, MNRAS, 397, 135Kauffmann, G., et al. 2003a, MNRAS, 341, 33Kauffmann, G., et al. 2003b, MNRAS, 346, 105Kauffmann, G., et al. 2004, MNRAS, 353, 713Kelly, B. C., Bechtold, J., Trump, J. R., Vestergaard, M., & Siemiginowska, A.
2008, ApJ, 176, 355Kewley, L., Dopita, M. A., Sutherland, R. S., Heisler, C. A., & Trevena, J.
2001, ApJ, 556, 121Kewley, L. J., Groves, B., Kauffmann, G., & Heckman, T. 2006, MNRAS, 372,
961Kim, D.-W., & Fabbiano, G. 2003, ApJ, 586, 826Kim, D.-W., Fabbiano, G., & Trinchieri, G. 1992, ApJ, 393, 134Kim, D.-W., Fabbiano, G., & Trinchieri, G. 1992, ApJS, 80, 645Kollmeier, J. A., et al. 2006, ApJ, 648, 128Kubota, A., & Makishima, K. 2004, ApJ, 601, 428Lehmer, B., et al. 2005, AJ, 129, 1Lightman, A. P., & White, T. R. 1988, ApJ, 335, 57Lu, J.-F., Li, S.-L., & Gu, W.-M. 2004, MNRAS, 352, 147Lu, Y., & Yu, Q. 1999, ApJ, 526, 5Maccarone, T. J., Fender, R. P., & Ho, L. C. 2005, From X-ray Binaries to
Quasars: Black Hole Accretion on All Mass Scales (Dordrecht: Kluwer)McHardy, I. M., Koerding, E., Knigge, C., Uttley, P., & Fender, R. P.
2006, Nature, 444, 730McLure, R. J., & Dunlop, J. S. 2004, MNRAS, 352, 1390Merloni, A., Heinz, S., & di Matteo, T. 2003, MNRAS, 345, 1057Miniutti, G., Ponti, G., Greene, J. E., Ho, L. C., Fabian, A. C., & Iwasawa, K.
2008, MNRAS, 394, 443Nandra, K., & Pounds, K. A. 1994, MNRAS, 268, 405Narayan, R., & Yi, I. 1994, ApJ, 428, 13Narayan, R., Igumenshchev, I. V., & Abramowicz, M. A. 2000, ApJ, 539, 798Narayan, R., & McClintock, J. E. 2008, New Astron. Rev., 51, 733Nayakshin, S. 2000, ApJ, 540, 37Netzer, H., Lira, P., Trakhtenbrot, B., Shemmer, Ohad, & Cury, I. 2007, ApJ,
671, 1256Page, M. J., Soria, R., Zane, S., Wu, K., & Starling, R. L. C. 2004, A&A, 422,
77Panessa, F., et al. 2006, A&A, 455, 173Parejko, J. K., Constantin, A., Vogeley, M. S., & Hoyle, F. 2008, AJ, 135, 10Pellegrini, S. 2005, ApJ, 624, 155Pellegrini, S., Baldi, A., Fabbiano, G., & Kim, D.-W. 2003, ApJ, 597, 175Pellegrini, S., Cappi, M., Bassani, L., della Ceca, R., & Palumbo, G. G. C.
2000a, A&A, 360, 878Pellegrini, S., Cappi, M., Bassani, L., Malaguti, G., Palumbo, G. G. C., & Persic,
M. 2000b, A&A, 353, 447Pellegrini, S., Fabbiano, G., Fiore, F., Trinchieri, G., & Antonelli, A. 2002, A&A,
383, 1Petrucci, P. O., et al. 2000, ApJ, 540, 131Porquet, D., Reeves, J. N., O’Brien, P., & Brinkmann, W. 2004, A&A, 422, 85Poutanen, J., Krolik, J. H., & Ryde, F. 1997, MNRAS, 292, 21Proga, D. 2005, ApJ, 630, 9Ptak, A., Serlemitsos, P., Yaqoob, T., & Mushotzky, 1999, ApJS, 120, 179Ptak, A., Terashima, Y., Ho, L. C., & Quataert, E. 2004, ApJ, 606, 173Ptak, A., Yaqoob, T., Serlemitsos, P. J., Kunieda, H., & Terashima, Y. 1996, ApJ,
459, 542Ptak, A., Zakamska, N. L., Strauss, M. A., Krolik, J. H., Heckman, T. M.,
Schneider, D. P., & Brinkmann, J. 2006, ApJ, 637, 147Reddy, N. A., & Steidel, C. C. 2004, ApJ, 603, 13Reyes, R., et al. 2008, AJ, 136, 2373Roberts, T. P., Schurch, N. J., & Warwick, R. S. 2001, MNRAS, 324, 737Roberts, T. P., & Warwick, R. S. 2000, MNRAS, 315, 98Satyapal, S., Dudik, R. P., O’Halloran, B., & Gliozzi, M. 2005, ApJ, 633, 86Satyapal, S., Sambruna, R. M., & Dudik, R. P. 2004, A&A, 414, 825Schawinski, K., et al. 2007, MNRAS, 382, 1415Shakura, N. I., & Syunyaev, R. A. 1973, A&A, 24, 337Shapiro, S. L., Lightman, A. P., & Eardley, D. M. 1976, ApJ, 204, 187Shemmer, O., Brandt, W. N., Netzer, H., Maiolino, R., & Kaspi, S. 2008, ApJ,
682, 81Shen, Y., Greene, J. E., Strauss, M. A., Richards, G. T., & Schneider, D. P.
2008, ApJ, 680, 169Shields, J. C. 1992, ApJ, 399, 27LSobolewska, M. A., Siemiginowska, A., & Zycki, P. T. 2004, ApJ, 617, 102Soria, R., Fabbiano, G., Graham, A. W., Baldi, A., Elvis, M., Jerjen, H.,
Pellegrini, S., & Siemiginowska, A. 2006, ApJ, 640, 126

No. 2, 2009 PROBING THE BALANCE OF AGN AND STAR-FORMING ACTIVITY WITH ChaMP 1355
Starling, R. L. C., Page, M. J., Branduardi-Raymont, G., Breeveld, A. A., Soria,R., & Wu, K. 2005, MNRAS, 356, 727
Stasinska, G., et al. 2008, MNRAS, 391, 29Taniguchi, Y., Shioya, Y., & Murayama, T. 2000, AJ, 120, 1265Terashima, Y., et al. 1998, ApJ, 503, 212Terashima, Y., Ho, L. C., & Ptak, A. F. 2000a, ApJ, 539, 161Terashima, Y., Ho, L. C., Ptak, A. F., Mushotzky, R. F., Serlemitsos, P. J.,
Yaqoob, T., & Kunieda, H. 2000b, ApJ, 533, 729Terashima, Y., Iyomoto, N., Ho, L. C., & Ptak, A. F. 2002, ApJS, 139, 1Terashima, Y., & Wilson, A. S. 2003, ApJ, 583, 145Tremaine, S., et al. 2002, ApJ, 574, 740Tremonti, C. A., et al. 2004, ApJ, 613, 898Vaughan, S., Edelson, R., Warwick, R. S., Malkan, M. A., & Goad, M. R.
2001, MNRAS, 327, 673Veilleux, S., & Osterbrock, D. E. 1987, ApJS, 63, 295Vignali, C., Brandt, W. N., Schneider, D. P., & Kaspi, S. 2005, AJ, 129,
2519
Wang, J.-M., Watarai, K.-Y., & Mineshige, S. 2004, ApJ, 607, 107Williams, R. J., Mathur, S., & Pogge, R. W. 2004, ApJ, 610, 737Winter, L. M., Mushotzky, R. F., Reynolds, C. S., & Tueller, J. 2009, ApJ, 690,
1322Wu, Q., & Gu, M. 2008, ApJ, 682, 212Yamaoka, K., Uzawa, M., Arai, M., Yamazaki, T., & Yoshida, A. 2005, Ch. J.
Astron. Astrophys. Suppl, 5, 273Yaqoob, T., Edelson, R., Weaver, K. A., Warwick, R. S., Mushotzky, R. F.,
Serlemitsos, P. J., & Holt, S. S. 1995, ApJ, 453, 81Yu, Q., & Tremaine, S. 2002, MNRAS, 335, 965Yuan, F., & Narayan, R. 2004, ApJ, 612, 724Yuan, F., Taam, R. E., Misra, R., Wu, X.-B., & Xue, Y. 2007, ApJ, 658, 282Zakamska, N. L., et al. 2005, AJ, 129, 1212Zakamska, N. L., Strauss, M. A., Heckman, T. M., Ivezic, Z., & Krolik, J. H.
2004, AJ, 128, 1002Zdziarski, A. A., Lubinski, P., & Smith, D. A. 1999, MNRAS, 303, 11Zhang, X.-G., Dultzin, D., & Wang, T.-G. 2008, MNRAS, 385, 1087