
Brightness Induction: Rate Enhancement and Neuronal Synchronization as Complementary Codes
11
Neuron 52, 1073–1083, December 21, 2006 ª2006 Elsevier Inc. DOI 10.1016/j.neuron.2006.11.012 Brightness Induction: Rate Enhancement and Neuronal Synchronization as Complementary Codes Julia Biederlack, 1 Miguel Castelo-Branco, 2 Sergio Neuenschwander, 3 Diek W. Wheeler, 3,4 Wolf Singer, 3,4 and Danko Nikolic ´ 3,4, * 1 Mibeg-Institut for Media Sachsenring 37-39 50677 Cologne Germany 2 IBILI-Centro de Oftalmologia Azinhaga de Sta Comba 3000 Coimbra Portugal 3 Max-Planck-Institute for Brain Research Deutschordenstraße 46 60528 Frankfurt a.M. Germany 4 Frankfurt Institute for Advanced Studies Johann Wolfgang Goethe University Frankfurt a.M. Germany Summary In cat visual cortex, we investigated with parallel re- cordings from multiple units the neuronal correlates of perceived brightness. The perceived brightness of a center grating was changed by varying the orienta- tion or the relative spatial phase of a surrounding grat- ing. Brightness enhancement by orientation contrast is associated with an increase of discharge rates of responses to the center grating but not with changes in spike synchronization. In contrast, if brightness enhancement is induced by phase offset, discharge rates are unchanged but synchronization increases between neurons responding to the center grating. The changes in synchronization correlate well with changes in perceived brightness that were assessed in parallel in human subjects using the same stimuli. These results indicate that in cerebral cortex the modulation of synchronicity of responses is used as a mechanism complementary to rate changes to enhance the saliency of neuronal responses. Introduction The perceived brightness and the contrast of visual stim- uli are influenced by surrounding stimuli (Agostini and Galmonte, 2002; Cannon and Fullenkamp, 1991; Huang et al., 2002; Sillito and Jones, 1996; Yu et al., 2001). These interactions are often correlated with a modulation of the discharge rates of neurons in the visual cortex (Blake- more and Tobin, 1972; DeAngelis et al., 1994; Knierim and Van Essen, 1992; Nelson and Frost, 1978; Rossi and Paradiso, 1999; Sengpiel et al., 1997; Walker et al., 2000). For example, when a sinusoidal grating of high contrast is surrounded by another grating of high con- trast, the perceived contrast of the center grating de- pends on the orientation of the surround. Perceived contrast is minimal with an iso-oriented and maximal with a cross-oriented surround, as the perceived bright- ness of the white bars of the grating increases with orien- tation offset (Cannon and Fullenkamp, 1991; Ejima and Takahashi, 1985; Solomon et al., 1993; Yu et al., 2001) (Figures 1B and 1C). This change in perception is closely correlated with changes of neuronal discharge rates in the primary visual cortex. An iso-oriented surround sup- presses neuronal responses much more than a cross- oriented surround (Blakemore and Tobin, 1972; DeAnge- lis et al., 1994; Knierim and Van Essen, 1992; Nelson and Frost, 1978; Sengpiel et al., 1997; Walker et al., 2000). There are cases, however, where changes in per- ceived brightness are not correlated with changes in neuronal firing rates. One example is the phase-depen- dent brightness-induction effect. Here, the enhance- ment in perceived contrast of the center grating is in- duced by phase offsets between the surround and the center grating (Cannon and Fullenkamp, 1991; Ejima and Takahashi, 1985; Yu et al., 2001)(Figure 1A). In this condition, the discharge rates of neurons in early visual areas do not correlate with perceived brightness be- cause responses remain equally suppressed by the sur- round grating, irrespective of its phase-relation to the center grating (DeAngelis et al., 1994; Tanaka et al., 1987). Interestingly, however, this enhancement of per- ceived brightness by phase offset is associated with in- creased BOLD responses in human V1 (Williams et al., 2003). This suggests that the brightness enhancement caused by phase offset, even if not associated with rate increases in V1, is nevertheless due to mechanisms that operate in early visual areas. A mechanism that does not rely on rate modulation but can also modify the sa- liency of neuronal responses is the precise synchroniza- tion of discharges. Like an increase in discharge rate, it enhances the impact of neuronal responses by rendering them more efficient in driving receiving neurons (Usrey et al., 1998). As recent evidence indicates that BOLD responses correlate not only with neuronal discharge rates but also with synchronization (Niessing et al., 2005), we hypothesized that brightness induction by phase offset could be associated with increased syn- chronization of responses to the center stimuli. In order to test this hypothesis, we investigated changes of neuronal discharge rates and synchrony in area 17 of anesthetized cats in response to center and surround gratings of different orientations and phase relations. Both center and surround gratings were sinu- soidally modulated, had the same high contrast (0.83– 0.97; mean luminance 31.4 cd m 22 ), the same spatial frequency (0.5–1.2 cycles/ ), and drifted with the same speed (1–3 /s). Thus, without introduction of a phase or orientation contrast, the two gratings merged into one large grating. In order to comply with psychophysical studies, we used large center stimuli (up to 11.4 of visual angle) that covered areas much larger than the sizes of in- dividual receptive fields (RFs). To investigate neuronal re- sponses, we recorded multiunit activity (MUA) and local field potentials (LFPs), either with multiple, individually *Correspondence: [email protected]
-
Upload
universidadedecoimbra -
Category
Documents
-
view
1 -
download
0
Transcript of Brightness Induction: Rate Enhancement and Neuronal Synchronization as Complementary Codes

Neuron 52, 1073–1083, December 21, 2006 ª2006 Elsevier Inc. DOI 10.1016/j.neuron.2006.11.012
Brightness Induction: Rate Enhancement andNeuronal Synchronization as Complementary Codes
Julia Biederlack,1 Miguel Castelo-Branco,2
Sergio Neuenschwander,3 Diek W. Wheeler,3,4
Wolf Singer,3,4 and Danko Nikolic3,4,*1Mibeg-Institut for MediaSachsenring 37-3950677 CologneGermany2 IBILI-Centro de OftalmologiaAzinhaga de Sta Comba 3000CoimbraPortugal3Max-Planck-Institute for Brain ResearchDeutschordenstraße 4660528 Frankfurt a.M.Germany4Frankfurt Institute for Advanced StudiesJohann Wolfgang Goethe UniversityFrankfurt a.M.Germany
Summary
In cat visual cortex, we investigated with parallel re-cordings from multiple units the neuronal correlates
of perceived brightness. The perceived brightness ofa center grating was changed by varying the orienta-
tion or the relative spatial phase of a surrounding grat-ing. Brightness enhancement by orientation contrast
is associated with an increase of discharge rates ofresponses to the center grating but not with changes
in spike synchronization. In contrast, if brightnessenhancement is induced by phase offset, discharge
rates are unchanged but synchronization increasesbetween neurons responding to the center grating.
The changes in synchronization correlate well withchanges in perceived brightness that were assessed
in parallel in human subjects using the same stimuli.These results indicate that in cerebral cortex the
modulation of synchronicity of responses is usedas a mechanism complementary to rate changes to
enhance the saliency of neuronal responses.
Introduction
The perceived brightness and the contrast of visual stim-uli are influenced by surrounding stimuli (Agostini andGalmonte, 2002; Cannon and Fullenkamp, 1991; Huanget al., 2002; Sillito and Jones, 1996; Yu et al., 2001). Theseinteractions are often correlated with a modulation of thedischarge rates of neurons in the visual cortex (Blake-more and Tobin, 1972; DeAngelis et al., 1994; Knierimand Van Essen, 1992; Nelson and Frost, 1978; Rossiand Paradiso, 1999; Sengpiel et al., 1997; Walker et al.,2000). For example, when a sinusoidal grating of highcontrast is surrounded by another grating of high con-trast, the perceived contrast of the center grating de-
*Correspondence: [email protected]
pends on the orientation of the surround. Perceivedcontrast is minimal with an iso-oriented and maximalwith a cross-oriented surround, as the perceived bright-ness of the white bars of the grating increases with orien-tation offset (Cannon and Fullenkamp, 1991; Ejima andTakahashi, 1985; Solomon et al., 1993; Yu et al., 2001)(Figures 1B and 1C). This change in perception is closelycorrelated with changes of neuronal discharge rates inthe primary visual cortex. An iso-oriented surround sup-presses neuronal responses much more than a cross-oriented surround (Blakemore and Tobin, 1972; DeAnge-lis et al., 1994; Knierim and Van Essen, 1992; Nelson andFrost, 1978; Sengpiel et al., 1997; Walker et al., 2000).
There are cases, however, where changes in per-ceived brightness are not correlated with changes inneuronal firing rates. One example is the phase-depen-dent brightness-induction effect. Here, the enhance-ment in perceived contrast of the center grating is in-duced by phase offsets between the surround and thecenter grating (Cannon and Fullenkamp, 1991; Ejimaand Takahashi, 1985; Yu et al., 2001) (Figure 1A). In thiscondition, the discharge rates of neurons in early visualareas do not correlate with perceived brightness be-cause responses remain equally suppressed by the sur-round grating, irrespective of its phase-relation to thecenter grating (DeAngelis et al., 1994; Tanaka et al.,1987). Interestingly, however, this enhancement of per-ceived brightness by phase offset is associated with in-creased BOLD responses in human V1 (Williams et al.,2003). This suggests that the brightness enhancementcaused by phase offset, even if not associated withrate increases in V1, is nevertheless due to mechanismsthat operate in early visual areas. A mechanism that doesnot rely on rate modulation but can also modify the sa-liency of neuronal responses is the precise synchroniza-tion of discharges. Like an increase in discharge rate, itenhances the impact of neuronal responses by renderingthem more efficient in driving receiving neurons (Usreyet al., 1998). As recent evidence indicates that BOLDresponses correlate not only with neuronal dischargerates but also with synchronization (Niessing et al.,2005), we hypothesized that brightness induction byphase offset could be associated with increased syn-chronization of responses to the center stimuli.
In order to test this hypothesis, we investigatedchanges of neuronal discharge rates and synchrony inarea 17 of anesthetized cats in response to center andsurround gratings of different orientations and phaserelations. Both center and surround gratings were sinu-soidally modulated, had the same high contrast (0.83–0.97; mean luminance 31.4 cd m22), the same spatialfrequency (0.5–1.2 cycles/�), and drifted with the samespeed (1–3�/s). Thus, without introduction of a phase ororientation contrast, the two gratings merged into onelarge grating. In order to comply with psychophysicalstudies, we used large center stimuli (up to 11.4� of visualangle) that covered areas much larger than the sizes of in-dividual receptive fields (RFs). To investigate neuronal re-sponses, we recorded multiunit activity (MUA) and localfield potentials (LFPs), either with multiple, individually

Neuron1074
Figure 1. Stimulation Conditions that Lead to
Changes in Perceived Contrast of the Center
Grating
The center gratings in all four panels have
identical physical contrasts in brightness.
Nevertheless, when simultaneously viewing
the center gratings in (A), (B), and (C), most
observers perceive the least contrast (or
sharpness) in the center grating surrounded
by an iso-oriented grating that has a very small offset from or is fully in phase with the center (B). An increase in either phase offset (A) or orien-
tation contrast (C) of the surround strongly increases the perceived contrast of the center. The phenomenon in (A) is known as the brightness
induction effect. (D) If the surround is segregated from the center by a gray ring, the brightness induction effect disappears.
adjustable tungsten electrodes (up to four electrodes si-multaneously, 162 recording sites in total) or with multi-site silicon probes (16 channel Michigan probes, threeseparate recordings with up to two probes simulta-neously, 68 recording sites in total). In all experiments,we recorded activity of neurons responding to the centergrating, and, in one experiment, we also recorded re-sponses to the surround grating. Discharge rates wereassessed from peristimulus time histograms (PSTHs)that were averaged across 20 responses to identicalstimulus conditions (trials), each stimulus presentationlasting for 2–4 s. Synchrony was assessed from cross-correlation functions (CCFs) computed between pairsof MUA or, in the case of long-distance synchrony, fromthe coherence functions between MUA and LFP signals(see Experimental Procedures). These correlation func-tions were computed from single-trial responses andsubsequently averaged across 20 identical trials.
Results
Rate ChangesConfirming previous studies, the discharge rates of re-sponses to the center grating were modulated by thepresence of the surround. The surround produced thestrongest rate suppression in the iso-orientation condi-tion, and this suppression gradually decreased withincreasing orientation difference between center andsurround [96 recording sites, ANOVA with linear con-trast, F(1, 95) = 8.56, p = 0.004] (Figures 2A and 2B).Thus, increasing the orientation contrast between thecenter and surround enhanced the neuronal responsesto the center. The effect size between the two extremeconditions (0� and 90� orientation contrast) was in themedium range (d = 0.46), indicating a moderately strongmodulation of response amplitudes relative to the vari-ability of the responses (see Experimental Procedures).The absolute magnitude of the modulation (9%) corre-sponded well to the magnitude of contrast enhancementin psychophysical experiments (e.g., 6%–12% acrosssubjects [Yu et al., 2001]) but was weaker than the re-ported modulation of single-unit responses to smallcenter and closely spaced surround stimuli (Joneset al., 2001). The reason is that the center stimuli usedin the present study exceeded the size of the classicalRFs of the recorded neurons. This had two attenuatingeffects on surround suppression. First, the large centerstimulus already induced some surround suppressionitself. Second, on average, the distance between thesurround stimulus and the classical RFs was increased.Hence, the surround stimuli suppressed center re-sponses by no more than 50% (Figure 2B).
The present results also confirm the finding that thephase offset of an iso-oriented surround does notmodulate the amplitude of the responses to the center(DeAngelis et al., 1994; Tanaka et al., 1987). In the exper-iments with tungsten electrodes, the changes in rateresponses were nonsignificant [123 recording sites,ANOVA, F(3, 242) = 0.13, p = 0.94; effect size, d = 0.12;Figure 2C] and the same was true for the experi-ments with Michigan probes [56 recording sites, ANOVA,F(1, 55) = 0.117, p = 0.73; d = 0.02] (Figures 2D and 2E, seeraw PSTHs in Figure 2F).
We investigated separately the rate responses ofsimple cortical cells because these are highly sensitiveto the phase of the gratings. They exhibit a sinusoidalmodulation of their discharges (Skottun et al., 1991),which is sensitive to surround suppression (Xu et al.,2005). In order to determine whether this fast modulationis sensitive to the phase offset between center and sur-round, single units were extracted (DeAngelis et al.,1994, 1999) by spike-sorting techniques. We then fitteda sine function to each PSTH and used the amplitude ofthe fitted function as a measure of the sinusoidal ratemodulation (see Figure 3A and Experimental Proceduresfor details).
The majority of the isolated neurons (13 out of 20) hadresponse characteristics of complex cells, and their re-sponse amplitudes were modulated by fewer than fourspikes/s for all four phase offsets: 0�, 60�, 120�, and180�. The responses of the remaining seven cells ex-hibited a strong sinusoidal modulation but again showedneither a significant nor a systematic dependence onthe phase offset of the surrounding grating [ANOVA,F(3, 24) = 1.55, p = 0.23; d = 0.43] (Figure 3B). This makesit unlikely that the changes in apparent brightnesscaused by phase offset are mediated by rate changesof simple cell responses, whose contribution mighthave been underestimated by the analysis of MUA.
In conclusion, our results agree with previous studies(Blakemore and Tobin, 1972; DeAngelis et al., 1994;Knierim and Van Essen, 1992; Nelson and Frost, 1978;Sengpiel et al., 1997; Tanaka et al., 1987; Walker et al.,2000), which indicated that firing rates are systematicallyaffected by the orientation offset but not by the phaseoffset of surround gratings.
Changes in Synchrony
Remarkably different results were obtained for changesin synchrony. The synchronization between neuronsresponding to the center grating decreased in a step-like function as soon as an orientation contrast wasintroduced but did not increase further with increasingorientation contrast [124 pairs, ANOVA, F(1, 123) = 5.7,

Brightness Induction and Synchronization1075
Figure 2. Firing-Rate Responses for Record-
ing Sites Stimulated by the Center Grating
and Modulated by Surround Gratings
Prior to averaging, the measures for firing
rates were normalized (see Experimental Pro-
cedures). The values in the scatter plots are
not normalized. (A) Population average of fir-
ing-rate responses to the surround presented
alone (SR), center presented alone (CN) and
with four different orientation contrasts be-
tween center and surround. (B) Firing rates
for individual recording sites in response to
0� and 90� orientation contrasts. (C and D)
Average firing-rate responses for different
degrees of phase offset between center and
surround obtained in the experiment with
tungsten electrodes (C) and Michigan probes
(D). (E) Firing rates for recording sites re-
corded with Michigan probes and for 0� and
180� phase offsets. The data in this graph
and in (B) are shown at two scales due to
the large variability in the number of neurons
composing MUA. Circles, left y axis; trian-
gles, right y axis. (F) Peristimulus time histo-
grams (PSTHs) for the typical responses for
which cross-correlation functions are shown
in Figure 4F (black, green, and red: 0�, 90�,
and 180� phase offset). Vertical bars: stan-
dard error of measurement.
p = 0.018]. This change in synchrony amounted to about10%, with d = 0.38 (Figures 4A and 4B). Such changeswould, according to our hypothesis, reduce, rather thanenhance, apparent brightness and thus could not ac-count for the perceptual changes associated with thesestimuli.
In contrast to the effects of orientation offset, changingthe phase relation between center and surround gratingsproduced much larger and highly significant effects onthe strength of synchronization between the cells re-sponding to the center grating. Response synchroniza-tion steadily increased with increasing phase offset.These changes in synchrony could be fitted well by asinusoidal function and peaked at the maximum offsetof 180� [Tungsten: 128 pairs; ANOVA, F(3, 252) = 6.3,p < 0.001; Michigan: 415 pairs; ANOVA with quadraticcontrast, F(1, 414) = 131.2, p = 0.0] (Figures 4C–4E).The changes amounted to 20% and 26%, respectively,and were associated with effect sizes of 0.63 and 0.42.These changes in synchrony remained similar and highlysignificant even in the individual recordings (n = 3)performed with Michigan probes (ANOVAs, all F values> 41.4, all p values < 0.0001, d.f. within groups rangingbetween 56 and 207). Therefore, synchronization ofneuronal responses is systematically affected by the
phase offset of an iso-oriented surround grating,increasing smoothly with phase offset.
Qualitatively, the changes in synchrony between re-sponses to the center grating were similar irrespectiveof whether the distance between recording site pairswas short (overlapping RFs of the same Michigan probe,200 mm to 1 mm) or long (between two Michigan probes,at least 2 mm) (Figure 4D). However, the short-distancesynchrony was modulated more strongly than long-dis-tance synchrony (the respective averages were 18%and 12% with effects sizes of 0.60 and 0.24). Thechanges in synchrony between the two most extremestimulation conditions (0� and 180� phase offset) for indi-vidual pairs of recording sites are shown in a scatter plot(Figure 4E). The magnitude of these changes in syn-chrony corresponds very well to the magnitude ofchanges in the perceived contrast that was assessedwith similar stimuli in psychophysical experiments(8%–24% across subjects; Yu et al., 2001) and also tothe increase of the BOLD response in human V1(w25% change; Williams et al., 2003). To illustrate thetemporal properties of the observed spike synchronybetween pairs of MUAs, we show examples of CCFsthat either do or do not include the stimulus-locked com-ponent of the synchronization (i.e., shift-predictors)

Neuron1076
(Figure 4F). The strength of the effect exerted by thephase offset is illustrated by showing CCFs for differentoffset magnitudes.
Psychophysical Measurements
The phase-offset-dependent decoupling between thecenter and surround has been proposed to reflect themechanism of perceptual segregation (Gail et al., 2000;Singer, 1999). Accordingly, it is not immediately clearwhether the increase in the synchrony of the responsesto the center grating reflects the process of figure-ground segregation rather than the changes in perceivedcontrast. To distinguish between these possibilities, wecorrelated the physiological measures with the corre-sponding psychophysical functions. As the perceptionof phase-offset gratings has been investigated only forthe extreme cases (0� and 180� offset; Yu et al., 2001),we conducted an additional psychophysical experiment,in which we investigated in human subjects the detailedpsychophysical functions associated with the detect-ability and the perceived contrast of the figure, respec-tively (see Experimental Procedures).
The perceived contrast of the center grating increasedmonotonically with the phase offset and peaked at themaximum of 180� [ANOVA, F(11, 48) = 11.7, p < 0.0001](Figure 5A). The resulting psychophysical function
Figure 3. Amplitudes of Sinusoidal Fits to PSTHs as a Function of
the Phase Offset between Center and Surround
(A) Single-unit PSTH accumulated over 20 repetitions of one stimu-
lus condition (phase offset = 0�). Thick black line: fitted sine wave
with a frequency of 1.5 Hz (the grating frequency). The amplitude
of the sine wave is used as a measure of response modulation. (B)
Mean amplitudes of response modulation for six single units
as a function of phase offset. Vertical bars: standard error of
measurement.
matched closely the changes in the strength of synchro-nization in cat area 17 and could be fitted well by a sinu-soid. In contrast, figure-ground segregation, measuredby the accuracy with which subjects distinguished be-tween two center gratings of different sizes, did not cor-respond to the changes in synchrony. Subjects per-formed 100% correctly already with phase shifts assmall as 5�, the ‘‘just noticeable difference’’ (JND) beingestimated for phase offsets of about 2.4� of phase angle(Figure 5B). The time needed to identify the size of thecenter grating also saturated at low values of phase off-sets (w10�) (Figure 5C). This suggests that any increasein the phase offset beyond about 10� does not contributeto the ability to segregate the foreground from the
Figure 4. Strength of Synchrony between the Recording Sites
Whose Rate Responses Are Shown in Figure 2
Prior to averaging, the measures of synchronization (measured by
modulation amplitude, MA) were normalized, while the values in
the scatter plots were not normalized (see Experimental Proce-
dures). (A) Average strength of synchronization between the sites
investigated in Figure 2A. (B) Strength of synchrony between individ-
ual pairs of recording sites for the same stimulation conditions as in
Figure 2B. (C and D) Strength of synchronization for the same sites
and same stimulation conditions as in Figures 2C and 2D, respec-
tively. The three different lines show the grand average (red trian-
gles), and the short- (diamonds) and long-distance synchrony
(squares) between sites belonging to the same or to two different
Michigan probes. The solid gray line indicates the fitted sine function:
(0.2 sin(q/2)) – 0.1. (E) Strength of synchrony between pairs of record-
ing sites for the same responses as shown in Figure 2E. (F) Example
of raw cross-correlation functions (CCF), shift predictors (SP), and
the cross-correlation with subtracted shift predictors (CCF 2 SP).
Examples are shown for three different levels of phase offset
(0�, 90�, and 180�). Vertical bars: standard error of measurement.

Brightness Induction and Synchronization1077
Figure 5. Psychophysical Judgments of Per-
ceived Contrast and Detection Accuracy of
the Center Stimulus as a Function of Phase
Offset between the Center and Surround
(A) Normalized changes in the perceived con-
trast of the center grating averaged over five
subjects. (B) Probability to correctly identify
whether a large or small center grating was
presented as a function of phase offset (aver-
age over three subjects). Chance level, 0.5;
JND, ‘‘just-noticeable difference.’’ (C) Latency
of responses in (B). Vertical bars: standard
error of measurement.
background stimulus. Therefore, the changes in thestrength of synchronization correlate closely only withthe perceived contrast of the center stimuli and do notcorrelate with the segregation of the center from thesurround.
Spatial Segregation between Center and Surround
The brightness induction phenomenon disappears if thesurround is segregated from the center grating by a grayring (Figure 1D) (Ejima and Takahashi, 1985; Yu et al.,2001), suggesting that the border between the centerand the surround plays an important role for the induc-tion of perceived brightness. If changes in perceivedbrightness are due to changes in synchrony betweencells responding to the center, then the introduction ofa ring should reduce the effects of phase offsets on re-sponse synchronization.
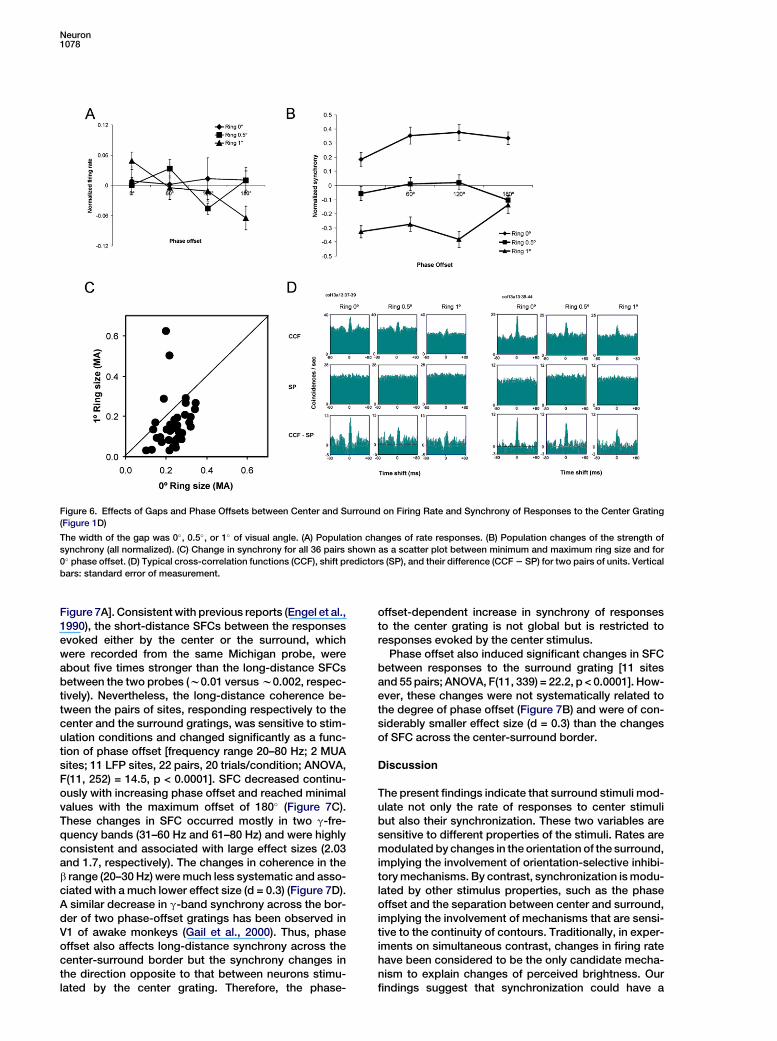
We investigated this prediction in a separate experi-ment (11 recording sites with appropriate orientationpreferences, 36 pairs, two Michigan probes inserted),where gray rings of different sizes (0�, 0.5�, and 1� of vi-sual angle) were introduced between the center and sur-round gratings (see Experimental Procedures for detail).The introduction of the ring did not significantly affect theaverage firing rates of the cells’ responses to the centergrating. The main factors of gap [F(3, 120) = 1.60; p =0.19] and offset [F(2, 120) = 0.50; p = 0.61] were not signif-icant, and the significance of the interaction was onlymarginal [F(6, 120) = 2.09; p = 0.06] (Figure 6A).
In contrast, synchrony decreased drastically with theintroduction of the ring (Figure 6B), and the changeswere highly significant [F(2, 420) = 136.7; p < 0.0001].The effect of the gap was, by all indicators, the mostprominent effect in the entire study: the effect sizesranged between 1.5 and 2.3. The scatter plot in Figure 6Cand the typical correlograms in Figure 6D illustrate thesestrong effects. Although the changes in synchronymatched most closely the psychophysical function inthe conditions without a gap, the above mentionedsine-like relationship between phase offsets and syn-
chrony did not replicate exactly in this experiment (Fig-ure 6B). We attribute this to the relatively small samplesize. This effect of phase offset was still detectable butprimarily in the significant interaction [F(6, 420) = 3.04;p = 0.006], while the significance of the main effect wasmarginal [F(3, 420) = 2.49; p = 0.06].
In conclusion, the introduction of a gap between cen-ter and surround—a manipulation that destroys theeffect of phase offset on apparent brightness—stronglyreduced the synchronicity between cells responding tothe center. This must also reduce strongly any percep-tual effect that relies on response synchronization.
Synchrony across the Contour BoundaryIn order to investigate whether the observed changes insynchrony with phase offset were global or confined onlyto responses to the center grating, we measured syn-chrony between pairs of sites activated by the centerand surround gratings, respectively. In addition, we in-vestigated the changes in the strength of synchrony be-tween the sites activated exclusively by the surroundgrating. To this end, we inserted two Michigan probesin area 17 such that the RFs of the respective recordingsites did not overlap and were completely covered eitherby the center or by the surround grating. To study theselong-range interactions, we selected recording-site pairswhose RFs shared the same orientation and werealigned collinearly. We assessed this long-distance syn-chrony by determining the spike-field coherence (SFC).This is a more sensitive measure than the CCF computedfrom neuronal discharges. It assesses the extent towhich the discharges of a cell are synchronized withthe activity of larger cell populations by quantifying theprecision of the correlation between action potentialsat one site with fluctuations of the local field potentialat another site (Fries et al., 1997) (see ExperimentalProcedures).
As expected, the firing rates of the neurons respondingto the surround were not affected by phase offsets[n = 11 MUA signals; ANOVA, F(11, 120) = 0.01, p = 0.9;
Neuron1078
Figure 6. Effects of Gaps and Phase Offsets between Center and Surround on Firing Rate and Synchrony of Responses to the Center Grating
(Figure 1D)
The width of the gap was 0�, 0.5�, or 1� of visual angle. (A) Population changes of rate responses. (B) Population changes of the strength of
synchrony (all normalized). (C) Change in synchrony for all 36 pairs shown as a scatter plot between minimum and maximum ring size and for
0� phase offset. (D) Typical cross-correlation functions (CCF), shift predictors (SP), and their difference (CCF 2 SP) for two pairs of units. Vertical
bars: standard error of measurement.
Figure 7A]. Consistent with previous reports (Engel et al.,1990), the short-distance SFCs between the responsesevoked either by the center or the surround, whichwere recorded from the same Michigan probe, wereabout five times stronger than the long-distance SFCsbetween the two probes (w0.01 versus w0.002, respec-tively). Nevertheless, the long-distance coherence be-tween the pairs of sites, responding respectively to thecenter and the surround gratings, was sensitive to stim-ulation conditions and changed significantly as a func-tion of phase offset [frequency range 20–80 Hz; 2 MUAsites; 11 LFP sites, 22 pairs, 20 trials/condition; ANOVA,F(11, 252) = 14.5, p < 0.0001]. SFC decreased continu-ously with increasing phase offset and reached minimalvalues with the maximum offset of 180� (Figure 7C).These changes in SFC occurred mostly in two g-fre-quency bands (31–60 Hz and 61–80 Hz) and were highlyconsistent and associated with large effect sizes (2.03and 1.7, respectively). The changes in coherence in theb range (20–30 Hz) were much less systematic and asso-ciated with a much lower effect size (d = 0.3) (Figure 7D).A similar decrease in g-band synchrony across the bor-der of two phase-offset gratings has been observed inV1 of awake monkeys (Gail et al., 2000). Thus, phaseoffset also affects long-distance synchrony across thecenter-surround border but the synchrony changes inthe direction opposite to that between neurons stimu-lated by the center grating. Therefore, the phase-
offset-dependent increase in synchrony of responsesto the center grating is not global but is restricted toresponses evoked by the center stimulus.
Phase offset also induced significant changes in SFCbetween responses to the surround grating [11 sitesand 55 pairs; ANOVA, F(11, 339) = 22.2, p < 0.0001]. How-ever, these changes were not systematically related tothe degree of phase offset (Figure 7B) and were of con-siderably smaller effect size (d = 0.3) than the changesof SFC across the center-surround border.
Discussion
The present findings indicate that surround stimuli mod-ulate not only the rate of responses to center stimulibut also their synchronization. These two variables aresensitive to different properties of the stimuli. Rates aremodulated by changes in the orientation of the surround,implying the involvement of orientation-selective inhibi-tory mechanisms. By contrast, synchronization is modu-lated by other stimulus properties, such as the phaseoffset and the separation between center and surround,implying the involvement of mechanisms that are sensi-tive to the continuity of contours. Traditionally, in exper-iments on simultaneous contrast, changes in firing ratehave been considered to be the only candidate mecha-nism to explain changes of perceived brightness. Ourfindings suggest that synchronization could have a

Brightness Induction and Synchronization1079
Figure 7. Responses to the Surround and
Spike-Field Coherence (SFC) between the
Responses to the Center Stimulus and the
Surround as a Function of Phase Offset
(A) Normalized average rate responses at
recording sites whose RFs were covered by
surround stimuli. (B) SFC between responses
to surround stimuli. (C) SFC between pairs of
sites stimulated by center and surround,
respectively. (D) Same data as in (C) decom-
posed into three frequency ranges. Vertical
bars: standard error of measurement.
similar function, in particular, because, as we haveshown, it correlates well with perception in conditionsin which discharge rates remain unchanged. Evidenceindicates that cortical neurons act as coincidence detec-tors and are sensitive to increases of synchronous firing(Konig et al., 1995; Usrey et al., 1998). Thus, an increasein synchronization should produce an effect on thesaliency of neuronal responses equivalent to that of anincrease in discharge rate (Abeles, 1982; Konig et al.,1996). This suggests the possibility that modulation ofdischarge rates and synchrony are complementary inadjusting the saliency of neuronal signals. This inter-pretation is consistent with the finding that phase offsetsenhance BOLD responses to the center stimulus withoutsignificantly enhancing firing rate (Williams et al., 2003)because recent evidence indicates that hemodynamicresponses increase not only with increases in dischargerates but also with increases in response synchroniza-tion (Niessing et al., 2005).
It is not clear how the changes in rate responsesinteract with the changes in synchronization when theorientation contrast between center and surround ismanipulated. In this case, perception is correlated withrates and not with synchrony. One possibility is that theinteraction is nonlinear and that, at the level of percep-tion, the changes in rates have precedence over thosein synchrony.
The mechanisms that underlie the observed changesin synchronization are not clear. Response synchroniza-tion depends on both the excitatory and inhibitorytangential connections (Engel et al., 1991; Schillen andKonig, 1994; Traub et al., 2001), reflects the anisotropyof these connections (Schmidt et al., 1997), and is, inaddition, highly susceptible to modulation by stimulusconfiguration (for review see Singer, 1999). Synchroniza-tion is particularly strong among neurons responding tocontinuous or collinear contours (Gray et al., 1989). Thisdependence on continuity accounts well for the de-crease of synchronicity across the center-surroundborder when the phase offset increases. Changes inphase offset are also likely to modulate the rate re-sponses of the cells straddling the border between thecenter and surround (Gilbert, 1977; von der Heydt et al.,
1984). However, the present results do not allow us todetermine whether and how these border effects aretranslated into enhanced synchrony that propagatesacross all neurons responding to the center stimulus.The finding that phase offsets and gaps between centerand surround had opposite effects on synchrony ex-cludes involvement of a mechanism that is solely sensi-tive to continuity. The fact that the effects are presentdespite anesthesia excludes the participation of higherattention-dependent cognitive functions and favors theinvolvement of low-level computations.
Interestingly, changes in the synchronization of re-sponses to the center grating do not correlate with theability to perceptually segregate the center from thesurround. Perceptual segregation is already completewith phase offsets that are too small to produce notice-able changes in apparent brightness and detectablechanges in synchrony. Hence, neither the modificationsin rate nor in synchrony of the responses to the segre-gated surfaces seem to be involved in the segmentationprocess proper. This suggests the possibility that theprimary cues for figure-ground segregation are the illu-sory lines that are induced at the border between thecenter and surround and that are detected by special-ized neurons (von der Heydt et al., 1984).
In conclusion, the present results demonstrate for thefirst time (to our knowledge) a close correlation betweena psychophysical function and corresponding changesin the strength of neuronal synchrony. In addition, thedata indicate that similar perceptual effects can corre-late either with changes in discharge rate or changesin synchrony. This leads us to conclude that, in corticalprocessing, increases in discharge rate and spike syn-chronization can be used as equivalent and comple-mentary mechanisms to raise the saliency of neuronalresponses and to generate similar perceptual effects.
Experimental Procedures
Preparation
Anesthesia was induced with ketamine (Ketanest, Parke-Davis,
10 mg kg21, intramuscular) and xylazine (Rompun, Bayer, 2 mg kg21,
intramuscular) and maintained with a mixture of 70% N2O and

Neuron1080
30% O2 supplemented with halothane (0.5%–1.0%). After tracheot-
omy, the animals were placed in a stereotactic frame. A craniotomy
was performed, and the skull was cemented to a metal rod. After
completion of all surgical procedures, the ear and eye bars were
removed, and the halothane level was reduced to 0.4%–0.6%. After
assuring that the level of anesthesia was stable and sufficiently
deep to prevent any vegetative reactions to somatic stimulation, the
animals were paralyzed with pancuronium bromide (Pancuronium,
Organon, 0.15 mg kg21 h21). Glucose and electrolytes were supple-
mented intravenously and through a gastric catheter. The end-tidal
CO2 and rectal temperature were kept in the range of 3%–4% and
37�C–38�C, respectively.
Visual Stimulation
Anesthetized Preparation
Stimuli were presented binocularly on a 21 inch computer screen
(HITACHI CM813ET) with 100 Hz refresh rate. To obtain binocular
fusion, the optical axes of the two eyes were first determined by map-
ping the borders of the respective RFs and then aligned on the com-
puter screen with adjustable prisms placed in front of one eye. The
software for visual stimulation was a combination of custom-made
programs and a stimulation tool, ActiveSTIM (www.ActiveSTIM.
com). In order to obtain orientation tuning curves, we presented
sinusoidal gratings moving in 12 directions with steps of 30�.
In about one-half of the recordings with tungsten electrodes, in
which we investigated surround modulation by orientation contrast,
we included two control stimulus conditions. These control condi-
tions consisted of the figure presented alone and the background
together with a gray patch in place of the figure. The latter stimulus
was used to ensure that the background did not directly activate
the neurons under investigation. Orientation and direction of move-
ment, as well as spatial frequency and stimulus velocity of the center
grating, were adjusted to activate a maximal number of cells and
were kept constant in each recording.
In the experiments with tungsten electrodes, the size of the center
grating was chosen such that it covered all of the receptive fields
(RFs) (size ranging between 2� and 10� of visual angle), and the diam-
eter of the background was adjusted to double that of the center grat-
ing, thus covering an area about four times as large. The gratings
were of rectangular shape and the average luminance of the gratings
matched that of the background.
All the investigations of surround effects with Michigan probes
were made with gratings of circular shape (0.7 cycles/� spatial fre-
quency, 2.2�/s drifting speed). Surround gratings always subtended
15.4� of visual angle. The size of the center was always adjusted to
match the sizes of the RF clusters, subtending either 11.4� for record-
ing the responses to the center only or 9.2� for simultaneous record-
ing of the responses to center and surround.
In recordings with tungsten electrodes, phase offsets were varied
randomly within the range between 0� and 180� and were subse-
quently sorted into the following four groups: 0�, 1�–60�, 61�–120�,
and 121�–180�. With Michigan probes, the phase offsets ranged
from 0� to 330� and were shifted in steps of 30�, resulting in 12 differ-
ent stimulus conditions. To investigate the effect of a ring segregat-
ing center from surround, only four phase offsets were used (0�, 60�,
120�, and 180�) but with three levels of separation between center
and surround: ring widths of 0�, 0.5�, and 1� of visual angle. The
ring had the neutral gray color of the screen background. Different
stimulation conditions were always presented in a randomized order.
Psychophysics with Human Subjects
Seven subjects (age 24–48 years) with normal or corrected-to-nor-
mal vision participated in the study. To investigate the changes in
the perceived contrast, five subjects were asked to make simulta-
neous comparisons between the contrasts of center gratings of
two stimuli, in which one always had zero offset relative to the sur-
round, while the offset in the other stimulus varied randomly between
0� and 330� in steps of 30� (12 stimulation conditions). The gratings
were always oriented vertically and identical to those used in the
physiological study with Michigan probes (size, contrast, and spatial
frequency), with the exception that the gratings were not drifting but
were presented still. In addition, we added a narrow but clearly per-
ceivable gray ring that separated center from surround. This ring in-
dicated the area within which the contrast needed to be judged and
was particularly helpful in the conditions with zero phase offset.
The two stimuli were in each trial presented for 3000 ms, with their
respective positions assigned randomly either to the left or the right
side of the screen. Subjects first reported the stimulus that appeared
to have stronger contrast (i.e., ‘‘left’’ or ‘‘right’’) and then judged the
relative contrast of that stimulus. Subjects were instructed to use
a scale at which zero indicates equal contrast and to freely choose
the upper limit of the scale. The five subjects participating in this
experiment used the following maximum values in their contrast
judgments: 3, 4, 5, 6, and 7. Prior to averaging the responses from
different subjects, we normalized individual responses by the proce-
dure described in the section titled ‘‘Normalization.’’
Subjects made ten practice trials to familiarize themselves with the
task and to establish the scale that they would use for the judgments.
Each subject performed 15 experimental trials per condition, result-
ing in a total of 180 trials. Subjects freely adjusted the viewing
distance from the screen, which was usually about 1 meter. All exper-
iments were performed in a dimmed room, and the experimental
procedure lasted about 20 min.
The ability to detect the segregation of the center from the sur-
round grating by phase shift was investigated with three subjects,
one of them participating also in the perceived contrast experiment.
We presented a single stimulus with randomly varying phase offsets
between center and surround, which had either one of the nine
smaller values: (0�–8� in steps of 1�) or one of the three larger values
(45�, 90�, and 180�) and the size of the center grating was either the
same as for the investigation of the perceived contrast or had
a 30% smaller diameter, the two sizes being clearly distinguishable.
There was no gray ring to help the segregation between the center
and surround.
Subjects needed to identify the size of the center grating by press-
ing the response button held in the right hand if the center was large
and the button held in the left hand if the center was small. This re-
sulted in a total of 24 experimental conditions. The stimulus remained
on the screen until the subjects pressed one of the buttons. Subjects
were instructed to emphasize accuracy but also to respond as
quickly as possible. Subjects were also instructed to guess if they
were uncertain about the size of the center stimulus. In addition to
accuracy, we also measured the response times. After ten practice
trials, each subject performed 20 trials per condition, resulting in a
total of 480 experimental trials. The experimental procedure lasted
about 20 min. For the data analysis, responses to the small and large
center gratings were pooled together.
Recordings
Data were recorded from 12 adult cats. In ten cats, multiunit activity
(MUA) was recorded with multiple varnish-coated tungsten elec-
trodes (1.0–2.0 MU impedance at 1000 Hz) from a region of area 17
corresponding to the central part of the visual field (0�–12� eccentric-
ity). Signals were amplified 10,0003 and band-pass filtered between
300 Hz and 3 kHz. In two cats, MUA was recorded with multiple
SI-based multielectrode probes (16 channels per electrode) supplied
by the Center for Neural Communication Technology at the Univer-
sity of Michigan (Michigan probes). Each probe consisted of four 3
mm long shanks that were separated by 200 mm and contained
four electrode contacts each (1250 mm2 area, 0.3–0.5 MU impedance
at 1000 Hz, intercontact distance 200 mm). In these experiments,
signals were filtered between 500 Hz and 3.5 kHz and between 1
and 100 Hz for extracting MUA and local field potentials, respectively.
The signals were then sent to an analog-to-digital converter and, af-
ter the detection of spikes, stored in computer memory. In some of
the recordings, the waveforms of detected spikes were recorded
for a duration of 1.2 ms, which allowed the later application of offline
spike-sorting techniques. The borders of MUA RFs were mapped
from responses to moving single bars and monitored through a loud-
speaker and an oscilloscope.
The electrodes and probes were positioned such that they would
enter the cortex approximately perpendicular to the surface. By ad-
vancing the tungsten electrodes in steps of about 50 mm, we sampled
responses from all cortical layers. However, no lesions were made to
determine precisely the layers from which the respective recordings
were made.
Michigan probes allowed simultaneous recording from neurons
with overlapping RFs at different cortical depths and along an axis
tangential to the cortical surface, spanning a distance of about

Brightness Induction and Synchronization1081
700 mm in both directions. To investigate modulation of the re-
sponses to the center grating, we recorded simultaneously from
two probes inserted in proximity to each other and repeated such re-
cording sessions by withdrawing the probes and reinserting them at
another position in the same hemisphere. In addition, we made one
single-probe recording by advancing one of the probes deeper in
the cortex (400 mm). This last probe was later combined with another
distantly inserted probe for simultaneous recording of responses to
surround and center. The depths at which the probes were inserted
into the cortex varied between 1 and 1.8 mm. Therefore, as in the
experiments with tungsten electrodes, responses had probably
been sampled from all layers.
As all comparisons of stimulus-related response changes were
confined to recordings obtained from fixed sites, sampling from dif-
ferent layers cannot have mimicked the observed stimulus depen-
dencies. If the described surround effects are restricted to certain
layers, pooling recordings from different layers attenuates the effects
and, hence, is unlikely to generate false positive results. We can also
exclude that some of the multiple recording sites picked up activity
from the same cells because we computed cross-correlation func-
tions between all sites (see below). If such stereo recordings had
happened, the cross-correlograms should have shown the sharp
center peak that is characteristic of auto-correlograms but, due to
the sufficiently large spatial separation of recording sites (minimum
200 mm), this was never the case.
Analysis
Measures of Firing Rates
Peristimulus time histograms (PSTH) and cross-correlation functions
(CCFs) were computed for response epochs of 1.9–3.9 s, excluding
the initial responses to stimulus onset.
To investigate rate modulation dependent on the relative grating
position, i.e., sinusoidal modulation of rate responses, it was neces-
sary to extract single-unit activity (SUA), otherwise the PSTHs are
smoothed due to the varying phase relations in multiunit activity
(DeAngelis et al., 1994). SUAs were isolated by an offline spike-sort-
ing technique in which the spike waveforms were first subjected to
principal component analysis (PCA). A single unit was isolated if, in
the 3D PCA space, we found a distinctive cluster of waveforms that
was clearly segregated from all the remaining waveforms. To mini-
mize contamination with spikes from another unit, we adopted highly
conservative criteria for isolating a single unit, which resulted in a rel-
atively small number of SUAs. In one experiment with 12 levels of
phase offset (0�–330�, 30� steps) and 16 simultaneously recorded
MUAs, we obtained 4 SUAs and another set of 16 units for which
we suspected contamination from other single units. We refer to
the latter ones as postsorting MUA, or pMUA. In another experiment
with four levels of phase offset (0�–180�, 60� steps), we sorted wave-
forms from 11 recording channels and obtained 36 units: NSUA = 16
and NpMUA = 20. For further analysis, the data from these two exper-
iments were pooled, and only the stimulation conditions with over-
lapping parameters were analyzed (i.e., 60� steps in phase offsets).
The average firing rate with which the extracted SUAs responded
to the stimuli ranged from 2.2 to 30.1 spikes/s, with an average of
10.1 spikes/s. To estimate the strength of sinusoidal rate modulation,
a sine function was fitted to a PSTH averaged over 20 presentations
(trials). The fitting required minimizing the errors of the sinusoid’s
amplitude, phase, and vertical offset. The frequency of the sinusoid
was fixed at 1.5 Hz, which was the temporal frequency of the grating
stimulus. To ensure that only sustained responses were fitted, the
sine fits were confined to response epoch starting 1300 ms after
the stimulus onset and lasting 3200 ms. A common measure for
response modulation is the ratio between the fitted amplitude and
the change in the mean firing rate (Skottun et al., 1991). As a simplifi-
cation, we used the fitted amplitudes directly as measures of rate
modulation, which was sufficient for the present purposes. Analysis
of variance (ANOVA) was applied to fitted amplitudes, which were
first normalized for each unit individually (as discussed in the section
titled ‘‘Normalization’’) across four stimulus conditions: 0�, 60�, 120�,
and 180� phase offset. A strongly modulated unit had a rate response
of at least 4 spikes/s in at least one of the four stimulation conditions.
The response modulation of individual units exhibited some
dependence on the phase offset of the surround grating. However,
in none of the single neurons did this modulation match the psycho-
physical function of perceived brightness (Figure 5A in the main text),
nor did we, as reported in the main text and Figure 3B, observe
a match for the averaged response. The same result was obtained
for another set of 11 pMUAs. The fitted response amplitudes of these
units also failed to exhibit a significant dependence on phase offsets
[F(3,40) = 1.61, p = 0.20], the effect size was smaller than that of the
SUAs (d = 0.27), and the trends did not suggest any similarity to the
psychophysical function. In an attempt to improve the test power,
we pooled the SUA and the pMUAs into a single analysis, resulting
in a sample size of n = 18, but the results remained the same
[F(3,68) = 0.99, p = 0.36, d = 0.31]. Also, the outcome of this analysis
did not change when we lowered the threshold for detecting a simple
cell from 4 to 1 spikes/s [n = 11 cells; F(3, 40) = 1.46, p = 0.24; d = 0.70]
or when we analyzed the 11 pMUAs separately [F(3, 40) = 1.61,
p = 0.20; d = 0.26].
Cross-Correlation Analysis
CCFs were computed with a resolution of 1.0 ms and for time shifts of
680 ms. One concern is synchronized covariation of rate responses,
which can boost the size of the center peaks in CCF and which could
be then incorrectly attributed to the changes in precise temporal
synchronicity of neuronal discharges (Brody, 1999). Our detailed
analysis of sinusoidal rate modulation (section titled ‘‘Measures of
Firing Rates’’) indicated that such rate covariation is unlikely to
have affected our results to any significant degree. Only about one-
third of the units showed sinusoidal rate modulation, and the
strength of rate modulation in these units did not depend on the
phase offset. We, nevertheless, investigated further the possibility
that rate covariation contributed to our CCFs by computing the
CCFs across randomly shuffled experimental trials, also known as
shift predictors. Flat shift predictors indicate that the CCFs do not
contain stimulus-locked temporal structures on the timescale inves-
tigated, and in our experiments, all shift predictors were flat (as illus-
trated in Figures 4F and 6D). This is expected because the grating
drifting speed of 1.5 Hz corresponds to a much longer oscillation
period (667 ms) than the timescale of CCFs. Thus, irrespective of
whether we based our analyses on raw CCFs or on the CCFs with
subtracted shift predictors, the analyses yielded the same results.
The strength of neuronal synchronization was quantified from the
height of the center peak (P) relative to the height of the baseline
(B) of the CCF. These values were obtained by fitting a damped
Gabor function to each CCF by the Marquardt-Levenberg algorithm
(for details see Konig, 1994). The strength of synchrony was then
expressed as the modulation amplitude (MA) by using the following
equation: MA = P/(P + B). This procedure also allows one to test
the significance of P, which was tested with a set to 0.05.
Selection of Recording Sites
Tungsten Electrodes. A recording site was included into analysis if it
was sufficiently selective for one of 12 stimulus directions and if it
synchronized its response with at least one other recording site in
at least one direction. From a total sample of 181 recording sites,
96 (53%) were investigated further. This resulted in a total of 124 pairs
for the investigation of surround effects on synchrony. The effects of
orientation contrast on rate responses and synchrony were investi-
gated with repeated-measure ANOVA and linear trends were tested
by appropriate ANOVA contrasts. Effects of phase offsets were
investigated at 123 sites and for 128 pairs. Each recording site
(pair) was tested at zero phase offset (0�) and one condition of phase
offset.For the fourgroupsofdifferentphaseoffsets (0�, 1�–60�, 61�–120�,
and 121�–180�), the numbers of investigated sites were 123, 33, 46,
and 44, and the numbers of pairs were 128, 30, 55, and 43, respec-
tively. Thus, we performed a one-way analysis of variance with
unequal sample sizes across stimulus conditions (i.e., nonorthogo-
nal ANOVA).
Michigan Probes. Each recording site that was responsive and
orientation selective was also synchronized strongly with at least
one other site. Thus, no sites had to be excluded based on the
synchronization criterion. From a total of 128 sites (8 3 16 channels),
68 well-responding and orientation-selective sites were used in the
study. Of those, 54 served for the investigation of the responses to
the center stimulus (23, 19, and 12 sites in the three separate record-
ings) and 13 for the investigation of responses to both the center and
the surround. For correlation analysis, pairs of sites had to be prese-
lected on the basis of the synchronization criterion. A pair was
included into analysis only if the respective recording sites

Neuron1082
synchronized strongly in at least two of the twelve different phase
conditions. This resulted in equal sample sizes for all phase condi-
tions allowing application of repeated-measure ANOVAs. Out of
545 possible pairs for the investigation of the responses to the cen-
ter, 418 passed the synchronization criterion (176, 149, and 57 pairs
for the three separate recordings and 36 for the investigation of the
ring effect). No preselection was made for the investigation of
spike-field coherence.
Normalization
Prior to analyzing average responses for the investigated popula-
tions of neurons, the measures of firing rates and MA were, for
each particular site (pair), normalized relative to the mean value
computed across all the stimulation conditions used in the analysis,
i.e., (response 2 mean)/mean. Therefore, all measures were trans-
formed to the scale centered on zero, positive values indicating
that the measurements were above average and negative values
that the measurements were smaller than average. Normalized
values of firing rates and MA were used in all analyses except for
the spike-field coherence. For the present data set, the overall fir-
ing-rate responses were on average 69.9 spikes/s (sd = 46.6, range
0.2–214 spikes/s) and the MA was on average 0.76 (sd = 0.87, range
0.1–12). All statistical tests were based on two-tailed p values for
rejecting null hypotheses.
Effect Sizes
In order to compare the degree of surround modulation for firing rates
and synchronization, we computed effect sizes. Effect size provides
information that is different from the information provided by statis-
tical significance. Significance indicates the probability that two
populations differ in their means, and this probability depends on
the sample size. In contrast, effect size is independent of the sample
size and indicates the degree to which an independent variable
affects the dependant variable relative to the variability in the popu-
lation. Effect size provides information similar to the Pearson’s corre-
lation coefficient. We used a measure for effect size known as
Cohen’s d (Cohen, 1988). According to Cohen, the effect can be
considered large if d is larger than 0.8 and should be considered
small if d is smaller than 0.2. When applicable, we also corrected
the effect sizes for the correlation between the variables in the re-
peated-measure designs because these dependencies can artifi-
cially boost the effect size. This correction was made by computing
Cohen’s d from the unpaired t test even in the experimental designs
that were based on repeated measures. To compute Cohen’s d from
the t values, we used the following formula if the two groups had the
same sample sizes:
d =2tffiffiffiffiffi
dfp
and in the cases in which two groups had different sample sizes
we used:
d =tðn1 + n2Þffiffiffiffiffi
dfp
ffiffiffiffiffiffiffiffiffiffi
n1n2
p
where n1 and n2 are the sample sizes of each group, df represent the
degrees of freedom, and t is the t value of a Student’s test. Unless
otherwise noted, the effect size was computed for the most extreme
conditions: in the case of orientation difference for 0� and 90� and in
the case of offset for 0� and 180�.
Spike-Field Coherence
In a first step of this analysis we computed the spike-triggered
averages (STA) by using the spikes from one site as triggers for the
averaging of the local field potential (LFP) recorded from another
site (Gray and Singer, 1989). The STAs were computed with the
same parameters as the cross-correlation functions. In order to ob-
tain a measure of spike-field synchronization that was independent
of the power of the LFP, we calculated the spike-field coherence
(SFC). For each of the LFP segments used for the computation of
the STA, the power spectrum was calculated and subsequently
averaged to obtain the spike-triggered power spectrum. The SFC
was then computed as the ratio between the power spectrum of
the STA and the spike-triggered power spectrum of the LFP
segments. For more details on this measure see Fries et al. (1997).
This analysis gave qualitatively identical results irrespective of which
site in a pair was taken as source of spikes and which site served as
the source of the LFP signal.
Acknowledgments
We thank the CNCT for providing multichannel probes and advice on
their application; Jerome Baron for help with visual stimuli; Johanna
Klon-Lipok, Ralf Galuske, and Kerstin E. Schmidt for help and advice
during the experiments; Nan-Hui Chen for help with spike sorting;
and Simon Baudrexel for the help with the psychophysical study.
The study was supported by the Max-Planck Society, D.W.W. was
supported by Hertie-Stiftung, and D.N. was supported by Alexander
von Humboldt-Stiftung and Hertie-Stiftung.
Received: March 24, 2005
Revised: June 28, 2006
Accepted: November 14, 2006
Published: December 20, 2006
References
Abeles, M. (1982). Role of the cortical neuron: integrator or coinci-
dence detector? Isr. J. Med. Sci. 18, 83–92.
Agostini, T., and Galmonte, A. (2002). Perceptual organization over-
comes the effects of local surround in determining simultaneous
lightness contrast. Psychol. Sci. 13, 89–93.
Blakemore, C., and Tobin, E.A. (1972). Lateral inhibition between ori-
entation detectors in the cat’s visual cortex. Exp. Brain Res. 15, 439–
440.
Brody, C.D. (1999). Correlations without synchrony. Neural Comput.
11, 1537–1551.
Cannon, M.W., and Fullenkamp, S.C. (1991). Spatial interactions in
apparent contrast: inhibitory effects among grating patterns of dif-
ferent spatial frequencies, spatial positions and orientations. Vision
Res. 31, 1985–1998.
Cohen, J. (1988). Statistical Power Analysis for the Behavioral Sci-
ences (Hillsdale, NJ: Lawrence Earlbaum Associates).
DeAngelis, G.C., Freeman, R.D., and Ohzawa, I. (1994). Length and
width tuning of neurons in the cat’s primary visual cortex. J. Neuro-
physiol. 71, 347–374.
DeAngelis, G.C., Ghose, G.M., Ohzawa, I., and Freeman, R.D. (1999).
Functional micro-organization of primary visual cortex: receptive
field analysis of nearby neurons. J. Neurosci. 19, 4046–4064.
Ejima, Y., and Takahashi, S. (1985). Apparent contrast of a sinusoidal
grating in the simultaneous presence of peripheral gratings. Vision
Res. 25, 1223–1232.
Engel, A.K., Konig, P., Gray, C.M., and Singer, W. (1990). Stimulus-
dependent neuronal oscillations in cat visual cortex: inter-columnar
interaction as determined by cross-correlation analysis. Eur. J. Neu-
rosci. 2, 588–606.
Engel, A.K., Konig, P., Kreiter, A.K., and Singer, W. (1991). Interhemi-
spheric synchronization of oscillatory neuronal responses in cat
visual cortex. Science 252, 1177–1179.
Fries, P., Roelfsema, P.R., Engel, A.K., Konig, P., and Singer, W.
(1997). Synchronization of oscillatory responses in visual cortex cor-
relates with perception in interocular rivalry. Proc. Natl. Acad. Sci.
USA 94, 12699–12704.
Gail, A., Brinksmeyer, H.J., and Eckhorn, R. (2000). Contour decou-
ples gamma activity across texture representation in monkey striate
cortex. Cereb. Cortex 10, 840–850.
Gilbert, C.D. (1977). Laminar differences in receptive-field properties
of cells in cat primary visual-cortex. J. Physiol. 268, 391–421.
Gray, C.M., and Singer, W. (1989). Stimulus-specific neuronal oscil-
lations in orientation columns of cat visual cortex. Proc. Natl. Acad.
Sci. USA 86, 1698–1702.
Gray, C.M., Konig, P., Engel, A.K., and Singer, W. (1989). Oscillatory
responses in cat visual cortex exhibit inter-columnar synchroniza-
tion which reflects global stimulus properties. Nature 338, 334–337.
Huang, X., MacEvoy, S.P., and Paradiso, M.A. (2002). Perception
of Brightness and Brightness Illusions in the Macaque Monkey.
J. Neurosci. 22, 9618–9625.
Jones, H.E., Grieve, K.L., Wang, W., and Sillito, A.M. (2001).
Surround suppression in primate V1. J. Neurophysiol. 86, 2011–2028.

Brightness Induction and Synchronization1083
Knierim, J.J., and Van Essen, D.C. (1992). Neuronal responses to
static texture patterns in area V1 of the alert macaque monkey.
J. Neurophysiol. 67, 961–980.
Konig, P. (1994). A method for the quantification of synchrony and
oscillatory properties of neuronal activity. J. Neurosci. Methods
54, 31–37.
Konig, P., Engel, A.K., and Singer, W. (1995). Relation between oscil-
latory activity and long-range synchronization in cat visual cortex.
Proc. Natl. Acad. Sci. USA 92, 290–294.
Konig, P., Engel, A.K., and Singer, W. (1996). Integrator or coinci-
dence detector? The role of the cortical neuron revisited. Trends
Neurosci. 19, 130–137.
Nelson, J.I., and Frost, B.J. (1978). Orientation-selective inhibi-
tion from beyond the classic visual receptive field. Brain Res. 139,
359–365.
Niessing, J., Ebisch, B., Schmidt, K.E., Niessing, M., Singer, W., and
Galuske, R.A.W. (2005). Hemodynamic signals correlate tightly with
synchronized gamma oscillations. Science 309, 948–951.
Rossi, A.F., and Paradiso, M.A. (1999). Neural correlates of per-
ceived brightness in the retina, lateral geniculate nucleus, and striate
cortex. J. Neurosci. 19, 6145–6156.
Schillen, T.B., and Konig, P. (1994). Binding by temporal structure in
multiple feature domains of an oscillatory neuronal network. Biol.
Cybern. 70, 397–405.
Schmidt, K.E., Goebel, R., Lowel, S., and Singer, W. (1997). The per-
ceptual grouping criterion of colinearity is reflected by anisotropies
of connections in the primary visual cortex. Eur. J. Neurosci. 9, 1083–
1089.
Sengpiel, F., Sen, A., and Blakemore, C. (1997). Characteristics of
surround inhibition in cat area 17. Exp. Brain Res. 116, 216–228.
Sillito, A.M., and Jones, H.E. (1996). Context-dependent interactions
and visual processing in V1. J. Physiol. (Paris) 90, 205–209.
Singer, W. (1999). Neuronal synchrony: a versatile code for the def-
inition of relations? Neuron 24, 49–65.
Skottun, B.C., De Valois, R.L., Grosof, D.H., Movshon, J.A., Albrecht,
D.G., and Bonds, A.B. (1991). Classifying simple and complex cells
on the basis of response modulation. Vision Res. 31, 1079–1086.
Solomon, J.A., Sperling, G., and Chubb, C. (1993). The lateral inhibi-
tion of perceived contrast is indifferent to on-center/off-center seg-
regation, but specific to orientation. Vision Res. 33, 2671–2683.
Tanaka, K., Ohzawa, I., Ramoa, A.S., and Freeman, R.D. (1987).
Receptive field properties of cells in area 19 of the cat. Exp. Brain
Res. 65, 549–558.
Traub, R.D., Kopell, N., Bibbig, A., Buhl, E.H., LeBeau, F.E., and
Whittington, M.A. (2001). Gap junctions between interneuron den-
drites can enhance synchrony of gamma oscillations in distributed
networks. J. Neurosci. 21, 9478–9486.
Usrey, W.M., Reppas, J.B., and Reid, R.C. (1998). Paired-spike inter-
actions and synaptic efficacy of retinal inputs to the thalamus.
Nature 395, 384–387.
von der Heydt, R., Peterhans, E., and Baumgartner, G. (1984). Illusory
contours and cortical neuron responses. Science 224, 1260–1262.
Walker, G.A., Ohzawa, I., and Freeman, R.D. (2000). Suppression
outside the classical cortical receptive field. Vis. Neurosci. 17,
369–379.
Williams, A.L., Singh, K.D., and Smith, A.T. (2003). Surround modu-
lation measured with functional MRI in the human visual cortex.
J. Neurophysiol. 89, 525–533.
Xu, W.F., Shen, Z.M., and Li, C.Y. (2005). Spatial phase sensitivity of
V1 neurons in alert monkey. Cereb. Cortex 15, 1697–1702.
Yu, C., Klein, S.A., and Levi, D.M. (2001). Surround modulation of
perceived contrast and the role of brightness induction. J. Vis. 1,
18–31.