Mineralogical structure of the subsurface of Syrtis Major from OMEGA observations of lobate ejecta...
30
Mineralogical structure of the subsurface of Syrtis Major from OMEGA observations of lobate ejecta blankets D. Baratoux, 1 P. Pinet, 1 A. Gendrin, 2 L. Kanner, 2 J. Mustard, 2 Y. Daydou, 1 J. Vaucher, 1 and J.-P. Bibring 3 Received 8 January 2007; revised 20 June 2007; accepted 18 July 2007; published 31 August 2007. [1] This paper focuses on the spectral characteristics of lobate ejecta across Syrtis Major volcano, a dark region of Mars presenting a mafic composition as revealed from the Observatoire pour la Mine ´ralogie, l’Eau, les Glaces et l’Activite ´ (OMEGA) instrument. Two spectrally distinct crater types are identified. Type I is enriched in high-calcium pyroxene (HCP) relative to the volcanic rocks. Type II is similar to the lava flow mineralogy driven by HCP, compared to the Noachian crust dominated by low-calcium pyroxene (LCP). Type I craters are systematically younger than type II. The type II mineralogy has been likely affected by a long-term weathering in a cold environment for the last 2 Ga. The axisymmetric spectral signatures of type I ejecta appear dominated by rock-forming minerals rather than by soils and reflect the composition of excavated materials offering a window for exploring the subsurface. A progressive change in the slope of the spectra around 1.5–2 mm is observed across the ejecta layers, pointing at a change in the HCP/LCP ratio. The deconvolution of the spectra by the Modified Gaussian Model unravels a maximum of HCP/LCP band strength ratio located between 1.2 and 3 crater radii for all type I craters. Using Z-modeling, this observation translates into a maximum in the HCP/LCP abundances at a few hundreds of meters depth and suggests a homogeneous subsurface structure of the volcanic edifice. Below this horizon the HCP/LCP decrease may reveal a more ancient lava composition or the signature of the underlying Noachian crust. Citation: Baratoux, D., P. Pinet, A. Gendrin, L. Kanner, J. Mustard, Y. Daydou, J. Vaucher, and J.-P. Bibring (2007), Mineralogical structure of the subsurface of Syrtis Major from OMEGA observations of lobate ejecta blankets, J. Geophys. Res., 112, E08S05, doi:10.1029/2007JE002890. 1. Introduction [2] The knowledge of the subsurface of Mars at all scales has been essential in the scientific goals of the instruments sent to this planet in the last few years. Investigations in this direction will probably develop even more as the structure, the mineral composition and the water content of the subsurface are key parameters for the future of Mars exploration. At a geographic resolution of hundreds of kilometers, the MOLA (Mars Orbiter Laser Altimeter) instrument onboard Mars Global Surveyor has established the variations of the crustal thickness and investigated the variations with time of the thickness of the elastic litho- sphere through the measurement of the gravitational field and of the topography [Zuber et al., 2000; Neumann et al., 2004]. At a similar lateral resolution, the Mars Odyssey Mission and its Gamma Ray Spectrometer (GRS) have investigated the abundance of hydrogen in the first meter upper layer. More recently, at a few kilometers scale, the ongoing MARSIS radar experiment has released the first observations of reflectors beneath the south layered polar deposit [Plaut et al., 2006] and of reflectors corresponding to a large buried basin in the northern hemisphere [Watters et al., 2006]. In addition to these indirect views of the Martian subsurface, impact craters are natural probes of the Mars subsurface at all scale, everywhere on the planet, and throughout all the geologic history. Impact cratering is the most efficient process exposing deep-seated material on a planet in the absence of plate tectonics. Their morphologies have been used for the last three decades to discuss the subsurface material properties and the distribution of sub- surface ice, water or brines [e.g., Barlow and Bradley , 1990; Baratoux et al., 2002; Barlow and Perez, 2003]. [3] Syrtis Major has been selected as one of the best regions of Mars to achieve a regional investigation of the subsurface mineralogy from impact craters using the OMEGA data (Observatoire pour la Mine ´ralogie l’Eau, les Glaces, JOURNAL OF GEOPHYSICAL RESEARCH, VOL. 112, E08S05, doi:10.1029/2007JE002890, 2007 Click Here for Full Articl e 1 Observatoire Midi-Pyre ´ne ´es, UMR 5562 CNRS, Laboratoire Dynami- que Terrestre et Plane ´taire, Universite ´ Paul Sabatier Toulouse III, Toulouse, France. 2 Department of Geological Sciences, Brown University, Providence, Rhode Island, USA. 3 Institut d’Astrophysique Spatiale, UMR 8617, Orsay, France. Copyright 2007 by the American Geophysical Union. 0148-0227/07/2007JE002890$09.00 E08S05 1 of 30
-
Upload
univ-toulouse -
Category
Documents
-
view
2 -
download
0
Transcript of Mineralogical structure of the subsurface of Syrtis Major from OMEGA observations of lobate ejecta...

Mineralogical structure of the subsurface of Syrtis
Major from OMEGA observations of lobate ejecta
blankets
D. Baratoux,1 P. Pinet,1 A. Gendrin,2 L. Kanner,2 J. Mustard,2 Y. Daydou,1 J. Vaucher,1
and J.-P. Bibring3
Received 8 January 2007; revised 20 June 2007; accepted 18 July 2007; published 31 August 2007.
[1] This paper focuses on the spectral characteristics of lobate ejecta across Syrtis Majorvolcano, a dark region of Mars presenting a mafic composition as revealed from theObservatoire pour la Mineralogie, l’Eau, les Glaces et l’Activite (OMEGA) instrument.Two spectrally distinct crater types are identified. Type I is enriched in high-calciumpyroxene (HCP) relative to the volcanic rocks. Type II is similar to the lava flowmineralogy driven by HCP, compared to the Noachian crust dominated by low-calciumpyroxene (LCP). Type I craters are systematically younger than type II. The type IImineralogy has been likely affected by a long-term weathering in a cold environment forthe last 2 Ga. The axisymmetric spectral signatures of type I ejecta appear dominated byrock-forming minerals rather than by soils and reflect the composition of excavatedmaterials offering a window for exploring the subsurface. A progressive change in theslope of the spectra around 1.5–2 mm is observed across the ejecta layers, pointing at achange in the HCP/LCP ratio. The deconvolution of the spectra by the Modified GaussianModel unravels a maximum of HCP/LCP band strength ratio located between 1.2 and3 crater radii for all type I craters. Using Z-modeling, this observation translates into amaximum in the HCP/LCP abundances at a few hundreds of meters depth andsuggests a homogeneous subsurface structure of the volcanic edifice. Below thishorizon the HCP/LCP decrease may reveal a more ancient lava composition or thesignature of the underlying Noachian crust.
Citation: Baratoux, D., P. Pinet, A. Gendrin, L. Kanner, J. Mustard, Y. Daydou, J. Vaucher, and J.-P. Bibring (2007), Mineralogical
structure of the subsurface of Syrtis Major from OMEGA observations of lobate ejecta blankets, J. Geophys. Res., 112, E08S05,
doi:10.1029/2007JE002890.
1. Introduction
[2] The knowledge of the subsurface of Mars at all scaleshas been essential in the scientific goals of the instrumentssent to this planet in the last few years. Investigations in thisdirection will probably develop even more as the structure,the mineral composition and the water content of thesubsurface are key parameters for the future of Marsexploration. At a geographic resolution of hundreds ofkilometers, the MOLA (Mars Orbiter Laser Altimeter)instrument onboard Mars Global Surveyor has establishedthe variations of the crustal thickness and investigated thevariations with time of the thickness of the elastic litho-sphere through the measurement of the gravitational field
and of the topography [Zuber et al., 2000; Neumann et al.,2004]. At a similar lateral resolution, the Mars OdysseyMission and its Gamma Ray Spectrometer (GRS) haveinvestigated the abundance of hydrogen in the first meterupper layer. More recently, at a few kilometers scale, theongoing MARSIS radar experiment has released the firstobservations of reflectors beneath the south layered polardeposit [Plaut et al., 2006] and of reflectors correspondingto a large buried basin in the northern hemisphere [Watterset al., 2006]. In addition to these indirect views of theMartian subsurface, impact craters are natural probes of theMars subsurface at all scale, everywhere on the planet, andthroughout all the geologic history. Impact cratering is themost efficient process exposing deep-seated material on aplanet in the absence of plate tectonics. Their morphologieshave been used for the last three decades to discuss thesubsurface material properties and the distribution of sub-surface ice, water or brines [e.g., Barlow and Bradley, 1990;Baratoux et al., 2002; Barlow and Perez, 2003].[3] Syrtis Major has been selected as one of the best
regions of Mars to achieve a regional investigation of thesubsurface mineralogy from impact craters using the OMEGAdata (Observatoire pour la Mineralogie l’Eau, les Glaces,
JOURNAL OF GEOPHYSICAL RESEARCH, VOL. 112, E08S05, doi:10.1029/2007JE002890, 2007ClickHere
for
FullArticle
1Observatoire Midi-Pyrenees, UMR 5562 CNRS, Laboratoire Dynami-que Terrestre et Planetaire, Universite Paul Sabatier Toulouse III, Toulouse,France.
2Department of Geological Sciences, Brown University, Providence,Rhode Island, USA.
3Institut d’Astrophysique Spatiale, UMR 8617, Orsay, France.
Copyright 2007 by the American Geophysical Union.0148-0227/07/2007JE002890$09.00
E08S05 1 of 30
et l’Activite, on board of the Mars Express spacecraft).Syrtis Major consists in a large shield volcano formed in theHesperian epoch [Hiesinger and Head, 2004]. Its surfacemorphology is dominated by lava flows intersected bycompressive ridges. Eastern and western parts of Syrtishave slightly different crater densities, respectively 133 ±5.7 and 158 ± 6.3 craters larger than 5 km per 106 km, bothcrater densities corresponding to Hesperian ages [Hiesingerand Head, 2004]. The volcanic center consists of twocalderas named Nili and Meroe. This region is characterizedby an albedo among the darkest on Mars and by thepresence of mafic materials identified from orbital [Mustardet al., 1993] and terrestrial spectral observations [Pinet andChevrel, 1990; Bell et al., 1997].[4] The Syrtis Major plateau belongs to the surface type 1
(ST1) as defined from the Thermal Emission Spectrometerobservations. This surface type is basaltic in composition[Bandfield et al., 2000]. The deconvolution of TES spectrausing a set of 36 end-members has lead to the identificationof several species: plagioclase (10–20%), high-calciumpyroxene (10–15%), isolated detections of olivine, andabout 10% of sheet-silicates or high-Si glass [Bandfield,2002]. This region is characterized by low values for thedust cover. More recently, OMEGA data has also observedat a higher resolution the strong spectral signature charac-teristic of mafic minerals (pyroxene, accompanied bydetectable amount of olivine) [e.g., Mustard et al., 2005;Bibring et al., 2005; Pinet et al., 2006b; Poulet et al., 2007].Impact craters on Syrtis Major have excavated through thevolcanic layers and their ejecta contain subsurface material.This paper is motivated by these exposures of subsurfacematerial which could potentially reveal for the first time themineralogical composition at a depth down to a fewhundreds of meters of a martian volcanic construct. Recentterrestrial remote sensing studies in the infrared domainhave demonstrated the connection between the spectralsignature of fresh ejecta morphologies with the spectralsignature of the subsurface material [Ramsey, 2002]. Usingthe THEMIS spectral bands in the thermal infrared domain,the subsurface origin of the spectral signatures of ejecta onMars has been searched [Tornabene et al., 2006]. A similarattempt is proposed on Syrtis Major craters using theOMEGA data in the visible and near-infrared domain from0.7 mm to 2.6 mm. The high spatial resolution of OMEGA(up to 300 meters/pixel) combined with its the spectralresolution gives access to a detailed study of the ejectalayers and to the interpretation of their spectral variations interms of relative pyroxene proportions, using the ModifiedGaussian Model for the spectral deconvolution [Sunshine etal., 1990; Sunshine and Pieters, 1993]. However, spectralsignatures of the ejecta unit do not necessarily represent thecomposition of subsurface material as ejecta can be coveredby dust, transported, eroded, degraded and the initial min-eralogy can be weathered with time. Consequently, the firstpart of the paper focuses on these aspects with the objectiveof characterizing and selecting which craters are pristineenough to be used as natural probes of the subsurfacecomposition. Then, the variations of the spectral featureswithin the ejecta layers are investigated. The differentpotential contributions to these variations are evaluated. Inthe last part, a first-order geometrical and kinematical modelof the excavation flow inside a layered target is developed
in association with the ballistic emplacement trajectories.This direct approach is aimed at proposing the first-ordercharacteristics of the subsurface mineralogy explaining atbest the variations in composition observed within the ejectaunits.
2. Distinct Mineralogic Signature of EjectaBlankets on Syrtis Major
2.1. Mineralogic Map of Syrtis Major: Two SpectrallyDistinct Types of Ejecta
[5] The details and discussion about the derivation ofpyroxene maps from OMEGA data are given by Gendrin etal. [2006] and the main aspects are recalled here. TheModified Gaussian Model [Sunshine et al., 1990] is usedto separate the high-calcium pyroxene (HCP) and the low-calcium pyroxene (LCP) contributions in the 1.0 to 2.5 mmdomain using the SWIR wavelength range. This wavelengthrange is sensitive to the pyroxene features and influenced byhydrated minerals and olivine. The positions and widths ofthe pyroxene bands were fixed in order to process all theOMEGA data set in a reasonable amount of time. Thecontinuum is defined as done by Hiroi et al. [2000]:
Continuum ¼ a * lþ bþ c
lð1Þ
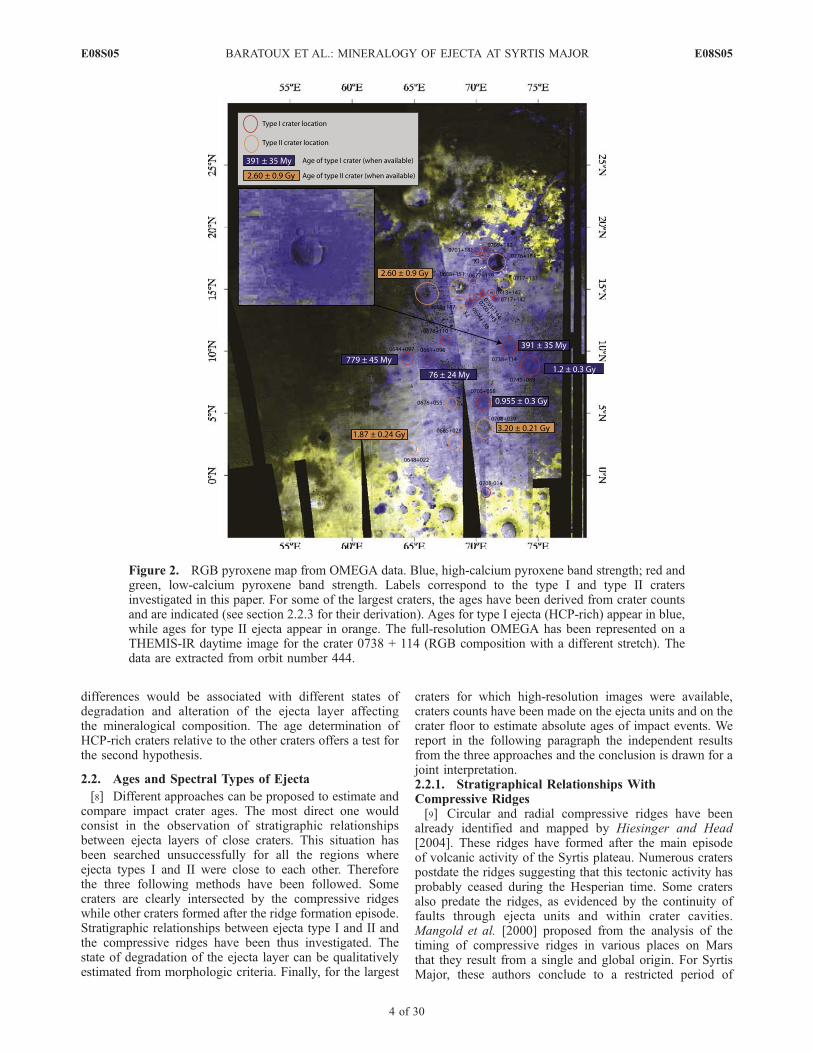
[6] As presented in the work of Mustard et al. [2005] andGendrin et al. [2006], LCP is prevalent in the Noachiancrust surrounding the volcanic edifice while the Hesperianvolcanic lava flows of Syrtis are enriched in HCP (Figures 1and 2). Two spectrally distinct types of ejecta are recog-nized. The division into two spectral classes here is done forthe purpose of this paper, from the spectral signature andwithout interfering with the efforts to standardize thenomenclature of impact crater ejecta morphologies [Barlowet al., 2000]. According to the standard nomenclature mostof these ejecta morphologies correspond to Single LayerEjecta or SLE. Some impact ejecta show a stronger HCPabsorption band suggesting an enrichment in HCP relativeto the volcanic lavas and are called here the HCP-rich ejectaor ejecta type I. However, some ejecta located within thevolcanic region are not spectrally distinguishable from thelavas. These objects will be referred to the following asthe ejecta type II. The geographic coordinates of the objectsinvestigated in this paper are given in Table 1. The tableincludes a measurement of standard morphometric param-eters, such as rim and cavity elevations from which thecavity depths are deduced.[7] Table 5 contains the ratio of LCP/(HCP + LCP) for all
the investigated craters. This ratio has been estimated for theejecta layer, and the minimum, maximum, average andstandard deviations are given. One can argue that thedifference in the depth of the absorption at 2.3 mm attributedto the HCP might be induced by a difference between thegrain sizes distribution for ejecta and for the lava flowsurfaces. However, assuming that ejecta have similar grainsizes distribution, the fact that some ejecta do not displaythis enrichment is an evidence against a dominant grain sizeeffect in the variations in the LCP/(LCP + HCP) banddepths parameter. Moreover, the band strength ratio ismostly independent of grain size as defined by Sunshine
E08S05 BARATOUX ET AL.: MINERALOGY OF EJECTA AT SYRTIS MAJOR
2 of 30
E08S05

and Pieters [1993]. Following Kanner et al. [2006], wefound LCP/(HCP + LCP) ratios ranging from 0.4 to 0.5within the lavas, a value only slightly higher than the valuesin type II craters, but twice higher than the average values intype I craters. In some ejecta layers, the ratio can be even aslow as 0.06 suggesting that the high-calcium pyroxene end-member may represent up to 90% in the mixture [Kanner etal., 2006]. Then, the most probable interpretation is that thedeep HCP band strength within the ejecta is associated witha change in the LCP/HCP ratio of weight abundances. TheHCP-rich ejecta are distributed all over the volcanic edificeand do not display any ubiquitous clustering. A quantitativeinvestigation of HCP-rich ejecta distribution is presented inthe following sections. Ejecta types I and II are distributed
in an apparent random manner relative to each other. Onecan find examples of pairs of close craters with similardiameters having a similar continuous ejecta blanket anddisplaying a different mineralogical signature. In suchexamples, the first crater is distinguishable from the lavabackground by a particular HCP-enrichment while thesecond one is not (e.g., craters 0705 + 058 and 0708 +039, or craters 0694 + 138 and X2). Two alternativehypotheses could explain this observation: (1) the ejectasignature represents the signature of subsurface excavatedmaterial and these mineralogical differences represent lat-eral changes in the mineralogical composition at depth, or(2) the spectral differences result from post-impact modifi-cation processes of the ejecta layer. If so, the spectral
Figure 1. Shaded relief map of Syrtis Major from MOLA data with reference names for the type I(HCP-rich) and type II craters investigated in this paper.
E08S05 BARATOUX ET AL.: MINERALOGY OF EJECTA AT SYRTIS MAJOR
3 of 30
E08S05
differences would be associated with different states ofdegradation and alteration of the ejecta layer affectingthe mineralogical composition. The age determination ofHCP-rich craters relative to the other craters offers a test forthe second hypothesis.
2.2. Ages and Spectral Types of Ejecta
[8] Different approaches can be proposed to estimate andcompare impact crater ages. The most direct one wouldconsist in the observation of stratigraphic relationshipsbetween ejecta layers of close craters. This situation hasbeen searched unsuccessfully for all the regions whereejecta types I and II were close to each other. Thereforethe three following methods have been followed. Somecraters are clearly intersected by the compressive ridgeswhile other craters formed after the ridge formation episode.Stratigraphic relationships between ejecta type I and II andthe compressive ridges have been thus investigated. Thestate of degradation of the ejecta layer can be qualitativelyestimated from morphologic criteria. Finally, for the largest
craters for which high-resolution images were available,craters counts have been made on the ejecta units and on thecrater floor to estimate absolute ages of impact events. Wereport in the following paragraph the independent resultsfrom the three approaches and the conclusion is drawn for ajoint interpretation.2.2.1. Stratigraphical Relationships WithCompressive Ridges[9] Circular and radial compressive ridges have been
already identified and mapped by Hiesinger and Head[2004]. These ridges have formed after the main episodeof volcanic activity of the Syrtis plateau. Numerous craterspostdate the ridges suggesting that this tectonic activity hasprobably ceased during the Hesperian time. Some cratersalso predate the ridges, as evidenced by the continuity offaults through ejecta units and within crater cavities.Mangold et al. [2000] proposed from the analysis of thetiming of compressive ridges in various places on Marsthat they result from a single and global origin. For SyrtisMajor, these authors conclude to a restricted period of
Figure 2. RGB pyroxene map from OMEGA data. Blue, high-calcium pyroxene band strength; red andgreen, low-calcium pyroxene band strength. Labels correspond to the type I and type II cratersinvestigated in this paper. For some of the largest craters, the ages have been derived from crater countsand are indicated (see section 2.2.3 for their derivation). Ages for type I ejecta (HCP-rich) appear in blue,while ages for type II ejecta appear in orange. The full-resolution OMEGA has been represented on aTHEMIS-IR daytime image for the crater 0738 + 114 (RGB composition with a different stretch). Thedata are extracted from orbit number 444.
E08S05 BARATOUX ET AL.: MINERALOGY OF EJECTA AT SYRTIS MAJOR
4 of 30
E08S05
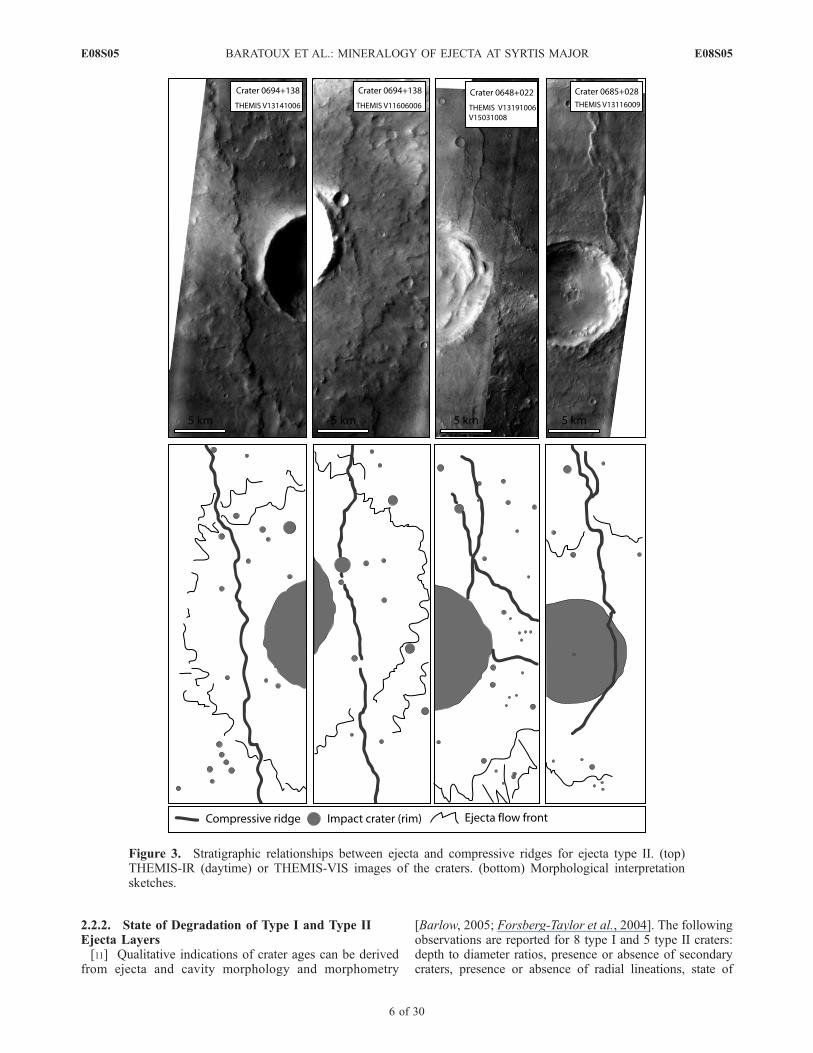
tectonic activity occurring within the late Hesperian epoch.The relationships of these ridges with ejecta of type I andII are presented here. Three type II craters (X2, 0648 +022 and 0685 + 028) have been analyzed in details.THEMIS-VIS images of the craters and the morphologicinterpretation are shown in the Figure 3. For the craterAH, the observation of a compressive ridge inside thecrater cavity is a clear evidence for the ridge being formedafter the impact. Unfortunately, the trajectory of theridge does not intersect the cavity for the craters X2 and0648 + 022. However, the intersection of the ridge withthe ejecta flow front offers also strong evidences forstratigraphic relationships. The ejecta flow front and itsdistal ridge are continuous and no topographical offset isobserved at the location where the compressive ridgetrajectory intersects the ejecta layer. The observation ofthe tectonic ridge within the ejecta layer is an argument forthe proposed time sequence, with the ridges postdating thetype II craters. Alternatively, the ejecta layer could be toothin to mask totally the underlying topography of the ridgeand would only smooth it. However, the sharpness of thetopography at the ridge is not apparently different outsideand within the ejecta unit, suggesting no particularsmoothing. No evidence has been found of type II ejectapostdating the tectonic episode.[10] Stratigraphic relationships for HCP-rich or type I
ejecta can be investigated in three situations for which thetrajectories of compressive ridges intersect the ejecta layers(Figure 4). The ejecta of the crater 0705 + 058 can bemapped from a THEMIS-IR daytime image as far as 50 kmfrom the crater center corresponding to about 5 crater radii.At the extreme north of the ejecta layer, the material has
clearly flown over a compressive ridge formed along aneast-west orientation. The tectonic ridge is overprinted bythe ejecta deposit. The trajectories of three ridges intersectthe crater 0717 + 142. These ridges cannot be tracedwithin the ejecta unit or in the cavity; the crater clearlypostdates the formation of these three ridges. The situationfor the crater 0738 + 114 is slightly more difficult toanalyze. A THEMIS-IR image, 100 m/pixel in resolution,is used in addition to one THEMIS-VIS image coveringonly the southern edge for this crater. The compressiveridge is seen within the lobe but, given the thickness of theflow at this distance of the center of the crater, thisobservation cannot be taken as a strong point. However,the bulge at the lobe front is clearly continuous over thetectonic ridge and not affected or offset by the ridge.Conversely, the ridge is interrupted at the intersection withthe flow front. A fourth more ambiguous case is reported atthe crater 0661 + 096 for which the trajectory of the ridgeintersects the ejecta unit. The THEMIS-IR daytime imageI01171005 does not have a sufficient resolution to definethe chronological sequence. The ridge is observed withinthe ejecta unit, but the flow appears to have been affected byits presence resulting in a thickening of the deposit at thefoot of the ridge on the downstream side of the flow. Allthese observations strongly suggest that type II craters havebeen formed before the tectonic episode, while HCP-rich ortype I craters have been formed after it. All craters cannot bedated relatively to the tectonic episode by this approach butthe stratigraphic relationships for these samples suggest thattype I ejecta are systematically younger than type II. Thisworking hypothesis will be investigated further in the nextsection examining the surface state of degradation of ejecta.
Table 1. Geographic Coordinates of Investigated Craters With Their Spectral Type According to Their HCP Band Depth Relative to the
Syrtis Plateaua
Crater ID Latitude Longitude (East) Diameter, km Type Min. Elevation, m Rim Elevation, m Cavity Depth, m
0708-014 �1.41 70.86 13.22 I 889 2339 14500705+058 5.89 70.55 23.00 I 461 1973 15120743+089 8.91 74.34 23.67 I �508 1350 18580661+096 9.61 66.74 17.78 I 1158 2620 14620644+097 10.32 64.14 12.61 I 1030 2254 12240676+110 11.08 67.65 13.96 I 1263 2388 11250738+114 11.47 73.04 17.66 I 88 1467 13790694+138 13.9 69.46 10.67 I 462 1418 9560717+142 14.24 71.73 6.92 I 295 1063 7680700+143 14.37 70.05 12.07 I 302 1261 9590703+144 14.45 70.34 7.17 I 725 1103 3780713+147 14.71 71.42 6.54 I 291 1044 7530677+159 16.16 69.41 6.14 I 338 1035 697X1 17.73 70.54 3.69 I �256 603 8590701+181 18.17 70.10 6.31 I 94 748 6540709+182 18.23 70.90 6.92 I �256 622 8780648+022 2.29 64.82 21.63 II 883 2361 14780685+028 2.8 68.60 14.86 II 901 2143 12420708+039 3.95 70.88 45.69 II 169 2199 20300676+055 6.61 68.20 15.79 II 857 2132 12750717+133 13.37 71.45 47.15 II 122 1157 1035X2 13.6 69.00 11.77 II 532 1685 11530660+147 14.78 66.10 32.66 II �264 1626 18900688+151 15.2 68.87 48.91 II �946 1820 27660776+184 18.44 71.98 43.26 II �1341 1104 2445
aThe minimum elevation of the cavity, the maximum elevation of the rim, and the difference between these two values (cavity depth) have been measuredfor all the craters from MOLA data. The diameter corresponds to the rim-to-rim diameter. The top part of the table corresponds to the type I craters, and thebottom part corresponds to the type II craters. Inside each class, the craters are sorted by increasing values of latitudes.
E08S05 BARATOUX ET AL.: MINERALOGY OF EJECTA AT SYRTIS MAJOR
5 of 30
E08S05
2.2.2. State of Degradation of Type I and Type IIEjecta Layers[11] Qualitative indications of crater ages can be derived
from ejecta and cavity morphology and morphometry
[Barlow, 2005; Forsberg-Taylor et al., 2004]. The followingobservations are reported for 8 type I and 5 type II craters:depth to diameter ratios, presence or absence of secondarycraters, presence or absence of radial lineations, state of
Figure 3. Stratigraphic relationships between ejecta and compressive ridges for ejecta type II. (top)THEMIS-IR (daytime) or THEMIS-VIS images of the craters. (bottom) Morphological interpretationsketches.
E08S05 BARATOUX ET AL.: MINERALOGY OF EJECTA AT SYRTIS MAJOR
6 of 30
E08S05

degradation from ejecta surface texture at the THEMIS-VISscale and presence or absence of a distinct thermal edge asdefined by Baratoux et al. [2005]. These observations andthe reference of each crater are reported in Tables 2 and 3.2.2.2.1. Morphometric Characteristics[12] Depths and crater diameters are affected by erosion
(crater infilling, mass wasting on the rim slope, etc.).Comparison of crater depths as a function of the craterdiameters could help in the discrimination of fresh mor-phologies from morphologies affected by erosion associatedwith older ages. Crater depths and diameters have beenmeasured from MOLA data for all the type I and type II
craters (Figure 5). Crater depths are scattered around butmostly below the standard average law for Martian freshcraters [Garvin et al., 2003] suggesting erosional modifica-tions. However, material properties can also explain thedeviation from the average martian law [Boyce et al., 2006].The important point is that ejecta type I and II are notdistinguishable from their morphometric characteristicswhich consequently cannot be used to trace the erosionalhistory of the lobate ejecta of Syrtis Major.2.2.2.2. Secondary Craters and Radial Lineations[13] Secondary craters are features formed at the time of
impact by fragment of ejecta and are easily erodible. Their
Figure 4. Stratigraphic relationships between ejecta and compressive ridges for ejecta type I (HCP-rich).(top) THEMIS-IR (daytime) or THEMIS-VIS images of the craters. (bottom) Morphological interpretationsketches.
E08S05 BARATOUX ET AL.: MINERALOGY OF EJECTA AT SYRTIS MAJOR
7 of 30
E08S05

presence suggests a young age for the primary crater.Radial chains or clusters of secondary craters have beenunambiguously identified for two craters of the HCP-richclass (0743 + 089 and 0644 + 097). Secondaries are ubiquitousfor the crater 0743 + 089 on THEMIS-IR daytime imagesI0932206 and I03143002 as shown in Figure 6 and they canalso be noticed on nighttime images. Radial lineations arereported only for one crater which belongs to the HCP-richclass. The mechanism of formation of radial lineations is notknown but it may develop during the radial surface flow ofejecta falling onto the crater rim producing scour marks[Mouginis-Mark and Boyce, 2004], or by impact-generatedwinds scouring the previously deposited ejecta layer [Suzukiet al., 2007]. These lineations are topographically small(few meters in height at maximum) and easily erodible.Their observation at the crater 0708–014 (Figure 7) inaddition to the secondaries suggests a relatively youngerage for the HCP-rich ejecta (Figure 7).2.2.2.3. Surface State and Degradation of the EjectaLayers[14] The typical morphologies of ejecta observed at Syrtis
suggest that all ejecta units have been preserved for erosionand it seems challenging to make a clear distinction betweenthe ejecta morphologies. However, we tried to distinguishbetween fresh and degraded surface state from the compar-ison of visible images at the same scale. The ejecta is said‘‘fresh’’ when the surface is homogeneous, smooth andwhen some features associated with the flow remains visible(concentric or radial textures). The ejecta is said ‘‘degraded’’or ‘‘dissected’’ when the surface is rougher and displaysevidence of erosion (e.g., presence of eroded small cratersformed on the ejecta unit). Typical examples of surfacestates are given in Figure 8. The terms ‘‘degraded’’ and‘‘dissected’’ correspond to a gradually rougher and lesshomogeneous surface (see Figure 8, right). Using imagesat similar resolution, we report that the surface texture is
generally fresher for ejecta type I while ejecta type IIdisplay in most cases a more or less dissected or degradedsurface texture. However, the ejecta layer and the flow frontare always clearly identified for all analyzed type II ejecta. Itis thus important to emphasize here that a similar but notextensive erosion has affected both type I and type IIcraters. This observation is consistent with the scatter ofcavity depths around the standard Martian law. The contin-uous ejecta layer is present for both types of craters (at theexception of the 717 + 133 crater). Thus the absence of theHCP enrichment relative to the Syrtis lava does notcorrespond to a removal of the ejecta material. However,a slightly more advanced state of surface degradationsuggests again an older age for the type II craters.2.2.2.4. Thermal Properties[15] The flow front of ejecta of a large majority of lobate
craters at Syrtis Major shows a thermal anomaly at night[Baratoux et al., 2005]. The presence or absence of thisthermal feature has been searched for the craters consideredhere. In some cases, the thermal anomaly outlines the flowfront continuously following all the ejecta perimeter and issaid complete. For other cases, the thermal anomaly can beonly observed over a segment of the ejecta flow front and issaid partial or sparse for the less developed cases. Thewarmer temperature at the flow front at night could resultfrom grain sorting during the surface flow [Baratoux et al.,2005]. This hypothesis has been recently recalled fromhigh-resolution images showing boulders at the edge ofejecta which could also correspond to remnants of massivematerial composing the edge of ejecta unit [Mouginis-Markand Baloga, 2006]. This thermal feature is not clearlyassociated with one of the observed spectral types of ejecta(Tables 2 and 3). Whatever its exact origin, the observationof the warmer ejecta front appears thus not to be diagnosticof the age of the craters at Syrtis Major.
Table 2. Synthesis of Morphological and Surface State Observations for HCP-Rich or Type I Cratersa
Crater ID Secondary Craters Radial Lineations Surface Texture Thermal Anomaly at the Front
0708-014 no yes fresh complete0705+058 no no fresh partial0743+089 yes yes fresh complete0661+096 yes no fresh partial0644+097 no no fresh partial0676+110 no no degraded complete0738+114 no no fresh complete0694+138 no no fresh complete
aCraters are sorted by increasing latitudes.
Table 3. Synthesis of Morphological and Surface State Observations for Type II Cratersa
Crater ID Secondary Craters Radial Lineations Surface Texture Thermal Anomaly at the Front
X2 no no degraded complete0660+147 ambiguous no dissected complete0776+184 few large ones ambiguous strongly dissected absent0676+055 no no degraded complete0685+028 no no dissected sparse708+039 no no dissected sparse0648+022 no no fresh partial
aCraters are sorted by increasing latitudes.
E08S05 BARATOUX ET AL.: MINERALOGY OF EJECTA AT SYRTIS MAJOR
8 of 30
E08S05

[16] Tables 2 and 3 synthesize the observations for ejectatype I and type II respectively. Some observations indicatethat some HCP-rich ejecta correspond to youngest impactevents. Other observations suggest that type I craters cannotbe distinguished from type II craters on the basis of theirerosional state. Indeed, the depth to diameter ratio and thepresence of the continuous ejecta layer for all these craterssuggest that minor amount of erosion has affected bothtypes of craters. To conclude, one can state that the youngestcraters are all among the HCP-rich class. However, a limitederosion has affected the crater cavities and the ejecta layers.Consequently, the erosional history cannot be used withconfidence to compare crater ages. Instead, absolute datingwhen possible will provide in the next section a better andconclusive basis for age comparison.2.2.3. Crater Counts: Absolute Dating of Type Iand Type II Craters[17] Absolute dating of impact craters is challenging
because the area of the cavity and ejecta units of one impactcrater is small in comparison with the area of geologic unitswhich are usually dated by this method. The unit associatedwith the impact crater has been divided in two zones,respectively the continuous ejecta blanket and the craterfloor which have been counted separately for all the datedcraters. The inner and outer walls of the rim are subject tosevere modification (mass wasting, erosion) and have beensystematically discarded. The objective is to date the impactevent itself and not any subsequent episode of erosion orcrater infilling. Both zones offer advantages and disadvan-tages for this purpose. The crater floor is identified without
any ambiguity but has an area smaller than the continuousejecta blanket and will induce lower accuracy of the counts.Moreover, the crater floor is easily filled by wind-transportedsediments. Mass wasting from the rim inside the crater floorafter the crater formation can also partially affect the floorsurface. The continuous ejecta blanket has a larger area thanthe crater floor but its limits are less easy to define inparticular for the thinnest part where underlying craterssmoothed by the ejecta deposit could be accidentally addedto the counts. The continuous ejecta blanket could be alsoaffected by secondary craters. However, secondaries formballistically and thus likely before the emplacement of thecontinuous ejecta unit. Secondaries are indeed mostlyobserved outside the continuous ejecta unit. Finally, wereport that crater counts on the crater floor translate sys-tematically into very young ages compared to the resultsfrom crater counts on the continuous ejecta blanket andare not considered here because we believe they onlyrepresent the last episodes of cavity infilling. Crater countshave been made essentially from THEMIS-VIS images andMOC images and 6 examples are shown in Figure 9. All thederived ages are presented in Figure 10 and reported on thepyroxene map (see Figure 2). Some of the ages show largeerror resulting from the small areas that were counted. It isemphasized here that similar crater classes have been usedfor all the crater counts, which justifies the comparison ofthe ages we derived. These results demonstrate once morethat type I craters are systematically younger than the type II.The HCP-rich signature is thus strongly associated withyounger ejecta.
Figure 5. Crater depth as a function of crater diameter for a set of large type I and type II craters whosetopography can be measured with the MOLA data. The average depth-diameter relationship is taken fromGarvin et al. [2003], the parameters being rigorously defined by Garvin et al. [2000]. Type I and type IIcraters are not distinguishable from their morphometric characteristics.
E08S05 BARATOUX ET AL.: MINERALOGY OF EJECTA AT SYRTIS MAJOR
9 of 30
E08S05

2.2.4. Age of Formation of Type I and II Craters,Erosion, and Alteration History During Hesperianand Amazonian[18] Relative ages from stratigraphic relationships
and absolute ages from crater counting demonstrate thatHCP-rich craters are systematically younger than the othercraters. The existence of these two surface compositions ofejecta is thus not necessarily connected with lateral varia-tions of the subsurface mineralogy. Lateral variations in thesubsurface mineralogy across Syrtis Major shield cannot beruled out from these observations, but are considered as asecond order contribution to the ejecta surface compositionvariability. The determination of the timing and duration ofthe tectonic episode is not the scope of the paper. Accordingto Hiesinger and Head [2004], the following chronology inthree stages can be proposed: (1) volcano construction, withmost of the lava flows observed today being emplaced
before the end of this stage, (2) compressive ridge formation(first radial, then circular), minor amount and decline of thevolcanic activity, and (3) no tectonic or volcanic activity butcontinuation of impact cratering. HCP-rich craters wouldhave formed after the compressive ridge episode. Type IIejecta result from impacts which would have occurred at the
Figure 6. An example of observation of secondary cratersassociated with HCP-rich ejecta. Areas with ubiquitousclusters of secondaries are outlined. The mosaic usesTHEMIS-IR day images I09322006 and I03143002 andcorresponds to the crater 0743 + 089 as referenced in thepaper. The observation of secondaries suggests that erosionhas been limited since the impact event and the presence ofsecondaries are thus consistent with the hypothesis thatHCP-rich ejecta correspond generally to the youngercraters.
Figure 7. Observations of radial lineations on the crater0708-014 (THEMIS-VIS image V10908801). These linea-tions are easily erodible, and their presence suggests ayoung age for the impact event.
E08S05 BARATOUX ET AL.: MINERALOGY OF EJECTA AT SYRTIS MAJOR
10 of 30
E08S05

end of the first stage and possible during the second stage.Then, the type II craters likely had the HCP enrichedsignature at the time of their formation but this signatureis now masked to the observation from orbit.[19] Different processes could have modified the HCP-
signature with time. The removal and transport of the ejectalayer affecting a thickness of a few meters or tens of metersof material could be invoked. The morphologic analysissuggests however that a minor amount of erosion occurredonly consistent with partial removal of probably a minorfraction of the continuous ejecta layer. A more superficialprocess is thus more likely. For instance, a superficialcoating or slow and long-term weathering during a coldand dry environment [Bibring et al., 2005] could affect thepyroxenes spectral signature without affecting the thermalfeatures. Indeed, ejecta as rock fragments of all sizes aremore easily weathered than massive lava layers. Alterna-tively, the accumulation of a dust cover which should bethicker on the older craters might also mask the HCP-signature. A few microns of a homogeneous dust coverwould be enough and such a thin deposit would not bedetected by THEMIS-IR nighttime images. Poulet et al.[2003] have suggested that the south-west region of Syrtismay be covered by fines and oxide-rich particles. Very goodexamples of type II craters can be indeed found in the south-west region of Syrtis while type I craters are absent in thesame area, but some type II craters can be also found northof the two pateras. Small and very recent craters impactingthe ejecta deposit may expose material originating at depthsof a few meters and representative of the mineralogy belowthe superficial layer made of dust or weathered basalt. Theobservations of the mineralogical signature of such small
craters is beyond the capability of OMEGA given itsresolution. However, CRISM observations might confirmor infirm this hypothesis. The mechanism modifying theHCP signature in older ejecta cannot be determined in thispresent study. However, given the rocks abundances atSyrtis and the lack of evidence for long-term dust accumu-lation at Syrtis, the slow and long-term weathering processmore likely explains our observations. In any case, HCP-richejecta correspond to recent craters (roughly belonging to theAmazonian period) and the ejecta mineralogy of these cratersreflects thus the mineralogical composition at depth givingaccess to the vertical variations.
2.3. Sizes and Distribution of HCP-Rich Craters
[20] HCP-rich ejecta reflect the enrichment of subsurfacematerial in high-calcium pyroxene relative to the exposureof volcanic rocks between the craters. This structure andthe mineralogical composition could be variable over thevolcanic shield depending for instance on the variation ofthe thicknesses of volcanic deposits with the distance fromthe vent. Such lateral variations should be reflected into thegeographic distribution of HCP-rich craters. In order to testthis hypothesis, a catalogue of 143 HCP-rich ejecta objectshas been realized. The excavation depth is related to thecrater size. Thus the distribution of HCP-rich ejecta relativeto the volcanic center has been explored as a function of thecrater size (see Figure 11). Radial thickness or depthvariations of a HCP-rich body should imply changes inthe average distance of type I crater to Nili as a function ofcrater diameters. For instance, let us consider a HCP-richlayer in the subsurface and assume that its depth increaseswill the radial distance. Then, the average distance of large
Figure 8. The typical morphologies of ejecta at Syrtis suggest that all ejecta units have been preservedfrom a large amount of erosion. However, a distinction can be made from the ejecta surface texture. Onthe left the ejecta is said to be fresh when the surface is homogeneous and smooth and when somefeatures associated with the flow remain visible (concentric or radial textures). The ejecta is said to bedegraded or dissected when the surface is rougher and displays some evidence of erosional activity likesmall eroded craters on the ejecta layer itself.
E08S05 BARATOUX ET AL.: MINERALOGY OF EJECTA AT SYRTIS MAJOR
11 of 30
E08S05

Figure 9. Crater counts and corresponding isochrons for craters 0705 + 058, 0743 + 089, 0738 + 114,0661 + 096, 0644 + 097, 0660 + 147, 0708 + 039, and 0648 + 022. Isochrons are from the last update ofHartmann [2005].
E08S05 BARATOUX ET AL.: MINERALOGY OF EJECTA AT SYRTIS MAJOR
12 of 30
E08S05

HCP-rich craters would be larger that the average distanceof small HCP-rich craters as a result of the decrease of smallHCP-rich craters at large distance. Assuming that NiliPatera is the volcanic center, we find that the averagedistances of HCP-rich ejecta is independent of crater sizes
which contradicts our hypothesis. Actually, this outcome isindependent of the choice of the location of the volcaniccenter. This has been checked through different tests placingthe center at Meroe Patera, north and south of Syrtis. Thisresult strongly supports the idea that HCP-rich material ispresent at similar depths within all the Syrtis plateau.[21] The depth of HCP-rich material can be discussed
from the size distribution of HCP-rich craters. The HCP-richsignature of ejecta may result from a shallow material,typically at a few millimeters/centimeters depth, whichwould not be or only partially detected outside the ejecta.One possibility would be that the uppermost layer at Syrtiscomprises a large proportion of dust or weathered basalt.However, the dust cover on Syrtis is not homogeneous assurface temperature variations at night demonstrate and thedust cover is not a satisfactory explanation. Alternatively,the HCP-rich ejecta signature may result from materialpresent at larger depth which can be only excavated anddeposited at the surface by large craters.[22] Assuming that the HCP-rich material is homoge-
neously present within the volcanic construct as suggestedby the geographic distribution of HCP-rich ejecta, the sizedistribution of craters associated with HCP-rich ejectaprovides some information about the depth and thicknessof the HCP-rich material. The size distribution has beennormalized to the Martian isochrons according to the lastupdate given by Hartmann [2005]. The crater count for the16–32 km class has been used for the normalization. Thenormalized crater counts should be all equal to one if allcraters excavated equally into the HCP-rich material. This
Figure 10. Comparison of the ages of ejecta types I and II.The rectangles account for formal uncertainties in agedetermination depending on the surface and the number ofcraters available. The ejecta type I (HCP-rich) surfacesappear systematically younger than the ejecta type II.
Figure 11. Average distance to Nili Patera and standard deviation for 143 impact craters within SyrtisMajor and associated with HCP-rich ejecta blanket as a function of diameter. The numbers of craters ineach class are in increasing order of diameter: 10, 39, 53, 27, 9, and 5.
E08S05 BARATOUX ET AL.: MINERALOGY OF EJECTA AT SYRTIS MAJOR
13 of 30
E08S05

would be the case if the HCP-rich material is found only atfew millimeters or centimeters depth. The typical excava-tion depth as a function of the crater diameter is given by(see details of this calculation in Appendix A)
Hex ¼ 0:109D0:872 ð2Þ
[23] A typical depth of excavated material is then con-sidered and defined here as half of the maximum excavationdepth. For the class of craters ranging from 4 to 8 km indiameter which goes across the simple-complex transition,an average value between the complex and simple case ischosen. The general increase of the normalized number ofHCP-rich ejecta with diameter (Figure 12) indicates thatsmall craters have less probability to excavate down theHCP-rich material. The depletion for the class of smallestcraters is thought to be partially due to the resolution of thedata. However, the 1–8 km craters would correspond toejecta extended through more than a few pixels on OMEGAobservations. Despite the fact that small craters can beeroded faster than larger ones explaining the increase ofthe proportion of HCP-rich ejecta with diameter, the lack ofsmall craters associated with HCP-rich ejecta blanket morelikely suggests that the HCP-rich material is buried at a fewtens to few hundreds of meters depth. The hypothesis will
be assessed further with the detailed analyses of OMEGAspectra within individual ejecta layers.
3. Spectral Variations Within the HCP-RichEjecta Deposit
3.1. Spectral Axisymmetry of Ejecta Deposit
3.1.1. Spectrum Integration Method Over AzimuthalDirections[24] Impact craters are axisymmetric features as illustrated
by the circular rim and the circular ejecta blanket except inthe case of a very oblique impact. This property results fromthe deposition of momentum and energy in a quasi-ponctualsource, the shock wave propagating as an expanding half-sphere [Holsapple and Schmidt, 1987; Melosh, 1989]. Forthis reason the spectral signature of ejecta which have notbeen perturbated by post-impact processes is expected todisplay an axisymmetric pattern reflecting the compositionaldistribution. In other words, the spectrum at a given distanceof the center should be independent of the direction takenfrom to the center of the crater. The axisymmetric propertyof the spectra within ejecta deposits can be evaluated for thefirst time on Mars and may provide an additional evidenceof the impact-related origin of the present spectral signature.If true, it will be then possible to take advantage of thissituation to average all spectra at a given distance from thecrater center to increase the signal to noise ratio incomparison with the analysis of an individual spectrum.The ‘‘noise’’, or more precisely the spectral variability withazimuth, is defined in that case, in addition to the instru-mental noise, by any local perturbations in the theoreticalaxisymmetric composition of the ejecta deposit due toinstabilities in the surface flow or local post-impactmodifications of the ejecta layer (e.g., erosion, windstreaks, dust patches, impact on the ejecta layer itself).[25] The region of interest is defined for each crater with
the objective to avoid the ubiquitous perturbations occurringon a restricted part of the ejecta unit. Among the possiblepost-impact modifications of the ejecta layer, two processescan be easily identified and discarded in the analysis: newimpacts on the ejecta itself (craters larger than a fewhundred of meters in diameter can be observed) and windstreaks which are the major modifications of the surfaceinvolving erosion or deposition of fine particles or soils.The definition of the set of selected spectra for one ejectaunit cannot be performed automatically and is thus donemanually from the simultaneous inspection of OMEGA dataand medium to high-resolution images (THEMIS-VIS andTHEMIS-IR). The rim of the crater is also defined on theOMEGA data. The location of the crater center in theOMEGA data geometry is defined using the rim geometryfitted to an ellipse using a least-squares algorithm. Therange relative to the crater center for each individual spectraof the region of interest is then estimated. An averagespectrum at a given range is estimated from the averageof all spectra inside a sliding annulus as a function of theradial distance and with a given width, the center of eachannulus being the center of the crater (see Figure 13, right):
R li; dj� �
¼ 1
n
Xnk¼0
R li; dkð Þ ð3Þ
Figure 12. Size distribution of craters associated with anHCP-rich ejecta. The crater count has been normalized to fita Martian isochron according to the last update ofHartmann [2005] and using the number of craters in the16–32 km class. Formal uncertainties before normalizationare estimated from DN =
ffiffiffiffiN
p/S, where N represents the
number of craters and S represents the surface counted. Thenumbers of craters in each class are in increasing order ofdiameter: 10, 39, 53, 27, 9, and 5.
E08S05 BARATOUX ET AL.: MINERALOGY OF EJECTA AT SYRTIS MAJOR
14 of 30
E08S05

where R(li, dj) represents the average spectra as a functionof the distance dj of the crater center, li represent thewavelength, R(li, dk) is a individual spectrum at thedistance dk from the crater center such as jdk � djj < d whered is the chosen spatial resolution for the smoothing process(or the width of the annulus); n is the number of spectrawithin the previously defined region of interest and withinthe annulus of width d. The number N of sliding annuli isdefined by
N ¼ dmax � dmin
d * 2 ð4Þ
where dmax and dmin are respectively the minimum and themaximum distance of spectra from the center of the crater,so dj varies from the dmin to dmax and is discretized alongN points. Then using a d ranging from three to six OMEGApixels, the average spectrum is generally estimated from afew tens to a few hundred individual spectra (Figure 13,left), with the exception of the most inner and most outerregions, the shape of the manually selected region of interestbeing not axisymmetric. In practice, the d parameter hasbeen made variable for these regions such that a minimumof 100 spectra are used for each averaged spectrum.3.1.2. Assessment of the Spectral Axisymmetry of theEjecta Layer[26] The different steps in order to evaluate the axisym-
metry of spectral variations are presented with an examplecorresponding to the crater 0743 + 089 as seen by OMEGAfrom the orbit 422_3 (Figure 14). For each value of dj, the I/Fvalue for one wavelength of each individual spectra withinthe annulus can be seen in polar coordinates. In thisrepresentation I/F values are function of the azimuth andan ellipse can be fitted for each wavelength and eachdistance dj (Figure 14a). The selection of a region ofinterest, which tends to avoid wind streaks or other potentialperturbations of the pristine ejecta composition as explainedpreviously, results in a partial coverage of all azimuthaldirections. The discarded sector never exceeds 50%, so theellipse parameters are always very well constrained. This
process is repeated for all distances and wavelengths. Theaverage spectrum and standard deviations within eachannulus are represented in Figures 14b and 14c. The valuesof the standard deviation for each spectrum are systemati-cally smaller than the range of spectral variations within theejecta unit. This first analysis demonstrates that significantspectral variations can be detected within the ejecta unit.These variations appear to be organized and display anubiquitous evolution from the inner part of the ejecta towardthe edge of the continuous ejecta blanket. Figures 14d and14e show the results of the ellipse fit. The ratio of the majoraxis to the minor axis of the ellipse obtained considering theI/F values as a function of azimuth is also generally small,as seen in this example. This ratio is higher for the spectracorresponding to the distal region of the ejecta. This distalregion corresponds to the thinnest part of the ejecta depositwhich could be easily more degraded and modified than theinner parts. Also, the deposit is not expected to be perfectlysymmetric. Initial heterogeneities in the cratering excava-tion flow and/or the development of surface flow instabil-ities leading to the sinuous pattern of the flow front arenaturally more developed in the distal regions than in theproximal ones. The average spectra extracted from theejecta flow front region should thus be considered withcaution in the following analyzes. The ratios of major axisto minor axis are consistent with the values of the standarddeviations suggesting that most of the scatter of the I/Fvalues at a given range from the center of the crater resultsfrom the slightly elongated shape of the I/F values in polarcoordinates, rather than from random scattering around acircle. The standard deviation of the residuals from theellipse fit are one order of magnitude smaller than the totalstandard deviation within an annulus as seen in Figure 14and confirming this assertion.[27] The same processing has been applied to all HCP-rich
ejecta. Both standard deviations and ratios between themajor and the minor axis confirm that spectral variationsalong the radial direction are larger than spectral variationswithin a given annulus. These values also demonstrate thatthe spectral signature of all HCP-rich ejecta is generally
Figure 13. Number of individual spectra (left) within the sliding annuli (represented on the right) usedfor the estimation of average spectra as a function of the distance from the center of the crater. A fewhundred spectra are averaged in this process for each annulus, except for the most inner and outer parts.The example presented in this graph is obtained for crater 0705 + 058 with orbit 444_2.
E08S05 BARATOUX ET AL.: MINERALOGY OF EJECTA AT SYRTIS MAJOR
15 of 30
E08S05

axisymmetric. The mean deviation from the ellipse confirmsthat most of the scatter within the annulus is due to theslightly elongated shape of the ellipse. The azimuth of themajor axis is not constant and can vary abruptly withthe range. The interpretations of eccentricities and variationsof major axis azimuth are nontrivial and might be related toimpact obliquity but are beyond the scope of this paper.Such a new investigation should be considered at the limitof the capabilities of OMEGA data given its resolution butis not out of reach for CRISM observations. We anticipate apossible correlation between these mineralogical variationsand the instabilities of the surface flow outlined by thesinuous front of the ejecta deposit.
[28] In conclusion, this analysis demonstrates the first-order axisymmetry of the spectral variations within theejecta layers. The axisymmetrical property and the nonran-dom evolution of the spectra within the ejecta layer is anadditional evidence that the observed spectral variations onejecta reflect the impact process and are not the result ofpost-impact modification processes. Consequently, it isfounded to analyze these spectral variations in terms ofsubsurface mineralogical variations.
3.2. A First Analysis of Spectral Variations WithRange
[29] The averaged spectra for two of the largest type I(HCP-rich) craters are presented in Figure 15. For both
Figure 14. (a) Polar representation of I/F values (radius) as a function of the azimuth. In this example,the I/F values correspond to a set of spectra whose distances from the crater center range from 26.5 to29.5 km (wavelength is 0.57 mm). The wind streaks and other potential perturbations require theexclusion of an azimuthal sector. For this example, the best ellipse fitted has a major axis of 0.1423 andthe minor axis of 0.1447 (I/F units), and the angle of the major axis relative to the east-west direction is6.85 degrees. (b) Average spectra as a function of the distance of the center of the crater. (c) Standarddeviation of I/F values as a function of the wavelengths and distance of the center of the crater from thespectra within the annulus of width d. (d) Ratio of the major axis to the minor axis of the ellipse definedby I/F as a function of azimuthal directions from all spectra within an annulus. (e) Standard deviation ofthe residuals after the ellipse fit of I/F values. The small errors indicate that the shape of the functiondefined by I/F values and azimuths is well described by an ellipse and demonstrate that most of thestandard deviation comes from the slight eccentricity of the ellipse.
E08S05 BARATOUX ET AL.: MINERALOGY OF EJECTA AT SYRTIS MAJOR
16 of 30
E08S05
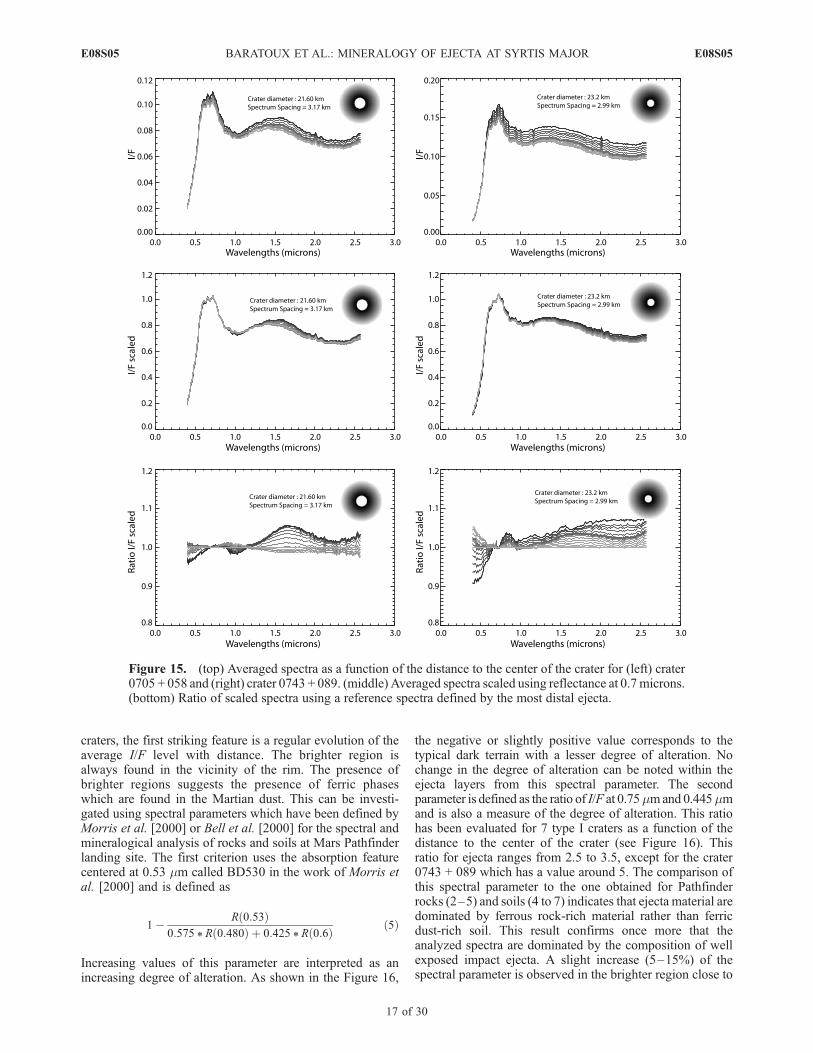
craters, the first striking feature is a regular evolution of theaverage I/F level with distance. The brighter region isalways found in the vicinity of the rim. The presence ofbrighter regions suggests the presence of ferric phaseswhich are found in the Martian dust. This can be investi-gated using spectral parameters which have been defined byMorris et al. [2000] or Bell et al. [2000] for the spectral andmineralogical analysis of rocks and soils at Mars Pathfinderlanding site. The first criterion uses the absorption featurecentered at 0.53 mm called BD530 in the work of Morris etal. [2000] and is defined as
1� R 0:53ð Þ0:575 * R 0:480ð Þ þ 0:425 * R 0:6ð Þ ð5Þ
Increasing values of this parameter are interpreted as anincreasing degree of alteration. As shown in the Figure 16,
the negative or slightly positive value corresponds to thetypical dark terrain with a lesser degree of alteration. Nochange in the degree of alteration can be noted within theejecta layers from this spectral parameter. The secondparameter is defined as the ratio of I/F at 0.75mmand 0.445mmand is also a measure of the degree of alteration. This ratiohas been evaluated for 7 type I craters as a function of thedistance to the center of the crater (see Figure 16). Thisratio for ejecta ranges from 2.5 to 3.5, except for the crater0743 + 089 which has a value around 5. The comparison ofthis spectral parameter to the one obtained for Pathfinderrocks (2–5) and soils (4 to 7) indicates that ejecta material aredominated by ferrous rock-rich material rather than ferricdust-rich soil. This result confirms once more that theanalyzed spectra are dominated by the composition of wellexposed impact ejecta. A slight increase (5–15%) of thespectral parameter is observed in the brighter region close to
Figure 15. (top) Averaged spectra as a function of the distance to the center of the crater for (left) crater0705 + 058 and (right) crater 0743 + 089. (middle) Averaged spectra scaled using reflectance at 0.7 microns.(bottom) Ratio of scaled spectra using a reference spectra defined by the most distal ejecta.
E08S05 BARATOUX ET AL.: MINERALOGY OF EJECTA AT SYRTIS MAJOR
17 of 30
E08S05

the rim. Ferric phases do also exhibit a broad absorptionfeature between 0.75 mm and 1.0 mm. The ratio of I/F at0.98 mm and I/F at 0.8 mm is a good index of the natureof the ferric oxides. This ratio ranges from 0.85 to 0.95 for the7 craters presented in Figure 15, which is consistent withthe presence of nanophase ferric oxides, with a size of about10 mm [Morris et al., 1989, 1993]. For large craters, theages have been determined as presented before, and arerecalled here. The large value of the ferric index for the crater0743 + 089 could be in favor of a possible relationshipbetween age and abundance of the ferric nanophase, but thisobservation is isolated and no definitive trend between ageand ferric indices can be established. In conclusion, thematerial observed within the ejecta layer is dominated bythe ejecta fragments, with the possibility that the observed10–15% increase of albedo at small radial range results fromthe presence of a larger amount of a ferric nanophase soilcomponent in the region close to the rim.[30] Besides the albedo variation, the spectral shape does
also change with the range. This behavior can be investi-gated from scaled spectra. The I/F value at 0.7 mm is used toscale each averaged spectra for the craters 0705 + 058 and0743 + 089 (see Figure 15, middle). Then, each scaledspectra has been also divided by the scaled spectra as thelargest distance from the center of the crater (see Figure 15,middle). Small changes are found in the 1 mm domain butare difficult to interpret. Indeed, any change in this domainfor the mafic materials found at Syrtis Major would likelyresult from the convolution of the 5 absorption features
related to olivine, high-calcium pyroxene and low-calciumpyroxene. However, a trend is observed as a change in theslope around the 1.5 mm–2.0 mm domain which is bothemphasized by the scaled spectra and the ratio of scaledspectra. Such an evolution could result from the variation ofthe band depth around 1.9 mm of the large absorptionfeature related to the low-calcium pyroxene. At longerwavelength, the change in band depth should be related tothe high-calcium pyroxene absorption feature. These directobservations of the spectral shape suggests that a variationin the HCP/LCP ratio occurs across the ejecta, and isdirectly connected to the variation of those mineral abun-dances at depth. We will thus focus in the next sections ofthis paper on how the evolution of HCP and LCP abun-dances vary as a function of the distance to the crater.
3.3. Absorption Band Strength Variations on Ejecta
[31] Spectral variations within the ejecta unit and as afunction of the range have been established in the previoussection. This section focuses on the corresponding varia-tions in absorptions depth of high-calcium pyroxene andlow-calcium pyroxene, suggested by the spectral shapeevolution in the ejecta layer. Two approaches are presented,both relying on the Modified Gaussian model (MGM)[Sunshine et al., 1990; Sunshine and Pieters, 1993] whichis suitable to deconvolve a spectra composed by a mixtureof the two types of pyroxene and estimate their abundance[Kanner et al., 2006]. The first approach relies on the globalmineral maps derived for Syrtis by Gendrin et al. [2006]
Figure 16. Spectral parameters from averaged spectra characterizing the presence of the nature of ferricphases. Crosses represent the approximate location of the rim and the approximate location of the distalejectaasseenfromthecrater topography(MOLA). (top left)BD530spectralparameterasdefinedbyMorrisetal. [2000]. (top right) Ratio I/F(750 mm)/I/F(445 mm). The ratio is more similar to Mars Pathfinder ferrousrock-rich material thanMars Pathfinder ferric dust-rich soil. (bottom right) Ratio I/F(980 mm)/I/F(800 mm).The presence of a ferric nanophase is suggested from values close to one.
E08S05 BARATOUX ET AL.: MINERALOGY OF EJECTA AT SYRTIS MAJOR
18 of 30
E08S05
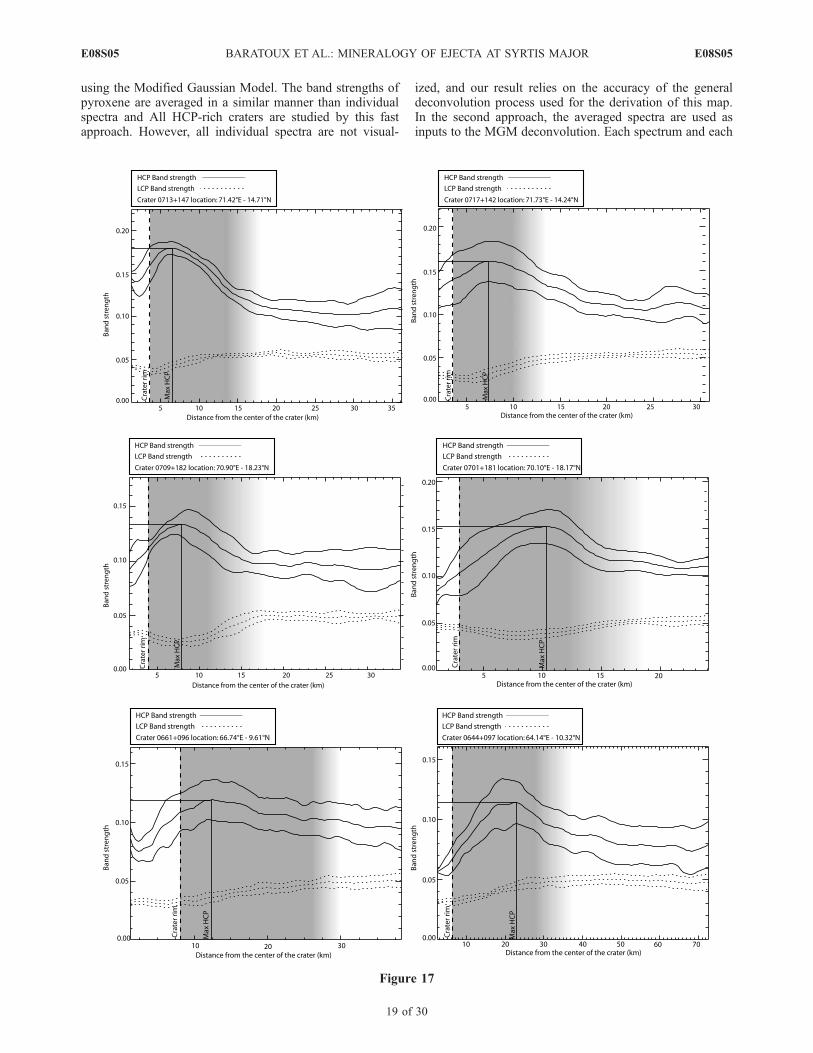
using the Modified Gaussian Model. The band strengths ofpyroxene are averaged in a similar manner than individualspectra and All HCP-rich craters are studied by this fastapproach. However, all individual spectra are not visual-
ized, and our result relies on the accuracy of the generaldeconvolution process used for the derivation of this map.In the second approach, the averaged spectra are used asinputs to the MGM deconvolution. Each spectrum and each
Figure 17
E08S05 BARATOUX ET AL.: MINERALOGY OF EJECTA AT SYRTIS MAJOR
19 of 30
E08S05

fit achieved by the deconvolution can be visualized, so thisapproach can be considered more robust and applicable tolocal studies. However, this treatment cannot be applied forthe hundreds of spectra obtained for all the HCP-richcraters. A few craters have been processed for comparisonand used as a validation of the results of the first step.3.3.1. Band Strengths From Modified Gaussian ModelFrom Global Maps[32] A few tens of spatial profiles are selected manually
on the band strengths map. The manual selection has thesame objective (see section 3.1.1) of avoiding wind streaksand other potential perturbations of pristine spectral signa-tures of the ejecta. The center of the craters is defined at theintersection of the selected profiles optimized by a leastsquares adjustment. The measurements are converted fromcartesian coordinates to polar coordinates. Band strengthsare then plotted as a function of the range from the center ofthe crater. A cubic spline interpolation method is applied inorder to obtain smoothed variations of the band strengths atregularly spaced distances from the center of the crater. Theinterpolation is done over 100 points regularly spaced fromthe center to the maximum range for all profiles. As before,band strengths close to the crater center or at the edge of thecontinuous ejecta deposit should be handled with caution asthey are derived from less points than the other parts. Theregularly interpolated smooth band strength functions arethen averaged and the standard deviation is estimated. Thisalgorithm has been applied to the HCP and LCP bands inthe 2 microns domain for 16 HCP-rich ejecta and 8 HCP-poor ejecta. A selection of the results on HCP-rich craters ispresented in Figure 17. This selection shows that the HCPband strength presents a systematic maximum at a givenrange from the crater center for all HCP-rich ejectaobserved. The positions of the rim of the crater and of theouter limit of the ejecta blanket have been indicated in orderto visualize location of the maximum with respect to theejecta morphology. The rims and ejecta boundaries loca-tions have been obtained from MOLA data, THEMIS-IRdaytime and THEMIS-VIS images when available. Thelight grey in Figure 17 corresponds to the extent of theejecta layer (the gradation to white is used to representthe typical variations of the sinuous outer boundary). This
maximum is reported for all the type I craters investigated inthe paper and the maximum occurs generally between 1.1and 3 crater radii. No trend can be reported between theband strength and the age of the craters.3.3.2. Band Strengths From Modified Gaussian Modelon Averaged Spectra[33] The Modified Gaussian Model is applied here to
averaged spectra over azimuthal directions. One disadvan-tage of this approach is the possible loss of resolution. In theapproach implemented in section 3.3.1, the MGM is appliedto all spectra, and then HCP and LCP band strengths areinterpolated and not averaged to produce a smooth curve oftheir variations. Here, the resolution is degraded before theapplication of the MGM taking into account the axisym-metry of the problem. Signal to noise ratio is increased atthe expense of the resolution in the second approach. Ejectablanket extending to large distances are the best targets forthe computation of averaged spectra. The crater 0743 + 089is one of the largest HCP-rich craters and it presents a HCPmaximum as identified in the previous analysis. The initialparameters for the 3 bands and the continuum are similar tothose of Gendrin et al. [2006] and are given in Table 4,except that the continuum is adapted to the level of I/F asperformed in the work of Pinet et al. [2006a, 2006b]. Theset of averaged spectra along the azimuthal directions (seeFigure 15) suggests an evolution with the range to the centerof the crater. One example of fit is given in Figure 18 andthe result of the MGM analysis for the crater 0743 + 089 ispresented in the Figure 19. Results of the MGM fitspresented in section 3.2.1 are displayed here for compari-son. Similar band strengths for HCP and LCP are obtainedusing the two methods, and the HCP band strengthmaximum is detected at a similar distance from the cratercenter.
4. Interpretation of Band Strength VariationsWithin the HCP-Rich Ejecta Deposits
[34] The spectral variations within the HCP-rich ejectahave two striking properties: their axisymmetry and theevolution of the band strengths of the high-calcium pyrox-ene which is systematically characterized by a maximumoccurring between 1.1 and 3 crater radius. The variations ofthe absorption depth could result from two contributions, achange in the modal composition and a variation of thegrain size distribution. The shock effect is not discussedbecause the amount of shocked material in ejecta is verylow (everywhere less than 1%) and is not likely tocontribute to the spectral signal for the sizes of impactcraters studied in this paper [Horz et al., 1983]. The non-compositional effects are discussed first and we demonstratethat a real radial change in the pyroxene composition isobserved on these ejecta. This conclusion justifies the
Figure 17. HCP and LCP band strengths of selected HCP-rich type I craters as a function of the distance from the centerof the crater. The two curves below and above the thick one indicate the uncertainties of band strength values estimatedfrom the standard deviation of spline-interpolated functions. The absorption depths of pyroxene have been obtained fromthe interpolation of global maps derived from the Modified Gaussian Model as detailed in the work of Gendrin et al. [2006]and A. Gendrin et al. (Pyroxene diversity on Mars, submitted to Journal of Geophysical Research, 2006). On each craterthe position of the crater rim is indicated. The extent of the ejecta layer is indicated by light grey, and the outer edge issymbolized by a gradation from grey to white.
Table 4. Initial Parameters for the MGM Fits for the Ejecta of
Crater 0743+089
Band 1 Band 2 Band 3
Band positions, mm 0.950 1.900 2.300Band widths, mm 0.400 0.500 0.560Band depths 0.080 0.080 0.080Error band depths 1.500 1.500 1.500Continuum coefficients �1.75 �0.13 0.000Error coefficients 1.00 0.5 0.000
E08S05 BARATOUX ET AL.: MINERALOGY OF EJECTA AT SYRTIS MAJOR
20 of 30
E08S05

attempt to derive the subsurface mineralogy from theseobservations and these aspects are presented in the last part.
4.1. Grain Size Variations
[35] Powders of the same material but with differentparticle sizes show pronounced distinctions in bandstrengths, even if the spectra are normalized or continuumremoved [Adams and Filice, 1967; Shkuratov, 1987]. Thespectral contrast and band depths at 0.95 mm and 2.0 mmhave been demonstrated to be minimal for small (<50 mm)and large particle (>200 mm) on the lunar sample 24085 ofLuna 24 [Shkuratov et al., 1999]. Then, one can argue thatthe maximum observed for the band strengths of pyroxenescan result from a monotonic increase or decrease in grainsize as shown by Shkuratov et al. [1999]. However, thismaximum of spectral contrast is expected to occur forparticles of about 50–100 mm. As proposed by Putzig etal. [2005], the thermal inertia at Syrtis can be interpreted asindicative of effective particle sizes greater than 100 mm orindicative of rocky material. Monotonic particle size varia-tions in this region are expected to produce monotonicchanges in the band strengths. However, to be moredemonstrative, we investigate below the expected grain sizedistribution in ejecta (1) from physical considerations ofimpact and ejecta emplacement processes, (2) from terres-trial observations, and (3) from the high-resolution thermalobservations on the ejecta blanket using THEMIS images.4.1.1. Grain Size Variations With Range ResultingFrom Ejecta Clasts Formation and Emplacement[36] Distal ejecta experiment larger shock intensity and
thus stronger fragmentation than proximal ones because
their origin are close to the impact point. An increasingamount of small particles with range is thus expected. Ejectaemplacement departs from the ballistic case due to theatmosphere and to the possible fluidization resulting fromthe presence of a liquid or/and gaseous phase filling theporosity between the solid particles [see Baratoux et al.,2005; Barlow, 2005]. Impact-generated wind vortices scourthe ejecta blanket and entrain the fine particles at largedistance [Barnouin-Jha et al., 1999]. The abundance ofsmall particles is increased for distal ejecta by this process.Surface flow is also able to sort particles as proposed byBaratoux et al. [2005]. In this case, a dam of larger particlescould form at the front of the flowing ejecta. This extent ofthis region as possibly identified on THEMIS-IR nighttimeimages is apparently limited to a few hundred meters andwill not affect the band depths for the entire ejecta layer.Owing to the number of involved processes and unknownparameters, the characterization of the grain size distributionfrom physical considerations on ejecta fragments formationand emplacement processes is not yet feasible. However, thediscussion above suggests that a regular increase of theeffective or mean size of the particles with the distance ofthe crater is difficult to achieve from any combinations ofthese processes.4.1.2. Terrestrial Observations[37] Few craters have enough pristine ejecta in order to
make observations concerning the grain sizes. At Elegantecrater, and even more pronounced at Meteor crater, Peet etal. [2006] found a monotonic diminution of the abundanceof blocks with the distance to the center of the crater.However, these two craters are small compared to the sizeof craters on Mars considered here. Ries crater in Germany(26 km in diameter) is the only known crater of thisdimension which still has preserved and well exposed ejectadeposits. Fitting their observation, Horz et al. [1983] foundthat the mean grain size of the Bunte breccia at Ries crater
Figure 18. Example of Modified Gaussian fit of anaveraged spectra at a given radial range. (top) Continuum,spectrum, and fit. (bottom) Gaussian forms and RMS.
Figure 19. LCP and HCP band strengths for crater 0743 +089 obtained from the first and the second method forcomparison. Similar band strength values are found, andthe presence of the HCP band strength maximum at about30–35 km from the center of the crater is reported fromboth methods.
E08S05 BARATOUX ET AL.: MINERALOGY OF EJECTA AT SYRTIS MAJOR
21 of 30
E08S05

falls as the inverse ninth power of the distance from thecenter of the crater. It is essential to emphasize that in everydrilling location, grain sizes vary by orders of magnitudeand ejecta are never well sorted. This mean grain sizeevolution has been reported on the Figure 20 with theindication of the domain of sensitivity to particle size forthe reflectance spectroscopy and surface temperature meas-urements from infrared images. At any given range, ejectaclasts are not well sorted and the grain size distribution isspread over few orders of magnitude, the physical meaningof the mean grain size should thus be considered withcaution. Despite this remark, the graph suggests that grainsize distribution in ejecta is not likely to explain alone theobserved spectral variability on Martian ejecta. Some recentobservations of the Ries ejecta layer [Schonian et al., 2005,2006; Schonian and Kenkmann, 2006] have confirmed thediamictite nature of the superficial material. We would likethus to emphasize from these observations the fact that thesurface observed from orbit on Mars corresponds really to awell-mixed layer of excavated material, the concept ofinverted stratigraphy, as often illustrated from Meteor Craterin Arizona, being only valid in the inner part of the craterwall or in a region immediately in the vicinity of the rim.4.1.3. Grain Size Distribution on the Ejecta LayerFrom THEMIS Images at Night[38] The grain size distribution can be further examined
from the thermal data. Examination of surface temperatureat night from THEMIS images (Figure 21) reveals that theejecta layer temperature is very homogeneous except for the
few hundreds meters width front as mentioned earlier. Sincethermal inertia is sensitive to a range of grain sizes whichcovers the range of sizes for which band depths could bealso modified (few microns to few millimeters), the resultabove does not suggest systematic grain size variation withthe distance to the center of the crater. Indeed, THEMISimages do not suggest any systematic grain size variationwith the distance to the center of the crater.4.1.4. Concluding Assessment About the Contributionof Grain Size[39] TES thermal inertia values at Syrtis Major already
suggested that the ejecta are dominated by rock fragments.THEMIS observations indicate that the surface temperatureis homogeneous and not controlled by local dust depositswithin the ejecta layer or by significant variations of thermalproperties related to grain size. From the ferric spectralindices, we report a slight increase of a soil component onlyin the region close to the rim where the soil component maypotentially affect the pyroxene band depths observed forpixels composed by a mixture of rocks and soils. However,the increase in the ferric index is restricted to the regionimmediately close to the rim (Figure 16), while the maxi-mum in HCP occurs generally at larger range. Finally, theLCP band depth gently increases systematically outward, orsometimes even presents a minimum. A simultaneousincrease or decrease of the HCP and LCP band strengthswould have been consistent with a grain size change or amixture with a soil component. However, the variation ofHCP and LCP are not correlated. In addition, the maximumof the HCP band depth corresponds to a pronouncedextremum in the normalized ratios of band depth. Theseobservations taken together demonstrate the spectral evolu-tion within the ejecta layer is controlled at the first order bymineralogical variations; the possible grain size changesacross the ejecta layer cannot explain the observed spectraltrends.
4.2. Compositional Variations Within the Ejecta Layer
[40] Noncompositional interpretations of the interestingspectral features on ejecta are thus ruled out and it isbelieved that the spectral variations, and in particular theHCP band strength maximum, results from a variation ofthe modal composition within the ejecta layer. It is possibleto estimate with a reasonable uncertainty the proportion ofthe two pyroxenes in a melange from normalized ratio ofLCP and HCP band strengths as recently demonstrated byKanner et al. [2006]. The band strengths ratio LCP/(HCP +LCP) can be estimated to compare the modal abundancesfor the maxima and for the regions outside the ejecta. Thisratio is independent of grain size and any variations of thisratio strengthening the demonstration that band strengthsvariations are not primarily related to grain size variationswithin the ejecta. Using typical values taken from theFigure 17 and reported in Table 6, the normalized bandstrength ratio is 0.136 ± 0.03 at the location of the HCPband strength maximum and reaches 0.33 ± 0.07 outside theejecta layer. The change in the ratio indicates a differencein the modal composition of about 20%. High-calciumpyroxene proportion is typically about 66% ± 12% at SyrtisMajor, except within the ejecta unit where the proportionof HCP reaches 87.5% ± 10.5%, arguing for a quasimonopyroxene composition for the ejecta, nevertheless not
Table 5. LCP/(HCP + LCP) Ratio as Defined in the Experimental
Work of Kanner et al. [2006] for the Selection of Type I and Type II
Craters Investigated in This Papera
Crater ID Type
Ratio LPC/(HCP + LCP)
Minimum Maximum Mean Standard Deviation
0708-014 I 0.237 0.442 0.327 0.0400705+058 I 0.061 0.382 0.207 0.0480743+089 I 0.128 0.335 0.211 0.0300661+096 I 0.149 0.342 0.251 0.0390644+097 I 0.216 0.408 0.281 0.0350676+110 I 0.164 0.369 0.268 0.0430738+114 I 0.097 0.348 0.231 0.0410694+138 I 0.013 0.291 0.171 0.0470717+142 I 0.092 0.333 0.213 0.0560700+143 I 0.200 0.385 0.303 0.0470703+144 I 0.074 0.352 0.217 0.0500713+147 I 0.139 0.315 0.230 0.0370677+159 I 0.081 0.365 0.210 0.064X1 I 0.052 0.329 0.216 0.0790701+181 I 0.159 0.337 0.240 0.0450709+182 I 0.114 0.352 0.214 0.0590648+022 II 0.338 0.490 0.400 0.0270685+028 II 0.280 0.396 0.330 0.0170708+039 II 0.197 0.491 0.361 0.0490676+055 II 0.228 0.447 0.343 0.0470717+133 II 0.197 0.839 0.448 0.132X2 II 0.259 0.463 0.354 0.0380660+147 II 0.262 0.620 0.343 0.0420688+151 II 0.266 0.623 0.413 0.0530776+184 II 0.154 0.999 0.380 0.162
aThe top part of the table corresponds to the type I craters, and the bottompart corresponds to the type II craters. The ratios have been averaged overthe entire ejecta units (fifth column); the maximum, minimum, and standarddeviation values are also reported.
E08S05 BARATOUX ET AL.: MINERALOGY OF EJECTA AT SYRTIS MAJOR
22 of 30
E08S05

excluding the presence of olivine or feldspar. Uncertaintiesgiven in Table 6 are derived from
dHCP ¼ffiffiffiffiffiffiffiffiffiffiffiffiffiffiffiffiffiffiffiffiffiffiffiffiffiffiffiffiffiffiffiffiffiffiffiffiffiffiffiffiffiffiffid2LCP= HCPþLCPð Þ þ 0:12
qð6Þ
where dLCP/(HCP+LCP) corresponds to the uncertainty on themeasured ratio and 0.1 corresponds to the uncertainty of theMGM method of 10% estimated in Kanner et al. [2006].The values only slightly overlap given the error bars, so webelieve that the difference interpreted in modal compositionis meaningful.[41] Both methods have demonstrated the enrichment of
the ejecta layer in HCP. The maximum of enrichment occurswithin the ejecta layer, but not necessarily at the rim wherethe deepest material of the ejecta unit is exposed. Anattempt is made in the next section to relate this variationof the HCP band-depth to the variations with depth of themineralogical composition.
4.3. Modeling the Excavation and Ejecta Emplacement
[42] A model of excavation flow and ejecta emplacementis required to obtain insights into the subsurface mineralogyfrom the variation of the mineralogical composition insidethe ejecta layer. Deriving the subsurface mineralogicalstructure from the variations of composition within theejecta is a challenging inverse problem. As a first step,the methodology developed here proposes a direct approachand different plausible mineralogical models for the sub-
surface mineralogy are explored and tested. Modeling theexcavation flow and ejecta emplacement is aimed at deriv-ing the composition of the ejecta layer as a function of therange, given a subsurface structure and composition. Then,the features of the ejecta layer are compared to OMEGAobservations. Absolute mineralogical concentration cannotbeen derived yet for the ejecta, owing to the uncertaintyconcerning other components (olivine, feldspar). However,we show that the relative trends (e.g., increase, decrease,minima or maxima) in mineralogical proportions withinejecta can provide with a quantitative information aboutthe subsurface mineralogy of Syrtis Major.4.3.1. Definition of the Subsurface Mineralogy[43] The subsurface mineralogy used in this direct mod-
eling of the excavation flow is described using a finitenumber of layers defined by their thicknesses and compo-sitions (Figure 22). The composition of each layer isdescribed with a number of minerals and their abundances.Minerals such as feldspars though certainly present[Bandfield, 2002] cannot be detected and mapped byOMEGA. The Modified Gaussian Model focuses on thedeconvolution of spectra assuming mafic minerals, namelyhigh-calcium and low-calcium pyroxenes. Olivine is alsopresent [Mustard et al., 2005; McSween et al., 2006; Pinetet al., 2006b; Poulet et al., 2007], but most of the cratersanalyzed here do not contain a significant amount ofolivine. Consequently, the presence of other spectrallyneutral components has been incorporated into the
Figure 20. Mean grain size variations with range according to the power-law fit of the observationsmade at Ries crater by Horz et al. [1983]. At any given range, ejecta clasts are not well sorted, and thegrain size distribution is spread over a few orders of magnitude; the physical meaning of the mean grainsize should thus be considered with caution. The corresponding domain of the HCP maximum has beenalso reported on the graph, as the sensitivity domain of surface temperature and spectral contrast to grainsize [Shkuratov et al., 1999; Pelkey et al., 2001]. This graph suggests that grain size variations within theejecta layer are not likely to explain the maximum in the HCP absorption.
E08S05 BARATOUX ET AL.: MINERALOGY OF EJECTA AT SYRTIS MAJOR
23 of 30
E08S05

excavation model, and the total abundance inside a layer isnot necessarily 100%.4.3.2. Z-Model Excavation Flow and BallisticTrajectories[44] The physical modeling of excavation flow is possible
using hydrocodes such as SALE-B [see Amsden et al.,1980; Ivanov, 2003]. However, the SALE-B cannot handleeasily a stratified target. An increasing number of difficul-ties arises when physical modeling of ejecta emplacementon Mars is attempted. These difficulties arise if one takes inaccount the fragmentation and grain size distribution of theejecta, the interaction of these particles of different sizeswith the atmosphere, and the possible surface flow of ejectahitting the surface, possibly modified by the presence ofvolatiles. The coupling of excavation flow into numericalmodels of ejecta emplacement incorporating the interactionwith the atmosphere and surface flow has not been reallyattempted yet [e.g., Barnouin-Jha et al., 1999]. Even if sucha model existed, it would probably be highly time consum-ing to investigate a wide range of subsurface structures.Instead, we choose here to develop a simple first orderanalytical approach. In this approach, the excavation flow isdescribed by the Z-model developed and validated forexplosion experiments [Maxwell, 1973, 1977; Austin etal., 1981] followed by ballistic trajectories. The excavationflow field is qualitatively illustrated in Figure 23. Velocityvectors in the material surrounding the growing cavity canbe connected by streamlines representing the paths alongwhich target material moves during the excavation flow.
The excavation flow is axisymmetric about a vertical linepassing through the impact point and the streamlinescorrespond to the projection of stream surfaces whichshould be seen in three dimensions. The central equationof the Z-model [Croft, 1980] approximating the excavationflow relates the radial component of the excavation flowvelocity to the inverse power of the radial distance to theimpact point:
ur ¼a q; tð ÞrZ
ð7Þ
[45] In this equation, the strength of the flow is controlledby a(q, t), a function of time t and angular distance from the
Figure 21. Example of the surface temperature at night inside the ejecta layer. The surface temperatureappears homogeneous, and no systematic variations with the range are observed. THEMIS imageI2638005.
Table 6. Examples of Typical Values for the HCP and LCP Band
Strengths Within the Ejecta Layer and Outside With Their
Associated Uncertainties
HCP Maximum Outside the Ejecta
Crater 0743+089HCP band strength 0.10 ± 0.01 0.07 ± 0.01LCP band strength 0.03 ± 0.005 0.04 ± 0.005LCP/(HCP + LCP) 0.2 ± 0.06 0.36 ± 0.09HCP abundance (weight %) 80% ± 12% 64% ± 13%
Crater 0713+147HCP band strength 0.19 ± 0.01 0.10 ± 0.01LCP band strength 0.03 ± 0.005 0.050 ± 0.005LCP/(HCP + LCP) 0.136 ± 0.03 0.33 ± 0.07HCP abundance (weight %) 87% ± 10.5% 67% ± 12%
E08S05 BARATOUX ET AL.: MINERALOGY OF EJECTA AT SYRTIS MAJOR
24 of 30
E08S05

vertical q. Z is the dimensionless parameter from which themodel gets its name. The characteristic velocities of theexcavation flow are generally subsonic; thus the flow can beassumed to be incompressible. The condition of incompres-sibility writes
~r~u ¼ 0 ð8Þ
and constrains naturally the angular component of thevelocity to be
uq ¼ ur Z � 2ð Þ sin q1þ cos q
ð9Þ
The integration of (9) gives the parameterized equation ofthe stream surfaces:
r ¼ r0 1� cos qð Þ1= Z�2ð Þ ð10Þ
[46] When the center of the excavation flow is assumed tobe at the surface, r0 represents the distance from the centerof the crater at which the material along the streamline isejected. The streamline that defines the divide betweenmaterial ejected from the transient cavity and materialwhich is merely displaced downward is called the hingestreamline. Roughly equal volumes of material are eitherejected from the crater or displaced downward into thecrater. The Z-model is used to define the origin of thematerial excavated at a given range from the center ofthe crater. The fate of this material depends on the ejectionposition and velocity angle. Ejection angle is assumed to begenerally close to 45�. The dimensional analysis of theimpact process has been applied to the ejecta deposits[Housen et al., 1983] and the following relationship
Figure 22. The (n, m) matrix defining the mineralogicalstructure of Syrtis for the direct modeling of excavationflow and ejecta emplacement. The mineralogical composi-tion at depth is defined with a finite number of n layers. Theproportions of the m different mineral species is given foreach layer. The total of proportions for each layer could beless than 100%, allowing the presence in the rocks ofmineralogical compounds which are spectrally neutral.
Figure 23. Schematic representation of the excavation flow and ejecta emplacement according to theZ-model followed by ballistic trajectories. The area represented in light grey represents the transientcavity. The area in darker grey between the stream surfaces outlines the material that is eventuallydeposited in the region defined by the continuation of stream surfaces into the ballistic trajectories.
E08S05 BARATOUX ET AL.: MINERALOGY OF EJECTA AT SYRTIS MAJOR
25 of 30
E08S05
[Melosh, 1989] for the ejecta velocity is used to estimate therange at which ejecta fall:
ve ¼ 0:28r
R
� ��1:8 ffiffiffiffiffiffiffiffi2gR
pð11Þ
where R is the radius of the transient crater, g is the gravityat the surface of the planet and r is the position of ejection.[47] The direct problem is solved numerically. The ejecta
layer is gridded into a number of points at given rangesdepending of the resolution desired. The material whichfalls within two nodes of the grid have traveled along thevolume defined by two neighboring ballistic trajectories inthe air intersecting the surface at two ejection points. Then,these two neighboring trajectories prolongate into twostreamlines of the excavation flow. The ejecta deposit isthus assumed to be a perfect mixture of the materialbounded by the two streamlines of the excavation flow.The composition of this material is computed from theintersection between the equation of the streamlines andthe matrix defining the composition of the subsurfacematerial. The resolution used to describe the subsurfacematerial is such that the volume inside streamlines containenough cells (generally more than one hundred). Stream-lines are approximated to follow the boundaries between thecells and no attempt has been made to consider fraction ofcells along the streamlines. The perfect mixture assumptionis justified by the observation of Chicxulub ejecta blanketwhich is a highly chaotic breccia or diamictite with indica-tions of turbulent mixing with the absence of bedding orstratification [Schonian et al., 2006]. The upper surface ofthe ejecta is thus expected to give a good representation ofthe ejecta layer content.4.3.3. Main Limitations of the Ejecta EmplacementModel[48] A number of processes have not been yet taken into
account in this approach. A single, stationary point-sourcefor the Z-model is known to be inadequate to explain thedetails of the excavation flow for oblique impacts, even forangle as high as 45�. A new analytical model could beimplemented in the future with a migrating point-source[Anderson et al., 2004] to address this issue. However thestrong approximation arises when neglecting both possibleatmospheric interaction and surface-flow after ballisticdeposition for the Martian case. Atmospheric transport hasthe potential to mix material initially on different ballistictrajectories by aerodynamic drag [Schultz and Gault, 1979]or after deposition by vortex winds scouring superficialparticles as suggested or reproduced by different experi-ments and models [Schultz, 1992; Barnouin-Jha andSchultz, 1996; Barnouin-Jha et al., 1999; Suzuki et al.,2007]. Ejecta analyses on terrestrial craters have demon-strated that distal ejecta which move faster incorporate alarge fraction of surface material when they hit the surface[Schonian et al., 2006; Kenkmann and Schonian, 2006].The fraction of superficial material in the ejecta, which isnaturally higher at large range given the excavation flow,would be ever increased by this effect. The lack of corre-lation between the volume inside the rampart and thevolume within the main part of the ejecta blanket empha-sized the importance of the radial low in the final morphol-ogy as reported by Mouginis-Mark and Baloga [2006].
Stewart and Valiant [2006] have also indicated that theoriginal Z-model does not provide a good fit to freshMartian impact crater and discrepancies arise for the volumeejecta or rim height modeling. Besides this unsatisfyingmodel for the excavation flow, other authors concentratedon the surface flow assuming rough approximation of theinitial ejecta flow pattern. This is the case for instance in thework of Baloga et al. [2005] where the source is approx-imated by time-dependent flow depth at the rim with aconstant velocity. This mathematical expression of thesource is useful to provide a reasonable initial conditionto study the surface flow. However, it is totally inappropri-ate for the investigation of the relationships betweenthe ejecta final range and their original depth. However,this model illustrates probably well the flow patterncorresponding to the spreading of ejecta after their ballistictrajectories. Their solution makes obvious that a bijectivefunction exists between the range of the final deposit andthe range of the deposit approximated by the ballisticemplacement. The main effect of the radial flow would beto spread, with a radial differential effect, the rangesdeduced from the ballistic sedimentation. In summary, itshould be noted that (1) there is not yet a satisfactory modelto reproduce analytically the excavation flow, (2) theinteraction of ejecta with the atmosphere may scour super-ficial materials and result in a strong mixing of materialinitially on different ballistic trajectories, (3) the radial flowsubstantially modifies the prediction of a purely ballisticmodel of emplacement, and (4) the incorporation of surfacematerial during the flow should consider an increasingamount of superficial material with ejecta range. Theseprocesses will be incorporated progressively as progressesare realized in each of these three aspects. Spectral studiesof terrestrial craters should be a key point to furtherprogress. Given these aforementioned limitations, thefollowing results should thus be considered as first-orderestimates.4.3.4. Results[49] Different models of the mineralogical structure have
been elaborated with the objective to reproduce the twomain properties which have been observed for the youngestimpact craters at Syrtis Major: (1) the enrichment in HCP inejecta compared to the surrounding lava flows covering andbeing part of the structure of the volcanic shield and (2) themaximum of this enrichment occurs between 1.1 and 3crater radii. In order to reproduce the global enrichment ofHCP inside the ejecta, the subsurface should be HCP-enriched at some depth. A simple two layers model withan increase in the HCP/LCP ratio in the deeper layer wouldreproduce this ejecta property. The distal ejecta have asimilar HCP and LCP proportion to the Syrtis lava flows;thus the superficial layer, used here as a reference to definethe other layers, has an HCP proportion comparable to theaverage Syrtis Major rocks. However, whatever the depthand thickness of the second layer, it is not possible toexplain the decrease of HCP inward. Indeed, the ejectamaterial which contains the largest proportion of a deepmaterial is found in the immediate vicinity of the rim. Thepresence of a maximum at some distance from the rim canbe only reproduced if one invokes a three layers model, or amodel in which the HCP abundance has maximum at somedepth and thus decreases at larger depths. The solution is
E08S05 BARATOUX ET AL.: MINERALOGY OF EJECTA AT SYRTIS MAJOR
26 of 30
E08S05

probably far from being unique and no attempt is made hereto derive the exact depths and abundances within each layer.The model presented in Figure 24 is simply a reasonablemodel in which the trends of the normalized band depthratio translate into a maximum of HCP proportion at a fewhundreds of meters depth.[50] We have varied the parameters of this model to
investigate the limit of the thicknesses that would reproducecorrectly the ejecta mineralogy for craters ranging from 5 to20 km in diameters. We find that the first layer has athickness of a few hundred of meters. HCP proportion onthe surface is thus representative of the HCP proportions inthe first tens to hundreds of meters depth. This constraint isgiven by the distal ejecta which are less rich in HCPcompared to the proximal ones. Recalling the fact thatdistal ejecta incorporate large proportions of surface mate-rial, a process which is not incorporated in the model, it islikely that the first layer has a shallower thickness than theestimate given from Z-modeling. Interestingly, an interme-diate layer is enriched in HCP material compared to theexposed Syrtis lava. The thickness of this layer is difficult todetermine. However, it should be thin enough such ascraters of a few kilometers in diameters excavate througha third layer depleted in HCP with respect to the secondlayer. Then, the thickness of the intermediate layer, or the
depth from which the HCP content starts to decrease shouldbe less than one kilometer.[51] The following properties of the Syrtis major subsur-
face are consistent with all the observations. First, thesurface mineralogy of the lava flows seems to representalso the first tens to possibly hundreds of meters of theSyrtis plateau. Then a change of the HCP/LCP ratio isobserved which is characterized by an increase followed bya decrease at a depth of about 1 km. The main difficulty forthe geologic interpretation arises with the possible evolutionwith depth for the other likely components of the rocks(feldspars, olivine and volcanic and/or impact glasses). Theknowledge of the evolution of these minerals would beessential to characterize the petrology of the volcano atdepth. However, the inferred change in the HCP/LCP ratioat a depth on the order of one kilometer opens the possi-bility that impact craters at Syrtis have excavated throughthe lava pile excavating through the underlying crust. Asimilar thickness of the lava pile has been independentlyestimated by Hiesinger and Head [2004].
5. Conclusion
[52] This study has been undertaken to demonstrate thatcraters on Mars can serve as a natural probe of the
Figure 24. Example of one possible mineral composition at depth that could explain the observedmineral variations within the ejecta unit. The graph at the top represents the fraction of ejecta materialoriginating from one given layer. The graph at the bottom represents the mineral composition of ejectagiven the mineral composition of each layer. There is no attempt to derive quantitative abundances atdepth here since mineral models are probably far from being unique. The figure shown in this exampleresults from the model of the subsurface structure shown at the bottom right. The important commonfeature to all possible mineral models is the increase of HCP abundance at few hundreds of meters depth.This increase is necessary to explain the HCP maximum in the ejecta unit.
E08S05 BARATOUX ET AL.: MINERALOGY OF EJECTA AT SYRTIS MAJOR
27 of 30
E08S05

subsurface mineralogy of the planet. The axisymmetricspectral signature of ejecta was demonstrated for the firsttime using the OMEGA data, and is considered as the bestevidence for the present relationships between the spectralsignature of ejecta and subsurface material. A secondimportant result concerns the new insights into the weath-ering history of Syrtis Major volcano. Two classes of cratershave been identified according to their mineralogy. Thetype I craters shows an enrichment in HCP compared to theSyrtis lavas. The HCP type II craters have a spectralsignature close to the Syrtis lava flows spectra. These twoclasses can been distinguished according to their ages. Thetype II craters are old and formed generally before theformation of the compressive radial and concentric ridges.The type I craters are younger and formed after the ridges.However, the two classes of craters have experienced aminor amount of erosion, as seen from the state of the ejectalayer. Then, the difference in the mineralogy could resultfrom a superficial and long-term weathering occurringunder the present environmental conditions. Fresh cratersare selected for an investigation of the subsurface mineral-ogy. The distribution and sizes of these craters suggest at thefirst order a homogeneous subsurface structure of thevolcanic edifice with an enrichment of HCP at depth.[53] Then, fresh craters are selected to constrain the
subsurface mineralogy. The spectral variations within theejecta units are organized and axisymmetric. The maximumof the HCP band strength translates into a maximum of theHCP content at few hundreds of meters depth. The miner-alogical sequence in the ejecta suggests a change in theHCP/LCP ratio with depth. The exposed layer outside theejecta extends down to probably to a few tens to a fewhundreds of meters depths and is enriched in HCP com-pared to the Noachian crust. Then, an additional increase inthe HCP/LCP ratio is observed below this layer. It couldcorrespond to the presence of basalts which are less weath-ered than the superficial ones if LCP and HCP are weath-ered at a different rate. Alternatively, it could correspond todifferent history of crystallization and magma cooling atdepth. The question is still open and difficult to solvewithout the knowledge of the other mineralogical compo-nents proportions. The third and deepest layer of our modelseems to result from the excavation of the underlyingNoachian terrain, the thickness of the decrease of theHCP/LCP being consistent with lava pile thickness estimatedindependently from morphology [Hiesinger and Head,2004]. Alternatively, this layer could also represent a moreancient Syrtis lava composition which would have beencloser in composition to the Noachian crust. CRISM shouldgive even more spectacular results on fresh ejecta whichshould be targeted in volcanic regions. Fresh craters innonvolcanic regions should be equally targeted to investi-gate the subsurface composition of sedimentary or hydratedlayers (sulfates or phyllosilicates deposits) using similar ormore sophisticated modeling of the excavation flow.
Appendix A: Excavation Depth of ComplexCraters
[54] The typical excavation depth as a function of thecrater diameter is estimated along the following lines. The
widely accepted rule of thumb has been applied [Melosh,1989]:
Hex ¼Dt
10ðA1Þ
where Hex is the maximum excavation depth and Dt is thediameter of the transient crater. For simple craters (simplecraters on Mars are smaller than 7 km in diameter), thediameter of the transient crater can be approximated withthe apparent rim-to-rim diameter which has been measuredin this study. For complex craters (diameters larger than7 km), the transient diameter should be corrected from theapparent rim-to-rim diameter D. The equation relating theterrace width W, the apparent and transient diameters andthe apparent and transient depths, respectively H and Ht
given by Melosh [1989] has been used:
D3t Ht ¼
5D3H
1þ 6
1þ D�WD
þ D�WDð Þ2
ðA2Þ
[55] The depth to diameter ratio for the transient cratercan be assumed to be constant for simple and complexcraters and is given by Melosh [1989]
Ht
Dt
¼ 1
2:7ðA3Þ
[56] Then, the terrace width is assumed to be 1/10 of theapparent crater diameter (as measured for the moon)[Pearce and Melosh, 1986], so the diameter of the floorof the crater corresponds to 80% of the apparent diameter.Finally, the apparent depth of complex craters (the depthafter crater collapse but before any subsequent infilling) isdetermined using the relationships established by Garvin etal. [2003]:
H ¼ 0:36D0:49 ðA4Þ
Equations (A2), (A3), and (A4) are finally combined into(A1) to provide an estimation of the maximum depth ofexcavation for complex craters:
Hex ¼ 0:109D0:872 ðA5Þ
[57] Acknowledgments. This project has been supported by theProgramme National de Planetologie and by the CNES (French SpaceAgency). We acknowledge the effort of the OMEGA Co-Investigator Teammembers and their associates who have contributed to this investigation inthe preparatory phase and in scientific discussions. The project has alsobenefited from the presentation of this research at the Workshop on Marsorganized by the Pole de Planetologie of Toulouse in October 2006. Wethank N. Mangold for a review of an earlier version of this manuscript. Weare grateful to P. Mouginis-Mark, as the suggestions made in his criticalreview improved the presentation of the data and discussions. We also dulyacknowledge the valuable effort of an anonymous reviewer for hispainstaking correction of the manuscript.
ReferencesAdams, J., and A. Filice (1967), Spectral reflectance 0.4 to 2.0 microns ofsilicate rock powders, J. Geophys. Res., 72, 5705–5715.
E08S05 BARATOUX ET AL.: MINERALOGY OF EJECTA AT SYRTIS MAJOR
28 of 30
E08S05

Amsden, A. A., H. W. Ruppel, and C. W. Hirt (1980), SALE: A simplifiedALE computer program for fluid flow at all speeds, Tech. Rep. LA-8095,Los Alamos National Laboratory, Los Alamos, N. M.
Anderson, J., P. Schultz, and J. Heineck (2004), Experimental ejectionangles for oblique impacts: Implications for the subsurface flow-field,Meteorit. Planet. Sci., 39(2), 303–320.
Austin, M., J. Thomsen, S. Ruhl, D. Orphal, W. Borden, S. Larson, andP. Schultz (1981), Z-model analysis of impact cratering: An overview,in Multi-ring Basins, edited by P. H. Schultz and R. Merill, pp. 197–205, Pergamon, New York.
Baloga, S. M., S. A. Fagents, and P. J. Monginis-Mark (2005), Emplace-ment of Martian rampart crater deposits, J. Geophys. Res., 110, E10001,doi:10.1029/2004JE002338.
Bandfield, J. L. (2002), Global mineral distributions on Mars, J. Geophys.Res., 107(E6), 5042, doi:10.1029/2001JE001510.
Bandfield, J. L., V. E. Hamilton, and P. R. Christensen (2000), A globalview of Martian surface compositions from MGS-TES, Science,287(5458), 1626–1630.
Baratoux, D., C. Delacourt, and P. Allemand (2002), An instability mechan-ism in the formation of the Martian lobate craters and the implications forthe rheology of ejecta, Geophys. Res. Lett., 29(8), 1210, doi:10.1029/2001GL013779.
Baratoux, D., N. Mangold, P. Pinet, and F. Costard (2005), Thermal proper-ties of lobate ejecta in Syrtis Major, Mars: Implications for the mechan-isms of formation, J. Geophys. Res., 110, E04011, doi:10.1029/2004JE002314.
Barlow, N. G. (2005), A review of Martian impact craters ejecta structuresand their implications for target properties, special paper, in LargeMeteoritics Impacts III, Spec. Pap. Geol. Soc. Am., 384, 433–442,doi:10.1130/0-8137-2384-1.
Barlow, N. G., and T. L. Bradley (1990), Martian impact craters: Correla-tions of ejecta and interior morphologies with diameter, latitude andterrain, Icarus, 87, 156–179.
Barlow, N. G., and C. B. Perez (2003), Martian impact crater ejectamorphologies as indicators of the distribution of subsurface volatiles,J. Geophys. Res., 108(E8), 5085, doi:10.1029/2002JE002036.
Barlow, N. G., J. M. Boyce, F. M. Costard, R. A. Craddock, J. B. Garvin,S. E. H. Sakimoto, R. O. Kuzmin, D. J. Roddy, and L. A. Soderblom(2000), Standardizing the nomenclature of Martian impact crater ejectamorphologies, J. Geophys. Res., 105(E11), 26,733–26,738.
Barnouin-Jha, O. S., and P. H. Schultz (1996), Ejecta entrainment by impact-generated ring vortices: Theory and experiments, J. Geophys. Res.,101(E9), 21,099–21,115.
Barnouin-Jha, O., P. H. Schultz, and J. Lever (1999), Investigating theinteractions between an atmosphere and an ejecta curtain. 2. Numericalexperiments, J. Geophys. Res., 104(E11), 27,117–27,131.
Bell, J. I., III, M. J. Wolff, P. B. James, R. T. Clancy, S. W. Lee, and L. J.Martin (1997), Mars surface mineralogy from Hubble Space Telescopeimaging during 1994–1995: Observations, calibrations and initial results,J. Geophys. Res., 102(E4), 9109–9123.
Bell, J. F., III, et al. (2000), Mineralogic and compositional properties ofMartian soil and dust: Results from Mars Pathfinder, J. Geophys. Res.,105(E1), 1721–1756.
Bibring, J.-P., et al. (2005), Mars surface diversity as revealed by theOMEGA/Mars Express observations, Science, 307(5515), 1576–1581.
Boyce, J. M., P. J. Mouginis-Mark, H. Garbeil, and L. A. Soderblom(2006), History of major crater degradational events on Mars: Preliminaryresults from crater depth and diameter measurements, Proc. Lunar Pla-net. Sci. Conf. 37th, Abstract 2354.
Croft, S. K. (1980), Cratering flow fields: Implications for the excavationand transient expansion stages of crater formation, Proc. Lunar Planet.Sci. Conf., 21st, 2347–2378.
Forsberg-Taylor, N. K., A. D. Howard, and R. A. Craddock (2004), Craterdegradation in the Martian highlands: Morphometric analysis of the SinusSabaeus region and simulation modeling suggest fluvial processes,J. Geophys. Res., 109, E05002, doi:10.1029/2004JE002242.
Garvin, J. B., S. E. H. Sakimoto, J. Frawley, and C. Schnetzler (2000),North polar region craterforms on Mars: Geometric characteristics fromthe Mars Orbiter Laser Altimeter, Icarus, 144(2), 329–352.
Garvin, J. B., S. Sakimoto, and J. Frawley (2003), Craters on Mars: Globalgeometric properties from gridded MOLA topography, paper presented atSixth International Conference onMars, Lunar and Planet. Inst., Pasadena,Calif.
Gendrin, A., et al. (2006), Strong pyroxene absorption bands on Marsidentified by OMEGA: Geological counterpart, Proc. Lunar Planet.Sci. Conf. 37th, Abstract 1858.
Hartmann, W. (2005), Martian cratering 8: Isochron refinement and thechronology of Mars, Icarus, 174, 294–320, doi:10.1016/j.icarus.2004.11.023.
Hiesinger, H., and J. W. Head III (2004), The Syrtis Major volcanic pro-vince, Mars: Synthesis from Mars Global Surveyor data, J. Geophys.Res., 109, E01004, doi:10.1029/2003JE002143.
Hiroi, T., C. Pieters, and S. Noble (2000), Improved scheme of modifiedGaussian deconvolution for reflectance spectra of lunar soils, Proc. LunarPlanet. Sci. Conf. 31st, Abstract 1548.
Holsapple, K., and R. Schmidt (1987), Point source and coupling para-meters in cratering mechanics, J. Geophys. Res., 92, 6350–6376.
Horz, F., R. Osterstag, and D. A. Rainey (1983), Bunte breccia of the ries:Continuous deposits of large impact craters, Rev. Geophys., 21, 1667–1725.
Housen, K., R. Schmidt, and K. Holsapple (1983), Crater ejecta scalinglaws, fundamental forms based on dimensionnal analysis, J. Geophys.Res., 88(B3), 2485–2499.
Ivanov, B. (2003), Education experience in numerical modeling of impactcratering, in Impact Cratering: Bridging the Gap Between Modeling andObservations, LPI Contrib. 1155, edited by R. Herrick and E. Pierazzo,Abstract 8028, Lunar and Planet. Inst., Houston, Tex.
Kanner, L., J. F. Mustard, and A. Gendrin (2006), Assessing the limits ofthe Modified Gaussian Model for remote spectroscopic studies of pyrox-enes on Mars, Icarus, 187, 442–456, doi:10.1016/j.icarus.2006.10.025.
Kenkmann, T., and F. Schonian (2006), Ries and Chicxulub: Impact craterson Earth provide insights for Martian ejecta blankets, Meteorit. Planet.Sci., 41, 1587–1603.
Mangold, N., P. Allemand, P. G. Thomas, and G. Vidal (2000), Chronologyof compressional deformation of Mars: Evidence of a single and globalorigin, Planet. Space Sci., 48, 1201–1211.
Maxwell, D. (1973), Cratering flow and crater prediction methods, Tech.Rep. 73-17, 50 pp., Phys. Int. Co., San Leandro, Calif.
Maxwell, D. (1977), Simple Z-model of cratering, ejection, and the over-turned flap, in Impact Explosion Cratering, edited by D. Roddy, R. Pepin,and R. Merill, pp. 1003–1008, Pergamon, New York.
McSween, H. Y., et al. (2006), Characterization and petrologic interpreta-tion of olivine-rich basalts at Gusev Crater, Mars, J. Geophys. Res., 111,E02S10, doi:10.1029/2005JE002477.
Melosh, H. (1989), Impact Cratering: A Geologic Process, Oxford Monogr.Geol. Geophys., vol. 11, 244 pp., Oxford Univ. Press, 244 pages, NewYork, USA.
Morris, R. V., D. Agresti, H. Lauer Jr., J. Newcomb, T. Shelfer, and A.Murali(1989), Evidence for pigmentary hematite on Mars based on optical, mag-netic, and Mossbauer studies of superparamagnetic (nanocrystalline) he-matite, J. Geophys. Res., 94, 2760–2778.
Morris, R. V., D. C. Golden, J. Bell III, H. Lauer Jr., and J. Adams (1993),Pigmenting agents in Martian soils: Inferences from spectral, Mossbauer,and magnetic properties of nanophase and other iron oxides in Hawaiianpalagonitic soil PN-9, Geochim. Cosmochim. Acta, 57, 4597–4609.
Morris, R. V., et al. (2000), Mineralogy, composition, and alteration of MarsPathfinder rocks and soils: Evidence from multispectral, elemental, andmagnetic data on terrestrial analogue, SNC meteorite, and Pathfindersamples, J. Geophys. Res., 105(E1), 1757–1818.
Mouginis-Mark, P., and J. Boyce (2004), Morphology of Martian doublelayered ejecta craters and the speed of ejecta emplacement, paper pre-sented at 7th Mars Crater Consortium Meeting, Northern Ariz. Univ.,Flagstaff, Ariz.
Mouginis-Mark, P. J., and S. M. Baloga (2006), Morphology and geometryof the distal ramparts of Martian impact craters,Meteorit. Planet. Sci., 41,1469–1482.
Mustard, J. F., S. Erard, J.-P. Bibring, J. Head III, S. Hurtrez, Y. Langevin,C. Pieters, and C. Sotin (1993), The surface of Syrtis Major: Compositionof the volcanic substrate and mixing with altered dust and soil, J. Geo-phys. Res., 98(E2), 3387–3400.
Mustard, J. F., F. Poulet, A. Gendrin, J.-P. Bibring, Y. Langevin, B. Gondet,N. Mangold, G. Belluci, F. Altieri, and the Omega Team (2005), Olivineand pyroxene diversity in the crust of Mars, Science, 307(5515), 1595–1597.
Neumann, G. A., M. T. Zuber, M. A. Wieczorek, P. J. McGovern, F. G.Lemoine, and D. E. Smith (2004), Crustal structure of Mars from gravityand topography, J. Geophys. Res., 109, E08002, doi:10.1029/2004JE002262.
Pearce, S., and H. J. Melosh (1986), Terrace width variations in complexlunar craters, Geophys. Res. Lett., 13, 1419–1422.
Peet, V., M. Ramsey, and D. Crown (2006), Terrestrial volcanic and impactanalogs to small Martian craters: Utilizing remote sensing and field-baseddatasets to analyse formational and sediment transport processes, Proc.Lunar Planet. Sci. Conf. 37th, Abstract 2323.
Pelkey, S., B. Jakosky, and M. T. Mellon (2001), Thermal inertia of crater-related wind streaks on Mars, J. Geophys. Res., 106(E10), 23,909–23,920.
Pinet, P., and S. Chevrel (1990), Spectral identification of geological unitson the surface of Mars related to the presence of silicates from Earth-
E08S05 BARATOUX ET AL.: MINERALOGY OF EJECTA AT SYRTIS MAJOR
29 of 30
E08S05

based near-infrared telescopic charge-coupled device imaging, J. Geo-phys. Res., 95, 14,435–14,446.
Pinet, P. C., et al. (2006a), Mantle rock surface mineralogy mapping inarid environment from imaging spectroscopy: The case of the Maqsadperidotitic massif in Oman and implications for the spectroscopic studyof exposed mafic units on Mars, Proc. Lunar Planet. Sci. Conf. 37th,Abstarct 1346.
Pinet, P. C., et al. (2006b), Detection and regional mapping of maficminerals across Syrtis Major from OMEGA/Mars Express observationsin the visible-near infrared domain by means of MGM deconvolution,Eur. Community, First Europlanet Meeting, Berlin.
Plaut, J., et al. (2006), MARSIS subsurface sounding observations of thesouth polar layered deposits of Mars, Lunar Planet. Sci. Conf. 37th,Abstract 1212.
Poulet, F., N. Mangold, and S. Erard (2003), A new view of dark Martianregions from geomorphic and spectroscopic analysis of Syrtis Major,Astron. Astrophys., 412, L19–L23, doi:10.1051/0004-6361:20031661.
Poulet, F., C. Gomez, J.-P. Bibring, Y. Langevin, B. Gondet, P. Pinet,G. Belluci, and J. Mustard (2007), Martian surface mineralogy fromObservatoire pour la Mineralogie, l’Eau, les Glaces et l’Activite on boardthe Mars Express spacecraft (OMEGA/MEx): Global mineral maps,J. Geophys. Res., 112, E08S02, doi:10.1029/2006JE002840.
Putzig, N., M. Mellon, K. Kretke, and A. Arvidson (2005), Global thermalinertia and surface properties of Mars from the MGM mapping mission,Icarus, 173, 325–341, doi:10.1016/j.icarus.2004.08.017.
Ramsey, M. S. (2002), Ejecta distribution patterns atMeteor Crater, Arizona:On the applicability of lithologic end-member deconvolution for space-borne thermal infrared data of Earth and Mars, J. Geophys. Res., 107(E8),5059, doi:10.1029/2001JE001827.
Schonian, F., and T. Kenkmann (2006), Implications for ejecta blankets onMars from the Ries and Chicxulub impact structures, paper presented atFirst Internation Conference on Impact Cratering in the Solar System,Eur. Space Res. and Technol. Cent., Noordwijk, Netherlands.
Schonian, F., R. Tagle, D. Stoffler, and T. Kenkmann (2005), Geology ofsouthern Quintana Roo (Mexico) and the Chicxulub ejecta blanket, Proc.Lunar Planet. Sci. Conf. 36th, Abstract 2389.
Schonian, F., T. Salge, T. Kenkmann, D. Stoffler, A. Solar Arechalde, andL. Urrutia Fucugauchi (2006), Chicxulub ejecta blanket: The suevites ofthe UNAM 5 and UNAM 7 drill cores, Proc. Lunar Planet. Sci. Conf.37th, Abstract 2229.
Shkuratov, Y. G. (1987), A model of spectral albedo dependence for solidsurface of cosmic bodies, Kinemat. Fiz. Nebesnykh Tel, 3, 39–46.
Shkuratov, Y. G., L. Starukhina, H. Hoffmann, and G. Arnold (1999), Amodel of spectral albedo of particulate surfaces: Implications for opticalproperties of the Moon, Icarus, 137, 235–246.
Schultz, P. H. (1992), Atmospheric effects on ejecta emplacement, J. Geo-phys. Res., 97, 13,257–13,302.
Schultz, P. H., and D. E. Gault (1979), Atmospheric effects on Martianejecta emplacement, J. Geophys. Res., 84(B13), 7669–7687.
Stewart, S. T., and G. J. Valiant (2006), Martian subsurface properties andcrater formation processes inferred from fresh impact crater geometries,Meteorit. Planet. Sci., 41, 1509–1537.
Sunshine, J., and C. Pieters (1993), Estimating modal abundances from thespectra of natural and laboratory pyroxene mixtures unising the modifiedGaussian model, J. Geophys. Res., 98(E5), 9075–9087.
Sunshine, J., C. Pieters, and S. Pratt (1990), Deconvolution of mineralbands: An improved approach, J. Geophys. Res., 95(B5), 6955–6966.
Suzuki, A., I. Kumagai, Y. Nagata, K. Kurita, and O. S. Barnouin-Jha(2007), Modes of ejecta emplacement at Martian craters from laboratoryexperiments of an expanding vortex ring interacting with a particle layer,Geophys. Res. Lett., 34, L05203, doi:10.1029/2006GL028372.
Tornabene, L., J.Moersch, H.McSween Jr., V. Hamilton, J. Piatek, K.Milam,and P. Christensen (2006), The subsurface geology of Mars: Remote sen-sing of impact craters using THEMIS, MOC and MOLA, Proc. LunarPlanet. Sci. Conf. 37th, Abstract 1739.
Watters, T., C. Leuschen, J. Plaut, G. Picardi, A. Safaeinili, S. Clifford,W. Farell, A. Ivanov, R. Philipps, and E. Stofan (2006), Evidence ofburied basins in the northern lowlands of Mars from the MARSIS radarsounder, Proc. Lunar Planet. Sci. Conf. 37th, Abstract 1693.
Zuber, M. T., et al. (2000), Internal structure and early thermal evolution ofMars from Mars Global Surveyor topography and gravity, Science, 287,1788–1793.
�����������������������D. Baratoux, Y. Daydou, P. Pinet, and J. Vaucher, Observatoire Midi-
Pyrenees, UMR 5562 CNRS, Laboratoire Dynamique Terrestre etPlanetaire, Universite Paul Sabatier Toulouse III, 14 Avenue EdouardBelin, F-31400 Toulouse, France. ([email protected])J.-P. Bibring, Institut d’Astrophysique Spatiale, UMR 8617, Batiment
121, F-91405 Orsay, France.A. Gendrin, L. Kanner, and J. Mustard, Department of Geological
Sciences, Brown University, Box 1846, Providence, RI 02912, USA.
E08S05 BARATOUX ET AL.: MINERALOGY OF EJECTA AT SYRTIS MAJOR
30 of 30
E08S05