Omega-3 polyunsaturated fatty acids and their - Research ...
251
Omega-3 polyunsaturated fatty acids and their impact upon the biosynthesis of endocannabinoids and N-acylethanolamines in human skin cells in the presence and absence of ultraviolet radiation A thesis submitted to The University of Manchester for the degree of PhD in the Faculty of Medical and Human Sciences 2015 Abdalla F. Mohammed Almaedani Manchester Pharmacy School
-
Upload
khangminh22 -
Category
Documents
-
view
0 -
download
0
Transcript of Omega-3 polyunsaturated fatty acids and their - Research ...

Omega-3 polyunsaturated fatty acids and their
impact upon the biosynthesis of
endocannabinoids and N-acylethanolamines in
human skin cells in the presence and absence of
ultraviolet radiation
A thesis submitted to The University of Manchester for
the degree of PhD in the Faculty of Medical and Human
Sciences
2015
Abdalla F. Mohammed Almaedani
Manchester Pharmacy School

2
CONTENTS………………………………………………………………..2
LIST OF TABLES ............................................................................ 12
LIST OF FIGURES .......................................................................... 15
LIST OF ABBREVIATIONS ............................................................ 21
Abstract .......................................................................................... 24
Declaration ..................................................................................... 25
Copy right statement ..................................................................... 25
Acknowledgement ......................................................................... 26
CHAPTER 1: Introduction ............................................................. 28
1.1. Introduction to human skin biology ...................................... 28
1.1.1. Epidermis ........................................................................................................... 29
1.1.1.1. Epidermal layers ....................................................................................... 30
1.1.1.1.1 Stratum basale .................................................................................. 30
1.1.1.1.2. Stratum spinosum .......................................................................... 30
1.1.1.1.3. Stratum granulosum ...................................................................... 30
1.1.1.1.4. Stratum corneum ............................................................................ 31
1.1.1.2. Epidermal cells .......................................................................................... 31
1.1.1.2.1. Keratinocytes ................................................................................... 31
1.1.1.2.1.1. Immortalized HaCaT keratinocytes .................................... 33
1.1.1.2.2. Melanocytes ..................................................................................... 33
1.1.1.2.3. Langerhans cells ............................................................................. 34
1.1.1.2.4. Merkel cells ...................................................................................... 35
1.1.2. Dermis................................................................................................................. 35
1.1.2.1. Dermal cells ............................................................................................... 36

3
1.1.2.1.1. Fibroblasts ........................................................................................ 36
1.1.2.1.2. Mast cells .......................................................................................... 37
1.1.2.1.3. Subcutaneous layer ....................................................................... 37
1.2. Ultraviolet radiation (UVR) and its effects on cells .............. 38
1.2.1. Effects of ultraviolet radiation on human skin ............................................... 39
1.3. Omega-3 polyunsaturated fatty acids (n-3 PUFA) ............... 40
1.3.1. Metabolism of essential fatty acids in human skin ....................................... 41
1.3.2. Polyunsaturated fatty acids and impact upon eicosanoid production ....... 44
1.3.3. Omega-3 PUFA and inflammatory gene expression ................................... 46
1.3.4. The protective effect of n-3 PUFA in UVR induced skin inflammation ...... 47
1.4. The endocannabinoid system ............................................... 47
1.4.1. Biosynthesis of N-arachidonoylethanolamide (AEA, anandamide) ........... 49
1.4.1.1. N-acyltransferases .................................................................................... 50
1.4.1.2. N-acyl phosphatidylethanolamine phospholipase D ............................ 50
1.4.1.3. Alternate pathways of anandamide biosynthesis ................................. 51
1.4.2. Biosynthesis of 2-arachidonoyl glycerol (2-AG) ........................................... 53
1.4.3. Catabolism of AEA and 2-AG .......................................................................... 55
1.4.3.1. Fatty acid amide hydrolase ...................................................................... 56
1.4.3.2. N-acylethanolamine hydrolysing acid amidase .................................... 57
1.4.4. N-acylethanolamines ........................................................................................ 58
1.4.5. Endocannabinoids and their impact on the skin ........................................... 59
1.5. Aims and objectives of the study........................................................................ 62
CHAPTER 2: Materials and Methods ............................................ 64
2.1. Cell culture and maintenance ................................................ 64
2.1.1. Cell lines ............................................................................................................. 64

4
2.2. Cell culture .............................................................................. 64
2.2.1. Materials ............................................................................................................. 64
2.2.2. Equipment .......................................................................................................... 65
2.2.3. Cell thawing ....................................................................................................... 65
2.2.4. Cell line maintenance ....................................................................................... 65
2.2.5. Cell treatment with fatty acids ......................................................................... 66
2.2.6. Cell irradiation .................................................................................................... 67
2.2.7. Collection of cell pellets and culture medium ................................................ 67
2.2.8. Cell counting ...................................................................................................... 68
2.2.9. Cryogenic storage of the cells ......................................................................... 68
2.3. Western blotting ..................................................................... 69
2.3.1 Chemicals ............................................................................................................ 69
2.3.2. Primary and Secondary Antibodies ................................................................ 70
2.3.3. Various consumables and small items .......................................................... 71
2.4. Sample preparation ................................................................ 71
2.4.1. Protein Extraction .............................................................................................. 71
2.4.2. Determination of protein concentration .......................................................... 72
2.5. Sodium dodecyl sulphate-polyacrylamide gel electrophoresis
(SDS-PAGE).................................................................................... 74
2.5.1 SDS-PAGE: Gel Preparation ............................................................................ 74
2.5.2 SDS-PAGE: Gel Electrophoresis ..................................................................... 75
2.5.3. Wet Transblotting .............................................................................................. 76
2.5.4. Blocking and Immunoblotting .......................................................................... 77
2.5.5. Protein visualization .......................................................................................... 79
2.5.6. Membrane stripping and re-probing ............................................................... 79

5
2.6. Densitometry analysis ............................................................ 80
2.7. Antibody optimization ............................................................ 80
2.7.1. COX-2 and GAPDH Antibodies ...................................................................... 80
2.7.2. Optimization of 12-Lipoxygenase (murine leukocyte) Polyclonal Antiserum
.......................................................................................................................... ..82
2. 8. Analysis of endocannabinoids by LC-MS/MS ..................... 83
2.8.1. Materials ............................................................................................................. 83
2.8.2. Experimental description of LC-MS/MS analysis ......................................... 83
2.8.3. Extraction Protocol ............................................................................................ 84
2.8.4. LC-MS/MS analysis of endocannabinoids and NAE.................................... 84
2.8.5. Standards for quantification and calibration lines ......................................... 86
2.9 Clinical study ........................................................................... 87
2.9.1. Experimental design ......................................................................................... 87
2.9.2. Simulated summer sunlight exposures .......................................................... 88
2.9.3. Irradiation Protocol ............................................................................................ 89
2.9.4. Skin colour measurements .............................................................................. 89
2.9.5. Blood collection and serum separation .......................................................... 90
2.9.6. Lipid Extraction .................................................................................................. 91
2.10. Statistical Analysis ............................................................... 92
CHAPTER 3: The effect of n-3 PUFA on the formation of
endocannabinoids and N-acylethanolamines in HaCaT
keratinocytes and 46BR.IN fibroblasts in response to ultraviolet
radiation ......................................................................................... 93
3.1 Introduction .............................................................................. 93

6
3.2 Aims of the study ..................................................................... 94
3.3 Materials and Methods ............................................................ 95
3.3.1. Materials ............................................................................................................. 95
3.3.2. Experimental description of LC-MS/MS analysis ......................................... 95
3.3.3. Extraction protocol ............................................................................................ 95
3.3.4. LC-MS/MS analysis of endocannabinoids and N-acylethanolamines ....... 95
3.3.5. Standards for quantification and calibration lines ......................................... 95
3.3.6. Statistical analysis (refer to section 2.10. chapter 2) ................................... 95
3.4. Results ..................................................................................... 95
3.4.1. Quantification of endocannabinoids and N-acylethanolamines in irradiated
and non-irradiated HaCaT keratinocytes treated with oleic acid........................... 95
3.4.2. Quantification of endocannabinoids and N-acylethanolamines in irradiated
and non-irradiated HaCaT keratinocytes treated with docosahexaenoic acid .... 99
3.4.3. Quantification of endocannabinoids and N-acylethanolamines in irradiated
and non-irradiated HaCaT keratinocytes treated with eicosapentaenoic acid 103
3.4.4. Quantification of endocannabinoids and N-acylethanolamines in culture
medium from irradiated and non-irradiated HaCaT keratinocytes treated with oleic
acid ............................................................................................................................... 107
3.4.5. Quantification of endocannabinoids and N-acylethanolamines in cell culture
medium from irradiated and non-irradiated HaCaT keratinocytes treated with
docosahexaenoic acid ............................................................................................... 110
3.4.6. Quantification of endocannabinoids and N-acylethanolamines in cell culture
medium from irradiated and non-irradiated HaCaT keratinocytes treated with
eicosapentaenoic acid ............................................................................................... 113
3.4.7. Quantification of the endocannabinoids and N-acylethanolamines in
irradiated and non-irradiated 46BR.IN fibroblasts treated with oleic acid. ......... 118

7
3.4.8. Quantification of the endocannabinoids and other N-acylethanolamines in
irradiated and non-irradiated 46BR.IN fibroblasts treated with docosahexaenoic
acid ............................................................................................................................... 122
3.4.9. Quantification of the endocannabinoids and N-acylethanolamines in
irradiated and non-irradiated 46BR.IN fibroblasts treated with eicosapentaenoic
acid. .............................................................................................................................. 126
3.4.10. Quantification of the endocannabinoids and N-acylethanolamines in culture
medium from irradiated and non-irradiated 46BR.IN fibroblasts treated with oleic
acid ............................................................................................................................... 130
3.4.11. Quantification of the endocannabinoids and N-acylethanolamines in culture
medium from irradiated and non-irradiated 46BR.IN fibroblasts treated with
docosahexaenoic acid ............................................................................................... 133
3.4.12. Quantification of the endocannabinoids and other N-acylethanolamines in
culture medium from irradiated and non-irradiated 46BR.IN fibroblasts treated with
eicosapentaenoic acid ............................................................................................... 136
3.5. Discussion ............................................................................. 141
3.5.1. Determination the effect of oleic acid and ultraviolet radiation on the
intracellular and extracellular levels of endocannabinoids and N-acylethanolamines
in HaCaT Keratinocytes and 46BR.IN fibroblasts. ................................................ 141
3.5.2. Determination the effects of n-3 PUFA on the intracellular and extracellular
levels of the endocannabinoids and N-acylethanolamines in HaCaT Keratinocytes
and 46BR.IN fibroblasts in response to ultraviolet radiation. ............................... 141
CHAPTER 4: The effect of n-3 PUFA on endocannabinoid
metabolizing enzymes in HaCaT keratinocytes and 46BR.IN
fibroblasts in response to ultraviolet radiation. ........................ 147
4.1. Introduction ........................................................................... 147
4.1.1. Cyclooxygenase-2 .......................................................................................... 147

8
4.1.2. Lipoxygenases ................................................................................................. 148
4.2. Aims of this study ................................................................. 149
4.3 Materials and Methods .......................................................... 150
4.3. Western blotting ................................................................................................. 150
4.3.1. Materials ........................................................................................................... 150
4.3.2. Experimental Design ...................................................................................... 150
4.3.3. Protein extraction ............................................................................................ 150
4.3.4. SDS-PAGE ..................................................................................................... 150
4.4. Results ................................................................................... 150
4.4.1. The effect of UVR and n-3 PUFA on COX-2 protein levels in HaCaT
keratinocytes and 46BR.IN fibroblasts. ................................................................... 150
4.4.1.1. The effect of docosahexaenoic acid and ultraviolet radiation ........ ..150
4.4.1.2. The effect of oleic acid and ultraviolet radiation ................................. 154
4.4.1.3. The effect of eicosapentaenoic acid and ultraviolet radiation .......... 154
4.5. The effect of UVR and n-3 PUFA on LOX protein levels in
HaCaT keratinocytes and 46BR.IN fibroblasts .......................... 159
4.6. The effect of UVR and n-3 PUFA on N-
acylphosphatidylethanolamine phopholipase-D (NAPE-PLD) and
fatty acid amide hydrolase (FAAH) protein levels in HaCaT
keratinocytes and 46BR.IN fibroblasts ...................................... 163
4.6.1. Effect of oleic acid and UVR on FAAH and NAPE-PLD in HaCaT
keratinocytes ............................................................................................................... 163
4.6.2. Effect of eicosapentaenoic acid and UVR on FAAH and NAPE-PLD in HaCaT
keratinocytes cell lines. ............................................................................................. 164
4.6.3. Effect of docosahexaenoylethanolamide and UVR on FAAH and NAPE-PLD
in HaCaT keratinocytes ............................................................................................. 164

9
4.6.4. Effect of oleic acid and UVR on FAAH and NAPE-PLD protein level in
46BR.IN fibroblasts .................................................................................................... 171
4.6.5. Effect of eicosapentaenoic acid and UVR on FAAH and NAPE-PLD in
46BR.IN fibroblasts .................................................................................................... 171
4.6.6. Effect of docosahexaenoylethanolamide and UVR on FAAH and NAPE-PLD
in 46BR.IN fibroblasts ................................................................................................ 172
4.7 Discussion .............................................................................. 179
4.7.1. The effect of omega-3 polyunsaturated fatty acids and UVR on COX-2
protein expression in HaCaT keratinocytes and 46BR.IN fibroblasts ................ 179
4.7.2. The effect of omega-3 polyunsaturated fatty acids and UVR on NAPE-PLD
and FAAH protein expression in HaCaT keratinocytes and 46BR.IN fibroblasts
................................................................................................................................. …..182
CHAPTER 5: Investigation the effect of ultraviolet radiation on
endocannabinoids and N-acylethanolamines in White Caucasians
of skin phototype II and South Asians of skin phototype V..... 186
5.1. Introduction ........................................................................... 186
5.2. Aim of the study .................................................................... 187
5.3. Materials and Methods ......................................................... 187
5.3.1. Statistical Analysis .......................................................................................... 187
5.4. Results ................................................................................... 187
5.4.1. Effect of UVR on serum endocannabinoids and N-acylethanolamines .. 187
5.4.1.1 Effect of UVR on serum palmitoylethanolamide .................................. 187
5.4.1.2. Effect of UVR on serum linoleoyalethanolamide ................................ 189
5.4.1.3. Effect of UVR on serum oleoylethanolamide ...................................... 190
5.4.1.4. Effect of UVR on serum stearoylethanolamide................................... 191
10
5.4.1.5. Effect of UVR on serum docosahexaenoylethanolamide ................. 192
5.4.1.6. Effect of UVR on serum N-arachidonoylethanolamide ...................... 193
5.4.1.7. Effect of UVR on serum 2-arachidonoyl glycerol ............................... 194
5.4.1.8. Effect of UVR on serum 1-arachidonoyl glycerol ............................... 196
5.4.1.9. Effect of UVR on docosapentaenoylethanolamide ............................ 197
5.4.1.10. Effect of UVR on serum Myristoylethanolamide ............................... 198
5.4.1.11. Effect of UVR on serum dihomo gamma linoleoyalethanolamide . 199
5.4.1.12. Effect of UVR on serum eicosapentaenoylethanolamide ............... 200
5.5. Discussion ............................................................................. 201
CHAPTER 6: General discussion and future studies ............... 204
6.1. Introduction ........................................................................... 204
6.2. General discussion ............................................................... 205
6.3. Future directions .................................................................. 209
References ................................................................................... 211
Appendices .................................................................................. 237
Appendix 1 ................................................................................... 237
1. Fatty acid stock solutions ..................................................................................... 237
1.1. Oleic Acid (OA) stock solution (50mM) ...................................................... 237
1.2. Eicosapentaenoic Acid (EPA) stock solution (50mM) .............................. 237
1.3. Docosahexaenoic Acid (DHA) stock solution (50mM) ............................. 237
Appendix 2 ................................................................................... 237
2.1. Preparation of BSA standards .......................................................................... 237
2.2. Genesis software (Version 2) ........................................................................... 238
2.3. Sample calculation for adjusting the protein content of the cell lysate ....... 238

11
Appendix 3 ................................................................................... 239
3.1 Preparation of buffers and stains ...................................................................... 239
3.1.1. Tank (running) buffer: (PH 8.4-8.5) 1 litre ............................................... 239
3.1.2. Transblotting buffer: (PH 8.4-8.5) 1 litre.................................................. 239
3.1.3. Lower (separating) gel Tris buffer (PH 8.8) - 0.5 litre ........................... 239
3.1.4. Upper (stacking) gel Tris buffer (PH 6.9) - 0.5 litre ............................... 240
3.1.5. Sample buffer 25 ml ................................................................................... 240
3.1.6. Coomassie blue stain for SDS ................................................................. 241
3.1.7. Destain for SDS .......................................................................................... 241
3.1.8. Fast green 0.1% for PVDF membrane .................................................... 241
3.1.9. ECL solution ................................................................................................ 241
Appendix 4 ................................................................................... 242
4.1. Membrane stripping ........................................................................................... 242
4.1.1. Mild stripping buffer .................................................................................... 242
4.2. Protocol of stripping western blots for re-probing .......................................... 242
Appendix 5 ................................................................................... 243
5.1. Chloroform/methanol (2:1 ratio) ....................................................................... 243
5.2. Internal standards (1 ng/µl AEA-d8 and 1 ng/µl 2-AG-d8) ........................... 243
5.3 Endocannabinoid cocktail for calibration line (400 pg/µl) .............................. 243
5.4. Mobile Phase A for endocannabinoid analysis .............................................. 244
5.5. Mobile Phase B for endocannabinoid analysis .............................................. 244
5.6. Seal wash ............................................................................................................ 244
5.7. Needle Wash ....................................................................................................... 245
5.8. Shutdown solution I ............................................................................................ 245
5.9. Shutdown solution II ........................................................................................... 245
Appendix 6 ................................................................................... 246
63232 words
12
LIST OF TABLES
Table 2.1: Composition of the sample buffer used for protein extraction. ..... 72
Table 2.2: Reagents used for the preparation of the acrylamide gel. .............. 75
Table 2.3: multiple reaction monitoring (MRM) transitions for the LC/ESI-MS/MS
assay of endocannabinoids and their congeners .............................. ………….85
Table 2.4: Guidelines for the generation of standards of different concentrations
to be used to construct an endocannabinoid calibration line ................... …..86
Table 2.5. Schematic pattern showing the time points of the UV radiation and
blood samples collection. ................................................................................... .88
Table 2.6. Sample Code: The highlighted days showing the days of UVR exposure
and/or the blood samples collection during the study……………….................88
Table 3.1. Summary of the significant findings in HaCaT keratinocytes cells and
their cell culture medium in response to DHA and/or UVR…………………….116
Table 3.2. Summary of the significant findings in HaCaT keratinocytes cells and
their cell culture medium in response to EPA and/or UVR……………………..117
Table 3.3. Summary of the significant findings in 46 BR.IN fibroblasts cells and
their cell culture medium in response to DHA and/or UVR……………………..139
Table 3.4. Summary of the significant findings in 46 BR.IN fibroblasts cells and
their cell culture medium in response to EPA and/or UVR……………………..140
Table 6.1. Comparison between palmitoylethanolamide levels in White
Caucasians of skin phototype II and South Asians of phototype V pre and post
UVR. .......................................................................................................... ……….246
Table 6.2. Comparison between linoleoyalethanolamide levels in White
Caucasians of skin phototype II and South Asians of phototype V pre and post
UVR. ..................................................................................................................... .246

13
Table 6.3. Comparison between oleoylethanolamide levels in White Caucasians
of skin phototype II and South Asians of phototype V pre and post UVR. ... 247
Table 6.4. Comparison between stearoylethanolamide levels in White
Caucasians of skin phototype II and South Asians of phototype V pre and post
UVR. ...................................................................................................................... 247
Table 6.5. Comparison between docosahexaenoylethanolamide levels in White
Caucasians of skin phototype II and South Asians of phototype V pre and post
UVR. ...................................................................................................................... 248
Table 6.6. Comparison between N-arachidonoylethanolamide levels in White
Caucasians of skin phototype II and South Asians of phototype V pre and post
UVR. ...................................................................................................................... 248
Table 6.7. Comparison between 2-arachidonoyl glycerol levels in White
Caucasians of skin phototype II and South Asians of phototype V pre and post
UVR. ...................................................................................................................... 249
Table 6.8. Comparison between 1-arachidonoyl glycerol levels in White
Caucasians of skin phototype II and South Asians of phototype V pre and post
UVR. ...................................................................................................................... 249
Table 6.9. Comparison between docosapentaenoylethanolamide levels in White
Caucasians of skin phototype II and South Asians of phototype V pre and post
UVR. ...................................................................................................................... 250
Table 6.10. Comparison between Myristoylethanolamide levels in White
Caucasians of skin phototype II and South Asians of phototype V pre and post
UVR. ...................................................................................................................... 250
Table 6.11. Comparison between dihomo gamma linoleoyalethanolamide levels
in White Caucasians of skin phototype II and South Asians of phototype V pre
and post UVR....................................................................................................... 250

14
Table 6.12. Comparison of different time point of UVR exposure on
eicosapentaenoylethanolamide levels in White Caucasians of skin phototype II.
.............................................................................................................................. 251

15
LIST OF FIGURES
Figure 1.1: Skin Structure .................................................................................... 28
Figure 1.2: Epidermal differentiation. ................................................................. 29
Figure 1.3: UV radiation spectrum ...................................................................... 38
Figure 1.4: Metabolism of n-3 and n-6 polyunsaturated fatty acids ................ 43
Figure 1.5: Chemical structures of the tetrahydrocannabinol, anandamide (AEA)
and 2-arachidonoyl glycerol (2-AG) .................................................................... 49
Figure 1.6: Schematic showing the variuos pathways of anandamide (AEA)
biosynthesis . ....................................................................................................... 52
Figure 1.7: Biosynthesis of 2-arachidonoyl glycerol (2-AG) ............................ 54
Figure 1.8: Catabolism of anandamide (AEA) and 2-arachidonoyl glycerol (2-
AG). ......................................................................................................................... 56
Figure 2.1. Side view of the haemocytometer slide........................................... 69
Figure 2.1. A. The haemocytometer chamber cell ............................................. 69
Figure 2.2: 96-wells microplate............................................................................ 73
Figure 2.3: Template showing how the samples were loaded into the 96-wells
microplate .............................................................................................................. 73
Figure 2.4: typical calibration line plotted from BSA standards ...................... 73
Figure 2.5: Schematic representation of western blotting and detection
procedure ............................................................................................................... 74
Figure 2.6: Protein denaturation using heat and SDS....................................... 76

16
Figure 2.7: Diagram showing the position of the blotting pads inside the blotting
module during the transblotting process ........................................................... 78
Figure 2.8: Diagram showing the position of PVDF membrane in the blotting
module. .................................................................................................................. 78
Figure 2.9: schematic summarizing the protein visualization process .......... 80
Figure 2.10: Optimization of COX-2 and GAPDH antibodies. ........................... 81
Figure 2.11: Optimization of 12-LOX (murine leukocyte) Polyclonal antiserum.
.............................................................................................................................. ..82
Figure 2.12: Philips HB588 cabinet ..................................................................... 89
Figure 2.13: Spectrophotometer.......................................................................... 90
Figure 3.1 Effect of oleic acid treatment on endocannabinoids and N-
acylethanolamines levels in HaCaT keratinocytes in response to UV radiation.
................................................................................................................................ 98
Figure 3.2 Effect of docosahexaenoic acid treatment on endocannabinoids and
N-acylethanolamines levels in HaCaT Keratinocytes in response to UV radiation.
.............................................................................................................................. 102
Figure 3.3 Effect of eicosapentaenoic acid treatment on endocannabinoids and
N-acylethanolamines levels in HaCaT Keratinocytes in response to UV radiation.
.............................................................................................................................. 106
Figure 3.4 Effect of oleic acid treatment on endocannabinoids and N-
acylethanolamines N-acylethanolamines levels in HaCaT keratinocytes culture
medium in response to UV radiation. ............................................................... 109
Figure 3.5 Effect of docosahexaenoic acid treatment on endocannabinoids and
N-acylethanolamines levels in HaCaT keratinocytes culture medium in response
to UV radiation..................................................................................................... 112

17
Figure 3.6 Effect of eicosapentaenoic acid treatment on endocannabinoids and
N-acylethanolamines levels in HaCaT keratinocytes culture medium in response
to UV radiation..................................................................................................... 115
Figure 3.7 Effect of oleic acid treatment on endocannabinoids and N-
acylethanolamines levels in 46BR.IN fibroblasts in response to UV radiation..
............................................................................................................................. .121
Figure 3.8 Effect of docosahexaenoic acid treatment on endocannabinoids and
N-acylethanolamines levels in 46BR.IN fibroblasts in response to UV radiation
.............................................................................................................................. 125
Figure 3.9 Effect of eicosapentaenoic acid treatment on endocannabinoids and
N-acylethanolamines levels in 46BR.IN fibroblasts in response to UV radiation
.............................................................................................................................. 129
Figure 3.10 Effect of oleic acid treatment on endocannabinoids and N-
acylethanolamines levels in 46BR.IN fibroblasts culture medium in response to
UV radiation. ........................................................................................................ 132
Figure 3.11 Effect of docosahexaenoic acid treatment on endocannabinoids and
N-acylethanolamines levels in 46BR.IN fibroblasts culture medium in response
to UV radiation..................................................................................................... 135
Figure 3.12 Effect of eicosapentaenoic acid treatment on endocannabinoids and
N-acylethanolamines levels in 46BR.IN fibroblasts culture medium in response
to UV radiation..................................................................................................... 138
Figure 4.1 COX-2 protein levels in docosahexaenoic acid and UVR treated
46BR.IN fibroblasts. (A) ...................................................................................... 152
Figure 4.2 COX-2 protein levels in docosahexaenoic acid and UVR treated
HaCaT Keratinocytes. ......................................................................................... 153

18
Figure 4.3 COX-2 protein levels in oleic acid and UVR treated in 46BR.IN
fibroblasts. ........................................................................................................... 155
Figure 4.4 COX-2 protein levels in oleic acid and UVR treated in HaCaT
Keratinocytes. ..................................................................................................... 156
Figure 4.5 COX-2 protein levels in eicosapentaenoic acid and UVR treated in
46BR.IN fibroblasts. ............................................................................................ 157
Figure 4.6 COX-2 protein levels in eicosapentaenoic acid and UVR treated in
HaCaT Keratinocytes. ......................................................................................... 158
Figure 4.7 12-LOX protein levels in oleic acid and UVR treated in in 46BR.IN
fibroblasts. ........................................................................................................... 160
Figure 4.8 12-LOX protein levels in docosahexaenoic acid and UVR treated in
46BR.IN fibroblasts. ............................................................................................ 161
Figure 4.9 12-LOX protein levels in oleic acid and UVR treated in HaCaT
keratinocytes. ...................................................................................................... 162
Figure 4.10: FAAH protein levels in oleic acid and UVR treated in HaCaT
Keratinocytes. ..................................................................................................... 165
Figure 4.11: NAPE-PLD protein levels in oleic acid and UVR treated in HaCaT
Keratinocytes. ..................................................................................................... 166
Figure 4.12: FAAH protein levels in eicosapentaenoic acid and UVR treated in
HaCaT Keratinocytes. ......................................................................................... 167
Figure 4.13: NAPE-PLD protein levels in eicosapentaenoic acid and UVR treated
in HaCaT Keratinocytes. ..................................................................................... 168
Figure 4.14: FAAH protein levels in docosahexaenoic acid and UVR treated in
HaCaT Keratinocytes. ......................................................................................... 169

19
Figure 4.15: NAPE-PLD protein levels in docosahexaenoic acid and UVR treated
in HaCaT Keratinocytes ...................................................................................... 170
Figure 4.16: FAAH protein levels in oleic acid and UVR treated in 46BR.IN
fibroblasts. ........................................................................................................... 173
Figure 4.17: NAPE-PLD protein levels in oleic acid and UVR treated in 46BR.IN
fibroblasts ............................................................................................................ 174
Figure 4.18: FAAH protein levels in eicosapentaenoic acid and UVR treated in
46BR.IN fibroblasts. ............................................................................................ 175
Figure 4.19: NAPE-PLD protein levels in eicosapentaenoic acid and UVR treated
in 46BR.IN fibroblasts. ........................................................................................ 176
Figure 4.20: FAAH protein levels in docosahexaenoic acid and UVR treated in
46BR.IN fibroblasts. ............................................................................................ 177
Figure 4.21: NAPE-PLD protein levels in docosahexaenoic acid and UVR treated
in 46BR.IN fibroblasts. ........................................................................................ 178
Figure 5.1. Palmitoylethanolamidelevels in serum before and after multiple UVR
exposures ............................................................................................................ 188
Figure 5.2. Linoleoyalethanolamide levels in serum before and after multiple
UVR exposures.................................................................................................... 189
Figure 5.3. Oleoylethanolamide levels in serum before and after multiple UVR
exposures.. .......................................................................................................... 190
Figure 5.4. Stearoylethanolamide levels in serum before and after multiple UVR
exposures ............................................................................................................ 191
Figure 5.5. Docosahxaenoylethanolamide levels in serum before and after
multiple UVR exposures. .................................................................................... 193
20
Figure 5.6. N-arachidonoylethanolamide levels in serum before and after
multiple UVR exposures.. ................................................................................... 194
Figure 5.7. 2-arachidonoyl glycerol levels in serum before and after multiple
UVR exposures.................................................................................................... 195
Figure 5.8. 1-arachidonoyl glycerol levels in serum before and after multiple
UVR exposures.................................................................................................... 196
Figure 5.9. Docosapentaenoylethanolamide levels in serum before and after
multiple UVR exposures. .................................................................................... 197
Figure 5.10. Myristoylethanolamide levels in serum before and after multiple
UVR exposures.................................................................................................... 198
Figure 5.11. Dihomo gamma linoleoyalethanolamide levels in serum before and
after multiple UVR exposures. ........................................................................... 199
Figure 5.12. Eicosapentaenoylethanolamide levels in serum before and after
multiple UVR exposures ..................................................................................... 200

21
LIST OF ABBREVIATIONS
1-AG 1-arachidonoyl-glycerol 2-AG 2-arachidonoyl-glycerol 2-AG-d8 2-Arachidonoyl glycerol-deuterium 8 2-AGMT 2-AG membrane transporter 46BR.1N Human fibroblast cell line AA Arachidonic acid AEA-d8 Anandamide-deuterium 8 ALA α-Linolenic acid AMT AEA membrane transporter APS Ammonium persulfate CB1 Cannabinoid receptor type-1 CB2 Cannabinoid receptor type-2 cDNA Complementary Deoxyribonucleic acid CHCl3 Chloroform COX-2 Cyclooxygenase-2 COXs Cyclooxygenases CPD Cyclobutane pyrimidine dimmers DAGL Diacylglycerol lipase DGLA Dihomo γ linolenic acid DGLEA Dihomo γ linolenoylethanolamide DHA Docosahexaenoic acid DHEA Docosahxaenoylethanolamide DHET Dihydroxyeicosatrienoic acid DMEM Dulbecco’s Modified Eagle Medium DMSO Dimethyl sulfoxide DNA Deoxyribonucleic acid DT Delayed tanning DTT Dithiothreitol ECACC European Collection of Cell Culture ECL Enhanced Chemilluminescent EDTA Ethylenediaminetetraacetic acid EPA Eicosapentaenoic acid EPEA Eicosapentaenoylethanolamide ES+ Positive ionization mode FAAH Fatty acid amide hydrolase FBS Foetal bovine serum FCS Foetal calf serum GAPDH Glyceraldehyde 3-phosphate dehydrogenase GLA γ linolenic acid GP-AEA Glycerophospho-arachidonoyl ethanolamide GPCR G-protein-coupled receptors HaCaT Human adult, calcium, temperature HBSS Hank’s Balanced Salt Solution HCl Hydrochloric acid HETE Hydroxy eicostetraeneic acid HODEs Hydroxyoctadecadienoicacids HPEPE Hydroperoxy eicosapentaenoic acid

22
HPETE Hydroperoxy eicosatetraenoic acid HRP Horseradish peroxide iPLA2 Independent cytosolic Ca2+ phospholipase A2 LA Linolenic acid LC-MS/MS Liquid chromatography tandem mass spectrometry LEA Linoleoylethanolamide LOXs Lipoxygenases LT Leukotriene LTA4 Leukotriene A4 LTB4 Leukotriene B4 LXA4 Lipoxin A4 LXB4 Lipoxin B4 Lyso-NAPE Lyso-N-arachidonoyl phosphatidylethanolamine Lyso-PA Lysophosphatidic acid Lyso-PLD Lysophospholipase D MAGL Monoacylglycerol lipase MAR Maresins MED Minimal erythema dose MEME Minimum essential medium eagle MeOH Methanol MRM Multiple reaction monitoring n -3 PUFA Omega -3 polyunsaturated fatty acid n -6 PUFA Omega 6 polyunsaturated fatty acid N2 Nitrogen NAAA N-acylethanolamine hydrolysing acid amidase NADA N-arachidonoyl-dopamine NAEs N-acylethanolamines NAPE N-arachidonoyl phosphatidylethanolamine NAPE-PLD N-acyl phosphatidylethanolamine phospholipase D NAT N-acyltransferase NHAK Normal human adult keratinocytes NHEKs Cultured normal human epidermal keratinocytes NO Nitric oxide OA Oleic acid OEA Oleoylethanolamide PA Phosphatidic acid PBS Phosphate buffered saline PC Phosphatidylcholine PDs Protectins PE Phosphatidylethanolamine PEA N-palmitoylethanolamide PG Prostaglandin PGDS Prostaglandin D synthases PGE2 Prostaglandin E2 PGES Prostaglandin E synthase PGFS prostaglandin F synthase PGG2 Prostaglandin G2 PGH2 Prostaglandin H2 PIC Protease inhibitor cocktail PL Phospholipase PLA2 Phospholipase A2 PLC Phospholipase C

23
PLD Phospholipase D PS Penicillin streptomycin PtdCho Phosphatidylcholine PtdIns Phosphatidylinositol PTPN22 Protein tyrosine phosphatase, non-receptor type 22 PVDF Plyvinylidene difluoride ROS Reactive oxygen species RvD D-series resolvins RvE E- resolvins series SDS Sodium dodecyl sulfate SDS-PAGE Sodium dodecyl sulfate-Polyacrylamide gel
electrophoresis SED Standard erythemal dose SPE Solid phase extraction sPLA2 Secretary phospholipases A2 STEA N-stearoylethanolamine TEMED Tetramethylenediamine THC Tetrahydrocannabinol TNF-α Tumor necrosis factor-alpha TRPV1 Transient receptor potential channel type V1 TXAS Thromboxane A synthase UCA Urocanic acid UVR Ultraviolet radiation Abhd 4 αβ-hydrolase 4

24
The University of Manchester
Abdalla F. Mohammed Almaedani
Doctor of Science (DSc)
Omega-3 polyunsaturated fatty acids and their impact upon the
biosynthesis of endocannabinoids and N-acylethanolamines in human skin
cells in the presence and absence of ultraviolet radiation.
March 2015
Abstract
Endocannabinoids are endogenous lipid mediators involved in various biological
processes, and have immunomodulatory and anti-inflammatory activities.
Anandamide (arachidonoyl ethanolamine, AEA) and 2-arachidonoyl glycerol
(2-AG) are the main representatives of this group. The endocannabinoid
receptors CB1 and CB2 with AEA have been found in human HaCaT
keratinocytes and fibroblasts, but the metabolic pathway leading to
endocannabinoid production in the skin has not been fully elucidated. This study
aimed to investigate the profile of endocannabinoids and their main metabolizing
enzymes in human skin cells and assess whether omega-3 polyunsaturated fatty
acids (n-3 PUFA) altered these profiles. In addition, an investigation was carried
out to check whether UV radiation could stimulate the production of
endocannabinoids and N-acylethanolamines (NAE) in human skin cells. For this
purpose HaCaT keratinocytes and 46RB.1N fibroblast cells were treated with 10
and 50µM of eicosapentaenoic acid (EPA), docosahexaenoic acid (DHA) or
oleic acid (OA) in the presence or absence of UVR (15mJ/cm2). Data suggest
that n-3 PUFA may both directly (by up-regulating NAPE-PLD levels) and
indirectly (by decreasing FAAH levels) increased endocannabinoid and NAE
levels in HaCaT keratinocytes and 46BR.IN fibroblasts. DHA treatment
significantly decreased COX-2 expression in the absence of UVR and inhibited
UVR-induced COX-2 overexpression in 46BR.IN fibroblasts. In contrast, DHA
appeared to induce COX-2 up-regulation in the absence of UVR and did not
prevent UVR induced COX-2 up-regulation in HaCaT keratinocytes. EPA
appeared to induce COX-2 down-regulation in the absence of UVR and did not
prevent UVR induced COX-2 up-regulation in both HaCaT keratinocytes and
46BR.IN fibroblasts. UVR did not have any significant effect on
endocannabinoid and NAE biosynthesis. However, UVR induced
endocannabinoid production in some experiments of this study. A clinical study
was carried on 16 volunteers from two different ethnic groups and two different
skin types. The purpose was to assess the effect of UVR on the serum
endocannabinoids and NAE, therefore, the volunteers were subjected to multiple
doses (1.3, SED/ 6 min) of UVR for 6 weeks. Data showed that UVR did not
have major effect on human serum NAE in both skin phototypes II and V but
increased 2-AG in human serum in both skin types but the more pronounced
effect was evident in skin phototypes V rather than in skin phototypes II. Human
serum docosahxaenoylethanolamide levels were found to be higher in White
Caucasians group (skin phototypes II). Based on these it can be concluded that
n-3 PUFA and UVR alter the endocannabinoids and NAE profile in HaCaT
keratinocytes and 46BR.IN fibroblasts. In addition, results of the clinical study
indicated that UVR has no major effects on serum endocannabinoids or NAE
therefore, further studies are required to address this question in vivo.

25
Declaration
I declare that no portion of the work referred to in the thesis has been submitted in
support of an application for another degree or qualification of this or any other university
or other institute of learning.
Copy right statement
i. The author of this thesis (including any appendices and/or schedules to this thesis)
owns certain copyright or related rights in it (the “Copyright”) and s/he has given The
University of Manchester certain rights to use such Copyright, including for
administrative purposes.
ii. Copies of this thesis, either in full or in extracts and whether in hard or electronic
copy, may be made only in accordance with the Copyright, Designs and Patents Act
1988 (as amended) and regulations issued under it or, where appropriate, in
accordance with licensing agreements which the University has from time to time. This
page must form part of any such copies made.
iii. The ownership of certain Copyright, patents, designs, trademarks and other
intellectual property (the “Intellectual Property”) and any reproductions of copyright
works in the thesis, for example graphs and tables (“Reproductions”), which may be
described in this thesis, may not be owned by the author and may be owned by third
parties. Such Intellectual Property and Reproductions cannot and must not be made
available for use without the prior written permission of the owner(s) of the relevant
Intellectual Property and/or Reproductions.
iv. Further information on the conditions under which disclosure, publication and
commercialisation of this thesis, the Copyright and any Intellectual Property and/or
Reproductions described in it may take place is available in the University IP Policy (see
http://documents.manchester.ac.uk/DocuInfo.aspx?DocID=487), in any relevant Thesis
restriction declarations deposited in the University Library, The University Library’s
regulations (see http://www.manchester.ac.uk/library/aboutus/regulations) and in The
University’s policy on Presentation of Theses.

26
Acknowledgement
First and foremost, I must acknowledge my limitless thanks to Allah, the Ever-
Magnificent; the Ever-Thankful, for His help and bless. I am totally sure that this work
would have never become truth, without His guidance.
I owe a deep gratitude to my supervisors who were more than generous with their
expertise and precious time. I would like to sincerely thank Prof. Anna Nicolaou, the
main supervisor and Dr. Costas Demonacos, the co-supervisor for their countless
hours of reflecting, reading, encouraging, and most of all patience throughout the entire
process. Also I would like to thank Dr. Steven Britland and Dr. Sobia Kauser for their
help and guidance through all the time they were engaged in this study.
I wish to thank Dr. Paula Urquhart and Dr. Alexandra Kendall for their willingness to
provide any assistance requested at any time during this research. Also, I would like to
express my thanks to Dr. Sharon Murphy, Dr. Naser Alaasswed, Dr. Naser Derbal and
Magdalena Kiezel and to all people who took part in making this thesis real. Also, I
would like to express my thanks to Manchester School of Pharmacy for giving me an
opportunity to complete this work. Special thanks goes to Dr. Jeffery Penny.
Finally I cannot end without conveying a deepest thanks my whole family especially my
wife Najah for her patience, support and for helping me in any possible way to
accomplish my degree.

27
This thesis is dedicated to my brother
Ibrahim for his endless support,
generosity and encouragement

28
CHAPTER 1: Introduction
1.1. Introduction to human skin biology
The skin is the largest organ of the body, it is forms the physical barrier that protect the
body from environmental stress and regulates water inward and outward (Hunter, 2003)
Skin also has a protection role against microorganisms, chemical agents and ultraviolet
radiation (Madison, 2003). Skin is composed of three structural layers including: the
epidermis, the dermis and the subcutaneous layer (Figure 1.1). Human skin also
contains various appendages including sebaceous glands, which secrete an oily or
waxy matter, called sebum, to lubricate and waterproof the skin and hair of mammals
(Hunter, 2003) . Sweat glands are found in almost every part of the skin and produce
sweat that works to maintain the homeostasis of the body. Widespread vasculature in
the dermis helps to regulate body temperature, to deliver oxygen and nutrients, and to
remove toxins and waste products (Hunter, 2003).
Figure 1.1. Skin Structure. Adapted from (www.MayoClinic.com), December, 2014
29
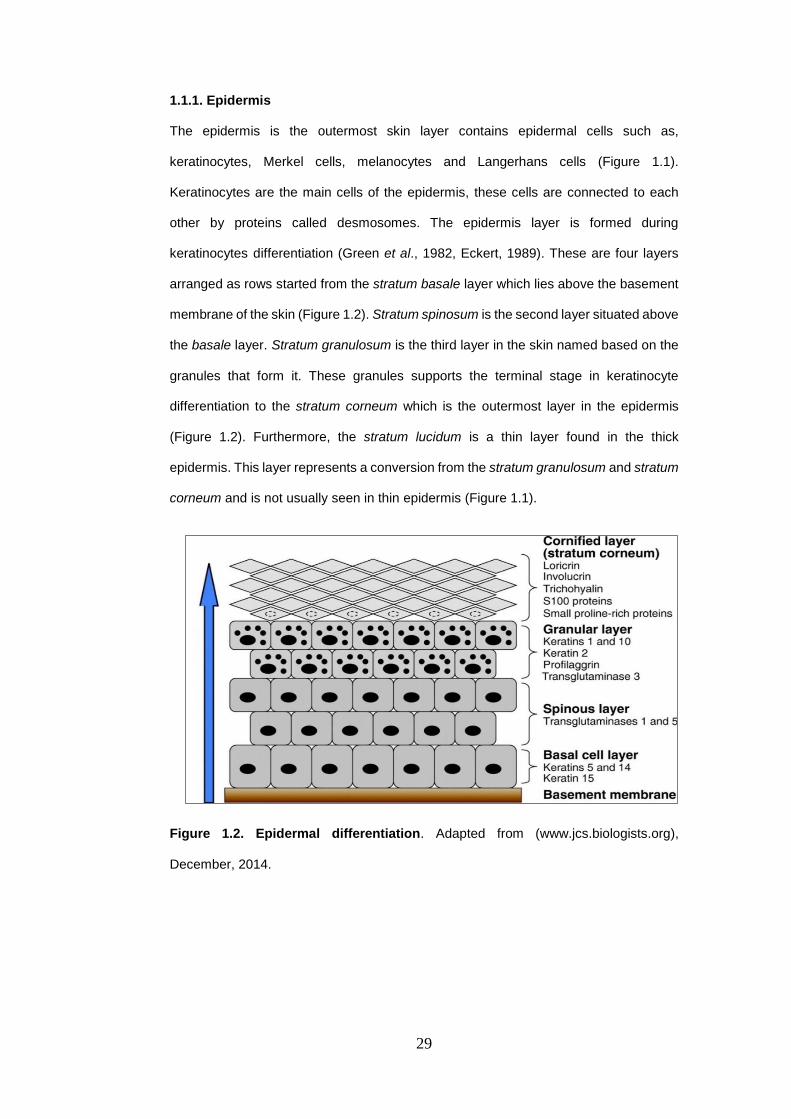
1.1.1. Epidermis
The epidermis is the outermost skin layer contains epidermal cells such as,
keratinocytes, Merkel cells, melanocytes and Langerhans cells (Figure 1.1).
Keratinocytes are the main cells of the epidermis, these cells are connected to each
other by proteins called desmosomes. The epidermis layer is formed during
keratinocytes differentiation (Green et al., 1982, Eckert, 1989). These are four layers
arranged as rows started from the stratum basale layer which lies above the basement
membrane of the skin (Figure 1.2). Stratum spinosum is the second layer situated above
the basale layer. Stratum granulosum is the third layer in the skin named based on the
granules that form it. These granules supports the terminal stage in keratinocyte
differentiation to the stratum corneum which is the outermost layer in the epidermis
(Figure 1.2). Furthermore, the stratum lucidum is a thin layer found in the thick
epidermis. This layer represents a conversion from the stratum granulosum and stratum
corneum and is not usually seen in thin epidermis (Figure 1.1).
Figure 1.2. Epidermal differentiation. Adapted from (www.jcs.biologists.org),
December, 2014.

30
1.1.1.1. Epidermal layers
1.1.1.1.1 Stratum basale
Stratum basale is the innermost layer of the epidermis (Figures 1.1 and 1.2), located
next to the dermis. Keratinocytes are the main cells in this layer where they are attached
to the basement membrane by hemidesmosomes (Heyden et al., 1992). This layer also
contains on another cells such as Langerhans, Merkel cells and melanocytes.
Melanocytes are responsible for melanin production. Melanin is a pigment that provides
protection against ultraviolet radiation (UVR) (Prota, 1997, Kobayashi et al., 1998a). It
is well known that the black skin is less susceptible to UVR than the white skin because
the distribution and rate of production of melanin is different in white and black skin
(reviewed in (Brenner and Hearing, 2008)).
1.1.1.1.2. Stratum spinosum
The stratum spinosum is found on top of the basal layer (Figures 1.1 and 1.2) and
consists of two to six rows of keratinocytes. Keratins produced by keratinocytes in this
layer are serves to form cytoplasmic protein termed tonofilaments (Mottaz and
Zelickson, 1975). This protein is required for the formation of the desmosomes that
connect the cell membranes of adjacent keratinocytes together. The continuation of
epidermal differentiation makes the cells in the upper layers of stratum spinosum to
become flat and long as step toward the stratum granulosum formation.
1.1.1.1.3. Stratum granulosum
Stratum granulosum is formed after the stratum spinosum layer during keratinocytes
differentiation (Figures 1.1 and 1.2.). Stratum granulosum is a thin layer in the epidermis
contains on protein called keratohyalin assists to bind the keratin filaments together. As
the keratinocytes continue in their differentiation, they lose the nuclei and organelles to
form non-viable corneocytes in the stratum corneum. Also, during this time
keratinocytes secrete lamellar granules that containing lipids and proteins into the

31
extracellular space to form hydrophobic lipid envelope works as the skin barrier
(Freinkel, 2001). Finally, the cornified cells are formed as the keratinocytes lose their
ability to differentiate in this layer (Ishida-Yamamoto and Iizuka, 1998).
1.1.1.1.4. Stratum corneum
Epidermal differentiation is end up with the formation of the stratum corneum layer
(Figures 1.1 and 1.2). The stratum corneum functions as a barrier to protect the skin
from environmental insults or any harmful substances or organisms. The stratum
corneum in addition regulates water loss from the body and the water plays an important
role in the integrity of stratum corneum barrier. The barrier nature of the stratum
corneum depends on the proteins and lipids in the lamellar bodies secreted from the
keratinocytes. According to Wilkes, (1973) the stratum corneum is composed of about
75-80% protein, 5-15% lipid (Wilkes et al., 1973). The protein is found in the
keratinocytes and it is about 70% alpha-keratin and 10% beta-keratin while, 5% is
proteinaceous cells envelop and the 15 % remaining are formed of enzymes and other
proteins. While, phospholipids do not exist in the stratum corneum layer (Lampe et al.,
1983), fatty acids, cholesterol, cholesterol sulfate and sterol/wax esters represents the
main lipids in this layer.
1.1.1.2. Epidermal cells
1.1.1.2.1. Keratinocytes
Keratinocytes are the major type of cell in the epidermis. They constitute approximately
95% of all cells found in the epidermis (Eckert, 1989) . In the stratum basale
keratinocytes exist as either stem cell-like cells i.e. they generate progeny by mitosis
some of which retain stem cell characteristics, or transiently amplifying cells i.e. they
replicate with a higher frequency than the stem cell-like keratinocytes but are only
capable of limited population doublings (Eckert, 1989). Once a keratinocyte becomes
fully committed to differentiation it will detach from the basement membrane,

32
differentiate and ultimately cease to proliferate as it migrates toward the skin surface,
where it will be sloughed off as a fully differentiated dead cornified cell (Figure 1.1)
(Eckert, 1989). As the keratinocyte migrates it expresses a progressive array of
different keratins, which are a family of tough and insoluble structural proteins that help
the skin protect from the external environment and help maintain its structure (Heyden
et al., 1992). Keratinocytes in the basale layer of the epidermis produce keratin type 5
and type 14 (Heyden et al., 1992) and throughout the epidermis they are joined to one
another by intercellular junctions known as desmosomes.
As the keratinocyte differentiate to the stratum spinosum layer its replicative potential is
reduced as its ability to produce keratin increases and its ability to produce different
types of keratin changes (Heyden et al., 1992). In addition to the production of keratin,
the keratinocytes also produce keratinosomes. At this stage of terminal differentiation
the keratinocytes mainly produce keratin types 1 and 10 (Heyden et al., 1992) (Figure
1.1.). Once the keratinocyte reaches the stratum granulosum it can no longer undergo
cell division and instead undergoes cornification (Eckert, 1989). Cornification is due to
the presence of keratohyalin granules and filaggrins (Candi et al., 2005). The epidermis
is between 5mm and 150mm thick (depending on body site) and as mentioned before,
it takes about 30 days for a keratinocyte to differentiate from the stratum basale to the
stratum corneum (Eckert, 1989). Calcium is required for a keratinocyte to differentiate
from the stratum spinosum and from the stratum granulosum to the stratum corneum
(Bikle, 2004), while protein kinase-C (PKC) is needed for the keratinocytes to
differentiate from the stratum spinosum to the stratum granulosum (Denning, 2004)
(Figure 1.1.). The intracellular concentration of calcium increases as keratinocytes
differentiate from the stratum basale to the stratum corneum, allowing the cells to
increase the number of their intracellular connections (Denda et al., 2003).
Keratinocytes have been reported to participate in immunological and inflammatory
processes (Forslind et al., 2004). It is well known that keratinocytes produce cytokines
such as interleukins (IL) and tumour necrosis factor-alpha (TNF-α), which modulate the
inflammatory response to UVR exposure (Tsatsanis et al., 2006). After UV radiation,
TNF-α and IL-1α are up-regulated in keratinocytes, activates NF-κB transcription factor.

33
This transcription factor controls expression of around 90 genes involved in
inflammation including cyclooxygenase-2 (COX-2) (Tsatsanis et al., 2006). In contrast,
UVR increases expression of the anti-inflammatory cytokine; interleukin-10 (IL-10)
which in turn decrease other pro-inflammatory cytokines such interleukin-1 (IL-1) and
interleukin-6 (IL-6) (Rivas and Ullrich, 1992).
1.1.1.2.1.1. Immortalized HaCaT keratinocytes
Life of normal human somatic cells is limited and their growth is ceased irreversibly after
certain number of divisions through a process called cellular senescence, or replicative
senescence. However, cellular immortality or unlimited proliferation can be induced
under culture conditions. Cellular immortality can be reproducibly induced by certain
DNA viruses such as simian virus 40, adenovirus types 5 and 12, and human papilloma
virus types 16, 18, 33 (Rhim et al., 1985, Rhim et al., 1986).
The HaCaT line is a spontaneously immortalized human keratinocyte cell line which
developed through long-term culture of normal human adult skin keratinocytes at
reduced calcium concentration and elevated temperature (Boukamp et al., 1985). It was
designated as HaCaT (Ha = human adult, Ca = calcium, T = temperature) to indicate
its origin and the initial culture conditions. Although, this cell lines has genetic
abnormalities, such as mutations in p53 (Lehman et al., 1993), it is still widely used and
important for many studies of skin biology and the pathogenesis of skin-related diseases.
1.1.1.2.2. Melanocytes
In addition to keratinocytes, the stratum basale contains other specialised cell types
such as the melanocytes (Figure 1.2.) (De Luca et al., 1988). Melanin pigment is
synthesized within the melanocytes and then transferred to surrounding keratinocytes
(Prota, 1997). Melanin absorbs ultraviolet light and protects skin from solar radiation
(Prota, 1997). In addition to its photoprotective role, epidermal melanin also regulates
cytokines activity where synthetic melanin was found to inhibit pro-inflammatory
cytokines include TNF, IL-6 and IL-10 (Mohagheghpour et al., 2000). Moreover, human
melanocytes serves as phagocytes against microorganisms (Le Poole et al., 1993).

34
Also, epidermal melanocytes were found to produce PGE2 under basal condition
(Nicolaou et al., 2004). Whereas, this eicosanoid was increased after UVB exposure
(Gledhill et al., 2010).
Two forms of melanin are found: eumelanin is the more common brown/black form,
whereas the less common phaeomelanin is red or yellow. Melanocytes make surface
contact with adjacent keratinocytes through dendritic connections, and this allows the
pigment granules to pass from the melanocytes to the keratinocytes (Kobayashi et al.,
1998b). Melanocyte presence appears to be inducible with chronic exposure to light
increasing the relative proportion of the pigment-forming cells within the basal layer.
There are equal numbers of melanocytes in a given body site in darker and lighter skin
types, but darker-skinned people have more active and efficient melanocytes (De Luca
et al., 1988).
1.1.1.2.3. Langerhans cells
Langerhans cells (LCs) are the main antigen presenting cells in the epidermis (Steinman
et al., 1995), and it has been reported to be involved in the skin’s immune responses
(Steinman et al., 1995). In addition, LCs reported to have a role in inflammatory
conditions (Kripke et al., 1990, Hemmi et al., 2001). LCs are also found within the
stratum basale (Figure 1.2) and in hair follicles (Steinman et al., 1995). They were
described in 1868 by Paul Langerhans and they are derived from bone marrow. They
are dendritic cells and through these processes connect to keratinocytes (Steinman et
al., 1995). Although LCs are not efficiently phagocytic, they may present the antigens
to lymphocytes in the lymph nodes (Steinman et al., 1995).
When compared to other membranes of the body, the skin comes into contact with many
potential antigens and hence the LCs play an important role in conditions such as
allergic contact dermatitis. As they are not linked to other cells by desmosomes, they
can move and migrate from the skin to the immune system (lymph nodes) (Kripke et al.,
1990). It is thought that they are able to internalise and process foreign antigens and
transport them to the skin lymph nodes where cutaneous immune responses are

35
initiated (Cumberbatch et al., 2003). Upon exposure to UVR, LCs migrate to the lymph
nodes where they are scavenge by cells of the immune system mainly Th cells for the
presence of antigen (Allan et al., 2006, Dandie et al., 2001). LCs migration and
maturation is mainly controlled by cytokines that are secreted by LCs end those
secreted by surrounding keratinocytes (Kripke et al., 1990, Griffiths et al., 2005).
1.1.1.2.4. Merkel cells
They are large cells found in low number in the stratum basale layer of the epidermis
(Sidhu et al., 2005) (Figure 1.2.). Merkel cells first described in 1875 by F. S. Merkel.
They are found in greatest numbers around the touch- sensitive sites of the body, such
as the lips and fingertips (Iggo and Muir, 1969). Merkel cells are associated with an
afferent nerve terminal, forming a structure known as a Merkel cell-neuron complex
(Saxod, 1996). Merkel cells also contain sensory receptors called merkel receptors
found in touch-sensitive areas of the skin surfaces such as hands and feet (Halata et
al., 2003).
1.1.2. Dermis
Dermis (Figure 1.2) is the second layer of the skin contains intensive connective tissues
and the dermal fibroblasts formed the majority in this layer (Fleischmajer et al., 1995).
It also contains lymphatic vessels, hair follicles, sebaceous, sweat glands sensory
neurones, motor neurons and a tough, supportive cell matrix (Wilkes et al., 1973, Sorrell
et al., 1996). Two layers comprise the dermis: thin papillary layer and thicker reticular
layer. The papillary dermis lies below and connects with the epidermis (Sorrell et al.,
1996). It contains thin loosely arranged collagen fibres, thick bundles of collagen run
parallel to the skin surface in the deeper reticular layer, which extends from the base of
the papillary layer to the subcutis tissue (Sorrell et al., 1996). Fibroblasts in this layer
produce collagen, elastin and structural proteoglycans, together with immunocompetent
mast cells and macrophages (Fleischmajer et al., 1993). Collagen fibres make up 70%
of the dermis provide its strength and toughness whereas elastin maintains normal

36
elasticity and flexibility and proteoglycans provide viscosity and hydration (Sorrell et al.,
1996).
1.1.2.1. Dermal cells
1.1.2.1.1. Fibroblasts
The presence of dermal fibroblasts within the dermal tissues is vital, as dermal
fibroblasts are responsible for the production and structuring of extracellular matrix
components, or ECM, within the skin (Ross et al., 1970). Further, dermal fibroblasts
communicate among themselves and with different cells to regulate the physiology of
the skin (Ross et al., 1970). Dermal fibroblasts constantly produce substances which
are then used to make up ECM, including various types of collagen; fibronectin and
types of elastin, integrin, proteoglycan and laminin, thus supporting the connective
tissues in the skin (Ross et al., 1970, Fleischmajer et al., 1993, Sorrell et al., 1996). Due
to this function, the dermal fibroblast is viewed as a central element in recovery from
wounds (Ross et al., 1970). Dermal fibroblasts are found both in the reticular dermis
and papillary dermis, and culturing these two subgroups has revealed variation in the
features of each (Azzarone and Macieira-Coelho, 1982, Schafer et al., 1985, Sorrell et
al., 1996, Sorrell et al., 2004).
The area available for molecules which display solubility to be transferred to the
epidermal layer, as well as for the occurrence of epithelial–mesenchymal interaction is
expanded by a large degree by the dermal papillae epidermis (Schafer et al., 1985,
Sorrell et al., 1996). The dermal reticular layer is located between the superficial and
the deep vascular plexi, and separates the hypodermis and dermis (Azzarone and
Macieira-Coelho, 1982, Schafer et al., 1985). The reticular dermis is penetrated by hair
follicles as well as the cells of the dermis with which they are linked, which frequently
end within the adipocyte-rich hypodermal layer (Azzarone and Macieira-Coelho, 1982).
Division takes place at greater pace in papillary fibroblasts compared with their reticular
counterparts (Azzarone and Macieira-Coelho, 1982, Schafer et al., 1985, Sorrell et al.,
1996, Sorrell et al., 2004). Biological study concerning the skin frequently utilises
46BR.IN fibroblasts, and are produced for this end by taking them from a subject who

37
has hypo-gammaglobulinemia before immortalizing them via plasmid pSV3neo,
transfection to express the T-antigen SV40, as described by Arlett et al. (1988).
The skin’s epidermal layer is bound with the dermis beneath through means of a
basement membrane composed of multiple molecules structured in a complex manner
(Burgeson and Christiano, 1997, Aumailley and Rousselle, 1999). Fibroblasts and
keratinocytes work together to create this membrane, which is distinguishable from
other tissues of the skin (Fleischmajer et al., 1993, Marinkovich et al., 1993, Smola et
al., 1998, Moulin et al., 2000). At the dermal-epidermal junction or DEJ, collagens IV
and VII are excreted from keratinocytes and fibroblasts, while laminin-1 and laminin-5
are excreted from fibroblasts and keratinocytes respectively, to form a linear array
(Marinkovich et al., 1993).
1.1.2.1.2. Mast cells
The mast cells of the skin lie deeper within the tissues, being found in the dermis, where
they are grouped around blood vessels and nerves (Eady et al., 1979). Mast cells have
an important role in inflammatory and allergic reactions such as allergic dermatitis, and
they secrete bioactive mediators such as histamine, cytokines and eicosanoids such as
prostaglandin D2 (PGD2) (Dawicki and Marshall, 2007, Wedemeyer et al., 2000). In
addition they have been reported to control local blood flow and angiogenesis (Marks
et al., 1986). These cells are affected by UVR which induces mast cells migration from
skin to draining lymph nodes (Byrne et al., 2008).
1.1.2.1.3. Subcutaneous layer
The subcutaneous tissue (Figure 1.2) is the layer between the dermis and the fascia
(Cross and Roberts, 1993). The fat tissue acts to preserve neutral fat, cushion against
external physical pressure, retain moisture and generate heat (Cross and Roberts,
1993). The subcutaneous tissue is largely composed of fat cells, accumulated fat cells
separated by the connective fibroid fat septum are called fat lobules (Wilkes et al.,

38
1973). Fibre bundles produced in the dermis and firmly connected with the fascia and
periostea through the subcutaneous tissue are found throughout this region (Cross and
Roberts, 1993). These fibre bundles are called retinaculae cutis, and they strengthen
the connection between the dermis and deeper tissues (Cross and Roberts, 1993).
1.2. Ultraviolet radiation and its effects on cells
The wavelength of the sunlight radiation is divided into three main regions of
wavelengths (Figure 1.3). Ultraviolet (UV), visible, and infrared. UV radiation includes
the wavelengths from 200 to 400 nm, these wavelengths are just shorter than those of
visible light (400-700 nm). It is then characterized further UVA (315-400 nm), UVB (280-
315 nm) and UVC (100-280 nm) reviewed in (Matsumura and Ananthaswamy, 2004).
UVC from sunlight is virtually completely screened out by the earth's atmosphere ozone
layer. UV light is essential for normal skin health and a suitable dose of UVB radiation
(280–320 nm) is necessary for processes including synthesis of vitamin D synthesis in
the skin. However, UVR has also harmful effects on skin cells, these effects will be
discussed in more details below.
Figure 1.3: UV radiation spectrum (Adapted from www.globalspec.com) December
2014.

39
1.2.1. Effects of ultraviolet radiation on human skin
Excessive UV radiation penetrates the epidermis and dermis and interferes with normal
skin function, causing a number of health disorders. UVB is the most harmful type of
UVR, it has been reported to be responsible for erythema (sunburn), which is the visual
effect of UVR on the skin, usually characterised by dilatation of the dermal blood vessels
and then increases the blood flow, consequently leading to skin redness (Diffey, 1991).
This is apparent from about 4 hours after exposure and is maximal at about 24 hours
(Young et al., 1996, Rhodes et al., 2009). An immediate tan is produced at between 5
and 10 minutes of the skin being exposed to ultraviolet radiation, and this type of tan
fades after twelve hours. By contrast, a delayed tan appears as the result of melanin
excreted by stimulated melanocytes and may last from several weeks to several months
(Diffey, 1991). Erythemal reactions vary based on the amount of UV radiation exposure,
the spectrum within which it is emitted and the individuals’ skin. Potential for burning
from sun exposure is frequently measured through observing the subject’s minimal
erythema dose or MED. In addition, multiple-occasion UVR exposure can lead to
epidermal hyperplasia causing the cells of the epidermis to hyperproliferate and this
layer to thicken. At between 1 and 3 weeks, the stratum corneum becomes three times
thicker, and at 7 weeks, may be up to 7 times as thick as originally. However, between
4 and 8 weeks after sun exposure ends, thickening is completely reversed. The thicker
skin produced with frequent ultraviolet exposure protects against damage from that
further exposure (Diffey, 1991, Soter, 1990).
For certain instances, burning from sun exposure is linked to skin alterations, which may
include for example the presence in the dermis of inflammatory cells (Gilchrest et al.,
1983, Hawk et al., 1988) the occurrence of the protein p53 (Burren et al., 1998), and
the presence of burned apoptotic cells in the epidermal layer (Sheehan and Young,
2002). Further, skin which was exposed to UVB radiation could display
immunosuppression (Novakovic et al., 2001) as well as melanogenesis (Sheehan et al.,
1998, Sheehan et al., 2002). In general, two pathways have been proposed for damage
caused by cytotoxicity disrupting cells’ regular functioning and linking UVB exposure to
carcinogenesis in the skin’s tissues. Exposure to UVB can produce damage directly

40
incurred by DNA through the forming of atypical covalent bonds joining pyrimidine bases
next to each other within molecules of DNA in an excited state (Young et al., 1998).
Where these anomalies are not destroyed via the pathway for nucleotide excision repair
prior to the DNA being further replicated (Young et al., 1996, Bykov et al., 1999, Budden
and Bowden, 2013), they disturb base pairs, and produce mutations which cause
melanomagenesis (Budden and Bowden, 2013).
Secondly, UVB exposure produces oxidative stress for normal cells within the skin,
through leading to production of reactive oxygen species (ROS) (Lee et al., 2013a),
which cause harm to structural elements within cells, such as to membranes, lipids,
DNA and proteins (Waster and Ollinger, 2009). The eventual result of this includes
photoaging (Pillai et al., 2005) and photodamage (Marrot and Meunier, 2008), as well
as photocarcinogenesis (Halliday, 2005).
Similar to UVB, UVA can also cause DNA damage primarily through the generation of
ROS (Kvam and Tyrrell, 1997). However, UVA and UVB have been found to stimulate
the production of melanin and induce apoptosis of melanocytes and keratinocytes an
effect that has been recognised as a protective mechanism in the skin (Bowen et al.,
2003). UVB radiation is mostly absorbed by the epidermis and upper dermis whereas,
UVA, with its longer wavelength can penetrate deeper through the epidermis to reach
the dermis (Costin and Hearing, 2007).
1.3. Omega-3 polyunsaturated fatty acids
Any fatty acid composed with over three or more double bonds is known as a
polyunsaturated fatty acid, PUFA, or long-chain polyunsaturated fatty acid, and includes
more than 17 atoms of carbon. For omega-3 polyunsaturated fatty acids, the omega (n)
element of the name represents the methyl terminal, while 3 denotes the position of the
final double-bond at the same end. There are 2 principal omega-3 polyunsaturated fatty
acids, namely C22:6 n-3 docosahexaenoic acid or DHA, and C20:5 n-3
eicosapentaenoic acid or EPA. These are generally contained in the diet through oils
from fish: for example from salmon, sardine or mackerel and sardines. Meanwhile, C18
41
n-3 PUFA α-linolenic acid or ALA, which is the parent to omega-3, can be obtained from
oils of vegetal origin and humans can use this to synthesise both DHA and EPA. The
advantages of these fatty acids for health are considered various (Wall et al., 2010).
Research suggests that omega-3 PUFA enhance the health of the heart and circulatory
system (De Caterina, 2011) as well as improving rheumatoid disorders (Bhangle and
Kolasinski, 2011). Further, recent research suggests an effect of these fatty acids
against cancer: specifically in combatting colorectal cancers or CRCs (CRC) (Cockbain
et al., 2012).
Polyunsaturated fatty acids act in the regulation of a variety of processes, such as
clotting of the blood and blood pressure, as well as nervous and brain development and
function (Das, 2006). Further, these fatty acids are an element in inflammation response
regulation via the creation of eicosanoids, which are powerful in terms of their mediating
function (Das, 2006, Calder, 2006). Neither linoleic acid (LA, C18:2n-6), which is used
in building n-6 UPFA, nor α-linolenic acid (ALA, C18:3n-3), which is necessary to create
omega-3 polyunsaturated fatty acids, can be produced in humans, and thus must be
provided by dietary means (Burr and Burr, 1929).
1.3.1. Metabolism of essential fatty acids in human skin
In 1929 Burr and Burr stated that there are two fatty acids that cannot be produced by
mammalian cells. These are Linoleic acid (LA; 18; 2n-6) and α-linolenic acid (ALA; 18:
3n-3), thus, termed essential fatty acids (Burr and Burr, 1929). LA is found in plant oils
such as sunflower, safflower, and corn oils, cereals, animal fat, and wholegrain bread,
while ALA is abundant in green leafy vegetables, flaxseed, and rapeseed oils. Although
mammalian cells cannot synthesize LA and ALA, they can metabolize them into more
physiologically active compounds by the introduction of further double bonds
(desaturation) via Δ5 and Δ6 desaturases, and by lengthening the acyl chain
(elongation) via elongases (Figure 1.4). LA has been demonstrated to be the most
abundant PUFA in human skin (Chapkin et al., 1986, Wertz, 1992). LA has reported to
play a role in the epidermal water barrier function (Hansen and Jensen, 1985). LA also
42
undergoes metabolism to produce different metabolites, for example, incubation of 15-
lipoxygenase (15-LOX) prepared from skin epidermis, metabolizes LA to 13-
hydroxyoctadecadienoic acid (13-HODE) which is the major metabolite of LA in the
epidermis (Ziboh et al., 2000). Elongation and desaturation of LA and ALA produces
eicosapentaenoic acid (EPA; 20: 5n-3), arachidonic acid (AA; 20: 4n-6), and
docosahexaenoic acid (DHA; 22: 6n-3). Elongation of gamma-linolenic acid (GLA; 18:
3n-6) forms dihomo-gamma-linolenic acid (DGLA; 20: 3n-6). At high concentrations
DGLA is metabolized by epidermal cyclooxygenases (COX) into prostaglandins of 1-
series such as PGE1 and also by 15-LOX to 15-hydroxyeicosatrienoic acids such as 15-
HETrE (Ziboh et al., 2000). However, EPA and DHA have also been shown to be
metabolized by epidermal 15-LOX to predominantly monohydroxylated metabolites
such as 15-hydroxyeicosapentaenoic acid (15-HEPE) and 17-hydroxydocosahexaenoic
acid (17-HoDHE) respectively (Miller et al., 1990, Miller et al., 1991). The n-6 PUFA AA
represents about 9% of the total fatty acids in humans skin (Vroman et al., 1969). AA
metabolised in the epidermis by the COX pathway to produce different types of
prostaglandins (PGs) such as PGE2, PGF2α and PGD2 (Vroman et al., 1969). Also, AA
metabolised by 15-LOX to generate 15-hydoxyeicosatetraenoic acid (15-HETE) (Ziboh
et al., 2000). In contrast, 5-LOX activity in the epidermis has reported to be insufficient
to transform AA to leukotriene (LTB4) (Iversen et al., 1993). Finally, it is well documented
how the essential fatty acids are important in the epidermis, thus any deficiency of them
will have an effect on skin health (Hansen and Jensen, 1985).

43
Figure 1.4: Metabolism of omega-9, 6 and 3 fatty acids. Adapted from (Wall et al.,
2010). The essential fatty acids Linoleic and alpha-Linolenic acids are not synthesized
by mammalian cells and need to be obtained through diet.

44
1.3.2. Polyunsaturated fatty acids and impact upon eicosanoids production
The eicosanoid group encompasses prostaglandins or PG, leukotrienes or LI,
prostacyclin or PGI2 and thromboxanes or TX. These find their precursor in 20-carbon
PUFA; principally AA. They are significant in mediating and regulating functions for
inflammatory processes (Tilley et al., 2001), and in modulation of inflammation as a
response in terms of length of time for which inflammation persists, and how strong
these processes are (Tilley et al., 2001, Kinsella et al., 1990). Despite this importance,
generally, the impact physiologically which follows inflammation is based upon which
cells are located in that area, how the response is caused, timing for production of
eicosanoids and numbers of the various eicosanoids as related to the area involved, as
well as how sensitive the region is where the eicosanoids are produced is at tissue and
cellular level (Calder, 2008). Polyunsaturated fatty acids of the n-3 and n-6 varieties
compete PUFA in generating eicosanoids via COX enzymes and LOX enzymes:
however, as inflammatory cells generally have a significant percentage of AA, this
generally forms the principal substrate in synthesising eicosanoids (Calder, 2001,
Simopoulos, 2002). Within the membranes of cells, phospholipases release AA, and in
particular phospholipase A2 with free AA thereafter providing substrates for LOX and
COX. As COX metabolises AA, 2-series PGs as well as 2-series thromboxanes or TXs
are produced. Significant quantities of prostaglandin F2α (PGF2α) and prostaglandin E2
(PGE2) are generated by monocytes and macrophages, while some PGE2 is created by
neutrophils and prostaglandin D2 or PGD2 is generated by mast cells.
When AA is metabolised via the 5-LOX path, this leads to production of derivative of
hydroxy hydroperoxy. These include 5-HPETE and 5-HETE, as well as 4-series LTs
and, leukotrienes A4 (LTA4), B4 (LTB4), C4 (LTC4), D4 (LTD4) and E4 (LTE4). LTB4 is
generated by monocytes, neutrophils and macrophages. Meanwhile, mast cells,
eosinophils and basophils generate LTC4, LTE4 and LTD4. The Arachidonic acid gives
the basis for so-called proinflammatory eicosanoids (Bagga et al., 2003), which include
interleukin-6 (IL-6) as generated by macrophage cells in response to PGE2, and the
functions of which include dilation of vascular channels and generation of pain (Tilley et
al., 2001, Bagga et al., 2003). Neutrophils meanwhile can be activated by LTB4, which

45
also impacts leukocytes by acting strongly as a chemotactic agent, as well as
stimulating macrophage generation of cytokines involved in inflammation including
tumour necrosis factor alpha, or TNFα, IL-1 beta, or IL-1β and IL-6 (Tilley et al., 2001).
While the status of proinflammatory mediator is frequently applied to eicosanoids
derived from AA however, these substances are also significant in modulation of
immune responses because of their ability to interact with leukocytes in a manner which
displays considerable complexity the initial inflammatory processes (Tilley et al., 2001,
Simopoulos, 2002). Despite these benefits, where such substances are present in
excess, the tissue local to their production may be harmed and conditions involving
inappropriate inflammatory response, as well as thrombosis, are partially caused by this
mechanism (Simopoulos, 2003).
LOX metabolises DHA to produce docosanoids, as well as resolvins (Hong et al., 2003).
Resolvins have a mediatory function, act locally and are endogenous: they act against
inflammation and help to regulate immune response (Serhan et al., 2002, Serhan et al.,
2007, Schwab et al., 2007). As concerns the cell, functions encompass reduction in
neutrophils infiltrating as well as regulating reactive oxygen species and the cytokine-
chemokine axis, and effecting reduction in inflammation-response (Serhan et al., 2000,
Serhan et al., 2002).
Both LOX and COX metabolise EPA, creating disparate eicosanoid groups, namely
HEPE, 3-series TXs and TXs, and 5-series LTs. As contrasted with AA-derived
eicosanoids, those of EPA may not be so, or may act against inflammation (Bagga et
al., 2003, Robinson and Stone, 2006). Variation in inflammatory effect between AA- and
EPA-derived eicosanoids is exemplified by LTB4 in comparison with LTB5. LTB4 is
stronger in producing inflammatory response than LTB5, due to its action as a
chemotactic agent for neutrophils, which is greater by a factor of between 10 and 100
(Goldman et al., 1983, Lee et al., 1984). In addition, resolvin E1, which derives from
EPA, is protective against colitis, as evidenced by studies of animals (Weylandt et al.,
2007). Further, PGE2 is described in the literature as more powerful in inducing
macrophage IL-6 generation in comparison with PGE3 (Bagga et al., 2003). Greater
amounts of n-3 PUFA, including DHA and EPA ingested leads to increased
46
concentration of these substances within inflammatory cell membranes, as reported by
Endres et al. (1989) and Yaqoob et al. (2000). Both DHA and EPA make up
inflammatory cells in humans in dose-response relation to their intake (Healy et al.,
2000, Rees et al., 2006) with this make-up able to reduce AA to some extent.
1.3.3. Omega-3 PUFA and inflammatory gene expression
In addition to their effects on the eicosanoids, n-3 PUFA exert their anti-inflammatory
effect by changing the inflammatory gene expression through their effects on
transcription factors such as NFκB and peroxisome proliferator-activated receptors
(PPARs) (Calder, 2006, Calder, 2002). NFκB is a transcription factor that plays an
important role in various inflammatory signalling pathways. It controls several cytokines
such as IL-1, IL-2, IL-6, IL-12, TNF-α, chemokines like IL-8, monocyte chemoattractant
protein-1, adhesion molecules and inducible enzymes such as the inducible nitric oxide
synthase (iNOS) and COX-2 (Ghosh and Karin, 2002). EPA has been shown to block
the activity of NFκB through decreased degradation of the inhibitory subunit of NFκB,
IκB, in cultured pancreatic cells and human monocytes (Lo et al., 1999, Novak et al.,
2003, Zhao et al., 2004).This has also been supported by the finding that transgenic
mice that endogenously biosynthesize n-3 PUFAs from n-6 PUFAs are protected from
colitis through a decrease in NFκB activity (Hudert et al., 2006).
PPARs are ligand-activated nuclear transcription factors that play important roles in
cellular differentiation, cancer, inflammation, insulin sensitization, atherosclerosis and
several metabolic diseases (Chawla et al., 2001). Ligands for PPARs are PUFAs,
especially those of the n-3 family and their eicosanoid derivatives (Kota et al., 2005).
When activated, PPARs bind to the PPAR-response element and repress or induce the
transcription of target genes. PPARs have been shown to inhibit NFκB and therefore
play an important role in several inflammatory processes (Poynter and Daynes, 1998,
Ricote et al., 1999). EPA and DHA for instance inhibit lipopolysaccharide-induced
activation of NFκB via a PPAR-γ-dependent pathway in human kidney-2 cells (HK-2) (Li
et al., 2005).

47
1.3.4. The protective effect of n-3 PUFA in UVR induced skin inflammation
The harmful effects of UVR in the skin, include acute effects such as erythema,
inflammatory and immune modulatory changes (Young, 2006). Chronic effects
eventually lead to photoaging and photocarcinogenesis (Taylor et al., 1990). Although,
there are some strategies to protect against UVR-induced skin damage such as topical
sunscreens (Rhodes, 1998), these strategies have been found to be inadequate. The
n-3 PUFA, EPA and DHA are considered as a dietary component with a promising
photoprotective effect against the deleterious effects of UVR. They are mainly present
in fish oil, and have been shown to have a protective effect against photocarcinogenesis
in mice (Black et al., 1992). Supplementation with fish oil also reduces UVB-erythemal
sensitivity in humans (Rhodes et al., 1994), by inhibition of UVB-induced PGE2 levels in
the skin (Rhodes et al., 1995). Additionally, n-3 PUFA have been reported to improve
some inflammatory diseases, including psoriasis (Mayser et al., 1998) and rheumatoid
arthritis (Kremer, 2000), and can inhibit tumor formation (De Vries and van Noorden,
1992).
1.4. The endocannabinoid system
The major psychotropic component of the cannabis sativa plant, Δ9-
tetrahydrocannabinol (THC) was discovered in 1964 (Gaoni and Mechoulam, 1964).
After more than 20 years the first THC receptor was identified in the mammalian brain
and named cannabinoid receptor type-1 (CB1) (Devane et al., 1988). Two years later
and then the second G-protein-coupled receptor (CB2) was cloned (Matsuda et al.,
1990). Whilst CB1 was shown to be extremely abundant in the brain, and hence
suggested to be responsible for THC psychoactivity, CB2 was expressed in its highest
levels in immune cells. The cloning of the cannabinoid receptors opened the way for
more research to identify endogenous lipid ligands termed endocannabinoids. The first
endocannabinoid to be discovered was N-arachidonoyl ethanolamide (AEA,
anandamide) (Devane et al., 1992), soon after that followed by the detection of the 2-
arachidonoyl-glycerol (2-AG) which shows high affinity for CB1 and CB2 receptors
(Mechoulam et al., 1995, Sugiura et al., 1995). Furthermore, more endocannabinoids

48
have been found in the last decade, including 2-arachidonyl-glycerol ether (noladin
ether) (Hanus et al., 2001), N-arachidonoyl-dopamine (NADA) (Bisogno et al., 2000)
and virodhamine (Porter et al., 2002). However, their pharmacological activity and
metabolism has not yet been thoroughly investigated. Therefore, the N-
acylethanolamine anandamide and the monoacylglycerols 2-AG are still the most
studied endocannabinoids (Figure 1.5).
The endocannabinoids exert their biological functions by binding to or activating CB1
and CB2 receptors (Howlett et al., 2002). However, they may have different responses
for example, AEA behaves as a partial agonist at both CB1 and CB2 receptors, but has
higher affinity for the CB1 receptor (Howlett et al., 2002). Thus, AEA has been reported
to have the same pharmacological functions to cannabinoids such as Δ9-THC, by
activating the CB1 receptors in the brain (Smith et al., 1994). In addition, AEA shows
potent immunomodulatory and anti-inflammatory activities by interacting peripherally
with CB receptors (Stefano et al., 1996).
AEA is transported into cells by the AEA membrane transporter (AMT) and its action is
terminated by the enzyme fatty acid amide hydrolase (FAAH). Whereas, 2-AG uptake
occurs through the 2-AG membrane transporter (2-AGMT) (Hermann et al., 2006), 2-
AG can be hydrolysed by FAAH but the main enzyme responsible for 2-AG degradation
is monoacylglycerol lipase (MAGL) (Cravatt et al., 1996, Dinh et al., 2002).

49
Figure 1.5: Chemical structures of the Δ9-tetrahydrocannabinol (THC), N-
arachidonoylethanolamine (AEA) and 2-arachidonoyl glycerol (2-AG). Adapted
from (Bari et al., 2011).
1.4.1. Biosynthesis of N-arachidonoylethanolamide (AEA, anandamide)
Anandamide or AEA is produced from membrane phospholipids, having the precursor
N-arachidonoyl phosphatidylethanolamine or NAPE. These phospholipid undergo
hydrolysis and form AEA via an enzyme: N-acyl phosphatidylethanolamine
phospholipase D (NAPE-PLD) as shown in Figure 1.6 (Di Marzo et al., 1994, Guo et al.,
2005). This may be simplistic however, since synthesis of AEA appears to encompass
a variety of pathways, including AEA produced independently from NAPE-PLD, as
concentrations of the end substance were unaffected by knockout of NAPE-PLD in a
study involving mice (Liu et al., 2006). Studies in mice also revealed NAPE-AEA
conversion from NAPE-PLD (Leung et al., 2006).

50
1.4.1.1. N-acyltransferases
AA gives the derivative AEA as ethanolamine, derivatives of N-acylethanolamine (NAE)
produced from metabolising different fatty acids and include a large number with
endocannabinoid functions, this includes DHEA. In biosynthesising NAE, initially
phosphatidylethanolamines (PE) are N-acylated to created ethanolamine phospholipids
which are N-acylated, including NAPE regulated via the Ca2+ dependent N-
acyltransferase or NAT (Hansen et al., 2000, Cadas et al., 1997, Jin et al., 2007).
Phosphatidylcholine (PC), 1-acyl-lyso-PtdCho and PE are utilised by NAT to form
donors in terms of substrate, while the enzyme selects acyl groups from these located
at sn-1 for extraction.
1.4.1.2. N-acyl phosphatidylethanolamine phospholipase D
N-acyl phosphatidylethanolamine-phospholipase D, or NAPE-PLD is a member of the
zinc metallohydrolase group from the β-lactamase, being separate in functional and
structural terms from PLD enzymes generating phosphatidic acid or PA by hydrolysing
glycerophospholipids, including PC, which acts between cells as a signalling molecule
(Liscovitch et al., 2000, Okamoto et al., 2004). The principle pathway for synthesising
AEA as well as various NAEs is NAPE-PLD (Schmid, 2000, Hansen et al., 2000, Schmid
and Berdyshev, 2002, Nakane et al., 2002). NAE being released from NAPE via NAPE-
PLD forms stage two in the process of synthesising NAE (Okamoto et al., 2007). It is
suggested that zinc is a component of NAPE-PLD which is vital to catalysis, while
purified recombinant enzyme correlates specifically to NAPE, is virtually non-reactive
when considering significant glycerophospholipids including PE and PC (Wang et al.,
2006). From animal tissue, there is only one enzyme which controls direct generation
of NAE as released by NAPE: NAPE-PLD. In terms of regulating transcripts, the Sp1
transcription factor is identified as contributing to baseline expression of NAPE-PLD in
a regulatory capacity (Zhu et al., 2011).
51
1.4.1.3. Alternate pathways for anandamide biosynthesis
A range of enzymes are identified as having roles in biosynthesising AEA, such as
secretory phospholipase A2 or sPLA2. This functions to hydrolyse NAPE, forming N-
arachidonoyl lysophosphatidylethanolamine or lyso-NAPE, and this is capable of
hydrolysation via lysophospholipase D (lyso-PLD), giving AEA independently of Ca2+
(see Figure 1.6) (Sun et al., 2004). Furthermore, αβ-hydrolase 4 or Abhd 4 may be
capable of affecting lyso-NAPE or NAPE and thus creating glycerophospho-
arachidonoyl ethanolamide or GP-AEA. This substance then acts on metal-reliant
phosphodiesterases, resulting in the formation of AEA (see Figure 1.6) (Leung et al.,
2006). Further, phospholipase C PLC can act in hydrolysation of NAPE, forming
phosphoanandamide, and this in turn undergoes dephosphorylation via phosphatases
including tyrosine phosphatase PTPN22, and AEA is produced in this manner, as show
in Figure 1.6 (Liu et al., 2006). Further, in macrophages treated with LPS, there was no
alteration in the level of AEA found for siRNA knockdown NAPE-PLD, PTPN22 and
Abhd 4 (Liu et al., 2008). The formation of AEA via avenues other than those discussed
above is considered to occur through free AA condensing alongside ethanolamine
within a FAAH reversed reaction (Arreaza et al., 1997, Kurahashi et al., 1997), which
may take place given adequate quantities of ethanolamine and AA (Katayama et al.,
1999). Generation of AEA in this manner was achieved on a study on live mice in which
part of their livers was removed (Mukhopadhyay et al., 2011). Furthermore, McCue et
al. (2009) state that spontaneous generation of AEA is possible based on ethanolamine
and arachidonoyl-CoA.
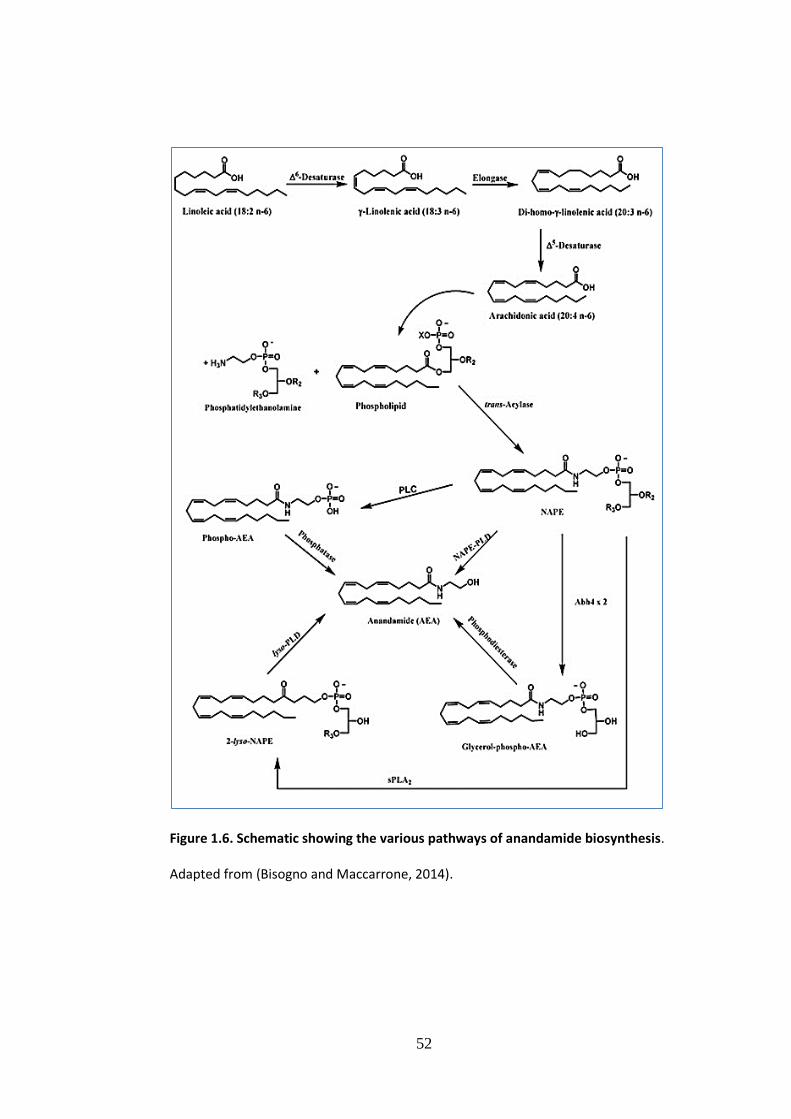
52
Figure 1.6. Schematic showing the various pathways of anandamide biosynthesis.
Adapted from (Bisogno and Maccarrone, 2014).

53
1.4.2. Biosynthesis of 2-arachidonoyl glycerol
In using phospholipids to produce AA, a principle avenue was viewed as producing
diacylglycerol lipase (DAGL) via the action of phospholipase C or PLC upon
phosphatidylinositol (Prescott and Majerus, 1983). The same avenue is also recognised
as central to 2-AG synthesis (Sugiura et al., 2006, Ueda et al., 2011), which takes place
within postsynaptic neurons as a reaction to Gq/11-coupled receptors being stimulated
and depolarised. Kano et al. (2009) report that the release of the resultant 2-AG allows
mediation of retrograde synaptic suppression via CB1 receptors located in presynaptic
terminals. The path described includes use of PLC in hydrolysing 2-arachidonoyl-
phosphatidylinositol or PtdIns, forming diacylglycerol (DAG), which contains arachidonic
acid, and subsequently undergoes hydrolysation via DAGL, forming 2-AG, as shown in
Figure 1.7. The most abundant PtdIns molecule in mammalian tissues is 1-stearoyl-2-
arachidonoyl-PtdIns is the most frequently encountered Ptdlns within the tissue of
mammals and allows 2-AG to be created in preference to different MAGs. The β subtype
or PLC may be stimulated via Gq/11-coupled receptors (Fukami et al., 2010), with the
implication that PLC is important for generating neurotransmitter-reliant 2-AG with
mediation through Gq/11-coupled receptors within postsynaptic neurons. However, it is
also possible to convert PtdCho to 2-arachidonoyl-DAG (Oka et al., 2005) and the same
is demonstrated for PA by Bisogno et al. (1999b) with this forming 2-AG precursor.
PtdIns also sets in motion a path in which lyso-PtdIns production via PLA1 leads to lyso-
PtdIns-specific PLC releasing 2-AG (Ueda et al., 1993, Tsutsumi et al., 1994) (Figure
1.6), as shown in Figure 1.6. Moreover, arachidonoyl-lysophosphatidic acid or Lyso-PA
can also generate 2-AG (Nakane et al., 2002).
DAGL is an enzyme linked with membranes and which hydrolyses DAG in a preferential
manner at locus sn-1 (Okazaki et al., 1981, Chau and Tai, 1981). Cloning via cDNA
demonstrates two genes, α and β, which have a high degree of relation to each other,
as involved in DAGL in humans (Bisogno et al., 2003). A broad distribution pattern has
been found for DAGLα within the tissues of both mice and humans: it is found in
particularly strong concentrations within the nervous system of both animals, and in
human pancreatic tissue. Further localisation to PLCβ, Gq/11-coupled receptors and
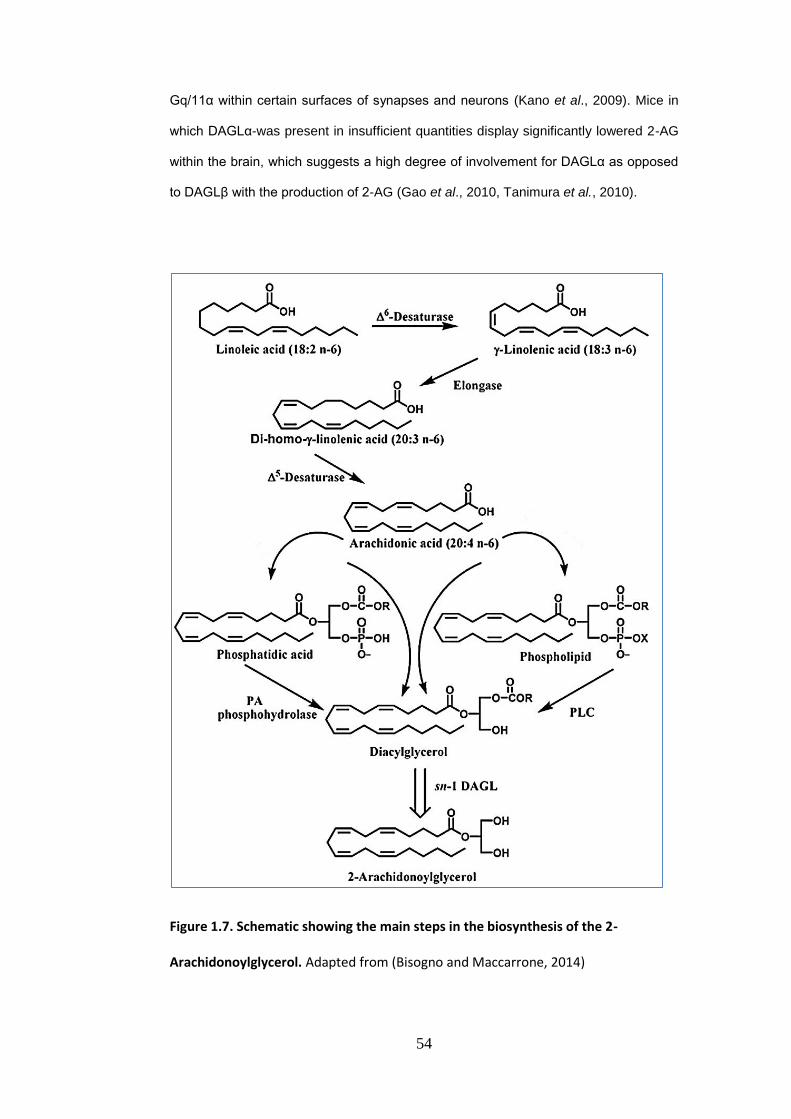
54
Gq/11α within certain surfaces of synapses and neurons (Kano et al., 2009). Mice in
which DAGLα-was present in insufficient quantities display significantly lowered 2-AG
within the brain, which suggests a high degree of involvement for DAGLα as opposed
to DAGLβ with the production of 2-AG (Gao et al., 2010, Tanimura et al., 2010).
Figure 1.7. Schematic showing the main steps in the biosynthesis of the 2-
Arachidonoylglycerol. Adapted from (Bisogno and Maccarrone, 2014)

55
1.4.3. Catabolism of AEA and 2-AG
Subsequent to their generation endocannabinoids rapidly become inactive, as shown in
Figure 1.8. AEA within the brain returns to neurons before undergoing hydrolysation via
FAAH to form ethanolamine and AA (Glaser et al., 2005, Fowler, 2007). As well as this
process, LOX, COX-2 and cytochrome P450 may also generate prostaglandin
ethanolamines (PG-EA), or prostamides, by metabolising AEA (Karsak et al., 2007).
Further, COX-2 is capable of metabolising 2-AG through PGH2-GE as an intermediate
in the production of prostaglandin glycerol esters including glyceryl prostaglandins and
PG-GE (Kozak et al., 2000). Transportation of 2-AG to cells is carried out either through
diffusion or via 2-AG transporters (Hermann et al., 2006). The majority of 2-AG
hydrolysation taking place in brain tissues is conducted by monoacylglycerol lipase
(MAGL). This substance allows 2-monoglycerides and 1-monoglycerides to be
converted to glycerol and fatty acid (Dinh et al., 2002, Blankman et al., 2007). Further,
it is possible that 2-AG is inactivated in a process which involves phosphorylating it with
monoacylglycerol kinase (Nakane et al., 2002). As transportation, metabolic pathways
and biosynthesis differ for 2-AG and AEA, it is suggested that each has its own
mechanisms for regulation. Further, direct inhibition of 2-AG by AEA is described by De
Petrocellis and Di Marzo (2009). Additionally, Fezza et al. (2008) report higher
concentration of AEA within the striatum as effecting reduction in 2-AG’s impact upon
GABAergic transmission.

56
Figure 1.8: Catabolism of anandamide (AEA) and 2-arachidonoyl glycerol (2-AG);
scheme adapted from (Ueda et al., 2013)).
1.4.3.1. Fatty acid amide hydrolase
FAAH is an amidohydrolase categorised within the amidase group of serine hydrolases,
and has an association with membranes. FAAH is responsible for hydrolysing NAEs,
including AEA, creating ethanolamine and specific fatty acids (Deutsch et al., 2002,

57
McKinney and Cravatt, 2005). Research involving FAAH−/− mice showed that FAAH
was important in the degrading process of several NAEs, including AEA (Cravatt et al.,
2001, Clement et al., 2003). It is also involved in hydrolysation of oleamide and various
fatty acid amides (Cravatt et al., 1996), as well as N-acyltaurine, as reported by
Saghatelian et al. (2004). Hydrolysation of 2-AG occurs rapidly via FAAH (Goparaju et
al., 1998), although studies have not considered FAAH to have a central importance in
degradation of 2-AG within brain tissue (Goparaju et al., 1999, Blankman et al., 2007).
Unlike rodent species studied, human tissues show expression of a FAAH isozyme
which has approximately 20% sequence identity when viewed at the level of amino
acids (Wei et al., 2006). The isozyme is categorised as FAAH-2, as distinct from FAAH-
1, or the first FAAH to be identified. FAAH-2 shows a different localisation to FAAH-1,
being found on droplets of lipids as opposed to the endoplasmic reticulum. Further,
Kaczocha et al. (2010) report that for FAAH-2, the N-terminal hydrophobic area of
FAAH-2 is shown to be a sequence for localising the isozyme on lipid droplets, and this
implies a distinct function of FAAH-2 in comparison with FAAH-1. Moreover a range of
symptoms are suspected to include FAAH involvement, among which are neuropathic
pain as well as depressed and anxious states. This has led to the expectation that
substances which inhibit FAAH may present drugs which have an effect in these
scenarios (Petrosino and Di Marzo, 2010). Thus, development of a number of
specifically targeted FAAH inhibitors has occurred, such as for OL-135 (Lichtman et al.,
2004), URB597(Kathuria et al., 2003), PF-3845 (Ahn et al., 2009) and PF-04457845
(Ahn et al., 2011).
1.4.3.2. N-acylethanolamine hydrolysing acid amidase
The initial identification of the lysosomal enzyme N-acylethanolamine hydrolysing acid
amidase or NAAA took place in humans in CMK megakaryoblastic cells, as reported by
Ueda et al. (1999). This was followed by its identification in rat subjects within various
tissues including those of the lung (Ueda et al., 2001). When the enzyme was cloned
via cDNA, it was identified as cysteine hydrolase from the N-terminal nucleophile
hydrolase supergroup (Tsuboi et al., 2005, Tsuboi et al., 2007a, Ueda et al., 2010). The

58
enzyme was considered a protein similar to the lysosomal enzyme acid ceramidase in
sequence homology (Hong et al., 1999). Acid ceramidase acts in hydrolysing ceramide,
forming fatty acids and sphingosine. Despite this, sequence homology has not been
observed for FAAH and NAAA. Based on the fact that NAAA is localised within
lysosomes, it shows activity solely when pH is in the acid area of the spectrum,
hydrolysing a range of NAEs but favouring PEA as shown in vitro. The NAAA
glycoprotein in humans has 4 loci of N-glycosylation (Zhao et al., 2007, West et al.,
2011). West et al. (2011) report that a recombinant form of NAAA is generated to form
a proenzyme which is not active, undergoing conversion through autocatalytic cleavage
of Phe125 and Cys126, forming a heterodimer based upon α and β elements and which
displays catalytic activity. Expression of NAAA can be found within a variety of tissues
in both human and rodent subjects, and is principally expressed within macrophage
cells (Sun et al., 2005, Tsuboi et al., 2007b). NAAA is expressed to the greatest degree
in humans within prostate tissue (Wang et al., 2008). Stimulation of NAAA has been
achieved in vitro via non-ionic detergent, including Nonidet P-40 Triton X-100, as well
as through dithiothreitol, which is an agent in reducing thiol. Nonidet P-40 may be
replaced by phospholipids which contain choline or ethanolamine, such as
sphingomyelin, PtdCho and PtdEtn, in endogenous stimulation, whereas dithiothreitol
can be replaced with dihydrolipoic acid, which is α-lipoic acid in reduction (Tai et al.,
2012).
1.4.4. N-acylethanolamines
N-acylethanolamines, or NAEs, are substances derived from fatty acids, and these
present themselves within the body tissues of mammals (Schmid, 2000, Hansen et al.,
2000, Schmid and Berdyshev, 2002, Nakane et al., 2002). Certain NAEs are shown to
fulfil particular roles, including for example N-stearoylethanolamide (STEA), which is
pro-apoptotic (van der Stelt et al., 2002). while N-palmitoylethanolamide (PEA) acts
against inflammation, as well as having neuroprotective and analgesic properties, and
being an agonist for peroxisome proliferator-activated receptor-α as opposed to CB1
and CB2 (Calignano et al., 1998, Smart et al., 2002, LoVerme et al., 2005). Further, N-

59
oleoylethanolamide or OEA is suggested to be anorexic by Rodriguez de Fonseca et
al. (2001). Further, OEA is an agonist for a range of receptors, such as; G protein-
coupled receptor GPR119, peroxisome proliferator-activated receptor-α and transient
receptor potential vanilloid 1 (Pavón et al., 2010). Each of these receptors derive from
membrane phospholipids. Phosphatidylethanolamine (PE) is converted to N-acyl
phosphatidylethanolamine (NAPE) by means of Acyltransferases, and NAPE
undergoes hydrolysation via NAPE-PLD, producing N-acylethanolamine (Hansen et al.,
2000), which is further elaborated in Section 1.4.1., and as an instance of this,
hydrolysing N-pamitoylphosphatidylethanolamide, a phospholipid precursor, is
considered via NAPE-PLD is considered to be a principle avenue in biosynthesising N-
palmitoylethanolamide, as proposed by Schmid et al. (1983). Various N-acyl chains for
NAE are considered to be biosynthesised via transacylation–phosphodiesterase.
Further, Sugiura et al. (1996) did not identify N-acyl species when catalysing reactions
via N-acyltransferase, and nor did Wang et al. (2006) when using NAPE-PLD.
1.4.5. Endocannabinoids and their impact on the skin
The endocannabinoid receptors CB1 and CB2 have been found in human and murine
skin cells such as cutaneous nerve fibres, mast cells, epidermal keratinocytes and cells
of the adnexal tissues (Stander et al., 2005, Ibrahim et al., 2005, Blazquez et al., 2006,
Telek et al., 2007, Casanova et al., 2003). In particular, CB1 is expressed on different
types of the cutaneous nerves such as the large myelinated nerve fibres in the papillary
dermis, also on the small nerve fibres that associate with hair follicles and on the nerve
fibres in the epidermis (Stander et al., 2005). In addition, the presence of CB1 receptor
has been reported in all dermal mast cells (Stander et al., 2005). CB2 has been found
in the skin on large myelinated nerve fibre bundles of the superficial and deep reticular
dermis, small unmyelinated nerves of the papillary dermis and occasionally on nerves
of the epidermis (Stander et al., 2005), as well as in human SZ95 sebocytes (Dobrosi
et al., 2008).

60
The CB receptors have been suggested to be involved in the differentiation of
keratinocytes (Casanova et al., 2003). For instance, endocannabinoids were found to
regulate human epidermal differentiation, probably via CB1-dependent mechanisms
.Therefore, local administration of AEA inhibited the differentiation of cultured NHEK
and HaCaT keratinocytes, as evidenced by the transcriptional downregulation of keratin
1, keratin 5, involucrin and transglutaminase-5 and suppression of the formation of
cornified envelopes (Maccarrone et al., 2003b). In addition, activation of the CB
receptors either by phytocannabinoids or these from synthetic sources has been
demonstrated to inhibit the proliferation process in cultured transformed human
epidermal keratinocytes (HPV-16 E6/E7) (Casanova et al., 2003). However, cellular
growth of cultured NHEKs and non-tumorigenic human HaCaT and murine MCA3D
keratinocytes was not altered by synthetic CB1 and CB2 agonists (Casanova et al.,
2003).
AEA and 2-AG have been found in murine epidermal cells (Berdyshev et al., 2000) and
in rodent skin (Calignano et al., 1998). In human skin, AEA and 2-AG were detected in
organ-cultured hair follicles (Telek et al., 2007) and SZ95 sebocytes (Dobrosi et al.,
2008). Endocannabinoids also have been suggested to play a regulatory role in the
human pilosebaceous unit; which control a wide range of the biological functions of the
skin from stem-cell supply through immunomodulation to cytokine production
(Roosterman et al., 2006, Paus et al., 2006a, Paus et al., 2006b). For example;
endocannabinoids might act as a regulators of human hair growth. Consistently with this
idea, CB1 receptor antagonists have been shown to induce hair growth in mice
(Srivastava et al., 2009).
As it was mentioned above endocannabinoids are involved in the regulation of the skin
cells growth in vivo. Local administration of synthetic CB1 and CB2 agonists induce
growth inhibition of malignant skin tumors generated by intradermal inoculation of
tumorigenic PDV.C57 mouse keratinocytes into nude mice (Casanova et al., 2003). This
growth inhibition was accompanied by enhanced intra-tumor apoptosis and impaired
tumor vascularization. Conversely, CB receptors and the related signalling pathways
have been suggested to be involved in the promotion of in vivo skin carcinogenesis

61
(Zheng et al., 2008). By using CB1/CB2 double gene-deficient mice, the study
demonstrated that absence of CB1 and CB2 receptors results in a marked decrease in
UVB-induced skin carcinogenesis. They also found marked attenuation of UVB-induced
activation of MAPKs and nuclear factor-κB was associated with CB1 and CB2 receptors
deficiency (Zheng et al., 2008).
Endocannabinoids exert a protective role in allergic inflammation of the skin (Karsak et
al., 2007). Also the same study found that mice lacking CB1 and CB2 or treated with
antagonists of these receptors exhibited exacerbated allergic inflammatory response
(Karsak et al., 2007). The existence of the endocannabinoid-mediated protection was
also supported by a reduced allergic response in the skin of FAAH-deficient mice that
has increased levels of AEA (Karsak et al., 2007). However, 2-AG levels were increased
in skin with acute and chronic contact dermatitis (Oka et al., 2006) and the symptoms
of skin inflammation were significantly reduced by CB2 antagonists (Oka et al., 2006).
Moreover, the cutaneous inflammation of contact dermatitis was found to be decreased
in CB2-deficient mice (Ueda et al., 2007), and similar suppression of the inflammatory
response by orally administered CB2 antagonists was also observed (Ueda et al., 2007,
Ueda et al., 2005).
Most of these studies focused on the existence of endocannabinoids and their CB1 and
CB2 receptors in human skin cells and the role of these receptors on skin health and
skin disorders. However, the role of these endocannabinoids in skin disorders, in
particular these related to UVR is still waiting to be investigated. Specifically, it would
be interesting to investigate the effects of UVR on endocannabinoid production by
human skin cells. As the n-3 PUFA, EPA and DHA are considered as a dietary
component with a promising photoprotective effect against the deleterious effects of
UVR, the formation of n-3 PUFA, NEA is also interest.

62
1.5. Aims and objectives of the study
Exposure to UV radiation has a range of effects and can cause skin disorders such as
erythema, sunburn, photoaging and photocarcinogenesis (Taylor et al., 1990, Young,
2006). It is clear that the predominant exposure to UVR may be occurs inadvertently
under everyday circumstances (Godar et al., 2003). There are some protection
strategies to save the skin from the harmful effects that may be initiated by UVR during
times of intense exposure (Wingerath et al., 1998). For example, avoidance of sun
exposure, wearing protective clothing or using the topical application of sunscreens.
Although the use of topical protection sunscreens is considered as a part of skin cancer
prevention plans (Moloney et al., 2002), this method of protection may affect the
synthesis of vitamin D in the skin leading to disorders related to vitamin D deficiency
such as reduced bone strength (Moloney et al., 2002). In addition to its action on vitamin
D synthesis, sunscreens should follow standardized methods to apply its protection
effect against UVB. For example, each cm2 of skin should be covered by 2 mg of
sunscreen (Ferguson, 1997). In reality, sunscreens are employed under
nonstandardized conditions, and often topical application may be inadequate to confer
optimal protection against UV radiation (Bech-Thomsen and Wulf, 1992, Krutmann,
2001, Diffey, 1996). Therefore, finding more effective protection approaches is still
required.
Photoprotection by endogenous compounds provided from the diet is became one of
the most promising approach in this field. In general, n-3 PUFA EPA and DHA have
been considered as a dietary component with a promising photoprotective effect against
the deleterious effects of UVR (Black et al., 1992, Rhodes et al., 1994, Rhodes et al.,
1995). They exert their anti-inflammatory effects through competition with AA as
substrates for COXs and LOXs enzymes, resulting in the formation of less active
prostaglandins and leukotrienes (Lands et al., 1992). n-3 PUFA also reduces UVB-
erythemal sensitivity in humans (Rhodes et al., 1994), by inhibition of UVB-induced
PGE2 levels in the skin (Rhodes et al., 1995). N-3 PUFA can also alter the levels of
other PUFA acting as substrates for endocannabinoids and other NAEs (Kozak et al.,
2002a, Kozak et al., 2002b, Kozak et al., 2004). n-3 PUFA therefore, could have an

63
effect on the endocannabinoid pathways in the skin cells and may lead to production of
NAE such as N-stearoylethanolamine (STEA) which has been reported to have pro-
apoptotic activity (van der Stelt et al., 2002) and/or N-palmitoylethanolamine (PEA) that
showed anti-inflammatory activity, analgesic and neuroprotective effects (Calignano et
al., 1998, Smart et al., 2002, LoVerme et al., 2005). Manipulation of the
endocannabinoid pathways through n-3 PUFA supplementation could be the major
defense mechanism behind the protective effect of n-3 PUFA against UVR in the skin
cells. Therefore, we will examine the hypothesis that n-3 PUFA particularly EPA and
DHA may have a biological role in protecting human skin cells against the harmful
effects of UVR through their effect on the formation of endocannabinoid and NAE or
through their effect on the endocannabinoid metabolizing enzymes such as FAAH,
NAPE-PLD, COX-2 and LOX. To address these questions we used two cell lines:
HaCaT keratinocytes and 46BR.1N fibroblasts. Cells will be treated DHA and EPA in
the presence and absence of UVR. AEA, 2-AG, NAE, NAPE-PLD, FAAH, COX-2 and
12-LOX and 15 LOX were investigated in nonirradiated and irradiated cells using
Western blot for protein experiment and LC-MS/MS for lipid analysis. Moreover, through
our collaboration in a clinical study, we will examine the effect of UVR on
endocannabinoids and NAE found in circulation. Therefore, the specific objectives of
this project were:
1. To study the effect of UVR and n-3PUFA on the formation of endocannabinoids
and their congeners in HaCaT keratinocytes and 46BR.1N fibroblasts.
2. To explore the effect of UVR and n-3PUFA on the endocannabinoid
metabolizing enzymes.
3. To assess the effect of UVR on the circulating levels of endocannabinoids and
their congeners through analysis of serum samples.

64
CHAPTER 2: Materials and Methods
2.1. Cell culture and maintenance
2.1.1. Cell lines
The HaCaT human keratinocyte cell line was provided by Dr S. Britland, University of
Bradford and the 46BR.1N human fibroblast cell line was purchased from The European
Collection of Cell Culture (ECACC).
2.2. Cell culture
2.2.1. Materials
Hank’s balanced salt solution (HBSS, Cat No. C-40390) was purchased from Promo
Cell, (Heidelberg, Germany). Dulbecco’s Modified Eagle’s Medium - high glucose
(DMEM, Cat No. D6429-6X500ML), minimum essential medium eagle (MEME, Cat No.
M2279-6X500ML), foetal bovine serum heat inactivated (FBS, Cat No F9665-500ML),
non-essential amino acid solution (Cat No. M7145-100ML), L-glutamine (Cat No.
G7513-100ML), dimethyl sulfoxide (DMSO, Cat No. D2438-50ML), Dulbecco’s
phosphate buffered saline, (Cat No. D8662-6x500ML), 0.4% trypan blue solution (Cat
No.T8154-100ML), sodium pyruvate (Cat No. S8636-100ML), oleic acid (OA; 99%
purity, Cat No. O1008), cis-5,8,11,14,17-eicosapentaenoic acid (EPA; 99% purity, Cat
No. E2011-25MG), cis-4,7,10,13,16,19-docosahexaenoic acid (DHA; 98% purity, Cat
No. D2534-25MG), penicillin (10,000U/ml) streptomycin (10mg/ml) (Cat No. P4333-
100ML), amphotericin B (2.5ng/ml, Cat No. A2942-100ML) and phenol red free trypsin-
EDTA solution (1X), (Cat No 59430C-500ML) were all purchased from Sigma (UK).
0.25% trypsin-EDTA solution (1X) and phenol red (Cat No. 25200072-500ML) were
purchased from Invitrogen (USA). 15ml centrifugation plastic tubes, 50 ml self-standing
centrifugation plastic tubes, T-25, and T-75 culture flasks, 6, 12, and 24 well cell culture
cluster and 96-well microplate were all purchased from Corning, (Amsterdam,
Netherlands). 25ml plastic tubes, Tissue culture dishes (100/20mm) and serological
plastic pipettes 10ml were from Sarstedt (Leicester, UK).

65
2.2.2. Equipment
Microscope: CK40-F200, (Olympus, Japan). UV lamp: UV 236 B, (Waldmann,
Germany). Light meter, (Waldmann, Germany). Centrifuge: Rolofix 32 Ilettich
entrifugen, (Scientific Laboratory supplies, Germany). Shaker: MS1 Minishaker, (IKA-
Labortachnik, Brasil). Incubator: Heraeus CO2 Incubator BBD 622, Thermo Scientific,
UK. Microplate reader: ELx800, (BioTek Instruments), USA. Aspirator: Vacumsafe
confort, (IBS Integra Biosciences, Switzerland) and Thermocouple, Improved Neubauer
haemocytometer, (Gallencamp, UK). Philips HB588 Sunstudio irradiation cabinet
(Eindhoven, The Netherlands), fitted with a combination of 11 Arimed B (Cosmedico
GmbH, Stuttgart, Germany) and 13 Cleo Natural (Philips, Eindhoven, The Netherlands)
fluorescent tubes. Bentham DTM300 spectroradiometer (Bentham, Reading, UK),
Ocean Optics S2000 spectroradiometer (Ocean Optics, Dunedin, FL, USA) and Minolta
CM-2500d hand-held spectrophotometer (Konica Minolta, Tokyo, Japan).
2.2.3. Cell thawing
A cryovial was removed from liquid nitrogen and immediately place in water bath at
37°C for 2 min. When about 80% of the cryovial’s content has thawed, the cells were
pipetted out into a T75 flask, topped up with 8ml of pre-warmed complete medium and
then placed in the incubator. After 24 hours, cells were investigated to insure that they
were attached. At the same time the culture medium was changed to remove any non-
adherent cells, replenish nutrients, and remove any dimethyl sulfoxide (DMSO) residue.
2.2.4. Cell line maintenance
Cells were maintained in 100% humidified incubator at 37oC with 5% (v/v) CO2. All
culturing procedures were carried out in a class II microbiological safety cabinet to
provide a sterile cell culturing condition. HaCaT keratinocytes were cultured in DMEM
medium supplemented with 10% foetal bovine serum (FBS), 1% of the antibiotic
penicillin streptomycin (PS) and 1% of the antifungal amphotericin B. 46BR.1N cells

66
were cultured in MEME medium supplemented with 15% foetal bovine serum (FBS),
1% of non-essential amino acids, 1:100 of sodium pyruvate (100mM), 1:100 of L-
glutamine (200mM), 1% penicillin streptomycin (PS) and 1% amphotericin B. All cells
were grown in T-75 culture flasks with vented caps.
Cells were observed every day under a microscope to ensure that they continued to
grow. When the cells had reached about 90% confluence they were passaged. The
medium was aspirated and 5ml of pre-warmed (37°C) HBSS solution was added. In
order to wash the cells, the HBSS solution was gently swirled inside the flask and after
it discarded, 4 ml of warm (37°C) 0.25% trypsin-EDTA solution was added and the cells
were incubated at 37°C for 15-20 minutes for HaCaT and 2-5 min for 46BR.IN, to detach
them from the wall of the flask. Cells were then transferred into 15 ml centrifuge tube.
The flask was then rinsed with 4-5 ml appropriate complete cell culture medium and
added to the cells in the centrifuge tube to neutralise the trypsin. The tube was spun
down (2,000 rpm, 5 min), the supernatant was removed and replaced by 4 ml of fresh
complete medium. The cells were then re-suspended by gently pipetting the medium up
and down. Then, the cells were counted (section 2.2.8) and an appropriate volume of
cell suspension was transferred into new cell culture flasks or cell culture dishes, as
needed. Fresh medium was added to cover the surface of the flask (8 ml added toT-75
and 10 ml added to100/20 mm Petri dish). All flasks and or dishes were then placed in
the incubator and used for further work.
2.2.5. Cell treatment with fatty acids
All fatty acids (EPA, DHA and OA) were dissolved in DMSO to prepare stock solutions
of 50mM. These solutions were aliquoted to 50µl and stored at -20°C until further use
(appendix 1 section 1.1 – 1.3). Cells were treated with either 10µM or 50µM (2µl or 10µl
from the 50mM stock solution was added to 100/20 mm Petri dish containing of 10ml of
the medium and 70% confluent cells). Control treatment was carried out by adding 10µl
DMSO into 10ml of medium. All cells were then incubated for 72 h before UV irradiation.
67
2.2.6. Cell irradiation
After 72 h incubation period, the medium was removed and the cells were washed with
5ml/dish pre-warmed sterile PBS (37°C) to remove any remaining media and floating
cells. Cells were then covered with a small volume (5ml/dish) of pre-warmed sterile PBS
before the UVR treatment. The UV lamp was switched on and left for 10 min to stabilize.
Light meter was used to measure the irradiance of the lamp (mW/cm2) to make sure
that the lamp had stabilized. Typically, this value was at 0.33 mW/cm2. The cover of
the Petri dish was removed and cells were placed at the base of the UV box, 30 cm
under the UV lamp and irradiated for the required duration. The exposure time was
calculated as follows: Exposure time (sec) = Dose (mJ/cm2)/UVR intensity (mW/cm2).
This corresponds approximately to 45 sec for 15mJ/cm2. After irradiation, PBS was
aspirated, discarded and replaced with 10ml of serum free media. The cells were further
incubated for 24 hours at 37oC with 5% (v/v) CO2.
2.2.7. Collection of cell pellets and culture media
24 pre-labelled sterile 15 ml centrifuge tubes were prepared before starting the
collection of cells pellets and culture media. In each experiment 12 petri dishes were
used and each experiment was performed in duplicate (A and B). Experiment generated
samples were as follows: Control, Control with UVR, Fatty acid at 10 µM, Fatty acid at
10 µM with UVR, Fatty acid at 50 µM and Fatty acid at 50 µM with UVR. The fatty acids
used were either OA or DHA or EPA as indicated in the figure legends.
The culture medium from each dish was collected 24 hours post UVR by a serological
pipette and transferred into sterile pre-labelled tube. The medium was stored at -80°C
for further use. To collect the cells, HaCaT and 46BR.IN were incubated in 4 ml of warm
(37°C) 0.25% trypsin-EDTA solution for 15-20 minutes or 2-5 minutes respectively.
Trypsin was neutralised by adding 4 ml of warm complete medium; the content of the
dish was then transferred to a pre-labelled 15 ml centrifuge tube. The tube was
centrifuged using 2,000 rpm, for 5 min. The supernatant was removed and replaced by
5ml of PBS. The cells were then re-suspended by gently pipetting the PBS up and down.

68
In order to collect and store the cells; the cell suspension was spun down again at 2,000
rpm, for 5 min at room temperature, then the supernatant was removed and the cell
pellet was stored at -80°C to be used for analysis.
2.2.8. Cell counting
In order to count the cells, 100µl of the cell suspension was transferred into an
Eppendroff® tube. A dilution 1:1 was done when the cell suspension was mixed with
100µl of 0.4% trypan blue solution. The haemocytometer slide was cleaned using 70%
ethanol, the face of the slide was moistened with exhaled breath and a glass coverslip
was affixed (Figure 2.1). 10µl of the cell suspension was transferred into the chamber.
The cells were counted in 4 grids per chamber (Figure 2.1) under the microscope, using
the 10x focus. The average cells of 4 grids were calculated and this number was used
to count the total number of cell as follows:
Number of cells/ml = [average cell number] x [dilution factor (2)] x [104/ml]. Eq. (1)
Total number of cells = [Cells/ml] x [volume of original cell suspension (ml)]. Eq. (2)
2.2.9. Cryogenic storage of the cells
Cells were stored in liquid nitrogen following the procedure described below: 4ml of
trypsin-EDTA was added into the culture flask to detach the cells. The detached cells
were pelleted by centrifugation at 2,000 rpm, for 5 min. The supernatant was aspirated
and the cells re-suspended in 2 ml cryogenic solution consisting of 90% (v/v) FBS and
10% DMSO, 1ml of the cell stock was then transferred into each cryogenic vial (Nunc)
and cells were stored in - 80oC for 48 hours as a protective step to minimize damage
and death; before they were transferred into liquid nitrogen (-196oC) for long time
storage.
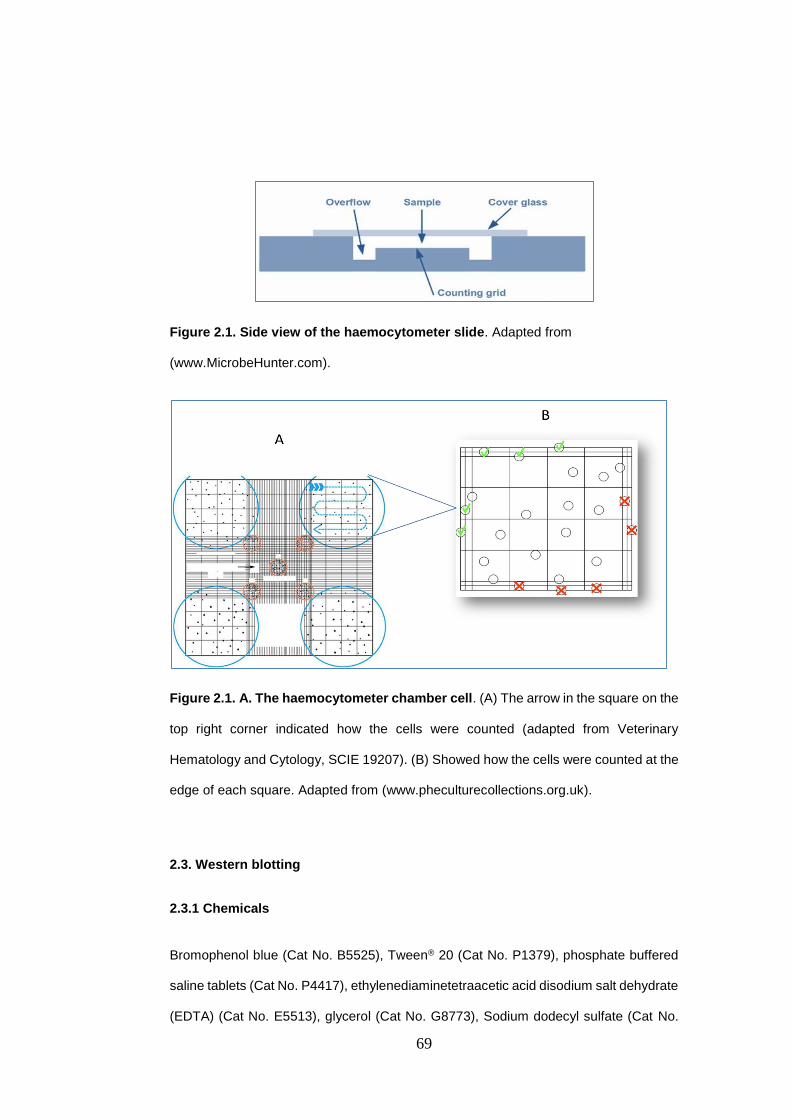
69
Figure 2.1. Side view of the haemocytometer slide. Adapted from
(www.MicrobeHunter.com).
Figure 2.1. A. The haemocytometer chamber cell. (A) The arrow in the square on the
top right corner indicated how the cells were counted (adapted from Veterinary
Hematology and Cytology, SCIE 19207). (B) Showed how the cells were counted at the
edge of each square. Adapted from (www.pheculturecollections.org.uk).
2.3. Western blotting
2.3.1 Chemicals
Bromophenol blue (Cat No. B5525), Tween® 20 (Cat No. P1379), phosphate buffered
saline tablets (Cat No. P4417), ethylenediaminetetraacetic acid disodium salt dehydrate
(EDTA) (Cat No. E5513), glycerol (Cat No. G8773), Sodium dodecyl sulfate (Cat No.
70
L3771), Trizma® base (Cat No. T4661), acetic acid (Cat No. 34245), glycine (Cat No.
G8898), methanol (Cat No. 494437), ammonium persulfate (Cat No. A3678), TEMED
(Cat No. T9281), Fast Green FCF (Cat No. F7252), ponceau S solution (Cat No. P7170-
1L), protease inhibitor cocktail (PIC) (Cat No. P8340), Coomassie® brilliant blue (Cat
No. B0149), Luminol (Cat No. 123072), P-Coumaric acid (Cat No. C9008), GBX fixer
(Cat No. P7167 – 5GA), and GBX developer (cat No. P7042 - 5GA) all were obtained
from Sigma (UK). Novex® ECL HRP chemilluminescent substrate reagents 2x125 ml
(Cat No. WP 20005) was from Invitrogen (UK). AcrylaFLOWGel 30% (Cat No. H17344)
and BisacrylaFLOWGel 2% (Cat No. H17356) were supplied by Flowgen Bioscience
(UK). DC Protein Assay Reagents (Cat No. 500-0116), lyophilized bovine serum (Cat
No. 500-0007), dithiothreitol (DTT) (Cat No. 161-0611), 10x Tris/glycine buffer (Cat No.
161-0734-1L) and 10x Tris/glycine/SDS buffer (Cat No. 161-0772-5L) were from BioRad
(USA).
2.3.2. Primary and Secondary Antibodies
COX-2 (human) polyclonal antibody (72KDa), from rabbit (Cat No. 160107), COX-2
(mouse) monoclonal antibody (72KDa), (Cat No. 160112), Fatty Acid Amide Hydrolase
polyclonal antibody, from rabbit (63KDa), (Cat No. 101600), NAPE-PLD (6-20)
polyclonal antibody (46KDa), from rabbit (Cat No. 10306), Fatty Acid Amide Hydrolase
Western Ready Control (Cat No. 10010182) and COX-2 (human) Western Ready
Control (Cat No. 10009624) were obtained from Cayman (USA). Anti-biotin, HRP-linked
Antibody from goat (Cat No. 7075S) and Biotinylated Protein Ladder Detection (Cat No.
7727S) were from Cell Signaling (USA). Anti-GAPDH (6C5) mouse monoclonal
antibody (Cat No. AB8245) and brain: cerebellum (right) (Human) whole cell lysate -
adult normal tissue (Cat No. AB30069) were provided by AbCam (UK). ECL Rabbit
IgG, HRP-Linked Whole Ab (from donkey) (Cat No. NA934) and ECL Mouse IgG, HRP-
Linked Whole Ab (from sheep) (Cat No. NA931) were from GE Healthcare (UK).

71
2.3.3. Various consumables and small items
Syringes PP/EP with removable needle (Cat No. Z116890), Whatman® filter paper (Cat
No. Z146382), Parafilm® M (Cat No. P7793), exposure cassette Kodak® BioMax™ (Cat
No. C4729) and Kodak® X-Omat LS film - size 5 in. (13 cm) × 7 in. (18 cm) (Cat No.
F1274-50EA) were from Sigma (UK). Immobilon Blottimg Filter Paper, 7x8.4 cm sheet
(Cat No. IBFP0785C) and Immobilon-P Membrane, PVDF, 0.45 µm, 15 x 15 cm sheet
(Cat No. IPVH15150) were purchased from Millipore (USA). Mini incubation trays (Cat
No. 170-3902) were from BioRad. Cassettes, 1.0 mm (Cat No. NC2010), Combs, 1.0
mm 10 well (Cat No. NC3010), Invitrolon™ PVDF⁄Filter Paper Sandwiches (Cat No.
LC2005) and Xcell SureLock Mini-Cell mark (Cat No. EI0002) were purchased from
Invitrogen (USA). Mini-PROTEAN® TGX precast gels 10% and 10-well comb, 50µl/well
(Cat No. 456-1034) were from BioRad (USA).
2.4. Sample preparation
2.4.1. Protein extraction
Cell pellets were defrosted in ice and then re-suspended initially in 200µl of ice cold
freshly prepared sample buffer (Table 2.1). (Appendix 3 section 3.1.5). 1:100 ice cold
protease inhibitor cocktail (PIC), that contained 4-(2-aminoethyl) benzenesulfonyl
fluoride (AEBSF), pepstatinA, E-64, bestatin, leupeptin and aprotinin, was then added
and the suspension was mixed and kept in ice for 10 minutes. The suspension was
homogenized by mixing repeatedly using a 5 ml syringe for 10 times to lyse cellular
membranes. If foam was produced during lysis the suspension was centrifuged 3 times
to reduce it. The suspension was then incubated on ice for 15 minutes, and then mixed
and centrifuged at 13,000 rpm for 5 min. The resulting supernatant that contained the
cellular protein was transferred to a new Eppendrof tube and kept on ice waiting for the
protein assay to be done or kept in -20 oC for further use.

72
Table 2.1: Composition of the sample buffer used for protein extraction.
Ingredients Concentration Final volume or weight
Glycerol 10% 2.5ml
EDTA 0.02M 0.19g
SDS 6% 1.5g
Tris base 62.4mM 0.19g
dH2O 25ml
2.4.2. Determination of protein concentration
The measurement of the protein concentration was carried out using the BIO RAD DC
protein assay kit. This colorimetric assay for the protein concentration is based on the
Lowry assay (Lowry et al., 1951). The protein reacts with alkaline copper solution
(reagent A) and then reacts with folin reagent (reagent B) and forms a blue colour with
maximum absorbance at 750nm and minimum at 450nm.
A calibration line (Figure 2.4) was constructed using six dilutions of bovine serum
albumin (BSA) (0.1, 0.2, 0.4, 0.6, 0.8 and 1 (mg/ml)) (appendix 2 section 2.1). As they
left for the blank, 5µl of the sample buffer (appendix 3 section 3.1.5) were added into
the first three wells of the 96-well microplate (Figure 2.2). Then, 5µl of each BSA
dilutions were added in triplicate into the 96-well microplate (Figure 2.3). Three dilutions
(1:2, 1:5 and 1:10) were prepared from each test sample. 1ml of reagent A was mixed
with 20µl of the surfactant solution (Reagent S) before adding it into every well of a 96-
well microplate. Then, 25µl and 200µl of reagent A and B were also added to each well.
The microplate was then covered with foil and left for 15 min at room temperature. The
absorbance was read at 650nm using a microplate reader, run by the genesis software
version 2 (appendix 2 section 2.2). The protein content was calculated based on the
equation corresponding to the calibration curve and the concentration was estimated
for all test samples (appendix 2 section 2.3).
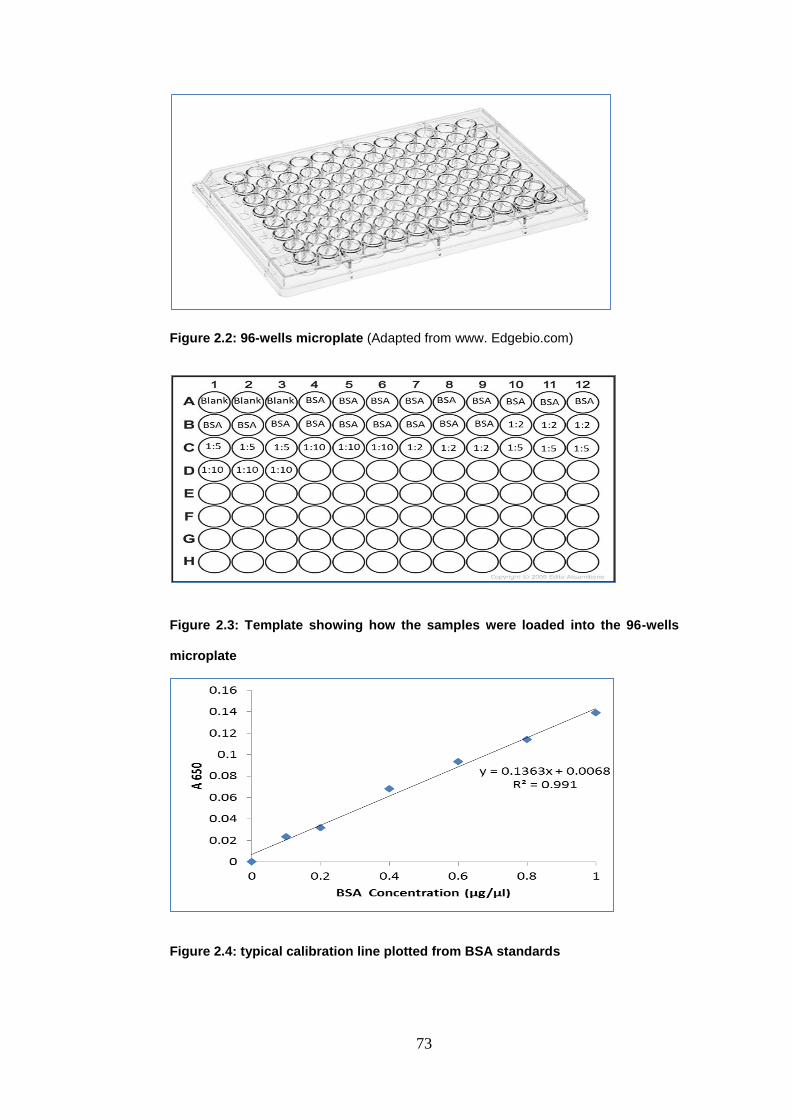
73
Figure 2.2: 96-wells microplate (Adapted from www. Edgebio.com)
Figure 2.3: Template showing how the samples were loaded into the 96-wells
microplate
Figure 2.4: typical calibration line plotted from BSA standards

74
2.5. Sodium dodecyl sulphate-polyacrylamide gel electrophoresis (SDS-PAGE)
Electrophoresis is a system used to separate large molecules, for example, proteins or
DNA which as charged atoms can be determined in an electric field as indicated by their
atomic weight. Protein movement in the gel relies on upon its charge and atomic weight.
Additionally, protein mobility dependent on the pH of the medium encompassing the
protein and on the gel itself. The movement rate of the proteins is also dependent on
gel concentration.
Figure 2.5: Schematic representation of western blotting and detection
procedure (Adapted from http://missinglink.ucsf.edu/lm/molecularmethods).
2.5.1 SDS-PAGE: Gel preparation
The lower resolving gel was prepared as described in the Table 2.2; (appendix 3 section
3.1.3). Gel was poured into a disposable gel cassette approximately 1 mm above the
first division line. The gel was poured slowly into the cassette to avoid formation of air
bubbles. In order to prevent oxygenation of the stacking gel during the polymerization,
300-500 µl of distilled water was added to the top of the gel. Polymerization of the lower
separating gel occurred in about 30-45 minutes at room temperature. During this time
the upper stacking gel was made (appendix 3 section 3.1.3) (without adding 10%

75
ammonium persulfate, (APS). When the lower gel polymerization was completed
(usually after 30 - 40 minutes), the distilled water was removed and 10% APS was
added to the upper stacking gel which applied on top of the solidified resolving gel.
1.5mm well combs were inserted into the gel cast for the formation of loading wells in
the gel. The upper stacking gel was then left for about 15-20 min for solidification. SDS-
PAGE was performed in 8% gel as described below in Table 2.2.
Table 2.2 Reagents used for the preparation of the acrylamide gel.
Reagents Separating (lower) gel 8%
Stacking (upper) gel 4.5%
Acrylamide 7.8 ml 2.2 ml
Bis-Acrylamide 3.12 ml 900 µl
Gel-Tris buffer 7.5 ml 3.75 ml
dH2O 11.6 ml 8.15 ml
ΤΕΜΕD 30 µl 30 µl
10% APS 100 µl 90 µl
2.5.2 SDS-PAGE: Gel electrophoresis
When preparing the SDS-PAGE, the samples to be analysed were denatured. SDS
loading buffer was added to the cell lysates and then boiled to unfolding protein into
primary (linear) form (Figure 3.7). SDS is an anionic detergent responsible only for the
disruption of non-covalent bonds in the proteins. Therefore the reducing agent;
dithiothreitol (DTT) was added to disrupt the disulfide covalent bonds which were not
affected by SDS (Figure 3.7). SDS also, confers negative charge in protein samples to
allow protein migration during SDS-PAGE. DTT was added at a concentration of 50mM;
an equal volume was added to the protein sample in 1:1 dilution. 0.08% of the tracking
agent bromophenol blue was then added to the protein sample and the mixture was
boiled for 5 min. The molecular weight markers were boiled at the same time for 3 min.
A biotinylated protein ladder was used as molecular weight marker on Western blots
when using the horseradish peroxidase (HRP). The molecular weight ladders are a
mixture of purified proteins covalently coupled to biotin that resolve to 10 bands that
have a size range of 9-200 kDa. The electrophoresis chamber was then assembled and
the running buffer was made (appendix 3 section 3.1.1). The comb was removed after
the gel was polymerized. The gel cassette was placed into the electrophoresis chamber

76
the tank was filled with running buffer and the protein samples were loaded into the
wells on the gel. Electrophoresis was carried out at a constant voltage of 125V for
approximately 90 minutes or until the bromophenol blue stain reached the end of the
cassette. The electrophoresis chamber was then assembled and the running buffer was
prepared (appendix 3 section 3.1.1). The comb was removed after the gel was
polymerized. The gel cassette was placed into the electrophoresis chamber the tank
was filled with running buffer and the protein samples were loaded into the wells on the
gel.
Figure 2.6: Protein denaturation using heat and SDS; circles indicate that the fold
caused by disulfide covalent bonds were not affected by heating and SDS. DTT
eliminated any tertiary or quaternary structures. Adapted from (www.ruf.rice.edu).
2.5.3. Wet transblotting
The PVDF membrane was activated in 100% methanol for 30 seconds and rinsed with
distilled water for about 2 min until hydrophobicity (apparent by beading of water on the
surface) disappears. In order to equilibrate the membrane, the membrane was
incubated in 15ml of the transblot buffer (appendix 3 section 3.1.2) for about 5 min.
When the electrophoresis was completed, the gel cassette was removed from the
electrophoresis tank, opened and the upper stacking gel was removed. The lower gel
was placed in a blotting module (Figure 2.7) which allowed the protein in the gel to be
transferred to the PVDF membrane; the position of the PVDF membrane inside the
blotting module is shown in Figure 2.8 A and B. The blotting module was then placed in

77
the electrophoresis chamber and run at 100 V for 2 hours. When the transblotting
finished, the PVDF membrane was placed in a plastic square dish containing fast green
stain (appendix 3 section 3.1.8) for about 2 min, after that the stain was poured off and
destain was added (appendix 3 section 3.1.7). When green bands were apparent on
white background, destain was removed. Next, the membrane was placed in another
plastic dish containing PBS and left for 2 min to be washed.
2.5.4. Blocking and Immunoblotting
The membrane was replaced in 5% non-fat milk in PBS for 1 hour at room temperature
to reduce non-specific antibody binding on non-target proteins. The milk solution was
changed after 30 min. Finally, the membrane was washed with PBS for 3 times and
submitted to primary antibody incubation overnight in the cold room under agitation.
After the incubation with the primary antibody; the membranes were washed with PBST
for 3 time 10 min each and 1 time with PBS for 5 min on a shaker. After that, the
membrane was incubated with the secondary antibody for 2 hours at room temperature
under agitation; the biotinylated protein ladder was added one hour later. The
membrane was then washed again as before to prepare for the protein visualization
step.

78
Figure 2.7: Diagram showing the position of the blotting pads inside the blotting
module during the transblotting process (Adapted from Invitrogen user manual).
Figure 2.8: Diagram showing the position of PVDF membrane in the blotting module. A
and B show the single and double membrane transblotting process respectively
(Adapted from; Invitrogen user manual).

79
2.5.5. Protein visualization
After the final washing step, the membrane was placed in a square dish filled with PBS.
PBS was then poured off; the membrane was dried by soft tissue or filter paper and
transferred into another clean square dish. 10 ml of freshly made ECL solution
(Appendix 3 section 3.1.9) was added into the clean dish covered with foil and left for 5
min at room temperature allowing the reaction between the ECL and HRP antibody
(Figure 2.9). The ECL solution was decanted and the PVDF membrane was removed
and dried off any excess moisture using tissue paper with the membrane’s protein side
up. Then the membrane was placed with the protein side down onto wrinkle free cling
film which was then folded over carefully. The cling film was cut and the membrane was
transferred to the exposure cassette with the protein side up and the exposure cassette
closed.
The exposure cassette was opened in the dark room; a photographic film was placed
on the top of the wrapped membrane; then the exposure cassette was closed and some
weights put on it for 5 min. During that time, the developing (Developer 50 ml in 200 ml
dH2O) and fixing (fixer 50 ml in 200 ml dH2O) solutions were prepared. After exposing
the film for the required time the cassette was opened and the film was bended at the
top left hand corner. The film was then placed in the developing solution tray until black
bands appeared (this was visualized by holding up to the light). Subsequently, the film
was put in the H2O tray with gently agitation for 2-3 min. Then, the film was placed in
the fixing solution tray with gently agitation for 2-3 min, it was then rinsed under tap
water to remove any residue. Finally, the film was left for 10 min to dry either in the
drying cabinet or standing up vertically on the bench.
2.5.6. Membrane stripping and re-probing
The PVDF membrane was incubated in a square petri dish with mild stripping buffer
(appendix 4 section 4.1.1) for 10 min at room temperature. The incubation was repeated
for another 10 min with fresh stripping buffer and the membrane was then washed with
PBS for 10 min 2 times, at room temperature and 2 times with PBS containing 0.05%

80
Tween 20, for 5 min each. Finally, the membrane was incubated with PBS only for 5
min before starting the blocking step (appendix 4 section 4.2).
Figure 2.9: schematic summarizing the protein visualization process. Adapted from
(www.gelifesciences.com)
2.6. Densitometry analysis
Densitometric analysis of Western blots (Schmidt et al., 1987, Gassmann et al., 2009)
was carried out using ImageJ software (Schneider et al., 2012). The intensity of the
protein band in each treatment was normalized to that of the corresponding GAPDH
protein band under the same conditions. The ratio of the intensity of the protein band
divided with the intensity of the GAPDH band in the untreated cells was arbitrarily set to
1. The ratio of the intensity of the protein versus the intensity of the GAPDH band in the
remaining samples was calculated accordingly.
2.7. Antibody optimization
2.7.1. COX-2 and GAPDH Antibodies
Two different concentrations of the antibodies against COX-2 and GAPDH were used
as shown in Figure 2.10. Cellular extract from the fibroblasts cells 46 BR.1N containing
300 µg protein subjected to SDS-PAGE and Western blot analysis as described above.

81
The PVDF membrane was then cut into three strips. The membrane was incubated
overnight with primary antibodies of COX-2 and GAPDH in the cold room followed by
incubation with the secondary antibodies for 2 hours at room temperature. The
biotinylated protein ladder was added one hour later. Figure 2.11 shows that the loading
control GAPDH (36 kDa) appeared clearly in strip 1 with dilution of 1:10,000 indicating
that further dilution was necessary and the exposure time (5 min) had to be reduced.
The COX-2 band (72 kDa) at a dilution of 1:200 shown in strip 2 was better than that in
strip 3 incubated with the primary antibody at dilution of 1:400.
After several experiments, the optimal dilution for the GAPDH antibody was found to be
1:30,000. Also, good quality of bands was achieved when the imaging time was reduced
from 5 min to 30 – 60 sec. However, the optimal dilution of COX-2 antibody was 1:200
and the bands required 3 to 5 min exposure time to be seen clearly. Moreover, all the
secondary antibodies used in this study were used at dilution range 1:500 – 1:2000.
Figure 2.10: Optimization of COX-2 and GAPDH antibodies. Aumont of protein was
300 µg per gel. (A) Showed GAPDH band after the PVDF membrane was incubated
with GAPDH (Mouse) monoclonal antibody at dilution of 1:10,000. (B) Showed COX-2
band after the membrane was incubated with COX-2 (Human) polyclonal antibody at
dilution of 1:200. (C) Showed COX-2 band after the membrane was incubated with
COX-2 (Human) polyclonal antibody at dilution of 1:400. HRP- (Anti-Mouse) 1:1500,
HRP- (Anti-Rabbit) at dilution of 1:1500.

82
2.7.2. Optimization of 12-Lipoxygenase (murine leukocyte) Polyclonal Antiserum
Cells from the fibroblastic cell lines 46 BR.1N were suspended in the lysis buffer (10%
Glycerol, 0.02M EDTA, 62.4mM Tris base, 6% SDS and dH2O) and the protein was
extracted as described in section 2.5.1 The protein obtained content was diluted to
2µg/µl. In order to have 30 µg/well, 15 µl of this solution were loaded into each well.
After transblotting (section 2.6.2), the PVDF membrane was blocked and then
incubated with the primary antibodies of 12-LOX overnight in the cold room. This was
followed by incubation with the secondary antibodies in the next day for 2 hours at
room temperature. The biotinylated protein ladder was added one hour later. This
experiment indicated that a dilution 1:1000 of 12-LOX antibody was slightly high but
still acceptable.
Figure 2.11: Optimization of 12-LOX (murine leukocyte) Polyclonal antiserum.
Dilution = 1:1000. HRP (Anti rabbit) secondary antibody, dilution = 1:1000. 12-LOX
expression after OA treatment in 46BR.IN fibroblasts in the presence and absence of
UVR. Protein dilution was 30 µg/well.

83
2. 8. Analysis of endocannabinoids by LC-MS/MS
2.8.1. Materials
Acetonitrile (HPLC grade), methanol (HPLC grade), chloroform (HPLC grade) and
glacial acetic acid (HPLC grade), all were purchased from, Fisher scientific,
Loughborough, UK. 50, 100, 250 and 500 µl glass syringes were purchased from SGE,
Australia. Glass tubes and glass Pasteur pipettes were purchased from Fisher,
Loughborough, UK. Amber glass vial, 100 µl insert vials, crew caps, and septa all were
purchased from Kinesis, Bedfordshire, UK.
2.8.2. Experimental description of LC-MS/MS analysis
Each pellet and medium from HaCaT keratinocytes and 46BR.IN fibroblasts was given
a code. The purpose of this was to blind the running of the samples in LC-MS/MS
analysis. Pellets and medium represent the same experimental design described in
section 2.2.7.
All endocannabinoids were analysed by multiple reaction monitoring (MRM) in the
positive ionization mode (ES+). Quantification is based on the construction of calibration
lines using commercially available standards and deuterated internal standards (AEA-
d8 and 2-AG-d8).
In this experiment the following compounds were analysed: AEA, 2-AG, PEA, ALEA,
LEA, OEA, STEA, DHEA, MEA, PDEA, POEA, HEA, DGLEA, DPEA, DEA, NEA, LGEA
and 1-AG. Chloroform/methanol 2:1(v/v) mixture (appendix 5 section 5.1) was added
into the cell pellets or the medium to extract polar and non-polar compounds. Water was
then added to form the bilayer phase, where the lipids in the lower chloroform layer and
the non-lipid components in the top methanol/water layer. Chloroform was removed by
evaporation under nitrogen (N2) and the lipid residue was then reconstituted in 100µl
ethanol (HPLC grade). Finally, the extracts were stored at -20 ºC before LC/ESI-MS/MS
analysis.

84
2.8.3. Extraction Protocol
All samples (pellets or culture medium) were defrosted in ice before start. 3 ml of ice
cold chloroform (CHCl3): methanol (MeOH) (2:1v/v all HPLC grade) (appendix 5 section
5.1) was added to the cell pellets and mixed well. However, 2 ml of the treated medium
were mixed with 9 ml of ice cold chloroform (CHCl3): methanol (MeOH). After that, 20ng
(20µl x 1ng/µl) of the internal standards anandamide-d8 (AEA-d8) and 40ng (40µl x
1ng/µl) 2-Arachidonoyl glycerol-d8 (2-AG-d8) (appendix 5 section 5.2) were added to
each sample (pellet or medium) using a Hamilton glass syringe. The syringe was wiped
with a clean tissue in between addition of the standard to the sample and refilling the
syringe sample. The samples were vortexed and left on ice for 30 min. During that time
the refrigerated centrifuge was switch on to cool down to 4 oC and the centrifuge was
set to 5 x 1000 RPM. 0.5 ml of Mill Q water was added to each cell pellets; but not to
the medium, to generate the two phase layers. The sample was mixed well and
centrifuged for 5 min at 4 oC, 5000 RPM.
The bottom organic phase was transferred into a clean glass 12ml vial using a glass
Pasteur pipette. After that the organic phase was dried down under nitrogen and the
extract reconstituted in 100µl of ethanol (HPLC grade) using a Hamilton glass syringe.
The syringe was wiped with a clean tissue in between addition. The ethanol was dripped
around the inside of the tube to collect dried lipids. Then, the collection was mixed well
and centrifuged for 10 seconds. At that point all the extracts were transferred to an insert
in a labelled amber vial with septa and lid. A parafilm was wrapped around the lid to
stop evaporation of solvent and stored on ice until finished. The syringe was washed
with 3x ethanol washes 1 and 2 and the extracts were kept in -20 oC while awaiting LC-
MS/MS analysis.
2.8.4. LC-MS/MS analysis of endocannabinoids and NAE
AEA, 2-AG, PEA, ALEA, LEA, OEA, STEA, DHEA, MEA, PDEA, POEA, HEA, DGLEA,
DPEA, DEA, NEA, LGEA and 1-AG were separated using an isocratic system
composed of two solvents (A and B) mixed at constant ratio of 30:70 (v/v).

85
Solvent A was acetonitrile: water: acetic acid, 2:98:0.5 (v/v/v) and solvent B was
acetonitrile: water: acetic acid, 98: 2: 0.5 (v/v/v).
The run time was set at 69 min. Separation was performed on a C18 (Luna 5µl, 150 x
2.0 mm) column. The injection volume was 3µl for standards and the biological extracts.
Details of MRM transitions, as well as indicative retention times, for 12
endocannabinoids and their congeners were shown in Table 2.3. The instrument is
operated in the positive ionisation mode, and for all compounds, the MS/MS settings
are as follows: capillary voltage 4500 V, source temperature 100 ºC, desolvation
temperature 400 ºC, cone voltage 35 Dwell time 0.2 s. The transitions should be split at
10 min so that those that are eluted before 10 min and those that are eluted after 10
min have a more focussed analysis. LC/ESI-MS/MS analysis was performed on a
Waters Alliance 2695 HPLC pump with a Waters 2690 autosampler coupled to an
electrospray ionisation (ESI) triple quadruple Quattro Ultimo mass spectrometer. The
Mass LynxTM V 4.0 was used as operating software to control the instrument and data
acquisition.
Table 2.3 multiple reaction monitoring (MRM) transitions for the LC/ESI-MS/MS
assay of endocannabinoids and their congeners
Compound MRM Collision energy (eV)
Retention time* (min)
PEA 300>62 13 32.57
ALEA 322>62 14 20.53
LEA 324>62 15 25.89
OEA 326>62 16 38.92
STEA 328>62 15 51.46
AEA 348>62 15 26.30
AEA-d8 356>63 16 25.92
DHEA 372>62 15 25.51
2-AG 379>287 18 35.01
2-AG-d8 387>295 20 34.13
1-AG 379>287 18 37.63
MEA 272>62 12 4.76
PDEA 286>62 12 5.42
POEA 298>62 14 5.07
HEA >62 12 7.27
DGLEA 350>62 14 6.11
DPEA 374>62 14 5.79

86
2.8.5. Standards for quantification and calibration lines
The following standards were used to generate calibration lines: AEA, 2-AG, PEA,
ALEA, LEA, OEA, STEA, DHEA, MEA, PDEA, POEA, HEA, DGLEA, DPEA, DEA, NEA,
LGEA and 1-AG (appendix 5 section 5.3). These calibration lines were used to calculate
the quantity of each one of the endocannabinoid compound of interest. At least 5
concentrations each calibrate should be used for each calibration line and
concentrations ranged from 1-200 pg/µl (Table 2.5). However, the range of these
calibration lines can be adjusted depending on the amount of compound found in the
samples. Standards are made up in amber vials with 100 µl inserts, sealed with Parafilm
and stored at -20 ºC until analysis. By integrating the chromatograms from each
standard concentration, the area under the peak for each compound from the first and
second injections can be determined. Additionally, as each injection also contains an
internal standard representative of each type of endocannabinoid, these peak-area
values can be normalized as a peak-area to internal standard ratio. The mean peak-
area to internal standard ratio for each concentration of standard can be used to
construct a calibration line, which can be analyzed by the least-squares linear
regression method to calculate its gradient.
Table 2.4: Guidelines for the generation of standards of different concentrations
to be used to construct an endocannabinoid calibration line
Final concentration (pg/µl)
200
160
120
100
80 50 40 20 10 4 2 1
Ethanol (µl) 10 20 30 35 40 47.5
50 55 57.5
59 59.5
59.75
400 pg/µl cocktail (µl)
50 40 30 25 20 12.5
10 5 2.5 1 0.5 0.25
1 ng/µl 2-AG-d8 (µl)
40 40 40 40 40 40 40 40 40 40 40 40
1 ng/µl AEA-d8 (µl)
40 40 40 40 40 40 40 40 40 40 40 40
Final volume (µl)
100*
100*
100*
100*
100*
100*
100*
100*
100*
100*
100*
100*
*Final volume does not include 40 µl of 1 ng/µl 2-AG-d8 as this internal standard is dried
down before the addition of other reagents, so it does not contribute to the final volume.

87
2.9 Clinical study
The clinical study was conducted by the group of Professor LE Rhodes at the Salford
Royal Photodermatology Unit. All samples were collected by Sarah Felton (OXFORD
UNIVERSITY HOSPITALS NHS TRUST). This work is part of a research collaboration
between the two labs.
2.9.1. Experimental design
Prof LE Rhodes and Dr Sarah Felton designed and undertook this study. Sixteen
healthy volunteers aged 23-59 years from Greater Manchester, UK, were engaged in
this study: 10 white Caucasians of skin phototype II and 6 South Asians of skin
phototype V. Subjects were excluded from participation if pregnant or breastfeeding,
taking vitamin D supplements or photoactive medication, if they had a personal history
of skin cancer, photosensitivity or systemic lupus erythematosus, or if they had used a
sunbed/sunbathed in the 3 months prior to commencement of the study, or during the
study period. All received and read the study information leaflets at least a week prior
to their decision to take part. They subsequently attended for an initial assessment visit
where the study was discussed and they were given the opportunity to ask questions
before providing their consent to participate. The Tables (2.5 and 2.6) below illustrates
the time points of UV radiation and blood samples collection throughout the study.
Volunteers were given short, sub-erythemal exposures to UV radiation three times
weekly for 6 weeks, whilst wearing informal summer clothing.
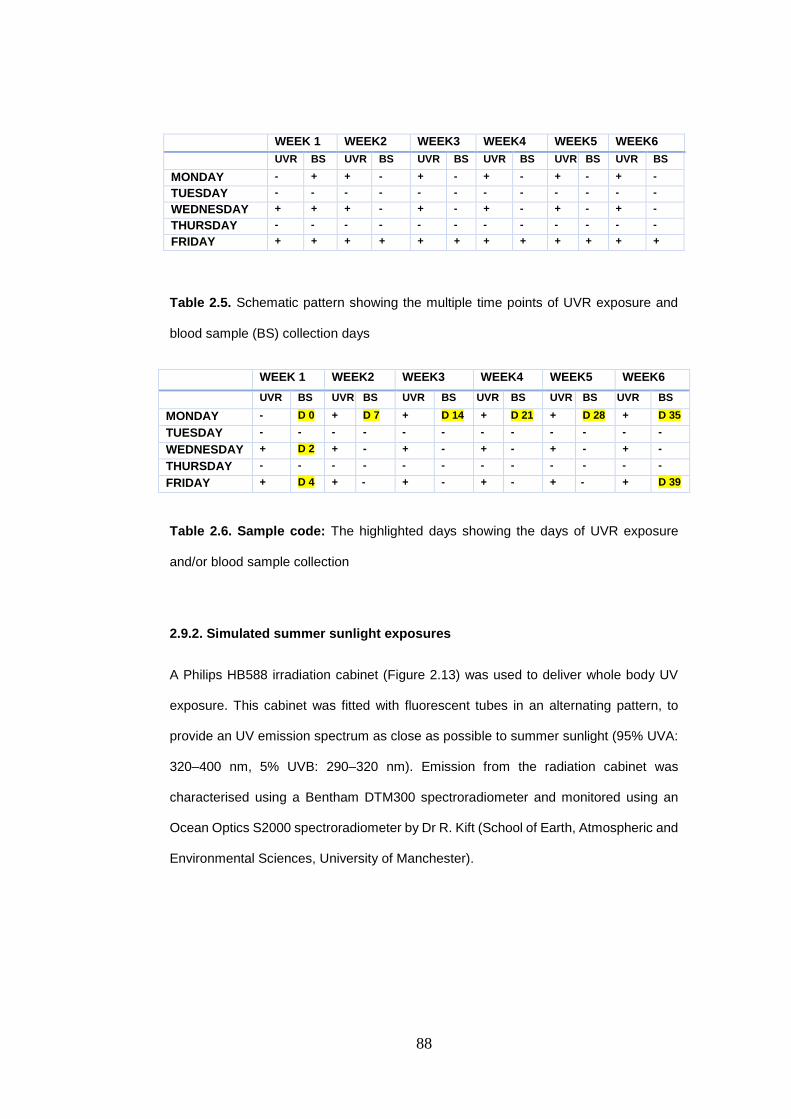
88
WEEK 1 WEEK2 WEEK3 WEEK4 WEEK5 WEEK6
UVR BS UVR BS UVR BS UVR BS UVR BS UVR BS
MONDAY - + + - + - + - + - + -
TUESDAY - - - - - - - - - - - -
WEDNESDAY + + + - + - + - + - + -
THURSDAY - - - - - - - - - - - -
FRIDAY + + + + + + + + + + + +
Table 2.5. Schematic pattern showing the multiple time points of UVR exposure and
blood sample (BS) collection days
WEEK 1 WEEK2 WEEK3 WEEK4 WEEK5 WEEK6
UVR BS UVR BS UVR BS UVR BS UVR BS UVR BS
MONDAY - D 0 + D 7 + D 14 + D 21 + D 28 + D 35
TUESDAY - - - - - - - - - - - -
WEDNESDAY + D 2 + - + - + - + - + -
THURSDAY - - - - - - - - - - - -
FRIDAY + D 4 + - + - + - + - + D 39
Table 2.6. Sample code: The highlighted days showing the days of UVR exposure
and/or blood sample collection
2.9.2. Simulated summer sunlight exposures
A Philips HB588 irradiation cabinet (Figure 2.13) was used to deliver whole body UV
exposure. This cabinet was fitted with fluorescent tubes in an alternating pattern, to
provide an UV emission spectrum as close as possible to summer sunlight (95% UVA:
320–400 nm, 5% UVB: 290–320 nm). Emission from the radiation cabinet was
characterised using a Bentham DTM300 spectroradiometer and monitored using an
Ocean Optics S2000 spectroradiometer by Dr R. Kift (School of Earth, Atmospheric and
Environmental Sciences, University of Manchester).

89
Figure 2.12: Philips HB588 cabinet. Adapted from (www.philips.com). December, 2014.
2.9.3. Irradiation Protocol
Wearing protective eye goggles, standardised T-shirts and knee-length shorts,
volunteers lay prone (i.e. face down) on the sunbed with the canopy closed.
Approximately 35% of their skin surface area was exposed. A 6-week course of
exposures was selected to be concordant with the length of the summer school holiday
period when the population is most exposed to sunlight. The course of simulated
summer sunlight was given three times a week in January and February when ambient
UVB is negligible at UK latitudes and people have their lowest vitamin D status (Webb
and Engelsen, 2006). An exposure of 1.35 standard erythemal dose (SED) (Diffey et
al., 1997) was given to each subject at every visit. The time required to deliver this dose
was found to be 6.5 min after accurate measurement of cabinet UV irradiance (Taylor
et al., 2002); a constant UV dose was maintained throughout the study by adjusting for
any decrease in irradiance by increasing delivery time.
2.9.4. Skin colour measurements
All participants had assessments of their buttock skin colour non-invasively at baseline
(i.e. prior to sunbed exposure) using a Minolta CM-2500d hand-held spectrophotometer
(Figure 2.14). Readings were taken when the volunteers had been placed prone for 3
min prior to their irradiation, to eliminate heat from the sunbed and postural variations

90
in circulation as confounding factors. UV-exposed and UV-protected buttock skin
subsequently underwent weekly spectrophotometric measurements. Data were
recorded in standard three-dimensional L*A*B* format, as recommended by the
Commission International de le’Eclairage (Robertson, 1978). L*represents white-black
differentiation, whereby an L* of 100 is pure white and conversely L* of 0 is pure black,
A* values reflect the balance between green (negative) and increasing redness
(positive) whilst B* represents the differentiation between blue (negative) and yellow
(positive). The spectrophotometer was ‘Zero calibrated’ at study commencement by Dr
D Allan, in addition to being calibrated using its ‘White Calibration’ system each time the
power was turned on prior to each participant’s measurements, to guarantee accuracy
of readings. Readings were made in triplicate at each site and the mean calculated.
Figure 2.13: Spectrophotometer. Adapted from. (www.konicaminolta.com). December,
2014.
2.9.5. Blood collection and serum separation
Each volunteer had a venous blood sample taken at baseline for measurement of
endocannabinoids (anandamide and 2-arachidonoyl glycerol). Samples were repeated
at the beginning of each week of the study. Samples were centrifuged in a centrifuge
at 2400rpm for 15 minutes and once the serum had separated it was aspirated using a
pipette and stored in a glass sample vial in a -20°C freezer. The samples were then
transferred to the University of Manchester on dry ice and stored at -80°C awaiting LC-
MS/MS analysis.

91
2.9.6. Lipid Extraction
The total number was 153 serum samples, 147 samples had the same volume (400µl),
and the other 16 samples were in the range from 350µl to 1000µl. All the samples were
defrosted in ice. 3 ml of ice cold chloroform (CHCl3): methanol (MeOH) (2:1v/v all HPLC
grade) (appendix 5 section 5.1) was added to the serum and mixed well. After that, the
whole volume of each sample was transferred into a new 12 ml glass tube. 20ng (20µl
x 1ng/µl), 20µl of the internal standards Anandamide-d8 (AEA-d8) and 40ng (40µl x
1ng/µl), 40µl of 2-Arachidonoyl glycerol-d8 (2-AG-d8) (appendix 5 section 5.2) was
added to each sample using a Hamilton glass syringe. The syringe was wiped with a
clean tissue in between addition of the standard to the sample and refilling the syringe
sample. The samples were mixed well and left on ice for 30 min (Samples were mixed
each 10 min). During that time the refrigerated centrifuge was switch on to cool down to
4 oC and the centrifuge was set to 5 x 1000 RPM. 0.5 ml or 1 ml of Mill Q water was
added to each sample, to generate the two phase layers. The samples were mixed well
and centrifuged for 5 min at 4 oC, 5000 RPM. The bottom organic phase was transferred
into a clean glass 12ml vial using a glass Pasteur pipette. After that the organic phase
was dried down under nitrogen and the extract reconstituted in 100µl of ethanol (HPLC
grade) using a Hamilton glass syringe. The syringe was wiped with a clean tissue in
between addition. The ethanol was dripped around the inside of the tube to collect dried
lipids. Then, the collection was mixed well and centrifuged for 10 seconds. At that point
all the extracts were transferred to an insert in a labelled amber vial with septa and lid.
A parafilm was wrapped around the lid to stop evaporation of solvent and stored on ice
until finished. The syringe was washed with 3x ethanol washes 1 and 2 and the extracts
were kept in -20 oC awaiting for LC-MS/MS analysis as described in sections 2.8.4 and
2.8.5.
92
2.10. Statistical Analysis
Data are presented as mean ± standard deviation where appropriate. In order to
determine that our data are parametric or non-parametric, all the data were subjected
to Shapiro-wik’s test (P>0.05) and their skewness and standard error were measured.
The histogram of all the data was inspected visually. Regarding to the Z value (which
was calculated manually by dividing the skewness value on the standard error), some
of our data have a small skew but it does not differ significantly from normality.
Therefore, it was assumed that the data are approximately normally distributed.
Comparisons between groups in chapters 3, 4 and 5 were made with one-way analysis
of variance (ANOVA) followed by Tukey post hoc test. In chapter 5 the comparison was
carried out between the different time points of UVR exposure in each skin phototype
separately. All statistical analyses were done using SPSS Statistics software version
22. P < 0.05 was considered to be a significant level of difference.

93
CHAPTER 3: The effect of n-3 PUFA on the formation of endocannabinoids and N-acylethanolamines in HaCaT keratinocytes and 46BR.IN fibroblasts in response to ultraviolet radiation
3.1 Introduction
The endocannabinoid system has been identified in different types of skin cells and
tissues as reported in several studies (Mechoulam et al., 1998; Howlett et al., 2002;
Pacher et al., 2006; Di Marzo, 2008). These studies reported the existence of AEA and
2-AG, in human skin along with the enzymes that are involved in their synthesis and
metabolism (Calignano et al., 1998; Berdyshev et al., 2000; Maccarrone et al., 2003;
Karsak et al., 2007). Moreover, the cannabinoid receptors CB1 and CB2 were identified
in many types of human and murine skin cells such as organ-cultured hair follicles, SZ95
sebocytes, cutaneous nerve fibres, mast cells and epidermal keratinocytes (Ständer et
al., 2005, Ibrahim et al., 2005, Blázquez et al., 2006, Telek et al., 2007b, Telek et al.,
2007a, Casanova et al., 2003). Endocannabinoids are also involved in the regulation of
human epidermal homeostasis. AEA, for instance has been found to inhibit the
differentiation of cultured normal human epidermal keratinocytes (NHEKs) and HaCaT
keratinocytes (Maccarrone et al., 2003; Paradisi et al., 2008). Endocannabinoids also
exert a protective role in skin allergic inflammation (Karsak et al., 2007).
The endocannabinoids AEA is an N-acylethanolamines (NAE). Other NAE, such as N-
palmitoylethanolamide (PEA), N-oleoylethanolamide (OEA) and N-
stearoylethanolamide (SEA), show different receptor preference, including affinity for
GPR55, GPR18, GPR119, TRPV1 (transient receptor potential channel type V1) or
PPARa, while often showing less or no affinity for CB1 or CB2 receptors (Alexander and
Kendall, 2007; Di Marzo et al., 2007; Farrell and Merkler, 2008; Hansen and Diep,
2009). Therefore, they were not always classified as endocannabinoids because they
lack the affinity to the endocannabinoid receptors. The group of NAE contains more
than 80 different conjugates of long-chain fatty acids with amino acids (lipoamino acids;
elmiric acids) or neurotransmitters (Burstein and Zurier, 2009; Connor et al., 2010; Tan
et al., 2010). NAE can be rapidly synthesized in membranes, released on demand by
the same biosynthesis pathway of AEA and degraded by the enzyme FAAH (Bisogno,

94
Ligresti et al. 2005, Bisogno 2008). In addition, NAE can also be produced through the
direct conversion of the n-3 PUFA to yield for example palmitoylethanolamide (PEA)
which has anti-inflammatory properties (Klein, Newton et al. 2003, Klein 2005,
O'Sullivan 2007, Hoareau, Buyse et al. 2009). Based on all this information we believe
that n-3 PUFA have a role in the endocannabinoids biosynthesis. Furthermore, n-3
PUFA, especially EPA and DHA, are considered a dietary component with a promising
photoprotective action against the deleterious effects of UVR (Black et al., 1992,
Rhodes et al., 1994, Rhodes et al., 1995). They exert their anti-inflammatory effects by
their competition with AA as substrates for COXs and LOXs, resulting in the formation
of less active prostaglandins and leukotrienes (Lands et al., 1992). N-3 PUFA also
reduces UVB-erythemal sensitivity in humans (Rhodes et al., 1994), by inhibition of
UVB-induced PGE2 levels in the skin (Rhodes et al., 1995).
3.2 Aims of the study
The aim of this study was to explore the hypothesis that EPA and DHA may play a role
in protecting human skin cells against the harmful effects of UVR through their effect on
the formation of endocannabinoids and other NAE. This study was carried out using a
model system including HaCaT keratinocytes and 46BR.1N fibroblasts. The specific
objective was to investigate the effect of n-3 PUFA on the formation of
endocannabinoids and other NAE in HaCaT and 46BR.1N cells pellets (intracellular)
and cell culture medium (extracellular) in response to UVR.

95
3.3 Materials and Methods
3.3.1. Material (refer to section 2.8.1 chapter 2)
3.3.2. Experimental description of LC-MS/MS analysis (refer to section 2.8.2
chapter 2)
3.3.3. Extraction protocol (refer to section 2.8.3 chapter 2)
3.3.4. LC-MS/MS analysis of endocannabinoids and NAE (refer to section 2.8.4
chapter 2)
3.3.5. Standards for quantification and calibration lines (refer to section 2.8.5
chapter 2)
3.3.6. Statistical analysis (refer to section 2.10. chapter 2)
3.4. RESULTS
The concentration of fatty acids and UVR dose used for this work were not toxic to the
cells. This was established by another research worker in the lab and the data is
included in his PhD thesis (Al-Aasswad 2013).
3.4.1. Quantification of endocannabinoids and NAE in irradiated and non-
irradiated HaCaT keratinocytes treated with OA
Treatment with OA 10µM or 50µM decreased STEA levels to be 369 pg/mg and 289
pg/mg respectively, in concentration dependent manner compared to the non-irradiated
control, 422 pg/mg (Figure 3.1A, compare bar 1 to bars 3 and 5). When these cells were
submitted to UV radiation, their STEA levels were 393 pg/mg and 273 pg/mg
respectively in OA 10µM and 50µM (Figure 3.1, compare bar 2 to bars 4 and 6).This
result indicated that UVR could not reverse OA effect on this mediator. However, STEA
level was increased in the irradiated HaCaT control cells, 522 pg/mg, compared to the
nonirradiated HaCaT cells (Figure 3.1, compare bar 1 with bar 2).

96
PEA levels estimated in the untreated cells were 1027pg/mg (Figure 3.1B, bar 1). Small
reduction (836 pg/mg and 900 pg/mg) of the PEA levels was evident in the cells treated
with either OA10µM or 50µM, respectively (Figure 3.1B, compare bar 1 to bars 3 and
5). The highest level of PEA was found in the irradiated control sample, 1374 pg/mg
(Figure 3.1, compare bar 2 to bar 1). Submitted OA treated cells 10µM or 50µM to UVR
resulted in a dose dependent decrease in PEA levels 982 pg/mg and 827pg/mg
compared to the irradiated control cells (Figure 3.1B, compare bar 2 to bars 4 and 6).
The OEA levels in the control untreated cells were assessed to be 1471 pg/mg (Figure
3.1C, bar 1). This level decreased in a dose dependent manner to 1140 pg/mg and 1099
pg/mg in HaCaT cells treated with OA 10µM or 50µM respectively (Figure 3.1C, bar 3
and bar 5). Exposing the OA treated cells (10µM and 50µM) to UVR also decreased the
OEA level in a dose dependent fashion, 1240 pg/mg and 1113 pg/mg compared to the
irradiated control cells 1632 pg/mg (Figure 3.1C, compare bar 2 to bars 4 and 6).
Treatment with OA10µM or 50µM did not induce significant changes in LEA levels, 51
pg/mg and 43 pg/mg compared to the untreated control cells 59 pg/mg (Figure 3.1D,
compare bar 1 to bars 3 and 5). In the irradiated cells LEA level was estimated to be 58
pg/mg indicating that UVR did not affect the LEA levels in these cells compared to the
nonirradiated control cells (Figure 3.1D, compare bar 1 to bar 2). UV radiation of OA
10µM or 50µM treated cells induced fluctuated levels of LEA, 64 pg/mg and 39 pg/mg
respectively, compared to the irradiated control cells 58 pg/mg (Figure 3.1D, compare
bar 2 to bar 4 and 6).
DHEA levels in HaCaT cells were estimated to be 480 pg/mg (Figure 3.1E, bar 1).
Treatment of HaCaT cells with 10µM OA alone induced a minor increase in the DHEA
level 559 pg/mg compared to the untreated cells (Figure 3.1E, compare bar 1 to bar 3)
whereas increase of the OA dose to 50µM decreased the DHEA level 265 pg/mg
compared to those observed in the untreated cells (Figure 3.1E, compare bar 1 to bar
5). The highest DHEA level was found in the irradiated control sample, which was
estimated to be 643 pg/mg (Figure 3.1E, bar 2). This level decreased in a dose

97
dependent fashion to 469 pg/mg and 226 pg/mg when the OA 10µM or 50µM treated
cells were irradiated (Figure 3.1E, compare bar 2 to bars 4 and 6).
AEA levels were estimated to be 433 pg/mg in the control untreated HaCaT cells (Figure
3.1F, bar 1). Treatment with OA 10µM decreased the AEA level to 295 pg/mg (Figure
3.1F, compare bar 1 to bar 3). In addition, further reduction in AEA level 195 pg/mg was
seen when the OA concentration was increased to 50µM (Figure 3.1F, compare bar 1
to bar 5). In the irradiated control HaCaT cells AEA level reduced to 371 pg/mg
compared to the nonirradiated control cells (Figure 3.1F, compare bar 1 to bar 2).
Exposed OA 10µM and 50µM treated cells to UV light dose dependently decreased the
AEA level to 263 pg/mg and 173pg/mg (Figure 3.1F, compare bar 2 to bars 4 and 6).
This indicated that the OA and UVR synergistically down-regulated AEA levels.
2-AG level was recorded to be 2732 pg/mg in the untreated HaCaT control cells. (Figure
3.1G bar, 1). Concentration dependent decrease, 2255 pg/mg and 1668 pg/mg was
observed in 2-AG levels when HaCaT cells were treated with OA 10µM or 50µM (Figure
3.1G compare bar 1 to bars 3 and 5). In the irradiated HaCaT control cells 2-AG level
was slightly reduced to 2520 pg/mg compared to the nonirradiated control cells (Figure
3.1G compare bar 1 to bar 2). Minor increase in 2-AG level was seen in HaCaT
irradiated cells treated with OA 10µM (Figure 3.1G compare bar 2 to bar 4). However,
this level was decreased again when these cells were treated with OA 50µM (Figure
3.1G compare bar 2 to bar 6).
1-AG level was slightly lower in the untreated control HaCaT cells 2208pg/mg compared
to the irradiated control cells 2504 pg/mg (Figure 3.1H compare bar 1 and bar 2). The
level of 1-AG was also decreased in a dose dependent manner, 2040 pg/mg and 1550
pg/mg respectively in OA 10µM or 50µM treated cells compared to the untreated (Figure
3.1 compare bar 1 to bars 3 and 5). Similar results were observed when OA 10µM or
50µM (2487pg/mg and 1504pg/mg) treated cells were irradiated compared to the
irradiated control (Figurer 3.1 compare bar 2 to bars 4 and 6).
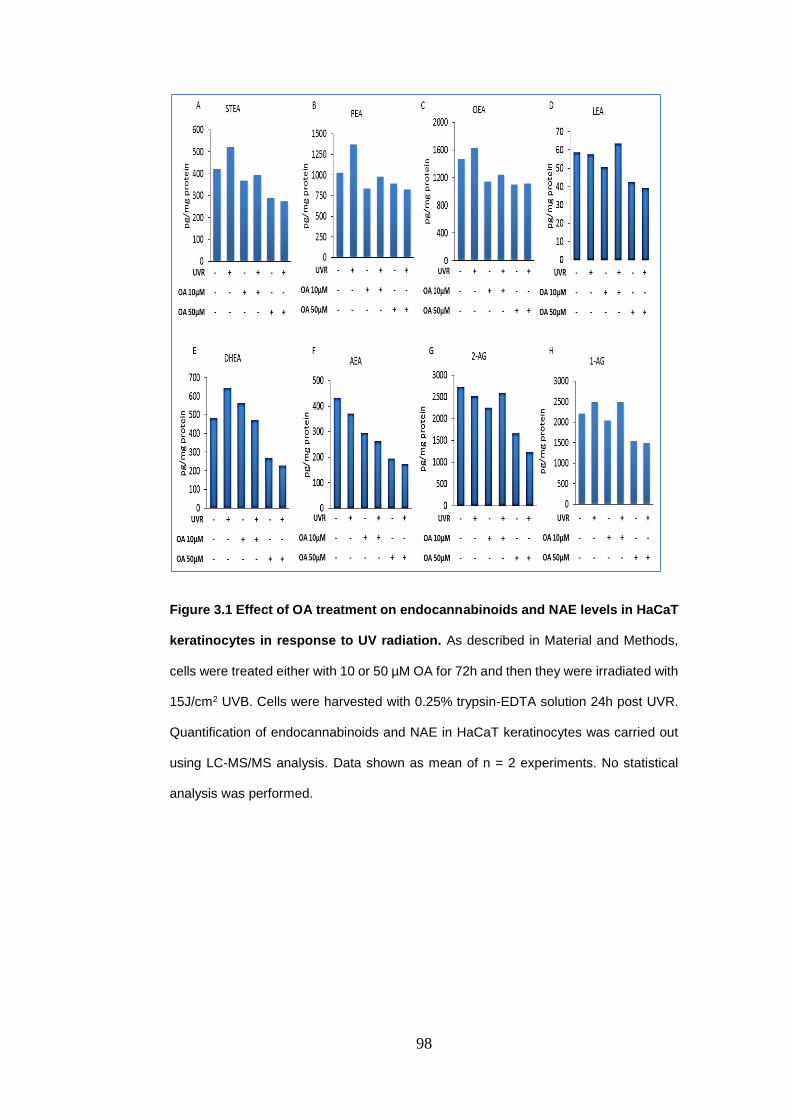
98
Figure 3.1 Effect of OA treatment on endocannabinoids and NAE levels in HaCaT
keratinocytes in response to UV radiation. As described in Material and Methods,
cells were treated either with 10 or 50 µM OA for 72h and then they were irradiated with
15J/cm2 UVB. Cells were harvested with 0.25% trypsin-EDTA solution 24h post UVR.
Quantification of endocannabinoids and NAE in HaCaT keratinocytes was carried out
using LC-MS/MS analysis. Data shown as mean of n = 2 experiments. No statistical
analysis was performed.

99
3.4.2. Quantification of endocannabinoids and NAE in irradiated and non-
irradiated HaCaT keratinocytes treated with DHA
Pellets from three independent experiments were extracted as described in materials
and Methods (Section 2.7.3) and analyzed for endocannabinoids and N-
acylethanolamines levels in irradiated and non-irradiated HaCaT Keratinocyte cells
treated with DHA.
The STEA level was estimated to be 483pg/mg in the untreated control HaCaT cells.
Treatment with DHA 10µM or 50µM for 72h induced dose dependent small reduction,
473pg/mg and 455pg/mg in the STEA levels compared to the untreated cells (Figure
3.2A compare bar 1 to bars 3 and 5). Compared to the irradiated control cells, STEA
level was slightly increased respectively to 505pg/mg and 492pg/mg in cells treated with
DHA 10µM or 50µM plus UVR (Figure 3.2A compare bar 2 with bars 4 and 6). No
significant differences were seen between groups in this experiment.
Figure 3.2B presented that the treatment with DHA either 10µM or 50µM moderately
increased the PEA levels in a dose dependent manner, 2350pg/mg and 2402pg/mg
compared to the untreated control cells which showed PEA level at1926pg/mg (Figure
3.2B compare bar 1 to bars 3 and 5). UVR-treated control showed the lowest PEA level
in this experiment (1476pg/mg) (Figure 3.2B bar 2). Compared to the irradiated control
cells, PEA levels also increased respectively to 2032pg/mg and 1776pg/mg in HaCaT
cells treated with DHA10µM or 50µM and submitted to UV radiation (Figure 3.10
compare bar 2 to bars 4 and 6). Statistically, there was a significant difference between
DHA 50µM and DHA 50µM plus UV radiation (P = 0.035).
OEA level was assessed to be 4030pg/mg in the untreated control cells (Figure 3.2C,
bar 1). Treatment with DHA 10µM or 50µM for 72h significantly decreased the OEA
levels, in a dose dependent fashion, respectively to 2504pg/mg (P = 0.001) and
2460pg/mg (P = 0.001) compared to the untreated control cells (Figure 3.2C compare
bar 1 to 3 and 5). Likewise, 2 fold decreases was seen in OEA level in the irradiated
control cells (1855pg/mg), compared to the non-irradiated control HaCaT cells (Figure
3.2C compare bar 2 to bar 1). Moreover, OEA levels were insignificantly decreased

100
when the irradiated cells were treated with DHA 50µM, 1794pg/mg (Figure 3.2C, bar 6).
However, this level was slightly increased, 2261pg/mg when the irradiated cells were
treated with DHA 10µM (Figure 3.2C, bar 4).
LEA levels in the nonirradiated control cells were assessed to be 310pg/mg (Figure
3.2D bar 1) while, after the UVR stimulation of control cells, this level significantly
decreased 2 fold to 190 pg/mg (P = 0.002) (Figure 3.2D bar 2). Treatment with DHA
either 10µM or 50µM for 72h also significantly decreased the LEA levels to 79pg/mg (P
= 0.001) and 90pg/mg (P = 0.001) respectively, compared to the untreated HaCaT cells
(Figure 3.2D compare bar 1 to bars 3 and 5). Similar effect was seen, 69pg/mg (P =
0.002) and 94pg/mg (P = 0.01) when the DHA 10µM or 50µM treated cells were
irradiated compared to the irradiated control cells (Figure 3.2D compare bar 2 to bars 4
and 6).
DHEA levels in untreated HaCaT control cells were estimated to be 676pg/mg (Figure
3.2E, bar 1). DHEA level was slightly higher in the irradiated control 704pg/mg,
compared to the nonirradiated control cells (Figure 3.2E compare bar 1 to bar 2). DHEA
level significantly increased in nonirradiated HaCaT cells treated with DHA 50µM
2045pg/mg (P = 0.001), compared to control cells (Figure 3.2E compare bar 1 to bar 5).
While, DHA 10µM induced only minor increase in DHEA level, 912pg/mg compared to
its control cells (Figure 3.2E compare bar 1 to bar 5). However, DHEA level was
significantly increased when HaCaT cells treated with DHA 50µM, 2045pg/mg,
compared to those treated with 10µM, 912pg/mg (P = 0.001) (Figure 3.2E compare bar
3 to bar 5). In cells treated with DHA 50µM plus UVR DHEA level was also significantly
increased to 2382pg/mg compared to the irradiated cells treated with 10µM, 1340pg/mg
and to the irradiated control cells as well (P = 0.001) (Figure 3.2E compare bar 4 to bar
6 and compare bar 2 to bar 6).
AEA levels in untreated HaCaT cells were estimated to be 321pg/mg, whereas, this
level was slightly increased after UV radiation in control cells to be 353pg/mg (Figure
3.2 F, bar 1 and 2). AEA levels was dose dependently increased when HaCaT cells
were treated with DHA 10µM or 50µM to 397pg/mg and 421pg/mg respectively (Figure

101
3.2 F compare bar 3 to bar 5). Similar effect was seen when these treated cells were
irradiated (DHA10µM or 50µM, 413pg/mg and 447pg/mg respectively) (Figure 3.2 F
compare bar 4 to bar 6). However significant differences were only observed between
50µM and irradiated and nonirradiated control cells (P = 0.03 and 0.02 respectively)
(Figure 3.2 F compare bar 1 to bar 5 and compare bar 2 to 6).
2-AG level in the control sample was 4827 pg/mg, whereas, its level was almost the
same; 4836pg/mg after UVR exposure (Figure 3.2 G bar 1 and bar 2). Treatment with
DHA 10µM or 50µM for 72h, decreased the 2-AG level respectively to 3822pg/mg and
3651pg/mg, compared to the untreated control cells (Figure 3.2 G compare bar 1 to
bars 3 and 5). Furthermore, 2-AG levels in UVR-treated cells combined with DHA either
10µM or 50µM were also reduced to 3600pg/mg and 4277pg/mg respectively,
compared to the irradiated control cells (Figure 3.2 G compare bar 2 to bars 4 and 6).
1-AG level was estimated to be 5133 pg/mg in the untreated control cells (Figure 3.2 H
bar 1) No major change was seen in 1-AG level 5345pg/mg, after UV irradiation (Figure
3.2 H compare bar 1 to bar 2). Whereas, treatment with DHA 10µM or 50µM for 72h,
significantly decreased 1-AG levels to 3341pg/mg (P = 0.01) and 2782pg/mg (P =
0.002), compared to the untreated control cells (Figure 3.2 H compare bar 1 to 3 and
5). Additionally, 1-AG level was also significantly decreased in a dose dependent
manner, 3700pg/mg (P = 0.02) and 2692pg/mg (P = 0.001) when the UVR-stimulated
cells were treated with DHA 10µM or 50µM compared to the irradiated control cells
(Figure 3.2 H compare bar 2 to bars 4 and 6).

102
Figure 3.2 Effect of DHA treatment on endocannabinoids and NAE levels in HaCaT
keratinocytes in response to UV radiation. As described in Material and Methods,
cells were treated either with DHA10 or 50µM for 72h and then they were irradiated with
15J/cm2 UVB. Cells were harvested with 0.25% trypsin-EDTA solution 24h post UVR.
Quantification of endocannabinoids and NAE in HaCaT keratinocytes was carried out
using LC-MS/MS analysis. Data shown as mean ± SD of n = 3 experiments. *P<0.05,
**P<0.01, ***P<0.001, comparing data to control. Figure B, * = compare to non-
irradiated cells treated with DHA 50µM, $. Figure E, § = compared to non-irradiated cells
treated with DHA 10µM while, ≠ = compared to irradiated cells treated with DHA 10µM.

103
3.4.3. Quantification of endocannabinoids and NAE in irradiated and non-
irradiated HaCaT keratinocytes treated with EPA
Pellets from three independent experiments were extracted as described in Materials
and Methods (Section 2.7.3) and analyzed for endocannabinoids and N-
acylethanolamines levels in irradiated and non-irradiated HaCaT keratinocyte cells
treated with EPA. Data are presented as mean ± standard deviation where appropriate.
Comparisons between groups were made with one-way analysis of variance (ANOVA)
followed by Tukey test using SPSS Statistics software. P < 0.05 was considered as
significant level of difference.
STEA levels in HaCaT control cells were assessed to be 389pg/mg (Figure 3.3 A bar
1). Treatment with EPA 10µM or 50µM for 72h did not induce significant changes in
STEA levels which was estimated between 382pg/mg and 438pg/mg compared to the
untreated control cells (Figure 3.3 A, compare bar 1 to 3 and 5). However, UVR induced
minor decreases in STEA level either in control cells or in the treated cells (316pg/mg,
347pg/mg and 357pg/mg compare bar 2 with bars 4 and 6 respectively).
PEA level was calculated to be 2699 in untreated control cells (Figure 3.3 B, bar 1).
Treatment with EPA 10 µM or 50 µM resulted in small decreases in PEA levels in these
cells, 2162pg/mg and 2288pg/mg respectively compared to untreated control cells
(Figure 3.3 B, compare bar 1 to bars 3 and 5). However, PEA level was significantly
reduced in irradiated cells to 1935pg/mg compared to nonirradiated HaCaT cells (P =
0.035) (Figure 3.3 B, compare bar 1 to bar 2). Whereas, when the EPA treated cells
were subjected to UVR there were no significant changes in PEA levels (1953pg/mg
and 2001pg/mg) compared to irradiated control cells (Figure 3.3 B, compare bar 2 to
bars 4 and 6).
Untreated HaCaT cells showed OEA level at 2069 pg/mg (Figure 3.3 C, bar 1).
Treatment of the HaCaT Keratinocyte cell with two different concentrations of EPA
(10µM or 50µM) for 72h increased the OEA levels to 2184 pg/mg and 2564 pg/mg,
respectively in dose dependent manner (Figure 3.3 C compare bar 1 to 3 and 5).
Likewise, OEA level was also increased in irradiated control cells to 2429 pg/mg.

104
However, this effect of UVR was reversed in dose dependent way in EPA10µM or 50µM
treated cells to 2085 pg/mg and 1807pg/mg, respectively) when they were irradiated
(Figure 3.3 C, compare bar 2 to bars 4 and 6).
LEA levels in HaCaT control cells were assessed to be 334 pg/mg (Figure 3.3 D, bar 1)
while, after the UVR exposure this level significantly fallen to 158 pg/mg (P = 0.001)
(Figure 3.3 D, bar 2). Treatment with EPA 10µM or 50µM for 72h decreased the LEA
levels to 242 pg/mg and 214 pg/mg, respectively, in dose dependent manner (Figure
3.3 D compare bar 1 to 3 and 5). However, the difference was only significant (P =
0.012) between untreated control and EPA 50 µM treated cells (Figure 3.3 D, compare
bar 1 with bar 5). In irradiated control cells LEA level was dropped to 158 pg/mg (Figure
3.3 D, bar 2), but raised in EPA10µM treated cells to 198pg/mg (Figure 3.3 D, bar 4)
and then decreased further to 120 pg/mg in the EPA 50µM treated cells. (Figure 3.3 D,
bar 6).
DHEA levels in the untreated control cells were found to be 1061pg/mg (Figure 3.3 E,
bar 1). Treatment with EPA either 10 µM or 50 µM significantly reduced DHEA levels to
783 pg/mg and 754 pg/mg respectively in dose dependent manner compared to the
untreated control cells (P = 0.001)(Figure 3.3 E, compare bar 1 to bars 3 and 5).
Moreover, UVR induced significant down-regulation in DHEA level to 821pg/mg
compared to the non-irradiated control cells (P = 0.001) (Figure 3.3 E, compare bar 2
to bar 1). These effect also continued when EPA 10µM (733 pg/mg) or 50µM (684
pg/mg) treated HaCaT cells were subjected to UV radiation compared to the irradiated
control cells (Figure 3.3 E, compare bar 2 to bars 4 and 6).
Figure 3.3 F showed that treatment with EPA at two different concentrations; 10 µM or
50 µM did not induce any noteworthy changes in AEA levels which was estimated to
be 93 pg/mg and 112 pg/mg respectively, compared to untreated control cells,
107pg/mg (Figure 3.3 F, compare bar 1 to bars 3 and 5). However, AEA level was
increased in irradiated HaCaT cells treated with EPA 10µM or 50µM to 116pg/mg and
119pg/mg compared to the irradiated control cells that its AEA level was estimated to
be 95pg/mg (Figure 3.3 F, compare bar 2 to bars 4 and 6). Statistical analysis showed
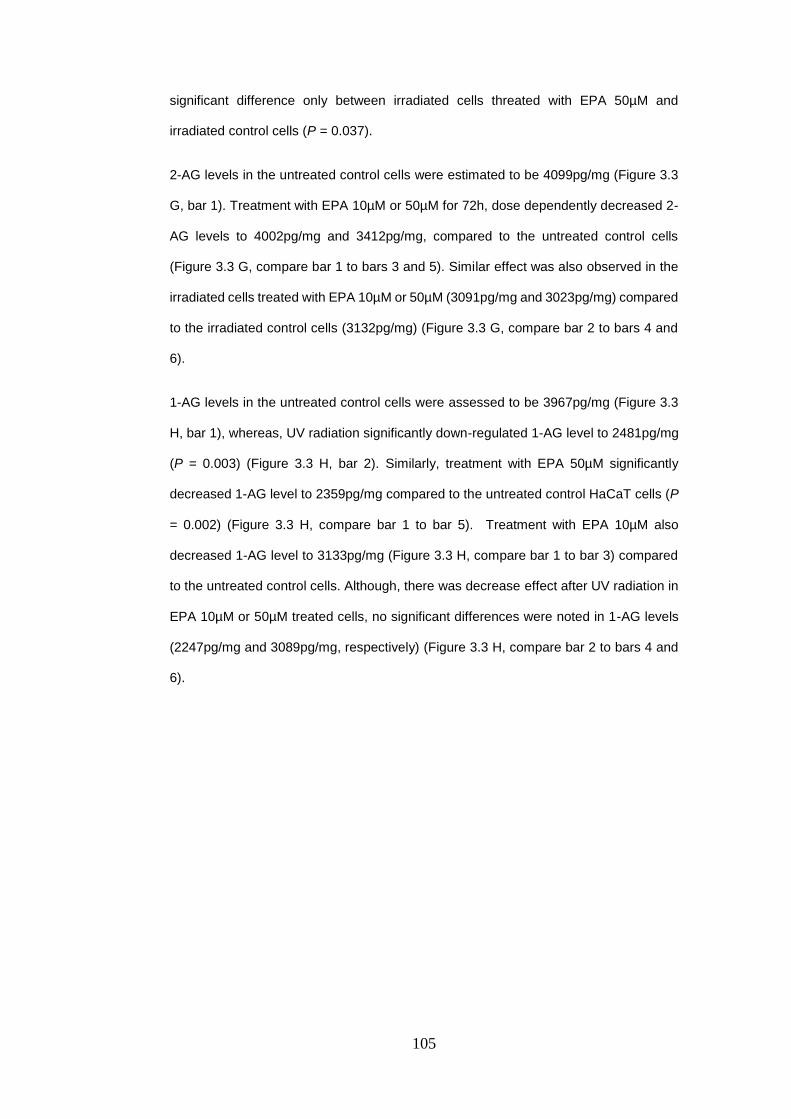
105
significant difference only between irradiated cells threated with EPA 50µM and
irradiated control cells (P = 0.037).
2-AG levels in the untreated control cells were estimated to be 4099pg/mg (Figure 3.3
G, bar 1). Treatment with EPA 10µM or 50µM for 72h, dose dependently decreased 2-
AG levels to 4002pg/mg and 3412pg/mg, compared to the untreated control cells
(Figure 3.3 G, compare bar 1 to bars 3 and 5). Similar effect was also observed in the
irradiated cells treated with EPA 10µM or 50µM (3091pg/mg and 3023pg/mg) compared
to the irradiated control cells (3132pg/mg) (Figure 3.3 G, compare bar 2 to bars 4 and
6).
1-AG levels in the untreated control cells were assessed to be 3967pg/mg (Figure 3.3
H, bar 1), whereas, UV radiation significantly down-regulated 1-AG level to 2481pg/mg
(P = 0.003) (Figure 3.3 H, bar 2). Similarly, treatment with EPA 50µM significantly
decreased 1-AG level to 2359pg/mg compared to the untreated control HaCaT cells (P
= 0.002) (Figure 3.3 H, compare bar 1 to bar 5). Treatment with EPA 10µM also
decreased 1-AG level to 3133pg/mg (Figure 3.3 H, compare bar 1 to bar 3) compared
to the untreated control cells. Although, there was decrease effect after UV radiation in
EPA 10µM or 50µM treated cells, no significant differences were noted in 1-AG levels
(2247pg/mg and 3089pg/mg, respectively) (Figure 3.3 H, compare bar 2 to bars 4 and
6).
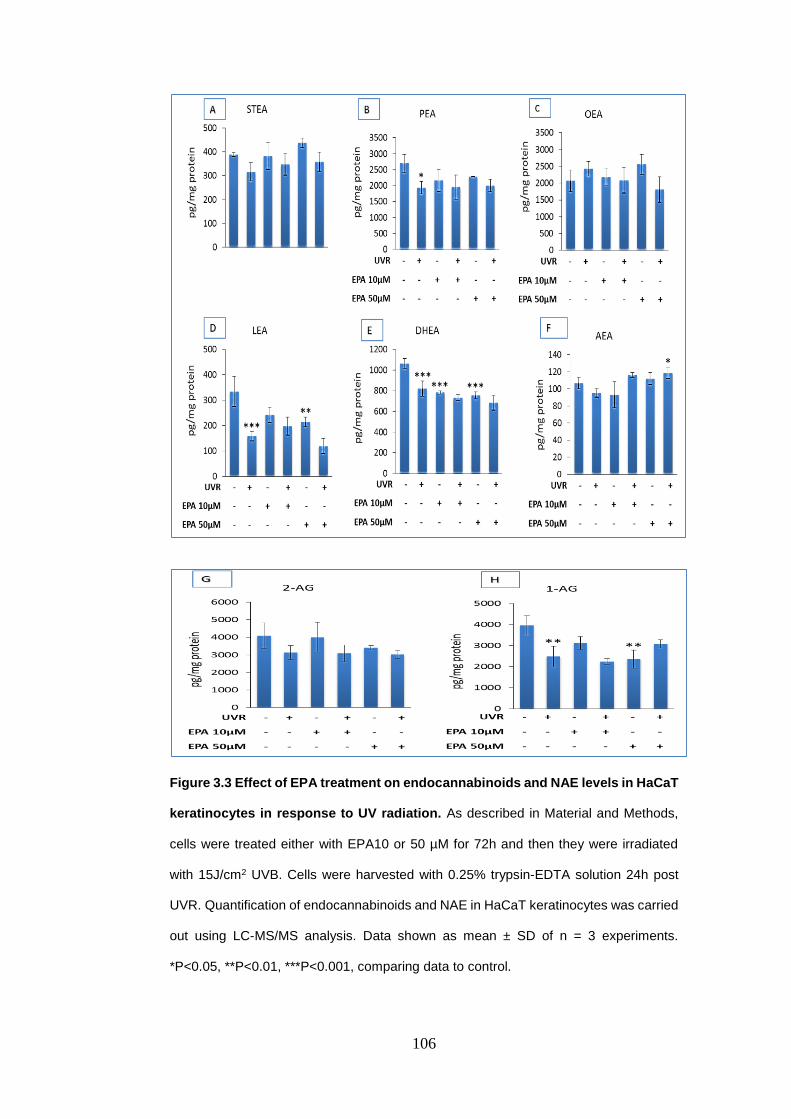
106
Figure 3.3 Effect of EPA treatment on endocannabinoids and NAE levels in HaCaT
keratinocytes in response to UV radiation. As described in Material and Methods,
cells were treated either with EPA10 or 50 µM for 72h and then they were irradiated
with 15J/cm2 UVB. Cells were harvested with 0.25% trypsin-EDTA solution 24h post
UVR. Quantification of endocannabinoids and NAE in HaCaT keratinocytes was carried
out using LC-MS/MS analysis. Data shown as mean ± SD of n = 3 experiments.
*P<0.05, **P<0.01, ***P<0.001, comparing data to control.

107
3.4.4. Quantification of endocannabinoids and NAE in culture medium from
irradiated and non-irradiated HaCaT keratinocytes treated with OA
Supernatant from HaCaT Keratinocyte cells treated with OA was analysed for the OEA
level. Figure 3.4 A, showed that the OEA level in the untreated medium was assessed
to be 369pg/ml (Figure 3.4 A, bar 1). Treatment with OA 10µM and 50µM decreased
this level to 295pg/ml and 318pg/ml respectively compared to untreated control medium
(Figure 3.4 A, bar 1 to bars 3 and 5). Radiation of control medium up-regulated OEA
level up to 421pg/ml compared to the nonirradiated control medium (Figure 3.4 A, bar
1 to bar 2). However, this level decreased to 308pg/ml and 373pg/ml respectively when
OA 10µM or 50µM treated HaCaT culture medium were irradiated (Figure 3.4 A, bar 2
to bars 4 and 6).
In the supernatant of untreated control cells STEA levels were found to be 2501pg/ml
(Figure 3.4 B, bar 1). Treatment with 10µM or 50µM of OA for 72h did not induce major
changes in STEA levels (2501pg/ml and 2250pg/ml) compared to the untreated control
culture medium (Figure 3.4 B, bar 1 to bars 3 and 5). On the other hand, UVR increased
the STEA level to 3501pg/ml in the irradiated control culture medium compared to the
nonirradiated control culture medium (Figure 3.4 B, compare bar 1 to bar 2). This level
was similar in the irradiated culture medium treated with OA 10µM or 50µM (3501pg/ml
and 3751pg/ml) compare to irradiated control culture medium (Figure 3.4 B, compare
bar 2 to bars 4 and 6).
In cell cultural medium of untreated control cells DHEA level was estimated to be
152pg/ml (Figure 3.4 C, bar 1), whereas, there was no much difference in DHEA level
in irradiated control culture medium (165pg/ml) compared to the non-irradiated control
(Figure 3.4 C, compare bar 1 to bar 2). In addition, treatment with OA either 10 µM or
50 µM did not change DHEA levels (156pg/ml and 154pg/ml, respectively) compared to
the untreated control culture medium (Figure 3.4 C, compare bar 1 to bars 3 and 5).
However, a small dose dependent decrease was observed in DHEA levels when OA
10µM or 50µM (148pg/ml and 141pg/ml) treated culture medium were irradiated
compared to the irradiated control culture medium (Figure 3.27 compare bar 2 to bars
4 and 6).
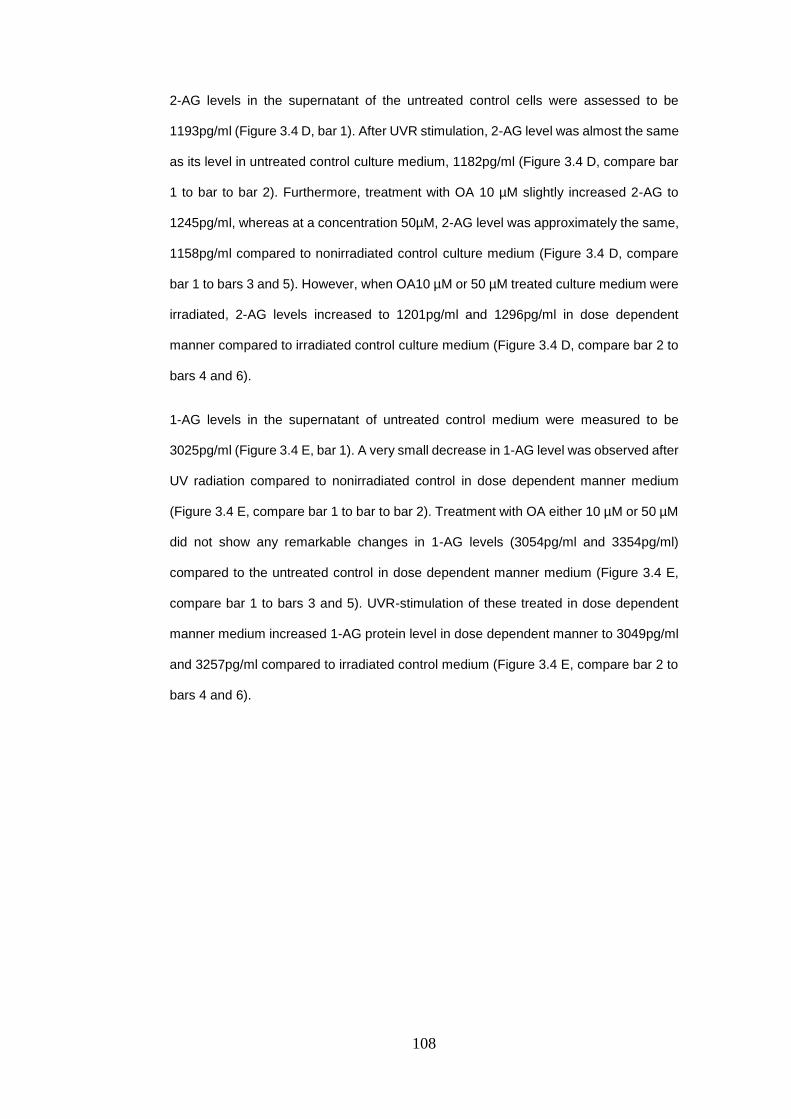
108
2-AG levels in the supernatant of the untreated control cells were assessed to be
1193pg/ml (Figure 3.4 D, bar 1). After UVR stimulation, 2-AG level was almost the same
as its level in untreated control culture medium, 1182pg/ml (Figure 3.4 D, compare bar
1 to bar to bar 2). Furthermore, treatment with OA 10 µM slightly increased 2-AG to
1245pg/ml, whereas at a concentration 50µM, 2-AG level was approximately the same,
1158pg/ml compared to nonirradiated control culture medium (Figure 3.4 D, compare
bar 1 to bars 3 and 5). However, when OA10 µM or 50 µM treated culture medium were
irradiated, 2-AG levels increased to 1201pg/ml and 1296pg/ml in dose dependent
manner compared to irradiated control culture medium (Figure 3.4 D, compare bar 2 to
bars 4 and 6).
1-AG levels in the supernatant of untreated control medium were measured to be
3025pg/ml (Figure 3.4 E, bar 1). A very small decrease in 1-AG level was observed after
UV radiation compared to nonirradiated control in dose dependent manner medium
(Figure 3.4 E, compare bar 1 to bar to bar 2). Treatment with OA either 10 µM or 50 µM
did not show any remarkable changes in 1-AG levels (3054pg/ml and 3354pg/ml)
compared to the untreated control in dose dependent manner medium (Figure 3.4 E,
compare bar 1 to bars 3 and 5). UVR-stimulation of these treated in dose dependent
manner medium increased 1-AG protein level in dose dependent manner to 3049pg/ml
and 3257pg/ml compared to irradiated control medium (Figure 3.4 E, compare bar 2 to
bars 4 and 6).

109
Figure 3.4 Effect of OA treatment on endocannabinoids and NAE levels in HaCaT
keratinocytes culture medium in response to UV radiation. As described in Material
and Methods, cells were treated either with OA10 or 50 µM for 72h and then they were
irradiated with 15J/cm2 UVB. Medium was collected 24h post UVR. Quantification of
endocannabinoids and NAE in HaCaT keratinocytes was carried out using LC-MS/MS
analysis. Data shown as mean of n = 2 experiments. No statistical analysis was
performed.

110
3.4.5. Quantification of endocannabinoids and NAE in cell culture medium from
irradiated and non-irradiated HaCaT keratinocytes treated with DHA.
Figure 3.5 A, showed that the base line of OEA in untreated medium was estimated to
be 541pg/ml (Figure 3.5 A, bar 1). DHA 10µM or 50µM treatment dose dependently
increased OEA level in HaCaT cultural medium to 624pg/ml and 681pg/ml compared to
untreated control medium (Figure 3.5 A, compare bar 1 to bar 3 and 5). OEA level was
significantly increased in irradiated control medium cells to 767pg/ml (P = 0.005)
compared to the nonirradiated control medium (Figure 3.5 A, compare bar 1 to bar 2).
Similar effect but, no significant difference was seen when DHA 10µM (840pg/ml) or
50µM (830pg/ml) treated medium were subjected to UVR (Figure 3.5 A, compare bar 2
to bars 4 and 5) compared to irradiated control medium.
STEA levels in untreated control medium were found to be 5168pg/ml (Figure 3.5 B, bar
1). UV light significantly reduced STEA level in irradiated control medium to 2501pg/ml
(P = 0.001) compared to nonirradiated control medium (Figure 3.5 B, compare bar 1 to
bar 2). Treatment with DHA 10µM also significantly decreased STEA level to 2667pg/ml
(P = 0.001) compared to untreated control medium (Figure 3.5 B, compare bar 1 to bar
3). However, DHA 50µM induced only small decrease (4668pg/ml) in STEA level
compared to untreated control medium (Figure 3.5 B, compare bar 1 to bar 5). Both
concentrations of DHA (10µM or 50µM) increased STEA protein levels to 3334pg/ml
when they were irradiated compared to the irradiated control medium (Figure 3.5 B,
compare bar 2 to bars 4 and 6).
DHEA levels in untreated control medium were measured to be 136pg/ml (Figure 3.5
C, bar 1), and this level was quite similar in the irradiated control medium, 130pg/ml
(Figure 3.5 C, bar 2). However, no significant differences were noticed in DHEA level in
non-irradiated medium treated with DHA 10 µM (130pg/ml) or 50 µM (144pg/ml) (Figure
3.5 C, compare bar 1 to bars 3 and 5) compared to untreated control medium. DHA
10µM (142pg/ml) and 50µM (144pg/ml) also have no effect on the irradiated medium
compared to the irradiated control medium (Figure 3.5 C, compare bar 2 to bars 4 and
6).

111
2-AG levels in untreated control medium were assessed to be 1161pg/ml (Figure 3.5 D,
bar 1) whereas, slight increase in 2-AG levels were observed in culture medium treated
with DHA 10µM or 50µM, 1207pg/ml and 1212pg/ml respectively, compared to
untreated control medium (Figure 3.5 D, compare bar 1 to bars 3 and 5). Moreover, 2-
AG level was also increased after UVR stimulation up to 1336pg/ml compare to
nonirradiated control medium (Figure 3.5 D, compare bar 1 to bar 2). However, 2-AG
level was dropped to 1094pg/ml in UVR-stimulated medium treated with DHA 10µM and
then increased again to 1363pg/ml with DHA 50µM compared to irradiated control
medium (Figure 3.5 D, compare bar 2 to bars 4 and 6).
1-AG levels in the untreated control medium were considered to be 3072pg/ml (Figure
3.5 E, bar 1) whereas, in cell culture medium treated with 10µM or 50µM DHA, 1-AG
levels were increased to 3153pg/ml and 3635pg/ml compared to untreated control
medium (Figure 3.5 E, compare bar 1 to bars 3 and 5). After UVR stimulation, 1-AG was
elevated up to 3712pg/ml but, this level was then dropped to 3414pg/ml and 3348pg/ml
UVR-stimulated medium treated with DHA 10µM or 50µM respectively (Figure 3.5 E,
compare bar 2 to bars 4 and 6).
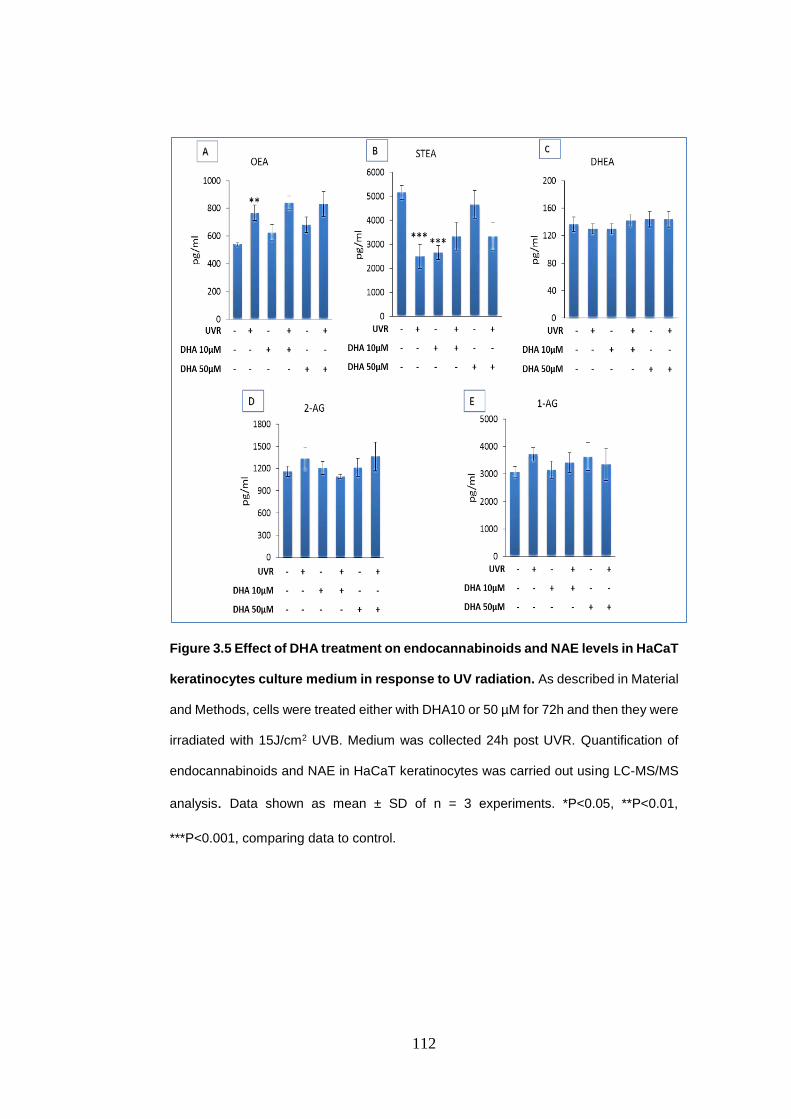
112
Figure 3.5 Effect of DHA treatment on endocannabinoids and NAE levels in HaCaT
keratinocytes culture medium in response to UV radiation. As described in Material
and Methods, cells were treated either with DHA10 or 50 µM for 72h and then they were
irradiated with 15J/cm2 UVB. Medium was collected 24h post UVR. Quantification of
endocannabinoids and NAE in HaCaT keratinocytes was carried out using LC-MS/MS
analysis. Data shown as mean ± SD of n = 3 experiments. *P<0.05, **P<0.01,
***P<0.001, comparing data to control.

113
3.4.6. Quantification of endocannabinoids and NAE in cell culture medium from
irradiated and non-irradiated HaCaT keratinocytes treated with EPA.
OEA levels in HaCaT cultural medium of untreated control cells were found to be
425pg/ml (Figure 3.6 A, bar 1). This level slightly increased in a dose dependent manner
to 407pg/ml and 437pg/ml in cell culture medium treated with EPA 10µM or 50µM
respectively, compared to untreated control HaCaT medium (Figure 3.6 A, compare bar
1 to bars 3 and 5). However, UVR significantly increased OEA level in irradiated control
up to 555pg/ml compared to nonirradiated control medium (P = 0.001) (Figure 3.6 A,
compare bar 1 to bar 2). This effect was significantly enhanced when EPA 10µM
(407pg/ml) (P = 0.002) or 50µM (500pg/ml) (P = 0.008) treated medium were irradiated
compared to irradiated control medium (Figure 3.6 A, compare bar 2 to bars 4 and 6).
STEA levels in untreated control medium were calculated to be 2667pg/ml (Figure 3.6,
B bar 1). Treatment with EPA10µM or 50µM increased STEA level to 3001pg/ml and
2834pg/ml respectively, compared to untreated control medium (Figure 3.6 B, compare
bar 1 to bars 3 and 5). Compared to nonirradiated control medium, UV light increased
STEA level in the irradiated control medium to 3167pg/ml (Figure 3.6 B, Compare bar
1 to bar 2). STEA level was then down-regulated to 2167pg/ml in irradiated medium
treated with EPA 10µM, but increased again to 3667pg/ml as EPA 50µM was tested
against UVR (Figure 3.6 B, compare bar 2 to bars 4 and 6).
DHEA levels in untreated control medium were estimated to be 140pg/ml (Figure 3.6 C,
bar 1), this level was slightly reduced in irradiated control medium to 132pg/ml (Figure
3.6 C, bar 2). However, no significant changes were noticed in DHEA level at EPA 10
µM (137pg/ml) or 50 µM (132pg/ml) treated groups compared to untreated control
medium (Figure 3.6 C, compare bar 1 to bars 3 and 5). Also, no major changes were
observed in DHEA levels, 132pg/ml and 137pg/ml respectively, when EPA 10µM and
50µM treated medium were examined against UVR compared to irradiated control
medium (Figure 3.6 C, compare bar 2 to bars 4 and 6).
2-AG levels in untreated control medium were assessed to be 1258pg/ml and there was
no noticeable change in its level in culture medium treated with EPA 10µM or 50µM,

114
1171pg/ml and 1282pg/ml, respectively (Figure 3.6 D, compare bar 1 to bars 3 and 5).
UVR stimulation did not induce any major change in 2-AG (1148pg/ml) compared to
nonirradiated control culture medium (Figure 3.6 D, compare bar 1 to bar 2). However,
2-AG levels increased to 1201pg/ml and 1213pg/ml in a dose dependent manner in
EPA 10µM or 50µM treated culture medium with UV radiation compared to the irradiated
control culture medium (Figure 3.6 D, compare bar 2 to bars 4 and 6).
1-AG levels in untreated control medium were estimated to be 3058pg/ml (Figure 3.3 E,
bar 1). Whereas, in HaCaT culture medium treated with EPA 10µM or 50µM 1-AG levels
increased to 3498pg/ml and significantly to 3833pg/ml (P = 0.022) respectively, in a
dose dependent manner compared to untreated control culture medium (Figure 3.6 E,
compare bar 1 to bar 3 and 5). After UV radiation, 1-AG level in irradiated control cells
was calculated to be 3111pg/ml, which is slightly higher than its level in nonirradiated
control culture medium (Figure 3.6 E, compare bar 1 to bar 2). However, this level
increased up 3688pg/ml and to 3521pg/ml respectively in UVR-stimulated culture
medium treated with EPA 10µM or 50µM (Figure 3.6 E, compare bar 2 to bars 4 and 6).
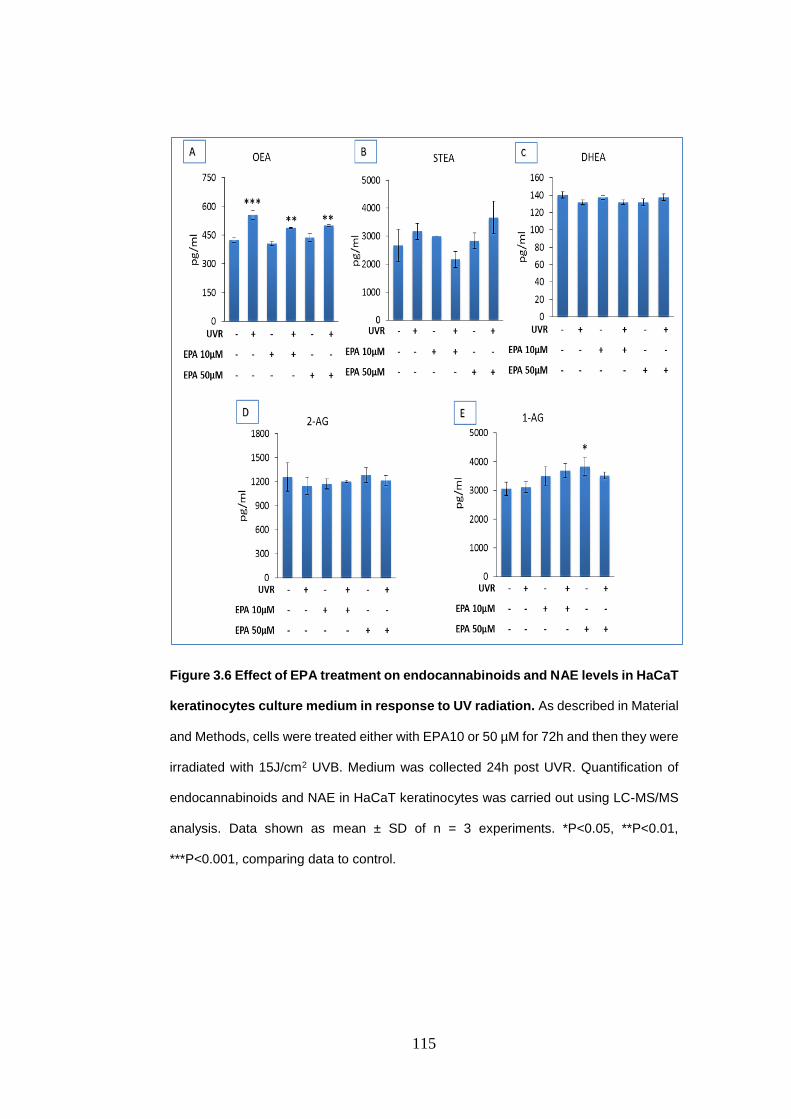
115
Figure 3.6 Effect of EPA treatment on endocannabinoids and NAE levels in HaCaT
keratinocytes culture medium in response to UV radiation. As described in Material
and Methods, cells were treated either with EPA10 or 50 µM for 72h and then they were
irradiated with 15J/cm2 UVB. Medium was collected 24h post UVR. Quantification of
endocannabinoids and NAE in HaCaT keratinocytes was carried out using LC-MS/MS
analysis. Data shown as mean ± SD of n = 3 experiments. *P<0.05, **P<0.01,
***P<0.001, comparing data to control.

116
Table 3.1. Summary of the significant findings in HaCaT keratinocytes cells and their
cell culture medium in response to DHA and/or UVR. Data shown as mean ± SD of n =
3 experiments. *P<0.05, **P<0.01, ***P<0.001, comparing data to control using one way
(ANOVA) followed by Tukey post hoc test.

117
Table 3.2. Summary of the significant findings in HaCaT keratinocytes cells and their
cell culture medium in response to EPA and/or UVR. Data shown as mean ± SD of n =
3 experiments. *P<0.05, **P<0.01, ***P<0.001, comparing data to control using one way
(ANOVA) followed by Tukey post hoc test.

118
3.4.7. Quantification of the endocannabinoids and other NAE in irradiated and
non-irradiated 46BR.IN fibroblasts treated with OA.
In general, because of N= 2 in OA experiments (Figures 3.25-3.31), statistically it is not
possible to assess if there are any significant differences in endocannabinoid congeners
level between the different groups in those experiments.
Compared to untreated control cells STEA levels in nonirradiated control group cells
were measured to be 2151pg/mg (Figure 3.7 A, bar 1). Compared to the untreated
control cells, STEA level was increased up to 5835pg/mg in nonirradiated cells treated
with 10µM OA and to 3494 pg/mg in the cells that were treated with 50µM of the same
fatty acid (Figure 3.7 A compare bar 1 to bars 3 and 5). However, a 2-fold increase was
seen in STEA after UVR exposure in the control cells (4757pg/mg) (Figure 3.7 A bar 2).
Whereas, treatment of the irradiated cell with OA 10µM or 50µM increased STEA level
up to 4238 pg/mg and 6251pg/mg respectively, compare to irradiated control cells
(Figure 3.7 A, compare bar 2 to bars 4 and 6).
Figure 3.7 B, presented some changes in PEA levels when untreated control cells were
compared with OA and UVR treated cells. PEA level in nonirradiated control group was
2958 pg/mg (Figure 3.7 B bar 1). However, this level was increased in irradiated control
cells up to 5123pg/mg, (Figure 3.7 B, bar 2). More elevation in PEA level (7522 pg/mg)
was noticed after the incubation with 10µM OA alone (Figure 3.7 B, bar 3). While, this
level was dropped to 2809 pg/mg (Figure 3.7 B, bar 5) when the OA concentration was
increased to 50µM. These increases in PEA level were also seen when the treated
samples were combined with UVR; 6527pg/mg in bar 4 and 8596 pg/mg in bar 6
compared to the irradiated control in bar 2.
OEA levels in untreated cells were 2259 pg/mg. Incubation of the 46BR.IN fibroblasts
with OA 10µM for 72h increased OEA level slightly to 3612 pg/mg, whereas, this level
was decreased to 2124 pg/mg with OA 50µM (Figure 3.7 C, compare bar 1 to bars 3
and 5). Likewise, UVR elevated OEA level in irradiated control cells to 5367pg/mg
compare to nonirradiated control cells (Figure 3.7 C, compare bar 1 to bar 2). However,

119
this effect was reversed when OA10µM (2712 pg/mg) or 50µM (3126 pg/mg) treated
cells were irradiated (Figure 3.7 C, compare bar 2 to bars 4 and 6).
DHEA levels in untreated control cells were estimated to be 323 pg/mg (Figure 3.7 D,
bar 1). Whereas, DHEA level dramatically increased in irradiated control cells up to 732
pg/mg (Figure 3.7 D, bar 2). Moreover, incubation of OA 10µM or 50µM treated cells
also raised DHEA levels to 695 pg/mg and 411pg/mg respectively, compared to
nonirradiated control cells (Figure 3.7 D, compare bar 1 to bars 3 and 5). However,
DHEA was decreased to 339 pg/mg and 625 pg/mg respectively, when OA10µM or
50µM treated cells were irradiated compared to irradiated control cells (Figure 3.7 C,
compare bar 2 to bars 4 and 6).
AEA levels were found to be 323 pg/mg in untreated control cells, however, in irradiated
control cells UVR increased this level up to 488 pg/mg (Figure 3.7 E, compare bar 1 to
bar 2).Treatment with OA10µM increased AEA level up to 556 pg/mg while, in OA 50µM
AEA level was decreased to 343 pg/mg, compared to untreated control cells (Figure 3.7
E, compare bar 1 to bars 3 and 5). AEA level was also decreased to 339 pg/mg in
irradiated treated with OA10µM, in contrast, OA 50µM in irradiated cells, raised AEA up
to 625 pg/mg compared to irradiated control cells (Figure 3.7 E, compare bar 2 to bars
4 and 6).
2-AG levels in untreated control cells were estimated to be 753 pg/mg (Figure 3.7 F, bar
1). UVR stimulation sharply increased 2-AG level up to 2562 pg/mg (Figure 3.7 F, bar
2). When these cells were incubated with 10µM or 50µM OA for 72h, 2-AG levels were
increased to 1389 pg/mg and 1096 pg/mg respectively compared to untreated control
cells (Figure 3.7 F, compare bar 1 to bars 3 and 5). However, 2-AG level was reduced
in UVR-stimulated cells treated with OA 10µM to 1780 pg/mg but, when the same cells
were treated with OA 50µM 2-AG level increased up to 3126 pg/mg compared to the
irradiated control cells (Figure 3.7 F, compare bar 2 to bars 4 and 6).
In untreated control cells 1-AG levels were found to be 753pg/mg whereas, this level
increased to 2684pg/mg in irradiated control cells (Figure 3.7 G, compare bar 1 to bar
2). Treatment with OA 10µM or 50µM in addition, increased 1-AG levels to 1667pg/mg

120
and 1096pg/mg compared to untreated control cells (Figure 3.7 G, compare bar 1 to
bars 3 and 5). However, 1-AG level was reduced to 1865pg/mg in UVR-stimulated cells
treated with OA 10µM compared to irradiated control cells but, when the OA 50µM was
used 1-AG level increased up to 3126 pg/mg in these cells compared to their control
cells (Figure 3.7 G, compare bar 2 to bars 4 and 6).

121
Figure 3.7 Effect of OA treatment on endocannabinoids and NAE levels in 46BR.IN
fibroblasts in response to UV radiation. As described in Materials and Methods, cells
were treated either with OA10 or 50 µM for 72h and then they were irradiated with
15J/cm2 UVB. Cells were harvested with 0.25% trypsin-EDTA solution 24h post UVR.
Quantification of endocannabinoids and NAE in 46BR.IN fibroblasts was carried out
using LC-MS/MS analysis. Data shown as mean of n = 2 experiments. No statistical
analysis was performed.

122
3.4.8. Quantification of the endocannabinoids and other NAE in irradiated and
non-irradiated 46BR.IN fibroblasts treated with DHA
STEA levels were calculated to be 3741pg/mg in untreated control cells (Figure 3.8 A,
bar 1). In addition, when these cells were incubated with DHA 10µM or 50µM for 72h,
STEA levels were increased to 5459pg/mg and 5984pg/mg, respectively (Figure 3.8 A,
compare bar 1 to 3 and 5). STEA level in the irradiated control was slightly lower
(3287pg/mg) compared to its level in nonirradiated control cells (Figure 3.8 A, compare
bar 1 to bar 2). In UVR-stimulated cells treated with DHA 10µM or 50µM STEA levels
were significantly increased in dose dependent manner to 7881pg/mg (P = 0.001) or
7153pg/mg (P = 0.002), respectively compared to the irradiated control (Figure 3.8 A,
compare bar 2 to bars 4 and 6).
Figure 3.48 showed that there were no significant differences in PEA levels between
nonirradiated (2276pg/mg) and irradiated (2343pg/mg) control cells (Figure 3.8 B,
compare bar 1 to bar 2). PEA level was slightly increased up to 3237pg/mg after the
incubation with 10µM DHA alone (Figure 3.8 B, bar 3), while, this level dropped to
2844pg/mg (Figure 3.8 B, bar 5) when DHA concentration was increased to 50µM. The
same trend was also seen when the treated cells were exposed to UVR. PEA level was
significantly increased up to 4658pg/mg (P = 0.001) and 3646pg/mg (P = 0.03) with
DHA10µM and 50µM respectively, compared to the irradiated control (Figure 3.8 B,
compare bar 2 to bar 4 and 6).
Figure 3.8 C showed that OEA levels in untreated control cells were assessed to be
1791pg/mg (Figure 3.8 C, bar 1). However, this level was decreased to 1407pg/mg in
irradiated control cells (Figure 3.8 C, bar 2). Treatment with DHA10µM or 50µM
significantly increased OEA levels up to 3394pg/mg (P = 0.001) and 2942pg/mg (P =
0.01) respectively, compared to untreated control cells (Figure 3.8 C, compare bar 1 to
bars 3 and 5). This effect was in addition, enhanced when DHA10µM or 50µM treated
cells were irradiated, OEA levels were significantly further increased up to 4587pg/mg
(P = 0.001) and 4107pg/mg (P = 0.001) respectively, compared to irradiated control
cells (Figure 3.8 C, compare bar 2 to bars 4 and 6).
123
DHEA levels in untreated control cells were estimated to be 345 pg/mg (Figure 3.8 D,
bar 1). Whereas, in irradiated control cells this level was dropped to 309 pg/mg (Figure
3.8 D, bar 2). Treatment with DHA 10 µM or 50 µM significantly up-regulated DHEA
protein levels in dose dependent manner up to 631pg/mg (P = 0.016) and 1085pg/mg
(P = 0.001) compared to the untreated control cells (Figure 3.8 D compare bar 1 to bars
3 and 5). Likewise, similar trend was observed when the treated groups combined with
UVR, OEA levels were significantly increased to 1165 pg/mg (P = 0.001) and 1184
pg/mg (P = 0.001) in DHA 10µM or 50µM, respectively compared to irradiated control
cells (Figure 3.8 D, compare bar 2 to bars 4 and 6).
Figure 3.8 E showed AEA levels at 517 pg/mg in untreated control cells, this level was
slightly decreased after UVR to 494 pg/mg in irradiated control cells (Figure 3.8 E,
compare bar 1 and bar 2). Treatment with DHA10µM or 50µM increased AEA level up
to 663 pg/mg and 632 pg/mg, respectively compared to untreated control cells (Figure
3.8 E, compare bar 1 to bars 3 and 5). Furthermore, AEA levels were significantly further
increased up to 981pg/mg (P = 0.001) and 841pg/mg (P = 0.001) respectively in
irradiated cells treated with DHA 10µM or 50µM compared to irradiated control cells
(Figure 3.8 E, compare bar 2 to bars 4 and 6).
2-AG levels in the untreated control cells were found to be 1680 pg/mg (Figure 3.8 F,
bar 1). Whereas, UVR stimulation significantly increased this level up to 3544pg/mg (P
= 0.001) in the irradiated control cells (Figure 3.8 F, bar 2). Also, when these cells were
treated with 10µM or 50µM DHA for 72h, 2-AG levels were increased to 2290 pg/mg
and 2037pg/mg, respectively compared to the untreated control cells (Figure 3.8 F,
compare bar 1 to bars 3 and 5). However, in comparison to the irradiated control cells,
2-AG level was dramatically increased up to 5009 pg/mg (P = 0.002) in UVR-stimulated
cells treated with DHA 10µM (Figure 3.8 F, compare bar 2 to bar 4). However, 2-AG
was decreased to 3223 pg/mg, when DHA 50µM was used in combination with UVR
compared to the irradiated control cells (Figure 3.8 F, compare bar 2 to bar 6).
1-AG levels in the untreated control cells were measured to be 1236 pg/mg, whereas,
UVR significantly increased 1-AG level to 2985 pg/mg (P = 0.001) (Figure 3.8 G,

124
compare bar 1 to bar 2). When these cells were treated with 10µM or 50µM DHA for
72h, 1-AG level increased to 1700 pg/mg and 1433 pg/mg respectively compared to the
untreated control cells (Figure 3.8 G, compare bar 1 to bars 3 and 5). Moreover, 1-AG
levels were additional increased to 3573 pg/mg and 3517pg/mg in UVR-stimulated cells
treated with DHA 10µM or 50µM respectively compared to the irradiated control cells
(Figure 3.8 G, compare bar 2 to bars 4 and 6).

125
Figure 3.8 Effect of DHA treatment on endocannabinoids and NAE levels in
46BR.IN fibroblasts in response to UV radiation. As described in Material and
Methods, cells were treated either with DHA10 or 50 µM for 72h and then they were
irradiated with 15J/cm2 UVB. Cells were harvested with 0.25% trypsin-EDTA solution
24h post UVR. Quantification of endocannabinoids and NAE in 46BR.IN fibroblasts was
carried out using LC-MS/MS analysis. Data shown as mean ± SD of n = 3 experiments.
*P<0.05, **P<0.01, ***P<0.001, comparing data to control.

126
3.4.9. Quantification of the endocannabinoids and other NAE in irradiated and
non-irradiated 46BR.IN fibroblasts treated with EPA.
STEA levels in the control cells were calculated to be 5427 pg/mg, whereas, this level
was slightly higher, 5868 pg/mg in the irradiated control cells (Figure 3.9 A, compare
bar 1 to bar 2). Incubation of these cells with EPA 10µM or 50µM for 72h reduced STEA
levels to 4063 pg/mg and 4864 pg/mg, respectively compared to the untreated control
cells (Figure 3.9 A, compare bar 1 to 3 and 5). However, treatment with EPA 10µM or
50µM did not induce any remarkable changes in STEA levels in UV irradiated cells,
compared to the irradiated control cells (Figure 3.9 A, compare bar 2 to bars 4 and 6).
Figure 3.9 B, illustrated that PEA levels in the control cells were measured to be 3336
pg/mg, while, this level was slightly decreased to 3174 pg/mg in the irradiated control
cells (Figure 3.9 B, compare bar 1 to bar 2). Two different concentrations of EPA (10µM
or 50µM) were used. PEA levels decreased to 2340 pg/mg and 2378 pg/mg,
respectively in dose dependent manner compared to the untreated control cells (Figure
3.9 B, compare bar 1 to bars 3 and 5). Whereas, in the irradiated cells treated with EPA
10µM or 50µM, PEA levels increased to 3402 pg/mg and 3860 pg/mg respectively, in a
dose dependent manner compared to the irradiated control cells (Figure 3.9 B, compare
bar 2 to bars 4 and 6)
OEA levels in the untreated cells were estimated to be 3484 pg/mg, while UV radiation
down-regulated this level to 2591 pg/mg (Figure 3.9 C, compare bar 1 to bar 2).
Incubation of 46BR.IN fibroblastic cells with EPA 10µM or 50µM for 72h decreased the
OEA level significantly to 1886 pg/mg (P = 0.015) and marginally to 2782 pg/mg
respectively compared to the untreated control cells (Figure 3.9 C, compare bar 1 to
bars 3 and 5) However, OEA level was increased to 3070 pg/mg in irradiated cells
treated with EPA 10µM (Figure 3.9 C, bar 4), but with EPA 50µM this level was dropped
to 1940 pg/mg compared to the irradiated control cells (Figure 3.9 C, compare bar 2 to
bars 4 and 6).
DHEA levels in the untreated control cells were considered to be 255 pg/mg, whereas,
this level was raised up to 327 pg/mg in the irradiated control cells (Figure 3.9 D,
127
compare bar 1 to bar 2). Treatment with EPA 10µM decreased DHEA level to 214 pg/mg
whilst, EPA 50µM significantly increased DHEA level to 452pg/mg (P = 0.008) compare
to the untreated control cells (Figure 3.9 D, compare bar 1 to bars 3 and 5). This figure
also illustrated that DHEA significantly increased to 656 pg/mg (P = 0.001) and 604
pg/mg (P = 0.001), respectively after EPA 10µM or 50µM treated cells were irradiated
compared to the irradiated control cells (Figure 3.9 D, compare bar 2 to bars 4 and 6).
Figure 3.9 E showed AEA level at 32pg/mg in the untreated control cells (Figure 3.9 E,
bar 1). UVR stimulation, did not induce any major change in AEA level in the irradiated
control cells (30 pg/mg) (Figure 3.9 E, bar 2). Moreover, treatment of the nonirradiated
cells with EPA, either 10µM or 50µM also did not produce any noticeable change in
AEA level, 30 pg/mg and32 pg/mg, respectively compared to the untreated control cells
(Figure 3.9 E, compare bar 1 to bars 3 and 5). In addition, when the UV irradiated cells
were treated with the same fatty acids either 10µM or 50µM no significant changes were
seen in AEA level in this experiment (32pg/mg and 33pg/mg) (Figure 3.9 E compare
bar 2 and bars 4 and 6).
2-AG levels in nonirradiated control cells were estimated to be 3144 pg/mg however, in
the irradiated control cells this level significantly increased about 3-fold to 10501 pg/mg
(P = 0.001) (Figure 3.9 F, compare bar 1 to bar 2). No significant differences were seen
when these cells were incubated with EPA 10µM or 50µM for 72h, 3518 pg/mg and
3453 pg/mg respectively (Figure 3.9 F, compare bar 1 to bars 3 and 5). In addition,
when these cells were treated with EPA 10µM, 2-AG level was approximately similar to
its level in the irradiated control cells but, when EPA 50µM was used 2-AG level slightly
decreased to 9025 pg/mg (Figure 3.9 F, compare bar 2 to bars 4 and 6).
1-AG levels in the untreated control cells were assessed to be 3059 pg/mg (Figure 3.9
G, bar 1). Treatment with EPA 10µM or 50µM for 72h decreased 1-AG level to 2835
pg/mg and 3853 pg/mg respectively (Figure 3.9 G, compare bar 1 to bars 3 and 5). UVR
stimulation significantly increased 1-AG level to 10377 pg/mg (P = 0.001) compared to
nonirradiated control cells (Figure 3.9 G, compare bar 1 to bar 2). However, 1-AG level
was slightly increased to 11251 pg/mg in UVR-stimulated cells treated with EPA 10µM

128
(Figure 3.9 G, compare bar 2 to bar 4) and then reduced to 7818 pg/mg when these
cells treated with EPA 50µM (Figure 3.9 G, compare bar 2 to bar 6).
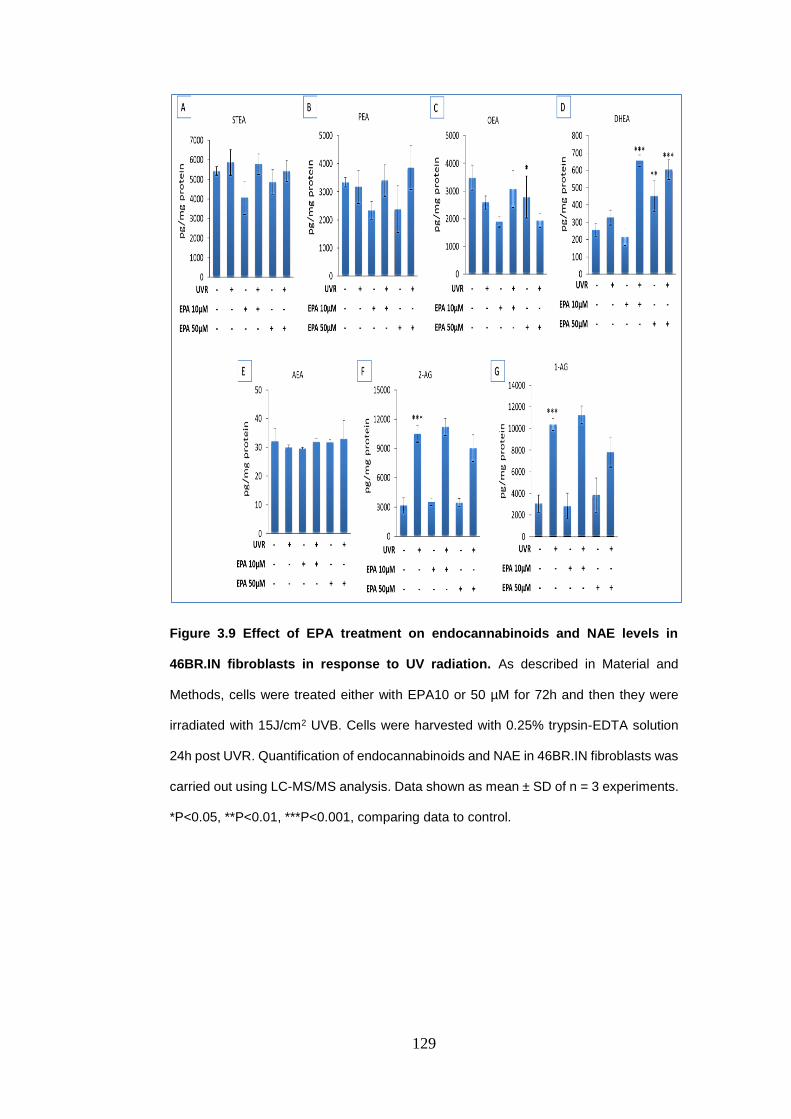
129
Figure 3.9 Effect of EPA treatment on endocannabinoids and NAE levels in
46BR.IN fibroblasts in response to UV radiation. As described in Material and
Methods, cells were treated either with EPA10 or 50 µM for 72h and then they were
irradiated with 15J/cm2 UVB. Cells were harvested with 0.25% trypsin-EDTA solution
24h post UVR. Quantification of endocannabinoids and NAE in 46BR.IN fibroblasts was
carried out using LC-MS/MS analysis. Data shown as mean ± SD of n = 3 experiments.
*P<0.05, **P<0.01, ***P<0.001, comparing data to control.

130
3.4.10. Quantification of the endocannabinoids and other NAE in culture medium
from irradiated and non-irradiated 46BR.IN fibroblasts treated with OA
Because of N=2 in the OA experiments, statistically it is not possible to assess if there
are any significant differences in endocannabinoids congeners level between the
different groups in those experiments.
STEA levels in control medium were 3001 pg/ml (Figure 3.10 A, bar 1). Adding OA
10µM or 50µM to cell culture medium decreased STEA level to 2000 pg/ml and 2501
pg/ml respectively compared to the untreated control (Figure 3.10 A, compare bar 1 to
bars 3 and 5). Furthermore, STEA level was decreased to 2501 in the irradiated control
culture medium compared to the nonirradiated control medium (Figure 3.10 A, compare
bar 1 to bar 2). Treatment with OA either 10µM increased STEA level in cell culture
medium of the irradiated cells, whereas, 50µM did not induce any significant change
compare to their control (Figure 3.10 A, compare bar 2 to bars 4 and 6).
Figure 3.10 B, presented DHEA level at 473 pg/ml in the untreated control medium
(Figure 3.10 B, bar 1). This level was dropped to 359 pg/ml after UVR stimulation
compared to nonirradiated culture medium (Figure 3.10 B, compare bar 1 to bar 2).
Using two different concentrations of OA, either 10µM or 50µM also decreased DHEA
level to 2257 pg/ml and 402 pg/ml respectively in the nonirradiated culture medium
compared to their control (Figure 3.10 B, compare bar 1 to bars 3 and 5). In contrast,
DHEA levels were dose dependently increased in the culture medium of irradiated cells
after treatment with OA 10µM or 50µM compared to the irradiated control culture
medium (Figure 3.10 B, compare bar 2 to bars 4 and 6).
2-AG levels in the untreated control medium were calculated to be 2749 pg/ml (Figure
3.10 C, bar 1) In addition, minor downregulation in 2-AG level was noticed when the
culture medium of the nonirradiated cells was incubated with OA 10µM (1952 pg/ml) or
50µM (2495 pg/ml) compared to their control (Figure 3.63 compare bar 1 to bars 3 and
5). No significant changes were seen in 2-AG level in the culture medium of irradiated
cells compared to nonirradiated cell culture medium (Figure 3.10 C, compare bar 1 to
bar 2). However, treatment with OA 10µM or 50µM did not induce any major changes

131
in 2-AG levels, 2580 pg/ml and 2527 pg/ml respectively compare to the medium of the
irradiated control cells (Figure 3.10 C, compare bar 2 to bars 4 and 6).
1-AG levels in the untreated control culture medium were 34507 pg/ml whereas, this
level was decreased to 25505 pg/ml in the cell culture medium of the irradiated cells
(Figure 3.10 D, compare bar 1 to bar 2). Adding OA 10µM to the cell culture medium
decreased 1-AG levels to 28506 pg/ml while in those treated with 50µM 1-AG level was
increased to 35007 pg/ml (Figure 3.10 D, compare bar 1 to bar 3 and bar 5).
Furthermore, using the UVR in combination either with 10µM or 50µM OA increased1-
AG level in dose dependent manner to 33007 pg/ml and 400008 pg/ml respectively
compared to the irradiated control culture medium (Figure 3. 10 D, compare bar 2 to
bar 4 and bar 6).

132
Figure 3.10 Effect of OA treatment on endocannabinoids and NAE levels in
46BR.IN fibroblasts culture medium in response to UV radiation. As described in
Materials and Methods, cells were treated either with OA10 or 50 µM for 72h and then
they were irradiated with 15J/cm2 UVB. Medium was collected 24h post UVR.
Quantification of endocannabinoids and NAE in 46BR.IN fibroblasts was carried out
using LC-MS/MS analysis. Data shown as mean of n = 2 experiments. No statistical
analysis was performed.

133
3.4.11. Quantification of the endocannabinoids and other NAE in culture medium
from irradiated and non-irradiated 46BR.IN fibroblasts treated with DHA.
Figure 3.11 A, showed STEA level at 5001 pg/ml in cell cultural medium of untreated
control cells. However, after UVR stimulation this level was significantly reduced to 2334
pg/ml in cell culture of the irradiated control cells compared to the nonirradiated medium
(P = 0.001)(Figure 3.11 A, compare bar 1 to bar 2). Treatment with DHA, either 10µM
or 50µM also significantly decreased STEA level in dose dependent manner to 2834
pg/ml (P = 0.001) and 2334 pg/ml (P = 0.001) compared to untreated culture medium
(Figure 3.11 A, compare bar 1 to bars 3 and 5). In contrast, the combination between
the DHA 10µM or 50µM and UVR increased STEA level to 3001 pg/ml and significantly
to 4001 pg/ml (P = 0.008), respectively compared to cell culture medium of irradiated
control cells (Figure 3.65 compare bar 2 to bars 4 and 6).
DHEA levels were estimated to be 352 pg/ml in the untreated control culture medium.
This level was however, increased to 504 pg/ml after UVR stimulation in the irradiated
control culture medium (Figure 3.11 B, Compare bar 1 to bar 2). DHA 10µM slightly
reduced DHEA level to 320 pg/ml while, DHA 50µM, increased it to 462 pg/ml compared
to the culture medium of nonirradiated cells (Figure 3.11 B, compare bar 1 to bars 3 and
5). Similar effect was observed when DHA 10µM (431 pg/ml) or 50µM (611 pg/ml)
treated culture medium were irradiated, compared to the irradiated control culture
medium (Figure 3.11 B, compare bar 2 to bars 4 and 6).
In untreated control medium, 2-AG levels were assessed to be 2283 pg/ml whereas,
when this culture medium was treated with 10µM or 50µM DHA, marginally increases
were seen in 2-AG levels, 2699 pg/ml and 2486 pg/ml, respectively compared to the
untreated control culture medium (Figure 3.11 C, compare bar 1 to bars 3 and 5). In cell
culture of the irradiated control cells 2-AG level was slightly increased to 2766 pg/ml
compared to the nonirradiated medium (Figure 3.11 C, compare bar 1 to bar 2). In
addition, when the treated medium were irradiated, 2-AG levels increased to 3215 pg/ml
and 3965 pg/ml with DHA 10µM and 50µM, respectively compared to the cell cultural of
the irradiated control cells (Figure 3.11 C, compare bar 2 to bars 4 and 6). Figure 3.11
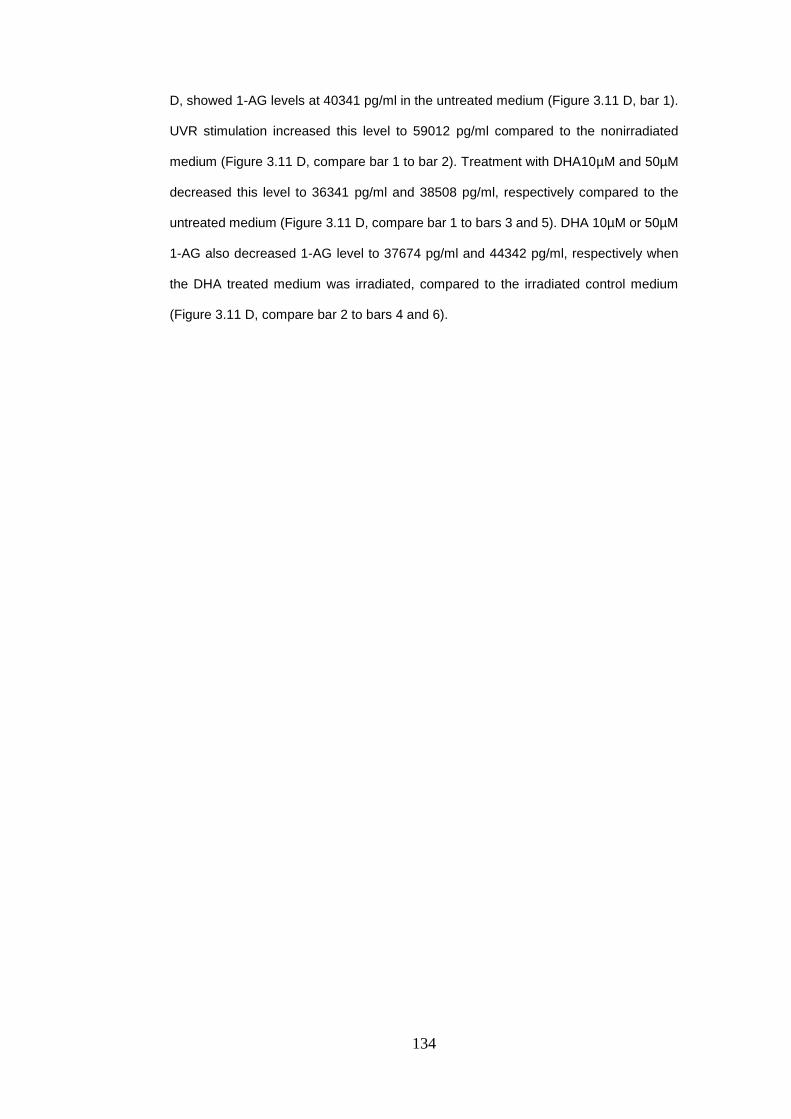
134
D, showed 1-AG levels at 40341 pg/ml in the untreated medium (Figure 3.11 D, bar 1).
UVR stimulation increased this level to 59012 pg/ml compared to the nonirradiated
medium (Figure 3.11 D, compare bar 1 to bar 2). Treatment with DHA10µM and 50µM
decreased this level to 36341 pg/ml and 38508 pg/ml, respectively compared to the
untreated medium (Figure 3.11 D, compare bar 1 to bars 3 and 5). DHA 10µM or 50µM
1-AG also decreased 1-AG level to 37674 pg/ml and 44342 pg/ml, respectively when
the DHA treated medium was irradiated, compared to the irradiated control medium
(Figure 3.11 D, compare bar 2 to bars 4 and 6).

135
Figure 3.11 Effect of DHA treatment on endocannabinoids and NAE levels in
46BR.IN fibroblasts culture medium in response to UV radiation. As described in
Material and Methods, cells were treated either with DHA10 or 50 µM for 72h and then
they were irradiated with 15J/cm2 UVB. Medium was collected 24h post UVR.
Quantification of endocannabinoids and NAE in 46BR.IN fibroblasts was carried out
using LC-MS/MS analysis. Data shown as mean ± SD of n = 3 experiments. *P<0.05,
**P<0.01, ***P<0.001, comparing data to control.
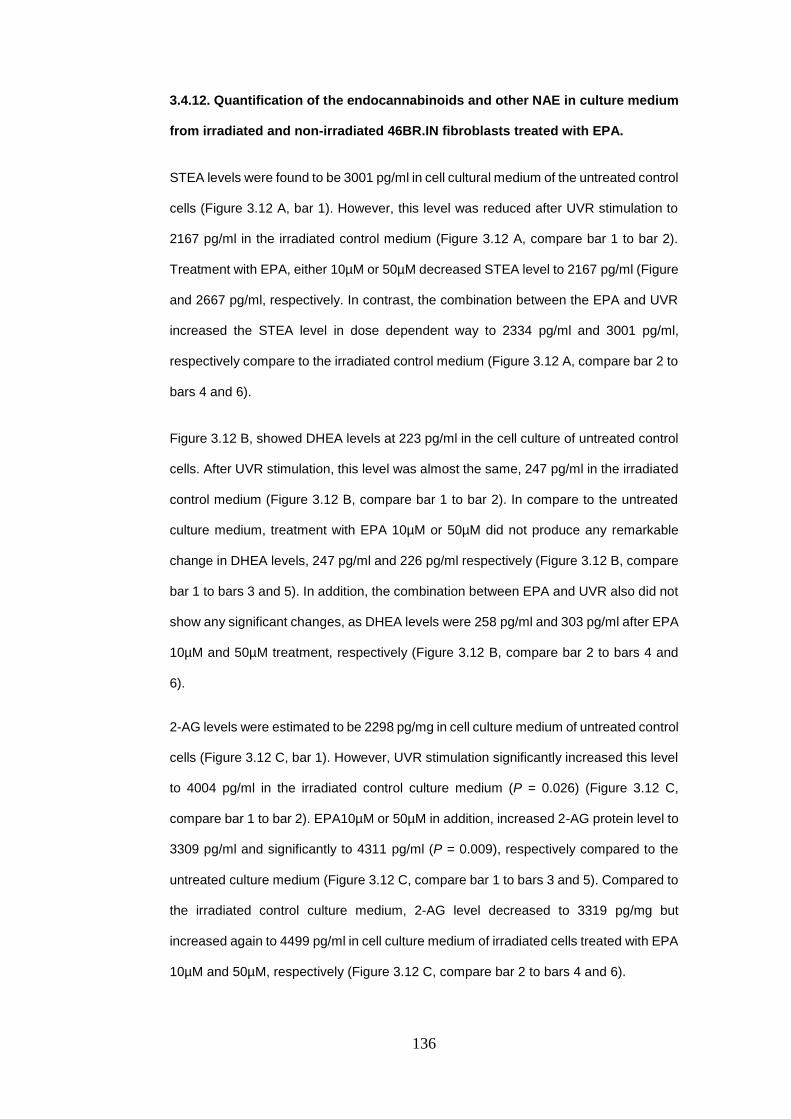
136
3.4.12. Quantification of the endocannabinoids and other NAE in culture medium
from irradiated and non-irradiated 46BR.IN fibroblasts treated with EPA.
STEA levels were found to be 3001 pg/ml in cell cultural medium of the untreated control
cells (Figure 3.12 A, bar 1). However, this level was reduced after UVR stimulation to
2167 pg/ml in the irradiated control medium (Figure 3.12 A, compare bar 1 to bar 2).
Treatment with EPA, either 10µM or 50µM decreased STEA level to 2167 pg/ml (Figure
and 2667 pg/ml, respectively. In contrast, the combination between the EPA and UVR
increased the STEA level in dose dependent way to 2334 pg/ml and 3001 pg/ml,
respectively compare to the irradiated control medium (Figure 3.12 A, compare bar 2 to
bars 4 and 6).
Figure 3.12 B, showed DHEA levels at 223 pg/ml in the cell culture of untreated control
cells. After UVR stimulation, this level was almost the same, 247 pg/ml in the irradiated
control medium (Figure 3.12 B, compare bar 1 to bar 2). In compare to the untreated
culture medium, treatment with EPA 10µM or 50µM did not produce any remarkable
change in DHEA levels, 247 pg/ml and 226 pg/ml respectively (Figure 3.12 B, compare
bar 1 to bars 3 and 5). In addition, the combination between EPA and UVR also did not
show any significant changes, as DHEA levels were 258 pg/ml and 303 pg/ml after EPA
10µM and 50µM treatment, respectively (Figure 3.12 B, compare bar 2 to bars 4 and
6).
2-AG levels were estimated to be 2298 pg/mg in cell culture medium of untreated control
cells (Figure 3.12 C, bar 1). However, UVR stimulation significantly increased this level
to 4004 pg/ml in the irradiated control culture medium (P = 0.026) (Figure 3.12 C,
compare bar 1 to bar 2). EPA10µM or 50µM in addition, increased 2-AG protein level to
3309 pg/ml and significantly to 4311 pg/ml (P = 0.009), respectively compared to the
untreated culture medium (Figure 3.12 C, compare bar 1 to bars 3 and 5). Compared to
the irradiated control culture medium, 2-AG level decreased to 3319 pg/mg but
increased again to 4499 pg/ml in cell culture medium of irradiated cells treated with EPA
10µM and 50µM, respectively (Figure 3.12 C, compare bar 2 to bars 4 and 6).

137
In untreated control medium, 1-AG levels were measured to be 47343 pg/ml, but in
irradiated control medium this level was slightly decreased to 36841pg/ml (Figure 3.12
D, compare bar 1 to bar 2). Adding EPA10µM and 50µM into cell culture medium of the
nonirradiated cells, reduced 1-AG levels to 31173 pg/ml and 37174 pg/ml, respectively.
In contrast, UVR in combination with 10µM or 50µM EPA increased 1-AG levels to
46676 pg/ml and 41008 pg/ml, respectively, compared to the irradiated control medium
(Figure 3.12 D, bar 2 to bars 4 and 6).
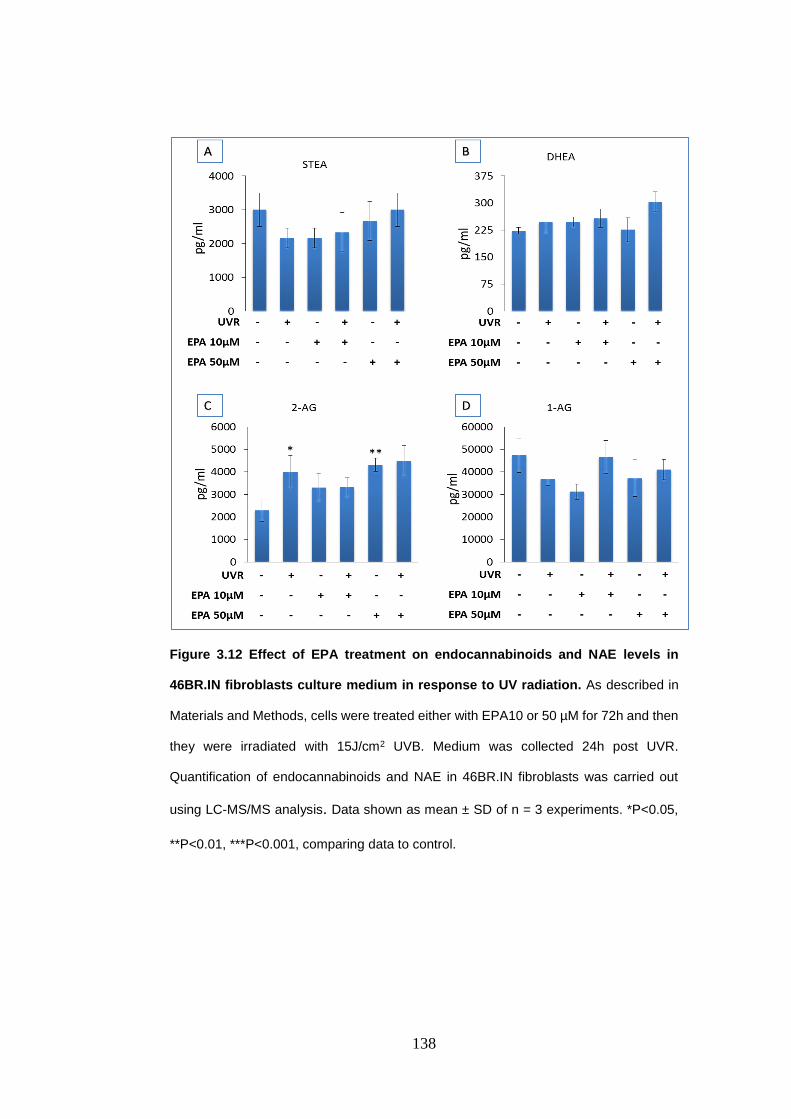
138
Figure 3.12 Effect of EPA treatment on endocannabinoids and NAE levels in
46BR.IN fibroblasts culture medium in response to UV radiation. As described in
Materials and Methods, cells were treated either with EPA10 or 50 µM for 72h and then
they were irradiated with 15J/cm2 UVB. Medium was collected 24h post UVR.
Quantification of endocannabinoids and NAE in 46BR.IN fibroblasts was carried out
using LC-MS/MS analysis. Data shown as mean ± SD of n = 3 experiments. *P<0.05,
**P<0.01, ***P<0.001, comparing data to control.

139
Table 3.3. Summary of the significant findings in 46 BR.IN fibroblasts cells and their cell
culture medium in response to DHA and/or UVR. Data shown as mean ± SD of n = 3
experiments. *P<0.05, **P<0.01, ***P<0.001, comparing data to control using one way
(ANOVA) followed by Tukey post hoc test.
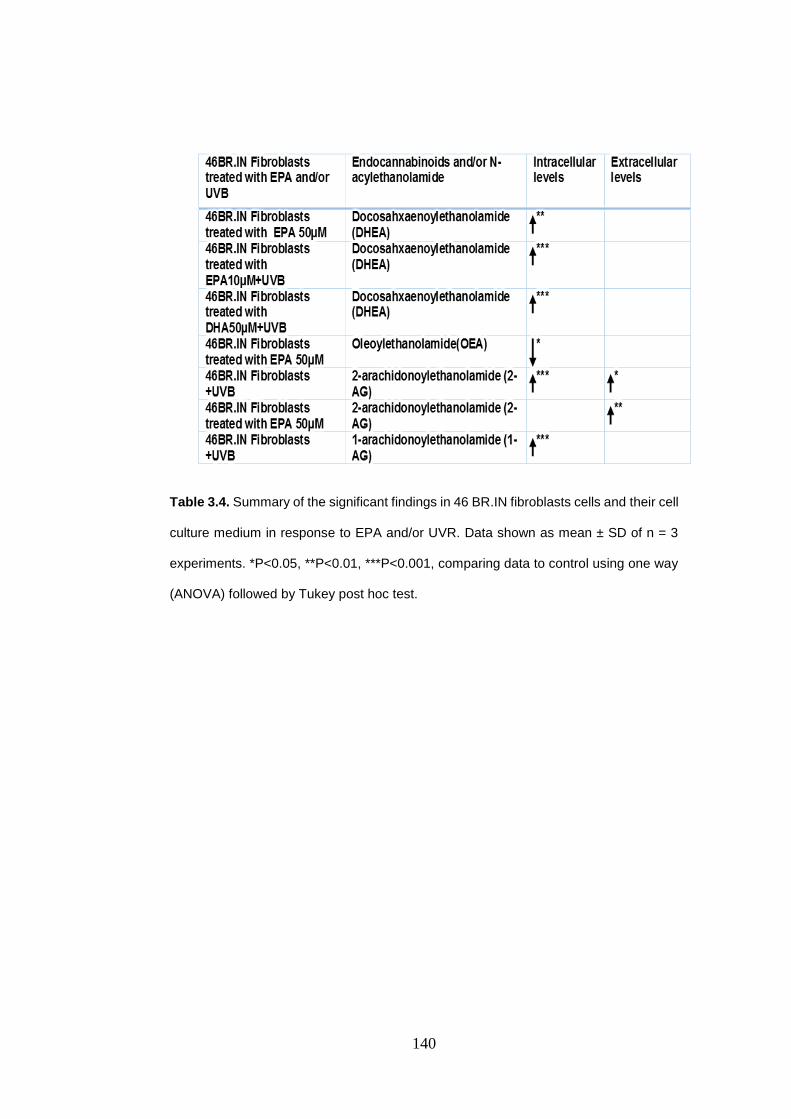
140
Table 3.4. Summary of the significant findings in 46 BR.IN fibroblasts cells and their cell
culture medium in response to EPA and/or UVR. Data shown as mean ± SD of n = 3
experiments. *P<0.05, **P<0.01, ***P<0.001, comparing data to control using one way
(ANOVA) followed by Tukey post hoc test.

141
3.5. Discussion
3.5.1. Determination of the OA and UVR effects on the intracellular and
extracellular levels of endocannabinoids and NAE in HaCaT Keratinocytes and
46BR.IN fibroblasts.
As non-essential monounsaturated fatty acid rich in cell membrane, lacking the ability
to be metabolized to DHA or EPA (Grammatikos et al., 1994), OA was selected to be a
control fatty acid in the present study. Our results showed that the UVR induced up-
regulation in STEA, PEA, OEA and DHEA was inhibited when the irradiated HaCaT
keratinocytes were treated with OA. In 46BR.IN fibroblasts the most noticeable effect
was that the intracellular levels of STEA, PEA, OEA, DHEA, AEA, 2-AG and 1-AG were
increased after UVR stimulation. However, this effect was inhibited and enhanced with
OA 10µM and 50µM respectively.
Only a few mediators were detected in the culture medium from HaCaT keratinocytes
and 46BR.IN fibroblasts, including STEA, (OEA HaCaT keratinocyte culture medium
only), DHEA and 2-AG. Fluctuated effects ranging from minor decrease or increase
were observed on the extracellular levels of these mediators after OA treatment and or
UVR exposure. In general, the fluctuation effects of OA treatment on the levels of the
above mentioned mediators could be attributed to the inability of OA to form these
mediators in HaCaT keratinocytes or 46BR.IN fibroblasts. Apart from this, the above
mentioned results related to OA treatment were obtained from experiments carried out
only twice; therefore concrete conclusions cannot be drawn from these observations.
3.5.2. Determination of the n-3 PUFA effects on the intracellular and extracellular
levels of the endocannabinoids and NAE in HaCaT Keratinocytes and 46BR.IN
fibroblasts in response to ultraviolet radiation.
Data from this study showed that DHA treatment increased intracellular levels of PEA,
DHEA and AEA in HaCaT keratinocytes, while mediators such OEA, LEA and 1-AG
were found to be decreased after DHA treatment in these cells. However, DHA has no
major effects on intracellular levels of STEA and 2-AG in HaCaT keratinocytes.

142
Furthermore, DHA increased the extracellular levels of OEA, 2-AG and 1-AG in HaCaT
keratinocytes and has no major effects on STEA and DHEA extracellular levels.
However, EPA treatment was found to reduce the intracellular levels of PEA, LEA,
DHEA, 2-AG and 1-AG in HaCaT keratinocytes. EPA treatment increased only OEA
level in HaCaT cells and has no remarkable effects on intracellular levels of STEA and
AEA.
In 46BR.IN fibroblasts, the intracellular levels of STEA, PEA, OEA, LEA, DHEA, AEA,
2-AG and 1-AG was found to be increased after DHA treatment. DHA also increased
the extracellular levels of OEA, 2-AG and 1-AG in these cells, whereas, the extracellular
levels of mediators such STEA and DHEA did not change by DHA. In contrast to DHA,
EPA treatment decreased STEA, PEA, OEA, DHEA and 1-AG intracellular levels in
46BR.IN fibroblasts; EPA had no effects on AEA and 2-AG intracellular levels in
46BR.IN fibroblasts. Similar to DHA, EPA increased the extracellular levels of OEA, 2-
AG and 1-AG in the media of 46BR.IN fibroblasts and had no major effects on STEA
and DHEA extracellular levels.
UV radiation decreased the intracellular levels of STEA, PEA and LEA in HaCaT
keratinocyte and 46BR.IN fibroblasts both in the presence and absence of DHA or EPA
treatments. Fluctuated effects on DHEA, AEA, 2-AG and 1-AG were observed post UV
radiation but in general the intracellular levels of these mediators tended to increase
after UVR exposure in HaCaT keratinocyte and 46BR.IN fibroblasts. Moreover, UVR
induced up-regulation in the extracellular levels of OEA, 2-AG and 1-AG in cell cultural
medium of HaCaT keratinocyte and 46BR.IN fibroblasts. However, the extracellular
levels of STEA and DHEA did not change post UV radiation in the media of these cells.
Overall, the trend shown in these results is consistent with another study carried out on
rodents which showed that a fish oil diet containing high levels of EPA and DHA lead to
a decrease in the intracellular formation of the 2-AG, PEA, STEA and OEA but not AEA
and DHEA (Artmann et al., 2008) in the liver of the test animals. Furthermore, AEA and
2-AG also have been reported to decrease in 3T3-F442A adipocytes after 72h
incubation with 100µM DHA (Matias et al., 2008). One possible interpretation of these

143
results is that DHA can reduce cell and tissue levels of AA and AA - derived downstream
metabolites, including AEA and/or AG, potentially due to substrate competition among
biosynthetic enzymes (Artmann et al., 2008, Connor et al., 1990, Rapoport, 2008,
Watanabe et al., 2003, Lim and Suzuki, 2001, Matias et al., 2008, Batetta et al., 2009).
This competition among lipid biosynthetic enzymes utilizing fatty acids as substrates
could represent an important influence on the formation of downstream lipid
metabolites, including their derived endocannabinoids metabolite components.
Furthermore, the acylation of endocannabinoid precursors such as membrane
phospholipids NAPE and DAG by DHA could be a potential explanation for the changes
observed toward DHA-derived (DHEA) in HaCaT keratinocytes and 46BR.IN
fibroblasts. Alternatively, the results of the current study showed that AEA, DHEA and
PEA intracellular levels increased as DHA concentration increased in the irradiated and
nonirradiated HaCaT keratinocytes. Moreover, AEA and DHEA intracellular levels were
significantly increased in a dose dependent manner after the irradiated and non-
irradiated 46BR.IN fibroblasts were treated with DHA. These results are in agreement
with another study in which it has been demonstrated that brain levels of AEA and DHEA
in piglets increased with DHA treatment (Berger et al., 2001). In addition, other studies
in different species have confirmed an increased formation of AEA, 2-AG and DHEA in
the jejunum of the rat after fish oil diet providing high level of EPA and DHA (Artmann
et al., 2008). DHA has been found in the brain, gut, retina and liver in concentrations
similar or higher than those of AEA (Berger et al., 2001, Wood et al., 2010), therefore,
increase its derivative DHEA level is a normal consequence. Hence, many studies
demonstrated that the DHEA can be synthesized from its precursor in different types of
tissues (Balvers et al., 2010, Kim et al., 2011). Moreover, another study suggested the
N-docosahxaenoyl-PE as a possible precursor of DHEA (Bisogno et al., 1999). The
effect of the DHA and EPA treatment on STEA, OEA, LEA and 2-AG was similar in both
HaCaT keratinocytes and 46BR.IN fibroblasts after UV radiation. In general the changes
recorded in their intracellular levels were minor. UV radiation in this study caused the
DHEA intracellular levels to be significantly increased in DHA treated cells of both used
models (AEA level was increased in 46BR.IN fibroblasts only). DHEA intracellular level

144
was also significantly increased after UV radiation in 46BR.IN fibroblasts treated with
EPA. Moreover, the intracellular levels of 2-AG and its isomer, 1-AG were found to be
significantly increased after UVR exposure either in EPA treated or untreated 46BR.IN
fibroblasts.
All these findings showed that the UV radiation might have an effect on the formation of
endocannabinoids and NAE. These effects can be attributed to phospholipase A2
(PLA2) activity that induced after UVR exposure (Chen et al., 1996, Cohen and DeLeo,
1993, Hanson and DeLeo, 1990), as PLA2 has been reported to be one of the possible
biosynthetic routes of NAEs via N-acyl-lysoPE (Sun et al., 2004). Moreover, PLA2 has
been reported to induce an increase in NAEs levels including AEA (Berdyshev et al.,
2000). Moreover, UVB can phosphorylate ERK (Chang et al., 2011) and p38 mitogen-
activated kinases (Bachelor et al., 2005, Kim et al., 2005) which then triggers NF-kB
(Chun and Surh, 2004). Therefore, UVR could impact FAAH and NAPE-PLD proteins
levels through their transcriptional aspects and gene expression. NF-kB is a translation
factor that perform a key part in cellular reaction to ecological pressure such as UVR by
causing or controlling the expression of particular gene (Herrlich et al., 2008). UVR-
induced NF-kB initial has been revealed in several research. For example, NF-kB initial
in epidermis fibroblasts has been confirmed after UVA radiation (Vile et al., 1995, Reelfs
et al., 2004). Also, UVB was discovered to generate NF-kB initial in human epidermis
keratinocytes (Adhami et al., 2003) and NF-kB could control FAAH gene expression
(Maccarrone et al., 2003a). Furthermore, Liu et al., has recommended NF-kB as the
primary translation factor manages LPS-induced AEA features (Liu et al., 2003).
Moreover, NF-kB was discovered to communicate with specific proteins 1 (SP 1); the
translation factor of NAPE-PLD gene (Sancéau et al., 1995). For example, p65 a subunit
of NF-kB has been found to interact with SP1 (Perkins et al., 1994, Pazin et al., 1996).
Therefore, UVR could regulates the expression of endocannabinoids and their
congeners throughout the transcriptional factors of their genes. All these findings
support our findings. These data could be the first step for future studies to define
potentially beneficial relationships between the effects of n-3 PUFA on
endocannabinoids and their related lipids. Also endocannabinoids modification due to

145
UVB exposure could be one of the defense mechanism performance by human skin
cells against UVB. Therefore, the biochemical role of n-3 PUFA in respect to the
interaction with the biosynthesis of endocannabinoids and NAE should be further
investigated.
Apart of UVB, UVA (320-400 nm) is a possible environmental stress has obtained less
attention, even though extreme sun visibility is also associated with extreme contact
with UVA (320-400 nm). The UVA transfer (80 nm) is twice that of UVB (40 nm), and
90% to 95% of solar UV radiation energy that gets to the surface of our planet is UVA;
only 5% to 10% of it is UVB. UVA has a longer period wavelengths than UVB and thus
spreads throughout further into skin. Because its short wavelength, UVB can penetrate
only the full epidermis and only 10 to 15% of it can reach the upper layer of the dermis;
papilla. However, 50% of UVA are absorbed by the epidermis, while the rest penetrate
the dermis up to 2mm depth (Césarini, 1996). The thickness of the epidermis is
increasing with direct consequence on the UVB absorption, making the basal layer of
the epidermis out of reaction with UVB radiations (Césarini, 1996). The UVA sunburn is
more violaceous with prominent vasodilation, therefore, UVA-induced erythema is not
representation of pigmentation or melanogenesis. In the UVB, the induced division of
the keratinocytes increases the thickness of the epidermis and so the total content in
melanin, whereas, in the UVA, the multiplication of keratinocytes is provided directly by
stimulation of melanogenesis (McKinlay and Diffey, 1987). UVA has been proven to
cause mutations in mammalian cells. For example, research in murine cell lines have
confirmed that UVA can generate mutations (Hitchins et al., 1986, Lundgren and Wulf,
1988). Moreover, UVA at 365nm could be mutagenic to cultured human fibroblasts
(Enninga et al., 1986). The prospective dangerous impact of UVA has also been
confirmed in cultured human melanocytes. UVA (320-400 nm) was found to induce DNA
single-strand breaks in cultured human melanocytes (Wenczl et al., 1998, Marrot and
Meunier, 2008). UVB are essentially inducing DNA dimers which are most of the time,
error free repaired. However, UVA induce DNA strand breaks much less frequently than
UVB, but the strand breaks are error prone lesions (Césarini, 1996). As a consequence.
After long tern exposure the genetic code is altered equally by UVA and UVB (Césarini,

146
1996). UVR also has an effect on lipids in human skin where they subjected to
peroxidation through indirect mechanisms after UV radiation (Césarini, 1996). UVB and
UVA leading to activated molecules responsible for the production of several cytokines,
mitosis inducer, vascular changes and systemic distance effects (Césarini, 1996).

147
CHAPTER 4: The effect of n-3PUFA on endocannabinoid metabolizing enzymes in HaCaT keratinocytes and 46BR.IN fibroblasts in response to ultraviolet radiation.
4.1. Introduction
4.1.1. Cyclooxygenase-2
COX-2 is a stress inducible enzyme, expressed in different human skin cells such as
fibroblasts, macrophages and keratinocytes (Gilroy et al., 2001). In response to different
stimuli such as UVB, phorbol 12-myristate 13-acetate (PMA) and interleukin-1β (IL-1β),
the expression of COX-2 in these cells is stimulated. This in turn plays an important role
in inflammatory and tissues injury (Gilroy et al., 2001). Moreover, UVB has been
demonstrated to activate the cytosolic phospholipase A2 (cPLA2), which mediates
prostaglandin synthesis in human keratinocytes during the first 6h of UVB exposure
(Gresham et al., 1996). COX-2 mRNA and COX-2 protein levels have been detected in
human keratinocytes following 24 h of UVB irradiation irrespectively of the presence of
serum (Buckman et al., 1998). Also, COX-2 expression is significantly increased in
human dermis and epidermis 24 h after UVB exposure (Rhodes et al., 2009). Moreover,
a recent study demonstrated the up-regulation of COX-2 expression and protein levels
in cultured HaCaT cells and in mice subjected to 30mJ/cm2 UVB (Lee et al., 2013b).
COX-2 is upregulated in response to induction by multiple mitogenic and pro-
inflammatory stimuli, including growth factors, cytokines, hormones, serum, hypoxia,
bacterial endotoxin, and carcinogens (Smith et al., 2000, Trifan and Hla, 2003, Buckman
et al., 1998). Furthermore, COX-2 is involved in pathophysiological conditions such as
inflammation, pain, fever wound repair, angiogenesis, vasodilation and increased
vascular permeability (Smith et al., 2000, Gilroy et al., 2001, Funk, 2001).
While AA is the normal substrate for COX-1 and COX-2 isoforms, other fatty acids can
be oxygenated by both of them (Laneuville et al., 1995, Wada et al., 2007, Yuan et al.,
2009). COX-2 for example, has up to 30% efficiency to oxygenate the fatty acid
eicosapentaenoic acid (EPA) (20:5 n-3) compared with AA. Whereas, COX-1 efficiency
to oxygenate the same fatty acid is less than 5% (Wada et al., 2007, Malkowski et al.,

148
2001). COX-2 can oxygenate a more extensive array of substrates compared with COX-
1, presumably because of an approximately 20% larger active site (Kurumbail et al.,
1996). Also, it has been established that COX-2, but not COX-1, oxygenates the
endocannabinoids 2-AG and AEA to produce respectively prostaglandin glycerol esters
(PG-Gs) and prostaglandin ethanolamines (PG-EAs) (Kozak et al., 2000, Kozak et al.,
2001b). 2-AG and AEA are widely distributed in mammalian tissues including human
skin (Bisogno, 2008). COX-2 oxygenates endocannabinoid substrates using the same
mechanism employed for AA, generating prostaglandin, thromboxane, and prostacyclin
ethanoloamides, glycerol esters, and glycine (Kozak et al., 2000, Kozak et al., 2002a,
Kozak et al., 2001a). The ability of COX-2 to metabolize endocannabinoid substrates
suggests that this isoform may be involved in the endogenous endocannabinoid
signalling system. Therefore, our study aimed to investigate the effects of UVR and n-3
PUFAs on COX-2 in relation to endocannabinoids.
4.1.2. Lipoxygenases
5, 12, and 15 Lipoxygenases (LOX), are related to the dioxygenase family. They are
involved in the polyunsaturated fatty acid metabolism in human skin. Some of these
LOX are involved in skin disorders. 15-LOX was found to exist in two isoforms, 15-LOX-
1 and 15-LOX-2. 15-LOX-1 was reported to be the main enzyme metabolizing linoleic
acid into 13-hydroxyoctadecadienoic acid (13-HODE) (Baer et al., 1991), while 15-LOX-
2 metabolize AA into 15-HETE (Brash et al., 1997). 12-LOX and 15-LOX expression in
human keratinocyte cell line has been demonstrated to be affected by UV radiation.
UVR decrease the 12-LOX and increase the 15-LOX levels in these cells line (Yoo et
al., 2008). In addition, Rhodes et al. found that LOX metabolites such as 11-HETE, 12-
HETE and 15-HETE were increased at, 4h, 18h and 24h respectively, after UVB
irradiation of human skin (Rhodes et al., 2009)
12-LOX has been reported to metabolise the endocannabinoid AEA to produce the
ethanolamide derivative of 12(S)-HETE-EA in rat pineal gland (Hampson et al., 1995,
Ueda et al., 1995). Purified 12-LOX from porcine leukocytes also has been reported to

149
oxygenate AEA to produce 12(S)-HETE-EA (Hampson et al., 1995). This study has also
showed that the porcine 12-LOX enzyme did not discriminate between the AEA and AA.
Ueda et al. reported that the 12-LOX from porcine leukocytes and the 15-LOX-1 from
rabbit reticulocytes could oxygenate AEA at rates comparable to those for AA (Ueda et
al., 1995). However, human platelet 12-LOX was only marginally active, and porcine
leukocyte 5-LOX was inactive with AEA as the substrate (Ueda et al., 1995).
Furthermore, another study demonstrated that 12-LOX from porcine leukocytes, could
efficiently oxygenate 2-AG to produce the glycerol ester of 12(S)-HETE (12(S)-HETE-
G) (Moody et al., 2001). Kozak et al. showed that human 15-LOX-1, and human 15-
LOX-2 metabolized 2-AG efficiently, whereas human leukocyte 5-LOXs showed no
activity with this substrate (Kozak et al., 2002b).
4.2. Aims of this study
Since n-3 PUFA alter the pathways of COX and LOX enzymes that are involved in the
metabolism of endocannabinoids and NAE (Kozak et al., 2002a, Kozak et al., 2002c,
Kozak et al., 2004), they could have an effect on the endocannabinoids pathways in
skin cells. This may lead to increased NAE production such as N-stearoylethanolamide
which has been reported to have pro-apoptotic activity (Maccarrone et al., 2002) and/or
N-palmitoylethanolamide that showed anti-inflammatory activity, analgesic and
neuroprotective effects (Calignano et al., 1998, Lambert et al., 2002, LoVerme et al.,
2005). This manipulation of the endocannabinoid pathways through n-3 PUFA could be
the major defense mechanism behind the protective effect of n-3 PUFA against UVR in
the skin cells. Accordingly, the hypothesis of this part of our study was based on that
the n-3 PUFA particularly EPA and DHA, may play more protective role saving human
skin cells from the harm of UVR through their effect on the endocannabinoids
metabolizing enzymes such as COX-2 and LOXs. Therefore, this study aimed to
investigate the effect of n-3 PUFA and UVR on protein levels of the inducible isoforms
of COX-2, 12-LOX and 15-LOX. The effect of n-3 PUFA and UVR on the protein levels
of enzymes, respectively NAPE-PLD and FAAH that control formation and degradation
of endocannabinoids was also examined.

150
4.3 Materials and Methods
4.3.1. Western Blotting (refer to section 2.3 chapter 2)
4.3.2. Materials (refer to section 2.3.1 chapter 2)
4.3.3. Primary and secondary antibodies (refer to section 2.3.2 chapter 2)
4.3.4. Protein extraction (refer to section 2.4.1 chapter 2)
4.3.5. Determination of protein concentration (refer to section 2.4.2 chapter 2)
4.3.6. SDS-PAGE (refer to section 2.5. chapter 2)
4.3.7. Statistical analysis (refer to section 2.10. chapter 2)
4.4. RESULTS
4.4.1. The effect of UVR and n-3 PUFA on COX-2 protein levels in HaCaT
keratinocytes and 46BR.IN fibroblasts.
4.4.1.1. The effect of DHA and UVR
The results shown in Figure 4.1 suggested that UVR does not significantly up-regulate
COX-2 protein level in 46BR.IN fibroblasts compared to non-irradiated control cells
(Figure 4.1 A and B). However, DHA treatment at concentration10μM or 50μM
significantly decreased COX-2 level (P = 0.007 and 0.002, respectively) compared to
the untreated control cells (Figure 4.1 A and B). Although these effects were reversed
by UVR, DHA treatments were able to retain COX-2 in lower levels compared to the
non-irradiated and irradiated control cells, especially DHA 50μM which showed stronger
inhibitory effect (P = 0.03) against UVR-induced COX-2 up-regulation (Figure 4.1 A and
B).
The results shown in Figure 4.2 indicate some changes in COX-2 protein level among
the differentially treated groups but all the below discussed changes in Figure 4.2 were
not enough to be accounted as significant differences. This data indicated that COX-2
protein level was increased in UVR irradiated HaCaT keratinocytes compared to the

151
non-irradiated cells (Figure 4.2 A and B). In the treated HaCaT cells, COX-2 level was
slightly increased in cells treated with DHA (10μM or 50μM) compared to untreated
control. This effect was enhanced with UVR radiation when combined with treated cells
(Figure 4.2 A and B). This data also showed that COX-2 levels were higher than any
other cells when the DHA 10μM or 50μM treated cells were exposed to UV radiation.

152
Figure 4.1 COX-2 protein levels in DHA and UVR treated 46BR.IN fibroblasts. (A)
Western blot analysis of COX-2 protein levels in 46BR.IN fibroblasts treated with10μM
or 50μM DHA and irradiated with UVR or left untreated as indicated. GAPDH was used
as loading control. One representative out of 3 independent experiments is shown. (B)
Densitometry analysis of Western blots was carried out using ImageJ software. The
intensity of the COX-2 protein band was normalized to that of the GAPDH protein band.
The ratio of the intensity of the COX-2 band with the intensity of the GAPDH band in the
non-treated cells was arbitrarily set to 1. The ratio of the intensity of the COX-2 versus
the intensity of the GAPDH band in the other groups was calculated accordingly. Data
shown as mean ± SD of n = 3 experiments. *P<0.05, **P<0.01, ***P<0.001, comparing
data to control.

153
Figure 4.2 COX-2 protein levels in DHA and UVR treated HaCaT keratinocytes.
A. Western blot analysis of COX-2 protein levels in HaCaT keratinocytes treated
with10μM or 50μM DHA and irradiated with UVR or left untreated as indicated. GAPDH
was used as loading control. One representative out of 3 independent experiments is
shown. B. Densitometry analysis of Western blots was carried out using ImageJ
software. The intensity of the COX-2 protein band was normalized to that of the GAPDH
protein band. The ratio of the intensity of the COX-2 band with the intensity of the
GAPDH band in the non-treated cells was arbitrarily set to 1. The ratio of the intensity
of the COX-2 versus the intensity of the GAPDH band in the other groups was calculated
accordingly. Data shown as mean ± SD of n = 3 experiments. Comparing data to control.

154
4.4.1.2. The effect of OA and UVR
The effect of OA and UVR on COX-2 protein level was followed in 46BR.IN fibroblasts
untreated or treated with 10μM or 50μM OA in the presence or absence of UVR
irradiation using Western blot analysis. COX-2 protein level was not found to be
significantly increased after UV radiation compared to the non-irradiated 46BR.IN
fibroblasts (Figure 4.3 A and B). However, treatment with OA using 10μM concentration
kept COX-2 level at the same range of untreated control cells. A similar effect was seen
when the OA was used with UVR compared to the irradiated control cells (Figure 4.3 A
and B). Whereas, increasing the concentration of OA up to 50μM caused the COX-2
level to be slightly upregulated compared to untreated control cells. However, no change
was seen when these cells were treated with UVR compared to the irradiated control
cells (Figure 4.3 A and B).The same result was seen in the data shown in Figure 4.4
where the effect of OA and UVR on COX-2 protein level in HaCaT keratinocytes is
depicted. These data (Figure 4.4 A and B) also indicated that the effect of 10μM or 50μM
OA alone or in combination with UVR on COX-2 protein level was similar to that seen
in 46BR.IN fibroblasts under the same conditions.
4.4.1.3. The effect of EPA and UVR
The effect of EPA and UVR on COX-2 protein level was investigated in 46BR.IN
fibroblasts and HaCaT keratinocytes, untreated or treated with10μM or 50μM EPA in
the presence or absence of UVR irradiation using western blot analysis. COX-2 protein
level was observed to be increased in UVR irradiated cells in both 46BR.IN fibroblasts
and HaCaT keratinocytes compared to their untreated control cells (Figure 4.5 A and B
and Figure 4.6 A and B). Dose dependent effect appeared as a down-regulation of COX-
2 protein level was recorded in 46BR.IN fibroblasts and HaCaT keratinocytes treated
with EPA 10μM or 50μM compared to the untreated control cells. Nevertheless the
statistical analysis did not show any significant differences (Figure 4.5 A and B and
Figure 4.6 A and B). However, COX-2 protein levels were noted to be increased after
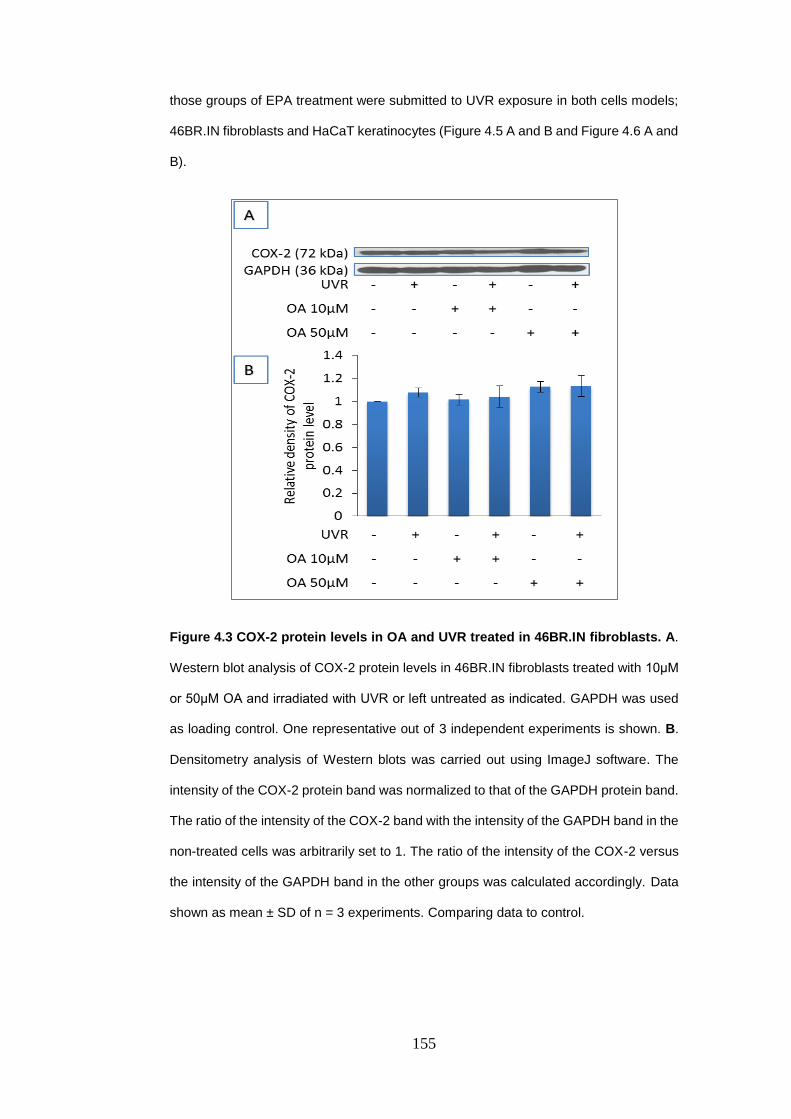
155
those groups of EPA treatment were submitted to UVR exposure in both cells models;
46BR.IN fibroblasts and HaCaT keratinocytes (Figure 4.5 A and B and Figure 4.6 A and
B).
Figure 4.3 COX-2 protein levels in OA and UVR treated in 46BR.IN fibroblasts. A.
Western blot analysis of COX-2 protein levels in 46BR.IN fibroblasts treated with 10μM
or 50μM OA and irradiated with UVR or left untreated as indicated. GAPDH was used
as loading control. One representative out of 3 independent experiments is shown. B.
Densitometry analysis of Western blots was carried out using ImageJ software. The
intensity of the COX-2 protein band was normalized to that of the GAPDH protein band.
The ratio of the intensity of the COX-2 band with the intensity of the GAPDH band in the
non-treated cells was arbitrarily set to 1. The ratio of the intensity of the COX-2 versus
the intensity of the GAPDH band in the other groups was calculated accordingly. Data
shown as mean ± SD of n = 3 experiments. Comparing data to control.

156
Figure 4.4 COX-2 protein levels in OA and UVR treated in HaCaT keratinocytes. A.
Western blot analysis of COX-2 protein levels in HaCaT keratinocytes treated with 10μM
or 50μM OA and irradiated with UVR or left untreated as indicated. GAPDH was used
as loading control. Data are representative of 3 experiments. B. Densitometry analysis
of Western blots was carried out using ImageJ software. The intensity of the COX-2
protein band was normalized to that of the GAPDH protein band. The ratio of the
intensity of the COX-2 band with the intensity of the GAPDH band in the non-treated
cells was arbitrarily set to 1. The ratio of the intensity of the COX-2 versus the intensity
of the GAPDH band in the other groups was calculated accordingly. Data shown as
mean ± SD of n = 3 experiments. Comparing data to control.

157
Figure 4.5 COX-2 protein levels in EPA and UVR treated in 46BR.IN fibroblasts. A.
Western blot analysis of COX-2 protein levels in 46BR.IN fibroblasts treated with10μM
or 50μM EPA and irradiated with UVR or left untreated as indicated. GAPDH was used
as loading control. Data are representative of 3 experiments. B. Densitometry analysis
of Western blots was carried out using ImageJ software. The intensity of the COX-2
protein band was normalized to that of the GAPDH protein band. The ratio of the
intensity of the COX-2 band with the intensity of the GAPDH band in the non-treated
cells was arbitrarily set to 1. The ratio of the intensity of the COX-2 versus the intensity
of the GAPDH band in the other groups was calculated accordingly. Data shown as
mean ± SD of n = 3 experiments. Comparing data to control.
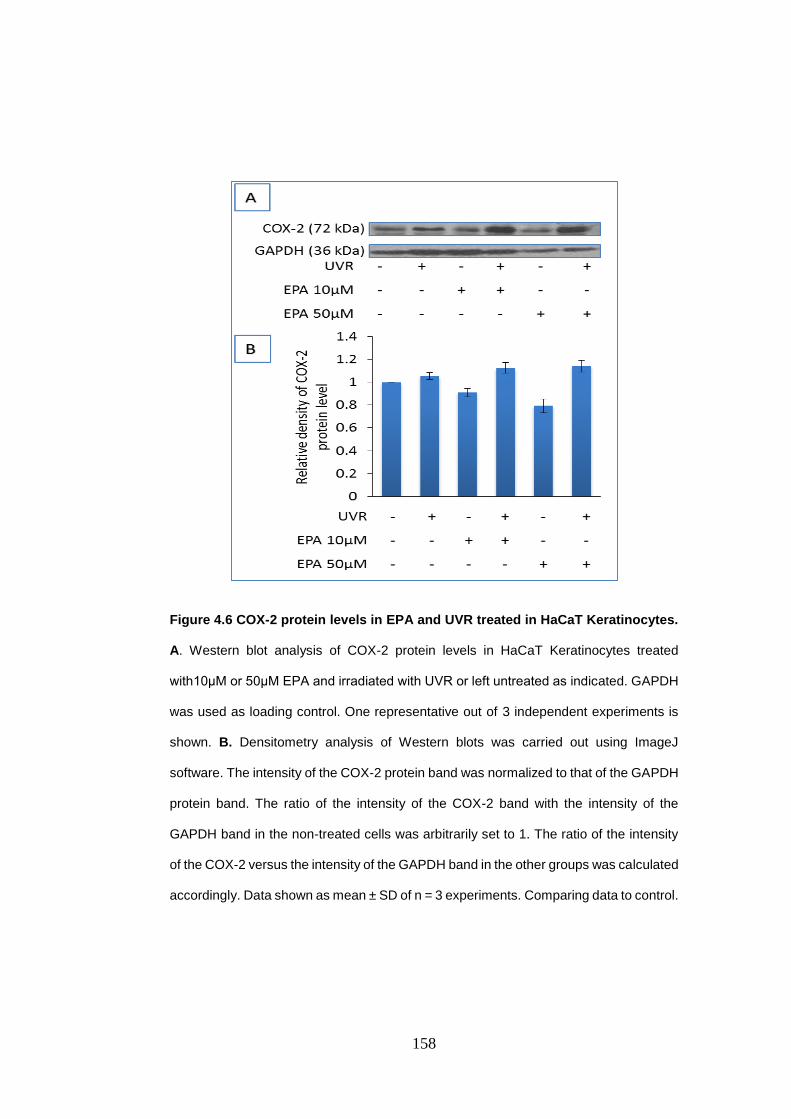
158
Figure 4.6 COX-2 protein levels in EPA and UVR treated in HaCaT Keratinocytes.
A. Western blot analysis of COX-2 protein levels in HaCaT Keratinocytes treated
with10μM or 50μM EPA and irradiated with UVR or left untreated as indicated. GAPDH
was used as loading control. One representative out of 3 independent experiments is
shown. B. Densitometry analysis of Western blots was carried out using ImageJ
software. The intensity of the COX-2 protein band was normalized to that of the GAPDH
protein band. The ratio of the intensity of the COX-2 band with the intensity of the
GAPDH band in the non-treated cells was arbitrarily set to 1. The ratio of the intensity
of the COX-2 versus the intensity of the GAPDH band in the other groups was calculated
accordingly. Data shown as mean ± SD of n = 3 experiments. Comparing data to control.
159
4.5. The effect of UVR and n-3 PUFA on LOX protein levels in HaCaT keratinocytes
and 46BR.IN fibroblasts.
LOX mediated metabolism of AEA and 2-AG has been discussed before in this chapter
(see section 4.2.1). Several Western blots experiments were carried out to assess the
effect of UVR and n-3 PUFA on LOX protein in HaCaT keratinocytes and 46BR.IN
fibroblasts. Since it is difficult to detect LOX protein levels possibly because of low levels
of expression of this enzyme in human skin cells three representative experiments will
be presented in this section.
Data in Figure 4.7 showed that 12-LOX protein level was increased after UVR exposure
in the irradiated 46BR.IN fibroblasts cells compared to non-irradiated control cells.
However a small decrease in its level was observed in cells treated with OA 10μM. On
the other hand, in cells treated with OA 10μM plus UVR, 12-LOX level was as same as
its level in the irradiated control cells (Figure 4.7 A and B). Also, cells that treated with
OA 50μM and OA 50μM plus UVR showed similar level of 12-LOX to that in untreated
and irradiated control cells respectively (Figure 4.7 A and B). Results in Figure 4.8 also
showed that 12-LOX level was increased in the irradiated control cells compared to non-
irradiated. Cells treated with DHA10μM presented minor decreases effect in 12-LOX
level compared to untreated 46BR.IN fibroblasts (Figure 4.8 A and B). This effect was
increased when a higher DHA concentration was used (50μM). UVR failed to increase
12-LOX level in the DHA treated (10μM or 50μM) cells (Figure 4.8 A and B). As in
46BR.IN fibroblasts, HaCaT keratinocytes cells treated with UV increased12-LOX level
compared to the non-irradiated cells (Figure 4.9 A and B). No changes in 12-LOX levels
were seen in cells treated with DHA 10μM or 50μM compared to untreated control cells
(Figure 4.9 A and B). Combined with UVR, DHA 10μM or 50μM also did not induce any
change in 12-LOX protein level (Figure 4.9 A and B).

160
Figure 4.7 12-LOX protein levels in OA and UVR treated in in 46BR.IN fibroblasts.
A. Western blot analysis of 12-LOX protein levels in 46BR.IN fibroblasts treated with
10μM or 50μM OA and irradiated with UVR or left untreated as indicated (n = 1). GAPDH
was used as loading control. B. Densitometry analysis of Western blots was carried out
using ImageJ software. The intensity of the 12-LOX protein band was normalized to that
of the GAPDH protein band. The ratio of the intensity of the 12-LOX band with the
intensity of the GAPDH band in the non-treated cells was arbitrarily set to 1. The ratio
of the intensity of the 12-LOX versus the intensity of the GAPDH band in the other
groups was calculated accordingly.

161
Figure 4.8 12-LOX protein levels in DHA and UVR treated in in 46BR.IN fibroblasts.
A. Western blot analysis of 12-LOX protein levels in 46BR.IN fibroblasts treated with
10μM or 50μM DHA and irradiated with UVR or left untreated as indicated (n = 1).
GAPDH was used as loading control. B. Densitometry analysis of Western blots was
carried out using ImageJ software. The intensity of the 12-LOX protein band was
normalized to that of the GAPDH protein band. The ratio of the intensity of the 12-LOX
band with the intensity of the GAPDH band in the non-treated cells was arbitrarily set to
1. The ratio of the intensity of the 12-LOX versus the intensity of the GAPDH band in
the other groups was calculated accordingly.

162
Figure 4.9 12-LOX protein levels in OA and UVR treated in HaCaT keratinocytes.
A. Western blot analysis of 12-LOX protein levels in HaCaT keratinocytes treated with
10μM or 50μM OA and irradiated with UVR or left untreated as indicated (n = 1). GAPDH
was used as loading control. B. Densitometry analysis of Western blots was carried out
using ImageJ software. The intensity of the 12-LOX protein band was normalized to that
of the GAPDH protein band. The ratio of the intensity of the 12-LOX band with the
intensity of the GAPDH band in the non-treated cells was arbitrarily set to 1. The ratio
of the intensity of the 12-LOX versus the intensity of the GAPDH band in the other
groups was calculated accordingly.

163
4.6. The effect of UVR and n-3 PUFA on NAPE-PLD and FAAH protein levels in
HaCaT keratinocytes and 46BR.IN fibroblasts
NAPE-PLD and FAAH are the enzymes responsible for endocannabinoid biosynthesis
and degradation, respectively. Protein levels of these enzymes were investigated in
HaCaT keratinocytes and 46BR.IN fibroblasts. In three independent experiments, these
cells were treated with DHA, EPA and OA at two doses: 10μM or 50μM. Each
experiment was divided into two groups; control with and without UVR and n-3 PUFAs
treated with and without UVR (see sections 2.2.5 and 2.2.6 for more details). NAPE-
PLD and FAAH protein levels were estimated by Western blot analysis.
4.6.1. Effect of OA and UVR on FAAH and NAPE-PLD in HaCaT keratinocytes
The effect of OA and UVR on FAAH protein level in HaCaT keratinocyte cell line was
assessed using Western blot analysis (Figure 4.10 A). Insignificant down-regulation
effect was seen in FAAH protein level in the irradiated compared to non-irradiated
HaCaT cells (Figure 4.10 A and B). Data in this figure showed that OA treatment at dose
10μM or 50μM increased FAAH levels compared to the untreated control cells (Figure
4.10 A and B). However, a combination of OA 10μM or 50μM treated groups with UVR
did not affect FAAH levels significantly compared to the irradiated controls cells (Figure
4.10 A and B). NAPE-PLD levels were slightly increased after UVR exposure compared
to the non-irradiated control cells. Furthermore, treatment either with OA 10μM or 50μM
insignificantly decreased NAPE-PLD compared to the non-irradiated. Moreover, NAPE-
PLD levels also were insignificantly reduced with OA 10μM or 50μM plus UVR
compared to the irradiated control cells. In general, NAPE-PLD protein levels were
almost similar in all treated groups either with or without UV radiation (Figure 4.11 A
and B).

164
4.6.2. Effect of EPA and UVR on FAAH and NAPE-PLD in HaCaT keratinocytes cell
lines.
FAAH protein level was reduced in the irradiated control HaCaT keratinocytes
compared to the non-irradiated control cells (Figure 4.12 A and B). Dose dependently
increase was observed in HaCaT keratinocytes treated with EPA 10µM or 50µM
compared to untreated HaCaT cells (Figure 4.12 A and B). However, this effect was
reversed by UVR in both, EPA10µM and 50µM treated groups. In this case FAAH levels
were reduced to the same level as in the irradiated control cells (Figure 4.12 A and B).
Data presented in Figure 4.13 suggested that UV radiation increased NAPE-PLD
protein level in HaCaT cells compared to the non-irradiated control. Furthermore,
NAPE-PLD protein levels also increased in cells treated with EPA 10µM and this effect
was enhanced with EPA 50µM (P = 0.002) compare to the untreated HaCaT cells
(Figure 4.13 A and B). However, combination of EPA 10µM and UVR induced
insignificant decreases in NAPE-PLD level compared to the irradiated control cells but
this effect was reversed in cells treated with EPA 50µM plus UVR compared to the
irradiated control HaCaT cells (Figure 4.13 A and B).
4.6.3. Effect of DHA and UVR on FAAH and NAPE-PLD in HaCaT keratinocytes
Data in Figure 4.14 indicated that FAAH protein level was reduced after HaCaT cells
were submitted to UV radiation compared to the non-irradiated control cells. However,
this level was increased in cells treated with treated with DHA 10µM compared to
untreated cells (Figure 4.14 A and B). This effect was then prevented by UVR which
reduced FAAH levels but to range upper than in the irradiated control cells. Likewise,
treatment with DHA 50µM decreased FAAH to its lowest level in this experiment and
this effect was however terminated by UV radiation which brought FAAH level to be as
same as in the irradiated cells treated with DHA 10µM (Figure 4.14 A and B). NAPE-
PLD protein level was decreased in HaCaT keratinocytes submitted to UVR compared
to non-irradiated control cells (Figure 4.15 A and B). Furthermore, its level was also
decreased in cells treated with DHA10µM or 50µM compared to untreated cells.

165
However, when this group was exposed to UVR these effects were reversed (Figure
4.15 A and B).
Figure 4.10: FAAH protein levels in OA and UVR treated in HaCaT keratinocytes.
A. Western blot analysis of FAAH protein levels in HaCaT keratinocytes treated
with10μM or 50μM OA and irradiated with UVR or left untreated as indicated. GAPDH
was used as loading control. One representative out of 3 independent experiments is
shown. B. Densitometry analysis of Western blots was carried out using ImageJ
software. The intensity of the FAAH protein band was normalized to that of the GAPDH
protein band. The ratio of the intensity of the FAAH band with the intensity of the GAPDH
band in the non-treated cells was arbitrarily set to 1. The ratio of the intensity of the
FAAH versus the intensity of the GAPDH band in the other groups was calculated
accordingly. Data shown as mean ± SD of n = 3 experiments. Comparing data to control.

166
Figure 4.11: NAPE-PLD protein levels in OA and UVR treated in HaCaT
keratinocytes. A. Western blot analysis of NAPE-PLD protein levels in HaCaT
keratinocytes treated with10μM or 50μM OA and irradiated with UVR or left untreated
as indicated. GAPDH was used as loading control. One representative out of 3
independent experiments is shown. B. Densitometry analysis of Western blots was
carried out using ImageJ software. The intensity of the NAPE-PLD protein band was
normalized to that of the GAPDH protein band. The ratio of the intensity of the NAPE-
PLD band with the intensity of the GAPDH band in the non-treated cells was arbitrarily
set to 1. The ratio of the intensity of the NAPE-PLD versus the intensity of the GAPDH
band in the other groups was calculated accordingly. Data shown as mean ± SD of n =
3 experiments. Comparing data to control.

167
Figure 4.12: FAAH protein levels in EPA and UVR treated in HaCaT keratinocytes.
A. Western blot analysis of FAAH protein levels in HaCaT keratinocytes treated with
10μM or 50μM EPA and irradiated with UVR or left untreated as indicated. GAPDH was
used as loading control. One representative out of 3 independent experiments is shown.
B. Densitometry analysis of Western blots was carried out using ImageJ software. The
intensity of the FAAH protein band was normalized to that of the GAPDH protein band.
The ratio of the intensity of the FAAH band with the intensity of the GAPDH band in the
non-treated cells was arbitrarily set to 1. The ratio of the intensity of the FAAH versus
the intensity of the GAPDH band in the other groups was calculated accordingly. Data
shown as mean ± SD of n = 3 experiments. Comparing data to control.

168
Figure 4.13: NAPE-PLD protein levels in EPA and UVR treated in HaCaT
keratinocytes. A. Western blot analysis of NAPE-PLD protein levels in HaCaT
keratinocytes treated with 10μM or 50μM EPA and irradiated with UVR or left untreated
as indicated. GAPDH was used as loading control. One representative out of 3
independent experiments is shown. B. Densitometry analysis of Western blots was
carried out using ImageJ software. The intensity of the NAPE-PLD protein band was
normalized to that of the GAPDH protein band. The ratio of the intensity of the NAPE-
PLD band with the intensity of the GAPDH band in the non-treated cells was arbitrarily
set to 1. The ratio of the intensity of the NAPE-PLD versus the intensity of the GAPDH
band in the other groups was calculated accordingly. Data shown as mean ± SD of n =
3 experiments. **P<0.01, comparing data to control.

169
Figure 4.14: FAAH protein levels in DHA and UVR treated in HaCaT keratinocytes.
A. Western blot analysis of FAAH protein levels in HaCaT keratinocytes treated with
10μM or 50μM DHA and irradiated with UVR or left untreated as indicated. GAPDH was
used as loading control. One representative out of 3 independent experiments is shown.
B. Densitometry analysis of Western blots was carried out using ImageJ software. The
intensity of the FAAH protein band was normalized to that of the GAPDH protein band.
The ratio of the intensity of the FAAH band with the intensity of the GAPDH band in the
non-treated cells was arbitrarily set to 1. The ratio of the intensity of the FAAH versus
the intensity of the GAPDH band in the other groups was calculated accordingly. Data
shown as mean ± SD of n = 3 experiments. Comparing data to control.

170
Figure 4.15: NAPE-PLD protein levels in DHA and UVR treated in HaCaT
keratinocytes. A. Western blot analysis of NAPE-PLD protein levels in HaCaT
keratinocytes treated with10μM or 50μM DHA and irradiated with UVR or left untreated
as indicated. GAPDH was used as loading control. One representative out of 3
independent experiments is shown. B. Densitometry analysis of Western blots was
carried out using ImageJ software. The intensity of the NAPE-PLD protein band was
normalized to that of the GAPDH protein band. The ratio of the intensity of the NAPE-
PLD band with the intensity of the GAPDH band in the non-treated cells was arbitrarily
set to 1. The ratio of the intensity of the NAPE-PLD versus the intensity of the GAPDH
band in the other groups was calculated accordingly. Data shown as mean ± SD of n =
3 experiments. Comparing data to control.

171
4.6.4. Effect of OA and UVR on FAAH and NAPE-PLD protein level in 46BR.IN
fibroblasts
The effect of OA and UVR on FAAH protein level in 46BR.IN fibroblasts was studied
using western blot analysis. Our findings demonstrated that there were on significant
changes in FAAH protein level in UVR irradiated 46BR.IN cells compared to non-
irradiated control cells (Figure 4.16 A and B). However, no changes were observed in
FAAH levels in OA 10μM or 50μM treated cells compared to the untreated control cells.
Compared to the irradiated control cells, minor increases were noticed in FAAH levels
when those treated cells exposed to UVR.
NAPE-PLD protein level showed similar patterns to that of FAAH protein levels in
46BR.IN fibroblasts where its level was also insignificantly decreased after UVR
exposure compared to non-irradiated control cells. This minor effect was enhanced
when the OA (10μM or 50μM) treatment was combined with UV radiation (Figure 4.17
A and B). Data also showed a slight reduction in NAPE-PLD level in cells treated with
OA 10μM. In contrast, OA at concentration 50μM caused the level of NAPE-PLD to be
increased compared to untreated control cells (Figure 4.17 A and B).
4.6.5. Effect of EPA and UVR on FAAH and NAPE-PLD in 46BR.IN fibroblasts
FAAH protein level was reduced after UV radiation compared to the non-irradiated
control cells. EPA treatment in both doses used (10µM and 50µM) also induced minor
decrease in FAAH level compared to the untreated cells (Figure 4.18 A and B). A similar
effect was observed when those treated cells were submitted to UV radiation (Figure
4.18 A and B).
The data shown in Figure 4.19 showed that there were minor increases in NAPE-PLD
levels in the irradiated cells compared to non-irradiated control cells (Figure 4.19 A and
B). In addition, both doses used (10µM or 50µM) of EPA induced dose dependently
minor increases compared to the untreated cells (Figure 4.19 A and B). This effect was
enhanced when those treated cells were exposed to UV radiation.

172
4.6.6. Effect of DHA and UVR on FAAH and NAPE-PLD in 46BR.IN fibroblasts
FAAH protein levels were found to be slightly decreased in the irradiated 46BR.IN
fibroblasts compared to the non-irradiated control cells (Figure 4.20 A and B). Also, a
similar effect was observed in DHA 10µM or 50µM and in DHA 50µM plus UVR (Figure
4.20 A and B). However, a small increase in FAAH level was seen in cells treated with
DHA 10µM combined with UV radiation (Figure 4.20 A and B). Data in Figure 4.21
indicated that NAPE-PLD protein level also was reduced after UVR compared to non-
irradiated cells (Figure 4.21 A and B). Comparing to the untreated control cells, DHA
10µM also showed the same effect. On the other hand, treatment with DHA 50µM and
DHA 10 µM or 50 µM plus UVR increased NAPE-PLD levels to the same range
compared to the irradiated and non-irradiated control cells (Figure 4.21 A and B).

173
Figure 4.16: FAAH protein levels in OA and UVR treated in 46BR.IN fibroblasts. A.
Western blot analysis of FAAH protein levels in 46BR.IN fibroblasts treated with 10μM
or 50μM OA and irradiated with UVR or left untreated as indicated. GAPDH was used
as loading control. One representative out of 3 independent experiments is shown. B.
Densitometry analysis of Western blots was carried out using ImageJ software. The
intensity of the FAAH protein band was normalized to that of the GAPDH protein band.
The ratio of the intensity of the FAAH band with the intensity of the GAPDH band in the
non-treated cells was arbitrarily set to 1. The ratio of the intensity of the FAAH versus
the intensity of the GAPDH band in the other groups was calculated accordingly. Data
shown as mean ± SD of n = 3 experiments. Comparing data to control.

174
Figure 4.17: NAPE-PLD protein levels in OA and UVR treated in 46BR.IN
fibroblasts. A. Western blot analysis of NAPE-PLD protein levels in 46BR.IN fibroblasts
treated with 10μM or 50μM OA and irradiated with UVR or left untreated as indicated.
GAPDH was used as loading control. One representative out of 3 independent
experiments is shown. B. Densitometry analysis of Western blots was carried out using
ImageJ software. The intensity of the NAPE-PLD protein band was normalized to that
of the GAPDH protein band. The ratio of the intensity of the NAPE-PLD band with the
intensity of the GAPDH band in the non-treated cells was arbitrarily set to 1. The ratio
of the intensity of the NAPE-PLD versus the intensity of the GAPDH band in the other
groups was calculated accordingly. Data shown as mean ± SD of n = 3 experiments.
Comparing data to control.

175
Figure 4.18: FAAH protein levels in EPA and UVR treated in 46BR.IN fibroblasts.
A. Western blot analysis of FAAH protein levels in 46BR.IN fibroblasts treated with
10μM or 50μM EPA and irradiated with UVR or left untreated as indicated. GAPDH was
used as loading control. One representative out of 3 independent experiments is shown.
B. Densitometry analysis of Western blots was carried out using ImageJ software. The
intensity of the FAAH protein band was normalized to that of the GAPDH protein band.
The ratio of the intensity of the FAAH band with the intensity of the GAPDH band in the
non-treated cells was arbitrarily set to 1. The ratio of the intensity of the FAAH versus
the intensity of the GAPDH band in the other groups was calculated accordingly. Data
shown as mean ± SD of n = 3 experiments. Comparing data to control.

176
Figure 4.19: NAPE-PLD protein levels in EPA and UVR treated in 46BR.IN
fibroblasts. A. Western blot analysis of NAPE-PLD protein levels in 46BR.IN fibroblasts
treated with 10μM or 50μM EPA and irradiated with UVR or left untreated as indicated.
GAPDH was used as loading control. One representative out of 3 independent
experiments is shown. B. Densitometry analysis of Western blots was carried out using
ImageJ software. The intensity of the NAPE-PLD protein band was normalized to that
of the GAPDH protein band. The ratio of the intensity of the NAPE-PLD band with the
intensity of the GAPDH band in the non-treated cells was arbitrarily set to 1. The ratio
of the intensity of the NAPE-PLD versus the intensity of the GAPDH band in the other
groups was calculated accordingly. Data shown as mean ± SD of n = 3 experiments.
Comparing data to control.

177
Figure 4.20: FAAH protein levels in DHA and UVR treated in 46BR.IN fibroblasts.
A. Western blot analysis of FAAH protein levels in 46BR.IN fibroblasts treated with
10μM or 50μM DHA and irradiated with UVR or left untreated as indicated. GAPDH was
used as loading control. One representative out of 3 independent experiments is shown.
B. Densitometry analysis of Western blots was carried out using ImageJ software. The
intensity of the FAAH protein band was normalized to that of the GAPDH protein band.
The ratio of the intensity of the FAAH band with the intensity of the GAPDH band in the
non-treated cells was arbitrarily set to 1. The ratio of the intensity of the FAAH versus
the intensity of the GAPDH band in the other groups was calculated accordingly. Data
shown as mean ± SD of n = 3 experiments. Comparing data to control.

178
Figure 4.21: NAPE-PLD protein levels in DHA and UVR treated in 46BR.IN
fibroblasts. A. Western blot analysis of NAPE-PLD protein levels in 46BR.IN fibroblasts
treated with10μM or 50μM DHA and irradiated with UVR or left untreated as indicated.
GAPDH was used as loading control. One representative out of 3 independent
experiments is shown. B. Densitometry analysis of Western blots was carried out using
ImageJ software. The intensity of the NAPE-PLD protein band was normalized to that
of the GAPDH protein band. The ratio of the intensity of the NAPE-PLD band with the
intensity of the GAPDH band in the non-treated cells was arbitrarily set to 1. The ratio
of the intensity of the NAPE-PLD versus the intensity of the GAPDH band in the other
groups was calculated accordingly. Data shown as mean ± SD of n = 3 experiments.
Comparing data to control.

179
4.7 Discussion
4.7.1. The effect of omega-3 polyunsaturated fatty acids and UVR on COX-2
protein expression in HaCaT keratinocytes and 46BR.IN fibroblasts
UVR radiation can cause skin disorders like sunburn, DNA damage and carcinogenesis.
It is well documented that COX-2 overexpression post UVR is involved in skin
inflammation and skin cancer and it may be the key factor behind all the detrimental
effects that UVR induces. However, n-3 PUFA are well known for their beneficial role
as anti-inflammatory compounds which may be a promising component that may play
a crucial role against the detrimental effects of UVR on skin cells. Therefore, in this
study we sought to examine the effect of n-3 PUFA on UVR-induced up-regulation in
COX-2 protein expression in HaCaT keratinocytes and 46BR.IN fibroblasts.
COX-2 is expressed in human keratinocytes and fibroblasts and involved in keratinocyte
differentiation (Leong et al., 1996) and human foreskin fibroblastic (HFF) cells (Gilroy et
al., 2001). Many factors may be involved in COX-2 expression such as multiple
mitogenic and pro-inflammatory stimuli (Maldve and Fischer, 1996, Feng et al., 1995).
Among these factors, growth factors (Feng et al., 1995), cytokines (Feng et al., 1995),
bacterial endotoxin (Xie et al., 1992) and carcinogens (Kujubu et al., 1991). Also, as
mentioned before during the differentiation process in human keratinocytes (Leong et
al., 1996) or fibroblastic cells (Gilroy et al., 2001). According to the Gilroy study, COX-2
expression is increased in fibroblasts cells when they were exposed to phorbol 12-
myristate 13-acetate (PMA) or interleukin-1β (IL-1β), this happened during the
quiescent G0 phase. Whereas when the cells entered the committed G1 phase of the
cell cycle, COX-2 expression was suppressed. Also it was reported that COX-2 mRNA
levels were reduced by 53% and 70% when a majority of the cells had entered the S
and G2/M phases of cell cycle, respectively. Gilroy et al., also suggested that COX-2
expression in cycling cells is firmly controlled to avoid excessive oxidative DNA damage.
Therefore, any dysregulation in this system could lead to detrimental effects.
Results from our study showed that COX-2 levels were up-regulated in the UVR
irradiated cells in levels slightly higher than those that were not irradiated in both cell

180
models. These results are in agreement with other previous studies showing up-
regulation of COX-2 protein levels following UVB irradiation in HaCaT keratinocytes
(Buckman et al., 1998, Tang et al., 2001, Kim et al., 2007). COX-2 protein expression
was also found to be up-regulated in human keratinocytes in volunteers subjected to
UVB radiation up to 4 times (Buckman et al., 1998). COX-2 was also overexpressed in
the skin of hairless mice upon UVB radiation (Kim et al., 2007). Moreover, Bachelor et
al., reported an increase in COX-2 mRNA after UVB radiation in SKH-1 mouse
epidermis (Bachelor et al., 2005). Findings from all of the above mentioned studies were
in agreement with our results.
It has been suggested that UVB induces COX-2 expression throughout increased
activation of transcription factors, p38 mitogen activated protein kinase (MAPK) and
phosphatidylinositol 3 kinase (PI3K) which will then phosphorylate the cyclic AMP-
responsive element binding protein (CREB) which is needed for the COX-2 to be
expressed (Bachelor et al., 2005). In addition, Tang et al., (2001) demonstrated that
CREB is essential for both basal and UVB induced COX-2 expression in HaCaT
keratinocytes (Tang et al., 2001). Furthermore, NF-kB is another transcription factor
which may play a key role in the UVB-induced COX-2 expression. Accordingly, UVB
has been found to lead to phosphorylation of ERK (Chang et al., 2011) and p38 mitogen-
activated kinases (Bachelor et al., 2005, Kim et al., 2005) which then activates NF-kB
and induces COX-2 expression (Chun and Surh, 2004). However, Chen et al.,
demonstrated that the ERK was not essential for UVB-induced COX-2 gene expression
in HaCaT keratinocytes (Chen et al., 2001). Moreover, it has been suggested that UVR
induced cytoplasmic expression of human antigen R (HuR) which in turn increases
COX-2 mRNA stability (Sengupta et al., 2003, Tong et al., 2007).
The effect of the n-3 PUFA DHA and EPA on COX-2 expression was also examined.
Our findings indicated that DHA treatment significantly decreased COX-2 expression in
46BR.IN fibroblasts in dose dependent manner (Figure 4.1). UVR-induced COX-2
expression was also dose dependently inhibited by 10μM or 50μM DHA in the same
cells. Similar results in different cell lines have been demonstrated by previous study
where DHA reported to block COX-2 expression in UVR stimulated keratinocytes

181
(Zhang and Bowden, 2008). Moreover, DHA has been also shown to revert UVR-
induced COX-2 expression in nr-HaCaT cells (Sengupta et al., 2003, Zhang and
Bowden, 2008) In this case DHA reduced the expression of COX-2 mRNA stabilizer
HuR in many cells including keratinocytes (Sengupta et al., 2003, Zhang and Bowden,
2008). Moreover, topical application of DHA has been also reported to inhibit UVB-
induced COX-2 expression in mouse skin (Rahman et al., 2011). According to Rahman
et al., (2011) this effect was attributed to the ability of DHA to attenuate UVB-induced
DNA binding of NF-kB through the inhibition of the phosphorylation of IKKα/β and
phosphorylation and degradation of IKBα and nuclear localization of p50 and p65
proteins. However, our results showed an opposite effect, when HaCaT keratinocytes
were treated with DHA 10μM or 50μM, DHA did not inhibit UVR induced COX-2
expression in the irradiated cells (Figure 4.2). Our results here are also in consistent
with another study that used a different stimulus and different type of cells. They were
found that the DHA enhanced phorbol ester or interleukin 1β-induced COX-2 expression
in rat vascular endothelial cells (Machida et al., 2005).The authors attributed this effect
to the ability of DHA induced p44/42 MAPK activation. Similar effect of DHA was also
reported by Hirafuji et al., and Diep et al., who suggested the role of DHA induced
p44/42 or p38 MAPK activation (Diep et al., 2000, Hirafuji et al., 2002).
Data from the present study also showed that EPA 10µM or 50µM decreased COX-2
protein levels in concentration dependent manner in both HaCaT keratinocytes and
46BR.IN fibroblasts cells. These results are in line with what another study indicated
that COX-2 expression was increased in young skin human after EPA treatment (Kim
et al., 2006). EPA and DHA also reduced COX-2 expression in HT-29 human colorectal
cells (Calviello et al., 2004). Furthermore, COX-2 expression was found to be decreased
in rats treated with flaxseed oil which is a high source of n-3 PUFA (Bommareddy et al.,
2006). Similar to DHA, EPA may exert its effect on COX-2 expression through NFkB.
EPA has been reported to inhibit NFkB expression in cultured pancreatic and human
monocytes via inhibition of IkB degradation, the inhibitory subunit of NFkB (Lo et al.,
1999, Novak et al., 2003, Zhao et al., 2004). This finding has been shown by another
study that suggested that endogenously biosynthesized n-3 PUFA protect transgenic

182
mice from colitis through a decrease in NFkB activity (Hudert et al., 2006). However,
our results showed that both EPA treatment and UV radiation synergistically induced
COX-2 expression in both cells types. Our data also showed that UVR significantly
increased COX-2 level in EPA treated HaCaT keratinocytes. In another study, a
synergistic action has also been reported between UVB and EPA to induce TNF-α
expression (Pupe et al., 2002). Indeed, TNF-α has been suggested to stimulate gene-6
(TSG-6) which in turn up-regulate COX-2 expression in macrophages which
preferentially produce PGD2 and its metabolite 15-deoxy-12,14-prostaglandinJ2
(15dPGJ2) (Mindrescu et al., 2005). 15dPGJ2 and n-3 PUFA both may play a key role
in the activation of the anti-inflammatory peroxisome-proliferator-activated-receptor
gamma (PPAR gamma) (Jump and Clarke, 1999, Mindrescu et al., 2005). In addition,
EPA and DHA has also been found to up-regulate COX-2 expression in HaCaT
keratinocytes (Chene et al., 2007). The effect could be essential to increase the
production of 3-series PGs (i.e. PGD3, PGI3 and PGE3) through EPA and DHA-induced
COX-2 expression (Fischer et al., 1988). It should be noted that the 3-series PGs may
play an important role as an anti-inflammatory eicosanoids as they are weaker
inflammatory than 2-series PGS (Bagga et al., 2003).
4.7.2. The effect of omega-3 polyunsaturated fatty acids and UVR on NAPE-PLD
and FAAH protein expression in HaCaT keratinocytes and 46BR.IN fibroblasts
Here we explore for the first time the effect of the UVB on the NAPE-PLD and FAAH,
the two enzymes that responsible for AEA biosynthesis and degradation respectively.
Although, there were no significant differences, our results showed some trends
indicating that UVR may reduce FAAH levels while, mixed effects observed on NAPE-
PLD levels in HaCaT keratinocytes and 46BR.IN fibroblasts. These were supported by
other observations presented in this study that AEA and 2-AG synthesis was found to
be slightly increased after UVR exposure of both types of cells models used in this study
(Figures 3.2 F, 3.7 F, 3.8 F and 3.9 F. Chapter 3).

183
DHA and EPA treatment decreased FAAH levels and increased NAPE-PLD levels in
both HaCaT keratinocytes and 46BR.IN fibroblasts. This has lent support to other
results in this study showing that DHA increased AEA production in HaCaT
keratinocytes (Figure 3.2 F. Chapter 3).
In an attempt to explain our findings, we examined many aspects. Presumably, UVR
could affect FAAH and NAPE-PLD protein levels through their transcriptional factors
and gene expression. NF-kB is a transcription factor that plays a key role in cellular
response to environmental stress such as UV radiation by inducing or suppressing the
expression of specific gene (Herrlich et al., 2008). UVR-induced NF-kB activation has
been reported in several studies. For example, NF-kB activation in human skin
fibroblasts has been demonstrated after UVA radiation (Vile et al., 1995, Reelfs et al.,
2004). Also, UVB was found to induce NF-kB activation in human epidermal
keratinocytes (Adhami et al., 2003). Apart from this, Leptin was demonstrated to
stimulate the activity and expression of FAAH throughout FAAH gene by activating the
promoter region through a STAT3 (signal transduction and activator of transcription 3)
element (Maccarrone et al., 2003a). Moreover, Waleh et al., has reported that FAAH
enzyme has estrogen response element (ERE) in its FAAH gene in mouse (Waleh et
al., 2002). Thus, sex hormones have been reported to down-regulate FAAH gene
expression (Maccarrone et al., 2000). Progesterone for example was found to up-
regulate the FAAH gene in human T-cells via the Ikaros transcription factor (Maccarrone
et al., 2003a). In contrast, endogenous steroid 17β-estradiol (E2) has been suggested
to regulate many transcription factors and may be enhance FAAH gene expression at
transcriptional and translational level (Rossi et al., 2007). It is noteworthy noting that
estrogen receptors (ER) has been found to interact with some transcription factors to
regulate or repress transcription (Cheng et al., 2003). NF-kB is one of these transcription
factors that were found to interact with ER (Frasor et al., 2009). Therefore, an interaction
between NF-kB and ER may be one of the mechanisms behind UVR-induced FAAH
down-regulation observed in our results. This is in line with previous observation that
suggested NF-kB could regulate FAAH expression (Maccarrone et al., 2003b).

184
Furthermore, Liu et al., has suggested NF-kB as the main transcription factor that
regulates LPS-induced AEA synthesis (Liu et al., 2003).
Data from the present study also showed that UV radiation affected NAPE-PLD protein
levels in a fluctuated manner. However, the general trend was that UVR suppressed
NAPE-PLD expression. These data are in line with another research reported that LPS
produce an inhibition effect on NAPE-PLD expression (Zhu et al., 2011). In fact, these
observations may be due to many reasons, the effect of UV radiation on gene
expression of this enzyme could be one of them. NAPE-PLD gene was cloned in rodent
and human (Okamoto et al., 2004). The expression of this gene has been found to be
controlled by the transcription factor SP1 (Zhu et al., 2011). An environmental stress
such as UV radiation may affect gene expression through up- or downregulation of their
transcriptional factors. These may occur via the interaction of transcriptional factors with
each other as mentioned earlier. For instance, a functional interaction between SP1
and NF-kB has been shown to induce IL-6 gene expression (Sancéau et al., 1995).
Also, p65 which is subunit of NF-kB has been found to synergistically activate HIV-1
transcription with SP1 (Perkins et al., 1994, Pazin et al., 1996). Therefore, interaction of
NF-kB with SP1 can act synergistically to activate transcription factor of many target
genes. Therefore, this is may be the case behind UVR-induced changes in NAPE-PLD
levels in our study, especially with the notion of that the environmental stress induced
genes expression was found to be controlled by the transcription factor, NF-kB (Hayden
and Ghosh, 2012).
NF-kB itself could be controlled by n-3 PUFA which then regulates cellular signalling
and genes expression, in particular those related to inflammatory signalling and lipid
metabolism (Sampath and Ntambi, 2005, Schmitz and Ecker, 2008). In addition, n-3
PUFA could affect the membrane phospholipids and as a result, the production of
eicosanoids (Sampath and Ntambi, 2005). As an example, n-3 PUFA have been found
to affect eicosanoids production through their inhibitory effect on leptin and then the
expression of lipogenic gene in adipose tissue (Jump and Clarke, 1999, Raclot et al.,
1997), This may explain the down-regulation of FAAH by EPA and DHA observed in our
study, as leptin was found to stimulate the activity of FAAH gene expression

185
(Maccarrone et al., 2003a). As a matter of interest, the effect of n-3 PUFA on genes
expression seems to be very complicated. For example, they could exert positive and
negative effects on NF-kB (Sampath and Ntambi, 2005). n-3 PUFA can initiate the
phosphorylation of the IkB and then allow NF-kB nucleus translocation and as a results
the transcription of different genes such as COX-2 and IL-6 (Calder, 1997, Khalfoun et
al., 1997). In contrast, n-3 PUFA was reported to decrease the phosphorylation of the
IkB and then inhibit NF-kB translocation and target gene transcription (Camandola et
al., 1996, Zhao et al., 2004). All these could explain the effects of n-3 PUFA on the
FAAH and NAPE-PLD protein levels observed in the current study.
Taken together these results, it suggest that n-3 PUFA can induce endocannabinoid
production through their effect on endocannabinoid related enzymes. UVR-induced
endocannabinoid biosynthesis could suggest a defense mechanism of skin cells
followed UV radiation. However, further studies are still required.

186
CHAPTER 5: Investigation the effect of ultraviolet radiation on endocannabinoids and N-acylethanolamines in White Caucasians of skin phototype II and South Asians of skin phototype V
5.1. Introduction
The endocannabinoids AEA and 2-AG and NAE are widely distributed in many cells and
tissues (Devane et al., 1988, Devane et al., 1992, Matsuda et al., 1990, Mechoulam et
al., 1995, Schmid, 2000). They are involved in many physiological and pathological
functions including anti-nociception, anti-inflammatory effects, reproduction, modulation
of vascular tone, obesity, cancer, schizophrenia, sleep and drug addiction (Di Marzo,
1998, Piomelli, 2003, Pacher et al., 2006).
Ultraviolet radiation (UVR) is an environmental insult that can cause several health
disorders to human beings ranging from skin inflammation to skin cancer. It is well
known that UVR exerts its harmful effects on the human body through their interaction
with many biological processes such as genes expression and lipid biosynthesis and
metabolism pathways. Endocannabinoids and NAE have been suggested to play a key
role as anti-inflammatory and anti-cancer bioactive lipids. However, the effect of UVR
on their biochemical pathways has not been fully studied. The effect of UVR on
endocannabinoids and their congeners on human skin cells was examined in chapters
3 and 4 of this study. Here we examine the hypothesis that UVR may affect
endocannabinoid levels in the circulation and we examined this using volunteers of two
different ethnicities. Therefore, the specific objective here was to investigate the effect
of UVR on serum endocannabinoids and NEA. Volunteers of two skin types were used
to measure the levels of serum endocannabinoids and NAE in response to multiple
doses of UVR.

187
5.2. Aim of the study
To explore the effect of UVR on the levels of endocannabinoids and N-
acylethanolamines in human serum from White Caucasians of skin phototype II and
South Asians of phototype V.
5.3. Materials and Methods (For more details about the volunteers, experimental
design and lipid extraction please refer to Chapter 2, sections 2.9.1, 2.9.2, 2.9.3, 2.9.4,
2.9.5 and 2.9.6).
5.3.1. Statistical Analysis (refer to chapter 2 section 2.10).
5.4. RESULTS
Volunteers were from two different ethnic groups; 10 White Caucasians of skin
phototype II and 6 South Asians of skin phototype V. They were subjected to 8 doses
of UVR each time receiving the same dose (1.3 SED) from day 4, 7, 14, 21, 28, 35 and
day 39 of the study, the baseline was coded as day 0.
5.4.1. Effect of UVR on serum endocannabinoids and N-acylethanolamines
5.4.1.1 Effect of UVR on serum palmitoylethanolamide
Palmitoylethanolamide (PEA) level in White Caucasians was estimated to be 3160
pg/ml on day 0 which represents the baseline of the PEA, pre UVR. On day 4, PEA level
was increased to 4048 pg/ml and then from the day 7 to day 39, PEA levels were almost
as same as the baseline level (Figure 5.1, compare day 0 to days 7, 14, 21, 28, 35 and
39 ). PEA baseline level in South Asians participants was found to be 2814 pg/ml on
day 0. Compared to this baseline, PEA levels were slightly decreased to 2571 pg/ml,
2473 pg/ml, 2533 pg/ml and 2474 pg/ml on day 4, 7, 21 and 39 respectively. Whereas,
on day 28 which is the time point for the fifth dose of the UVR, PEA level was slightly
increased up to 3023 pg/ml compared to the baseline (Figure 5.1, compare day 0 to day
28). While, on day 14 and 35 the PEA levels were approximately similar to the baseline
level (Figure 5.1, compare day 0 to day 14 and 35). Overall, One-Way ANOVA followed

188
by Tukey post hoc test did not show any significant differences in PEA levels between
the different time points of UVR exposure either in the White Caucasians of skin
phototype II or in the South Asians of skin phototype V. As a result, it was concluded
that exposure to UVR for 6 weeks did not cause significant changes in PEA levels in
the human serum samples from White Caucasians of skin phototype II and South
Asians of skin phototype V.
Figure 5.1. PEA levels in serum before and after multiple UVR exposures (1.35
standard erythemal dose) in White Caucasians (skin phototype II, n=10 volunteers) and
South Asians (skin phototype V, n = 6 volunteers). Data shown as mean ± SD of n = 3
experiments. Comparing data to control.

189
5.4.1.2. Effect of UVR on serum linoleoyalethanolamide
Linoleoyalethanolamide (LEA) baseline levels were measured to be 870pg/ml and
1015pg/ml in skin phototype II and skin phototype V respectively. The comparison
between the different time points of UVR exposure was done by One-way ANOVA
following by Tukey Post hoc tests. There were no significant changes in LEA levels in
both skin phototype between all-time points of UVR exposures. LEA baseline in White
Caucasians of skin phototype II was assessed to be 870pg/ml. UVR exposure from day
4 to day 21 did not induce any noteworthy changes in LEA levels compared to the
baseline on day 0. However, in day 28 LEA level was increased up to 1004 pg/ml and
then decreased again to 947 pg/ml, 885 pg/ml in day 35 and 39 respectively. In addition,
the LEA baseline in South Asians of skin phototype V was calculated to be 1015 pg/ml.
The repeated doses of UVR on days 4, 7, 21 and 39 decreased the LEA level to 916
pg/ml, 920 pg/ml, 928 pg/ml and 969 pg/ml respectively. However, on day 14, 28 and
35 there were no important changes in LEA level compared to the baseline (Figure 5.2,
compare day 0 to day 14, 28 and 35). Consequently, One-Way ANOVA showed that 6
weeks of UVR exposure did not bring about any significant changes in LEA levels
between the different time points in the examined groups
Figure 5.2. LEA levels in serum before and after multiple UVR exposures (1.35
standard erythemal dose) in White Caucasians (skin phototype II, n=10 volunteers) and
South Asians (skin phototype V, n = 6 volunteers). Data shown as mean ± SD of n = 3
experiments. Comparing data to control.

190
5.4.1.3. Effect of UVR on serum oleoylethanolamide
OEA baseline levels were calculated to be 1412pg/ml and 798pg/ml in skin phototype
II and skin phototype V respectively. The comparison between the OEA levels in each
time points of UVR exposure was done by One-way ANOVA following by Tukey Post
hoc tests. Accordingly, there were no significant changes in OEA levels either in skin
phototype II or phototype V (Figure 5.3).
OEA baseline level in White Caucasians of skin phototype II was calculated to be
1412pg/ml while, this level slightly increased to 1513pg/ml, 1700pg/ml and 1589pg/ml
on day 4, day 28 and day 39 respectively. However, there were no intense changes in
OEA levels among the other time points of UVR exposure representative on day 7, 14,
21 and 35 (Figure 5.3). In South Asians of phototype V, OEA baseline level was
estimated to be 798pg/ml on day 0. Compared to this baseline level, no significant
changes were seen in OEA level especially on day 4, 14 and 28 (Figure 5.3, compare
day 0 to day 4, 14 and 28). However, on day 7, 21, 35 and 39 OEA levels insignificantly
decreased to 684pg/ml, 598pg/ml, 675pg/ml and 681pg/ml respectively (Figure 5.3,
compare day 0 to day 7, 21, 35 and 39).
Figure 5.3. OEA levels in serum before and after multiple UVR exposures (1.35
standard erythemal dose) in White Caucasians (skin phototype II, n=10 volunteers) and
South Asians (skin phototype V, n = 6 volunteers). Data shown as mean ± SD of n = 3
experiments. Comparing data to control.

191
5.4.1.4. Effect of UVR on serum stearoylethanolamide
Stearoylethanolamide (STEA) baseline levels were considered to be 713 pg/ml and 671
pg/ml in skin phototype II and skin phototype V respectively. The comparison between
the STEA levels in each time points of UVR exposure was done by One-way ANOVA
following by Tukey post hoc test. As a result, there were no significant changes in STEA
levels in both skin phototype between all-time points of UVR exposures. STEA baseline
level in the White Caucasians group was estimated to be 713 pg/ml (Figure 5.4).
However, STEA level was 943 pg/ml after the first dose of the UVR on day 4. In the
South Asians group STEA baseline was assessed to be 671 pg/ml (Figure 5.4).
However, STEA levels in volunteers from South Asia were decreased on day 4 and 7
after the first two doses of the UVR to 436 pg/ml and 457 pg/ml respectively. Whereas,
on day 14, 21, 28, 35 and 39, STEA levels were increased to 548 pg/ml, 493 pg/ml, 591
pg/ml, 560 pg/ml and 557 pg/ml respectively (Figure 5.4, compare day 0 to days 4, 7,
14, 21, 28, 35 and 39). Generally, different time points of UVR exposure did not induce
any significant changes in STEA levels in both tested groups.
Figure 5.4. STEA levels in serum before and after multiple UVR exposures (1.35
standard erythemal dose) in White Caucasians (skin phototype II, n=10 volunteers) and
South Asians (skin phototype V, n = 6 volunteers). Data shown as mean ± SD of n = 3
experiments. Comparing data to control.
192
5.4.1.5. Effect of UVR on serum docosahxaenoylethanolamide
Docosahxaenoylethanolamide (DHEA) baseline levels were considered to be 2797
pg/ml and 792 pg/ml in skin phototype II and skin phototype V respectively. The
comparison between the DHEA levels in each time points of UVR exposure was done
by One-way ANOVA following by Tukey Post hoc tests. There were no significant
differences in DHEA levels of both tested groups of skin phototypes (Figure 5.5). DHEA
baseline level was considered to be 2797 pg/ml (day 0). Compared to this baseline,
DHEA level was decreased to 2282 pg/ml after the first dose of UVR on day 4 (Figure
5.5, compare day 0 to day 4). However, no significant differences were recorded
between these time points. Regardless of DHEA levels on day 4, there were no dramatic
changes in the DHEA levels between the other time points representative on day 7, 14,
21, 28, 35 and 39 (Figure 5.5). In addition, Serum samples from six South Asians of
skin phototype V were extracted and analyzed for DHEA. Baseline levels were
assessed to be 792 pg/ml (day 0). DHEA levels were increased to 849 pg/ml, 1081
pg/ml, 1103 pg/ml and 1127 pg/ml on days 4, 14, 28 and 35 respectively. (Figure 5.17,
compare day 0 to days 4, 14, 28 and 35). However, on days 7, 21 and 39 DHEA levels
were decreased to 707 pg/ml, 626 pg/ml and 755 pg/ml respectively, compared to the
baseline level on day 0 (Figure 5.17, compare day 0 to days 7, 21 and 39). Accordingly,
we can conclude that UVR exposure for 6 weeks did not end in any significant changes
in DHEA levels in the White Caucasians and South Asians groups when the UVR effect
was examined in each group separately

193
Figure 5.5. DHEA levels in serum before and after multiple UVR exposures (1.35
standard erythemal dose) in White Caucasians (skin phototype II, n=10 volunteers) and
South Asians (skin phototype V, n = 6 volunteers). Data shown as mean ± SD of n = 3
experiments. Comparing data to control.
5.4.1.6. Effect of UVR on serum arachidonoylethanolamide
Arachidonoylethanolamide (AEA) baseline levels were considered to be 326 pg/ml and
280 pg/ml in skin phototype II and skin phototype V respectively. The comparison
between the AEA levels in each time points of UVR exposure was done by One-way
ANOVA following by Tukey post hoc test (Figure 5.6). White Caucasians volunteers
were extracted and analyzed for AEA. AEA level was estimated to be 326 pg/ml (day 0,
Figure 5.6). In general, AEA levels were similar between all the time points of UVR
exposure compared to the baseline on day 0. (Figure 5.6, compare day 0 to day 4, 7,
14, 21, 28, 35 and 39). Thus, no significant differences in AEA levels were found in this
experiment. AEA baseline level in South Asians volunteers was considered to be 280
pg/ml (day 0, Figure 5.6). AEA levels were decreased to 150 pg/ml, 196 pg/ml and 145
pg/ml on days 4, 7 and day 21 respectively, compared to day 0 (Figure 5.6, compare

194
day 0 to days 4, 7 and 21). In addition, AEA levels were also slightly decreased to
272pg/ml, 202pg/ml and 237pg/ml on days 14, 35 and 39 respectively. On the other
hand, on day 28 AEA level was increased to 322pg/ml compared to the baseline level
(Figure 5.6, compare day 0 to day 28). At the end, no significant differences were found
in this experiment.
Figure 5.6. AEA levels in serum before and after multiple UVR exposures (1.35
standard erythemal dose) in White Caucasians (skin phototype II, n=10 volunteers) and
South Asians (skin phototype V, n = 6 volunteers). Data shown as mean ± SD of n = 3
experiments. Comparing data to control.
5.4.1.7. Effect of UVR on serum 2-arachidonoyl glycerol
2-arachidonoyl glycerol (2-AG) baseline levels were considered to be 993 pg/ml and
1786 pg/ml in skin phototype II and skin phototype V respectively. The comparison
between the 2-AG levels in each time points of UVR exposure was done by One-way
ANOVA following by Tukey Post hoc tests. Based on our data, there were no significant
differences in 2-AG levels in all time points. 2-AG baseline in White Caucasians group
was calculated to be 993 pg/ml on day 0 (Figure 5.7). Compared to its baseline, 2-AG
level was markedly increased up to 2364 pg/ml after the first exposure of UVR on day

195
4. In day 7, 2-AG level was decreased to 1101pg/ml recording the nearest level to the
baseline on day 0 (Figure 5.7, compare day 0 to day 7). After that, 2-AG level was
increased again to 1732 pg/ml, 1575 pg/ml, 1474 pg/ml, and 1527 pg/ml on day 14, 21,
28 and 35 respectively. However, on day 39, 2-AG level decreased to 1231 pg/ml but
still more than its baseline level.
2-AG baseline in South Asians group was considered to be 1786 pg/ml on day 0 (Figure
5.7). Compared to its baseline, 2-AG level was increased up to 2088pg/ml, 2487pg/ml
and 2560pg/ml on day 4, 21 and 28 respectively (Figure 5.7, compare day 0 to days 4,
21 and 28). Conversely, on day 7, 14, 35 and 39, 2-AG levels was slightly decreased to
1800 pg/ml, 1699 pg/ml, 1682 pg/ml and 1185 pg/ml respectively, compared to the
baseline level (Figure 5.7, compare day 0 to days 7, 14, 35 and 39). Finally, our results
did not show any significant changes in 2-AG levels between the different time points of
UVR exposure either in White Caucasians or South Asians group.
Figure 5.7. 2-AG levels in serum before and after multiple UVR exposures (1.35
standard erythemal dose) in White Caucasians (skin phototype II, n=10 volunteers) and
South Asians (skin phototype V, n = 6 volunteers). Data shown as mean ± SD of n = 3
experiments. Comparing data to control.

196
5.4.1.8. Effect of UVR on serum 1-arachidonoyl glycerol
1-arachidonoyl glycerol (1-AG) baseline in White Caucasians was considered to be 742
pg/ml on day 0 (Figure 5.8). Compared to the baseline, UVR did not alter the 1-AG
levels in day 4, 7, 14, 28 and 35. Whereas, 1-AG levels were slightly decreased on day
22 compared to day 0 (Figure 5.8, compare day 0 to days 4, 7, 14, 21, 28 and 35). The
highest level of 1-AG was seen on day 39 (865pg/ml) (Figure 5.8, compare day 0 to day
39). 1-AG baseline in South Asians was measured to be 847 pg/ml on day 0 (Figure
5.8). 1-AG level was decreased to 726 pg/ml, 508 pg/ml, 651 pg/ml, 618 pg/ml, 713
pg/ml and 467 pg/ml on days 4, 7, 14, 28, 35 and 39 respectively (Figure 5.8, compare
day 0 to days 4, 7, 14, 28, 35 and 39). On the contrary, 1-AG level was increased to
895 pg/ml on day 21 compared to its baseline level on day 0 (Figure 5.8, compare day
0 to day 21). Overall, there were no significant changes in 1-AG level between all the
time points of UVR exposure in the data obtained from both groups this experiment.
Figure 5.8. 1-AG levels in serum before and after multiple UVR exposures (1.35
standard erythemal dose) in White Caucasians (skin phototype II, n=10 volunteers) and
South Asians (skin phototype V, n = 6 volunteers). Data shown as mean ± SD of n = 3
experiments. Comparing data to control.

197
5.4.1.9. Effect of UVR on docosapentaenoylethanolamide
Docosapentaenoylethanolamide (DPEA) level in White Caucasians was measured to
be 76pg/ml (day 0, Figure 5.9). Overall, DPEA levels were similar among all the time
points of UVR exposure compared to the baseline on day 0. (Figure 5.9, compare day
0 to day 4, 7, 14, 21, 28, 35 and 39). DPEA baseline level in South Asians was assessed
to be 48 pg/ml (day 0, Figure 5.9). Also, there were no important changes in DPEA
levels, they were similar between all the time point of UVR exposures compared to the
baseline on day 0. (Figure 5.9, compare day 0 to day 4, 7, 14, 21, 28, 35 and 39). Hence,
no significant differences in DPEA levels were found in this experiment according to
One-Way ANOVA test used for both groups.
Figure 5.9. DPEA levels in serum before and after multiple UVR exposures (1.35
standard erythemal dose) in White Caucasians (skin phototype II, n=10 volunteers) and
South Asians (skin phototype V, n = 6 volunteers). Data shown as mean ± SD of n = 3
experiments. Comparing data to control.

198
5.4.1.10. Effect of UVR on serum Myristoylethanolamide
Myristoylethanolamide (MEA) level in White Caucasians was considered to be 465pg/ml
on day 0, whereas on day 4, 7 and day 28, MEA levels were increased to 723pg/ml,
599pg/ml and 793pg/ml respectively (Figure 5.10, compare day 0 to day 4, 7 and day
28). After that, MEA levels were decreased on day 14, 21, 35 and 39 to 374pg/ml,
541pg/ml, 449pg/ml and 403pg/ml respectively, compared to the baseline level (Figure
5.10, compare day 0 to day 14, 21, 35 and 39). MEA baseline level in South Asians was
considered to be 335pg/ml on day 0. Compared to the baseline, MEA levels were
increased to 337pg/ml, 449pg/ml, 773pg/ml, 477pg/ml and 492pg/ml on days 4, 7, 14,
28 and 35 respectively (Figure 5.10, compare day 0 to days 4, 7, 14, 28 and 35). The
highest level of MEA was recorded at day 15 (773pg/ml). However, MEA levels were
decreased only on day 21 and 39 to 299 pg/ml and 297 pg/ml respectively, compared
to the baseline level (Figure 5.10, compare day 0 to day 21 and day 39). Yet, One-Way
ANOVA did not show any significant differences in MEA levels between all the time
points of UVR exposure in both groups examined. Therefore, this result conclude that
exposure to UVR for 6 weeks did not elicit significant changes in MEA level compared
to the MEA baseline.
Figure 5.10. MEA levels in serum before and after multiple UVR exposures (1.35
standard erythemal dose) in White Caucasians (skin phototype II, n=10 volunteers) and
South Asians (skin phototype V, n = 6 volunteers). Data shown as mean ± SD of n = 3
experiments. Comparing data to control.
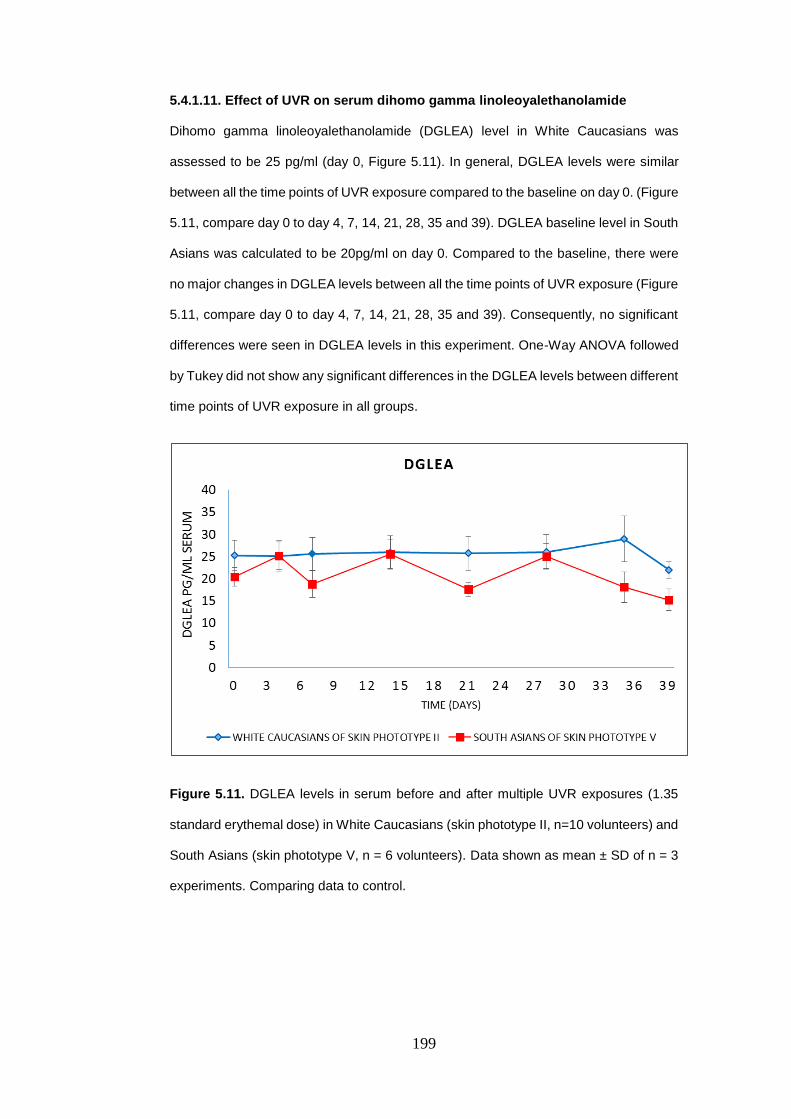
199
5.4.1.11. Effect of UVR on serum dihomo gamma linoleoyalethanolamide
Dihomo gamma linoleoyalethanolamide (DGLEA) level in White Caucasians was
assessed to be 25 pg/ml (day 0, Figure 5.11). In general, DGLEA levels were similar
between all the time points of UVR exposure compared to the baseline on day 0. (Figure
5.11, compare day 0 to day 4, 7, 14, 21, 28, 35 and 39). DGLEA baseline level in South
Asians was calculated to be 20pg/ml on day 0. Compared to the baseline, there were
no major changes in DGLEA levels between all the time points of UVR exposure (Figure
5.11, compare day 0 to day 4, 7, 14, 21, 28, 35 and 39). Consequently, no significant
differences were seen in DGLEA levels in this experiment. One-Way ANOVA followed
by Tukey did not show any significant differences in the DGLEA levels between different
time points of UVR exposure in all groups.
Figure 5.11. DGLEA levels in serum before and after multiple UVR exposures (1.35
standard erythemal dose) in White Caucasians (skin phototype II, n=10 volunteers) and
South Asians (skin phototype V, n = 6 volunteers). Data shown as mean ± SD of n = 3
experiments. Comparing data to control.

200
5.4.1.12. Effect of UVR on serum eicosapentaenoylethanolamide
Eicosapentaenoylethanolamide (EPEA) was found in 6 out of 10 White Caucasians of
skin phototype II. EPEA baseline level was calculated to be 44 pg/ml. this level did not
change after the first dose of UVR on day 4 (43 pg/ml). Compared to the baseline on
day 0, EPEA levels however increased to 69pg/ml, 72 pg/ml, 70 pg/ml, 88 pg/ml and 79
pg/ml from the second dose of UVR on day 7 until day 35 respectively (Figure 5.12,
compare day 0 to days 7, 14, 21, 28 and 35). On day 39, EPEA level decreased to the
baseline level (45pg/ml). These data were analyzed using One-Way ANOVA to
investigate the differences in the EPEA levels between different time points of UVR
exposure. Statistically, there were no significant differences in EPEA levels after 6
weeks of UVR exposure, compared to the EPEA baseline.
Figure 5.12. EPEA levels in serum before and after multiple UVR exposures (1.35
standard erythemal dose) in White Caucasians (skin phototype II, n=10 volunteers) and
South Asians (skin phototype V, n = 6 volunteers). Data shown as mean ± SD of n = 3
experiments. Comparing data to control.

201
5.5. Discussion
The aim of this study was to determine the effect of UVR on human serum
endocannabinoids and NAE using volunteers with two different skin phototypes. We
wanted to see if there are any differences in serum endocannabinoids and NAE in
response to multiple doses of UVR. The study was carried out for 6 weeks to mimic
UVR exposure during summer time. All clinical work was undertaken by Prof Rhodes’
group.
Based on our data, there were differences in the baseline levels of the
endocannabinoids and NAEs in the White Caucasians and South Asians. However,
findings from this study showed that UVR had no effect on PEA, LEA, STEA and DGLEA
levels in either skin phototypes. Regardless of the differences in the baseline between
the two tested skin types, multiple doses of UVR approximately induced similar
fluctuating effects on PEA, LEA, STEA and DGLEA levels in both skin types.
In general, NEA levels were found at higher concentrations in White Caucasians of skin
phototype II than South Asians of phototype V. PEA for example was at the highest level
among the detected NAE then DHEA, OEA, LEA, STEA, MEA, AEA, DP-EA, and
DGLEA. Moreover, DGLEA was at the lowest level in all the NAEs found. Its levels were
under 30 pg/ml in both groups. On the other hand, EPEA was found in 6 out of 10
volunteers of the White Caucasian group while, it was not found in the South Asian
group. UVR increased 2-AG in the serum of both groups. However, 2-AG levels were
higher in the South Asian group compared to the White Caucasian group. In all the time
points including the day 0 (baseline), no significant differences were recorded between
those time points in both examined groups. Therefore, based on these observations it
was concluded that UV radiation at the multiple doses used in this clinical study has no
effect on the serum endocannabinoids and their congeners in both skin phototype used.
Therefore, further study is still needed.
Sample stability could be another issue behind the negative results showed here in our
study. The human serum samples for the clinical study were stored at -80oC. Although,
all endocannabinoids and NAEs were detected by LC-MS/MS analysis, the samples
202
may be affected by storage. Especially, with NAEs which have very low levels in intact
cells and tissue (Berdyshev et al., 2000). Furthermore, it is well known that the
endocannabinoids and NEA are usually produced on demand rather than being stored
in cells (Schreiber et al., 2007) Also, the levels of such of these NAE are significantly
reduced with samples frizzing and thawing (Schreiber et al., 2007). Although this was
not an issue in this study, since the samples were only defrosted once, for the analysis.
Apart from this, endocannabinoid and NAE levels were higher in skin phototype II than
skin phototype V.
As it was mentioned before, the baseline of these endocannabinoids and NAE were
different thus, the differences in their baseline levels may attributed to other factors such
as the dietary habits of the participants but not to the UVR itself. It is well known that
diet has a large effect on endocannabinoid and NAE levels in our body. Since the
examined groups in this study were from different ethnic groups, they could have
different life styles especially in the way of food consumption.
The current study showed that the levels of OEA, DHEA, AEA and DPEA were higher
in the White Caucasians of skin phototype II than the South Asians of phototype V. This
result may be due to the diet of the White Caucasians volunteers, especially food that
contains omega-3 PUFA such as DHA and EPA. Dietary fatty acids can exert multiple,
indirect influences on lipid metabolism across n-3, n-6, n-9 pathways through processes
including tissue fatty acid uptake, distribution, and oxidation, fatty acid circulation and
elimination rates (Rapoport, 2008, Rapoport et al., 2007, Madsen et al., 1999, Polozova
et al., 2006, Emken et al., 1993). Further support for this suggestion comes from the
observation that DHA has been reported to induce an increase in plasma concentrations
of its NAE derivative DHEA (Wood et al., 2010). In addition, another study, reported
that two week supplementation with DHA affected brain and plasma NAE and
endocannabinoid metabolites to favour the formation of DHA and EPA derivatives.
Specifically, DHEA and EPG concentrations increased in both plasma and brain,
whereas AEA decreased in brain and OEA, AG, OG and AA levels decreased in plasma
(Wood et al., 2010). All these data suggest that competition among lipid biosynthetic
enzymes utilizing fatty acids as substrates could represent an important influence on

203
the formation of downstream lipid metabolites, including their derived endocannabinoid
metabolome constituents (Wood et al., 2010).

204
CHAPTER 6: General discussion and future studies
6.1. Introduction
The skin is the largest organ of the human body. It forms the physical barrier that protect
the body from environmental stress and regulates the inward and outward passage of
water (Hunter, 2003). Skin has also a protective role against microorganisms, chemical
agents and UVR. It is well known that UV radiation is a dangerous environmental
stressor on the skin. Repeated UVR exposure especially due to higher levels of UVR
reaching the earth, makes the skin impairs its protective function and as a consequence,
skin inflammation, DNA damaging and skin cancer may develop. Therefore, finding an
alternative way to protect our skin from harmful UV radiation is important. Based on
several investigations dietary n-3 PUFA could be a reliable way offering protection
against an array of health disorders. N-3 PUFA are now some of the most studied fatty
acids that have been thought to play a key role as anti-inflammatory agent. N-3 PUFA
can regulate a wide range of functions in the body, including blood pressure, blood
clotting, and correct development and functioning of the brain and nervous systems
(Das, 2006). Furthermore, they have a role in regulating inflammatory responses
through the production of inflammatory mediators such as the eicosanoids (Das, 2006,
Calder, 2006). EPA and DHA are believed to have several health benefits (Wall et al.,
2010). There is evidence that n-3 PUFAs improve cardiovascular outcomes (De
Caterina, 2011) and that they have efficacy in rheumatoid conditions (Bhangle and
Kolasinski, 2011).There is now emerging evidence that n-3 PUFAs may also have anti-
cancer activities (Cockbain et al., 2012). All these discoveries suggest that n-3 PUFA
could play a role in protecting the human body from the harmful effects of environmental
stressors like UV radiation.
N-3 PUFA can also generate endocannabinoids which are a group of lipid mediators,
derived from fatty acid precursors linked to an ethanolamine moiety. They can also
stimulate various physiological effects including hypothermia, anti-nociception,
vasodilation and anti-inflammatory effects (Di Marzo, 1998, Zygmunt et al., 1999) and
have been implicated in several physiological functions and conditions ranging from
analgesia, reproduction, modulation of vascular tone, obesity, cancer, schizophrenia,

205
and multiple sclerosis (Pacher et al., 2006). Endocannabinoid congeners such as the
NAEs Include palmitoylethanolamide (PEA), oleoylethanolamide (OEA) and
stearoylethanolamide (STEA). There are also involved in several physiological and
pathophysiological processes, such as, inflammation, pain sleep, reproduction and drug
addiction (Piomelli, 2003, Lo Verme et al., 2005, Fu et al., 2003). Therefore, our study
was set out to explore the effect of n-3 PUFA on endocannabinoids and their
metabolizing enzymes in human skin cells exposed to UV radiation. The study has also
sought to know whether the n-3 PUFA and UVR could have an effect on the formation
of endocannabinoids and their related fatty acids. In order to address these questions,
this study was carried out on two types of human skin cells lines, HaCaT keratinocytes
and 46BR.IN fibroblasts. Furthermore, a clinical study has taken place to investigate the
effect of UV radiation on serum endocannabinoids and other NAE.
6.2. General discussion
Generally, our results show that the DHA treatment increased the intracellular levels of
endocannabinoid and NAEs such as AEA, PEA and DHEA in HaCaT keratinocytes.
Whereas, in 46BR.IN fibroblasts DHA was more effective and increased all the detected
endocannabinoid and their congeners including STEA, PEA, OEA, DHEA, AEA and 2-
AG. These results are in the same line with other studies which demonstrated that DHA
supplementation increased AEA and DHEA levels (Berger et al., 2001, Artmann et al.,
2008). On the other hand, EPA treatment decreased OEA, PEA, LEA and DHEA in
HaCaT keratinocytes and 46BR.IN fibroblasts. Whereas, the intracellular levels of AEA
and 2-AG did not change in both cells model but 2-AG level may increase in 46BR.IN
fibroblasts. These results are also supported with the observations in Artmann study
showed that EPA and DHA decreased the intracellular levels of the 2-AG, PEA, STEA
and OEA but not AEA and DHEA (Artmann et al., 2008). Furthermore, AEA and 2-AG
also have been reported to be decreased in 3T3-F442A adipocytes after DHA treatment
(Matias et al., 2008).

206
UV radiation was found to decrease the intracellular of STEA, PEA and LEA in both
HaCaT keratinocytes and 46BR.IN fibroblasts in the presence and absence of n-3 PUFA
supplementations. However, the intracellular levels of DHEA, AEA and 2-AG were
observed to fluctuate in both cells lines post UV radiation. The extracellular levels of
OEA and 2-AG were found to be increased whereas, STEA and DHEA levels did not
change in the irradiated HaCaT keratinocytes and 46BR.IN fibroblasts. All these finding
showed that UV radiation may be affect the formation of the endocannabinoids and their
related compounds. These findings may attributed to phospholipase A2 (PLA2) activity
that is induced after UVR exposure (Chen et al., 1996, Cohen and DeLeo, 1993, Hanson
and DeLeo, 1990), as PLA2 has been reported to be one of the possible biosynthetic
routes of NAEs via N-acyl-lysoPE (Sun et al., 2004). Moreover, UVR has been reported
to stimulate N-acyl-PE and NAEs including AEA (Berdyshev et al., 2000).
Data from a second study showed that UVR-induced COX-2 up-regulation. In fact, this
observation is well documented, for example, several studies suggested the up-
regulation of COX-2 protein levels mRNA and following UVB irradiation in HaCaT
keratinocytes, in human keratinocytes in volunteers subjected to UVB radiation, in
mouse epidermis and in the skin of hairless mice (Buckman et al., 1998, Tang et al.,
2001, Bachelor et al., 2005, Kim et al., 2007).
Our results also showed that DHA treatment significantly decreased COX-2 expression
in 46BR.IN fibroblasts in dose dependent manner. UVR-induced COX-2 expression was
also dose dependently inhibited by DHA treatment in 46BR.IN fibroblasts. Similarly, but
in different cells, DHA was reported to block UVR induced COX-2 expression (Sengupta
et al., 2003, Zhang and Bowden, 2008, Rahman et al., 2011). In contrast, DHA did not
inhibit UVR-induced COX-2 expression in HaCaT keratinocytes in our study. These
results are also in agreement with another study used different stimulus and different
type of cells. They found that DHA enhanced phorbol ester or interleukin 1β-induced
COX-2 expression in rat vascular endothelial cells (Machida et al., 2005).
Data from our study showed that EPA decreased COX-2 protein levels in a
concentration dependent manner in both HaCaT keratinocytes and 46BR.IN fibroblasts

207
cells. These results are in agreement with another studies where EPA induced down-
regulation in COX-2 expression (Calviello et al., 2004, Kim et al., 2006). In addition, our
results suggest that EPA did not prevent UVR-induced COX-2 expression in either cell
line.
Back to endocannabinoid, our results revealed that UVR induced down-regulation in
FAAH levels while, there were no consistent effects on NAPE-PLD in HaCaT
keratinocytes and 46BR.IN fibroblasts. However, AEA and 2-AG synthesis was found
to be increased after UVR exposure in both cell lines used in this study.
DHA and EPA treatment decreased FAAH level and increased NAPE-PLD levels in both
HaCaT keratinocytes and 46BR.IN fibroblasts. This was consistent with our results
showing that DHA increased AEA production in HaCaT keratinocytes as observed in
another part of this study.
Data from the present study also indicated that UV radiation could inhibit NAPE-PLD
expression. These data are in line with another research reported that LPS inhibits
NAPE-PLD expression (Zhu et al., 2011). In fact, these observations may be due to
many reasons, such as gene expression changes induced due to UV radiation.
In the clinical study, our findings showed that UVR has no significant effects on PEA,
LEA, STEA, PEA, LEA and DGLEA levels in either skin phototype (II or V). However, 2-
AG levels were found increased in both skin phototypes post UV radiation. In general,
NEA levels were higher in the White Caucasian of skin phototype II than the South Asian
of phototype V. PEA for example was the most abundant NAE among the detected
NAEs while, DGLEA was at the lowest level between all the found NAEs. EPEA was
found in 6 out of 10 volunteers of the White Caucasian group. 2-AG level was higher in
the South Asian group while, DHEA levels were much higher in White Caucasians group
than South Asians group. All these observations suggest that these differences between
two groups of volunteers can be attributed to diet and not UVR because there were
huge difference in the baseline levels of endocannabinoid and NAE. Overall, the main
findings of this project are:

208
1. N-3 PUFA increased NAPE-PLD levels in HaCaT keratinocytes and 46BR.IN
fibroblasts and as a result increased the production of endocannabinoids and
NAE.
2. N-3 PUFA reduced FAAH levels in HaCaT keratinocytes and 46BR.IN
fibroblasts which could be an indirect way to increase the concentration of
endocannabinoids and NAE.
3. N-3 PUFA induced AEA and 2-AG biosynthesis in HaCaT keratinocytes and
46BR.IN fibroblasts
4. DHA treatment significantly decreased COX-2 expression in 46BR.IN
fibroblasts
5. DHA inhibited UVR-induced COX-2 overexpression in 46BR.IN fibroblasts
6. DHA induced COX-2 up-regulation in HaCaT keratinocytes
7. DHA did not prevent UVR induced COX-2 up-regulation in HaCaT
keratinocytes.
8. EPA induced COX-2 down-regulation in HaCaT keratinocytes and 46BR.IN
fibroblasts.
9. EPA did not prevent UVR induced COX-2 up-regulation in both HaCaT
keratinocytes and 46BR.IN fibroblasts.
10. UVR did not have any effect on endocannabinoid and NAE biosynthesis.
However, UVR induced endocannabinoids production in some experiments and
this could suggest a defense mechanism of skin cells followed UV radiation.
11. UVR had no major effect on human serum NAE in both skin phototypes II and
V
12. UVR increased 2-AG in human serum NAE in both skin phototypes II and V
13. Human serum NAE levels were found to be higher in White Caucasian group
(skin phototypes II).
14. Human serum 2-AG level was higher in the South Asian group (skin phototypes
V).

209
6.3. Future directions
This study has shown that n-3 PUFA increased endocannabinoids and NAE in human
skin cells. Also our results showed that n-3 PUFA increased NAPE-PLD expression and
decreased FAAH in the human cell lines HaCaT keratinocytes and 46BR.IN fibroblasts.
These results indicated that n-3 PUFA may alter endocannabinoid biosynthesis
pathways in two ways; (a) directly by increasing NAPE-PLD which in turn increases the
biosynthesis of endocannabinoids and NAE. (b) Indirectly by decreasing FAAH, as a
result increasing the intracellular levels of endocannabinoids. However, it will be of
interesting to elucidate the effect of these n-3 PUFA on the 2-AG synthesizing enzyme
diacylglycerol lipase (DAGL) and the 2-AG degrading enzyme monoacylglycerols lipase
(MAGL) in HaCaT keratinocytes and 46BR.IN fibroblasts in the presence and absence
of UVR. Furthermore, it will be essential to investigate the effect of n-3 PUFA in NAPE-
PLD, FAAH, DAGL and MAGL in primary HaCaT keratinocytes and in 46BR.IN
fibroblasts in the presence and absence of UVR. Also, it is importance to assess the
effect of UVR on the biosynthesis of endocannabinoids and NAE through measuring
Ca2+ intracellular levels per and post UVR.
Data from this study also showed that DHA supplementation significantly decreased
COX-2 expression and inhibited UVR-induced COX-2 up-regulation in 46BR.IN
fibroblasts. In contrast, in HaCaT keratinocytes, DHA exerts an opposite effect by
increasing COX-2 expression and did not prevent UVR-induced COX-2 expression in
the irradiated HaCaT keratinocytes. Moreover, our results showed that EPA induced
COX-2 down-regulation in HaCaT keratinocytes and 46BR.IN fibroblasts. However,
EPA did not inhibit UVR-induced COX-2 expression in the HaCaT keratinocytes and
46BR.IN fibroblasts. Therefore, further study is still required to assess the effect of DHA
and EPA on COX-2 expression in the presence and absence of UVR in primary HaCaT
keratinocytes and in 46BR.IN fibroblasts.
Our study did not produce results that could help us to assess the effect of n-3 PUFA
on 12- and 15-LOX in HaCaT keratinocytes and 46BR.IN fibroblasts. Therefore, more
work is needed to determine the effect of n-3 PUFA on 12- and 15-LOX in these cells
and in the presence and absence of UVR. Furthermore, it will be interesting to clarify

210
the effect of exogenous AEA and 2-AG on the expression of COX-2, 12-LOX and 15-
LOX in HaCaT keratinocytes and 46BR.IN fibroblasts in the presence and absence of
UVR.
Several studies reported that n-3 PUFA and UVR have an effect on gene expression on
different cells and tissues. Further work aiming to examine NAPE-PLD, FAAH, DAGL
and MAGL gene expression in HaCaT keratinocytes and 46BR.IN fibroblasts, in the
presence and absence of n-3 PUFA and UVR is needed.
Finally, our results showed that UVR has no major effects on circulating levels of
endocannabinoids and NAE as measured in human serum samples. We believed that
the differences observed in endocannabinoids and NAE may be attributed to dietary
habits of the volunteers engaged in the clinical study. Therefore, it will be essential to
assess the effect diet on endocannabinoid and NAE in the human circulation.

211
References
ADHAMI, V. M., AFAQ, F. & AHMAD, N. 2003. Suppression of Ultraviolet
B Exposure-Mediated Activation of NF-κB in Normal Human
Keratinocytes by Resveratrol. Neoplasia, 5, 74-82.
AHN, K., JOHNSON, D. S., MILENI, M., BEIDLER, D., LONG, J. Z.,
MCKINNEY, M. K., WEERAPANA, E., SADAGOPAN, N.,
LIIMATTA, M., SMITH, S. E., LAZERWITH, S., STIFF, C.,
KAMTEKAR, S., BHATTACHARYA, K., ZHANG, Y., SWANEY, S.,
VAN BECELAERE, K., STEVENS, R. C. & CRAVATT, B. F. 2009.
Discovery and characterization of a highly selective FAAH inhibitor that
reduces inflammatory pain. Chem Biol, 16, 411-20.
AHN, K., SMITH, S. E., LIIMATTA, M. B., BEIDLER, D., SADAGOPAN, N.,
DUDLEY, D. T., YOUNG, T., WREN, P., ZHANG, Y., SWANEY, S.,
VAN BECELAERE, K., BLANKMAN, J. L., NOMURA, D. K.,
BHATTACHAR, S. N., STIFF, C., NOMANBHOY, T. K.,
WEERAPANA, E., JOHNSON, D. S. & CRAVATT, B. F. 2011.
Mechanistic and Pharmacological Characterization of PF-04457845: A
Highly Potent and Selective Fatty Acid Amide Hydrolase Inhibitor That
Reduces Inflammatory and Noninflammatory Pain. Journal of
Pharmacology and Experimental Therapeutics, 338, 114-124.
ALLAN, R. S., WAITHMAN, J., BEDOUI, S., JONES, C. M.,
VILLADANGOS, J. A., ZHAN, Y., LEW, A. M., SHORTMAN, K.,
HEATH, W. R. & CARBONE, F. R. 2006. Migratory dendritic cells
transfer antigen to a lymph node-resident dendritic cell population for
efficient CTL priming. Immunity, 25, 153-62.
ARREAZA, G., DEVANE, W. A., OMEIR, R. L., SAJNANI, G., KUNZ, J.,
CRAVATT, B. F. & DEUTSCH, D. G. 1997. The cloned rat hydrolytic
enzyme responsible for the breakdown of anandamide also catalyzes its
formation via the condensation of arachidonic acid and ethanolamine.
Neurosci Lett, 234, 59-62.
ARTMANN, A., PETERSEN, G., HELLGREN, L. I., BOBERG, J.,
SKONBERG, C., NELLEMANN, C., HANSEN, S. H. & HANSEN, H.
S. 2008. Influence of dietary fatty acids on endocannabinoid and N-
acylethanolamine levels in rat brain, liver and small intestine. Biochim
Biophys Acta, 1781, 200-12.
AUMAILLEY, M. & ROUSSELLE, P. 1999. Laminins of the dermo-epidermal
junction. Matrix Biol, 18, 19-28.
AZZARONE, B. & MACIEIRA-COELHO, A. 1982. Heterogeneity of the
kinetics of proliferation within human skin fibroblastic cell populations.
J Cell Sci, 57, 177-87.
BACHELOR, M. A., COOPER, S. J., SIKORSKI, E. T. & BOWDEN, G. T.
2005. Inhibition of p38 mitogen-activated protein kinase and
phosphatidylinositol 3-kinase decreases UVB-induced activator protein-
1 and cyclooxygenase-2 in a SKH-1 hairless mouse model. Mol Cancer
Res, 3, 90-9.
212
BAER, A. N., COSTELLO, P. B. & GREEN, F. A. 1991. In vivo activation of
an omega-6 oxygenase in human skin. Biochem Biophys Res Commun,
180, 98-104.
BAGGA, D., WANG, L., FARIAS-EISNER, R., GLASPY, J. A. & REDDY, S.
T. 2003. Differential effects of prostaglandin derived from ω-6 and ω-3
polyunsaturated fatty acids on COX-2 expression and IL-6 secretion.
Proceedings of the National Academy of Sciences, 100, 1751-1756.
BALVERS, M. G., VERHOECKX, K. C., PLASTINA, P., WORTELBOER, H.
M., MEIJERINK, J. & WITKAMP, R. F. 2010. Docosahexaenoic acid
and eicosapentaenoic acid are converted by 3T3-L1 adipocytes to N-acyl
ethanolamines with anti-inflammatory properties. Biochim Biophys Acta,
1801, 1107-14.
BARI, M., BATTISTA, N., PIRAZZI, V. & MACCARRONE, M. 2011. The
manifold actions of endocannabinoids on female and male reproductive
events. Front Biosci (Landmark Ed), 16, 498-516.
BATETTA, B., GRIINARI, M., CARTA, G., MURRU, E., LIGRESTI, A.,
CORDEDDU, L., GIORDANO, E., SANNA, F., BISOGNO, T., UDA,
S., COLLU, M., BRUHEIM, I., DI MARZO, V. & BANNI, S. 2009.
Endocannabinoids may mediate the ability of (n-3) fatty acids to reduce
ectopic fat and inflammatory mediators in obese Zucker rats. J Nutr, 139,
1495-501.
BECH-THOMSEN, N. & WULF, H. C. 1992. Sunbathers' application of
sunscreen is probably inadequate to obtain the sun protection factor
assigned to the preparation. Photodermatol Photoimmunol Photomed, 9,
242-4.
BERDYSHEV, E. V., SCHMID, P. C., DONG, Z. & SCHMID, H. H. 2000.
Stress-induced generation of N-acylethanolamines in mouse epidermal
JB6 P+ cells. Biochem J, 346 Pt 2, 369-74.
BERGER, A., CROZIER, G., BISOGNO, T., CAVALIERE, P., INNIS, S. & DI
MARZO, V. 2001. Anandamide and diet: inclusion of dietary
arachidonate and docosahexaenoate leads to increased brain levels of the
corresponding N-acylethanolamines in piglets. Proc Natl Acad Sci U S
A, 98, 6402-6.
BHANGLE, S. & KOLASINSKI, S. L. 2011. Fish oil in rheumatic diseases.
Rheum Dis Clin North Am, 37, 77-84.
BIKLE, D. D. 2004. Vitamin D regulated keratinocyte differentiation. J Cell
Biochem, 92, 436-44.
BISOGNO, T. 2008. Endogenous cannabinoids: structure and metabolism. J
Neuroendocrinol, 20 Suppl 1, 1-9.
BISOGNO, T., DELTON-VANDENBROUCKE, I., MILONE, A., LAGARDE,
M. & DI MARZO, V. 1999. Biosynthesis and Inactivation of N-
Arachidonoylethanolamine (Anandamide) and N-
Docosahexaenoylethanolamine in Bovine Retina. Archives of
Biochemistry and Biophysics, 370, 300-307.
BISOGNO, T., HOWELL, F., WILLIAMS, G., MINASSI, A., CASCIO, M. G.,
LIGRESTI, A., MATIAS, I., SCHIANO-MORIELLO, A., PAUL, P.,
WILLIAMS, E. J., GANGADHARAN, U., HOBBS, C., DI MARZO, V.
& DOHERTY, P. 2003. Cloning of the first sn1-DAG lipases points to
the spatial and temporal regulation of endocannabinoid signaling in the
brain. J Cell Biol, 163, 463-8.
213
BISOGNO, T. & MACCARRONE, M. 2014. Endocannabinoid signaling and
its regulation by nutrients. Biofactors, 40, 373-80.
BISOGNO, T., MELCK, D., BOBROV, M., GRETSKAYA, N. M.,
BEZUGLOV, V. V., DE PETROCELLIS, L. & DI MARZO, V. 2000.
N-acyl-dopamines: novel synthetic CB(1) cannabinoid-receptor ligands
and inhibitors of anandamide inactivation with cannabimimetic activity
in vitro and in vivo. Biochem J, 351 Pt 3, 817-24.
BLACK, H. S., THORNBY, J. I., GERGUIS, J. & LENGER, W. 1992. Influence
of dietary omega-6, -3 fatty acid sources on the initiation and promotion
stages of photocarcinogenesis. Photochem Photobiol, 56, 195-9.
BLANKMAN, J. L., SIMON, G. M. & CRAVATT, B. F. 2007. A
comprehensive profile of brain enzymes that hydrolyze the
endocannabinoid 2-arachidonoylglycerol. Chem Biol, 14, 1347-56.
BLAZQUEZ, C., CARRACEDO, A., BARRADO, L., REAL, P. J.,
FERNANDEZ-LUNA, J. L., VELASCO, G., MALUMBRES, M. &
GUZMAN, M. 2006. Cannabinoid receptors as novel targets for the
treatment of melanoma. FASEB J, 20, 2633-5.
BOMMAREDDY, A., ARASADA, B. L., MATHEES, D. P. & DWIVEDI, C.
2006. Chemopreventive effects of dietary flaxseed on colon tumor
development. Nutr Cancer, 54, 216-22.
BOUKAMP, P., RUPNIAK, H. T. & FUSENIG, N. E. 1985. Environmental
modulation of the expression of differentiation and malignancy in six
human squamous cell carcinoma cell lines. Cancer Res, 45, 5582-92.
BRASH, A. R., BOEGLIN, W. E. & CHANG, M. S. 1997. Discovery of a
second 15S-lipoxygenase in humans. Proc Natl Acad Sci U S A, 94,
6148-52.
BRENNER, M. & HEARING, V. J. 2008. The protective role of melanin against
UV damage in human skin. Photochem Photobiol, 84, 539-49.
BUCKMAN, S. Y., GRESHAM, A., HALE, P., HRUZA, G., ANAST, J.,
MASFERRER, J. & PENTLAND, A. P. 1998. COX-2 expression is
induced by UVB exposure in human skin: implications for the
development of skin cancer. Carcinogenesis, 19, 723-9.
BUDDEN, T. & BOWDEN, N. 2013. The Role of Altered Nucleotide Excision
Repair and UVB-Induced DNA Damage in Melanomagenesis.
International Journal of Molecular Sciences, 14, 1132-1151.
BURGESON, R. E. & CHRISTIANO, A. M. 1997. The dermal-epidermal
junction. Curr Opin Cell Biol, 9, 651-8.
BURR, G. & BURR, M. 1929. A new difficincy desease produced by the rigid
exclusion of fat diet. Biological Chemistry, LXXXII.
BURREN, R., SCALETTA, C., FRENK, E., PANIZZON, R. G. &
APPLEGATE, L. A. 1998. Sunlight and carcinogenesis: expression of
p53 and pyrimidine dimers in human skin following UVA I, UVA I + II
and solar simulating radiations. Int J Cancer, 76, 201-6.
BYKOV, V. J., SHEEHAN, J. M., HEMMINKI, K. & YOUNG, A. R. 1999. In
situ repair of cyclobutane pyrimidine dimers and 6-4 photoproducts in
human skin exposed to solar simulating radiation. J Invest Dermatol,
112, 326-31.
BYRNE, S. N., LIMON-FLORES, A. Y. & ULLRICH, S. E. 2008. Mast cell
migration from the skin to the draining lymph nodes upon ultraviolet

214
irradiation represents a key step in the induction of immune suppression.
J Immunol, 180, 4648-55.
CADAS, H., DI TOMASO, E. & PIOMELLI, D. 1997. Occurrence and
biosynthesis of endogenous cannabinoid precursor, N-arachidonoyl
phosphatidylethanolamine, in rat brain. J Neurosci, 17, 1226-42.
CALDER, P. C. 1997. n-3 polyunsaturated fatty acids and cytokine production
in health and disease. Ann Nutr Metab, 41, 203-34.
CALDER, P. C. 2002. Dietary modification of inflammation with lipids. Proc
Nutr Soc, 61, 345-58.
CALDER, P. C. 2006. n−3 Polyunsaturated fatty acids, inflammation, and
inflammatory diseases. The American Journal of Clinical Nutrition, 83,
S1505-1519S.
CALDER, P. C. 2008. Polyunsaturated fatty acids, inflammatory processes and
inflammatory bowel diseases. Mol Nutr Food Res, 52, 885-97.
CALIGNANO, A., RANA, G. L., GIUFFRIDA, A. & PIOMELLI, D. 1998.
Control of pain initiation by endogenous cannabinoids. Nature, 394, 277-
281.
CALVIELLO, G., DI NICUOLO, F., GRAGNOLI, S., PICCIONI, E., SERINI,
S., MAGGIANO, N., TRINGALI, G., NAVARRA, P., RANELLETTI,
F. O. & PALOZZA, P. 2004. n-3 PUFAs reduce VEGF expression in
human colon cancer cells modulating the COX-2/PGE2 induced ERK-1
and -2 and HIF-1alpha induction pathway. Carcinogenesis, 25, 2303-10.
CAMANDOLA, S., LEONARDUZZI, G., MUSSO, T., VARESIO, L.,
CARINI, R., SCAVAZZA, A., CHIARPOTTO, E., BAEUERLE, P. A.
& POLI, G. 1996. Nuclear factor kB is activated by arachidonic acid but
not by eicosapentaenoic acid. Biochem Biophys Res Commun, 229, 643-
7.
CANDI, E., SCHMIDT, R. & MELINO, G. 2005. The cornified envelope: a
model of cell death in the skin. Nat Rev Mol Cell Biol, 6, 328-40.
CASANOVA, M. L., BLAZQUEZ, C., MARTINEZ-PALACIO, J.,
VILLANUEVA, C., FERNANDEZ-ACENERO, M. J., HUFFMAN, J.
W., JORCANO, J. L. & GUZMAN, M. 2003. Inhibition of skin tumor
growth and angiogenesis in vivo by activation of cannabinoid receptors.
J Clin Invest, 111, 43-50.
CÉSARINI, J. P. UV and the skin: the biological effects of UVA and UVB.
1996.
CHANG, E. J., KUNDU, J. K., LIU, L., SHIN, J. W. & SURH, Y. J. 2011.
Ultraviolet B radiation activates NF-kappaB and induces iNOS
expression in HR-1 hairless mouse skin: role of IkappaB kinase-beta.
Mol Carcinog, 50, 310-7.
CHAPKIN, R. S., ZIBOH, V. A., MARCELO, C. L. & VOORHEES, J. J. 1986.
Metabolism of essential fatty acids by human epidermal enzyme
preparations: evidence of chain elongation. J Lipid Res, 27, 945-54.
CHAU, L. Y. & TAI, H. H. 1981. Release of arachidonate from diglyceride in
human platelets requires the sequential action of a diglyceride lipase and
a monoglyceride lipase. Biochem Biophys Res Commun, 100, 1688-95.
CHAWLA, A., REPA, J. J., EVANS, R. M. & MANGELSDORF, D. J. 2001.
Nuclear Receptors and Lipid Physiology: Opening the X-Files. Science,
294, 1866-1870.

215
CHEN, W., TANG, Q., GONZALES, M. S. & BOWDEN, G. T. 2001. Role of
p38 MAP kinases and ERK in mediating ultraviolet-B induced
cyclooxygenase-2 gene expression in human keratinocytes. Oncogene,
20, 3921-6.
CHENE, G., DUBOURDEAU, M., BALARD, P., ESCOUBET-LOZACH, L.,
ORFILA, C., BERRY, A., BERNAD, J., ARIES, M. F., CHARVERON,
M. & PIPY, B. 2007. n-3 and n-6 polyunsaturated fatty acids induce the
expression of COX-2 via PPARgamma activation in human keratinocyte
HaCaT cells. Biochim Biophys Acta, 1771, 576-89.
CHENG, C. K., CHOW, B. K. & LEUNG, P. C. 2003. An activator protein 1-
like motif mediates 17beta-estradiol repression of gonadotropin-
releasing hormone receptor promoter via an estrogen receptor alpha-
dependent mechanism in ovarian and breast cancer cells. Mol
Endocrinol, 17, 2613-29.
CHUN, K. S. & SURH, Y. J. 2004. Signal transduction pathways regulating
cyclooxygenase-2 expression: potential molecular targets for
chemoprevention. Biochem Pharmacol, 68, 1089-100.
CLEMENT, A. B., HAWKINS, E. G., LICHTMAN, A. H. & CRAVATT, B. F.
2003. Increased seizure susceptibility and proconvulsant activity of
anandamide in mice lacking fatty acid amide hydrolase. J Neurosci, 23,
3916-23.
COCKBAIN, A. J., TOOGOOD, G. J. & HULL, M. A. 2012. Omega-3
polyunsaturated fatty acids for the treatment and prevention of colorectal
cancer. Gut, 61, 135-149.
CONNOR, W. E., NEURINGER, M. & LIN, D. S. 1990. Dietary effects on brain
fatty acid composition: the reversibility of n-3 fatty acid deficiency and
turnover of docosahexaenoic acid in the brain, erythrocytes, and plasma
of rhesus monkeys. J Lipid Res, 31, 237-47.
CRAVATT, B. F., DEMAREST, K., PATRICELLI, M. P., BRACEY, M. H.,
GIANG, D. K., MARTIN, B. R. & LICHTMAN, A. H. 2001.
Supersensitivity to anandamide and enhanced endogenous cannabinoid
signaling in mice lacking fatty acid amide hydrolase. Proc Natl Acad Sci
U S A, 98, 9371-6.
CRAVATT, B. F., GIANG, D. K., MAYFIELD, S. P., BOGER, D. L.,
LERNER, R. A. & GILULA, N. B. 1996. Molecular characterization of
an enzyme that degrades neuromodulatory fatty-acid amides. Nature,
384, 83-7.
CROSS, S. E. & ROBERTS, M. S. 1993. Subcutaneous absorption kinetics and
local tissue distribution of interferon and other solutes. J Pharm
Pharmacol, 45, 606-9.
CUMBERBATCH, M., DEARMAN, R. J., GRIFFITHS, C. E. & KIMBER, I.
2003. Epidermal Langerhans cell migration and sensitisation to chemical
allergens. APMIS, 111, 797-804.
DANDIE, G. W., CLYDESDALE, G. J., RADCLIFF, F. J. & MULLER, H. K.
2001. Migration of Langerhans cells and gammadelta dendritic cells
from UV-B-irradiated sheep skin. Immunol Cell Biol, 79, 41-8.
DAS, U. N. 2006. Biological significance of essential fatty acids. J Assoc
Physicians India, 54, 309-19.
DAWICKI, W. & MARSHALL, J. S. 2007. New and emerging roles for mast
cells in host defence. Curr Opin Immunol, 19, 31-8.

216
DE CATERINA, R. 2011. n-3 fatty acids in cardiovascular disease. N Engl J
Med, 364, 2439-50.
DE LUCA, M., D'ANNA, F., BONDANZA, S., FRANZI, A. T. &
CANCEDDA, R. 1988. Human epithelial cells induce human
melanocyte growth in vitro but only skin keratinocytes regulate its proper
differentiation in the absence of dermis. J Cell Biol, 107, 1919-26.
DE VRIES, C. E. & VAN NOORDEN, C. J. 1992. Effects of dietary fatty acid
composition on tumor growth and metastasis. Anticancer Res, 12, 1513-
22.
DENDA, M., TOMITAKA, A., AKAMATSU, H. & MATSUNAGA, K. 2003.
Altered distribution of calcium in facial epidermis of aged adults. J Invest
Dermatol, 121, 1557-8.
DENNING, M. F. 2004. Epidermal keratinocytes: regulation of multiple cell
phenotypes by multiple protein kinase C isoforms. Int J Biochem Cell
Biol, 36, 1141-6.
DEUTSCH, D. G., UEDA, N. & YAMAMOTO, S. 2002. The fatty acid amide
hydrolase (FAAH). Prostaglandins, Leukotrienes and Essential Fatty
Acids, 66, 201-210.
DEVANE, W., HANUS, L., BREUER, A., PERTWEE, R., STEVENSON, L.,
GRIFFIN, G., GIBSON, D., MANDELBAUM, A., ETINGER, A. &
MECHOULAM, R. 1992. Isolation and structure of a brain constituent
that binds to the cannabinoid receptor. Science, 258, 1946-1949.
DEVANE, W. A., DYSARZ, F. A., 3RD, JOHNSON, M. R., MELVIN, L. S. &
HOWLETT, A. C. 1988. Determination and characterization of a
cannabinoid receptor in rat brain. Mol Pharmacol, 34, 605-13.
DI MARZO, V. 1998. ‘Endocannabinoids’ and other fatty acid derivatives with
cannabimimetic properties: biochemistry and possible
physiopathological relevance. Biochimica et Biophysica Acta (BBA) -
Lipids and Lipid Metabolism, 1392, 153-175.
DI MARZO, V., FONTANA, A., CADAS, H., SCHINELLI, S., CIMINO, G.,
SCHWARTZ, J.-C. & PIOMELLI, D. 1994. Formation and inactivation
of endogenous cannabinoid anandamide in central neurons. Nature, 372,
686-691.
DIEP, Q. N., TOUYZ, R. M. & SCHIFFRIN, E. L. 2000. Docosahexaenoic acid,
a peroxisome proliferator-activated receptor-alpha ligand, induces
apoptosis in vascular smooth muscle cells by stimulation of p38 mitogen-
activated protein kinase. Hypertension, 36, 851-5.
DIFFEY, B. L. 1991. Solar ultraviolet radiation effects on biological systems.
Phys Med Biol, 36, 299-328.
DIFFEY, B. L., JANSÉN, C. T., URBACH, F. & WULF, H. C. 1997. The
standard erythema dose: a new photobiological concept.
Photodermatology, Photoimmunology & Photomedicine, 13, 64-66.
DIFFEY, R. A. 1996. Quantitative assessment of sunscreen application
technique by in vivo fluorescence spectroscopy, New York, NY, ETATS-
UNIS, Society of Cosmetic Chemists.
DINH, T. P., CARPENTER, D., LESLIE, F. M., FREUND, T. F., KATONA, I.,
SENSI, S. L., KATHURIA, S. & PIOMELLI, D. 2002. Brain
monoglyceride lipase participating in endocannabinoid inactivation.
Proc Natl Acad Sci U S A, 99, 10819-24.

217
DOBROSI, N., TOTH, B. I., NAGY, G., DOZSA, A., GECZY, T., NAGY, L.,
ZOUBOULIS, C. C., PAUS, R., KOVACS, L. & BIRO, T. 2008.
Endocannabinoids enhance lipid synthesis and apoptosis of human
sebocytes via cannabinoid receptor-2-mediated signaling. Faseb j, 22,
3685-95.
EADY, R. A., COWEN, T., MARSHALL, T. F., PLUMMER, V. & GREAVES,
M. W. 1979. Mast cell population density, blood vessel density and
histamine content in normal human skin. Br J Dermatol, 100, 623-33.
ECKERT, R. L. 1989. Structure, function, and differentiation of the
keratinocyte. Physiol Rev, 69, 1316-46.
EMKEN, E. A., ADLOF, R. O., ROHWEDDER, W. K. & GULLEY, R. M.
1993. Influence of linoleic acid on desaturation and uptake of deuterium-
labeled palmitic and stearic acids in humans. Biochim Biophys Acta,
1170, 173-81.
ENNINGA, I. C., GROENENDIJK, R. T., FILON, A. R., VAN ZEELAND, A.
A. & SIMONS, J. W. 1986. The wavelength dependence of u.v.-induced
pyrimidine dimer formation, cell killing and mutation induction in
human diploid skin fibroblasts. Carcinogenesis, 7, 1829-36.
FENG, L., XIA, Y., GARCIA, G. E., HWANG, D. & WILSON, C. B. 1995.
Involvement of reactive oxygen intermediates in cyclooxygenase-2
expression induced by interleukin-1, tumor necrosis factor-alpha, and
lipopolysaccharide. J Clin Invest, 95, 1669-75.
FERGUSON 1997. European guidelines (COLIPA) for the evaluation of sun
protection factors. In Sunscreens. Development, Regulation and
Regulatory Aspects, New York, Marcel Dekker.
FISCHER, S., VON SCHACKY, C. & SCHWEER, H. 1988. Prostaglandins E3
and F3 alpha are excreted in human urine after ingestion of n - 3
polyunsaturated fatty acids. Biochim Biophys Acta, 963, 501-8.
FLEISCHMAJER, R., MACDONALD, E. D., 2ND, CONTARD, P. &
PERLISH, J. S. 1993. Immunochemistry of a keratinocyte-fibroblast co-
culture model for reconstruction of human skin. J Histochem Cytochem,
41, 1359-66.
FLEISCHMAJER, R., SCHECHTER, A., BRUNS, M., PERLISH, J. S.,
MACDONALD, E. D., PAN, T. C., TIMPL, R. & CHU, M. L. 1995.
Skin fibroblasts are the only source of nidogen during early basal lamina
formation in vitro. J Invest Dermatol, 105, 597-601.
FOWLER, C. J. 2007. The contribution of cyclooxygenase-2 to
endocannabinoid metabolism and action. Br J Pharmacol, 152, 594-601.
FRASOR, J., WEAVER, A., PRADHAN, M., DAI, Y., MILLER, L. D., LIN,
C. Y. & STANCULESCU, A. 2009. Positive cross-talk between estrogen
receptor and NF-kappaB in breast cancer. Cancer Res, 69, 8918-25.
FREINKEL, D. W. A. R. K. 2001. The biology of the skin, New York, Parthenon
Pub. Group.
FU, J., GAETANI, S., OVEISI, F., LO VERME, J., SERRANO, A.,
RODRIGUEZ DE FONSECA, F., ROSENGARTH, A., LUECKE, H.,
DI GIACOMO, B., TARZIA, G. & PIOMELLI, D. 2003.
Oleylethanolamide regulates feeding and body weight through activation
of the nuclear receptor PPAR-alpha. Nature, 425, 90-3.
FUKAMI, K., INANOBE, S., KANEMARU, K. & NAKAMURA, Y. 2010.
Phospholipase C is a key enzyme regulating intracellular calcium and

218
modulating the phosphoinositide balance. Progress in Lipid Research,
49, 429-437.
FUNK, C. D. 2001. Prostaglandins and leukotrienes: advances in eicosanoid
biology. Science, 294, 1871-5.
GAO, Y., VASILYEV, D. V., GONCALVES, M. B., HOWELL, F. V., HOBBS,
C., REISENBERG, M., SHEN, R., ZHANG, M. Y., STRASSLE, B. W.,
LU, P., MARK, L., PIESLA, M. J., DENG, K., KOURANOVA, E. V.,
RING, R. H., WHITESIDE, G. T., BATES, B., WALSH, F. S.,
WILLIAMS, G., PANGALOS, M. N., SAMAD, T. A. & DOHERTY, P.
2010. Loss of retrograde endocannabinoid signaling and reduced adult
neurogenesis in diacylglycerol lipase knock-out mice. J Neurosci, 30,
2017-24.
GAONI, Y. & MECHOULAM, R. 1964. Isolation, Structure, and Partial
Synthesis of an Active Constituent of Hashish. Journal of the American
Chemical Society, 86, 1646-1647.
GASSMANN, M., GRENACHER, B., ROHDE, B. & VOGEL, J. 2009.
Quantifying Western blots: Pitfalls of densitometry.
ELECTROPHORESIS, 30, 1845-1855.
GHOSH, S. & KARIN, M. 2002. Missing pieces in the NF-kappaB puzzle. Cell,
109 Suppl, S81-96.
GILCHREST, B. A., SOTER, N. A., HAWK, J. L., BARR, R. M., BLACK, A.
K., HENSBY, C. N., MALLET, A. I., GREAVES, M. W. & PARRISH,
J. A. 1983. Histologic changes associated with ultraviolet A--induced
erythema in normal human skin. J Am Acad Dermatol, 9, 213-9.
GILROY, D. W., SAUNDERS, M. A., SANSORES-GARCIA, L.,
MATIJEVIC-ALEKSIC, N. & WU, K. K. 2001. Cell cycle-dependent
expression of cyclooxygenase-2 in human fibroblasts. FASEB J, 15, 288-
90.
GLASER, S. T., KACZOCHA, M. & DEUTSCH, D. G. 2005. Anandamide
transport: a critical review. Life Sci, 77, 1584-604.
GLEDHILL, K., RHODES, L. E., BROWNRIGG, M., HAYLETT, A. K.,
MASOODI, M., THODY, A. J., NICOLAOU, A. & TOBIN, D. J. 2010.
Prostaglandin-E2 is produced by adult human epidermal melanocytes in
response to UVB in a melanogenesis-independent manner. Pigment Cell
Melanoma Res, 23, 394-403.
GODAR, D. E., URBACH, F., GASPARRO, F. P. & VAN DER LEUN, J. C.
2003. UV doses of young adults. Photochem Photobiol, 77, 453-7.
GOLDMAN, D. W., PICKETT, W. C. & GOETZL, E. J. 1983. Human
neutrophil chemotactic and degranulating activities of leukotriene B5
(LTB5) derived from eicosapentaenoic acid. Biochem Biophys Res
Commun, 117, 282-8.
GOPARAJU, S. K., UEDA, N., TANIGUCHI, K. & YAMAMOTO, S. 1999.
Enzymes of porcine brain hydrolyzing 2-arachidonoylglycerol, an
endogenous ligand of cannabinoid receptors. Biochem Pharmacol, 57,
417-23.
GOPARAJU, S. K., UEDA, N., YAMAGUCHI, H. & YAMAMOTO, S. 1998.
Anandamide amidohydrolase reacting with 2-arachidonoylglycerol,
another cannabinoid receptor ligand. FEBS Lett, 422, 69-73.
GRAMMATIKOS, S. I., SUBBAIAH, P. V., VICTOR, T. A. & MILLER, W.
M. 1994. n-3 and n-6 fatty acid processing and growth effects in

219
neoplastic and non-cancerous human mammary epithelial cell lines. Br J
Cancer, 70, 219-27.
GREEN, H., FUCHS, E. & WATT, F. 1982. Differentiated structural
components of the keratinocyte. Cold Spring Harb Symp Quant Biol, 46
Pt 1, 293-301.
GRESHAM, A., MASFERRER, J., CHEN, X., LEAL-KHOURI, S. &
PENTLAND, A. P. 1996. Increased synthesis of high-molecular-weight
cPLA2 mediates early UV-induced PGE2 in human skin. Am J Physiol,
270, C1037-50.
GRIFFITHS, C. E., DEARMAN, R. J., CUMBERBATCH, M. & KIMBER, I.
2005. Cytokines and Langerhans cell mobilisation in mouse and man.
Cytokine, 32, 67-70.
GUO, Y., WANG, H., OKAMOTO, Y., UEDA, N., KINGSLEY, P. J.,
MARNETT, L. J., SCHMID, H. H. O., DAS, S. K. & DEY, S. K. 2005.
N-Acylphosphatidylethanolamine-hydrolyzing Phospholipase D Is an
Important Determinant of Uterine Anandamide Levels during
Implantation. Journal of Biological Chemistry, 280, 23429-23432.
HALATA, Z., GRIM, M. & BAUMAN, K. I. 2003. Friedrich Sigmund Merkel
and his "Merkel cell", morphology, development, and physiology:
review and new results. Anat Rec A Discov Mol Cell Evol Biol, 271, 225-
39.
HALLIDAY, G. M. 2005. Inflammation, gene mutation and
photoimmunosuppression in response to UVR-induced oxidative
damage contributes to photocarcinogenesis. Mutat Res, 571, 107-20.
HAMPSON, A. J., HILL, W. A., ZAN-PHILLIPS, M., MAKRIYANNIS, A.,
LEUNG, E., EGLEN, R. M. & BORNHEIM, L. M. 1995. Anandamide
hydroxylation by brain lipoxygenase:metabolite structures and potencies
at the cannabinoid receptor. Biochim Biophys Acta, 1259, 173-9.
HANSEN, H. S. & JENSEN, B. 1985. Essential function of linoleic acid
esterified in acylglucosylceramide and acylceramide in maintaining the
epidermal water permeability barrier. Evidence from feeding studies
with oleate, linoleate, arachidonate, columbinate and alpha-linolenate.
Biochim Biophys Acta, 834, 357-63.
HANSEN, H. S., MOESGAARD, B., HANSEN, H. H. & PETERSEN, G. 2000.
N-Acylethanolamines and precursor phospholipids - relation to cell
injury. Chem Phys Lipids, 108, 135-50.
HANUS, L., ABU-LAFI, S., FRIDE, E., BREUER, A., VOGEL, Z., SHALEV,
D. E., KUSTANOVICH, I. & MECHOULAM, R. 2001. 2-arachidonyl
glyceryl ether, an endogenous agonist of the cannabinoid CB1 receptor.
Proc Natl Acad Sci U S A, 98, 3662-5.
HAWK, J. L., MURPHY, G. M. & HOLDEN, C. A. 1988. The presence of
neutrophils in human cutaneous ultraviolet-B inflammation. Br J
Dermatol, 118, 27-30.
HAYDEN, M. S. & GHOSH, S. 2012. NF-kappaB, the first quarter-century:
remarkable progress and outstanding questions. Genes Dev, 26, 203-34.
HEALY, D. A., WALLACE, F. A., MILES, E. A., CALDER, P. C. &
NEWSHOLM, P. 2000. Effect of low-to-moderate amounts of dietary
fish oil on neutrophil lipid composition and function. Lipids, 35, 763-8.
HEMMI, H., YOSHINO, M., YAMAZAKI, H., NAITO, M., IYODA, T.,
OMATSU, Y., SHIMOYAMA, S., LETTERIO, J. J., NAKABAYASHI,

220
T., TAGAYA, H., YAMANE, T., OGAWA, M., NISHIKAWA, S.,
RYOKE, K., INABA, K., HAYASHI, S. & KUNISADA, T. 2001. Skin
antigens in the steady state are trafficked to regional lymph nodes by
transforming growth factor-beta1-dependent cells. Int Immunol, 13, 695-
704.
HERMANN, A., KACZOCHA, M. & DEUTSCH, D. G. 2006. 2-
Arachidonoylglycerol (2-AG) membrane transport: history and outlook.
AAPS J, 8, E409-12.
HERRLICH, P., KARIN, M. & WEISS, C. 2008. Supreme EnLIGHTenment:
damage recognition and signaling in the mammalian UV response. Mol
Cell, 29, 279-90.
HEYDEN, A., HUITFELDT, H. S., KOPPANG, H. S., THRANE, P. S.,
BRYNE, M. & BRANDTZAEG, P. 1992. Cytokeratins as epithelial
differentiation markers in premalignant and malignant oral lesions. J
Oral Pathol Med, 21, 7-11.
HIRAFUJI, M., MACHIDA, T., TSUNODA, M., MIYAMOTO, A. &
MINAMI, M. 2002. Docosahexaenoic acid potentiates interleukin-1beta
induction of nitric oxide synthase through mechanism involving p44/42
MAPK activation in rat vascular smooth muscle cells. Br J Pharmacol,
136, 613-9.
HITCHINS, V. M., WITHROW, T. J., OLVEY, K. M., HARLESTON, B. A.,
ELLINGSON, O. L. & BOSTROM, R. G. 1986. The cytotoxic and
mutagenic effects of UVA radiation on L5178Y mouse lymphoma cells.
Photochem Photobiol, 44, 53-7.
HONG, S., GRONERT, K., DEVCHAND, P. R., MOUSSIGNAC, R.-L. &
SERHAN, C. N. 2003. Novel Docosatrienes and 17S-Resolvins
Generated from Docosahexaenoic Acid in Murine Brain, Human Blood,
and Glial Cells: AUTACOIDS IN ANTI-INFLAMMATION. Journal of
Biological Chemistry, 278, 14677-14687.
HONG, S. B., LI, C. M., RHEE, H. J., PARK, J. H., HE, X., LEVY, B., YOO,
O. J. & SCHUCHMAN, E. H. 1999. Molecular cloning and
characterization of a human cDNA and gene encoding a novel acid
ceramidase-like protein. Genomics, 62, 232-41.
HOWLETT, A. C., BARTH, F., BONNER, T. I., CABRAL, G., CASELLAS,
P., DEVANE, W. A., FELDER, C. C., HERKENHAM, M., MACKIE,
K., MARTIN, B. R., MECHOULAM, R. & PERTWEE, R. G. 2002.
International Union of Pharmacology. XXVII. Classification of
cannabinoid receptors. Pharmacol Rev, 54, 161-202.
HUDERT, C. A., WEYLANDT, K. H., LU, Y., WANG, J., HONG, S.,
DIGNASS, A., SERHAN, C. N. & KANG, J. X. 2006. Transgenic mice
rich in endogenous omega-3 fatty acids are protected from colitis.
Proceedings of the National Academy of Sciences, 103, 11276-11281.
HUNTER, J. S. A. M. D. 2003. Clinical Dermatology, Black science.
IBRAHIM, M. M., PORRECA, F., LAI, J., ALBRECHT, P. J., RICE, F. L.,
KHODOROVA, A., DAVAR, G., MAKRIYANNIS, A., VANDERAH,
T. W., MATA, H. P. & MALAN, T. P., JR. 2005. CB2 cannabinoid
receptor activation produces antinociception by stimulating peripheral
release of endogenous opioids. Proc Natl Acad Sci U S A, 102, 3093-8.
IGGO, A. & MUIR, A. R. 1969. The structure and function of a slowly adapting
touch corpuscle in hairy skin. J Physiol, 200, 763-96.

221
ISHIDA-YAMAMOTO, A. & IIZUKA, H. 1998. Structural organization of
cornified cell envelopes and alterations in inherited skin disorders. Exp
Dermatol, 7, 1-10.
IVERSEN, L., FOGH, K., ZIBOH, V. A., KRISTENSEN, P., SCHMEDES, A.
& KRAGBALLE, K. 1993. Leukotriene B4 formation during human
neutrophil keratinocyte interactions: evidence for transformation of
leukotriene A4 by putative keratinocyte leukotriene A4 hydrolase. J
Invest Dermatol, 100, 293-8.
JIN, X. H., OKAMOTO, Y., MORISHITA, J., TSUBOI, K., TONAI, T. &
UEDA, N. 2007. Discovery and characterization of a Ca2+-independent
phosphatidylethanolamine N-acyltransferase generating the anandamide
precursor and its congeners. J Biol Chem, 282, 3614-23.
JUMP, D. B. & CLARKE, S. D. 1999. Regulation of gene expression by dietary
fat. Annu Rev Nutr, 19, 63-90.
KANO, M., OHNO-SHOSAKU, T., HASHIMOTODANI, Y.,
UCHIGASHIMA, M. & WATANABE, M. 2009. Endocannabinoid-
mediated control of synaptic transmission. Physiol Rev, 89, 309-80.
KARSAK, M., GAFFAL, E., DATE, R., WANG-ECKHARDT, L., REHNELT,
J., PETROSINO, S., STAROWICZ, K., STEUDER, R., SCHLICKER,
E., CRAVATT, B., MECHOULAM, R., BUETTNER, R., WERNER,
S., DI MARZO, V., TUTING, T. & ZIMMER, A. 2007. Attenuation of
allergic contact dermatitis through the endocannabinoid system. Science,
316, 1494-7.
KATAYAMA, K., UEDA, N., KATOH, I. & YAMAMOTO, S. 1999.
Equilibrium in the hydrolysis and synthesis of cannabimimetic
anandamide demonstrated by a purified enzyme. Biochim Biophys Acta,
1440, 205-14.
KATHURIA, S., GAETANI, S., FEGLEY, D., VALINO, F., DURANTI, A.,
TONTINI, A., MOR, M., TARZIA, G., LA RANA, G., CALIGNANO,
A., GIUSTINO, A., TATTOLI, M., PALMERY, M., CUOMO, V. &
PIOMELLI, D. 2003. Modulation of anxiety through blockade of
anandamide hydrolysis. Nat Med, 9, 76-81.
KHALFOUN, B., THIBAULT, F., WATIER, H., BARDOS, P. &
LEBRANCHU, Y. 1997. Docosahexaenoic and eicosapentaenoic acids
inhibit in vitro human endothelial cell production of interleukin-6. Adv
Exp Med Biol, 400B, 589-97.
KIM, A. L., LABASI, J. M., ZHU, Y., TANG, X., MCCLURE, K., GABEL, C.
A., ATHAR, M. & BICKERS, D. R. 2005. Role of p38 MAPK in UVB-
induced inflammatory responses in the skin of SKH-1 hairless mice. J
Invest Dermatol, 124, 1318-25.
KIM, H. H., CHO, S., LEE, S., KIM, K. H., CHO, K. H., EUN, H. C. & CHUNG,
J. H. 2006. Photoprotective and anti-skin-aging effects of
eicosapentaenoic acid in human skin in vivo. J Lipid Res, 47, 921-30.
KIM, H. W., RAO, J. S., RAPOPORT, S. I. & IGARASHI, M. 2011. Dietary n-
6 PUFA deprivation downregulates arachidonate but upregulates
docosahexaenoate metabolizing enzymes in rat brain. Biochim Biophys
Acta, 1811, 111-7.
KIM, J. K., KIM, Y., NA, K. M., SURH, Y. J. & KIM, T. Y. 2007. [6]-Gingerol
prevents UVB-induced ROS production and COX-2 expression in vitro
and in vivo. Free Radic Res, 41, 603-14.

222
KINSELLA, J. E., LOKESH, B., BROUGHTON, S. & WHELAN, J. 1990.
Dietary polyunsaturated fatty acids and eicosanoids: potential effects on
the modulation of inflammatory and immune cells: an overview.
Nutrition, 6, 24-44; discussion 59-62.
KOBAYASHI, N., NAKAGAWA, A., MURAMATSU, T., YAMASHINA, Y.,
SHIRAI, T., HASHIMOTO, M. W., ISHIGAKI, Y., OHNISHI, T. &
MORI, T. 1998a. Supranuclear melanin caps reduce ultraviolet induced
DNA photoproducts in human epidermis. J Invest Dermatol, 110, 806-
10.
KOBAYASHI, T., IMOKAWA, G., BENNETT, D. C. & HEARING, V. J.
1998b. Tyrosinase stabilization by Tyrp1 (the brown locus protein). J
Biol Chem, 273, 31801-5.
KOTA, B. P., HUANG, T. H. & ROUFOGALIS, B. D. 2005. An overview on
biological mechanisms of PPARs. Pharmacol Res, 51, 85-94.
KOZAK, K. R., CREWS, B. C., MORROW, J. D., WANG, L. H., MA, Y. H.,
WEINANDER, R., JAKOBSSON, P. J. & MARNETT, L. J. 2002a.
Metabolism of the endocannabinoids, 2-arachidonylglycerol and
anandamide, into prostaglandin, thromboxane, and prostacyclin glycerol
esters and ethanolamides. J Biol Chem, 277, 44877-85.
KOZAK, K. R., CREWS, B. C., RAY, J. L., TAI, H. H., MORROW, J. D. &
MARNETT, L. J. 2001a. Metabolism of prostaglandin glycerol esters
and prostaglandin ethanolamides in vitro and in vivo. J Biol Chem, 276,
36993-8.
KOZAK, K. R., GUPTA, R. A., MOODY, J. S., JI, C., BOEGLIN, W. E.,
DUBOIS, R. N., BRASH, A. R. & MARNETT, L. J. 2002b. 15-
Lipoxygenase metabolism of 2-arachidonylglycerol. Generation of a
peroxisome proliferator-activated receptor alpha agonist. J Biol Chem,
277, 23278-86.
KOZAK, K. R., PRUSAKIEWICZ, J. J. & MARNETT, L. J. 2004. Oxidative
metabolism of endocannabinoids by COX-2. Curr Pharm Des, 10, 659-
67.
KOZAK, K. R., PRUSAKIEWICZ, J. J., ROWLINSON, S. W., SCHNEIDER,
C. & MARNETT, L. J. 2001b. Amino acid determinants in
cyclooxygenase-2 oxygenation of the endocannabinoid 2-
arachidonylglycerol. J Biol Chem, 276, 30072-7.
KOZAK, K. R., ROWLINSON, S. W. & MARNETT, L. J. 2000. Oxygenation
of the endocannabinoid, 2-arachidonylglycerol, to glyceryl
prostaglandins by cyclooxygenase-2. J Biol Chem, 275, 33744-9.
KREMER, J. M. 2000. n-3 fatty acid supplements in rheumatoid arthritis. Am J
Clin Nutr, 71, 349s-51s.
KRIPKE, M. L., MUNN, C. G., JEEVAN, A., TANG, J. M. & BUCANA, C.
1990. Evidence that cutaneous antigen-presenting cells migrate to
regional lymph nodes during contact sensitization. J Immunol, 145,
2833-8.
KRUTMANN, J. 2001. New developments in photoprotection of human skin.
Skin Pharmacol Appl Skin Physiol, 14, 401-7.
KUJUBU, D. A., FLETCHER, B. S., VARNUM, B. C., LIM, R. W. &
HERSCHMAN, H. R. 1991. TIS10, a phorbol ester tumor promoter-
inducible mRNA from Swiss 3T3 cells, encodes a novel prostaglandin
synthase/cyclooxygenase homologue. J Biol Chem, 266, 12866-72.
223
KURAHASHI, Y., UEDA, N., SUZUKI, H., SUZUKI, M. & YAMAMOTO, S.
1997. Reversible hydrolysis and synthesis of anandamide demonstrated
by recombinant rat fatty-acid amide hydrolase. Biochem Biophys Res
Commun, 237, 512-5.
KURUMBAIL, R. G., STEVENS, A. M., GIERSE, J. K., MCDONALD, J. J.,
STEGEMAN, R. A., PAK, J. Y., GILDEHAUS, D., MIYASHIRO, J.
M., PENNING, T. D., SEIBERT, K., ISAKSON, P. C. & STALLINGS,
W. C. 1996. Structural basis for selective inhibition of cyclooxygenase-
2 by anti-inflammatory agents. Nature, 384, 644-8.
LAMPE, M. A., BURLINGAME, A. L., WHITNEY, J., WILLIAMS, M. L.,
BROWN, B. E., ROITMAN, E. & ELIAS, P. M. 1983. Human stratum
corneum lipids: characterization and regional variations. J Lipid Res, 24,
120-30.
LANDS, W. E., LIBELT, B., MORRIS, A., KRAMER, N. C., PREWITT, T. E.,
BOWEN, P., SCHMEISSER, D., DAVIDSON, M. H. & BURNS, J. H.
1992. Maintenance of lower proportions of (n - 6) eicosanoid precursors
in phospholipids of human plasma in response to added dietary (n - 3)
fatty acids. Biochim Biophys Acta, 1180, 147-62.
LANEUVILLE, O., BREUER, D. K., XU, N., HUANG, Z. H., GAGE, D. A.,
WATSON, J. T., LAGARDE, M., DEWITT, D. L. & SMITH, W. L.
1995. Fatty acid substrate specificities of human prostaglandin-
endoperoxide H synthase-1 and -2. Formation of 12-hydroxy-(9Z,
13E/Z, 15Z)- octadecatrienoic acids from alpha-linolenic acid. J Biol
Chem, 270, 19330-6.
LE POOLE, I. C., VAN DEN WIJNGAARD, R. M., WESTERHOF, W.,
VERKRUISEN, R. P., DUTRIEUX, R. P., DINGEMANS, K. P. & DAS,
P. K. 1993. Phagocytosis by normal human melanocytes in vitro. Exp
Cell Res, 205, 388-95.
LEE, C.-W., KO, H.-H., CHAI, C.-Y., CHEN, W.-T., LIN, C.-C. & YEN, F.-L.
2013a. Effect of Artocarpus communis Extract on UVB Irradiation-
Induced Oxidative Stress and Inflammation in Hairless Mice.
International Journal of Molecular Sciences, 14, 3860-3873.
LEE, C., PARK, G. H., AHN, E. M., KIM, B.-A., PARK, C.-I. & JANG, J.-H.
2013b. Protective effect of Codium fragile against UVB-induced pro-
inflammatory and oxidative damages in HaCaT cells and BALB/c mice.
Fitoterapia, 86, 54-63.
LEE, T. H., MENICA-HUERTA, J. M., SHIH, C., COREY, E. J., LEWIS, R.
A. & AUSTEN, K. F. 1984. Characterization and biologic properties of
5,12-dihydroxy derivatives of eicosapentaenoic acid, including
leukotriene B5 and the double lipoxygenase product. Journal of
Biological Chemistry, 259, 2383-9.
LEHMAN, T. A., MODALI, R., BOUKAMP, P., STANEK, J., BENNETT, W.
P., WELSH, J. A., METCALF, R. A., STAMPFER, M. R., FUSENIG,
N., ROGAN, E. M. & ET AL. 1993. p53 mutations in human
immortalized epithelial cell lines. Carcinogenesis, 14, 833-9.
LEONG, J., HUGHES-FULFORD, M., RAKHLIN, N., HABIB, A.,
MACLOUF, J. & GOLDYNE, M. E. 1996. Cyclooxygenases in Human
and Mouse Skin and Cultured Human Keratinocytes: Association of
COX-2 Expression with Human Keratinocyte Differentiation.
Experimental Cell Research, 224, 79-87.

224
LEUNG, D., SAGHATELIAN, A., SIMON, G. M. & CRAVATT, B. F. 2006.
Inactivation of N-acyl phosphatidylethanolamine phospholipase D
reveals multiple mechanisms for the biosynthesis of endocannabinoids.
Biochemistry, 45, 4720-6.
LI, H., RUAN, X. Z., POWIS, S. H., FERNANDO, R., MON, W. Y.,
WHEELER, D. C., MOORHEAD, J. F. & VARGHESE, Z. 2005. EPA
and DHA reduce LPS-induced inflammation responses in HK-2 cells:
evidence for a PPAR-gamma-dependent mechanism. Kidney Int, 67,
867-74.
LICHTMAN, A. H., LEUNG, D., SHELTON, C. C., SAGHATELIAN, A.,
HARDOUIN, C., BOGER, D. L. & CRAVATT, B. F. 2004. Reversible
inhibitors of fatty acid amide hydrolase that promote analgesia: evidence
for an unprecedented combination of potency and selectivity. J
Pharmacol Exp Ther, 311, 441-8.
LIM, S.-Y. & SUZUKI, H. 2001. Changes in Maze Behavior of Mice Occur
after Sufficient Accumulation of Docosahexaenoic Acid in Brain. The
Journal of Nutrition, 131, 319-324.
LISCOVITCH, M., CZARNY, M., FIUCCI, G. & TANG, X. 2000.
Phospholipase D: molecular and cell biology of a novel gene family.
Biochem J, 345 Pt 3, 401-15.
LIU, J., BATKAI, S., PACHER, P., HARVEY-WHITE, J., WAGNER, J. A.,
CRAVATT, B. F., GAO, B. & KUNOS, G. 2003. Lipopolysaccharide
induces anandamide synthesis in macrophages via
CD14/MAPK/phosphoinositide 3-kinase/NF-kappaB independently of
platelet-activating factor. J Biol Chem, 278, 45034-9.
LIU, J., WANG, L., HARVEY-WHITE, J., HUANG, B. X., KIM, H. Y.,
LUQUET, S., PALMITER, R. D., KRYSTAL, G., RAI, R.,
MAHADEVAN, A., RAZDAN, R. K. & KUNOS, G. 2008. Multiple
pathways involved in the biosynthesis of anandamide.
Neuropharmacology, 54, 1-7.
LIU, J., WANG, L., HARVEY-WHITE, J., OSEI-HYIAMAN, D., RAZDAN,
R., GONG, Q., CHAN, A. C., ZHOU, Z., HUANG, B. X., KIM, H. Y.
& KUNOS, G. 2006. A biosynthetic pathway for anandamide. Proc Natl
Acad Sci U S A, 103, 13345-50.
LO, C. J., CHIU, K. C., FU, M., LO, R. & HELTON, S. 1999. Fish oil decreases
macrophage tumor necrosis factor gene transcription by altering the NF
kappa B activity. J Surg Res, 82, 216-21.
LO VERME, J., FU, J., ASTARITA, G., LA RANA, G., RUSSO, R.,
CALIGNANO, A. & PIOMELLI, D. 2005. The nuclear receptor
peroxisome proliferator-activated receptor-alpha mediates the anti-
inflammatory actions of palmitoylethanolamide. Mol Pharmacol, 67, 15-
9.
LOVERME, J., LA RANA, G., RUSSO, R., CALIGNANO, A. & PIOMELLI,
D. 2005. The search for the palmitoylethanolamide receptor. Life Sci, 77,
1685-98.
LOWRY, O. H., ROSEBROUGH, N. J., FARR, A. L. & RANDALL, R. J. 1951.
Protein measurement with the Folin phenol reagent. J Biol Chem, 193,
265-75.
LUNDGREN, K. & WULF, H. C. 1988. Cytotoxicity and genotoxicity of UVA
irradiation in Chinese hamster ovary cells measured by specific locus

225
mutations, sister chromatid exchanges and chromosome aberrations.
Photochem Photobiol, 47, 559-63.
MACCARRONE, M., BARI, M., DI RIENZO, M., FINAZZI-AGRO, A. &
ROSSI, A. 2003a. Progesterone activates fatty acid amide hydrolase
(FAAH) promoter in human T lymphocytes through the transcription
factor Ikaros. Evidence for a synergistic effect of leptin. J Biol Chem,
278, 32726-32.
MACCARRONE, M., DE FELICI, M., BARI, M., KLINGER, F., SIRACUSA,
G. & FINAZZI-AGRÒ, A. 2000. Down-regulation of anandamide
hydrolase in mouse uterus by sex hormones. European Journal of
Biochemistry, 267, 2991-2997.
MACCARRONE, M., DI RIENZO, M., BATTISTA, N., GASPERI, V.,
GUERRIERI, P., ROSSI, A. & FINAZZI-AGRO, A. 2003b. The
endocannabinoid system in human keratinocytes. Evidence that
anandamide inhibits epidermal differentiation through CB1 receptor-
dependent inhibition of protein kinase C, activation protein-1, and
transglutaminase. J Biol Chem, 278, 33896-903.
MACHIDA, T., HIRAMATSU, M., HAMAUE, N., MINAMI, M. &
HIRAFUJI, M. 2005. Docosahexaenoic acid enhances cyclooxygenase-
2 induction by facilitating p44/42, but not p38, mitogen-activated protein
kinase activation in rat vascular smooth muscle cells. J Pharmacol Sci,
99, 113-6.
MADISON, K. C. 2003. Barrier function of the skin: "la raison d'etre" of the
epidermis. J Invest Dermatol, 121, 231-41.
MADSEN, L., RUSTAN, A. C., VAAGENES, H., BERGE, K., DYROY, E. &
BERGE, R. K. 1999. Eicosapentaenoic and docosahexaenoic acid affect
mitochondrial and peroxisomal fatty acid oxidation in relation to
substrate preference. Lipids, 34, 951-63.
MALDVE, R. E. & FISCHER, S. M. 1996. Multifactor regulation of
prostaglandin H synthase-2 in murine keratinocytes. Mol Carcinog, 17,
207-16.
MALKOWSKI, M. G., THURESSON, E. D., LAKKIDES, K. M., RIEKE, C.
J., MICIELLI, R., SMITH, W. L. & GARAVITO, R. M. 2001. Structure
of eicosapentaenoic and linoleic acids in the cyclooxygenase site of
prostaglandin endoperoxide H synthase-1. J Biol Chem, 276, 37547-55.
MARINKOVICH, M. P., KEENE, D. R., RIMBERG, C. S. & BURGESON, R.
E. 1993. Cellular origin of the dermal-epidermal basement membrane.
Dev Dyn, 197, 255-67.
MARKS, R. M., ROCHE, W. R., CZERNIECKI, M., PENNY, R. & NELSON,
D. S. 1986. Mast cell granules cause proliferation of human
microvascular endothelial cells. Lab Invest, 55, 289-94.
MARROT, L. & MEUNIER, J.-R. 2008. Skin DNA photodamage and its
biological consequences. Journal of the American Academy of
Dermatology, 58, S139-S148.
MATIAS, I., CARTA, G., MURRU, E., PETROSINO, S., BANNI, S. & DI
MARZO, V. 2008. Effect of polyunsaturated fatty acids on
endocannabinoid and N-acyl-ethanolamine levels in mouse adipocytes.
Biochim Biophys Acta, 1781, 52-60.

226
MATSUDA, L. A., LOLAIT, S. J., BROWNSTEIN, M. J., YOUNG, A. C. &
BONNER, T. I. 1990. Structure of a cannabinoid receptor and functional
expression of the cloned cDNA. Nature, 346, 561-4.
MATSUMURA, Y. & ANANTHASWAMY, H. N. 2004. Toxic effects of
ultraviolet radiation on the skin. Toxicology and Applied Pharmacology,
195, 298-308.
MAYSER, P., MROWIETZ, U., ARENBERGER, P., BARTAK, P.,
BUCHVALD, J., CHRISTOPHERS, E., JABLONSKA, S.,
SALMHOFER, W., SCHILL, W. B., KRAMER, H. J., SCHLOTZER,
E., MAYER, K., SEEGER, W. & GRIMMINGER, F. 1998. Omega-3
fatty acid-based lipid infusion in patients with chronic plaque psoriasis:
results of a double-blind, randomized, placebo-controlled, multicenter
trial. J Am Acad Dermatol, 38, 539-47.
MCKINLAY, A. & DIFFEY, B. 1987. A reference action spectrum for
ultraviolet induced erythema in human skin. CIE j, 6, 17-22.
MCKINNEY, M. K. & CRAVATT, B. F. 2005. Structure and function of fatty
acid amide hydrolase. Annu Rev Biochem, 74, 411-32.
MECHOULAM, R., BEN-SHABAT, S., HANUS, L., LIGUMSKY, M.,
KAMINSKI, N. E., SCHATZ, A. R., GOPHER, A., ALMOG, S.,
MARTIN, B. R., COMPTON, D. R., PERTWEE, R. G., GRIFFIN, G.,
BAYEWITCH, M., BARG, J. & VOGEL, Z. 1995. Identification of an
endogenous 2-monoglyceride, present in canine gut, that binds to
cannabinoid receptors. Biochemical Pharmacology, 50, 83-90.
MILLER, C. C., TANG, W., ZIBOH, V. A. & FLETCHER, M. P. 1991. Dietary
supplementation with ethyl ester concentrates of fish oil (n-3) and borage
oil (n-6) polyunsaturated fatty acids induces epidermal generation of
local putative anti-inflammatory metabolites. J Invest Dermatol, 96, 98-
103.
MILLER, C. C., ZIBOH, V. A., WONG, T. & FLETCHER, M. P. 1990. Dietary
supplementation with oils rich in (n-3) and (n-6) fatty acids influences in
vivo levels of epidermal lipoxygenase products in guinea pigs. J Nutr,
120, 36-44.
MINDRESCU, C., LE, J., WISNIEWSKI, H. G. & VILCEK, J. 2005. Up-
regulation of cyclooxygenase-2 expression by TSG-6 protein in
macrophage cell line. Biochem Biophys Res Commun, 330, 737-45.
MOHAGHEGHPOUR, N., WALEH, N., GARGER, S. J., DOUSMAN, L.,
GRILL, L. K. & TUSE, D. 2000. Synthetic melanin suppresses
production of proinflammatory cytokines. Cell Immunol, 199, 25-36.
MOLONEY, F. J., COLLINS, S. & MURPHY, G. M. 2002. Sunscreens: safety,
efficacy and appropriate use. Am J Clin Dermatol, 3, 185-91.
MOODY, J. S., KOZAK, K. R., JI, C. & MARNETT, L. J. 2001. Selective
oxygenation of the endocannabinoid 2-arachidonylglycerol by
leukocyte-type 12-lipoxygenase. Biochemistry, 40, 861-6.
MOTTAZ, J. H. & ZELICKSON, A. S. 1975. Keratinosomes in psoriatic skin.
Acta Derm Venereol, 55, 81-5.
MOULIN, V., AUGER, F. A., GARREL, D. & GERMAIN, L. 2000. Role of
wound healing myofibroblasts on re-epithelialization of human skin.
Burns, 26, 3-12.
MUKHOPADHYAY, B., CINAR, R., YIN, S., LIU, J., TAM, J.,
GODLEWSKI, G., HARVEY-WHITE, J., MORDI, I., CRAVATT, B.

227
F., LOTERSZTAJN, S., GAO, B., YUAN, Q., SCHUEBEL, K.,
GOLDMAN, D. & KUNOS, G. 2011. Hyperactivation of anandamide
synthesis and regulation of cell-cycle progression via cannabinoid type 1
(CB1) receptors in the regenerating liver. Proceedings of the National
Academy of Sciences, 108, 6323-6328.
NAKANE, S., OKA, S., ARAI, S., WAKU, K., ISHIMA, Y., TOKUMURA, A.
& SUGIURA, T. 2002. 2-Arachidonoyl-sn-glycero-3-phosphate, an
arachidonic acid-containing lysophosphatidic acid: occurrence and rapid
enzymatic conversion to 2-arachidonoyl-sn-glycerol, a cannabinoid
receptor ligand, in rat brain. Arch Biochem Biophys, 402, 51-8.
NICOLAOU, A., ESTDALE, S. E., TSATMALI, M., HERRERO, D. P. &
THODY, A. J. 2004. Prostaglandin production by melanocytic cells and
the effect of alpha-melanocyte stimulating hormone. FEBS Lett, 570,
223-6.
NOVAK, T. E., BABCOCK, T. A., JHO, D. H., HELTON, W. S. & ESPAT, N.
J. 2003. NF-kappa B inhibition by omega-3 fatty acids modulates LPS-
stimulated macrophage TNF-alpha transcription. American Journal of
Physiology-Lung Cellular and Molecular Physiology, 284, L84-L89.
NOVAKOVIC, L., LEE, S., ORCHARD, G. E., SHEEHAN, J. M., YOUNG, A.
R. & WALKER, S. L. 2001. Effects of solar-simulated radiation dose
fractionation on CD1a+ Langerhans cells and CD11b+ macrophages in
human skin. Br J Dermatol, 145, 237-44.
OKA, S., WAKUI, J., IKEDA, S., YANAGIMOTO, S., KISHIMOTO, S.,
GOKOH, M., NASUI, M. & SUGIURA, T. 2006. Involvement of the
cannabinoid CB2 receptor and its endogenous ligand 2-
arachidonoylglycerol in oxazolone-induced contact dermatitis in mice. J
Immunol, 177, 8796-805.
OKA, S., YANAGIMOTO, S., IKEDA, S., GOKOH, M., KISHIMOTO, S.,
WAKU, K., ISHIMA, Y. & SUGIURA, T. 2005. Evidence for the
involvement of the cannabinoid CB2 receptor and its endogenous ligand
2-arachidonoylglycerol in 12-O-tetradecanoylphorbol-13-acetate-
induced acute inflammation in mouse ear. J Biol Chem, 280, 18488-97.
OKAMOTO, Y., MORISHITA, J., TSUBOI, K., TONAI, T. & UEDA, N. 2004.
Molecular characterization of a phospholipase D generating anandamide
and its congeners. J Biol Chem, 279, 5298-305.
OKAMOTO, Y., WANG, J., MORISHITA, J. & UEDA, N. 2007. Biosynthetic
Pathways of the Endocannabinoid Anandamide. Chemistry &
Biodiversity, 4, 1842-1857.
OKAZAKI, T., SAGAWA, N., OKITA, J. R., BLEASDALE, J. E.,
MACDONALD, P. C. & JOHNSTON, J. M. 1981. Diacylglycerol
metabolism and arachidonic acid release in human fetal membranes and
decidua vera. J Biol Chem, 256, 7316-21.
PACHER, P., BATKAI, S. & KUNOS, G. 2006. The endocannabinoid system
as an emerging target of pharmacotherapy. Pharmacol Rev, 58, 389-462.
PAUS, R., SCHMELZ, M., BIRO, T. & STEINHOFF, M. 2006a. Frontiers in
pruritus research: scratching the brain for more effective itch therapy. J
Clin Invest, 116, 1174-86.
PAUS, R., THEOHARIDES, T. C. & ARCK, P. C. 2006b.
Neuroimmunoendocrine circuitry of the 'brain-skin connection'. Trends
Immunol, 27, 32-9.

228
PAVÓN, F. J., SERRANO, A., ROMERO-CUEVAS, M., ALONSO, M. &
RODRÍGUEZ DE FONSECA, F. 2010. Oleoylethanolamide: a new
player in peripheral control of energy metabolism. Therapeutic
implications. Drug Discovery Today: Disease Mechanisms, 7, e175-
e183.
PAZIN, M. J., SHERIDAN, P. L., CANNON, K., CAO, Z., KECK, J. G.,
KADONAGA, J. T. & JONES, K. A. 1996. NF-kappa B-mediated
chromatin reconfiguration and transcriptional activation of the HIV-1
enhancer in vitro. Genes Dev, 10, 37-49.
PERKINS, N. D., AGRANOFF, A. B., PASCAL, E. & NABEL, G. J. 1994. An
interaction between the DNA-binding domains of RelA(p65) and Sp1
mediates human immunodeficiency virus gene activation. Mol Cell Biol,
14, 6570-83.
PETROSINO, S. & DI MARZO, V. 2010. FAAH and MAGL inhibitors:
Therapeutic opportunities from regulating endocannabinoid levels.
Current Opinion in Investigational Drugs, 11, 51-62.
PILLAI, S., ORESAJO, C. & HAYWARD, J. 2005. Ultraviolet radiation and
skin aging: roles of reactive oxygen species, inflammation and protease
activation, and strategies for prevention of inflammation-induced matrix
degradation – a review. International Journal of Cosmetic Science, 27,
17-34.
PIOMELLI, D. 2003. The molecular logic of endocannabinoid signalling. Nat
Rev Neurosci, 4, 873-84.
POLOZOVA, A., GIONFRIDDO, E. & SALEM, N., JR. 2006. Effect of
docosahexaenoic acid on tissue targeting and metabolism of plasma
lipoproteins. Prostaglandins Leukot Essent Fatty Acids, 75, 183-90.
PORTER, A. C., SAUER, J. M., KNIERMAN, M. D., BECKER, G. W.,
BERNA, M. J., BAO, J., NOMIKOS, G. G., CARTER, P., BYMASTER,
F. P., LEESE, A. B. & FELDER, C. C. 2002. Characterization of a novel
endocannabinoid, virodhamine, with antagonist activity at the CB1
receptor. J Pharmacol Exp Ther, 301, 1020-4.
POYNTER, M. E. & DAYNES, R. A. 1998. Peroxisome Proliferator-activated
Receptor α Activation Modulates Cellular Redox Status, Represses
Nuclear Factor-κB Signaling, and Reduces Inflammatory Cytokine
Production in Aging. Journal of Biological Chemistry, 273, 32833-
32841.
PRESCOTT, S. M. & MAJERUS, P. W. 1983. Characterization of 1,2-
diacylglycerol hydrolysis in human platelets. Demonstration of an
arachidonoyl-monoacylglycerol intermediate. J Biol Chem, 258, 764-9.
PROTA, G. 1997. Pigment cell research: what directions? Pigment Cell Res, 10,
5-11.
PUPE, A., MOISON, R., DE HAES, P., VAN HENEGOUWEN, G. B.,
RHODES, L., DEGREEF, H. & GARMYN, M. 2002. Eicosapentaenoic
acid, a n-3 polyunsaturated fatty acid differentially modulates TNF-
alpha, IL-1alpha, IL-6 and PGE2 expression in UVB-irradiated human
keratinocytes. J Invest Dermatol, 118, 692-8.
RACLOT, T., GROSCOLAS, R., LANGIN, D. & FERRE, P. 1997. Site-specific
regulation of gene expression by n-3 polyunsaturated fatty acids in rat
white adipose tissues. J Lipid Res, 38, 1963-72.

229
RAHMAN, M., KUNDU, J. K., SHIN, J. W., NA, H. K. & SURH, Y. J. 2011.
Docosahexaenoic acid inhibits UVB-induced activation of NF-kappaB
and expression of COX-2 and NOX-4 in HR-1 hairless mouse skin by
blocking MSK1 signaling. PLoS One, 6, e28065.
RAPOPORT, S. I. 2008. Brain arachidonic and docosahexaenoic acid cascades
are selectively altered by drugs, diet and disease. Prostaglandins Leukot
Essent Fatty Acids, 79, 153-6.
RAPOPORT, S. I., RAO, J. S. & IGARASHI, M. 2007. Brain metabolism of
nutritionally essential polyunsaturated fatty acids depends on both the
diet and the liver. Prostaglandins Leukot Essent Fatty Acids, 77, 251-61.
REELFS, O., TYRRELL, R. M. & POURZAND, C. 2004. Ultraviolet A
Radiation-Induced Immediate Iron Release Is a Key Modulator of the
Activation of NF-[kappa]B in Human Skin Fibroblasts. J Investig
Dermatol, 122, 1440-1447.
REES, D., MILES, E. A., BANERJEE, T., WELLS, S. J., ROYNETTE, C. E.,
WAHLE, K. W. & CALDER, P. C. 2006. Dose-related effects of
eicosapentaenoic acid on innate immune function in healthy humans: a
comparison of young and older men. The American Journal of Clinical
Nutrition, 83, 331-342.
RHIM, J. S., FUJITA, J., ARNSTEIN, P. & AARONSON, S. A. 1986.
Neoplastic conversion of human keratinocytes by adenovirus 12-SV40
virus and chemical carcinogens. Science, 232, 385-8.
RHIM, J. S., JAY, G., ARNSTEIN, P., PRICE, F. M., SANFORD, K. K. &
AARONSON, S. A. 1985. Neoplastic transformation of human
epidermal keratinocytes by AD12-SV40 and Kirsten sarcoma viruses.
Science, 227, 1250-2.
RHODES, L. E. 1998. Topical and systemic approaches for protection against
solar radiation-induced skin damage. Clin Dermatol, 16, 75-82.
RHODES, L. E., DURHAM, B. H., FRASER, W. D. & FRIEDMANN, P. S.
1995. Dietary fish oil reduces basal and ultraviolet B-generated PGE2
levels in skin and increases the threshold to provocation of polymorphic
light eruption. J Invest Dermatol, 105, 532-5.
RHODES, L. E., GLEDHILL, K., MASOODI, M., HAYLETT, A. K.,
BROWNRIGG, M., THODY, A. J., TOBIN, D. J. & NICOLAOU, A.
2009. The sunburn response in human skin is characterized by sequential
eicosanoid profiles that may mediate its early and late phases. FASEB J,
23, 3947-56.
RHODES, L. E., O'FARRELL, S., JACKSON, M. J. & FRIEDMANN, P. S.
1994. Dietary fish-oil supplementation in humans reduces UVB-
erythemal sensitivity but increases epidermal lipid peroxidation. J Invest
Dermatol, 103, 151-4.
RICOTE, M., HUANG, J. T., WELCH, J. S. & GLASS, C. K. 1999. The
peroxisome proliferator-activated receptor(PPARgamma) as a regulator
of monocyte/macrophage function. Journal of Leukocyte Biology, 66,
733-9.
RIVAS, J. M. & ULLRICH, S. E. 1992. Systemic suppression of delayed-type
hypersensitivity by supernatants from UV-irradiated keratinocytes. An
essential role for keratinocyte-derived IL-10. J Immunol, 149, 3865-71.
ROBERTSON, A. R. 1978. Colorimetry. Reports on Progress in Physics, 41,
469.

230
ROBINSON, J. G. & STONE, N. J. 2006. Antiatherosclerotic and
Antithrombotic Effects of Omega-3 Fatty Acids. The American Journal
of Cardiology, 98, 39-49.
ROOSTERMAN, D., GOERGE, T., SCHNEIDER, S. W., BUNNETT, N. W. &
STEINHOFF, M. 2006. Neuronal control of skin function: the skin as a
neuroimmunoendocrine organ. Physiol Rev, 86, 1309-79.
ROSS, R., EVERETT, N. B. & TYLER, R. 1970. Wound healing and collagen
formation. VI. The origin of the wound fibroblast studied in parabiosis.
J Cell Biol, 44, 645-54.
ROSSI, G., GASPERI, V., PARO, R., BARSACCHI, D., CECCONI, S. &
MACCARRONE, M. 2007. Follicle-Stimulating Hormone Activates
Fatty Acid Amide Hydrolase by Protein Kinase A and Aromatase-
Dependent Pathways in Mouse Primary Sertoli Cells. Endocrinology,
148, 1431-1439.
SAMPATH, H. & NTAMBI, J. M. 2005. Polyunsaturated fatty acid regulation
of genes of lipid metabolism. Annu Rev Nutr, 25, 317-40.
SANCÉAU, J., KAISHO, T., HIRANO, T. & WIETZERBIN, J. 1995.
Triggering of the Human Interleukin-6 Gene by Interferon-γ and Tumor
Necrosis Factor-α in Monocytic Cells Involves Cooperation between
Interferon Regulatory Factor-1, NFκB, and Sp1 Transcription Factors.
Journal of Biological Chemistry, 270, 27920-27931.
SAXOD, R. 1996. Ontogeny of the cutaneous sensory organs. Microsc Res Tech,
34, 313-33.
SCHAFER, I. A., PANDY, M., FERGUSON, R. & DAVIS, B. R. 1985.
Comparative observation of fibroblasts derived from the papillary and
reticular dermis of infants and adults: growth kinetics, packing density at
confluence and surface morphology. Mech Ageing Dev, 31, 275-93.
SCHMID, H. H. 2000. Pathways and mechanisms of N-acylethanolamine
biosynthesis: can anandamide be generated selectively? Chem Phys
Lipids, 108, 71-87.
SCHMID, H. H. & BERDYSHEV, E. V. 2002. Cannabinoid receptor-inactive
N-acylethanolamines and other fatty acid amides: metabolism and
function. Prostaglandins Leukot Essent Fatty Acids, 66, 363-76.
SCHMIDT, G., AMIRAIAN, K., FREY, H., STEVENS, R. W. & BERNS, D.
S. 1987. Densitometric analysis of Western blot (immunoblot) assays for
human immunodeficiency virus antibodies and correlation with clinical
status. J Clin Microbiol, 25, 1993-8.
SCHMITZ, G. & ECKER, J. 2008. The opposing effects of n-3 and n-6 fatty
acids. Prog Lipid Res, 47, 147-55.
SCHNEIDER, C. A., RASBAND, W. S. & ELICEIRI, K. W. 2012. NIH Image
to ImageJ: 25 years of image analysis. Nat Methods, 9, 671-5.
SCHREIBER, D., HARLFINGER, S., NOLDEN, B. M., GERTH, C. W.,
JAEHDE, U., SCHOMIG, E., KLOSTERKOTTER, J., GIUFFRIDA,
A., ASTARITA, G., PIOMELLI, D. & MARKUS LEWEKE, F. 2007.
Determination of anandamide and other fatty acyl ethanolamides in
human serum by electrospray tandem mass spectrometry. Anal Biochem,
361, 162-8.
SCHWAB, J. M., CHIANG, N., ARITA, M. & SERHAN, C. N. 2007. Resolvin
E1 and protectin D1 activate inflammation-resolution programmes.
Nature, 447, 869-74.

231
SENGUPTA, S., JANG, B. C., WU, M. T., PAIK, J. H., FURNEAUX, H. &
HLA, T. 2003. The RNA-binding protein HuR regulates the expression
of cyclooxygenase-2. J Biol Chem, 278, 25227-33.
SERHAN, C. N., CLISH, C. B., BRANNON, J., COLGAN, S. P., CHIANG, N.
& GRONERT, K. 2000. Novel Functional Sets of Lipid-Derived
Mediators with Antiinflammatory Actions Generated from Omega-3
Fatty Acids via Cyclooxygenase 2–Nonsteroidal Antiinflammatory
Drugs and Transcellular Processing. The Journal of Experimental
Medicine, 192, 1197-1204.
SERHAN, C. N., HONG, S., GRONERT, K., COLGAN, S. P., DEVCHAND,
P. R., MIRICK, G. & MOUSSIGNAC, R. L. 2002. Resolvins: a family
of bioactive products of omega-3 fatty acid transformation circuits
initiated by aspirin treatment that counter proinflammation signals. J Exp
Med, 196, 1025-37.
SERHAN, C. N., LU, Y., HONG, S. & YANG, R. 2007. Mediator lipidomics:
search algorithms for eicosanoids, resolvins, and protectins. Methods
Enzymol, 432, 275-317.
SHEEHAN, J. M., CRAGG, N., CHADWICK, C. A., POTTEN, C. S. &
YOUNG, A. R. 2002. Repeated ultraviolet exposure affords the same
protection against DNA photodamage and erythema in human skin types
II and IV but is associated with faster DNA repair in skin type IV. J Invest
Dermatol, 118, 825-9.
SHEEHAN, J. M., POTTEN, C. S. & YOUNG, A. R. 1998. Tanning in human
skin types II and III offers modest photoprotection against erythema.
Photochem Photobiol, 68, 588-92.
SHEEHAN, J. M. & YOUNG, A. R. 2002. The sunburn cell revisited: an update
on mechanistic aspects. Photochem Photobiol Sci, 1, 365-77.
SIDHU, G. S., CHANDRA, P. & CASSAI, N. D. 2005. Merkel cells, normal
and neoplastic: an update. Ultrastruct Pathol, 29, 287-94.
SIMOPOULOS, A. P. 2002. Omega-3 fatty acids in inflammation and
autoimmune diseases. J Am Coll Nutr, 21, 495-505.
SIMOPOULOS, A. P. 2003. Essential fatty acids in health and chronic diseases.
Forum Nutr, 56, 67-70.
SMART, D., JONSSON, K. O., VANDEVOORDE, S., LAMBERT, D. M. &
FOWLER, C. J. 2002. 'Entourage' effects of N-acyl ethanolamines at
human vanilloid receptors. Comparison of effects upon anandamide-
induced vanilloid receptor activation and upon anandamide metabolism.
Br J Pharmacol, 136, 452-8.
SMITH, P. B., COMPTON, D. R., WELCH, S. P., RAZDAN, R. K.,
MECHOULAM, R. & MARTIN, B. R. 1994. The pharmacological
activity of anandamide, a putative endogenous cannabinoid, in mice. J
Pharmacol Exp Ther, 270, 219-27.
SMITH, W. L., DEWITT, D. L. & GARAVITO, R. M. 2000. Cyclooxygenases:
structural, cellular, and molecular biology. Annu Rev Biochem, 69, 145-
82.
SMOLA, H., STARK, H. J., THIEKOTTER, G., MIRANCEA, N., KRIEG, T.
& FUSENIG, N. E. 1998. Dynamics of basement membrane formation
by keratinocyte-fibroblast interactions in organotypic skin culture. Exp
Cell Res, 239, 399-410.

232
SORRELL, J. M., BABER, M. A. & CAPLAN, A. I. 1996. Construction of a
bilayered dermal equivalent containing human papillary and reticular
dermal fibroblasts: use of fluorescent vital dyes. Tissue Eng, 2, 39-49.
SORRELL, J. M., BABER, M. A. & CAPLAN, A. I. 2004. Site-matched
papillary and reticular human dermal fibroblasts differ in their release of
specific growth factors/cytokines and in their interaction with
keratinocytes. J Cell Physiol, 200, 134-45.
SOTER, N. A. 1990. Acute effects of ultraviolet radiation on the skin. Semin
Dermatol, 9, 11-5.
SRIVASTAVA, B. K., SONI, R., PATEL, J. Z., JOHARAPURKAR, A.,
SADHWANI, N., KSHIRSAGAR, S., MISHRA, B., TAKALE, V.,
GUPTA, S., PANDYA, P., KAPADNIS, P., SOLANKI, M., PATEL, H.,
MITRA, P., JAIN, M. R. & PATEL, P. R. 2009. Hair growth stimulator
property of thienyl substituted pyrazole carboxamide derivatives as a
CB1 receptor antagonist with in vivo antiobesity effect. Bioorg Med
Chem Lett, 19, 2546-50.
STANDER, S., SCHMELZ, M., METZE, D., LUGER, T. & RUKWIED, R.
2005. Distribution of cannabinoid receptor 1 (CB1) and 2 (CB2) on
sensory nerve fibers and adnexal structures in human skin. J Dermatol
Sci, 38, 177-88.
STEFANO, G. B., LIU, Y. & GOLIGORSKY, M. S. 1996. Cannabinoid
receptors are coupled to nitric oxide release in invertebrate immunocytes,
microglia, and human monocytes. J Biol Chem, 271, 19238-42.
STEINMAN, R., HOFFMAN, L. & POPE, M. 1995. Maturation and migration
of cutaneous dendritic cells. J Invest Dermatol, 105, 2S-7S.
SUGIURA, T., KISHIMOTO, S., OKA, S. & GOKOH, M. 2006. Biochemistry,
pharmacology and physiology of 2-arachidonoylglycerol, an endogenous
cannabinoid receptor ligand. Prog Lipid Res, 45, 405-46.
SUGIURA, T., KONDO, S., SUKAGAWA, A., NAKANE, S., SHINODA, A.,
ITOH, K., YAMASHITA, A. & WAKU, K. 1995. 2-
Arachidonoylgylcerol: A Possible Endogenous Cannabinoid Receptor
Ligand in Brain. Biochemical and Biophysical Research
Communications, 215, 89-97.
SUN, Y. X., TSUBOI, K., OKAMOTO, Y., TONAI, T., MURAKAMI, M.,
KUDO, I. & UEDA, N. 2004. Biosynthesis of anandamide and N-
palmitoylethanolamine by sequential actions of phospholipase A2 and
lysophospholipase D. Biochem J, 380, 749-56.
SUN, Y. X., TSUBOI, K., ZHAO, L. Y., OKAMOTO, Y., LAMBERT, D. M.
& UEDA, N. 2005. Involvement of N-acylethanolamine-hydrolyzing
acid amidase in the degradation of anandamide and other N-
acylethanolamines in macrophages. Biochim Biophys Acta, 1736, 211-
20.
TAI, T., TSUBOI, K., UYAMA, T., MASUDA, K., CRAVATT, B. F.,
HOUCHI, H. & UEDA, N. 2012. Endogenous Molecules Stimulating N-
Acylethanolamine-Hydrolyzing Acid Amidase (NAAA). ACS Chemical
Neuroscience, 3, 379-385.
TANG, Q., CHEN, W., GONZALES, M. S., FINCH, J., INOUE, H. &
BOWDEN, G. T. 2001. Role of cyclic AMP responsive element in the
UVB induction of cyclooxygenase-2 transcription in human
keratinocytes. Oncogene, 20, 5164-72.

233
TANIMURA, A., YAMAZAKI, M., HASHIMOTODANI, Y.,
UCHIGASHIMA, M., KAWATA, S., ABE, M., KITA, Y.,
HASHIMOTO, K., SHIMIZU, T., WATANABE, M., SAKIMURA, K.
& KANO, M. 2010. The Endocannabinoid 2-Arachidonoylglycerol
Produced by Diacylglycerol Lipase α Mediates Retrograde Suppression
of Synaptic Transmission. Neuron, 65, 320-327.
TAYLOR, C. R., STERN, R. S., LEYDEN, J. J. & GILCHREST, B. A. 1990.
Photoaging/photodamage and photoprotection. J Am Acad Dermatol, 22,
1-15.
TAYLOR, D. K., ANSTEY, A. V., COLEMAN, A. J., DIFFEY, B. L., FARR,
P. M., FERGUSON, J., IBBOTSON, S., LANGMACK, K., LLOYD, J.
J., MCCANN, P., MARTIN, C. J., MENAGÉ, H. D. P., MOSELEY, H.,
MURPHY, G., PYE, S. D., RHODES, L. E. & ROGERS, S. 2002.
Guidelines for dosimetry and calibration in ultraviolet radiation therapy:
a report of a British Photodermatology Group workshop. British Journal
of Dermatology, 146, 755-763.
TELEK, A., BIRO, T., BODO, E., TOTH, B. I., BORBIRO, I., KUNOS, G. &
PAUS, R. 2007. Inhibition of human hair follicle growth by endo- and
exocannabinoids. FASEB J, 21, 3534-41.
TILLEY, S. L., COFFMAN, T. M. & KOLLER, B. H. 2001. Mixed messages:
modulation of inflammation and immune responses by prostaglandins
and thromboxanes. J Clin Invest, 108, 15-23.
TONG, X., VAN DROSS, R. T., ABU-YOUSIF, A., MORRISON, A. R. &
PELLING, J. C. 2007. Apigenin prevents UVB-induced cyclooxygenase
2 expression: coupled mRNA stabilization and translational inhibition.
Mol Cell Biol, 27, 283-96.
TRIFAN, O. C. & HLA, T. 2003. Cyclooxygenase-2 modulates cellular growth
and promotes tumorigenesis. J Cell Mol Med, 7, 207-22.
TSATSANIS, C., ANDROULIDAKI, A., VENIHAKI, M. & MARGIORIS, A.
N. 2006. Signalling networks regulating cyclooxygenase-2. Int J
Biochem Cell Biol, 38, 1654-61.
TSUBOI, K., SUN, Y. X., OKAMOTO, Y., ARAKI, N., TONAI, T. & UEDA,
N. 2005. Molecular characterization of N-acylethanolamine-hydrolyzing
acid amidase, a novel member of the choloylglycine hydrolase family
with structural and functional similarity to acid ceramidase. J Biol Chem,
280, 11082-92.
TSUBOI, K., TAKEZAKI, N. & UEDA, N. 2007a. The N-Acylethanolamine-
Hydrolyzing Acid Amidase (NAAA). Chemistry & Biodiversity, 4,
1914-1925.
TSUBOI, K., ZHAO, L. Y., OKAMOTO, Y., ARAKI, N., UENO, M.,
SAKAMOTO, H. & UEDA, N. 2007b. Predominant expression of
lysosomal N-acylethanolamine-hydrolyzing acid amidase in
macrophages revealed by immunochemical studies. Biochim Biophys
Acta, 1771, 623-32.
TSUTSUMI, T., KOBAYASHI, T., UEDA, H., YAMAUCHI, E.,
WATANABE, S. & OKUYAMA, H. 1994. Lysophosphoinositide-
specific phospholipase C in rat brain synaptic plasma membranes.
Neurochem Res, 19, 399-406.
UEDA, H., KOBAYASHI, T., KISHIMOTO, M., TSUTSUMI, T. &
OKUYAMA, H. 1993. A Possible Pathway of Phosphoinositide

234
Metabolism Through EDTA-Insensitive Phospholipase A1 Followed by
Lysophosphoinositide-Specific Phospholipase C in Rat Brain. Journal of
Neurochemistry, 61, 1874-1881.
UEDA, N., TSUBOI, K. & UYAMA, T. 2010. N-acylethanolamine metabolism
with special reference to N-acylethanolamine-hydrolyzing acid amidase
(NAAA). Prog Lipid Res, 49, 299-315.
UEDA, N., TSUBOI, K., UYAMA, T. & OHNISHI, T. 2011. Biosynthesis and
degradation of the endocannabinoid 2-arachidonoylglycerol. BioFactors,
37, 1-7.
UEDA, N., YAMAMOTO, K., YAMAMOTO, S., TOKUNAGA, T.,
SHIRAKAWA, E., SHINKAI, H., OGAWA, M., SATO, T., KUDO, I.,
INOUE, K. & ET AL. 1995. Lipoxygenase-catalyzed oxygenation of
arachidonylethanolamide, a cannabinoid receptor agonist. Biochim
Biophys Acta, 1254, 127-34.
UEDA, N., YAMANAKA, K. & YAMAMOTO, S. 2001. Purification and
characterization of an acid amidase selective for N-
palmitoylethanolamine, a putative endogenous anti-inflammatory
substance. J Biol Chem, 276, 35552-7.
UEDA, Y., MIYAGAWA, N., MATSUI, T., KAYA, T. & IWAMURA, H.
2005. Involvement of cannabinoid CB(2) receptor-mediated response
and efficacy of cannabinoid CB(2) receptor inverse agonist, JTE-907, in
cutaneous inflammation in mice. Eur J Pharmacol, 520, 164-71.
UEDA, Y., MIYAGAWA, N. & WAKITANI, K. 2007. Involvement of
cannabinoid CB2 receptors in the IgE-mediated triphasic cutaneous
reaction in mice. Life Sci, 80, 414-9.
VAN DER STELT, M., VAN KUIK, J. A., BARI, M., VAN ZADELHOFF, G.,
LEEFLANG, B. R., VELDINK, G. A., FINAZZI-AGRÒ, A.,
VLIEGENTHART, J. F. G. & MACCARRONE, M. 2002. Oxygenated
Metabolites of Anandamide and 2-Arachidonoylglycerol:
Conformational Analysis and Interaction with Cannabinoid Receptors,
Membrane Transporter, and Fatty Acid Amide Hydrolase. Journal of
Medicinal Chemistry, 45, 3709-3720.
VILE, G. F., TANEW-ILIITSCHEW, A. & TYRRELL, R. M. 1995.
ACTIVATION OF NF-KB IN HUMAN SKIN FIBROBLASTS BY
THE OXIDATIVE STRESS GENERATED BY UVA RADIATION.
Photochemistry and Photobiology, 62, 463-468.
VROMAN, H. E., NEMECEK, R. A. & HSIA, S. L. 1969. Synthesis of lipids
from acetate by human preputial and abdominal skin in vitro. J Lipid Res,
10, 507-14.
WADA, M., DELONG, C. J., HONG, Y. H., RIEKE, C. J., SONG, I., SIDHU,
R. S., YUAN, C., WARNOCK, M., SCHMAIER, A. H., YOKOYAMA,
C., SMYTH, E. M., WILSON, S. J., FITZGERALD, G. A.,
GARAVITO, R. M., SUI DE, X., REGAN, J. W. & SMITH, W. L. 2007.
Enzymes and receptors of prostaglandin pathways with arachidonic acid-
derived versus eicosapentaenoic acid-derived substrates and products. J
Biol Chem, 282, 22254-66.
WALEH, N. S., CRAVATT, B. F., APTE-DESHPANDE, A., TERAO, A. &
KILDUFF, T. S. 2002. Transcriptional regulation of the mouse fatty acid
amide hydrolase gene. Gene, 291, 203-210.

235
WALL, R., ROSS, R. P., FITZGERALD, G. F. & STANTON, C. 2010. Fatty
acids from fish: the anti-inflammatory potential of long-chain omega-3
fatty acids. Nutr Rev, 68, 280-9.
WANG, J., OKAMOTO, Y., MORISHITA, J., TSUBOI, K., MIYATAKE, A.
& UEDA, N. 2006. Functional analysis of the purified anandamide-
generating phospholipase D as a member of the metallo-beta-lactamase
family. J Biol Chem, 281, 12325-35.
WANG, J., ZHAO, L. Y., UYAMA, T., TSUBOI, K., WU, X. X., KAKEHI, Y.
& UEDA, N. 2008. Expression and secretion of N-acylethanolamine-
hydrolysing acid amidase in human prostate cancer cells. J Biochem,
144, 685-90.
WASTER, P. K. & OLLINGER, K. M. 2009. Redox-Dependent Translocation
of p53 to Mitochondria or Nucleus in Human Melanocytes after UVA-
and UVB-Induced Apoptosis. J Invest Dermatol, 129, 1769-1781.
WATANABE, S., DOSHI, M. & HAMAZAKI, T. 2003. n-3 Polyunsaturated
fatty acid (PUFA) deficiency elevates and n-3 PUFA enrichment reduces
brain 2-arachidonoylglycerol level in mice. Prostaglandins Leukot
Essent Fatty Acids, 69, 51-9.
WEBB, A. R. & ENGELSEN, O. 2006. Calculated Ultraviolet Exposure Levels
for a Healthy Vitamin D Status. Photochemistry and Photobiology, 82,
1697-1703.
WEDEMEYER, J., TSAI, M. & GALLI, S. J. 2000. Roles of mast cells and
basophils in innate and acquired immunity. Curr Opin Immunol, 12, 624-
31.
WEI, B. Q., MIKKELSEN, T. S., MCKINNEY, M. K., LANDER, E. S. &
CRAVATT, B. F. 2006. A second fatty acid amide hydrolase with
variable distribution among placental mammals. J Biol Chem, 281,
36569-78.
WENCZL, E., VAN DER SCHANS, G. P., ROZA, L., KOLB, R. M.,
TIMMERMAN, A. J., SMIT, N. P., PAVEL, S. & SCHOTHORST, A.
A. 1998. (Pheo)melanin photosensitizes UVA-induced DNA damage in
cultured human melanocytes. J Invest Dermatol, 111, 678-82.
WERTZ, P. W. 1992. Epidermal lipids. Semin Dermatol, 11, 106-13.
WEST, J. M., ZVONOK, N., WHITTEN, K. M., WOOD, J. T. &
MAKRIYANNIS, A. 2011. Mass Spectrometric Characterization of
Human N-Acylethanolamine-hydrolyzing Acid Amidase. Journal of
Proteome Research, 11, 972-981.
WEYLANDT, K. H., KANG, J. X., WIEDENMANN, B. & BAUMGART, D.
C. 2007. Lipoxins and resolvins in inflammatory bowel disease. Inflamm
Bowel Dis, 13, 797-9.
WILKES, G. L., BROWN, I. A. & WILDNAUER, R. H. 1973. The
biomechanical properties of skin. CRC Crit Rev Bioeng, 1, 453-95.
WINGERATH, T., SIES, H. & STAHL, W. 1998. Xanthophyll esters in human
skin. Arch Biochem Biophys, 355, 271-4.
WOOD, J. T., WILLIAMS, J. S., PANDARINATHAN, L., JANERO, D. R.,
LAMMI-KEEFE, C. J. & MAKRIYANNIS, A. 2010. Dietary
docosahexaenoic acid supplementation alters select physiological
endocannabinoid-system metabolites in brain and plasma. J Lipid Res,
51, 1416-23.

236
XIE, W., ROBERTSON, D. L. & SIMMONS, D. L. 1992. Mitogen-inducible
prostaglandin G/H synthase: A new target for nonsteroidal
antiinflammatory drugs. Drug Development Research, 25, 249-265.
YOO, H., JEON, B., JEON, M. S., LEE, H. & KIM, T. Y. 2008. Reciprocal
regulation of 12- and 15-lipoxygenases by UV-irradiation in human
keratinocytes. FEBS Lett, 582, 3249-53.
YOUNG, A. R. 2006. Acute effects of UVR on human eyes and skin. Prog
Biophys Mol Biol, 92, 80-5.
YOUNG, A. R., CHADWICK, C. A., HARRISON, G. I., HAWK, J. L.,
NIKAIDO, O. & POTTEN, C. S. 1996. The in situ repair kinetics of
epidermal thymine dimers and 6-4 photoproducts in human skin types I
and II. J Invest Dermatol, 106, 1307-13.
YOUNG, A. R., CHADWICK, C. A., HARRISON, G. I., NIKAIDO, O.,
RAMSDEN, J. & POTTEN, C. S. 1998. The similarity of action spectra
for thymine dimers in human epidermis and erythema suggests that DNA
is the chromophore for erythema. J Invest Dermatol, 111, 982-8.
YUAN, C., SIDHU, R. S., KUKLEV, D. V., KADO, Y., WADA, M., SONG, I.
& SMITH, W. L. 2009. Cyclooxygenase Allosterism, Fatty Acid-
mediated Cross-talk between Monomers of Cyclooxygenase
Homodimers. J Biol Chem, 284, 10046-55.
ZHANG, J. & BOWDEN, G. T. 2008. UVB irradiation regulates Cox-2 mRNA
stability through AMPK and HuR in human keratinocytes. Mol
Carcinog, 47, 974-83.
ZHAO, L. Y., TSUBOI, K., OKAMOTO, Y., NAGAHATA, S. & UEDA, N.
2007. Proteolytic activation and glycosylation of N-acylethanolamine-
hydrolyzing acid amidase, a lysosomal enzyme involved in the
endocannabinoid metabolism. Biochim Biophys Acta, 1771, 1397-405.
ZHAO, Y., JOSHI-BARVE, S., BARVE, S. & CHEN, L. H. 2004.
Eicosapentaenoic acid prevents LPS-induced TNF-alpha expression by
preventing NF-kappaB activation. J Am Coll Nutr, 23, 71-8.
ZHENG, D., BODE, A. M., ZHAO, Q., CHO, Y. Y., ZHU, F., MA, W. Y. &
DONG, Z. 2008. The cannabinoid receptors are required for ultraviolet-
induced inflammation and skin cancer development. Cancer Res, 68,
3992-8.
ZHU, C., SOLORZANO, C., SAHAR, S., REALINI, N., FUNG, E., SASSONE-
CORSI, P. & PIOMELLI, D. 2011. Proinflammatory Stimuli Control N-
Acylphosphatidylethanolamine-Specific Phospholipase D Expression in
Macrophages. Molecular Pharmacology, 79, 786-792.
ZIBOH, V. A., MILLER, C. C. & CHO, Y. 2000. Metabolism of
polyunsaturated fatty acids by skin epidermal enzymes: generation of
antiinflammatory and antiproliferative metabolites. Am J Clin Nutr, 71,
361S-6S.
ZYGMUNT, P. M., PETERSSON, J., ANDERSSON, D. A., CHUANG, H.,
SORGARD, M., DI MARZO, V., JULIUS, D. & HOGESTATT, E. D.
1999. Vanilloid receptors on sensory nerves mediate the vasodilator
action of anandamide. Nature, 400, 452-7.

237
Appendices
Appendix 1
1. Fatty acid stock solution
1.1. Oleic Acid (OA) stock solution (50mM)
1. OA 25 mg
2. Dimethyl sulfoxide (DMSO) 1.8 ml
3. Aliquot to 50µl each and store at -20°C.
1M of OA = 282.46 g, so 14.123g are needed to prepare OA at concentration of 50mM.
1.2. Eicosapentaenoic Acid (EPA) stock solution (50mM)
1. EPA 25 mg
2. Dimethyl sulfoxide (DMSO) 1.7 ml
3. Aliquot to 50µl each and store at -20°C.
1M of EPA = 302.45 g, so 15.123g are needed to prepare EPA at concentration of
50mM
1.3. Docosahexaenoic Acid (DHA) stock solution (50mM)
1. Docosahexaenoic acid 25 mg
2. Dimethyl sulfoxide (DMSO) 1.5 ml
3. Aliquot to 50µl each and store at -20°C.
1M of DHA = 328.49 g, so 16.424g are needed to prepare DHA at concentration of 50m.
Appendix 2
2.1. Preparation of BSA standards
Prepare BSA solutions in 100 µl
1. The stock solution of BSA is 1.54 mg/ml
2. The required concentrations are 0.1, 0.2, 0.4, 0.6, 0.8 and 1 mg/ml
238
Example: (0.1mg/ml) / (1.54 mg/ml) = 0.06 x 100µl = 6 µl
6 µl BSA+ 94 µl of sample buffer (Appendix 3, section 3.1.5) = 100µl
3. Do this calculation of the rest of required concentrations
4. Put in eppendroff tubes and vortex
5. Store in -20 oC to be used for the protein assay
2.2. Genesis software (Version 2)
1. In a 96-well microplate add 5 µl of each BSA standard and 5 µl of each test
sample all in triplicate
2. Add 25 µl Protein Assay Reagent A (Bio-Rad) in each well
3. Add 200 µl Protein Assay Reagent B (Bio-Rad) in each well
4. Leave the plate to stand in the dark for 15 min
5. Read the absorbance of all wells using a plate reader at 650 nm
6. To estimate the protein content, launch Genesis software (Version 2).
7. Once opened, click on ‘Protocol’ at the menu bar and then ‘Open’.
8. From the list, choose ‘protein.prt’ and confirm the selection ‘OK’.
9. Once set up, gently place the micro-plate onto the reader holder and run
samples (running man icon at the task bar).
10. Type any relevant comments and confirm by ‘RUN’. Note: Filter must be set at
650 nm.
11. Save data.
2.3. Sample calculation for adjusting the protein content of the cell lysate
Example: if the sample volume is 200 µl and the protein concentration of the sample is
3.7µg/µl, then a dilution to a concentration of 2µg/µl is needed.
So: C1V1=C2V2
V2 = (3.7µg/µlx200µl )/(2µg/µl ) =370µl
370 µl - 200 µl = 170 µl.

239
Therefore; 170 µl of sample buffer (Appendix 3, section 3.1.5) should be added to the
original lysate to generate a sample of: volume 370 µl, protein concentration 2µg/µl.
Appendix 3
3.1 Preparation of buffers and stains
3.1.1. Tank (running) buffer: (PH 8.4-8.5) 1 litre
1. Tris base 30 g
2. Glycine 144 g
3. SDS 10 g
4. Add dH2O to adjust the volume to 1 litre
Do not adjust PH
In case of preparing 1 L, mix all solids together, add dH2O up 1000 ml using a stirrer
mix very gently to dissolve all ingredients.
3.1.2. Transblotting buffer: (PH 8.4-8.5) 1 litre
1. Tris base 30 g
2. Glycine 144 g
3. dH2O to adjust the volume to 1 litre. Do not adjust PH
In case of preparing 1 L, mix all solids together, add dH2O up 1000 ml using a stirrer
mix very gently to dissolve all ingredients.
3.1.3. Lower (separating) gel Tris buffer (PH 8.8) - 0.5 litre
1. Tris base 90.8 g
2. SDS 2 g
3. dH2O 500 ml
Adjust PH using concentrated HCl

240
3.1.4. Upper (stacking) gel Tris buffer (PH 6.9) - 0.5 litre
1. Tris base 30.3 g
2. SDS 2 g
3. dH2O 500 ml
Adjust pH using concentrated HCl (Add few drops until pH adjusted)
3.1.5. Sample buffer 25 ml
10% Glycerol, 2.5 ml
0.02M EDTA, 0.185 g
MW = 372.24 g
1M = 372.24 g/L
Quantity required is 0.02 M in 100 ml
(0.02M x 372.24 g ) / 1M = 7.44 g
(7.44 g x 100 ml) / (1000 ml) = 0.74 g
To dissolve EDTA add few drops of NaOH 1M. 1M = 40 g/1000ml
(1mM = 4 g/100 ml)
6% SDS, 1.5g
62.4mM Tris base, 0.19g
MW = 121.14 g
1M = 121.14 g/L
Quantity required is 62 mM in 100 ml
1M = 121.14 g
(0.062M x 121.14 g) / 1M = 7.51 g
(7.51 x 100 ml) / (1000 ml) = 0.76 g

241
Bromophenol blue 0.08% (omit this step and do it when adding samples)
dH2O to adjust the volume to 25ml
3.1.6. Coomassie blue stain for SDS
1. 125 ml dH2O
2. 100 ml methanol
3. 25 ml acetic acid
4. 0.1% w/v coomassie blue
Filter before use with Whatman filter paper and funnel.
3.1.7. Destain for SDS
1. 250 ml dH2O
2. 200 ml methanol
3. 50 ml glacial acetic acid
3.1.8. Fast green 0.1% for PVDF membrane
1. 0.5 g fast green
2. 500 ml dH2O Filter with Whatman filter paper and funnel
3.1.9. ECL solution
1. Tris base 2.5 ml (pH 8.5)
2. Luminal 130 µl
3. P-coumaric acid 60 µl
4. H2O2 28 µl
5. dH2O 22.32 ml.
The mixture was protected from the light by mixed in 50 ml universal tube wrapped in
foil.

242
Appendix 4
4.1. Membrane stripping
4.1.1. Mild stripping buffer
1. Glycine1.5 g
2. SDS 0.1 g
3. Tween 20 (1ml)
Adjust pH to 2.2 by using concentrated HCl (Add few drops until pH adjusted) Bring
volume up to 100 ml with dH2O.
4.2. Protocol of stripping western blots for re-probing
1. Put the PVDF membrane in a 10cm square petri dish contains of an enough
volume of mild stripping buffer that will cover the PVDF membrane, usually use
15 – 20 ml.
2. Incubate at room temperature for 10 min.
3. Discharge mild stripping buffer.
4. Incubate PVDF membrane again at room temperature for 10 minutes with fresh
stripping buffer.
5. Discharge buffer.
6. Incubate PVDF membrane at room temperature for 10 min with PBS
7. Pour off the PBS
8. Incubate PVDF membrane again at room temperature for 10 min with PBS
9. Pour off the PBS
10. Incubate PVDF membrane at room temperature for 5 min with PBS/Tween20
(0.05%)
11. Pour off the PBS/Tween20 (0.05%)
12. Incubate PVDF membrane again at room temperature for 5 min with
PBS/Tween20 (0.05%)
13. Pour off the PBS/Tween20 (0.05%)
14. Incubate PVDF membrane at room temperature for 5 min with PBS
243
15. Ready for blocking stage.
Appendix 5
5.1. Chloroform/methanol (2:1 ratio)
1. Add 100 ml methanol (HPLC grade) into 500 measuring flask.
2. Add 300 ml of chloroform (HPLC grade) to step number 1
3. Store at room temperature for use, this solution can stand up to one month
5.2. Internal standards (1 ng/µl AEA-d8 and 1 ng/µl 2-AG-d8)
1. In an amber vial, mix 100 µl of 100 ng/µl stocks with 900 µl ethanol (HPLC grade)
to make a 10 ng/µl stock
2. In another amber vial, mix 100 µl 10 ng/µl stocks and mix with 900 µl ethanol
(HPLC grade) to make a 1 ng/µl stock
3. Seal both 1 ng/µl stock and remaining 10 ng/µl stocks with Parafilm and store at -
20 ºC for up to three months
5.3 Endocannabinoid cocktail for calibration line (400 pg/µl)
1. Using a Hamilton syringe, measure 40 µl of the 10 ng/µl AEA standard into an
amber vial
2. Add 40 µl each of the 10 ng/µl 2-AG, ALEA, DHEA, OEA, SEA, PEA, EPEA
and LEA standards, rinsing the Hamilton syringe between standards
3. Add 640 µl ethanol (HPLC grade) to make up to 1 ml
4. Mix thoroughly

244
5.4. Mobile Phase A for endocannabinoid analysis
1. Measure 20 ml acetonitrile (HPLC grade) into a 1 L measuring cylinder
2. Add 5 ml glacial acetic acid (HPLC grade)
3. Make up to 1 L with deionized water
4. Vacuum filter
5. Transfer to 1 L bottle
Should be made fresh at the beginning of each run
5.5. Mobile Phase B for endocannabinoid analysis
1. Measure 20 ml deionized water into a 1 L measuring cylinder
2. Add 5 ml glacial acetic acid (HPLC grade)
3. Make up to 1 L with acetonitrile (HPLC grade)
4. Vacuum filter
5. Transfer to 1 L bottle
Should be made fresh at the beginning of each run
5.6. Seal wash
1. Measure 100 ml acetonitrile (HPLC grade) into a 1 L measuring cylinder
2. Make up to 1 L with deionized water
3. Vacuum filter
4. Transfer to 1L bottle

245
Should be made fresh at the beginning of each run
5.7. Needle Wash
1. Measure 300 ml deionized water into a 1 L measuring cylinder
2. Make up to 1 L with acetonitrile (HPLC grade)
3. Vacuum filter
4. Transfer to 1 L bottle
Should be made fresh at the beginning of each run
5.8. Shutdown solution I
1. Measure 500 ml methanol (HPLC grade) into a 1 L measuring cylinder
2. Add 2 ml glacial acetic acid (HPLC grade)
3. Make up to 1 L with deionized water
4. Vacuum filter
5. Transfer to 1 L bottle
Should be made fresh at the beginning of each run
5.9. Shutdown solution II
1. Measure 500 ml methanol (HPLC grade) into a 1 L measuring cylinder
2. Make up to 1 L with deionized water
3. Vacuum filter
4. Transfer to 1 L bottle

246
Should be made fresh at the beginning of each run
Appendix 6
Table 6.1. Comparison between PEA levels in White Caucasians of skin phototype
II and South Asians of phototype V pre and post UVR.
Skin phototype II Skin phototype V
Days of UVR exposure PEA (pg/ml) PEA (pg/ml)
Day 0 3160 2814
Day 4 4048 2571
Day 7 3085 2473
Day 14 3049 2892
Day 21 3041 2533
Day 28 3311 3023
Day 35 3184 2871
Day 39 3251 2474
Table 6.2. Comparison between LEA levels in White Caucasians of skin phototype
II and South Asians of phototype V pre and post UVR.
Skin phototype II Skin phototype V
Days of UVR exposure LEA (pg/ml) LEA (pg/ml)
Day 0 870 1015
Day 4 896 916
Day 7 893 920
Day 14 863 1101
Day 21 810 928
Day 28 1004 1235
Day 35 947 1115
Day 39 885 969
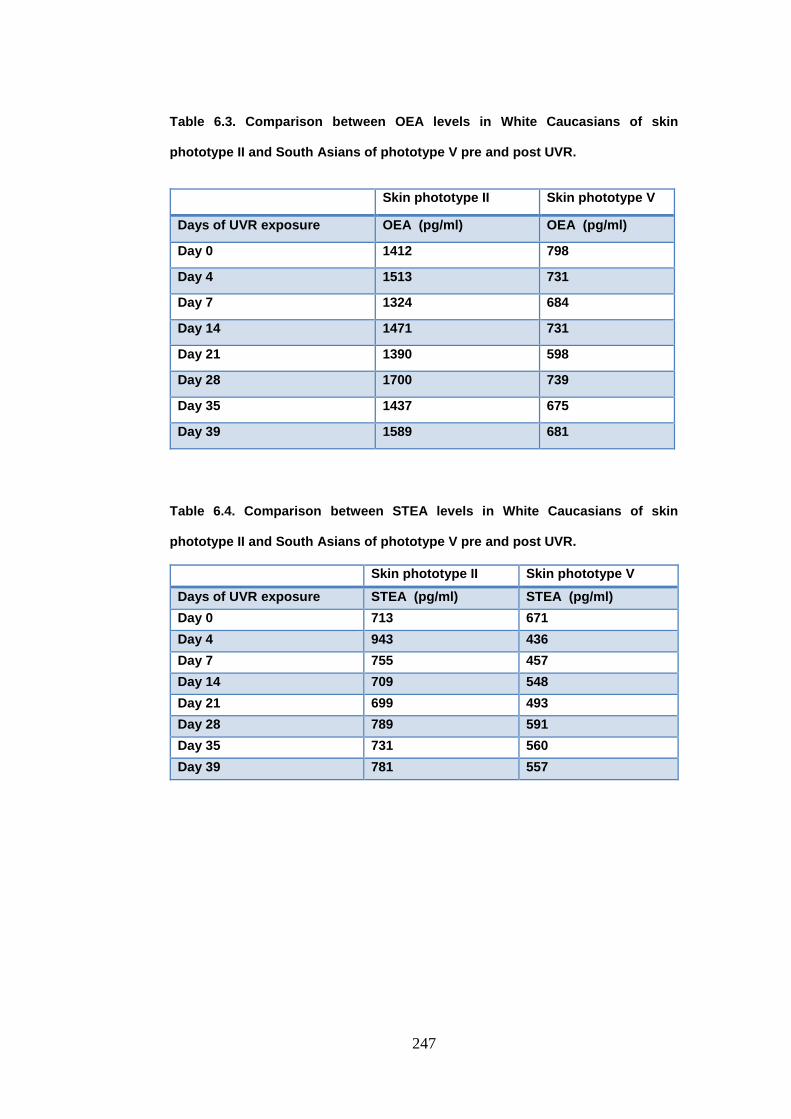
247
Table 6.3. Comparison between OEA levels in White Caucasians of skin
phototype II and South Asians of phototype V pre and post UVR.
Table 6.4. Comparison between STEA levels in White Caucasians of skin
phototype II and South Asians of phototype V pre and post UVR.
Skin phototype II Skin phototype V
Days of UVR exposure STEA (pg/ml) STEA (pg/ml)
Day 0 713 671
Day 4 943 436
Day 7 755 457
Day 14 709 548
Day 21 699 493
Day 28 789 591
Day 35 731 560
Day 39 781 557
Skin phototype II Skin phototype V
Days of UVR exposure OEA (pg/ml) OEA (pg/ml)
Day 0 1412 798
Day 4 1513 731
Day 7 1324 684
Day 14 1471 731
Day 21 1390 598
Day 28 1700 739
Day 35 1437 675
Day 39 1589 681

248
Table 6.5. Comparison between DHEA levels in White Caucasians of skin
phototype II and South Asians of phototype V pre and post UVR.
Skin phototype II Skin phototype V
Days of UVR exposure DHEA (pg/ml) DHEA (pg/ml)
Day 0 2797 792
Day 4 2282 849
Day 7 2902 707
Day 14 2643 1081
Day 21 2517 626
Day 28 3023 1103
Day 35 2703 1127
Day 39 2605 755
Table 6.6. Comparison between AEA levels in White Caucasians of skin phototype
II and South Asians of phototype V pre and post UVR.
Skin phototype II Skin phototype V
Days of UVR exposure AEA (pg/ml) AEA (pg/ml)
Day 0 326 280
Day 4 358 150
Day 7 315 196
Day 14 331 272
Day 21 298 145
Day 28 347 322
Day 35 339 202
Day 39 383 237

249
Table 6.7. Comparison between 2-AG levels in White Caucasians of skin
phototype II and South Asians of phototype V pre and post UVR.
Skin phototype II Skin phototype V
Days of UVR exposure 2-AG (pg/ml) 2-AG (pg/ml)
Day 0 993 1786
Day 4 2364 2088
Day 7 1101 1800
Day 14 1732 1699
Day 21 1575 2487
Day 28 1474 2560
Day 35 1527 1682
Day 39 1231 1185
Table 6.8. Comparison between 1-AG levels in White Caucasians of skin
phototype II and South Asians of phototype V pre and post UVR.
Skin phototype II Skin phototype V
Days of UVR exposure 1-AG (pg/ml) 1-AG (pg/ml)
Day 0 742 847
Day 4 771 726
Day 7 765 508
Day 14 690 651
Day 21 564 895
Day 28 710 618
Day 35 684 713
Day 39 865 467

250
Table 6.9. Comparison between DP-EA levels in White Caucasians of skin
phototype II and South Asians of phototype V pre and post UVR.
Skin phototype II Skin phototype V
Days of UVR exposure DP-EA (pg/ml) DP-EA (pg/ml)
Day 0 76 43
Day 4 67 48
Day 7 73 47
Day 14 73 53
Day 21 71 43
Day 28 81 66
Day 35 75 63
Day 39 73 47
Table 6.10. Comparison between Myristoyl-EA levels in White Caucasians of skin
phototype II and South Asians of phototype V pre and post UVR.
Skin phototype II Skin phototype V
Days of UVR exposure Myristoyl-EA (pg/ml) Myristoyl-EA (pg/ml)
Day 0 465 335
Day 4 723 337
Day 7 599 449
Day 14 374 773
Day 21 541 299
Day 28 793 477
Day 35 449 492
Day 39 403 297
Table 6.11. Comparison between DGLEA levels in White Caucasians of skin
phototype II and South Asians of phototype V pre and post UVR.
Skin phototype II Skin phototype V
Days of UVR exposure DGLEA (pg/ml) DGLEA (pg/ml)
Day 0 25 20
Day 4 25 25
Day 7 26 19
Day 14 26 26
Day 21 26 18
Day 28 26 25
Day 35 29 18
Day 39 22 15

251
Table 6.12. Comparison of different time point of UVR exposure on EPEA levels
in White Caucasians of skin phototype II.
Days of UVR exposure EPEA (pg/ml)
0 44
4 43
7 69
14 72
21 70
28 88
35 79
39 45