Omega-3 and omega-6 fatty acids from sustainable crops
38
Omega-3 and omega-6 fatty acids from sustainable crops Del Fiore A. 1* , Colonna N. 1 , Crinò P. 1 , Cuna D. 2 , Stamigna C. 1 , Tolaini V. 1 , and De Rossi P. 3 EXPERIMENTAL PLAN INTRODUCTION Fats are essential for living organisms, having not only energetic but also structural and metabolic functions. They are constituents of cell membranes and tissues, and precursors of some hormones. The main structural components of fats are fatty acids (Yaqoob, 2013) √ . Among these, polyunsaturated fatty acids (PUFAs) are fat components of great interest, as they have many beneficial effects on health, allowing to preserve cellular and metabolic balance. PUFAs include omega-3 and omega-6 essential fatty acids such as docosahexanoic (DHA), eicosapentanoic (EPA), and arachidonic (AA) acids, along with their precursors linoleic and α-linolenic acids. They cannot be synthesized by the human organism and, therefore, must be taken with the diet. A balanced intake of omega-3 and omega-6 fatty acids can protect against cardiovascular and inflammatory diseases. Linoleic acid, precursor of omega-6 fatty acids, is the most abundant polyunsaturated fatty acid in nature. It is present in many seed oils and cereal grains (e.g. sunflower, sesame, peanut, corn oil, walnuts, almonds, wheat germ, rice, barley) (Saini and Keum, 2018) √ . The primary sources of α-linolenic acid, precursor of omega-3 fatty acids, are instead mainly fish, fish liver oil, molluscs and crustaceans; it is present also in flax and soybean seed oil and in algae (Hossain, 2011) √ . Due to poor sustainability of both fishing and conventional agriculture, it would be essential to have alternative sustainable sources of these essential acids (Maurer et al., 2012) √ . The present work aimed at studying the suitability of different genotypes of some alternative crops: Cynara cardunculus var. scolymus L. (artichoke), Cannabis sativa L. (hemp) and Carthamus tinctorius L. (safflower) to be exploited as sustainable source of omega-3 and omega-6 fatty acids. These crops have been chosen because they have optimal agronomic features such as high tolerance to abiotic (drought, cold, salinity) and biotic stress (pathogens). They can be grown effectively at different climates and are also characterized by high land use efficiency, and low demand for nutrients. FATTY ACIDS PROFILE ANALYSIS AND OIL YIELD DETERMINATION HAVE BEEN APPLIED TO SEED SAMPLES TO CHARACTERIZE AND VALORIZE THESE SUSTAINABLE AND ALTERNATIVE CROPS. Fatty acids profile. 1 Palmitic acid (C16:0); 2. Stearic acid (C18:0); 3. Oleic acid (C18:1); 4. Linoleic acid (C18:2); 5. Linolenic acid (C18:3) Significant differences in the chromatographic fatty acids profile among the three different species analysed, but not between different genotypes of a same species; Linoleic acid (C18:2) is the most representative for all the three crops, with the highest percentages in safflower; α-linolenic acid (C18:3): Highest percentages in hemp; not detected in artichoke and only in traces in safflower; Oil yield: ~28-30% hemp, ~21-22%artichoke, ~28- 29% safflower . RESULTS AND DISCUSSIONS The percentage composition of fatty acids of the analysed crops is in line with literature data, confirming a good content of omega-3 and/or omega-6 precursors; Hemp shows the most complete and balanced fatty acids profile and also a good value of oil yield. Therefore, it could be better able to meet the needs of sustainable development from a bioeconomy perspective. CONCLUSIONS Fatty acids extracted and derivatized into fatty acid methyl esters following a hydrolysis and methylation procedure, according to (Phippen et al., 2006) √ ; . GC analytical method parameters: capillary column Omegawax® (30 m, 0.25 mm i. d., 0.25 μm film thickness); 1’ at 170°C to 225°C at 1°C/min; detector at 250°C; 1 μl injection volume. Hot (N–Esan) Solvent Randall Oil Extraction. MATERIALS METHODS Artichoke selected genotypes from spring germplsm collection at ARSIAL Demonstrative Farm of Cerveteri, (Rome, Italy). Seeds of safflower from ENEA breeding programs. Hemp commercial varieties and commercial variety Futura 75 (from South Hemp Tecno, Taranto–Italy) . HEMP ARTICHOKE SAFFLOWER FATTY ACIDS EXTRACTION AND ANALYSIS OIL EXTRACTION AND YIELD EVALUATION Freeze-dried and powdered seeds Gas Chromatographic System (Agilent GC 7890 Series) Randall extraction (VELP SCIENTIFICA™ SER148 Series Semi-Automatic Solvent Extractor) Oil yield evaluation ENEA, Italian National Agency for New Technologies, Energy and Sustainable Economic Development - 1 Department of Sustainability and 3 Energy Efficiency Unit Department, Casaccia Research Centre, Via Anguillarese 301, 00123 Rome (Italy), 2 Department of Sustainability, Brindisi Research Centre, SS7 KM 706+000, 72100 Brindisi (Italy). *Corresponding author: [email protected]; √ for references see to the abstract.
-
Upload
khangminh22 -
Category
Documents
-
view
0 -
download
0
Transcript of Omega-3 and omega-6 fatty acids from sustainable crops

Omega-3 and omega-6 fatty acids from sustainable crops Del Fiore A.1*, Colonna N.1, Crinò P.1, Cuna D.2, Stamigna C.1, Tolaini V.1, and De Rossi P.3
EXPERIMENTAL PLAN
INTRODUCTION Fats are essential for living organisms, having not only energetic but also structural and metabolic functions. They are constituents of cell membranes and tissues, and precursors of some hormones. The main structural
components of fats are fatty acids (Yaqoob, 2013)√. Among these, polyunsaturated fatty acids (PUFAs) are fat components of great interest, as they have many beneficial effects on health, allowing to preserve cellular and
metabolic balance. PUFAs include omega-3 and omega-6 essential fatty acids such as docosahexanoic (DHA), eicosapentanoic (EPA), and arachidonic (AA) acids, along with their precursors linoleic and α-linolenic
acids. They cannot be synthesized by the human organism and, therefore, must be taken with the diet. A balanced intake of omega-3 and omega-6 fatty acids can protect against cardiovascular and inflammatory diseases.
Linoleic acid, precursor of omega-6 fatty acids, is the most abundant polyunsaturated fatty acid in nature. It is present in many seed oils and cereal grains (e.g. sunflower, sesame, peanut, corn oil, walnuts, almonds, wheat
germ, rice, barley) (Saini and Keum, 2018)√. The primary sources of α-linolenic acid, precursor of omega-3 fatty acids, are instead mainly fish, fish liver oil, molluscs and crustaceans; it is present also in flax and soybean seed oil
and in algae (Hossain, 2011)√. Due to poor sustainability of both fishing and conventional agriculture, it would be essential to have alternative sustainable sources of these essential acids (Maurer et al., 2012)√. The present work
aimed at studying the suitability of different genotypes of some alternative crops: Cynara cardunculus var. scolymus L. (artichoke), Cannabis sativa L. (hemp) and Carthamus tinctorius L. (safflower) to be exploited as
sustainable source of omega-3 and omega-6 fatty acids. These crops have been chosen because they have optimal agronomic features such as high tolerance to abiotic (drought, cold, salinity) and biotic stress (pathogens).
They can be grown effectively at different climates and are also characterized by high land use efficiency, and low demand for nutrients.
FATTY ACIDS PROFILE ANALYSIS AND OIL YIELD
DETERMINATION HAVE BEEN APPLIED TO SEED
SAMPLES TO CHARACTERIZE AND VALORIZE
THESE SUSTAINABLE AND ALTERNATIVE CROPS.
Fatty acids profile.
1 Palmitic acid (C16:0); 2. Stearic acid (C18:0);
3. Oleic acid (C18:1); 4. Linoleic acid (C18:2);
5. Linolenic acid (C18:3)
Significant differences in
the chromatographic fatty
acids profile among the
three different species
analysed, but not between
different genotypes of a
same species;
Linoleic acid (C18:2) is the
most representative for all
the three crops, with the
highest percentages in
safflower;
α-linolenic acid (C18:3):
Highest percentages in
hemp; not detected in
artichoke and only in
traces in safflower;
Oil yield: ~28-30% hemp,
~21-22%artichoke, ~28-
29% safflower .
RESULTS AND DISCUSSIONS
The percentage composition of fatty acids of the analysed crops is in line with
literature data, confirming a good content of omega-3 and/or omega-6 precursors;
Hemp shows the most complete and balanced fatty acids profile and also a good value
of oil yield. Therefore, it could be better able to meet the needs of sustainable
development from a bioeconomy perspective.
CONCLUSIONS
Fatty acids extracted and derivatized into fatty acid methyl esters following a
hydrolysis and methylation procedure, according to (Phippen et al., 2006)√; .
GC analytical method parameters: capillary column Omegawax® (30 m,
0.25 mm i. d., 0.25 μm film thickness); 1’ at 170°C to 225°C at 1°C/min;
detector at 250°C; 1 μl injection volume.
Hot (N–Esan) Solvent Randall Oil Extraction.
MATERIALS
METHODS
Artichoke selected genotypes from spring
germplsm collection at ARSIAL
Demonstrative Farm of Cerveteri, (Rome,
Italy).
Seeds of safflower from ENEA breeding
programs.
Hemp commercial varieties and commercial
variety Futura 75 (from South Hemp Tecno,
Taranto–Italy) .
HEMP
ARTICHOKE
SAFFLOWER
FATTY ACIDS
EXTRACTION
AND ANALYSIS
OIL EXTRACTION
AND YIELD
EVALUATION
Freeze-dried and
powdered seeds Gas Chromatographic System
(Agilent GC 7890 Series)
Randall extraction (VELP
SCIENTIFICA™ SER148 Series
Semi-Automatic Solvent Extractor)
Oil yield evaluation
ENEA, Italian National Agency for New Technologies, Energy and Sustainable Economic Development - 1 Department of Sustainability and 3 Energy Efficiency Unit Department,
Casaccia Research Centre, Via Anguillarese 301, 00123 Rome (Italy), 2 Department of Sustainability, Brindisi Research Centre, SS7 KM 706+000, 72100 Brindisi (Italy). *Corresponding author: [email protected]; √for references see to the abstract.

Characterization and assays of wild growing plants used in herbal medicine
Kubeš J., Sýkorová T., Skalický M., Lhotská M., Česká J., Hnilička F.
Department of Botany and Plant Physiology, Faculty of Agrobiology, Food and Natural Resources, Czech University of Life Sciences Prague, Czech Republic
Material and methodsPlant samples were collected in Vestec near Prague during spring and summer of2019 and individual samples were processed and dried acccording torequirements of companies that buy wild growing herbs. The characterization andassays of samples were performed according Czech Pharmacopoeia 2017.Identification of herbal substances was performed by macro- and microscopicalobservation, assays of impurietes were made for total ash and water content, andcontent of secondary metabolites was evaluated by UV/Vis spectrophotometry.
This study was supported by project “S grant of the Ministry of Education,Youth and Sports of the Czech Republic”.
6
8
10
12
14
Hyperici herba Matricariae flos Plantaginis folium Sambuci nigrae flos
Limit [%] Measured content [%]
3
6
9
12
15
Hyperici herba Matricariae flos Plantaginis folium Sambuci nigrae flos
Limit [%] Measured content [%]
Fig. 3. Water content in dried sample
Fig. 5. Content of representative metabolites in the herbal substances
Plantaginis folium is acquired from nonflowering plants ofPlantago lanceolata L. Herbal substances are componentsof cough mixtures with regard to mucilages but they alsofind application in treatment of minor wounds. Besidethese compounds, different metabolites like iridoids,flavonoids or derivates of o-hydroxycinnamic acids, such as
acteoside, can be found.
Matricariae flos are dried flowers of chamomile(Matricaria chamomilla L.) that contain essentialoils and flavonoids. This herb finds its application intreatment of spasms and various inflammations.Essential oils are obtained by steam distallionproviding typical blue colour due to the content ofchamazulene
Hyperici herba is harvested as flowering stem of St.John´s wort (Hypericum perforatum L.) that is usedin phytotherapy of depression and other problemslike insomnia. Glands create typical dots, darkerones contain naphthodianthrones, like hypericin,and various secondary metabolites that couldparticipate on antidepressive effect.
Sambuci nigrae flos is herbal substance that is harvestedduring late spring from elderberry (Sambucus nigra L.) andis also used in preparation of syrups with typical aroma andflavour. The flowers provide mostly flavonoids and phenolicacids and they found their application in diuretic anddiaphoretic medicaments.
Results and conclusionHerbal substances are identified by various anatomical traits that are observableon different magnification. Red arrow points to black coloured glands on leaves ofH. perforatum (Fig 1. A) and these structures are also apparent (Fig. 2A) withpalisade parenchyma on microscopic level. Flower of chamomilla is composed byconcave receptacle forming anthodium (Fig. 1B); detail of ovary skin showsglandular trichomes, druses of calcium oxalate and spiky pollen grains (Fig 2B).There are light green lines of veins on the abaxial side of Plantago leaves (Fig. 1C)with trichomes. Stomata are mostly of diacytic type (Fig. 2C), sometimesanomocytic. Elderberry flower has five joined leaves at their base with the fivestamens (Fig. 1D). On microscopic slide, epidermal cells have irregularly thickenedwalls with crystals sand of calcium oxalate and anomocytic stomata.Determination of water content (Fig 3.) and total ash (Fig. 4) showed thatharvesting, processing and storage, with exception of Hyperici herba, metrequired conditions. All herbs, minus chamomile, from the area of interest alsocontained adequate concentrations of monitored metabolites (Fig. 5). Thecontent of secondary metabolites is dependent on many factors like phenologicalphase of plant, stage of ripeness, genetic and environmental factors includingpossible abiotic and biotic stress.It can be assumed that plants from this locality have potential as source of herbalsubstances with appropriate quality, which can be verified by further tests.
Fig. 1. Macroscopic analysis Fig. 2 Microscopic analysis
IntroductionWild growing plants still represent relevant source of herbal substances for folkmedicine and phytotherapy in a case of problems with their cultivation. Theplants are often applied in combinations and they are used for treatment ofvarious mild symptoms of respiratory, digestive and nerve system or some skinproblems. For ensuring of safety and efficacy of these herbal substances andpreparations, the harvested parts should meet conditions required by specificdirectiones stated in appropriate guidelines like supranational and nationalpharmacopoeias.
Selected herbal substances
Fig. 4. Content of total ash after combustion in muffle furnace

Sorry, authors did not provide poster
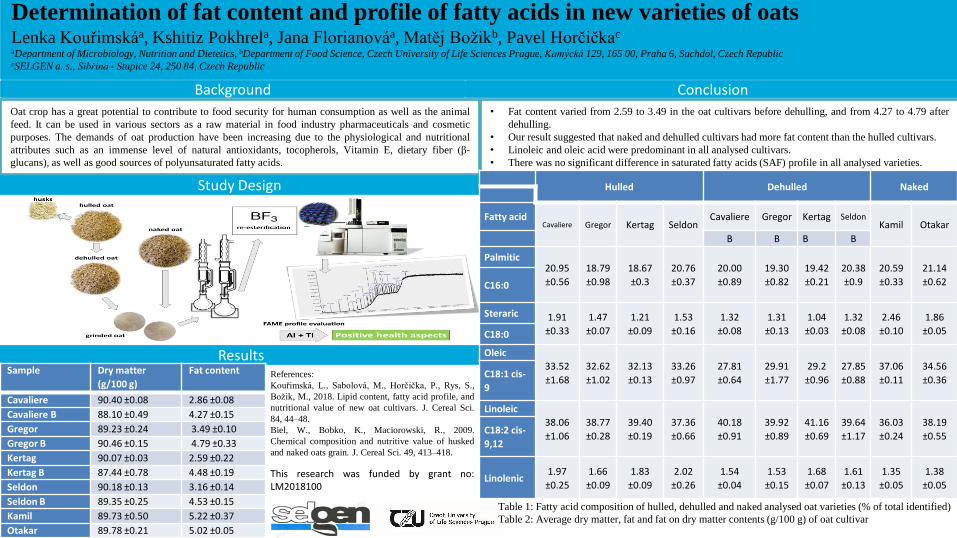
Determination of fat content and profile of fatty acids in new varieties of oatsLenka Kouřimskáa, Kshitiz Pokhrela, Jana Florianováa, Matěj Božikb, Pavel Horčičkac
aDepartment of Microbiology, Nutrition and Dietetics, bDepartment of Food Science, Czech University of Life Sciences Prague, Kamýcká 129, 165 00, Praha 6, Suchdol, Czech RepubliccSELGEN a. s., Sibřina - Stupice 24, 250 84, Czech Republic
Oat crop has a great potential to contribute to food security for human consumption as well as the animal
feed. It can be used in various sectors as a raw material in food industry pharmaceuticals and cosmetic
purposes. The demands of oat production have been increasing due to the physiological and nutritional
attributes such as an immense level of natural antioxidants, tocopherols, Vitamin E, dietary fiber (β-
glucans), as well as good sources of polyunsaturated fatty acids.
Background Conclusion
• Fat content varied from 2.59 to 3.49 in the oat cultivars before dehulling, and from 4.27 to 4.79 after
dehulling.
• Our result suggested that naked and dehulled cultivars had more fat content than the hulled cultivars.
• Linoleic and oleic acid were predominant in all analysed cultivars.
• There was no significant difference in saturated fatty acids (SAF) profile in all analysed varieties.
Study Design
Results
Table 1: Fatty acid composition of hulled, dehulled and naked analysed oat varieties (% of total identified)
Table 2: Average dry matter, fat and fat on dry matter contents (g/100 g) of oat cultivar
Sample Dry matter
(g/100 g)
Fat content
Cavaliere 90.40 ±0.08 2.86 ±0.08
Cavaliere B 88.10 ±0.49 4.27 ±0.15
Gregor 89.23 ±0.24 3.49 ±0.10
Gregor B 90.46 ±0.15 4.79 ±0.33
Kertag 90.07 ±0.03 2.59 ±0.22
Kertag B 87.44 ±0.78 4.48 ±0.19
Seldon 90.18 ±0.13 3.16 ±0.14
Seldon B 89.35 ±0.25 4.53 ±0.15
Kamil 89.73 ±0.50 5.22 ±0.37
Otakar 89.78 ±0.21 5.02 ±0.05
References:
Kouřimská, L., Sabolová, M., Horčička, P., Rys, S.,
Božik, M., 2018. Lipid content, fatty acid profile, and
nutritional value of new oat cultivars. J. Cereal Sci.
84, 44–48.
Biel, W., Bobko, K., Maciorowski, R., 2009.
Chemical composition and nutritive value of husked
and naked oats grain. J. Cereal Sci. 49, 413–418.
This research was funded by grant no:LM2018100
Hulled Dehulled Naked
Fatty acidCavaliere Gregor Kertag Seldon
Cavaliere Gregor Kertag SeldonKamil Otakar
B B B B
Palmitic20.95
±0.56
18.79
±0.98
18.67
±0.3
20.76
±0.37
20.00
±0.89
19.30
±0.82
19.42
±0.21
20.38
±0.9
20.59
±0.33
21.14
±0.62C16:0
Steraric 1.91
±0.33
1.47
±0.07
1.21
±0.09
1.53
±0.16
1.32
±0.08
1.31
±0.13
1.04
±0.03
1.32
±0.08
2.46
±0.10
1.86
±0.05C18:0
Oleic
33.52
±1.68
32.62
±1.02
32.13
±0.13
33.26
±0.97
27.81
±0.64
29.91
±1.77
29.2
±0.96
27.85
±0.88
37.06
±0.11
34.56
±0.36C18:1 cis-
9
Linoleic
38.06
±1.06
38.77
±0.28
39.40
±0.19
37.36
±0.66
40.18
±0.91
39.92
±0.89
41.16
±0.69
39.64
±1.17
36.03
±0.24
38.19
±0.55C18:2 cis-
9,12
Linolenic1.97
±0.25
1.66
±0.09
1.83
±0.09
2.02
±0.26
1.54
±0.04
1.53
±0.15
1.68
±0.07
1.61
±0.13
1.35
±0.05
1.38
±0.05

The effect of microwave treatment on quality and oxidation stability of nuts and almondsh
Petra Škvorová, Lenka Kouřimská
Microwave treatment can be used for:
drying
pasteurization
sterilization
defrosting
tempering
baking
Microwave treatment (MWT) is based onthe ability of materials to absorb microwaveenergy and convert it to heat. It reduces thedrying time and improves the final productquality. Microwave treated food productsshowed better taste, colour, quality andnutritional value than those treated by othercommonly used methods.
MWT advantages: energy saving, shorter processing time and lower operating costs
MWT disadvantage: the uneven temperature distribution
Study design:
The microwave radiation caused the changes in the oxidation stability of the dry shell fruit (nuts and almonds). The changes primarily depended on the treated kind of sample and than on the storage conditions. However, it was found that the quality of hazelnuts and almonds treated with microwave radiation was still acceptable throughout their storage even at elevated temperatures. We can therefore assume that it will be preserved until the expiration date on the shelves in stores. The quality of peanuts was not good even before their treatment, and microwaves significantly accelerated their oxidation.
Results:
Microwave treatment in our samples caused statistically significant decrease in moisture content and increase in peroxide value.
The nuts were also darker after the MWT comparing to the control untreated samples.
three-month storage
microwave treatment nuts and almonds 2 × 4.2 kW, 120 s.
Nuts are often a part of our diet. They contain many health promoting substances. However, their quality and shelf life during affected by the length and temperature of storage and access to oxygen.
The aim of the study was to evaluate the effect of microwave radiation on nuts
quality and their stability against oxidation. peroxide value analysis
Conclusion:
The Research was a part of the project „Hygienization (sanitation) of food by non-chemical way (physical radiofrequency method), reg. No. 15/001/16220/563/000008, which was supported by the Rural Development Program.
Background:colour analysis
determination of dry matter
Department of Microbiology, Nutrition and Dietetics, Czech University of Life Sciences Prague
almonds, peanuts and hazelnuts
Peroxide value changes in peanuts Peroxide value changes in hazelnuts Peroxide value changes in almonds

BEHAVIOUR OF POLYPHENOLS AND ANTIOXIDANT ACTIVITY AFTER BOILING OF HEADS FROM A GLOBE ARTICHOKE IMPROVED GENOTYPE Tolaini V.1, Salazar Sanclemente K.C. 2, Crinò P. 1 (corresponding author: [email protected])
1 ENEA (Italian National Agency for New Technologies, Energy and Sustainable Economic Development) – Division Biotechnologies and Agroindustry - Laboratory Bio-products and Bio-processes, Casaccia Research Centre, Via Anguillarese 301 - 00123 Rome, Italy 2 Università Campus Bio-Medico di Roma, Via Alvaro del Portillo, 21 - 00128 Rome, Italy
The Mediterranean diet is characterized by a high consumption of different fruits and vegetables. The cultivation of globe artichoke (Cynara cardunculus var. scolymus L.) is widespread in many South-Europe and North-
Africa countries, and Italy is the main worldwide producer of this vegetable (389,813 tonnes according to FAOSTAT, 2018) with a wide germplasm. Immature flower heads (capitula) are rich in minerals, vitamins, dietary
fiber and phenolic compounds with many healthy properties (1). In particular, polyphenols are secondary bioactive metabolites responsible for the antioxidant activity and Cynara spp. are a good source of
hydroxycinnamic acids (chlorogenic acid, cynarin and 1,5-dicaffeoylquinic acid) and flavonoids (luteolin and apigenin) (2). Different factors can affect polyphenol content such as genotype, soil and climatic conditions,
crop management, harvest time (3). Furthermore, heat treatments tend to increase the concentration of phenolic compounds and the antioxidant capacity also in some vegetables (4). The inner portion of the artichoke
head (receptacle and inner bracts) is edible and traditionally used for many typical dishes, both as raw and cooked. Up to our knowledge, there are few data on the influence of heat treatment or cooking on polyphenols
and antioxidant capacity in globe artichoke heads (5).
The aim of our work was to investigate the behaviour of polyphenols and antioxidant activity in globe artichoke heads from improved genotype (IA) compared to a commercial one (CA), both as raw and boiled.
An increase of total polyphenols (Fig. 1) was shown in cooked heads: about 5 times higher in the
improved genotype and 2 times in the commercial one. This behaviour in boiled artichoke could be due to
the thermal destruction of cell walls and consequent polyphenols release, and the inactivation of
polyphenol oxidase (5).
Regarding antioxidant activity (Fig. 1), no difference between raw and boiled samples was detected,
probably due to the inactivation of other thermolabile antioxidant compounds.
About the polyphenols profile (Tab. 1), boiling determined an increase of phenolic acids, especially of
1,5-dicaffeoylquinic acid and cinarin, both important for human health (antioxidant, anticarcinogenic and
hepatoprotective activities, diuretic effects, protection of astrocytes from cell death, prevention of neuron
apoptosis in Alzheimer’s disease).
Artichoke heads are a rich source of polyphenolic compounds and
could be consumed as raw and cooked. Cooking process, however,
increases polyphenols content due to thermal destruction of cell
walls, suggesting also a probable better action of gastrointestinal
enzymes that could increase the bioavailability of these health
compounds (4).
Further chemical characterization of different genotypes could be
useful to exploit and valorise the wide Italian germplasm in breeding
programs.
RESULTS
chlo
roge
nic
aci
d
cina
rin
1,5-
dica
ffeoy
lqui
nic
acid
lu
teol
in-7
-
gluc
osid
e
lute
olin
apig
enin
raw IA sliced
heads
562.67 ±
20.13 b
nd 853.33 ±
22.03 b
7.93 ±
0.42 b
nd nd
boiled IA
sliced heads
698.67 ±
16.65 a
288.01 ±
7.11 a
1984.00 ±
62.86 a
nd 16.17 ±
1.87 a
nd
raw CA
sliced heads
478.53 ±
25.23 c
66.43 ±
1.86 c
857.33 ±
64.96 b
18.67 ±
4.43 a
nd nd
boiled CA
sliced heads
554.13 ±
50.60 b
81.87 ±
12.01 b
1856.00 ±
124.33 a
10.31 ±
1.82 b
4.16 ±
0.28 b
7.44 ±
0.71 a
CONCLUSIONS Tab. 1 - Polyphenols profile by HPLC (mg/100 g dry weight, nd= not detected)
MATERIALS AND METHODS
total polyphenols (Folin-Ciocalteu method)
antioxidant activity (DPPH assay)
polyphenols profile
(HPLC)
raw sliced heads
artichoke
head
edible part
boiled sliced heads
polyphenols extraction (methanol/water 80:20)
1.Lattanzio et al., 2009. Journal of Functional Foods, I, 131–144
2.Maietta et al., 2017. Food Research International, 100, 780–790
3.Lombardo et al., 2010. Food chemistry, 119, 1175–1181
4.Juániz et al., 2016. Food Chemistry, 197, 466–473
5.Ferracane et al., 2008. Journal of Agricultural and Food Chemistry, 56, 8601–8608
6.Llorach et al., 2002. J. Agriculture and Food Chemistry, 50, 3458-3464
ACKNOWLEDGMENT
Special thanks are addressed to Dr. Riccardo Aringoli for supplying the artichoke improved genotype.
0
1000
2000
3000
4000
5000
6000
7000
raw IA sliced heads boiled IA sliced heads raw CA sliced heads boiled CA sliced heads
Fig. 1 – Behaviour of total polyphenols and antioxidant activity
total polyphenols (mg/100 g dry weight) antioxidant activity (µmoli Trolox eq/100 g dry weight)
d
a
c
b
a a a a

ISOLATION AND IDENTIFICATION OF BACTERIA CAUSING MASTITIS IN
DAIRY SHEEP AND THEIR RESISTANCE TO ANTIBIOTICS
František Zigo1, Silvia Ondrášovičová1, Milan Vasiľ1, Ewa Pecka-Kielb2, Jolanta Bujok2
1University of Veterinary Medicine and Pharmacy, Košice, Slovak Republic
2Wrocław University of Environmental and Life Sciences, Poland
INTRODUCTIONMastitis is one of the most economically important diseases of dairy animals.
Great economic losses caused by clinical mastitis include reduced milk yield and
quality, costs of veterinary care and discarded milk. (Nielsen et al. 2010). However,
the majority of the economic losses caused by subclinical mastitis are due to
reduced milk production (Huijps et al. 2008).
Inflammation of the udder is generally results from interaction between a variety
of microbial infections and host responses in the udder. Milk and dairy products
made from mastitic milk may cause foodborne diseases, infections or intoxications
(Malinowski and Gajewski, 2009).
The predominant contagious pathogens involved in sheep mastitis are Staph. spp.
(Staph. aureus and Staph. epidermidis), Strep. spp. (Strep. agalactiae, Strep.
dysgalactiae, Strep. uberis and Strep. bovis), coliforms (mainly E. coli and
Klebsiella pneumoniae) and Actinomyces pyogenes (Vasiľ et al., 2009).
The aim of this study was to monitor the occurrence of bacterial agents causing
mastitis, forms of mastitis and antibiotic resistance in 300 ewes on a farm in Eastern
Slovakia.
MATERIAL AND METHODSThe localisation of the farm with 300 dairy sheep is in the east of Slovakia. The breeding consists of improved
Wallachian sheep, Lacaune sheep and their crosses. The farm consists of two stables, a hayloft, areas for the staff,
the milking parlour and a collection container for milk. The milking period starts in the middle of March after
lambing. Initially the sheep milk once a day (in the afternoon) when they still have their lambs. One month later,
in the middle of April the sheep are released onto pasture and the milking starts twice a day. The sheep will milk
twice a day until end of September, making the milking season approximately six months long.
Practical part of study and sampling was performed during three complex investigations at the beginning
(April), middle (June) and end (September) of the milking season. A thorough evaluation of udder health included
clinical examination, sensory analysis of milk from forestripping of each udder half followed by the assessment of
CMT (Indirect Diagnostic Test, Krause, Denmark). Next, were aseptically collected a milk samples for
bacteriological cultivation in accordance with the guidelines of the National Mastitis Council (2011).
Isolated bacteria from milk samples were tested in vitro by a disc method EUCAST (2009) by evaluation of the
zones of inhibition to grow on Mueller-Hinton agar after 24 hours incubation at 37 °C. To the test of sensitivity of
staphylococci to 9 antibiotics have been use test discs (OXOID Ltd., Basingstoke, Hants, UK). The choice of
antibiotics reflects the range of which is contained in a number of intramammary products to treat mastitis, which
are available in Slovakia.
CONTACT ADDRESS: MVDr. František Zigo, PhD., Institute of Animal
Breeding, University of Veterinary Medicine and Pharmacy, Komenského 73, 041
84 Košice, Slovak Republic,
e-mail: [email protected], phone: +421908689722
RESULTS
Graph 1: Occurrence of mastitis during three examinations
Table 1: Bacterial pathogens causing mastitis from all three samplings
Note: n - number of isolated bacteria of ewes
Table 2: Resistance of Staphylococcus spp. to tested antibiotic
DISCUSSIONThe incidence of mastitis in sheep farms are extremely variable. Fthenakis (2009)
found the occurrence of mastitis in sheep to be between 4-50%. In our study, the
incidence of mastitis at the beginning of the season was 23.8%, in the middle 25.3%
and at the end 33.3%. In all three cases, the most frequently diagnosed was the
subclinical form of mastitis. There was a significant increase in the number of
positive ewes as well as clinical mastitis at the end of the milking season (Graph 1).
In our study 225 (28.2%) samples out of 806 were positive for bacterial
pathogens causing mastitis. Staphylococci were most often isolated from positive
milk samples during all three monitoring periods. Coagulase-negative staphylococci
(CNS) and S. aureus was identified in 61.7% and 20% of all the positive samples,
respectively. In addition, Streptococcus sanguinis (11.2%) and Enterococcus
faecalis (7.1%) being the major bacterial cause from positive milk samples (Table
1).
From all tested positive milk samples, staphylococci were observed very high
resistance to Novobiocin (59.5%) and Penicillin (51.4%) with highest number of
bacterial isolates, followed by high resistency to Amoxycillin (35.1%) (Table 2). In
a study performed by Kunz et al. (2010) showed that of the 67 and 208 of S. aureus
and CNS strains, 31.3% and 8.2% were resistant to Penicillin, 29.9% and 1.0 % to
Ampicillin, 1.5% and 10.6% to Erythromycin and 3.0% and 7.7% to Tetracycline,
respectively. As in the study performed by Kunz et al. (16), isolated S. aureus from
investigated milk samples showed high resistance to Penicillin with 70% being
resistant. Up to 80 % of these bacteria were also resistant to Novobiocin, but none
were resistant to Ampicillin.
From all the CNS (23) that were tested for antibiotic resistance together, we can
conclude that they had very high resistance to Novobiocin, with 56.5% being
resistant. To Penicillin (39.1%) and Amoxicillin (34.7%), they showed high
resistance and to Ampicillin (17.4%) they had medium resistance.CONCLUSION
Antibiotic resistance is one of the important problems encountered in the treatment and control of mastitis.
Antibiotic susceptibility tests should be done to determine the effectiveness of drug that can be used for successful
treatment of diseases. Proper isolation and identification of the causative organism play significant role in
prevention and control of the intramammary infection. In our study a combinations of Streptomycin,
Ciprofloxacin and Tetracycline were the most effective antibiotics for control of mastitis.
Figure 1. Process of udder infection
Legend: 1 – Organisms invade the udder through teat canal, 2 – Migrate up the teat
canal and colonize the secretory cells, 3 – Colonized organisms produce toxic
substances harmful to the milk producing cells.
REFERENCES: References by authors.
Bacterial pathogens
April June September All three
samplings (n)
All three
samplings
(%)
n % n % n %
S. chromogenes3 1.4 26 8.7 30 10.1 59 7.3
S. epidermidis 6 2.9 11 3.7 15 5.0 32 4.0
S. aureus 26 12.4 13 4.3 6 2.0 45 5.6
S. schleiferi 7 3.3 20 6.7 4 1.4 31 3.8
S. intermedius 0 0 3 1.0 19 6.4 22 2.7
Strept. sanguinis2 1.0 0 0 8 2.7 10 1.3
S. hyicus 0 0 0 0 17 5.7 17 2.1
Ent. faecalis 6 2.9 3 1.0 0 0 9 1.1
Total 50 23.9 76 25.3 90 33.3* 225 28.0
Antibiotics AMP AML FOX NEO NV P S CIP TE
Patogens n % % % % % % % % %
S. schleiferi 8 13 25 0 0 88 0 0 0 0
S. intermedius 3 33 100 0 0 0 100 0 0 0
S. hyicus 1 0 0 100 0 100 0 0 0 0
S. epidermidis 6 50 66 0 0 33 83 33 0 0
S. aureus 10 0 20 20 40 80 70 0 0 0
S. chromog. 6 0 33 17 0 33 66 0 17 0
S. simulans 2 0 0 0 0 50 0 0 0 0
S. xylosus 1 0 0 100 0 100 0 0 0 0
Resistence (%) 13.5 35.1 13.5 10.8 59.5 51.4 5.4 2.7 0
Sensitive (%) 86.5 64.9 86.5 89.2 40.5 48.6 94.6 97.3 100
Total (n) 37 5 13 5 4 22 19 2 1 0
Value of R* M H M M VH VH L L N
*Value of resistance: N - negliable, VL – very low, L - low, M - medium, H - high, VH – very high, EH – extremely
high.
ACKNOWLEDGEMENTS: This work was supported by projects APVV
No. SK-PL-18-0088 and VEGA No. 1-0529-19.
Acrylamide is a contaminant present especially in baked and fried rich starchy food
products, such as french fries, bread, cookies and coffee. It is a product of the Maillard
Reaction formed during food processing, at high temperatures by the reaction between
free amine groups (amino acids/proteins) and the carbonyl group (sugars/carbohydrates).
Acrylamide is classified by the International Agency for Research on Cancer as a
carcinogenic substance to humans, and its quantification is essential to control the
exposure risk. Since the discovery of its presence in food, several studies have been
conducted to developed extraction procedures for acrylamide quantification. The present
study aims to develop a cleaning method suitable for several food matrices, like bread and
chips, followed by liquid chromatography coupled to a mass detector method (LC-MS/MS)
for acrylamide quantification. To achieve this aim, the use of solid-phase extraction and
several salts mixtures, such as QuEChERS type, was implemented.
Introduction
Regarding the extraction of acrylamide, the application of two different salts mixtures was
studied: magnesium sulfate, aluminum oxide and sodium chloride (mixture 2) and
magnesium sulfate, primary and secondary amine (PSA) and sodium acetate (mixture 1),
which remove the fat and purify the sample. A combined method with SPE Oasis HLB was
also tested. The D3-acrylamide internal standard was individually added to each sample
before extraction and clean-up. The method accuracy was demonstrated through the
evaluation of the recovery of analyte in samples spiked with acrylamide standard of known
concentration and also by the evaluation of the bias, using ERM-BD274 (74 ± 7 µg/kg). All
samples were analyzed in triplicate. For the detection and quantification of acrylamide, an
Ultra Performance Liquid Chromatographic coupled to a mass detector (UPLC-MS/MS) was
used.
Methodology
Referenceshttps://www.fda.gov/food/chemicals/acrylamide Commission Regulation (EU) 2017/2158 of 20 November 2017 establishing mitigation measures and benchmark levels for the reduction of the presence of acrylamide in food
A method for determination of acrylamide in bread by UPLC-MS/MSCopeto Sandra, Jesus Susana, Motta Carla, Coelho Inês, Castanheira IsabelDepartment of Food Safety and Nutrition, National Institute of Health Doctor Ricardo Jorge, Lisbon, [email protected]
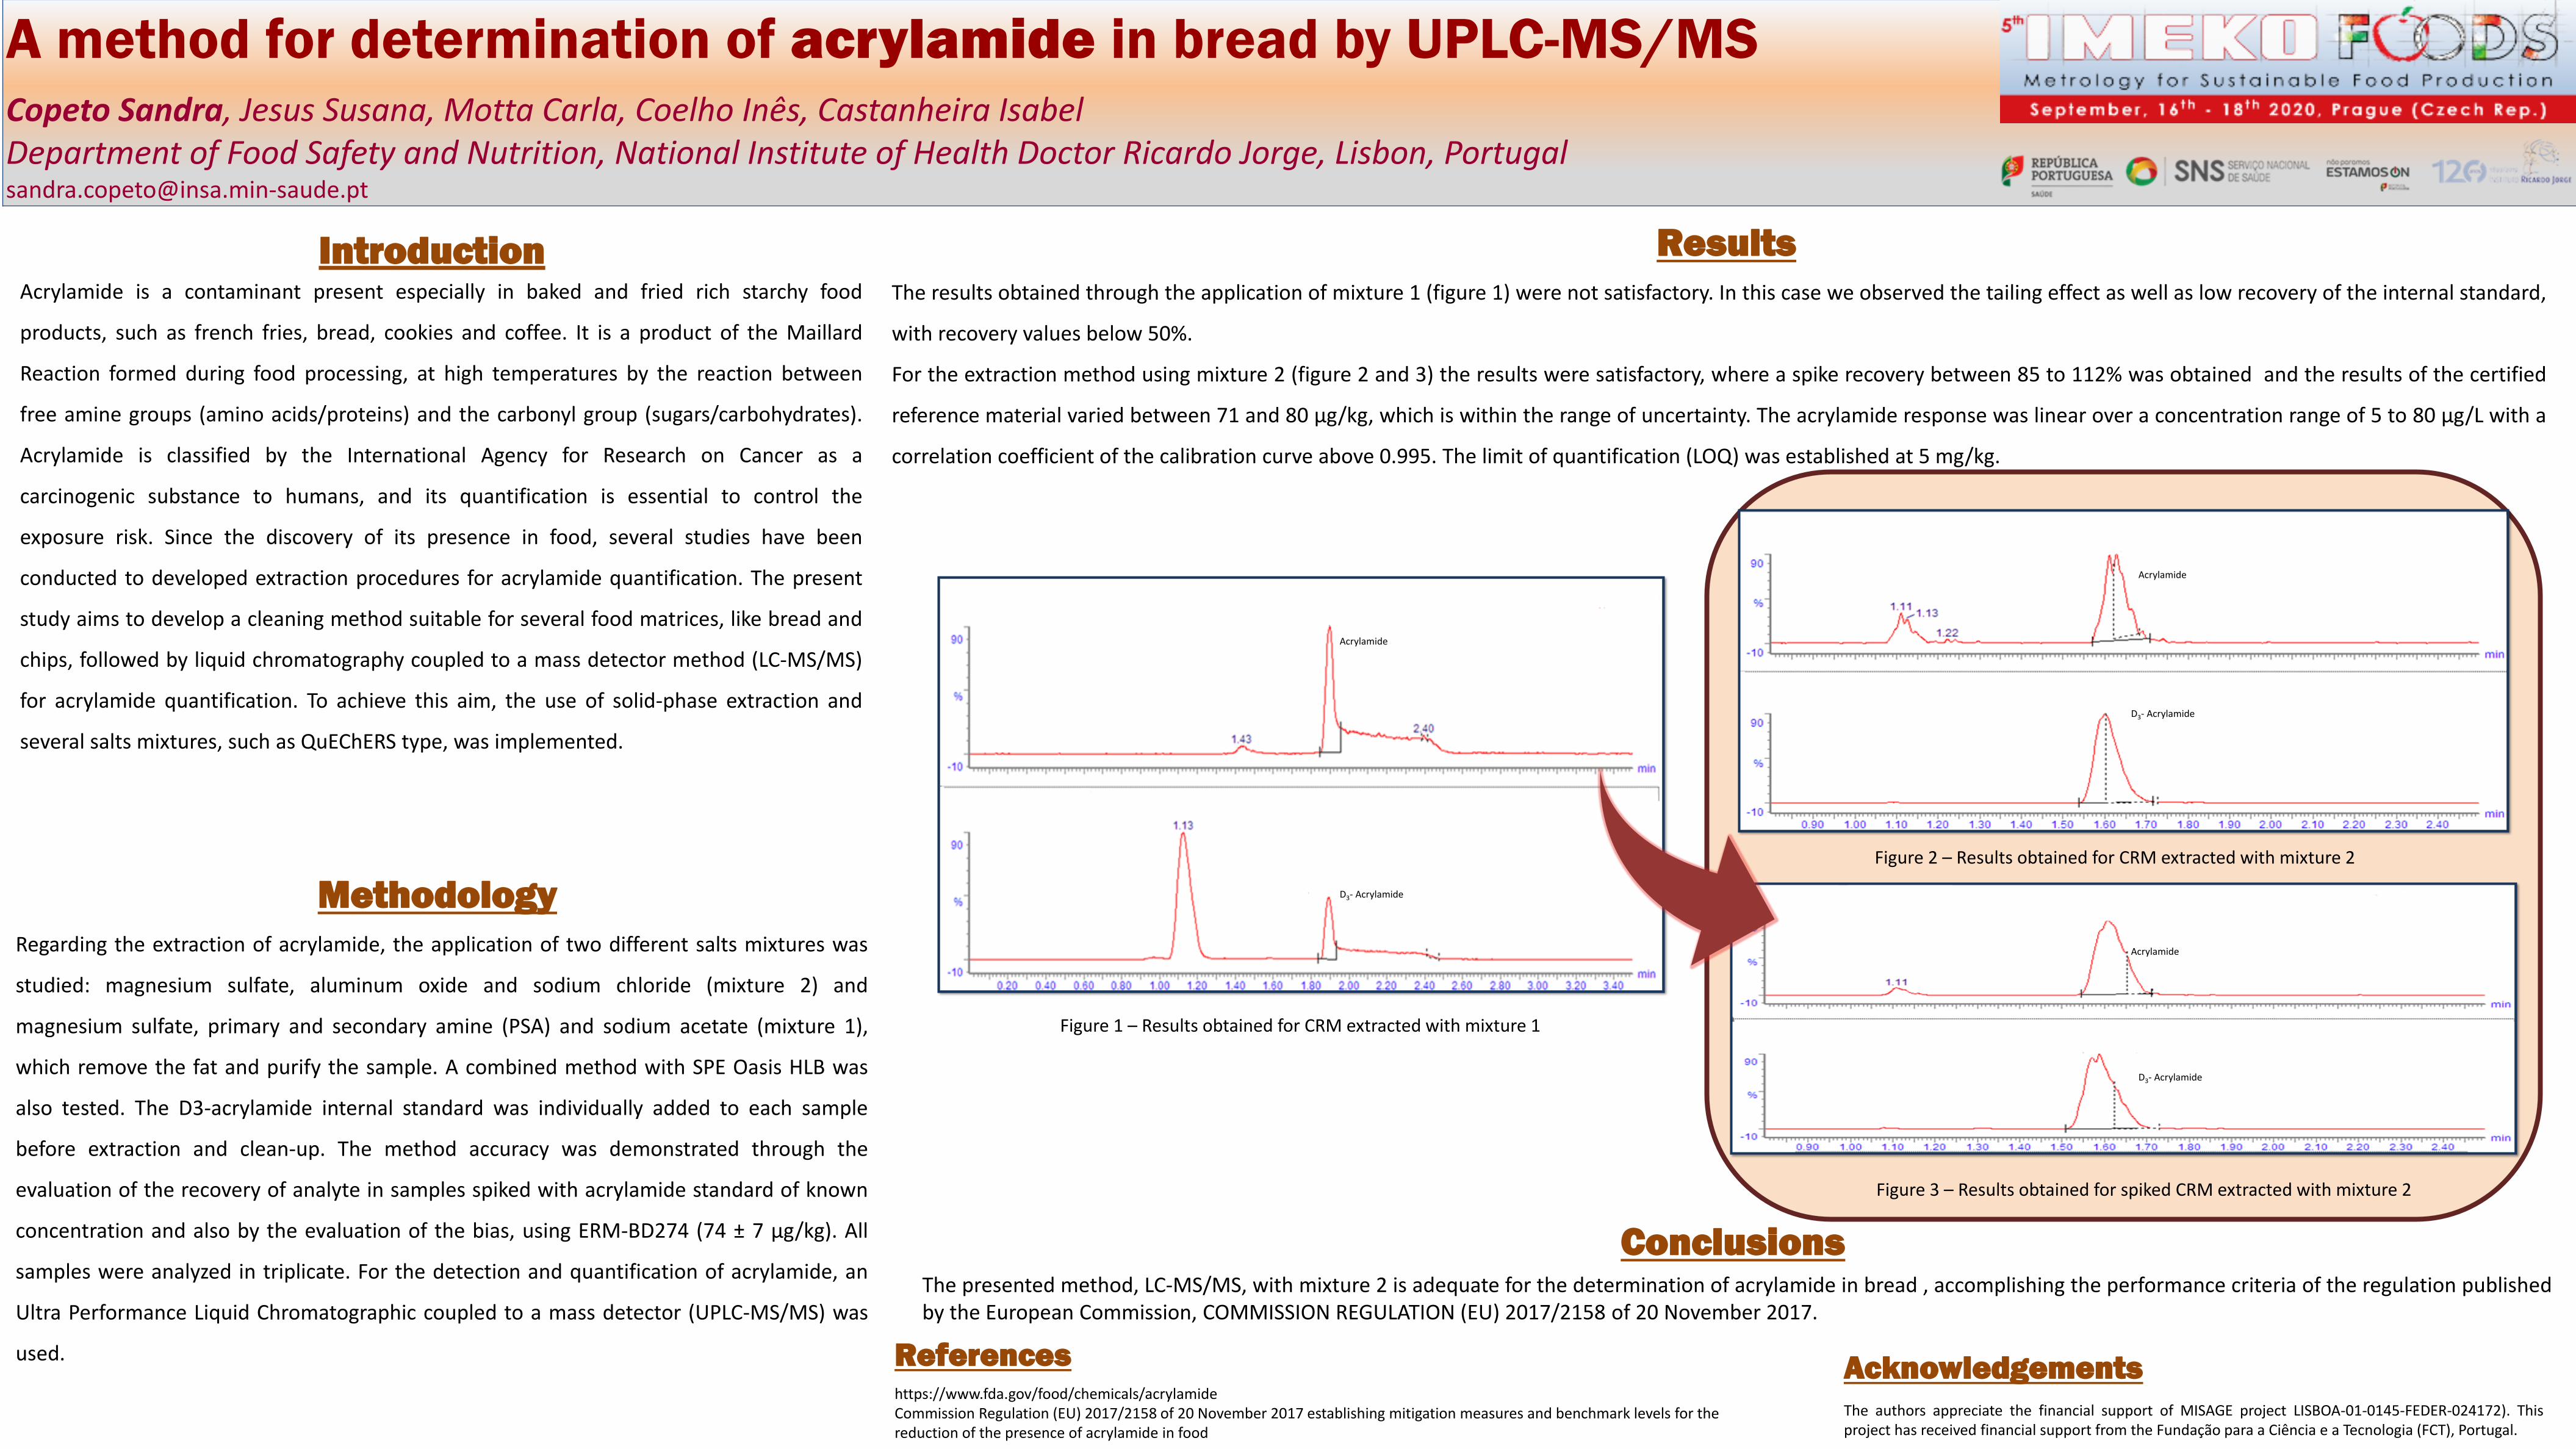
Results
The results obtained through the application of mixture 1 (figure 1) were not satisfactory. In this case we observed the tailing effect as well as low recovery of the internal standard,
with recovery values below 50%.
For the extraction method using mixture 2 (figure 2 and 3) the results were satisfactory, where a spike recovery between 85 to 112% was obtained and the results of the certified
reference material varied between 71 and 80 µg/kg, which is within the range of uncertainty. The acrylamide response was linear over a concentration range of 5 to 80 µg/L with a
correlation coefficient of the calibration curve above 0.995. The limit of quantification (LOQ) was established at 5 mg/kg.
The authors appreciate the financial support of MISAGE project LISBOA-01-0145-FEDER-024172). Thisproject has received financial support from the Fundação para a Ciência e a Tecnologia (FCT), Portugal.
Acknowledgements
ConclusionsThe presented method, LC-MS/MS, with mixture 2 is adequate for the determination of acrylamide in bread , accomplishing the performance criteria of the regulation publishedby the European Commission, COMMISSION REGULATION (EU) 2017/2158 of 20 November 2017.
Figure 1 – Results obtained for CRM extracted with mixture 1
Acrylamide
D3- Acrylamide
Figure 3 – Results obtained for spiked CRM extracted with mixture 2
Acrylamide
D3- Acrylamide
Figure 2 – Results obtained for CRM extracted with mixture 2
Acrylamide
D3- Acrylamide

Characterization of food from burnt areas in the Central Region of Portugal
INTRODUCTION: Forest fires constitute an environmental problem with adverse and diversified impacts on atmospheric, terrestrial, and aquatic ecosystems, with economic and social repercussions, and a significantimpact on flora. Fire mineralizes soil nutrients and returns plant-locked nutrients to the soil. Nutrients are lost from the ecosystem through the release of particulates and volatile compounds during the fire, and laterthrough surface transport and leaching by rains1. Wildfires can play an important role in the environmental distribution of major and trace elements, including through their mobilization by fire-induced runoff andassociated transport of soil and ash particles. Also, wildfires have been found to release and deposit contaminants on the soil surface, either directly by combustion of vegetation and mineralization of soil organic matteror indirectly through interactions of ashes. This fact can lead to the addition of potentially significant amounts of these elements in the soil and, thereby, can alter its chemical properties2.
AIM: This study aims to evaluate the content of arsenic (As), cadmium (Cd) and chromium (Cr) in cabbage, potatoes, eggs and fruit samples cultivated in recently burnt areas.
MATERIAL AND METHODS: A total of 24 pools composed of 3 samples each was analysed at threedifferent harvest periods. Cabbage samples from burnt zones were compared with a designated controlsample from a non-burnt zone. Analytical determinations were performed by Inductive Plasma CoupledMass Spectrometry (ICP-MS). Previously, samples underwent a heating block acid digestion with avalidated time and temperature program. Speciation analysis was carried out by High Performance LiquidChromatography (HPLC) coupled to ICP-MS. Before analysis, samples were extracted using nitric acid.Analyses were performed in accordance with ISO 17025:2005.
RESULTS: The concentrations of As in fruits and Cd in eggs were below the limit of quantification (2.2 µg/kgand 3.1 µg/kg, respectively). The variation of Cr content between matrices was as follows: fruits > eggs >cabbages > potatoes. On the other hand, As contents was verified as: cabbage > eggs > potatoes > fruit.Cabbage presented the highest Cd content, while eggs had the lowest values for this element. Whencompared to the control sample, the most pronounced rise was observed for As. Speciation studies show thatthe predominant arsenic species in cabbages are also the most toxic ones, that is, arsenite (As (III)) andarsenate (As (V)).
DigestionFreeze-dried
sample
ICP-MSThermo X series II
GrindingFreeze drying Vacuum packing
Sample preparation Multielementaranalysis
0
20
40
60
80
A1 B1 C1 D1 E1 F1 G1 H1 A2 B2 C2 D2 E2 F2 G2 H2 A3 B3 C3 D3 E3 F3 G3 H3
Conc
entr
atio
n (µ
g/kg
)
Arsenic
Cabbage Eggs Potatoes Fruits
Gueifão S.1,2, Moreira T.1, Ventura M.1, Delgado I.1, Coelho I.1, Castanheira I.1
1 Food and Nutrition Department, National Institute of Health Doutor Ricardo Jorge, I.P. (INSA), Avenida Padre Cruz 1649-016 Lisboa – Portugal2 Department of Chemical Engineering, Instituto Superior Técnico (IST), Av. Rovisco Pais, 1049-001 Lisboa – Portugal
[email protected]úde.pt
ACKNOWLEDGMENT: This work was funded by National Institute of Health Doutor Ricardo Jorge, I.P., under the project“Contaminantes químicos provenientes dos fogos florestais com impacte nos alimentos da região” (CONFFIAR).
Harvest 2Harvest 1 Harvest 3
0
20
40
A1 B1 C1 D1 E1 F1 G1 H1 A2 B2 C2 D2 E2 F2 G2 H2 A3 B3 C3 D3 E3 F3 G3 H3
Conc
entr
atio
n (µ
g/kg
) Cadmium
Cabbage Eggs Potatoes Fruits
Harvest 2Harvest 1 Harvest 3
CONCLUSIONS: The values of the inorganic elements present in this study are not yet properly legislated so it is important toperformed studies able to support future legal references. Monitoring studies based on accredited methods are a powerful aidin assessing the risk exposure of affected populations.
REFERENCES: 1.Wittkuhn, R. S., Lamont, B. B. & He, T.(2017): Combustion temperatures and nutrient transfers when grasstrees burn. For. Ecol. Manage. 399, 179–187 doi: 10.1016/j.foreco.2017.05.0372.Campos, I., Abrantes, N., Keizer, J. J., Vale, C. & Pereira, P.(2016): Major and trace elements in soils and ashes of eucalypt and pine forest plantationsin Portugal following a wildfire. Sci. Total Environ. 572, 1363–1376 doi: 10.1016/j.scitotenv.2016.01.190
HPLC-ICP-MS
020406080
100120
A1 B1 C1 D1 E1 F1 G1 H1 A2 B2 C2 D2 E2 F2 G2 H2 A3 B3 C3 D3 E3 F3 G3 H3
Conc
entr
atio
n (µ
g/kg
)
Chromium
Cabbage Eggs Potatoes Fruits
Harvest 2Harvest 1 Harvest 3

Sorry, authors did not provide poster

ACKNOWLEDGMENTThe authors appreciate the financial support of Project NewFood4Thought - PTDC/ASP-PLA/28350/2017.
REFERENCESꟷCabral, H. N. and Murta, A. G. (2002): The diet of blue whiting, hake, horse mackerel and mackerel off Portugal. Journal of Applied Ichthyology, 18, 14-23.ꟷMartins, M. M. (1996): New biological data on growth and maturity of Spanish Mackerel (Scomber japonicas) off the Portuguese coast (ICES Division IX a). Page International Council for the Exploration of the Sea. Lisbon, Portugal.
Mackerel seasonality effect on Se contentRego A.1, Ventura M.1, Gueifão S.1, Coelho I.1, Cardoso C.2, Afonso C.2, Bandarra N.2, Isabel Castanheira1
1 Department of food and nutrition, National Institute of health Doutor Ricardo Jorge, Lisbon 2 Portuguese Institute for Sea and Atmosphere, Lisbon
AIM Selenium (Se) is an essential micronutrient that can become toxic when ingested in high concentrations.The human being can obtain Se through the consumption of food, dietary supplements, water andexposure to ambient air. The food source is the most abundant and the main contributor to the dailyintake of Se.Fish is one of the best sources of Se, and the Portuguese Mackerel is one of the most important andabundant species in Portugal. It is rich in several vitamins and Se, due to being a predator. The workpresented integrates part of the first task of the project Newfood4thought that aims at the prevention ofcognitive decline through nutrient combination. The aim is to study of the influence of seasonality in thelevels of Se in Mackerel samples collected throughout the year.
RESULTS AND DISCUSSIONResults showed insignificant variation of Se content between months, ranging from 462 ± 27,5 μg/Kg to605 ± 27,5 μg/Kg, with an average of approximately 540 ± 45,8 μg/Kg except for a particular month, May.The Se content from May was significantly higher (715 ± 26,2 μg/Kg). Cabral et al. (2002) showed thatthe mackerel diet consisted mainly in zooplankton (rich in Se and other vitamins) in spring and summer,fish and decapods in autumn and decapod larvae in winter. Martins et. al. (1996) referred that in thePortuguese continental coast the spawning season of Spanish mackerel, runs between February toMarch and April to May.
MATERIAL AND METHODSMackerel samples were collected monthly, from March 2019 to December 2019, and prepared in tenpools.Se was determined by an inductively coupled plasma mass spectrometer (ICP-MS) preceded by aciddigestion in a graphite hotplate using a previously validated time and temperature program. All standardsand reagents were of high purity (over 99.5%).As quality control, a minimum of three replicate analyses was performed for each sample. Se calibrationcurve was made with no less than five standards in different concentrations with a correlation coefficientsuperior to 0.9995. Spiked samples and a certified reference material from fish muscle (ERM—BB422)were also used. All analyses performed were in accordance with ISO 17025:2017.For statistical analysis, One-Way ANOVA and the Least Significant Test were used.
CONCLUSIONSWith the exception of May, Se content in mackerel remained constant throughout the year. The high Secontent found in May samples may be related to mackerel´s spawning season and feeding habits.However, further studies are needed to confirm these preliminary conclusions, namely studying the Secontent monthly for several years.
Se
(μg
/Kg)

MERSEL FISH: ASSESSMENT OF THE MECHANISMS AND PATHWAYS OF FISH CONTAMINATION
AND MERCURY-SELENIUM ANTAGONISMRibeiro M.1,2,3, Zephyr N.1, Leufroy A.1, Coelho I.2, Danion, M.4, Castanheira I.2, Guerin T.1 and Jitaru P.1
1 Université Paris-Est, Anses, Laboratory for Food Safety, F-94700 Maisons-Alfort, France2 Department of food and nutrition, National Institute of health Doutor Ricardo Jorge, Lisbon
3 Structural Chemistry Center, Instituto Superior Técnico, University of Lisbon, Lisbon4 Agency for Food, Environmental and Occupational Health & Safety (ANSES), Ploufragan-Plouzané Laboratory, Fish Viral Pathology Unit, Technopôle Brest-Iroise, 29280 Plouzané, France
Mariana, MENDES RIBEIRO, September, 16-17, 2020. 01 49 77 26 90 – [email protected]

The main aim of the service is to transfer scientific knowledge anddemonstrate technical solutions to industrial food business operators on howto adapt/improve food processing technology to inhibit/minimize processcontaminants, specifically acrylamide, in bakery products. This will be realisedthrough on-site demonstration and training to bakery producers c/o IBA pilotplants in Bucharest, Romania.
Where? METROFOOD-RO National Node: National R&D Institute for Food Bio-resources - IBA Bucharest, Romania.
Open access to METROFOOD-RI services
METROFOOD-RI is an EU-funded ESFRI project, aiming toestablish a new distributed European Research Infrastructure(RI) to increase efficiency in food quality and food safety. Itstrives to provide and coordinate high-level metrologicalservices on a European scale for researchers, laboratories, foodinspection agencies and policymakers. As part of thepreparatory phase, three use cases have been proposed toprovide proof of concept of the METROFOOD-RI services. Two ofthese cases are aimed to get access to the physical facilities ofthe RI: (a) remote access to the Transmission ElectronMicroscope (TEM) facility for physicochemical characterizationof nanoparticles in food, and (b) physical access* to the foodpilot demonstrating technical solutions and adaptations of foodprocessing technology to minimize acrylamide in bakeryproducts. While a third case is related to (c) virtual access to e-services. Interested parties can have access to METROFOODservices via calls. Projects that align with the aims ofMETROFOOD-RI and meet the technical, scientific and ethicalrequirements, will be eligible. The calls for the physical facilities(a & b) are open.
(A) Remote access to the Transmission Electron Microscope (TEM) facility for
physicochemical characterization of nanoparticles in food
INTRODUCTION
www.metrofood.eu
METROFOOD-PP project has received funding from the European Union’s Horizon 2020 research and innovation programme under grant
agreement No. 871083
Subha Lakshmi Sharma1, Karine Vandermeiren
1, Nastasia Belc
2, Jan Mast
1, Karl Presser
3, Eveline Verleysen
1, Claudia Zoani
4, Joris Van Loco
1
AUTHOR AFFILIATION: 1Sciensano (Belgium),
2IBA (Romania),
3Premotec GmBH (Switzerland),
4ENEA (Italy)
USE CASES FOR OPEN ACCESS
This service is addressed to researchers engaged in nanoparticle analysis infood. Remote access to the TEM facility of Sciensano (Belgium), or training andanalytical assistance for the TEM will be provided. The service will make a high-end analytical TEM available for use by users who request analyses in thephysicochemical characterization of nanomaterials in food. It will be available atthree levels:
• Analyses performed by Sciensano operators• Training & analytical assistance by Sciensano
operators• Remote operation
Timeline (A & B):
(B) Physical access* to the food pilot demonstrator: how to minimize acrylamide
in bakery products
(C) Virtual access to e-services
The below two use cases are dedicated to the wide virtual access and will provide access to two different tools:C.1: Search engine for Reference Materials and Methods: The use case is mainly destined for researchers and lab workers and will provide access to an electronicsearch engine for: (a) Reference Materials (RM), and (b) Reference and official Analytical Methods (AM) related to bakery products and mycotoxin analyses.
C.2: Tool to integrate Total Diet Study (TDS) sample data with Monte Carlo Risk Assessment (MCRA): This service provides access to a tool that will facilitateresearchers, food inspection agencies, control agencies and policymakers to perform risk assessments based on analytical data obtained from Total Diet Studies(TDS). For this use case, an Application Programming Interface (API) will be developed, enabling seamless TDS data transfer to MCRA from FoodCASE or othercompatible databases.
Timeline:
• The current open calls for access for (A) remote access to the TEMfacility, and (B) Physical access to the food pilot demonstrator are openuntil 30/09/2020.
• More information on the open calls: https://www.metrofood.eu/access/open-call.html
• Open access registration form: TEM: https://sciensano2020.calls.metrofood.eu/Food pilot: https://iba2020.calls.metrofood.eu/
• Contact for open calls: [email protected]
FURTHER INFORMATION
*Due to the COVID-19 sanitary emergency, travel to the facilities might be subject to
restrictions.
Target users: Researchers engaged in nanoparticle analysis in food.
Where? Remote access to the facilities of or on-site assistance at Sciensano (Service Trace Elements and Nanomaterials), Uccle, Belgium.
Target users: Food business operators.
Other potential users: Official food safety control agencies, Policymakers, researchers, academia and students.
Design data model Data input, implementation & testing Access
01/’20 06/’20 01/’21 05/’21
Open callEvaluation
Access
05/’20 09/’20 10/’20 05/’21
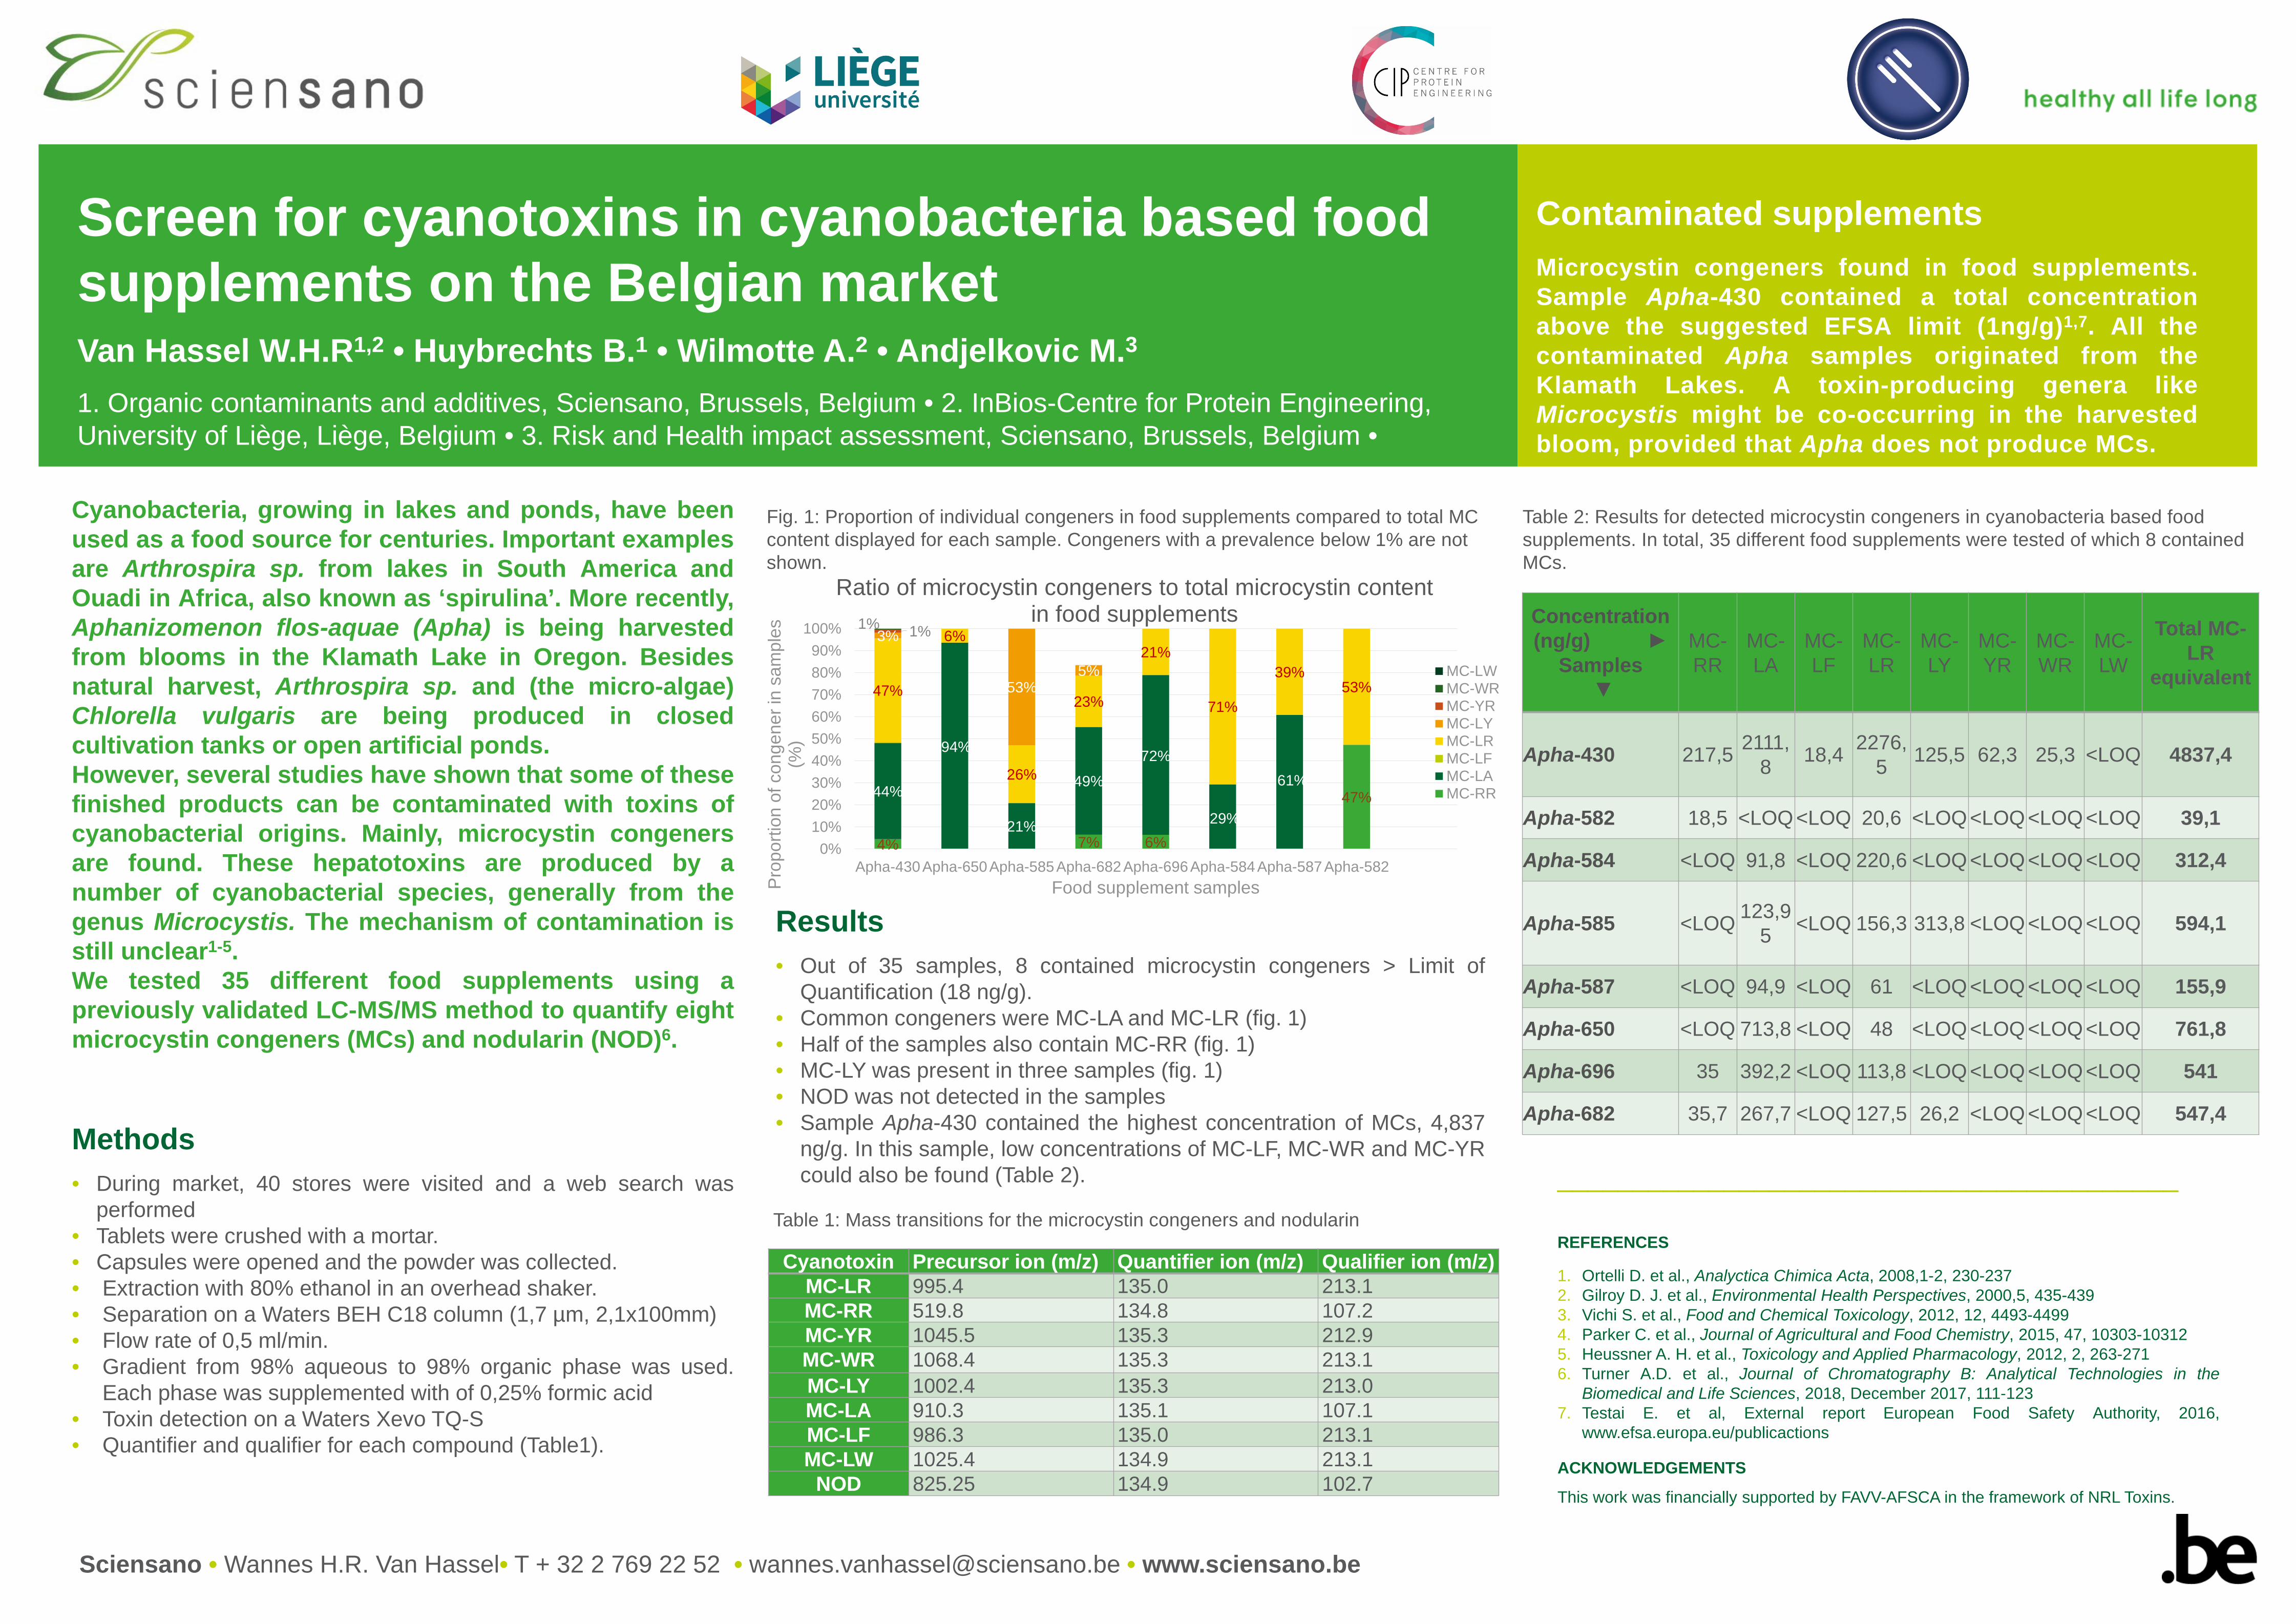
Results• Out of 35 samples, 8 contained microcystin congeners > Limit of
Quantification (18 ng/g).• Common congeners were MC-LA and MC-LR (fig. 1)• Half of the samples also contain MC-RR (fig. 1)• MC-LY was present in three samples (fig. 1)• NOD was not detected in the samples• Sample Apha-430 contained the highest concentration of MCs, 4,837
ng/g. In this sample, low concentrations of MC-LF, MC-WR and MC-YRcould also be found (Table 2).
Contaminated supplementsMicrocystin congeners found in food supplements.Sample Apha-430 contained a total concentrationabove the suggested EFSA limit (1ng/g)1,7. All thecontaminated Apha samples originated from theKlamath Lakes. A toxin-producing genera likeMicrocystis might be co-occurring in the harvestedbloom, provided that Apha does not produce MCs.
Screen for cyanotoxins in cyanobacteria based food supplements on the Belgian marketVan Hassel W.H.R1,2 • Huybrechts B.1 • Wilmotte A.2 • Andjelkovic M.3
1. Organic contaminants and additives, Sciensano, Brussels, Belgium • 2. InBios-Centre for Protein Engineering, University of Liège, Liège, Belgium • 3. Risk and Health impact assessment, Sciensano, Brussels, Belgium •
Cyanobacteria, growing in lakes and ponds, have beenused as a food source for centuries. Important examplesare Arthrospira sp. from lakes in South America andOuadi in Africa, also known as ‘spirulina’. More recently,Aphanizomenon flos-aquae (Apha) is being harvestedfrom blooms in the Klamath Lake in Oregon. Besidesnatural harvest, Arthrospira sp. and (the micro-algae)Chlorella vulgaris are being produced in closedcultivation tanks or open artificial ponds.However, several studies have shown that some of thesefinished products can be contaminated with toxins ofcyanobacterial origins. Mainly, microcystin congenersare found. These hepatotoxins are produced by anumber of cyanobacterial species, generally from thegenus Microcystis. The mechanism of contamination isstill unclear1-5.We tested 35 different food supplements using apreviously validated LC-MS/MS method to quantify eightmicrocystin congeners (MCs) and nodularin (NOD)6.
Methods• During market, 40 stores were visited and a web search was
performed• Tablets were crushed with a mortar.• Capsules were opened and the powder was collected.• Extraction with 80% ethanol in an overhead shaker.• Separation on a Waters BEH C18 column (1,7 µm, 2,1x100mm)• Flow rate of 0,5 ml/min.• Gradient from 98% aqueous to 98% organic phase was used.
Each phase was supplemented with of 0,25% formic acid• Toxin detection on a Waters Xevo TQ-S• Quantifier and qualifier for each compound (Table1).
_________________________________________
REFERENCES
1. Ortelli D. et al., Analyctica Chimica Acta, 2008,1-2, 230-2372. Gilroy D. J. et al., Environmental Health Perspectives, 2000,5, 435-4393. Vichi S. et al., Food and Chemical Toxicology, 2012, 12, 4493-44994. Parker C. et al., Journal of Agricultural and Food Chemistry, 2015, 47, 10303-103125. Heussner A. H. et al., Toxicology and Applied Pharmacology, 2012, 2, 263-2716. Turner A.D. et al., Journal of Chromatography B: Analytical Technologies in the
Biomedical and Life Sciences, 2018, December 2017, 111-1237. Testai E. et al, External report European Food Safety Authority, 2016,
www.efsa.europa.eu/publicactions
ACKNOWLEDGEMENTSThis work was financially supported by FAVV-AFSCA in the framework of NRL Toxins.
Cyanotoxin Precursor ion (m/z) Quantifier ion (m/z) Qualifier ion (m/z)MC-LR 995.4 135.0 213.1MC-RR 519.8 134.8 107.2MC-YR 1045.5 135.3 212.9MC-WR 1068.4 135.3 213.1MC-LY 1002.4 135.3 213.0MC-LA 910.3 135.1 107.1MC-LF 986.3 135.0 213.1MC-LW 1025.4 134.9 213.1
NOD 825.25 134.9 102.7
Table 1: Mass transitions for the microcystin congeners and nodularin
Fig. 1: Proportion of individual congeners in food supplements compared to total MC content displayed for each sample. Congeners with a prevalence below 1% are not shown.
4% 7% 6%
47%44%
94%
21%
49%72%
29%
61%
47%
6%
26%
23%
21%
71%
39%53%
3%
53%5%
1%1%
0%10%20%30%40%50%60%70%80%90%
100%
Apha-430Apha-650Apha-585Apha-682Apha-696Apha-584Apha-587Apha-582
Prop
ortio
n of
con
gene
r in
sam
ples
(%
)
Food supplement samples
Ratio of microcystin congeners to total microcystin content in food supplements
MC-LWMC-WRMC-YRMC-LYMC-LRMC-LFMC-LAMC-RR
Concentration (ng/g) ►
Samples▼
MC-RR
MC-LA
MC-LF
MC-LR
MC-LY
MC-YR
MC-WR
MC-LW
Total MC-LR
equivalent
Apha-430 217,5 2111,8 18,4 2276,
5 125,5 62,3 25,3 <LOQ 4837,4
Apha-582 18,5 <LOQ <LOQ 20,6 <LOQ <LOQ <LOQ <LOQ 39,1
Apha-584 <LOQ 91,8 <LOQ 220,6 <LOQ <LOQ <LOQ <LOQ 312,4
Apha-585 <LOQ 123,95 <LOQ 156,3 313,8 <LOQ <LOQ <LOQ 594,1
Apha-587 <LOQ 94,9 <LOQ 61 <LOQ <LOQ <LOQ <LOQ 155,9
Apha-650 <LOQ 713,8 <LOQ 48 <LOQ <LOQ <LOQ <LOQ 761,8
Apha-696 35 392,2 <LOQ 113,8 <LOQ <LOQ <LOQ <LOQ 541
Apha-682 35,7 267,7 <LOQ 127,5 26,2 <LOQ <LOQ <LOQ 547,4
Table 2: Results for detected microcystin congeners in cyanobacteria based food supplements. In total, 35 different food supplements were tested of which 8 contained MCs.
Sciensano • Wannes H.R. Van Hassel• T + 32 2 769 22 52 • [email protected] • www.sciensano.be

Lysozyme from chicken egg-white is known as one of the mostimportant allergens to date, especially in infants and children. Aninnovative sample treatment strategy involving magnetic aptamer-based oligoprecipitation of target proteins from complex food extractsfor efficient protein extraction is being developed to ensure liquidchromatography-tandem mass spectrometry-based determination ofhidden lysozyme in processed foods. For this purpose, the potential ofaptamer oligonucleotides as recently discovered recognition elementsalternative to antibodies is being studied.
0,0E+00
5,0E-06
1,0E-05
1,5E-05
2,0E-05
2,5E-05
3,0E-05
3,5E-05
4,0E-05
-4,00E-01 -2,00E-01 0,00E+00 2,00E-01
i (A
)
E (V)
Lyz 2 µM
Lyz 1 µM
Lyz 0,5 µM
Blank
Magnetic aptamer-based oligoprecipitation as innovative sample treatment strategy for food allergen determination: egg white
lysozyme as case study
Name Sequence (5’ – 3’) KD
Apt_80Apt_40
AGCAGCACAGAGGTCAGATGGCAGGTAAGCAGGCGGCTCACAAAACCATTCGCATGCGGCCCTATGCGTGCTACCGTGAA
2.8 ± 0.3 nM 1
Clone1_80Clone1_30
GGGAATGGATCCACATCTACGAATTCATCAGGGCTAAAGAGTGCAGAGTTACTTAGTTCACTGCAGACTTGACGAAGCTT 0.46 ± 0.04 μM 2
Target LC-MS/MS method for lysozyme
Unique lysozyme peptides were selected by DDA analysis and a target LC-MS/MS method was developed for lysozyme analysis
Aptamer immobilization (at 0.5, 1 and 2 μM) on the surface of
carboxyl-functionalized micro magnetic beads using a (5’)-
amino-C6 modified and (3’)-biotin-labelled sequences
Aptamer selection Protein extraction
1Han B. et al., J. Chromatogr. B (2012) 903:112-117; 2Kirby R. et al, Anal. Chem. (2004) 76:4066-4075
Toma L.1, Franzoni A.1, Mattarozzi M.1, Cavazza A.1, Giannetto M.1, Ronda L.2, Careri M.1
1 Dept. of Chemistry, Life Sciences and Environmental Sustainability, University of Parma, IT2 Dept. of Medicine and Surgery, University of Parma, IT
Aptamers Sequences selected from literature
Circular dichroism (CD) spectra were acquired as preliminary assessment of lysozyme-aptamer interaction.Protein and aptamer solutions were at the same concentration (10 µM)
Apt_80+Lysozyme Clone1_80+Lysozyme Apt_40+Lysozyme Clone1_30+Lysozyme
Magnetic beads functionalization
Electrochemical assay
Signal increase corresponding to a concentration attributable to a greater occupation of the available sites
Future perspectives
Selectivity of interaction between selected aptamers and lysozyme has to be verified in presence of different interferingcompounds. Non-denaturing extraction methods will be optimized using experimental design techniques. In the end, finalevaluations will concern compatibility between extraction method and lysozyme isolation by the aptamer. The approach also pavesthe way for protein extraction involved in emerging aptasensing platforms.
Necessity to assure maintenance of lysozyme structurewithout compromising the interaction with the aptamerreceptor, avoiding the denaturing conditions commonlyused in incurred materials and processed food analysis
Protein extraction carried out using athermostatic water bath, beat beaterand immersion probe sonication,testing two buffer solutions: TrisHCl20 mM pH=8.2 and ammoniumbicarbonate 50 mM pH=8
Bradford assay (280 nm)
0
0,05
0,1
0,15
0,2
0,25
0,3
0,35
0,4
Co
nce
ntr
atio
n(%
)
Biscuits
0
0,1
0,2
0,3
0,4
0,5
0,6
0,7
0,8Egg white (cooked)
Thermostaticbath
Immersionsonication
Bead beating
Sonication probe Beat-beater
Contact person: Lorenzo Toma, [email protected]

Samples were analysed by using the neutron flux produced by The Triga Mark II nuclear reactor at the University of Pavia.Two aliquots of each sample weighing about 100 mg were subjected to extraction by solubilization and solid residue filtration in order todecrease matrix interferences. The residue was irradiated for 6 hours under the neutron flux.Multi-standard dried solutions, blanks and CRMs (Certified Reference Materials) were submitted to the same procedure steps. Thespectrometry of the emitted gamma ray was accomplished during about 50 days. 35 elemental concentrations have been determined inevery sample (the mass results were expressed as μg/g of insoluble residue:Sm Mo Lu U Yb Au La As W Br Ga Na K Tm Ce Se Th Cr Hf
Nd Os Zr Cs Ni Tb Sc Rb Fe Zn Co Ta Eu Sb Ba MnThe concentration data were subsequently analysed by means of chemometrics with the aim to compare the samples with a multivariateapproach. Data uncertainties were included in the model using DATA EXPLOSION METHOD, based on Montecarlo simulation.
Characterization and discrimination of salt samples of different geographical areas and kind by Neutron Activation Analysis and chemometric methods Bergamaschi L. ,Mandrile L. ,Sacco A., Rossi A.M.
INRiM, National Institute of Metrological Research – Strada delle Cacce 91, Torino (Italy) Contact: Luigi Bergamaschi, e-mail: [email protected]
• high sensitivity, accuracy and precision,• possibility of multielemental analyses for pattern recognition,• can be used for analysis of micro-samples (few milligrams),• treatment of the samples such as dissolution are not required avoiding
contamination or losses.For all these reasons, NAA is a very useful multi-element analysis withminimum detection limits in the sub-ppm range providing an elementalfingerprint of the samples, which can be used for the specific recognition ofan unknown sample.
Neutron Activation Analysis (NAA)
Triga Mark II Nuclear Reactor
Samples preparation and analytical Method
Salt is an essential mineral for human health. It is one of the most common seasonings throughout the world, as it is used in many cultures. Salt is available on the market in numerous types: many of them have different colors and tastes, and are valuable food specialties for fine cuisine with different nutraceutical properties. From a chemical point of view, refined sea salt and peculiar mine salts present characteristic elemental compositions which influence the flavor and the commercial value.In this study, Neutron Activation Analysis (NAA) was applied on rock and sea salt samples of differentorigin and kind for the determination of major and trace elements. This technique allows todetermine more than 30 elemental concentrations, guaranteeing results traceable to the SI. Theelemental concentration were obtained to characterize the salts and point out possible nutrient orhazardous elements, as well as to figure out the elemental fingerprint of different mine salts for theirauthentication. Data were analysed by multivariate statistics, including in the chemometricmodelling, with the aim of discriminate the samples by geographical origin and salt kind.
Samples selection
Kuhn, T., Chytry, P., Souza, G. M. S., Bauer, D. V., Amaral, L., & Dias, J. F. (2020). Signature of the Himalayan salt. Nuclear Instruments and Methods in Physics Research Section B: Beam Interactions with Materials and Atoms, 477, 150-153.
Binder, K., Heermann, D., Roelofs, L., Mallinckrodt, A. J., & McKay, S. (1993). Monte Carlo simulation in statistical physics. Computers in Physics, 7(2), 156-157.
Greenberg R R, Bode P and De Nadai E A 2011 Neutron activation analysis: a primary method of measurement Spectrochim. Acta B 66 193–241
• Only Rock salts from Pakistan (Himalayan pink salts) present detectable traces Au, Mo and Ga traces.
• A variable reduction using PCA is possible to easily visualize differences in the elemental fingerprint of different salt samples, 3 PCs aresufficient to explain the most variability of the system (93.49 % CEV);
• Data explosion method was used to include data uncertainties in chemometric models: even though few samples were analyzed themodel results are valid and reliable since uncertainty of measurements was considered during the elaboration of the PCA model.
• The replicates are close in the PCs’ space, providing repeatability of the analytical procedure for element quantification; most importantly,after MC simulation, the clouds of points representing the probablity density distribution of the scores of replicates overlap, attesting thatthey are not statistically different if we consider their measurement uncertainty.
• Rock salts present peculiar features, different from all the Marine salts. Himalayan pink salt scores are all grouped in the low left quadrantof the PC1,2,3 space; the difference between rock and sea salts is well described on PC1 (red separation plane in the 3D scores plot). Ingeneral sea salts present a higher concentration of all detected metals in the insoluble residue analysed (higher scores on PC1)
• Pink Himalayan salts and black Hawaiian salt present common features on PC1 and PC2 (lower amount of all detected elements comparedwith the other sea salts), but they are differentiated by PC3, which is dominated by high concentration values of Br; Hawaiian red saltpresent very high scores on PC2 respect to all other samples (higher concentration of Cr, Ni, Co, Fe, Sc, Eu).
• By considering the uncertainty of measurements in the model we can confirm that the separation of the data in the PCA scores plot issignificant. Therefore, reliable considerations about the elemental composition of different salts can be done, even though the samplenumber is limited.
Comments and conclusions
References
Results
NAA is based on the conversion of stable atomic nuclei in radioactive nuclei by irradiation with neutrons. The obtainedradionuclides emits gamma radiation and the spectrometry of this radiation allow the elemental qualitative and quantitativeanalysis. The method is carried out by using high purity germanium detectors coupled with multi-channel analysers.NAA presents some important properties as:
5 Rokc Salts from Hymalaya: 4 Sea Salts from around the World:
SAMPLE NAME KIND AND PROVENIENCE PRODUCER SAMPLE TYPE MASS (g) aliquote 1 MASS (g) aliquote 2
FLF Pink Himalaya (Pakistan) Fior di Loto Fine salt 0,10398 0,10498
FLR Pink Himalaya (Pakistan) Fior di Loto Rock salt 0,09056 0,09361
CDS Pink Himalaya (Pakistan) Casa del Sale Coarse salt 0,08811 0,08571
RAV Pink Himalaya (Pakistan) Raab Vitalfood Coarse salt 0,09302 0,09217
AIL Pink Himalaya (Pakistan) Ananda-Inner Life Fine salt 0,10467 0,11977
BLA Sea Black Hawaii Damune Coarse salt 0,03531 0,03686
RED Sea Red Hawaii Damune Coarse salt 0,05182 0,04096
MAD Sea salt, Delta dell' Ebro (Spain) Damune Coarse salt 0,00214 0,00211
MAT Sea salt, Trapani (Italy) Saline di Trapani Coarse salt 0,00306 0,00288
Analytical data are traceable to SI by using CRMs and methods under INRIM quality system. Furthermore data quality are guaranteed by the participation ininternational comparisons, certification of CRMs related to food, human health, nutrition and environment. This metrological activities have been allowed byINRIM to issue CMCs (Calibration and Measurement Capabilities) for food analytes, internationally recognized by MRA (Mutual Recognition Arrangement).
PC1,2,3 loadings
DATA EXPLOSION:Perform Monte Carlo (MC)simulation to extract 104 datafrom the probability densityfunction of data (appropriatedistribution based on type A andB uncertainty, Gaussian orrectangular in this case)
PCA scores plot, using the best estimates onlyPCA scores plot, considering the uncertainty
of each measurement
RELIABLE AND INFORMATIVE RESULTS CAN BE OBTAINED IF THE UNCERTAINTY OF MEASUREMENTSIS INCLUDED IN THE MODEL, EVEN THOUGH A HIGH NUMBER OF SAMPLES IN NOT AVAILABLE.
Himalayan pink saltsBlack Hawaiian sea saltRed Hawaiian sea saltWhite sea salts
Himalayan pink saltsBlack Hawaiian sea saltRed Hawaiian sea saltWhite sea salts
Each sample is represented by a cloud of 104 points extractedrandomly from the probabilitydensity function of its best estimate.
Abstract

B U I L D I N G A D A T A B A S E F O R P R O V E N A N C E S T U D I E S O F O R I G I N W I N E S F R O M T H E D O U R O V A L L E YCoelho I.1, Matos A.2, Nascimento A. 1, Bordado J. 3, Donard O. 4, Epova E. 5, Barre J. 5, Berail S. 4, Castanheira I.1
1 Dep. of Food and Nutrition, National Institute of Health Doutor Ricardo Jorge, Portugal; 2 UNIDEMI, Dep. de Engenharia Mecânica e Industrial, Faculdade de Ciências e Tecnologia, Universidade Nova de Lisboa; 3 CERENA, Dep. de Engenharia Química e Biológica, Instituto Superior Técnico, Universidade de Lisboa;
4 MARSS-IPREM, Center of Mass Spectrometry for Reactivity and Speciation Sciences, Université de Pau et des Pays de l'Adour, France; 5Advanced Isotopic Analysis, Hélioparc, Pau, France
Introduction Port and Douro wines are produced within
the same geographical area, the Douro Valley, but follow
different vinification procedures; leading to distinct end
products. The mineral composition of plants reflects the
soil and the environmental conditions under which plants
were grown. Minerals and trace elements, as well as their
isotopes, are potential biomarkers in authenticity studies.
Two analytical strategies, multielemental analysis and
stable isotopes, were used and combined with
chemometric tools to characterize the geographical
region and both wines.
Aim To produce high quality analytical data suitable for
evaluating the provenance of Port wine and Douro wine
and integrating an authentic wine reference database.
Material and Methods Fifteen samples of each type of wine, Port and Douro, were characterized for 26 elements. Li, Be,
B, Al, Cr, Mn, Co, Ni, Cu, Zn, As, Se, Rb, Sr, Mo, Ag, Cd, Sn, Tl, Pb, Fe, Mg , P , Ca , Na , K), by ICP-MS and ICP-OES; and two
isotopic systems: 87Sr/86Sr and 18O determined by MC-ICP-MS and IRMS, respectively. Analytical results were combined
with chemometric tools, Principal Components Analysis (PCA) and Hierarchical Cluster Analysis (HCA), capable of
performing multivariate data analysis.
Results Ag, Cd and Tl were mostly below the
level of quantification and were therefore
removed from statistical analysis. 87Sr/86Sr
varied between 0,71652 and 0,72290. Cr was
significantly higher in Port wine (Fig 1). PCA
revealed 6 principal components that
explained 84,6% of the total variance (Fig 2).
Conclusions The vinification method did not affect significantly stable isotopes, either 87Sr/86Sr or 18O. On the other hand,
some elements; namely Cr, Co, Cu, Rb, Se, Ca and Na; showed significant differences between the two types of wine. The
produced data can be integrated into an authenticity system for Port and Douro wines.
Acknowledgments The authorswould like to thank the Porto andDouro wines Institute forproviding the samples.
Fig 1 – Variation of Cr content between to type of wine
Fig 2 – Score plot for wine samples (Douro wine inblue and Port wine in green).

Barley Two-row barley
Varieties: Blaník, Bojos, Francin, Laudis 550, LG Monus,Malz, Manta, Petrus, Radegast, Vendela, Zhana
Barley varieties are derived from cultivated varieties approved by the CzechAgricultural and Food Inspection Authority in Brno and recommended bythe Research Institute of Brewing and Malting in Prague.
Malt Pale malt also known as "Pilsener malt"
Lower proteolytic and cytolytic modification and the degree of attenuation resulting in th presence ofresidual extract
Hop Recommended varieties:
Saaz, Saaz late, Saaz special, Sládek, PremiantHop varieties are derived from cultivated varieties approved by the CzechAgricultural and Food Inspection Authority in Brno and recommended bythe Research Institute of Brewing and Malting in Prague.
Ratio of α and β bitter acid concentration is 1 : 1,5 (in comparison with the other hops 2,5 : 1)
β - farnesene content of 14 - 20% of the total essential oils
Water From local sources
Soft to medium hardness
Brewer‘s Yeast Bottom-fermentating yeast
Saccharomyces pastorianus
Yeast are included in the collection of reproduction strains of brewer‘s yeast of
the Brewing Yeasts in the Research Institute of Brewing and Malting in Prague under registration No RIBM 655 - they are available to all producers of Czech beer.
References:OLŠOVSKÁ, Jana, Pavel ČEJKA, Karel SIGLER a Věra HÖNIGOVÁ, 2014. The Phenomenon of Czech Beer: a review. Czech Journal of Food Sciences. 32(4), 309-319.OLŠOVSKÁ, Jana, Pavel ČEJKA, Karel ŠTĚRBA, Martin SLABÝ a František FRANTÍK, 2017. Senzorická analýza piva. 1. Praha: Výzkumný ústav pivovarský a sladařský. ISBN 978-80-86576-74-9.COMMISSION REGULATION (EC) No 1014/2008 of 16 October 2008 entering certain names in the Register of protected designations of origin and protected geographical indications (České pivo (PGI), Cebreiro (PDO)).COUNCIL REGULATION (EC) No 510/2006 of 20 March 2006 on the protection of geographical indications and designations of origin for agricultural products and foodstuffs.
Protected Geographical Indication „České pivo“Karolína Drábková1,2, Tomáš Vrzal1, Jana Olšovská1
1 Research Institute of Brewing and Malting, PLC (RIBM), Prague, CZ.
2Department of Microbiology, Nutrition, and Dietetics, Czech University of Life Sciences, Prague CZ. e-mail: [email protected]
Production
Why?
Chemical proporties
Beer is considered a traditional national beverage honoured as a part of the cultural heritage in the Czech Republic.
The traditional Czech lager of the Pilsen type differs from the others by its specific sensory properties, such as
higher bitterness and fullness. These properties are closely correlated with its specific chemical composition, which
is given by the typical production technology and the use of local raw materials. To protect the specific character of
the Czech beer, an application for a trademark was submitted by members of the Association of Breweries and
Malthouses in 2008. Therefore, beer meeting the conditions set out in application on the Protection of
Geographical Indications and designations of origin (PGI) for agricultural products and foodstuffs may beer the
trademark "České pivo, CHZO“ (in English „Czech Beer, PGI“). Currently, 97 beers from 20 breweries beer this
designation.
Raw material appropriate for production
Protected Geographical Indication „České pivo“
It guarentees the autenticity of traditional Czech beer
It guarantees a market stability and protection against unfair competition
It guarantees to consumers the preservation of sensory properties
It guarantees suppliers of raw materials a stable demand of raw material suitable for the production of Czech beer
Figure 2. from Sensory of Czech beer (Olšovská et al. 2017)
Beer production process
Malt millMash mixer Mashing
pan
Fermentation tun
Wort cooler Whirlpool Wort kettle Lautertun
Lager tank Beer filter Bottling beer
Expedition
Table 1. Qualitative parameters for malt
Qualitative parameters
Extract in dry malt min 80 % (% w/w)
Kolbach Index 39 ± 3 %
Diastatic power min 220 WK units
Actual attenuation max max. 82 %
Friability min 75 %
One to three mashing process
At least 80 % ofthe total malt gristin made up of malt
produced fromapprovedvarieties.
The minimum quantity of Czech hops or productsprocessed fromthem is 30 % for
pale lagers and least 15 % for other types
of beer.
At the wort boilingan evaporation
rate of at least 6 % must be achieved.During this phase, witch takes 60 to
120 minutes.
Brewer's yeastused exclusively forbottom fermenting
(Saccharomyces pastorianus).
1.fermentation takesplace at a maximum
temperature of14 °C
(fermentation).
Sensory of the Czech beer
Figure 1. Beer production process (Czech Association of Breweries and Malthouses)
Table 2. Quality parameters forbeer
Quality parameters
Pale lager Dark lager Pale draught Dark draught Light beer
Original hoppedwort extract (% w/w)
11,0 – 12,99 11,0 – 12,99 8,00 – 10,99 8,00 – 10,99 max. 7,99
Alcohol content (% v/v) 3,8 – 6,0 3,6 – 5,7 2,8 – 5,0 2,6 – 4,8 2,6 – 3,6
Colour (EBC units) 8 – 16 50 – 120 7 – 16 50 – 120 6 – 14
Bitter substances (EBC units)
20 – 45 20 – 45 16 – 28 16 – 28 14 – 26
pH value 4,1 – 4,8 4,1 – 4,8 4,1 – 4,8 4,1 – 4,8 4,1 – 4,8
Difference between apparent and actualattenuation (% rel.)
1,0 – 9,0 2,0 – 9,0 1,0 – 11,0 2,0 – 11,0 1,0 – 11,0
Polyphenols (mg/l) 130 – 230
The secondaryfermentationproces takes
place attemperaturesclose to 0 °C.
Fermentationtechnological
proces is normalyseparated from
secondaryfermentation, i.e.
two-stagefermentation.
Low intensity of diacetyl (butter)
Low intensity of malty
Gently bitterness with long after taste
Hoppy
Fulness and bready
Medium sharpness (carbonation)

5th IMEKOFOODS Metrology for sustainable food produztion, Prague (CZ), 16th – 18th September 2020
Simone Fortunati1, Marco Giannetto1, Andrea Rozzi1, Roberto Corradini1, Maria Careri1 1Department of Chemistry, Life Sciences and Environmental Sustainability, University of Parma, Parco Area delle Scienze 17/A, 43124 Parma, Italy [email protected]
Target DNA
sequenceLOD / LOQ
Linear
response
range
Validation on
genomic DNA Reference
Event specific RR
Soybean sequence
and lectin gene
soybean sequence
650 fM
(RRsequence)
190 fM (lectin
sequence)
2 - 250 pM Not performed
Manzanares
Palenzuela et al.
[3]
MON810 GM
Maize
150 pM / 500
pM0.25 - 2.5 nM
Performed with
PCR amplificationFreitas et al. [4]
Cor a 9 hazelnut
allergen720 fM / 2.4 pM 2.4 – 750 pM
Performed with
PCR amplification
Montiel et al.
[5]
HMGA maize gene 90 pM / 310 pM 0.5-5 nMPerformed with
PCR amplificationSousa et al. [6]
RR soybean 415 fM / 995 fM 25 pM – 3 nM
Performed on non-
amplified genomic
DNA extracts
Current work
[7]
Aim
Assay procedure
ConclusionsAnalytical Performance
Validation
In this study an electrochemical genosensor aimed at the detection of GM Roundup Ready soy DNA is proposed. The genosensing assay is based on the exploitation of PNA-based probes. PNAs[1] are a class of DNA mimic composed of a 2-aminoethyl glycine backbone where a nucleobase is inserted on each amino acid. Due to the neutrality of its backbone, PNA-DNA duplexes result more stable than the analogous DNA-DNA complex.
Furthe Furthermore, it was chosen to employ magnetic microbeads as immobilization substrate, which offer improved functionalization yields, also thanks to quick and efficient washing through magnetic separation, and the lack of non-specific interactions with oligonucleotide probes.
The genoassay proposed is based on the formation of a sandwich complexbetween the PNA capture probe (CP) bound to the mMB, the target DNAsequence and a PNA signalling probe (SP) labelled with biotin. The generation ofthe electrochemical signal is obtained thanks to the presence of the SP, in factthe biotin interacts with the streptavidin present in an enzyme conjugate withalkaline phosphatase, subsequently the enzyme substrate hydroquinonediphosphate is added and processed to hydroquinone. Finally the hydroquinone
is electrochemically oxidized to quinone, yielding a signal proportional to the amount of sandwich complex formed on the surface of the mMBs.
The oxidation of thehydroquinone was performed byconfining the mMBs on screen-printed electrodes (SPEs) andsubsequently apply a DPV scan.The analytical performance of themethod were assessed byemploying a synthetic target DNAand all-carbon SPEs (C-SPEs) werecompared carbon nanotubes-modified SPE (SWCNT-SPEs) asreadout substrates.readout substrate. On C-SPEs a linear response range spanning from target
concentration 25 pM to 4 nM was observed, with a LOD of 8,2 pM and a LOQ of 27 pM.On SWCNT-SPEs the linear response range spans from 1 pM to 3 nM, with a LOD of 415 fM and a LOQ of 995 fM. It was observed that the exploitation of nanostructured substrate for the readout step led to an increase in the sensitivity approximately 2,5 times higher than that measured on C-SPEs
A validation of the method on real samples was carried out by employing Europeanreference material soy flours. In particular the genomic DNA was extracted from soyflours containing different percentages of Roundup Ready soy in wild-type soy, namely10 % and 1% and the results were compared with the signals given by wild-type soy.Performing the sandwich magneto-genoassay with the genomic extracts, a statistically significant (p<0,001) difference was observed among the three levels. Furthermore, by comparing these with the results obtained on previous studies[2] performed in absence of mMBs, a consistently higher signal for the 10% level was observed due to the lack of non-specific signals.
By comparison with other recently published magnetogenoassay aimed at assessment of food safety and authenticity, the method presented offers better LOD, wider linearity range and, most importantly, can be directly applied to non-amplified genomic DNA extracted from food samples, whereas all other methods require a pre-amplification step involving PCR techniques. Regarding food authenticity, the European Union imposes mandatory
mandatory labelling for all the products containing a percentage of GM material greater th greater than 0.9%[8]. To this aim, considering the capability
of the magnetogenoassay to discriminate between wild-type and 1% Roundup Ready soy DNA extracts, theproposed method can be employed to assess theconformity of food samples to European legislative limit interms of GM material content.
References
[1] A. Manicardi, A. Rozzi, S. Korom, R. Corradini, Supramol. Chem. 29 (2017) 784–795.[2] S. Fortunati, A. Rozzi, F. Curti, M. Giannetto, R. Corradini, M. Careri, Biosens. Bioelectron. 129 (2019) 7-14.[3] C.L. Manzanares-Palenzuela, N. de-los-Santos-Álvarez, M.J. Lobo-Castañón, B. López-Ruiz, Biosens. Bioelectron., 68 (2015) 259-265.[4] M. Freitas, M. Sá Couto, M.F. Barroso, C. Pereira, N. de-los-Santos-Álvarez, A.J. Miranda-Ordieres, M.J. Lobo-Castañón, C. Delerue-Matos,, ACS Sens., 1 (2016) 1044-1053.[5] V.R.V. Montiel, R.M. Torrente-Rodríguez, G.G. de Rivera, A.J. Reviejo, C. Cuadrado, R. Linacero, F.J. Gallego, S. Campuzano, J.M. Pingarrón, Sensor. Actuat. B-Chem. 245 (2017) 895-902.[6] [30].J.B. Sousa, J. Ramos-Jesus, L.C. Silva, C. Pereira, N. de-Los-Santos-Álvarez, R.A. Fonseca, R. Miranda-Castro, C. Delerue-Matos, J.R.D. Santos Junior, M.F. Barroso,. Talanta, 206 (2020) 120220.[7] S. Fortunati, A. Rozzi, M. Giannetto, R. Corradini, M. Careri, Article submitted.[8] European Regulation, C. (2003). No 1830/2003. Official Journal, 50, 268.

Sorry, authors did not provide poster
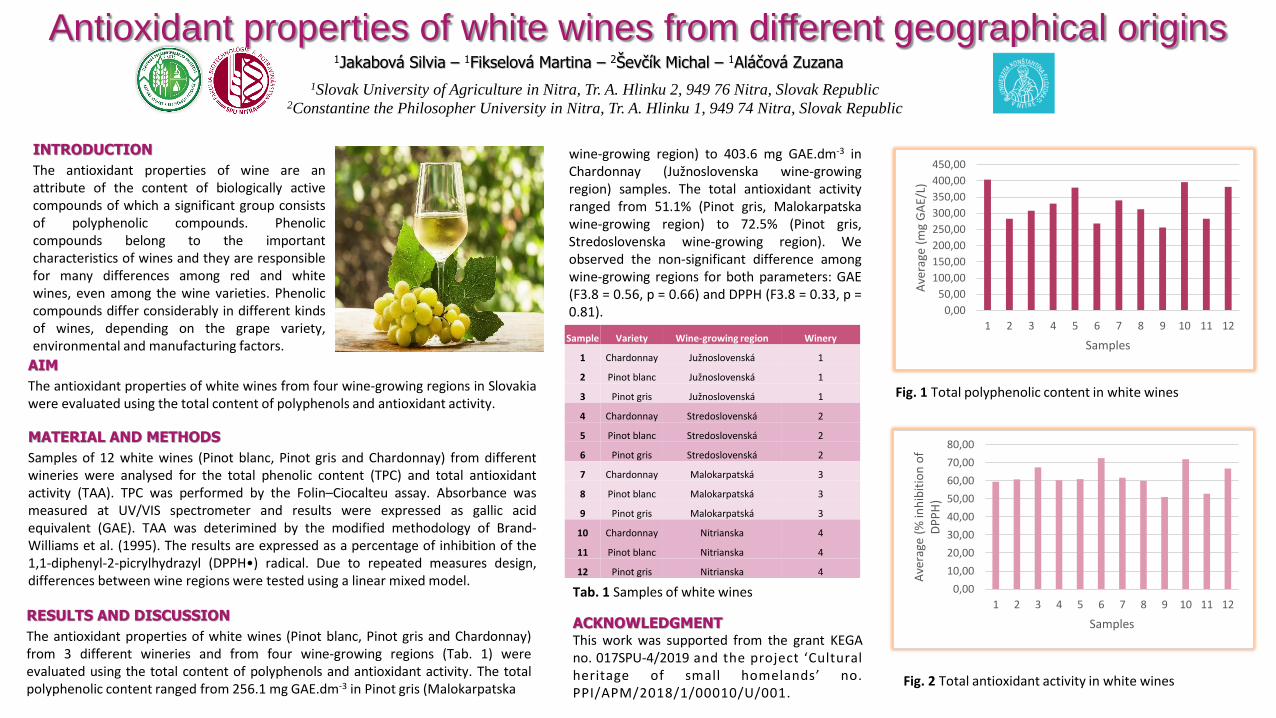
Antioxidant properties of white wines from different geographical origins1Jakabová Silvia – 1Fikselová Martina – 2Ševčík Michal – 1Aláčová Zuzana
1Slovak University of Agriculture in Nitra, Tr. A. Hlinku 2, 949 76 Nitra, Slovak Republic2Constantine the Philosopher University in Nitra, Tr. A. Hlinku 1, 949 74 Nitra, Slovak Republic
INTRODUCTION
The antioxidant properties of wine are anattribute of the content of biologically activecompounds of which a significant group consistsof polyphenolic compounds. Phenoliccompounds belong to the importantcharacteristics of wines and they are responsiblefor many differences among red and whitewines, even among the wine varieties. Phenoliccompounds differ considerably in different kindsof wines, depending on the grape variety,environmental and manufacturing factors.
AIM
The antioxidant properties of white wines from four wine-growing regions in Slovakiawere evaluated using the total content of polyphenols and antioxidant activity.
MATERIAL AND METHODS
Samples of 12 white wines (Pinot blanc, Pinot gris and Chardonnay) from differentwineries were analysed for the total phenolic content (TPC) and total antioxidantactivity (TAA). TPC was performed by the Folin–Ciocalteu assay. Absorbance wasmeasured at UV/VIS spectrometer and results were expressed as gallic acidequivalent (GAE). TAA was deterimined by the modified methodology of Brand-Williams et al. (1995). The results are expressed as a percentage of inhibition of the1,1-diphenyl-2-picrylhydrazyl (DPPH•) radical. Due to repeated measures design,differences between wine regions were tested using a linear mixed model.
Sample Variety Wine-growing region Winery
1 Chardonnay Južnoslovenská 1
2 Pinot blanc Južnoslovenská 1
3 Pinot gris Južnoslovenská 1
4 Chardonnay Stredoslovenská 2
5 Pinot blanc Stredoslovenská 2
6 Pinot gris Stredoslovenská 2
7 Chardonnay Malokarpatská 3
8 Pinot blanc Malokarpatská 3
9 Pinot gris Malokarpatská 3
10 Chardonnay Nitrianska 4
11 Pinot blanc Nitrianska 4
12 Pinot gris Nitrianska 4
0,00
50,00
100,00
150,00
200,00
250,00
300,00
350,00
400,00
450,00
1 2 3 4 5 6 7 8 9 10 11 12
Ave
rage
(m
g G
AE/
L)
Samples
ACKNOWLEDGMENTThis work was supported from the grant KEGAno. 017SPU-4/2019 and the project ‘Culturalheritage of small homelands’ no.PPI/APM/2018/1/00010/U/001.
Fig. 1 Total polyphenolic content in white wines
Fig. 2 Total antioxidant activity in white wines
0,00
10,00
20,00
30,00
40,00
50,00
60,00
70,00
80,00
1 2 3 4 5 6 7 8 9 10 11 12
Ave
rage
(% in
hib
itio
no
f D
PP
H)
SamplesRESULTS AND DISCUSSION
The antioxidant properties of white wines (Pinot blanc, Pinot gris and Chardonnay)from 3 different wineries and from four wine-growing regions (Tab. 1) wereevaluated using the total content of polyphenols and antioxidant activity. The totalpolyphenolic content ranged from 256.1 mg GAE.dm-3 in Pinot gris (Malokarpatska
wine-growing region) to 403.6 mg GAE.dm-3 inChardonnay (Južnoslovenska wine-growingregion) samples. The total antioxidant activityranged from 51.1% (Pinot gris, Malokarpatskawine-growing region) to 72.5% (Pinot gris,Stredoslovenska wine-growing region). Weobserved the non-significant difference amongwine-growing regions for both parameters: GAE(F3.8 = 0.56, p = 0.66) and DPPH (F3.8 = 0.33, p =0.81).
Tab. 1 Samples of white wines

Authenticity of dairy products by Capillary Electrophoresis
Maurizio Masci 1*, Claudia Zoani 2, Teresina Nevigato 1, Aida Turrini 1, Renata Jasionowska 3, Roberto Caproni 1, Patrizia Ratini 3
1 Council for Agricultural Research and Economics (CREA), Research Centre for Food and Nutrition, Rome (Italy). *Corresponding author [email protected] Italian National Agency for New Technologies, Energy and Sustainable Economic Development, Department for Sustainability - Biotechnology and Agroindustry Division (ENEA– SSPT-BIOAG), Rome (Italy)3 Università degli Studi di Roma La Sapienza, Rome (Italy)
INTRODUCTION
Capillary electrophoresis (CE) represents a very powerful technique due to the multiple adjustable parameters that areunknown to other analytical techniques. In CZE mode it can easy separate charged molecules, such as proteins, in MEKCmode it can analyze neutral molecules, and in Electrochromatography mode it combines the separation driven by astationary phase (chromatography) together with adjunctive resolution power provided by a high electrical voltage.Milk and derivatives are a very important part in the diet of the world population. Products from goat, buffalo and sheepspecies have a greater economic value than the cow ones therefore authenticity frauds occur frequently: dairy products areamong the seven more attractive foods for adulteration. Each milk from the above-cited animal species has its own definitepattern of whey proteins, essentially variants of β-Lactoglobulin (β-Lg) and α-Lactalbumin (α-LA) that can be usefullyexploited as markers of authenticity by means of CE in CZE mode. This work presents case studies on the authenticity ofcheeses and on some milk mixtures. Sample preparation simply required the adding of an acidic solution for milk samplesand of distilled water for cheese samples. After centrifugation and filtration, samples were ready for CE analysis.Electrophoretic runs where carried out by means of an alkaline buffer and the UV detection which allowed the completeresolution of proteins of interest in few minutes. Instrument used was a Spectraphoresis 1000 from Thermo QuestCorporation (California, U.S.A.).
c) Overlap
Fig. 1. Ewe milk and cow milk. Conditions: 18kV, methyl deactivated column 68 cm (61 cm to the detector), 50 µm ID, borate buffer 80 mM, UV detection 200 nm, T 25°C.
a) Pure ewe milk b) Pure cow milk
Fig. 2. Mixture of ewe milk and cow milk 50:50. Conditions: 28kV, methyl deactivated column 68 cm (61 cm to the detector), 50 µm ID, borate buffer 80 mM, UV detection 200 nm, T 25°C.
CASE STUDIES
ewe α-LA
ewe β-Lg
cow α-LA
cow β-LgB
cow β-LgA
cow β-LgA
cow β-LgB
Ewe-cow milk mixturesFig. 1a shows an electropherogram ofwhey proteins from a pure ewe milkcollected in central Italy. With theconditions used the optimum resolutionbetween ewe alfa-Lactalbumin (ewe α-LA)and ewe beta- Lactoglobulin (ewe β-Lg)can be observed (all the original highresolution figures of the present postercan be requested from the correspondingauthor). By using the same experimentalconditions an electropherogram of purecow milk is reported in Fig. 1b. The threewhey proteins of cow milk are perfectlyresolved.
The three peaks in Fig. 1b refer to cow α-LA, cow β-Lg variant B (β-LgB) andcow β-Lg variant A (β-LgA). Run times are short, less than 15 min. Byoverlapping the two electropherograms 1a and 1b it may be expected thatby injecting a mixture of ewe and cow milk ALL whey proteins coming fromthe two milk types could be separated (Fig. 1c). To test this hypothesis, amixture of sheep and bovine milk 50:50 was prepared and subsequentlyinjected. Instrumental conditions were essentially the same of those inFigs. 1a, 1b, 1c, but the potential was increased from 18kV to 28 kV tomaintain a good peak efficiency of a complex protein mixture like this one.The result is shown in Fig. 2. As the Voltage increases the run timedecreases but the whey proteins coming from the two milks are perfectlyresolved in 10 min so demonstrating the great potential of CapillaryElectrophoresis in CZE mode in the field of protein analysis. Thecharacteristic “doublet” of cow β-LgB and cow β-LgA is clearly visible in Fig.2. Such peaks can be used as markers for the presence of cow milk.Therefore they represent markers of authenticity.
A milk declared as "pure sheep's milk" should have a profile as in Fig. 1a without the presence of bovine whey proteins. Byusing cow β-LgA as a marker of cow milk (more intense than cow β-LgB so allowing a better limit of detection) a limit ofdetection of 2% of cow milk fraudulently added to ewe milk can be measured with the present method. Given the quick andsimple milk preparation and by considering the fast analysis time, the method can be used to quickly check the authenticityof sheep's milk batches that could be subject to fraud with cow's milk adding. In fact cow's milk is much cheaper and moreavailable than sheep's milk. This latter has limited availability depending on the season and is used to produce typicalproducts with high economic and cultural value such as the “Pecorino cheese” which is PDO, that means it has ProtectedDesignation of Origin status at European level.
cow α-LA
Fig. 3. Pure goat milk. Conditions: 4kV, methyldeactivated column 29 cm (22 cm to the detector), 50 µm ID, borate buffer 50 mM, UV detection 200 nm, T 25°C.
Fig. 4. Mixture of goat milk and cow milk 50:50. Conditions: 4kV, methyl deactivated column 29 cm (22 cm to the detector), 50 µm ID, borate buffer 50 mM, UV detection 200 nm, T 25°C.
goat α-LA
goat β-Lg
goat α-LA
goat β-Lg
cow α-LA
cow β-LgB
cow β-LgA
These fatty acids are more rapidlymetabolized and absorbed by theorganism, therefore goat milk ismore easy to digest with respectcow milk. Other characteristics arethe following: the free fatty acidsin goat milk are lower than incow's milk, the price is higher, theflavor is stronger and the lactosecontent is a little lower. As regardsgoat cheeses, there is a vasttradition and an extensive marketworldwide. The particular contentof medium-chain fatty acids(caproic, caprylic, capric) conferstypical organoleptic properties togoat cheeses which therefore havea good economic value and aresought after as typical products inmany countries.
They can be marketed as fresh or aged cheeses. For all the reasons mentioned and also due to the more limited availabilityof goat's milk compared to cow's milk, it is important to check the correct composition of batches of milk declared as "puregoat".Figs. 3 and 4 show the great performance of CE in ascertaining the authenticity of goat milk when fraudulently added withcow's milk. In Fig.3 the electropherogram of a pure goat milk sample collected in southern Italy is reported. The two mainwhey protein α-Lactalbumin and β-Lactoglobuiln are quite resolved. A mixture of goat-cow milk 50:50 was then preparedand injected. Result is shown in Fig.4. It may be noted that all whey proteins coming from the two types of milk are resolved.On the right it appears the typical profile of cow’s milk, as in Fig. 1b, with cow α-LA, cow β-LgB and cow β-LgA. AppliedVoltage was lower with respect Figs. 1 and 2 (ewe milk) therefore the runtime increased to about 33 min.Under these conditions for a batch of goat's milk adulterated with cow's milk it is impossible to pass the authenticity checkperformed by Capillary Electrophoresis as the bovine whey proteins must be completely absent in the electropherogram.
Goat cheesesFig. 5 shows a goat cheese of French origin purchased on the market. It was commercialized in the form of freshcheese. The whey proteins present in the milk, from which the cheese derived from, are well visible also in theelectropherogram of the cheese. It can be noted that the relative intensities of goat α-LA and goat β-Lg are differentfrom that observed in Fig.3 for the goat milk collected in southern Italy. This is probably due to the different breed ofgoats considered (genetic variability). From the electropherogram in Fig.5 it seems that the cheese was produced with
Fig. 5. Goat cheese. Conditions: 12kV, methyldeactivated column 29 cm (22 cm to the detector), 50 µm ID, borate buffer 80 mM, UV detection 200 nm, T 25°C.
Fig. 6. Goat cheese spiked with a minimum amountof cow milk. Conditions: 12kV, methyl deactivatedcolumn 29 cm (22 cm to the detector), 50 µm ID, borate buffer 80 mM, UV detection 200 nm, T 25°C.
goat α-LA
goat β-Lg
goat α-LA
goat β-Lg
cow β-LgB
cow β-LgA
goat milk only, as declared bythe producer. But for a trueconfirmation an experimentalverification is necessary, also byconsidering that a weak peak ispresent at about 22.4 min. Forthe confirmation a minimumamount of whey from cow milkwas added to the solution ofgoat cheese already injected forthe electropherogram of Fig.5.The spiking is to be deemedperfectly successful: the twoweak peaks of cow β-LgB andcow β-LgA appear in an areapreviously devoid of peaks, onthe sides of the weak pre-existing peak, thus confirmingthe total absence of cow's milkin the production of thisdeclared “pure goat cheese”.
Goat-cow milk mixturesGoat-based dairy products have a thousand-year tradition and were widespread in all ancient civilizations. The traditioncontinues today, in some cases with the support of modern technologies, but in many other cases by means of traditionalmethods. From the nutritional point of view goat milk contains more short- and medium-chain fatty acids than cow milk.
In other cases of goat cheeses found from local producers (but in the form of aged cheeses) we carried out the samecontrol that was effective. However it was much more laborious due to the presence of some new-formed peptideswhich derived from the ripening process.
CONCLUSIONSCase studies about ewe-cow and goat-cow milk mixtures together with the analysis of a goat cheese are presented. Inall these cases Capillary Electrophoresis showed effective in determining the true composition of the sample by asimple operational procedure and a short time requested, so making the technique very suitable for checking theauthenticity of dairy products. Some limitations are to be taken into account, mainly when aged cheese are examinedsince in such samples the peptides formed during the ripening process may interfere with the whey proteins used asmarkers of authenticity.
REFERENCES• Kvasnička F (2005): Capillary electrophoresis in food authenticity. Journal of Separation Science, 28, 813-825.
• Trimboli F, Costanzo N, Lopreiato V, Ceniti C, Morittu VM, Spina A, Britti D (2019): Detection of buffalo milkadulteration with cow milk by capillary electrophoresis analysis. Journal of Dairy Science, 102, 5962–5970.

Optimization of HPLC method for determination of cholesterol
Kolarič L.1, Šimko P.1
1 Slovak University of Technology, Faculty of chemical and food technology, Institute of Food Science and
Nutrition, Radlinského 9, 812 37 Bratislava, Slovakia
The aim of this work was to evaluate the optimal conditions for
determination of cholesterol by HPLC chromatography when optimal
composition of mobile phase, its influence on the retention time,
absorption wavelength, and limit of quantification have been studied. The
main parameters, which influence the effectivity of liquid chromatography
are the composition of mobile phase, type of stationary phase, or the size
particle of column. The cholesterol content can be determined by several
analytical methods but the most used are gas or liquid chromatography. In
the HPLC method, most of the mobile phases are composed of acetonitrile,
isopropanol, or methanol1.
HPLC analysis was performed using an Agilent
Technologies 1260 infinity system equipped with a
UV-DAD detector. Isocratic elution was
performed at a flow rate of 0.5 mL.min-1 using the
various mobile phase composed of water,
methanol, and acetonitrile. The injection volume
was 10 μL and the temperature was set at 30 °C.
As a stationary phase, a Zorbax Eclipse Plus SB-
C18 column (2.1x100 mm, 3.5 μm particle size)
was used with the guard column Zorbax SB-C18
(4.6x12.5 mm, 5 μm particle size).
2,1
2,6
3,1
3,6
4,1
4,6
5,1
5,6
6,1
6,6
7,1
10000
10200
10400
10600
10800
11000
11200
11400
11600
1 2 3 4 5 6
RET
ENTI
ON
TIM
E [m
in]
AV
ERA
GE
PEA
K A
REA
[m
AU
*s]
THE MOBILE PHASE COMPOSITION1-ACETONITRILE:METHANOL 10:90; 2-ACETONITRILE:METHANOL
30:70; 3-ACETONITRILE:METHANOL 20:80; 4-ACETONITRILE:METHANOL 60:40; 5-ACETONITRILE:METHANOL
50:50; 6-ACETONITRILE:METHANOL 70:30
Fig. 1 The influence of the mobile phase
composition on the peak area and retention time of
cholesterol standard
Fig. 2 The isothermal record of cholesterol standard.
The red area refers to absorption maximum at 205
nm
It can be concluded that the optimal mobile phase for
cholesterol determination by HPLC is mixture of
methanol and acetonitrile (40:60, v/v), with the retention
time of cholesterol in 5,701 min at the flow rate of 0.5
mL.min-1 and the absorption wavelength at 205 nm. At
these conditions, the LOQ was 24.21 μg.ml-1.
REFERENCES
1. Albuque rque TG, Olive i ra MBPP, Sanches -S i lva A, Cos ta HS (2016) : Choles te ro l de termina t ion in foods : Compar ison
between high perfo rmance and ult ra -h igh perfo rmance liquid chroma tography. Food Chemis t r y, 193, 18 -25. doi:
ht tps : / /do i . o rg/10.1016 / j . foodchem. 2014.09.109
ACKNOWLEDGMENT
This work is the res u l t o f the p ro jec t imp le menta t ion of grant APVV-061-2018 and ITM S 26230120009 f inanc ia l ly s uppor ted by
the Research & Development Opera t iona l Programme funded by the ERDF.

Variation in the fatty acids profile of the meat by adding
hempseed cake in the diet of multiparous cull cows
Pianezze S.1,2, Perini M. 2, Sepulcri A. 1, Baldini M. 1, Fabro C. 1, Piasentier E. 1, Corazzin M. 1
1Departement of Agricultural, Food, Environmental and Animal Sciences, University of Udine, Udine (UD) 2Fondazione Edmund Mach, Technology Transfer Centre, San Michele All’Adige, Trento (TN)
Acknowledgement
This research was funded by Start-up 2018 project, Department of Agricultural, Food, Environmental
and Animal Sciences, University of Udine
References Baldini M, Ferfuia C, Piane B, Sepulcri A, Dorigo G, Zuliani F, Danuso F, Cattivello C, (2018): The Performance and Potentiality of
Monoecious Hemp (Cannabis Stiva L.) Cultivars as a Multipurpose Crop Agronomy, 8, 162. doi:10.3390/agronomy8090162
Folch J, Lees M, Sloane Stanley G H, (1975): A simple method for the isolation and purification of total lipids from animal tissues. Journal
of Biological Chemistry, 226, 497-509
The AIM OF THIS WORK was to study the effects of the inclusion of hempseed cake in multiparous cows diet on the fatty acids (FA) composition of their meat.
The hempseed cake , a byproduct of hempseed
oil production process, is rich in fat (around 10%
of the dry matter) and has a favorable fatty
acids profile (unsaturated fatty acids for over the 80% of the total) (Baldini et al. 2018). Therefore, its
use may contribute to enhance the properties of
bovine meat.
In this work, 18 multiparous cows were
considered. They were divided into two groups
fed on different diets (Figure 1). Within the same
group, whether A or B, half cows were provided
with hemp cake, while the rest was given a
soybean meal instead.
Material and Methods
The total lipid fraction was extracted from samples of m. longissimus thoracis by following the
procedure reported elsewhere (Folch et al., 1957). Fatty acids were esterified, methylated and
quantified through GC-MS (GCMS 5977E, Agilent Thecnologies). The separation was performed
through a HP 88 column (100 m x 0.25 mm x 0.25 µm).
The statistics was carried out by using the software R vers. 4.0.0 with a model that considered the
experimental factor (hempseed cake vs soybean meal) as fixed, and the type of forage (whether
hay or corn silage) as a block factor.
Fig
ure
1. Sa
mp
les
de
scri
pti
on
Results
FA1 HC (%) SM (%) RMSE
C10:0 0.11 0.11 0.023
C14:0 3.47 a 3.03 b 0.425
C15:0iso 0.17 0.17 0.036
C15:0anteiso 0.25 0.17 0.126
C14:1n-9c 0.28 0.32 0.154
C15:0 0.39 0.40 0.060
C16:0iso 0.22 0.20 0.057
C16:0 27.50 26.57 2.553
C16:1n-7c 0.32 0.34 0.047
C16:1n-9c 3.12 2.76 0.677
C17:0anteiso 0.63 0.66 0.097
C17:0 1.06 1.11 0.213
C17:1 0.53 0.57 0.122
C18:0 19.22 19.36 3.206
C18:1t2 1.79 1.78 0.578
C18:1n-9c 34.54 35.96 1.985
C18:1n-7 1.02 1.05 0.198
cis-C18:13 0.61 0.60 0.147
C18:2n-6t 0.57 0.55 0.119
C18:2n-6c 2.32 2.33 0.328
C19:1 0.11 0.11 0.039
C20:0 0.18 0.17 0.096
C18:3n-3 0.37 0.35 0.087
C20:1n-9 0.10 0.07 0.037
CLA c9,t11 0.21 0.26 0.120
C20:3n-6 0.11 0.12 0.045
SFA4 53.50 52.27 2.626
MUFA5 42.51 43.64 2.798
n-6 PUFA6 3.49 3.60 0.487
n-3 PUFA7 0.50 0.50 0.140
PUFA8 3.99 4.09 0.518
n-6/n-3 7.95 7.50 3.286
Fig
ure
2. G
CM
S 5
97
7E
Figure 3. Results of the quantification
of the fatty acids in the meat
In conclusion, from an overall point
of view, the fatty acids profile was
not improved by adding
hempseed cake in the diet of
Italian Simmental cull cows.
The dataset of all the fatty acids analyzed is displayed in Figure 3. The results
obtained for the hempseed cake group, considering the FA mainly present in
the meat, i.e. palmitic (C16:0), stearic (C18:0)and oleic (C18:1n-9c) acid, as
well as those favorable for the human health such as linolenic acid (C18:3n-
3) and the total unsaturated fatty acids (PUFA) were comparable to those
found for the soybean meal group (P>0.05). The n-6/n-3 ratio was not
affected by the use of hempseed cake either.
On the other hand, myristic acid (C14:0) turned out to be statistically higher
for the group provided with hempseed cake (Figure 4). Therefore, as for
C14:0, the quality of the meat has been enhanced by providing the cows
with hempseed cake.
1 Fatty acids with a concentration lower than 0.1% have not been reported 2 trans-C18:1 as sum of t6-, t8-, t9-, t10-, t11-, t12-, t13, t14-18:1 3 cis-C18:1 as sum of c11-, c12-, c13-, c14-, c15-18:1 4 SFA (saturated fatty acids) considered: C10:0 + C12:0 + C13:0 + C14:0iso + C14:0 + C15:0 + C15:iso + C15anteiso + C16:0 + C16:0iso + C17:0 + C17:0iso + C17:0anteiso + C18:0 + C20:0 5 MUFA (mono unsaturated fatty acids) considered: C14:1n-9c + C16:1n-9t + C16:1n-9c + C16:1n-7c + cis-C16:1 + C17:1 + C18:1t11 + transC18:1 + C18:1n-9c + C18:1n-7 + cis-C18:1 + C19:1 + C20:1n-9 6 PUFA n-6 = C18:2n-6t + C18:2n-6c + C18:3 n-6 + CLA + C20:2n-6 + C20:3 n-6 + C20:4 n-6 + C22:4 n-6 7 PUFA n-3 = C18:3 n-3 + C20:2n-3 + C20:3n-3 + C20:5 n-3 + C22:5 n-3 8 PUFA (polyunsaturated fatty acids) = n-3 PUFA + n-6 PUFA
FA
= F
att
y a
cid
, H
C =
He
mp
see
d C
ake
, SM
= S
oyb
ea
n M
ea
l, R
MSE =
Ro
ot
Me
an
Sq
ua
re E
rro
r
Figure 4. Box plots of the FA mainly present in the meat

The effect of frying oil on the fat content of fish fingers and potato croquettes and its stabilityJosef Soukup, Lenka Kouřimská
Department of Microbiology, Nutrition and Dietetics,, Czech University of Life Sciences Prague, Kamýcká 129, 165 00, Praha 6, Suchdol, Czech Republic
Frying in a high layer of oil (deep frying) is a process of preparing foods that has been very popular for a long period oftime. It is a process whereby the prepared food is immersed in an oil pre-heated to 150-200 °C. The food prepared this wayhas its characteristic aroma and golden brown coluor, which is mainly a result of Maillard reaction, that is taking placemainly in the crust. There are many types of oils used for deep frying, the quality of which is important to take into accountprimarily because the oil used becomes a part of fried food and affects its organoleptic properties and nutritional value.The quality of frying oil is mostly influenced by its fatty acid composition, presence of unsaponificable accompanyingcompounds and antioxidants in oil, oil freshness, fried food composition or frying technology etc.
Background
Conclusions
The difference between fat content in fried foodbefore and after frying was not significant.
The least amount of fat was soaked when sunflowerand rice oils were used.
There were no differences in fat content betweensamples throughout the experiment (repeated frying1 to 10).
Rice oil showed the highest oxidative stability duringstorage in increased temperature; sunflower oil wasthe least stable.
Study Design
Results
Three different types of oils were used as a frying medium, and pre-fried fish fingers and potato croquettes were preparedin them. All these items were purchased in the food store. Fish fingers and potato croquettes were fried at thetemperatures recommended by the producer of the deep fat fryer for these products (170 or 180 °C respectively). Tenrepetitions of frying for each kind of food was performed in order to be close to the continuous frying conditions in fastfoods and restaurants. The dry matter, ash a fat content were determined. To determine the oil stability oils were stored inopen 100mL beakers at 60 °C. The increase in mass reflects the degree of oxidation of the monitored oil.
Type of oil Dry matter
(g/100 g
sample)
Ash
(g/100 g
dry matter)
Ash
(g/100 g
sample)
Fat
(g/100 g
dry matter)
Fat
(g/100 g
sample)
Rapeseed 39.03 ±1.18 2.97 ±0.48 1.16 ±0.20 15.81 ±0.72 6.17 ±0.29
Sunflower 39.99 ±1.79 3.40 ±1.69 1.37 ±0.76 15.55 ±0.40 6.22 ±0.29
Rice 38.69 ±0.77 1.22 ±0.64 0.47 ±0.24 15.64 ±0.41 6.05 ±0.21
Type of oil Dry matter
(g/100 g
sample)
Ash
(g/100 g
dry matter)
Ash
(g/100 g
sample)
Fat
(g/100 g
dry matter)
Fat
(g/100 g
sample)
Rapeseed 47.84 ±0.77 2.46 ±0.15 1.18 ±0.09 5.48 ±0.08 2.62 ±0.04
Sunflower 48.05 ±1.51 2.08 ±0.39 1.00 ±0.20 5.37 ±0.15 2.58 ±0.10
Rice 48.18 ±0.79 2.26 ±0.17 1.09 ±0.08 5.46 ±0.11 2.63 ±0.04
Though there were differences between oils before and after frying in some parameters, the results of individual samples after frying showed neither increasing nor decreasing tendencies in any of observed factors (no significant differences among individual samples from frying 1 to 10 were proved). During the storage, rice oil and rapeseed oil showed the highest stability, the sunflower oil was on the other hand really unstable and easily oxidised. Because the rice oil also soaked the least amount of fat in case of fish fingers, it seemed to be the best option. In was not shown in case of potato croquettes – sunflower oil soaked less.
Average of dry matter, ash and fat in fish fingers fried in different oils
Average of dry matter, ash and fat in potato croquettes fried in different oils

Zuzana Šmídová, Marika Šavrdová, Ivana Laknerová, Marian Urban
Food Research Institute Prague, p.r.i., Radiová 7, Prague 10200, Czech Republic
This work was supported by METROFOOD-PP project which has received funding from the European Union’s Horizon 2020 research and innovation programme under grant agreement No 871083 and METROFOOD-CZ project MEYS Grant No: LM2018100
METROFOOD-RI as a global multidisciplinary research infrastructure joins together 18 European countries with 48 partner institutions. The infrastructure is aimed at metrology in food and nutrition and operates in various areas –
agriculture, sustainable development, food quality and safety, food traceability and authenticity, environmental safety and human health. The Czech national node of METROFOOD-RI is represented by METROFOOD-CZ, Infrastructure
for Promoting Metrology in Food and Nutrition in the Czech Republic. METROFOOD-CZ makes part of large research infrastructures in the Czech Republic. The partners in the Czech Republic include Czech University of Life Sciences,
University of Chemical Technology and Food Research Institute Prague.
The Accredited Testing Laboratory (ISO 17025) promotes scientific excellence in the field of food allergens analysis, e.g. gluten, casein, soya proteins, buckwheat allergen, mustard
allergens and peanut allergens. This Laboratory operates with approx. 100 analyses a month of products from the leading Czech food producers. The main food matrices analysed
are cereals and cereal products, bread and bakery products, fruit, vegetables and their juices, spices, herbs and their extracts, sauces and dressings , cocoa and chocolate, beer, etc.
Within Metrofood, scientific knowledge and data are shared with a wide variety of users and stakeholders: research groups, laboratories, academics, food inspections and food control agencies, policy makers,food producers, food business operators, consumers and citizens.
Metrofood, as a scientific infrastructure, supports the connection between the scientific sphere and industry. In this way, it can improve food quality, introduce new technological methods and improve food knowledgein the scientific and general public.
The equipment of the Food Research Institute Prague (FRIP) allows research in the field of new products development
and new technological challenges in the area of food processing, storage and preservation. Within FRIP various facilities
are included in the Metrofood infrastructure: Accredited Testing Laboratory, devices for food analysis and processing -
high-pressure processing machine, spray drying, rheological instruments, bioreactors. The innovative method of high-
pressure processing enables delicate conservation of foods (e.g. juices) without heating. Thus, the products keep and
preserve their natural colour, appearance, taste, smell as well as nutritional value. The products have prolonged lifetime
and are stored in a cold place.

Policies and strategies in food and healthy lifestylesJesus s.1, Coelho M. 1, Dias G. 1, Castanheira I.
National Institute of Health Doctor Ricardo Jorge
MATERIAL AND METHODSIn the present study data were collected from multiple sources:
�Suport structures and reforms
To promote healthy eating and lifestyles are somesupport structures and reforms for better consumerawareness:• Awareness campaigns• Education in specific contexts• Funded projects• Taxes and nutrition labels
Research QuestionWhat is the state of strategies and policies in health andfood lifestyles in Europe?
10.0%11.7%
14.1%
“Healthy Lifestyles Policies”
“Food Policy”“Healthy Food Policies”
�Key Information collected from AHFES project partners about their region/country:
• Healthy food and lifestyles and innovation policies applied
• Innovation tools in healthy food and lifestyles
• Existing support structures and reforms in healthy
food and lifestyles
� Literature review with application of different terms:
REFERENCESWHO. Health 2020. A European policy framework and strategyfor the 21st centuryhttps://ec.europa.eu/jrc/en/health-knowledge-gateway/promotion-prevention/nutrition/food-based-dietary-guidelines.
ACKNOWLEDGMENTThe authors appreciate the financial support of AHFES project (EAPA_1071_2018AHFES). This project has been co-funded by the European Regional Development Fund through the Atlantic Area Programme.
There are differences in the Food-based dietary guidelinesmodels applied in each country since the nutritional needsand the NCDs are not the same between the countriesanalyzed. However, it appears that the models need aconstant reorientation, based on changing lifestyles, thehealth status of the population and also the concern withsustainability.
So far, the political measures implemented in the area of marketing restriction, mainly aimed at the children's age group,are legal regulation, self-regulation or a mixture of the two. These measures can be divided according to the medium usedfor marketing, that is, from traditional transmission marketing to marketing carried out in stores and outdoor.
�Innovation tools
• The innovation tools are directly related to scienceprograms/calls. In general, Europe has threeprincipal calls in the area of Healthy food andlifestyles: INTERREG, PRIMA and HORIZON2020.
• Although each country has national calls toimproved innovation products in the area ofhealthy food.
All countries have implemented measures to reformulate the processing and nutritional properties of food, withcollaboration between different actors, such as universities, investigation centers and industry. Highlight the results alreadyachieved in terms of the content of salt, sugar and trans fatty acids:
BACKGROUNDThe rapid growth in industrialization, urbanization and market globalization had asignificant impact on population diets and lifestyles. At the same time, the livingstandards improved, the food availability expanded and became more diversified.However, it occurred a change in the dietary patterns and an increase of physicalinactivity, which led to a rise in the chronic non-communicable diseases(NCDs),including obesity, diabetes, cardiovascular disease, hypertension, stroke and cancer.It was determined that in 2001 chronic diseases contributed to 46% in the worldfor the global burden diseases and will increase to 57% by 2020 . The study wasdeveloped within the project “A Quadruple Helix Atlantic Area Healthy FoodEcosystem for Growth of SME’s”(AHFES). This project aims to improve thecompetitiveness and growth of Small and Medium-sized Enterprises (SMEs) inthe value chain of healthy eating and lifestyles, contributing to the development ofa transnational innovation ecosystem that helps entities to access information, andpartners and markets to align their products and services to the needs andexpectations of the European consumer/community.
RESULTS� Overall, countries are increasing the policies and measures to be implemented in the area of health.
Most countries have very similar national plans. However their policies and levels of implementation vary between them.The measures and policies applied to increase and encourage society to modify it’s diet and lifestyle were diverse and can begrouped into five categories: nutrition and diet counselling, portion size control, regulation of marketing to children,reformulation and dietary guidelines.
SaltFrance: 12% in bread, 32% in soups and 23% in pizzasIreland: 28% (2005-2017)Spain: 23% in bread (2005 -2009)UK: 20 to 40%(2006-2014)
SugarFrance: produced less than 10.4 tonnes / yearIreland: 8% (2005 -2017)Portugal: 15% reduction in total sugarSpain: 23% in soft drinks (2005 -2014)UK: 19% (between 2013 and 2018)
Trans Fatty AcidsFrance: -2.14 tons per year of saturated fatty acidsIreland: 10% (2005-2017)•UK: 70% for saturated fats
Figure 1. Food-based dietary guidelines models
Figure 2. Global determinants
CONCLUSIONS• The countries of the Atlantic area are increasing policies
and measures to be implemented in the area of health.
• All countries have defined very similar national plans. However, the approach and the level of implementation vary between them.
• The implementation of the measures cannot be only at the national level, but there is a need for greater government participation at the regional level.
• It is necessary to increase the cooperation of the 4-helix actors so that the implementation of the measures and strategies are successful and reach a more significant number of individuals.

EPA and DHA content in fish oil supplements on the Italian market: A preliminary study
Teresina Nevigato 1*, Maurizio Masci 1, Aida Turrini 1, Claudia Zoani 2, Roberto Caproni 1
1 Council for Agricultural Research and Economics (CREA), Research Centre for Food and Nutrition, Rome (Italy). *Corresponding author [email protected] Italian National Agency for New Technologies, Energy and Sustainable Economic Development, Department for Sustainability - Biotechnology and Agroindustry Division (ENEA– SSPT-BIOAG), Rome (Italy)
INTRODUCTION
MATERIALS AND METHODS
RESULTS
While a good fish consumption is generally accepted to have beneficial effects on health mainly due to Eicosapentaenoic acid(EPA) and Docosahexaenoic acid (DHA) omega-3 supplements are not universally recognized to exert the same positiveaction. Some authors suggest that the easy oxidation such supplements go through invalidates the goodness of theexperiments giving conflicting results.In any case, the market of supplements has grown a lot in recent years with a turnover of billions of euros. Italy ranks first inEurope in the consumption of food supplements with a 23% share of the European market. Analytical controls on omega-3supplements are rarely carried out but they are needed since from the few available papers some frauds were detected withthe addition of large amounts of soybean oil, for example [1].The present work investigated the fatty acid (FA) composition of omega-3 supplements available on the Italian market.Measured FA concentrations were compared with the labels to assess the product compliance. Method reliability has beenparticularly taken care of, with the total amount of fatty acids determined experimentally by saponification, according to theKinsella method [2]. Gas Chromatography - Mass Spectrometry was subsequently used by performing a peak-by-peakidentification and integration until the signal to noise ratio of 3 in order to assign each fatty acid to its exact quantity. About50 different fatty acids were detected in each sample.
Fatty acids Supplement n.1 Supplement n.2 Supplement n.3
12:0 (Lauric) <LOD <LOD 0.14
13:0 <LOD <LOD 0.03
14:0 (Myristic) 0.05 0.13 6.29
14:1 ω-5 (Myristoleic) <LOD <LOD 0.05
15:0 0.01 0.06 0.54
16:0 (Palmitic) 0.16 1.32 13.80
16:1 ω-7 (Palmitoleic) 0.11 0.44 7.71
16:2 ω-4 (Palmitolinoleic) <LOD 0.08 1.21
17:0 (Margaric) 0.06 0.10 0.35
18:0 (Stearic) 2.94 4.27 2.77
18:1 ω-9 (Oleic) 2.87 6.17 9.55
18:1 ω-7 (Vaccenic) 1.29 2.48 2.72
18:2 ω-6 (Linoleic) 0.52 1.33 0.99
19:0 0.39 0.52 0.37
18:3 ω-3 (Linolenic) 0.34 0.70 0.72
18:4 ω-3 (Stearidonic) 0.47 1.54 2.75
20:0 (Arachidic) 0.93 1.02 0.38
20:1 ω-11 (Gadoleic) 0.73 0.26 <LOD
20:1 ω-9 (Gondoic) 3.58 1.61 0.93
20:2 ω-6 0.39 0.13 <LOD
20:4 ω-6 (Arachidonic) 2.56 1.59 0.78
20:4 ω-3 (ω3-Arachidonic) 1.58 1.32 0.69
20:5 ω-3 (EPA) 32.41 25.76 16.68
22:1 ω-11 (Cetoleic) 2.60 1.42 <LOD
22:1 ω-9 (Erucic) 0.18 0.44 <LOD
22:5 ω-3 (DPA) 2.71 2.91 1.37
22:6 ω-3 (DHA) 19.68 20.06 12.89
Others 13.39 12.32 8.26
Sum (total FAs) 90 88 92
Table1. Fatty acid composition of the three omega-3 supplements analyzed (mg/100 mg oil)
Table 1 shows the fatty acid composition of the three supplements analyzed. In the supplement n.1 they were detected a total of 46 FAs while in thesupplements n.2 and n.3 they were detected 55 and 47 FAs, respectively. 27 fatty acids represented the majority of the total being 85% in the supplement n.1,86% in the supplement n.2 and 91% in the supplement n.3. These 27 FAs, from Lauric to DHA, are listed in Table 1. EPA and DHA compliance with the labels wasas follows (mg/100 mg oil):Supplement n.1 - EPA declared 40, EPA measured 32.41 (81%); DHA declared 20, DHA measured 19.68 (98%).Supplement n.2 - EPA declared 33, EPA measured 25.76 (78%); DHA declared 22, DHA measured 20.06 (91%).Supplement n.3 - EPA declared 15, EPA measured 16.68 (111%); DHA declared 10, DHA measured 12.89 (129%).It may be noted that in supplements n.1 and 2 EPA is about 80% of what was declared on the label. Also Chee et al. [3] in their study of marine oil capsulesobserved about 80% of labeled content as regards EPA. The other measured values (DHA in all supplements, EPA in supplement n.3) are essentially in agreementwith the label being the supplement 3 slightly in excess of what declared but this does not necessarily mean a higher quality, as exposed below.By considering the 27 main fatty acids, the ratio ω-6/ω-3 is equal to 0.06, 0.06 and 0.05 for supplement n.1, n.2 and n.3 respectively. These values are well incompliance with the current guidelines which recommend not to exceed the value of 1 in the diet for the ratio ω-6/ω-3. Such values were to be expected forproducts derived from fish oil which are in fact used also to rebalance the diet.As regards the distribution between saturated fatty acids (SFA), monounsaturated fatty acids (MUFA) and polyunsaturated fatty acids (PUFA) a noticeabledifference can be observed between the supplement n.3 and the other two. The series SFA-MUFA-PUFA as mg/100 mg oil is equal to 5-11-61 for supplement n.1,7-13-55 for supplement n.2 and 25-21-38 for supplement n.3. This may indicate that an effective purification step has probably been carried out for supplementsn.1 and n.2 in order to eliminate the less valuable saturated fatty acids, in fact the above values, especially for SFA, are not typical of fish oil, while the values forsupplement n.3 are.In this regard we can consider, for example, the value of 16:0 (Palmitic) that is generally one of the most concentrated fatty acids in fish oils. In supplements n.1and 2 16:0 is instead one of the less concentrated FAs (0.16 and 1.32 mg/100 mg oil) while in the supplement n.3 it is one of the most concentrated (13.80mg/100 mg oil). A similar situation can be observed for 14:0. Furthermore the two saturated FAs 12:0 and 13:0 are completely absent in supplement 1 and 2. Onthe contrary they are present in supplement 3 even if in low quantity (the same low quantity generally observed in fish oils). We must emphasize that theproduction of good omega-3 supplements involves accurate purification steps by means of which free fatty acids, heavy metals, colored compounds and otherimpurities are removed from raw fish oil, making the oil much purer. Generally the Short Path Distillation technique is used. During this process there is also theconcentration of fish oils which leads to a higher total omega-3 content and a higher concentration of EPA and DHA. A fractionation step is used to removesaturated fatty acids. Supplement n.3 appears to have undergone incomplete purification process. in addition to the significant presence of saturated fatty acids,supplement no. 3 has in fact a total omega-3 content of only 35 mg /100 mg oil compared to 57 and 52 mg/100 mg oil of supplements 1 and 2 respectively.For EPA and DHA there is a noticeable difference between the supplement n.3 and the other two. The EPA content in n.3 is half of n.1 and two thirds of n.2, whilethe DHA content in n.3 is two thirds of n.1 and n.2. This forces the consumer to take more oil from supplement n.3 to obtain the same quantity of bioactivemolecules. In terms of percentages the sum EPA+DHA represents 58 and 51% in supplements n.1 and 2, while in supplement n.3 is 33%.CONCLUSIONS. Apart from a slight difference in the measured and declared content of EPA, supplements n.1 and 2 have a higher quality than the supplementn.3, the cheapest. This last in fact has a high content of saturated fatty acids, a lower content of total omega-3 and a lower content of EPA + DHA. The lowercontent of EPA + DHA per 100 mg of oil (with respect the supplements n.1 and 2) forces the consumer to take more oil through the supplement n.3 with possibleside effects. This indicates that the compliance with the EPA and DHA labeled contents is not the only quality parameter to consider for fish oil supplements.
REFERENCES
Three Omega3 supplements of the most popular brands were purchased from retailers. Four capsules for each brand wereopened and approximately 10 mg of the pooled oil were methyl derivatized. Derivatization was carried out with BF3 methanolsolution 14% and methanol (1:1). Individual analytical standards of the main important 27 FAs were purchased as methylesters either from Merck KGaA® or from Larodan® (Solna, Sweden). After the purchase, the pure FA standards were dissolvedin n-hexane and stored at a temperature of -30°C by using the Certan® capillary bottles, i.e. vials specially designed foroptimum storage available from Merck KGaA®. Instrument used was a Varian 3900 gas chromatograph connected to theMass Spectrometer Saturn 2100T (GC-MS) equipped with an Ion Trap analyzer. Injections were made in split mode (15:1) withan injection volume of 1 µL. Capillary column installed was a CP-WAX 52 CB (60 m × 0.32 mm I.D., 0.50 µm film thickness)from Chrompack®, the Netherlands. Mass spectra were obtained in EI (Electron Ionization) mode at 70 eV. Ion traptemperature was 180°C. The selected Mass to Charge Ratio to acquire was in the 40-440 m/z range. Analyses were carriedout in full scan mode. Fatty acids detected in the samples were identified by multiple confirmation criteria, mainly thecoincidence of mass spectrum and the retention time with the mass spectrum and the retention time of the pure analyticalstandard injected in the same conditions. Checking with the mass spectrum NIST® database completed the validation. Thelimit of detection was 0.005 mg FA / 100 mg oil. An aliquot of oil from each brand was used to derive the total quantity offatty acids per 100 mg of oil. To such aim it was used the Kinsella method. Briefly said about 100 mg of oil were subjected tosaponification by means of 10% alcoholic KOH, the nonsaponifiable material was extracted with hexane and the residualsoaps were acidified to pH 1.5. The free fatty acids were extracted with hexane, dried in a tared vial and the weight of fattyacids was determined. Total FAs for each one of the three supplements are shown in Table 1. As reported by Kinsella: “Thesedata are used to calculate the weights of individual fatty acids separated by gas chromatography”. [1] Galuch MB, Carbonera F, Magon TFS, Da Silveira R, Dos Santos
PDS, Pizzo JS, Santos OO, Visentainer JV (1990): Quality Assessmentof Omega-3 Supplements Available in the Brazilian Market. Journal ofthe Brazilian Chemical Society, 29, 631-638.
[2] Kinsella JE, Shimp JL, Mai J, Weihrauch J (1977): Fatty acid contentand composition of freshwater finfish. Journal of the American OilChemists' Society, 54, 424-429.
[3] Chee KM, Gong JX, Good Rees DM, Meydanl M, Ausman L,Johnson J, Siguel EN, Schaefer EJ (1990): Fatty acid content of marineoil capsules. Lipids, 25, 523-528.
LOD: Limit Of Detection
GC-MS chromatogram of the omega-3 supplement n.1.The "syringe IS" was added in the final vial prior toinjecting in order to monitor possible variations in theretention time and in the injection volume
GC-MS chromatograms of the three supplements.Overlap. Peak of the "syringe IS". Note the goodinjection repeatibility both for the retention timeand for the injected volume. IS used was 15:1 ω-5
Mass spectrum of EPA. Supplement n.2
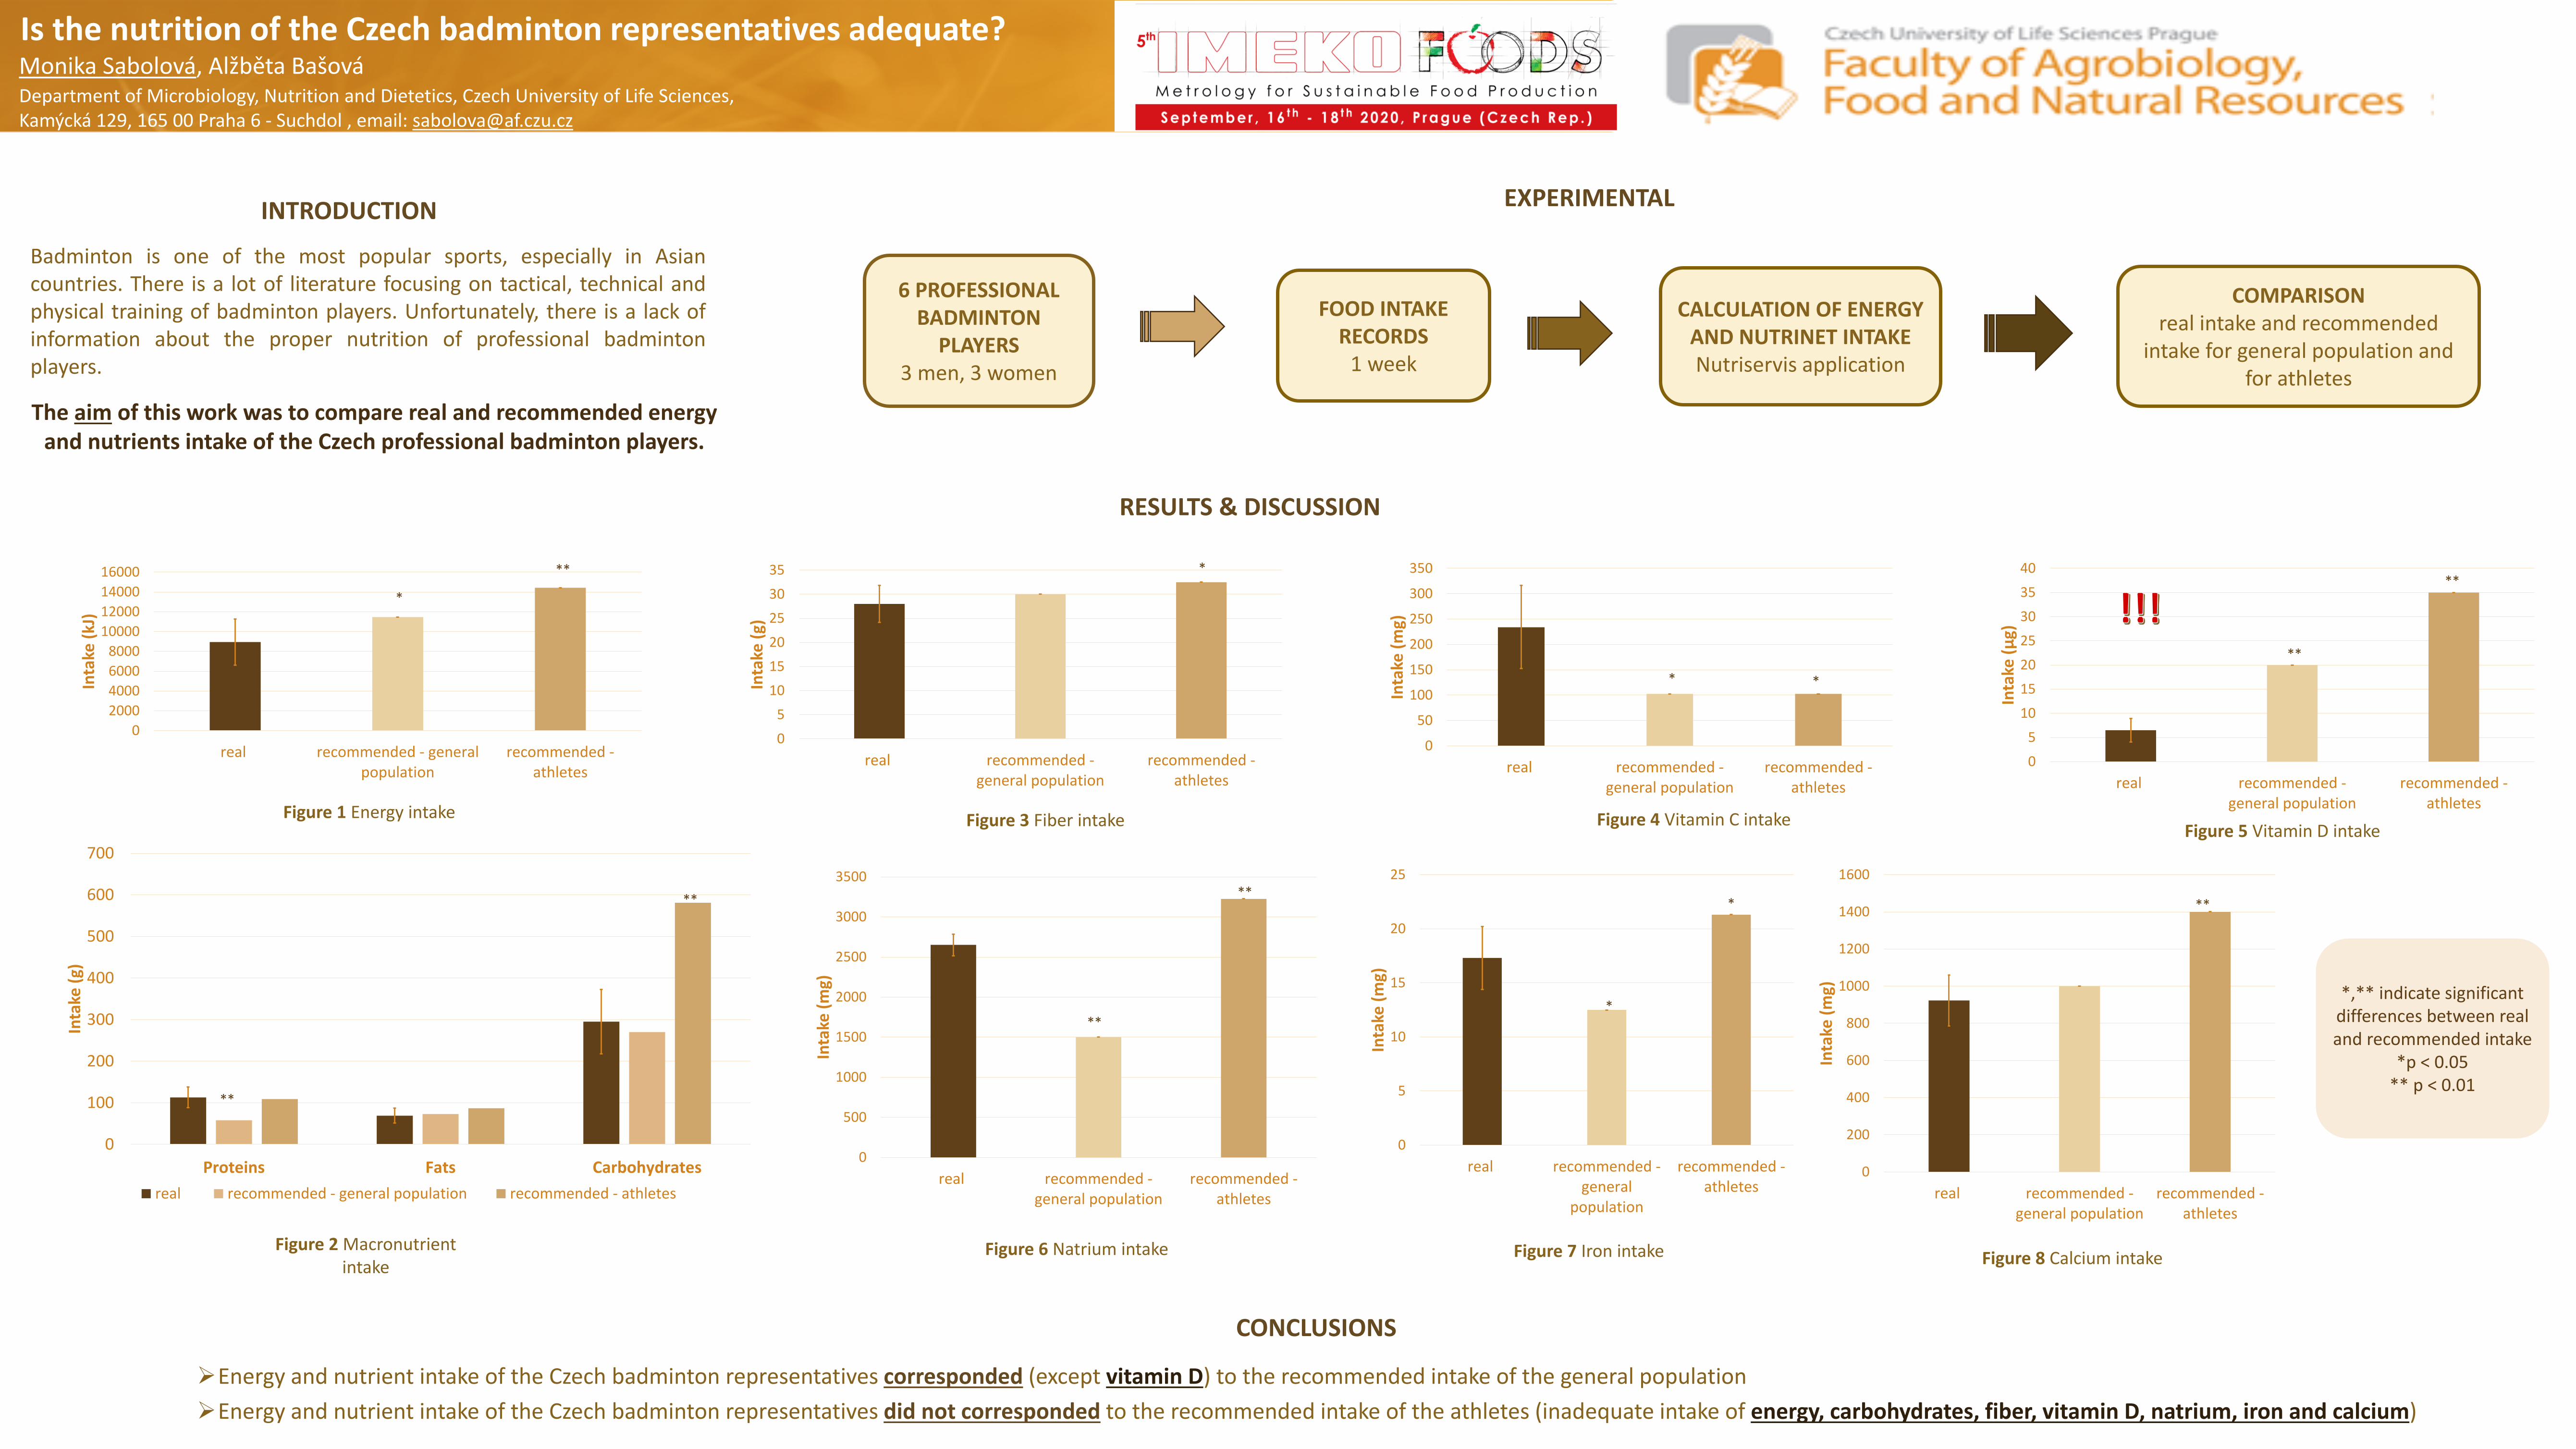
EXPERIMENTAL
Monika Sabolová, Alžběta BašováDepartment of Microbiology, Nutrition and Dietetics, Czech University of Life Sciences,Kamýcká 129, 165 00 Praha 6 - Suchdol , email: [email protected]
Is the nutrition of the Czech badminton representatives adequate?
The aim of this work was to compare real and recommended energy and nutrients intake of the Czech professional badminton players.
RESULTS & DISCUSSION
CONCLUSIONS
Energy and nutrient intake of the Czech badminton representatives corresponded (except vitamin D) to the recommended intake of the general population
Energy and nutrient intake of the Czech badminton representatives did not corresponded to the recommended intake of the athletes (inadequate intake of energy, carbohydrates, fiber, vitamin D, natrium, iron and calcium)
INTRODUCTION
Badminton is one of the most popular sports, especially in Asiancountries. There is a lot of literature focusing on tactical, technical andphysical training of badminton players. Unfortunately, there is a lack ofinformation about the proper nutrition of professional badmintonplayers.
6 PROFESSIONAL BADMINTON
PLAYERS3 men, 3 women
FOOD INTAKE RECORDS
1 week
CALCULATION OF ENERGY AND NUTRINET INTAKENutriservis application
COMPARISON real intake and recommended
intake for general population and for athletes
Figure 2 Macronutrient intake
0
100
200
300
400
500
600
700
Proteins Fats Carbohydrates
Inta
ke(g
)
real recommended - general population recommended - athletes
0
5
10
15
20
25
30
35
real recommended -general population
recommended -athletes
Inta
ke (
g)0
5
10
15
20
25
30
35
40
real recommended -general population
recommended -athletes
Inta
ke (
µg)
0
50
100
150
200
250
300
350
real recommended -general population
recommended -athletes
Inta
ke (
mg)
0
500
1000
1500
2000
2500
3000
3500
real recommended -general population
recommended -athletes
Inta
ke (
mg)
0
5
10
15
20
25
real recommended -general
population
recommended -athletes
Inta
ke (
mg)
0
200
400
600
800
1000
1200
1400
1600
real recommended -general population
recommended -athletes
Inta
ke (
mg)
0
2000
4000
6000
8000
10000
12000
14000
16000
real recommended - generalpopulation
recommended -athletes
Inta
ke (
kJ)
Figure 1 Energy intake Figure 3 Fiber intake Figure 4 Vitamin C intakeFigure 5 Vitamin D intake
Figure 6 Natrium intake Figure 7 Iron intake Figure 8 Calcium intake
*,** indicate significant differences between real and recommended intake
*p < 0.05 ** p < 0.01
*
**
**
**
*
*
*
**
**
**
**
**
*
*

NON COELIACGLUTENSENSITIVITY
WHAT ARE THE RESULTS?The results showed that neither gluten nor easily fermentable carbohydrates had asignificant effect on the intensity of negative symptoms in our volunteers. Theintensity of the negative symptoms was assessed subjectively using a visual analoguescale. The results of the study also showed that there was no significant change inanthropometric parameters and blood pressure due to the consumption of a gluten-free diet and a diet with a low content of easily fermentable carbohydrates.
HOW WE DID IT?The study lasted 14 weeks and consisting of two phases and invovle 9 volunteers. Thefirst phase included a gluten-containing diet and a gluten-free diet, as well asdouble-blind exposure weeks and the second phase included a diet with a reducedamount of easily fermentable carbohydrates followed by an exposure test. Theintensity of negative symptoms using a visual analogue scale, anthropometricparameters and blood pressure of all volunteers were regularly measured.
WHAT WE DID?We investigated the effect of consumption of gluten and easily fermentablecarbohydrates on the intensity of negative symptoms, anthropometric parameters andblood pressure. This was investigated using an observational clinical study.
WHAT IS NCGS? Non-celiac gluten sensitivity has recently become a frequently-discussed topic amongthe scientist, and despite a number of studies, it is still unclear what is the exactcause and mechanism of its origin.
AUTHORS: LADISLAV ŽATEČKA, MONIKA SABOLOVÁ

METROFOOD: an Infrastructure for Promoting Metrology in Food and Nutrition
Lucarini M., Benedetti B., Durazzo A., Ferrari Nicoli S., Di Lena G., Turrini A. and Lombardi-Boccia G.
CREA Research Centre for Food and Nutrition. Via Ardeatina 546, 00178 Rome (Italy)
E-mail: [email protected]
IntroductionMETROFOOD is an infrastructure aimed at improving the quality and
the reliability of measurements in food science. It promotes data
sharing, cooperation of the scientific community and harmonization of
procedures. The project engages multiple actors and sectors throughout
the food value chain, including sustainable development, food safety,
quality, traceability, authenticity, environmental safety and human
health. The METROFOOD network will include analytical laboratories
for the characterization of agri-food matrices and technological
systems for the production and transformation of food.
Conclusions and perspectives➢ Fish waste is rich in polyunsaturated fatty acids and is source of tocopherols,
retinol, squalene and phytosterols (in minor extent)
➢Quantitative chromatographic data can be correlated to FTIR spectra by
chemometric models, speeding analysis
➢ The identified compounds can be recovered through sustainable approaches in
the form of fish oil, a resource for many industrial applications
Fatty acids composition determined by GC/MS
• Extraction of lipids by Bligh&Dyer method(1)
• Methylation of Fatty acids by BF3 in MeOH→ Fatty Acid Methyl Esters (FAME)
• GC-MS-FID analysis (qualititive and semi-quantitative)
Aim of the present workIn the METROFOOD framework, an important aspect is the exploitation of
food by-products, to reduce waste and promote circular economy. In fact,
waste from the food chain is becoming a resource, since it can provide new
high-added value ingredients. The case study here reported describes an
approach to valorise fisheries waste. Although unsuitable for human
consumption, it is rich of valuable nutrients, such as polyunsaturated fatty
acids (EPA, DHA) and liposoluble vitamins. These can be recovered in the
form of fish oil, by applying sustainable biotechnological processes, thus
becoming important for several industrial applications.
Development of new high-value added food products
Fish discards collection
Sampling procedure
Pre-treatment
Identification of desirable compounds
for end-usersChemical profiling
(analytical determination based on
separation/purification techniques)
Enzyme-based green extraction
Fish oil production and
characterization
Exploitation of fish processing waste
EXPERIMENTAL
Fatty acid
(analyzed as methyl ester)
Sea bream
HEADS
Sea bream
VISCERA
Sea bream
FRAMES
Anchovies
HEAD+VISCERA
% (relative quantitation)
C14:0 2 ± 0.8 2.2 ± 1 2.2 ± 1.4 4.8 ± 1.9
C15:0 ND ND ND 1.2 ± 0.5
C16:0 17 ± 4.2 17.1 ± 4 16.9 ± 2.1 30.3 ± 6.6
C16:1 4.4 ± 1.6 4.1 ± 1.1 4.5 ± 1.9 5.2 ± 1.5
C17:0 ND ND ND 1.1 ± 0.1
C17:1 ND ND ND 0.5 ± 0.1
C18:0 3.7 ± 0.6 4.3 ± 1 3.4 ± 0.4 6 ± 0.7
C18:1 (elaidic+oleic) 44.9 ± 4.6 40 ± 8.8 41.4 ± 5.7 20.6 ± 4.5
C18:2 21 ± 2 23.2 ± 5.7 20.6 ± 6.7 1.1 ± 0.6
C18:3 4.8 ± 1 4 ± 0.7 4.1 ± 0.6 ND
C20:1 1.4 ± 0.7 1.1 ± 0.5 1.6 ± 0.7 0.9 ± 0.5
C20:4 ND ND ND 2.3 ± 1.3
C20:5 (EPA) 0.8 ± 0.4 1.5 ± 0.5 2.3 ± 1.7 7.6 ± 4.3
C22:6 (DHA) 2.2 ± 1.9 3.5 ± 0.4 4.1 ± 1.6 17.9 ± 8.6
Characterization of fish waste
SamplesWaste: heads, viscera, framesThe waste material coming from anchovies
processing were pooled and treated as a
unique matrix (heads+viscera); the waste
from sea bream was divided into viscera,
frames and heads.
Analytical equipment
GC-MS-FID
LC-MS/MS
EPA
DHA
CompoundSea bream
VISCERA
Sea bream
FRAMES
Anchovies
HEADS+VISCERA
µg/g (fresh sample)
retinol 46.6 ± 3.4 0.1 ± 0.01 4.8 ± 0.4
γ-tocopherol 0.9 ± 0.1 ND 0.1 ± 0.01
α-tocopherol 44.8 ± 5.5 12 ± 1.5 1.1 ± 0.1
squalene 33.2 ± 4.8 10.7 ± 1.5 7.3 ± 1
β-sitosterol 25.4 ± 2.4 0.6 ± 0.1 4.6 ± 0.4
brassicasterol 1.6 ± 0.1 ND ND
campesterol 2.5 ± 0.2 ND 2.8 ± 0.2
sitostanol 9.1 ± 0.6 ND 1.6 ± 0.1
stigmasterol 7.6 ± 1.1 ND 2.1 ± 0.3
Liposoluble bioactive compounds determined by LC/MS-MS
• Lipidic extract subjected to hot saponification by KOH in EtOH
• Extraction of the unsaponifiable fraction by ethyl acetate/hexane
• LC-APCI-MS/MS analysis (absolute quantitation and reliable identification)
References
(1) Bligh, E. G., & Dyer, W. J. A rapid method of total lipid extraction and purification. Canadian J. of 387 Biochemistry and Physiology,
1959, 37: 911-917.
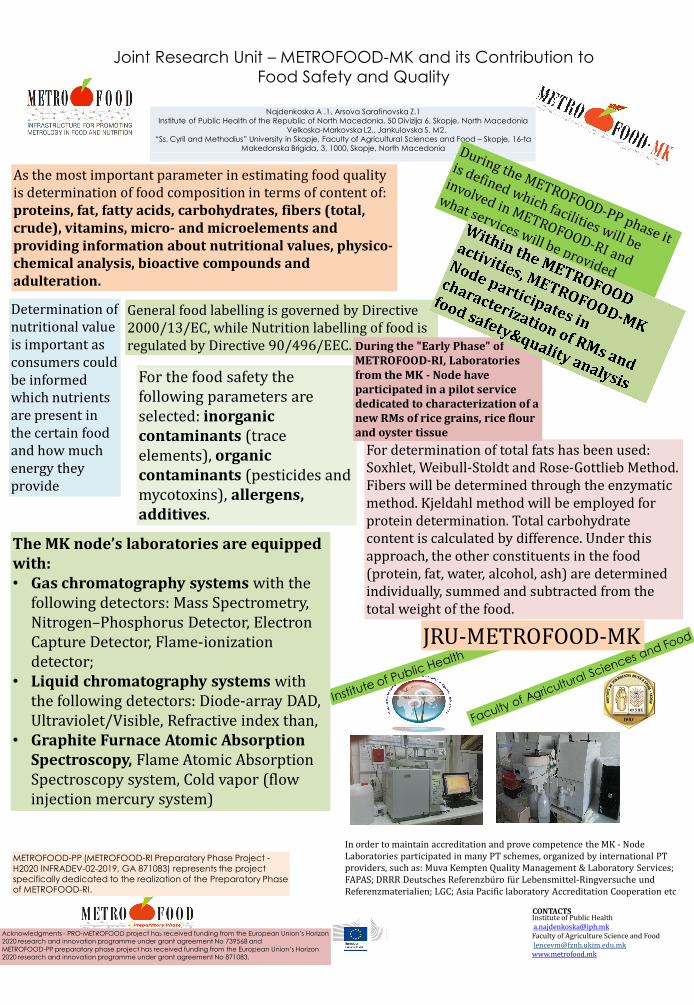
CONTACTSInstitute of Public [email protected] of Agriculture Science and [email protected]
Joint Research Unit – METROFOOD-MK and its Contribution to Food Safety and Quality
Najdenkoska A .1, Arsova Sarafinovska Z.1Institute of Public Health of the Republic of North Macedonia, 50 Divizija 6, Skopje, North Macedonia
Velkoska-Markovska L2., Jankulovska S. M2. “Ss. Cyril and Methodius” University in Skopje, Faculty of Agricultural Sciences and Food – Skopje, 16-ta
Makedonska Brigida, 3, 1000, Skopje, North Macedonia
JRU-METROFOOD-MK
Acknowledgments - PRO-METROFOOD project has received funding from the European Union’s Horizon 2020 research and innovation programme under grant agreement No 739568 and METROFOOD-PP preparatory phase project has received funding from the European Union’s Horizon 2020 research and innovation programme under grant agreement No 871083.
METROFOOD-PP (METROFOOD-RI Preparatory Phase Project -H2020 INFRADEV-02-2019, GA 871083) represents the project specifically dedicated to the realization of the Preparatory Phase of METROFOOD-RI.
The MK node’s laboratories are equipped with: • Gas chromatography systems with the
following detectors: Mass Spectrometry, Nitrogen–Phosphorus Detector, Electron Capture Detector, Flame-ionization detector;
• Liquid chromatography systems with the following detectors: Diode-array DAD, Ultraviolet/Visible, Refractive index than,
• Graphite Furnace Atomic Absorption Spectroscopy, Flame Atomic Absorption Spectroscopy system, Cold vapor (flow injection mercury system)
For the food safety the following parameters are selected: inorganic contaminants (trace elements), organic contaminants (pesticides and mycotoxins), allergens, additives.
As the most important parameter in estimating food quality is determination of food composition in terms of content of:proteins, fat, fatty acids, carbohydrates, fibers (total, crude), vitamins, micro- and microelements and providing information about nutritional values, physico-chemical analysis, bioactive compounds and adulteration.
Determination of nutritional value is important as consumers could be informed which nutrients are present in the certain food and how much energy they provide
For determination of total fats has been used: Soxhlet, Weibull-Stoldt and Rose-Gottlieb Method. Fibers will be determined through the enzymatic method. Kjeldahl method will be employed for protein determination. Total carbohydrate content is calculated by difference. Under this approach, the other constituents in the food (protein, fat, water, alcohol, ash) are determined individually, summed and subtracted from the total weight of the food.
General food labelling is governed by Directive 2000/13/EC, while Nutrition labelling of food is regulated by Directive 90/496/EEC.
In order to maintain accreditation and prove competence the MK - Node Laboratories participated in many PT schemes, organized by international PT providers, such as: Muva Kempten Quality Management & Laboratory Services; FAPAS; DRRR Deutsches Referenzbüro für Lebensmittel-Ringversuche und Referenzmaterialien; LGC; Asia Pacific laboratory Accreditation Cooperation etc
During the "Early Phase" of METROFOOD-RI, Laboratories from the MK - Node have participated in a pilot service dedicated to characterization of a new RMs of rice grains, rice flour and oyster tissue
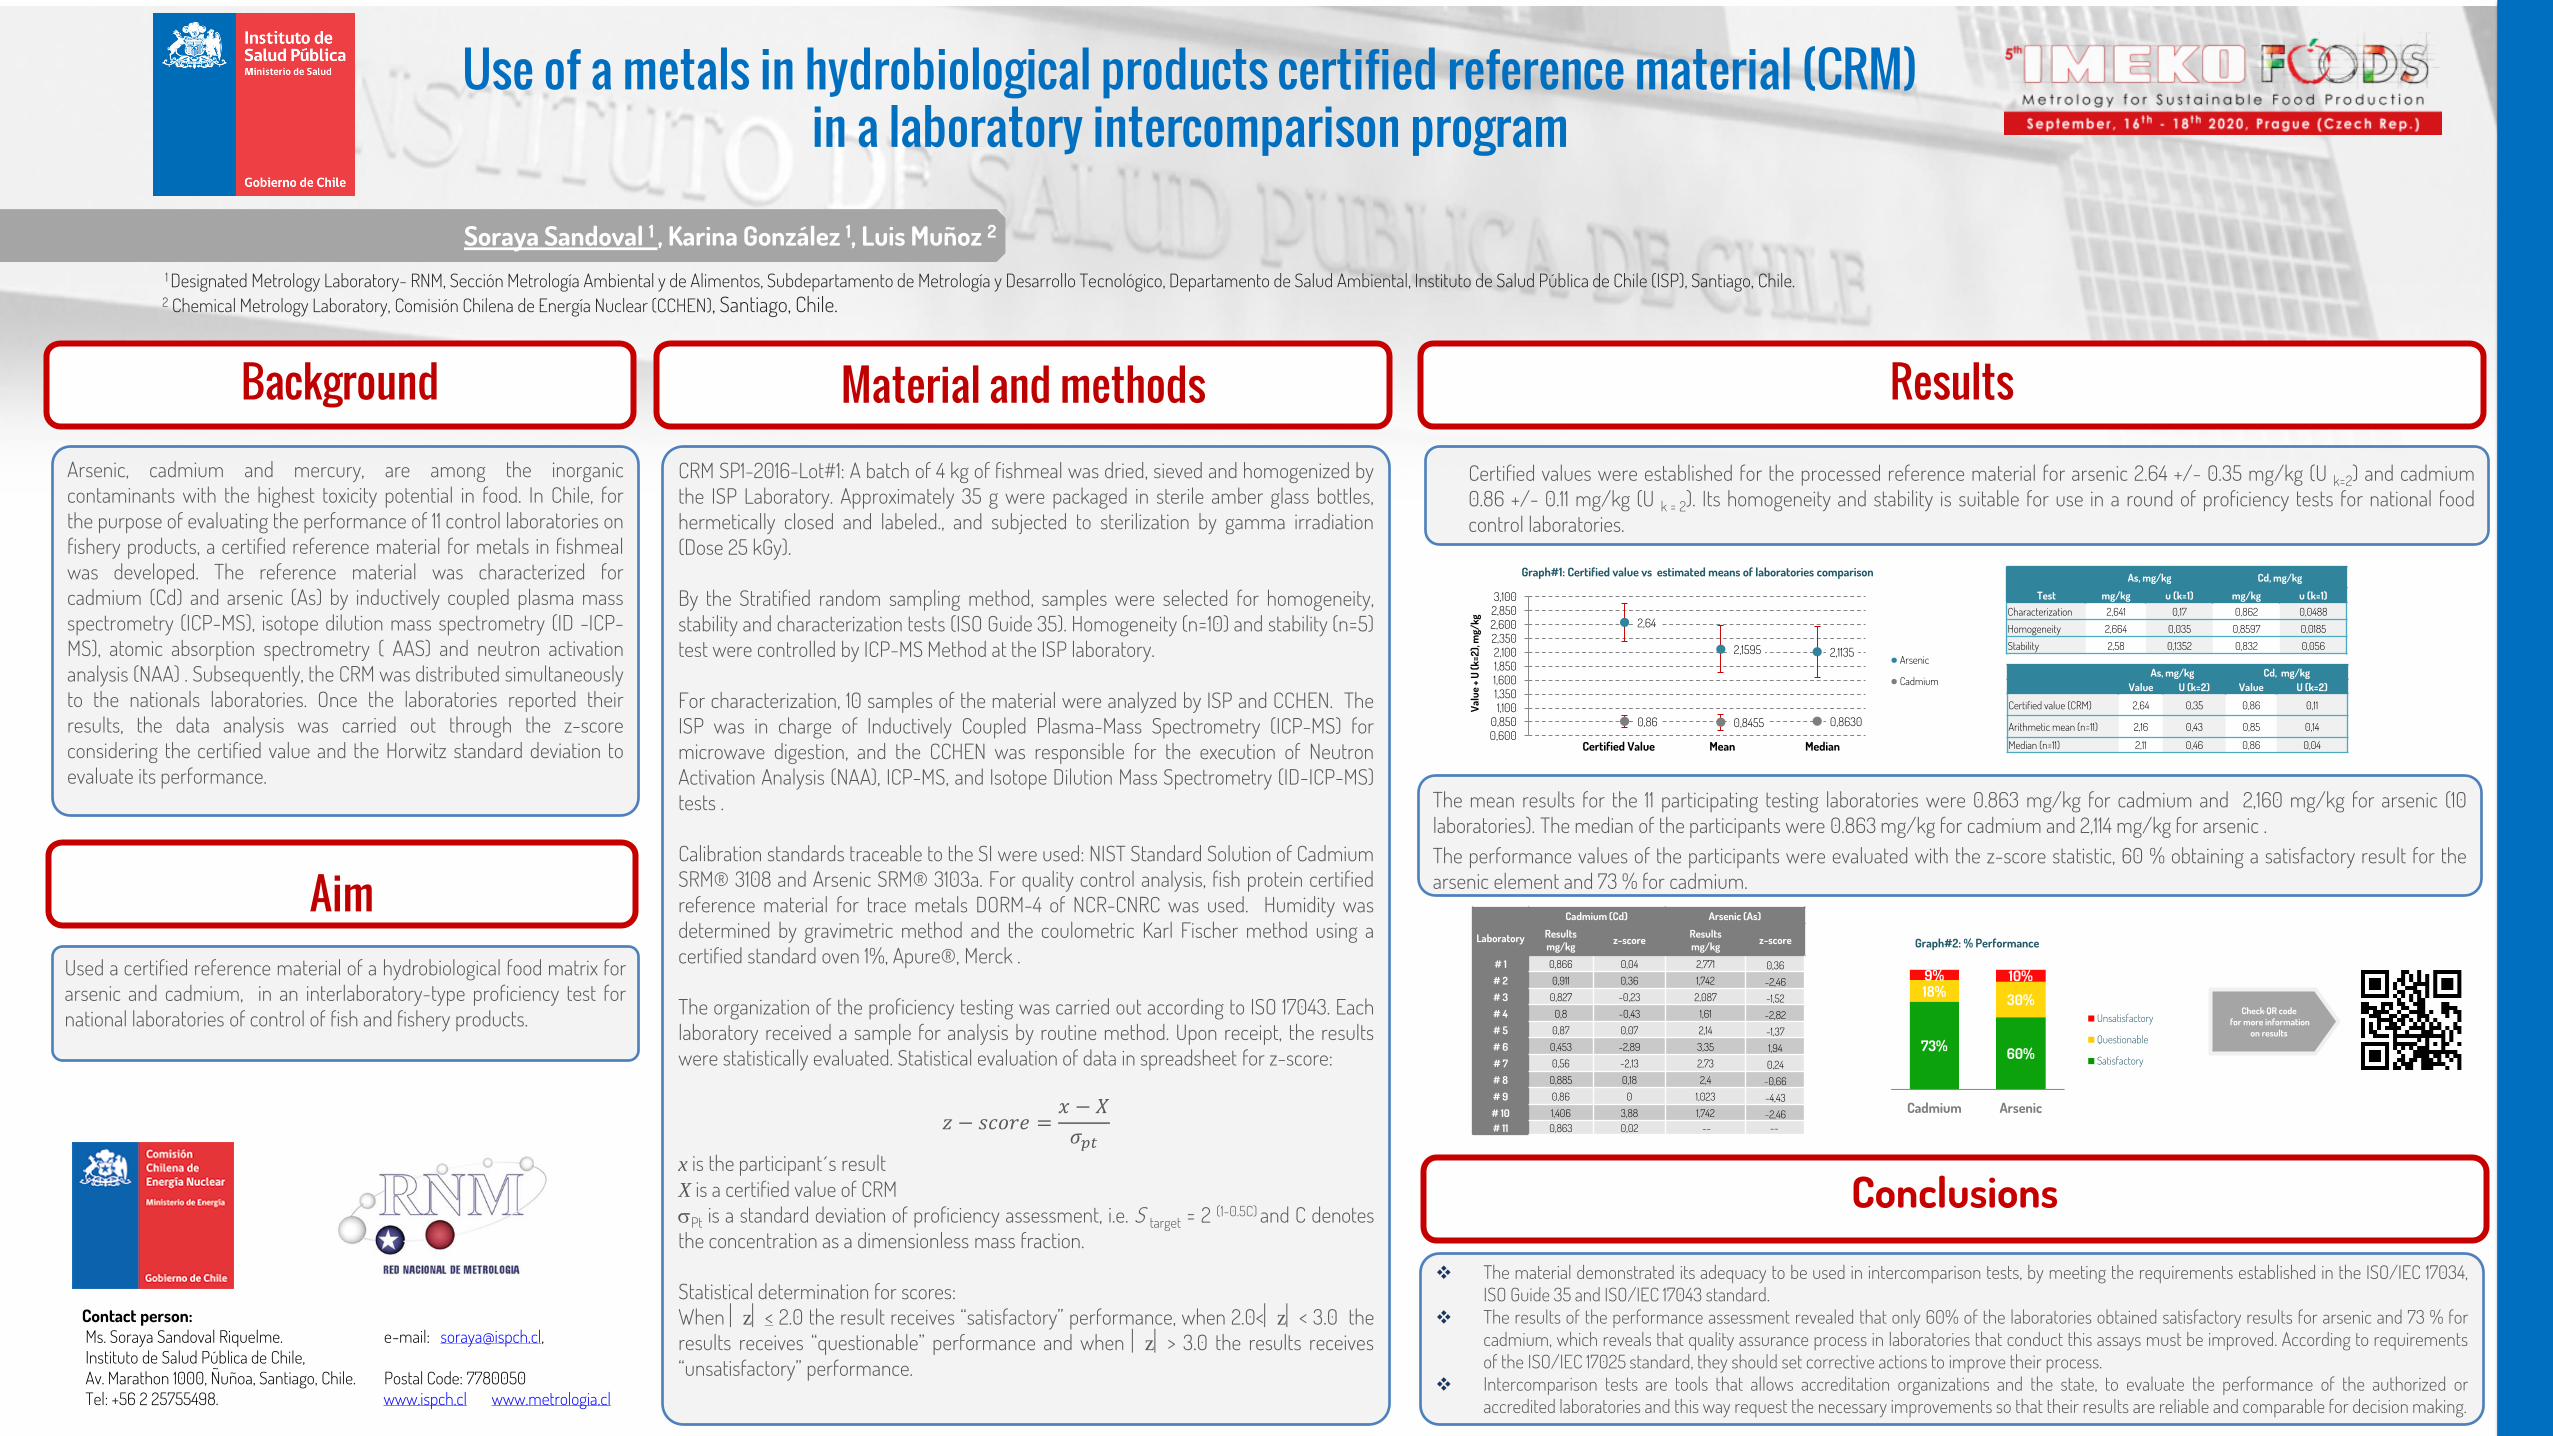
Use of a metals in hydrobiological products certified reference material (CRM) in a laboratory intercomparison program
Soraya Sandoval 1 , Karina González 1, Luis Muñoz 2
1 Designated Metrology Laboratory- RNM, Sección Metrología Ambiental y de Alimentos, Subdepartamento de Metrología y Desarrollo Tecnológico, Departamento de Salud Ambiental, Instituto de Salud Pública de Chile (ISP), Santiago, Chile. 2 Chemical Metrology Laboratory, Comisión Chilena de Energía Nuclear (CCHEN), Santiago, Chile.
Background Arsenic, cadmium and mercury, are among the inorganic contaminants with the highest toxicity potential in food. In Chile, for the purpose of evaluating the performance of 11 control laboratories on fishery products, a certified reference material for metals in fishmeal was developed. The reference material was characterized for cadmium (Cd) and arsenic (As) by inductively coupled plasma mass spectrometry (ICP-MS), isotope dilution mass spectrometry (ID -ICP-MS), atomic absorption spectrometry ( AAS) and neutron activation analysis (NAA) . Subsequently, the CRM was distributed simultaneously to the nationals laboratories. Once the laboratories reported their results, the data analysis was carried out through the z-score considering the certified value and the Horwitz standard deviation to evaluate its performance.
Aim Used a certified reference material of a hydrobiological food matrix for arsenic and cadmium, in an interlaboratory-type proficiency test for national laboratories of control of fish and fishery products.
Material and methods CRM SP1-2016-Lot#1: A batch of 4 kg of fishmeal was dried, sieved and homogenized by the ISP Laboratory. Approximately 35 g were packaged in sterile amber glass bottles, hermetically closed and labeled., and subjected to sterilization by gamma irradiation (Dose 25 kGy). By the Stratified random sampling method, samples were selected for homogeneity, stability and characterization tests (ISO Guide 35). Homogeneity (n=10) and stability (n=5) test were controlled by ICP-MS Method at the ISP laboratory. For characterization, 10 samples of the material were analyzed by ISP and CCHEN. The ISP was in charge of Inductively Coupled Plasma-Mass Spectrometry (ICP-MS) for microwave digestion, and the CCHEN was responsible for the execution of Neutron Activation Analysis (NAA), ICP-MS, and Isotope Dilution Mass Spectrometry (ID-ICP-MS) tests . Calibration standards traceable to the SI were used: NIST Standard Solution of Cadmium SRM® 3108 and Arsenic SRM® 3103a. For quality control analysis, fish protein certified reference material for trace metals DORM-4 of NCR-CNRC was used. Humidity was determined by gravimetric method and the coulometric Karl Fischer method using a certified standard oven 1%, Apure®, Merck . The organization of the proficiency testing was carried out according to ISO 17043. Each laboratory received a sample for analysis by routine method. Upon receipt, the results were statistically evaluated. Statistical evaluation of data in spreadsheet for z-score:
𝑧 − 𝑠𝑐𝑜𝑟𝑒 =𝑥 − 𝑋
𝜎𝑝𝑡
x is the participant´s result X is a certified value of CRM Pt is a standard deviation of proficiency assessment, i.e. S target = 2 (1-0.5C) and C denotes the concentration as a dimensionless mass fraction. Statistical determination for scores: When z< 2.0 the result receives “satisfactory” performance, when 2.0<z< 3.0 the results receives “questionable” performance and when z> 3.0 the results receives “unsatisfactory” performance.
Results
Certified values were established for the processed reference material for arsenic 2.64 +/- 0.35 mg/kg (U k=2) and cadmium 0.86 +/- 0.11 mg/kg (U k = 2). Its homogeneity and stability is suitable for use in a round of proficiency tests for national food control laboratories.
2,64
2,1595 2,1135
0,86 0,8455 0,8630 0,6000,850
1,1001,3501,6001,8502,1002,3502,6002,8503,100
Valu
e +
U (k
=2),
mg/
kg
Certified Value Mean Median
Graph#1: Certified value vs estimated means of laboratories comparison
Arsenic
Cadmium
As, mg/kg Cd, mg/kg
Test mg/kg u (k=1) mg/kg u (k=1) Characterization 2,641 0,17 0,862 0,0488
Homogeneity 2,664 0,035 0,8597 0,0185
Stability 2,58 0,1352 0,832 0,056
Contact person: Ms. Soraya Sandoval Riquelme. e-mail: [email protected], Instituto de Salud Pública de Chile, Av. Marathon 1000, Ñuñoa, Santiago, Chile. Postal Code: 7780050 Tel: +56 2 25755498. www.ispch.cl www.metrologia.cl
As, mg/kg Cd, mg/kg Value U (k=2) Value U (k=2)
Certified value (CRM) 2,64 0,35 0,86 0,11
Arithmetic mean (n=11) 2,16 0,43 0,85 0,14
Median (n=11) 2,11 0,46 0,86 0,04
The mean results for the 11 participating testing laboratories were 0.863 mg/kg for cadmium and 2,160 mg/kg for arsenic (10 laboratories). The median of the participants were 0.863 mg/kg for cadmium and 2,114 mg/kg for arsenic .
The performance values of the participants were evaluated with the z-score statistic, 60 % obtaining a satisfactory result for the arsenic element and 73 % for cadmium.
Laboratory
Cadmium (Cd) Arsenic (As)
Results mg/kg z-score Results
mg/kg z-score
# 1 0,866 0,04 2,771 0,36 # 2 0,911 0,36 1,742 -2,46 # 3 0,827 -0,23 2,087 -1,52 # 4 0,8 -0,43 1,61 -2,82 # 5 0,87 0,07 2,14 -1,37 # 6 0,453 -2,89 3,35 1,94 # 7 0,56 -2,13 2,73 0,24 # 8 0,885 0,18 2,4 -0,66 # 9 0,86 0 1,023 -4,43 # 10 1,406 3,88 1,742 -2,46 # 11 0,863 0,02 -- --
Cadmium Arsenic
73% 60%
18% 30%
9% 10%
Graph#2: % Performance
Unsatisfactory
Questionable
Satisfactory
Check QR code for more information
on results
Conclusions
The material demonstrated its adequacy to be used in intercomparison tests, by meeting the requirements established in the ISO/IEC 17034, ISO Guide 35 and ISO/IEC 17043 standard.
The results of the performance assessment revealed that only 60% of the laboratories obtained satisfactory results for arsenic and 73 % for cadmium, which reveals that quality assurance process in laboratories that conduct this assays must be improved. According to requirements of the ISO/IEC 17025 standard, they should set corrective actions to improve their process.
Intercomparison tests are tools that allows accreditation organizations and the state, to evaluate the performance of the authorized or accredited laboratories and this way request the necessary improvements so that their results are reliable and comparable for decision making.

Active Food Packaging Joins Quality by Design for the Development of Antimicrobial MaterialsContaining Essential Oil–based
Department of Chemistry “U. Schiff”,
the critical parameters
(CPPs) investigated in the 40– μg
absorbance values of each bacterial suspension at
λ °
° ° °
, 7, 17929–
. The work also benefited from the framework of the COMP-HUB Initiative, funded
by the ‘Departments of Excellence’
Probability map obtained by plotting CARconcentration vs. THY concentration maintaining CINconcentration at 105 µg/
I.
II.
III.
IV. ±
±
μg μgμg
: used to depict how the CPPs settings can bevaried around the selected set-point still guaranteeing a level ofprobability ≥

Clitoria ternatea extract as a source of antioxidant compounds in chitosan based edible filmsand their intelligent properties
Jancikova S., Dordevic D., Tesikova K., Antonic B., Tremlova B.
Department of Plant Origin Food Sciences, University of Veterinary and Pharmaceutical Sciences Brno, Palackeho tr. 1946/1, 612 42, Brno, Czech Republic
AIMThe aim of the study was to add a water based Clitoriaternatea (also called blue tea) extract to the chitosan filmsand measured antioxidant potential of experimentallyproduced edible packaging. Another part of the research isfocused on the determination of intelligent properties dueto the presence of anthocyanins responsible for changingcolour in different pH.
MATERIAL AND METHODSEdible films consisted of chitosan, glycerol and Clitoriaternatea extract in the following concentrations 5, 10, 20, 30and 40 % were prepared. DPPH assay was used as adetermination of antioxidant properties. DPPH solution inethanol was mixed with 3 mL of ethanolic extract of filmsand incubated for 30 minutes in dark. The absorbance wasmeasured at 517 nm and DPPH scavenging activity wasexpressed as a percentage. The polyphenol content wasmeasured with Folin-Ciocalteau solution. The absorbancewas measured at 765 nm and the polyphenol content wasexpressed as an amount of gallic acid (mg/g). The intelligentproperties were analysed by dipping films in 1M HCl and 1MNaOH.
RESULTSIt was found out that films with Clitoria ternatea extract donot have a high antioxidant activity, the highest results forDPPH was around 3 %, which is very low, in comparison withthe article by Jancikova et al. (2019): 87.84 ± 0.07 % forcarrageenan films with 20 % of dried rosemary extract. Totalpolyphenol content as an indicator of antioxidant activity isalso not too high (max. 14.85 ± 0.65 mg gallic acid/g ofsample). The best intelligent properties were confirmed inthe films with 40 % of extract. Film´s colour in neutral pHwas blue, in acidic pink and in basic green.
CONCLUSION
Prepared films with addition of blue tea extract are not agood source of polyphenolic and antioxidant compounds. Inthe future researches the concentration of extract should beincreased or the amount of Clitoria ternatea used for extractpreparation should be higher. Concentration 40 % of blue teaextract is sufficient for the intelligent properties, so the filmcould potentially work as an indicator of foodstuff´s shelf life.
ACKNOWLEDGMENT
This research was supported by Internal grant agency in the University of
Veterinary and Pharmaceutical Sciences Brno project number 229/2020/FVHE.
Sample TPC (mg gallic acid/g) DPPH (%)
CHL 2.19 ± 0.55a 0.38 ± 0.09a
5CHLMČ 3.20 ± 0.42a 0.59 ± 0.05a
10CHLMČ 3.86 ± 0.22a 0.42 ± 0.16a
20CHLMČ 7.65 ± 0.17b 3.12 ± 0.12b
30CHLMČ 10.04 ± 0.06c 3.90 ± 0.15c
40CHLMČ 14.85 ± 0.65d 3.96 ± 0.07c
0.1M HCl 0.1M NaOH

Achievement & Capacity Development within the Greek Node of METROFOOD-RI
Capacity development within the Greek Node of METROFOOD-RI regarding food processing. Challenges and opportunities for fermented food product reformulation
THE GREEK NODE FOOD REFORMULATION GROUP: Tsimidou, M.Z.1, Mantzouridou, F.Th.1, Trichopoulou, A.2, Tsakalidou, E.3, Kazou, M.3, Tarantilis, P.3
1 ARISTOTLE UNIVERSITY OF THESSALONIKI (AUTH); 2HELLENIC HEALTH FOUNDATION (HHF); 3AGRICULTURAL UNIVERSITY OF ATHENS (AUA)
The Greek Node of METROFOOD–RI provides the expertise and the servicesrelated to both the “Metro” and the “Food” side of the physical infrastructure.Particularly, considering the “Food” side, the facilities are related to primaryproduction up to food and beverage processing and waste treatment. As a casestudy, this work is focused on capacity development within the Greek Node ofMETROFOOD–RI regarding food processing. The topic chosen is ‘foodreformulation’, the sub-topic is ‘reformulation of fermented food products’and the food for which capacity development is foreseen is ‘table olives’.
Food reformulation may be defined as the action of“reformulating existing foods to remove (e.g. trans fatty acids)or reduce (e.g. sugars, saturated fat, salt) certain foodcomponents while maintaining characteristics, such as flavour,texture and shelf life”. 1
Food reformulation is not an easy task and needs to bedeveloped product by product.
Reformulation of fermented foods, which account for approximately the1/3 of all foods and beverages consumed, is not a straightforward process.The reason is that their manufacturing is strongly depended on salt or sugarcontent, which cannot be easily reduced. Food microbiota is the drivingforce in food fermentations. Ιn any food microbial ecosystem, thesurveillance and control of the balance, in favor of the technological andfunctional microbial members over the spoilage and pathogenic ones,guarantee the quality, nutritional value and safety of the final product.
Table olives production process flow charts
Challenges and Opportunities for Reformulation of Table Olives“Table olives” is the product: (α) prepared from the sound fruits of varieties of the cultivated olive tree (Olea europaea L.) having reached appropriate degree of development for processing that are chosen for their production of olives whose volume, shape, flesh-to-stone ratio, fine
flesh, taste, firmness and ease of detachment from the stone make them particularly suitable for processing; (b) treated to remove its bitterness and preserved by natural fermentation, and/or by heat treatment, and/or by other means so as to prevent spoilage and to ensure product stability in appropriate storage conditions with or without the addition of preservatives; (c) packed with or without a suitable liquid packing medium (CODEX STAN 66-1981).
Duplication of table olive world production since 2000(3.8 million tonnes). The EU member states cover the 31%. Of this,Spain, Italy, and Greece are the major producing ones (97% of theEU production).2
REFERENCES[1] van Raaij J, Hendriksen M, Verhagen H (2008): Potential for improvement of population diet through reformulation of commonly eaten foods. Public Health Nutrition, 12, 325-330; [2]https://www.internationaloliveoil.org/what-we-do/economic-affairs-promotion-unit/#figures; [3] Mastralexi A, Mantzouridou FTh, Tsimidou MZ (2019): Evolution of safety and other quality parameters of the Greek PDO table olives “Prasines Elies Chalkidikis” during Industrial scale processing and storage. Eur. J. Lipid Sci. Technol. 121, 1800171; [4] Mantzouridou FTh, Mastralexi A, Filippidou M, Tsimidou MZ (2020): Challenges in the processing line of Spanish Style cv. Chalkidiki Green Table Olives spontaneously fermented in reduced NaCl content brines. Eur. J. Lipid Sci. 122(4):1900453; [5] Kazou M, Tzamourani A, Panagou EZ, Tsakalidou E (2020): Unraveling the microbiota of natural black cv. Kalamata fermented olives through 16S and ITS metataxonomic analysis. Microorganisms, 8, 672.
ACKNOWELEDGEMENT: METROFOOD-PP project has received funding from the European Union’s Horizon 2020 research and innovation programme under grant agreement No 871083.
Integration of expertise for further research activities toward reformulation of specific commercialtypes of table olives and other products, too.
Updating the existing Greek Food Composition Tables (GrFCT) with data for newly launchedreformulated foods.
Enhancement of links with the Greek table olive industry. Strengthening international links within METROFOOD RI on this topic. Communication with the International Olive Council about the need for new standards for the
reformulated products. Consumer education activities about the nutritional properties of reformulated products.
STRATEGIES
References
INTRODUCTIONThe agrifood sector is a very complex systemand owns many responsibilities. A food productshould have nutritional and sensorial quality,should be safe, authentic, sustainable andethically produced, as well as traceable all alongthe supply chain. Nowadays, there are still manyissues worldwide in all those aspects, indicatingthat the Food Supply Chain Management(FSCM) approaches used can be improved.It is fundamental to deeply understand how foodsupply chain is structured, operates, performsand is managed, in order to increase itscompetitiveness and sustainability, identifyingsuitable management tools and indicators alongwith the main influencing factors.
Final purpose: to create an integrated system of interoperable dataallowing FSCM to make more informed decisions that will lead toimprovements such as higher yields, greater nutritional value ofproducts, decreased production costs and losses, higher traceability
Big data analytics - a method with thecapability of managing data that can helpto make graphical decisions with moreaccurate data input by excavating hiddenand invaluable information or knowledge.
Blockchain technology - it ensures dataauthenticity, saves transaction time,removes overheads and intermediarycosts, reduces risk of tampering, fraudand cybercrime.
CHALLENGES
Improve technology transfer
Avoid duplication of effortsand time and money waste
Avoid knowledge fragmentation among actors, promoting integration
Improve data sharingNACCP (Nutrient hazard Analysis and Critical Control Points) - to evaluate and guarantee total quality management in the maintenance of high nutritional levels (2)
(1) M. D. Wilkinson et al., «The FAIR Guiding Principles for scientific data management and stewardship», Sci Data, vol. 3, n. 1, pag. 160018, dic. 2016, doi: 10.1038/sdata.2016.18(2) L. Di Renzo et al., «Food safety and nutritional quality for the prevention of non communicable diseases: the Nutrient, hazard Analysis and Critical Control Point process (NACCP)», J Transl Med, vol. 13, n. 1, pag. 128, dic. 2015, doi:10.1186/s12967-015-0484-2
Researches
Consumers
Authorities/ Organizations
Suppliers
Producers
Processors
Distributors
Retailers
PROPOSED MODEL - An integrated network to share integrated andinteroperable data (e.g. analytical data on quality, safety and authenticity;data on production and movement of goods; technologies; regulations; etc.)among all the interested stakeholders, and integrate academic knowledgewith FSCM, by combining different technologies and models.
Data sharing should integrate:
(1)
PARAMETERS TO BE MONITORED & LOADED
IN THE NETWORK
üQualityüSafetyüAuthenticity üTraceabilityüProduction yield &
technologyüMovement of goodsüRegulations, SOPs
and good practicesü…..
Data sharing to improve food supply chain management Palocci C.1, Zoani C.2
1 Department of Enterprise Engineering, University of Rome Tor Vergata, Rome, Italy2 ENEA, Italian National Agency for New Technologies, Energy and Sustainable Economic Development, Dept. for Sustainability,
Biotechnologies and Agro-Industry Division (ENEA SSPT-BIOAG), Casaccia Research Center, Rome, Italy
FAIR principles
Following:
AcknowledgementFNS-Cloud project received funding from the European Union’s Horizon 2020research and innovation programme under grant agreement No 863059
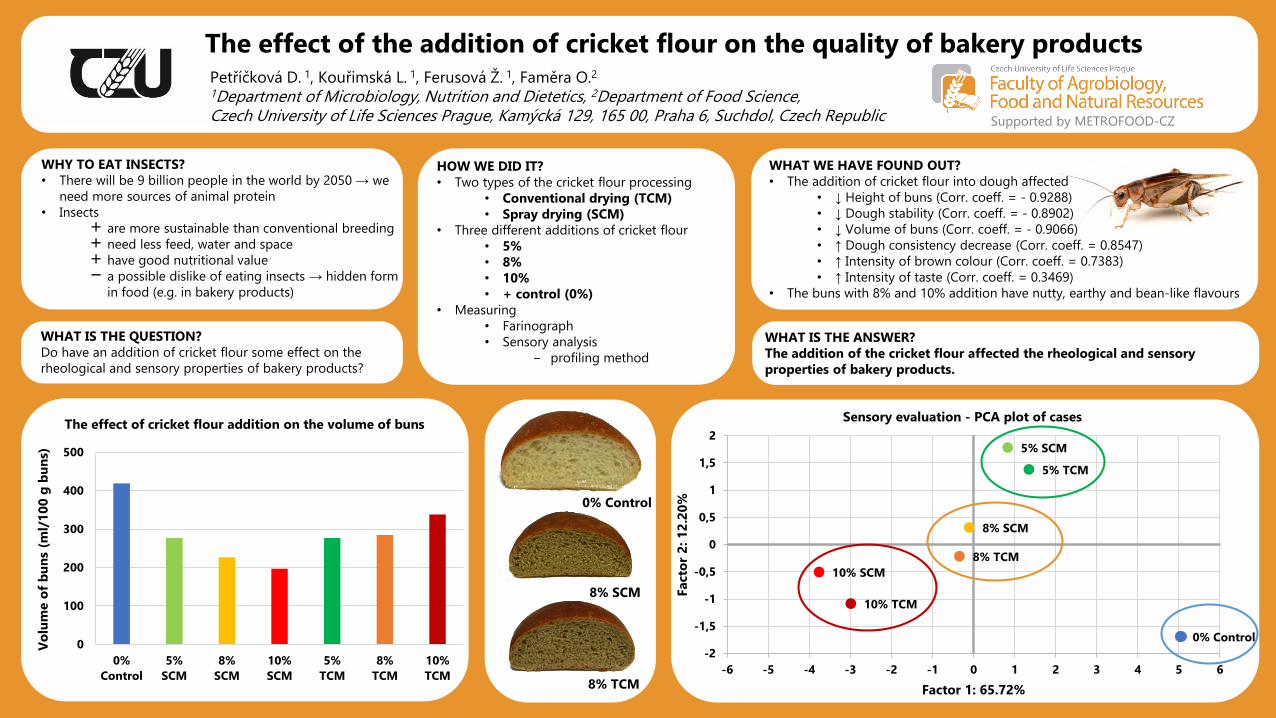
WHAT WE HAVE FOUND OUT?• The addition of cricket flour into dough affected
• ↓ Height of buns (Corr. coeff. = - 0.9288)
• ↓ Dough stability (Corr. coeff. = - 0.8902)
• ↓ Volume of buns (Corr. coeff. = - 0.9066)
• ↑ Dough consistency decrease (Corr. coeff. = 0.8547)
• ↑ Intensity of brown colour (Corr. coeff. = 0.7383)
• ↑ Intensity of taste (Corr. coeff. = 0.3469)
• The buns with 8% and 10% addition have nutty, earthy and bean-like flavours
Petříčková D. 1, Kouřimská L. 1, Ferusová Ž. 1, Faměra O.2
1Department of Microbiology, Nutrition and Dietetics, 2Department of Food Science, Czech University of Life Sciences Prague, Kamýcká 129, 165 00, Praha 6, Suchdol, Czech Republic
The effect of the addition of cricket flour on the quality of bakery products
WHAT IS THE ANSWER?The addition of the cricket flour affected the rheological and sensory properties
of bakery products.
HOW WE DID IT?• Two types of the cricket flour processing
• Conventional drying (TCM)• Spray drying (SCM)
• Three different additions of cricket flour
• 5%• 8% • 10%• + control (0%)
• Measuring
• Farinograph
• Sensory analysis
− profiling method
WHAT IS THE QUESTION?Do have an addition of cricket flour some effect on the
rheological and sensory properties of bakery products?
WHY TO EAT INSECTS?• There will be 9 billion people in the world by 2050 → we
need more sources of animal protein
• Insects
+ are more sustainable than conventional breeding
+ need less feed, water and space
+ have good nutritional value
− a possible dislike of eating insects → hidden form
in food (e.g. in bakery products)
0% Control
5% SCM
5% TCM
8% SCM
8% TCM
10% SCM
10% TCM
-2
-1,5
-1
-0,5
0
0,5
1
1,5
2
-6 -5 -4 -3 -2 -1 0 1 2 3 4 5 6Fact
or
2: 1
2.2
0%
Factor 1: 65.72%
Sensory evaluation - PCA plot of cases
0
100
200
300
400
500
0%
Control
5%
SCM
8%
SCM
10%
SCM
5%
TCM
8%
TCM
10%
TCM
Vo
lum
e o
f b
un
s(m
l/1
00
g b
un
s)
The effect of cricket flour addition on the volume of buns
WHAT IS THE ANSWER?The addition of the cricket flour affected the rheological and sensory properties of bakery products.
0% Control
8% SCM
8% TCM
Supported by METROFOOD-CZ