Star Formation and Extinction in Redshift z~2 Galaxies: Inferences from Spitzer MIPS Observations
24
arXiv:astro-ph/0602596v1 27 Feb 2006 Received 2005 October 06; Accepted 2006 February 23 Preprint typeset using L A T E X style emulateapj v. 12/14/05 STAR FORMATION AND EXTINCTION IN REDSHIFT Z ∼ 2 GALAXIES: INFERENCES FROM SPITZER MIPS OBSERVATIONS 1 Naveen A. Reddy 2 , Charles C. Steidel 2 , Dario Fadda 3 , Lin Yan 3 , Max Pettini 4 , Alice E. Shapley 5 , Dawn K. Erb 6 , and Kurt L. Adelberger 7 Received 2005 October 06; Accepted 2006 February 23 ABSTRACT Using very deep Spitzer MIPS 24 μm observations, we present an analysis of the bolometric lumi- nosities and UV extinction properties of more than 200 spectroscopically identified, optically selected (U n GR) z ∼ 2 galaxies in the GOODS-N field. The large spectroscopic sample of rest-UV selected galaxies is supplemented with photometrically identified near-IR-selected (“BzK” and “DRG”) galax- ies and sub-mm sources at similar redshifts in the same field, providing a representative collection of relatively massive (M ∗ > 10 10 M ⊙ ) galaxies at high redshifts. We focus on the redshift range 1.5 <z< 2.6, for which the 24 μm observations provide a direct measurement of the strength of the mid-IR PAH features in the galaxy spectra; the rest-frame 5 − 8.5 μm luminosities (L 5−8.5μm ) are particularly tightly constrained for the objects in our sample with precise spectroscopic redshifts. We demonstrate, using stacked X-ray observations and a subset of galaxies with Hα measurements, that L 5−8.5μm provides a reliable estimate of L IR for most star forming galaxies at z ∼ 2. We show that the range of L IR in the optical/near IR-selected samples considered extends from ≃ 10 10 L ⊙ to > 10 12 L ⊙ , with a mean 〈L IR 〉≃ 2 × 10 11 L ⊙ . The LIRG population at z ∼ 2 is essentially the same population of galaxies that are selected by their optical/near-IR colors. Objects with LIRG to ULIRG luminosities are present over the full range of stellar masses in the samples, from 2 × 10 9 M ⊙ to 5 × 10 11 M ⊙ . We use the MIPS 24 μm observations for an independent examination of dust extinction in high redshift galaxies, and demonstrate that, as in the local universe, the obscuration ( LIR L1600 ) is strongly dependent on bolometric luminosity, and ranges in value from < 1 to ∼ 1000 within the sample considered. However, the obscuration is ∼ 10 times smaller at a given L bol (or, equivalently, a similar level of obscuration occurs at luminosities ∼ 10 times larger) at z ∼ 2 than at z ∼ 0. We show that the values of L IR and obscuration inferred from the UV spectral slope β generally agree well with the values inferred from L 5−8.5μm for L bol < 10 12 L ⊙ . As found previously by several investigators, for “ultraluminous” objects with L bol > 10 12 L ⊙ it is common for UV-based estimates to underpredict L IR by a factor of ∼ 10 − 100. Using the specific star formation rate of galaxies (SFR per unit stellar mass) as a proxy for cold gas fraction, we find a wide range in the evolutionary state of galaxies at z ∼ 2, from galaxies that have just begun to form stars to those which have already accumulated most of their stellar mass and are about to become, or already are, passively-evolving. Subject headings: cosmology: observations — dust, extinction — galaxies: evolution — galaxies: high redshift — galaxies: stellar content — infrared: galaxies 1. INTRODUCTION The most direct method currently available for trac- ing the bolometric luminosities of high redshift star- forming galaxies (z 2) has been from their submil- 1 Based, in part, on data obtained at the W.M. Keck Observa- tory, which is operated as a scientific partnership among the Cal- ifornia Institute of Technology, the University of California, and NASA, and was made possible by the generous financial support of the W.M. Keck Foundation. Also based in part on observations made with the Spitzer Space Telescope, which is operated by the Jet Propulsion Laboratory, California Institute of Technology un- der a contract with NASA. 2 California Institute of Technology, MS 105–24, Pasadena, CA 91125 3 Spitzer Science Center, California Institute of Technology, MS 220–6, Pasadena, CA 91126 4 Institute of Astronomy, Madingley Road, Cambridge CB3 OHA, UK 5 Department of Astrophysical Sciences, Peyton Hall-Ivy Lane, Princeton, NJ 08544 6 Harvard-Smithsonian Center for Astrophysics, 60 Garden Street, Cambridge, MA 02138 7 McKinsey & Company, 1420 Fifth Avenue, Suite 3100, Seattle, WA 98101 limeter emission (e.g., Smail et al. 1997; Hughes et al. 1998; Barger et al. 1998). Unfortunately, current sensi- tivity limits of bolometers and submillimeter wave in- terferometers allow for only the most luminous star- burst galaxies to be detected at high redshifts via their dust emission. Further compounding the problem is the coarse spatial resolution provided by such instruments, making it difficult to distinguish the counterpart(s) to the submillimeter emission for subsequent followup, al- though the recently developed method of radio-detection has been a breakthrough in alleviating this problem for most, but not all, bright submillimeter galaxies (e.g., Chapman et al. 2005). Regardless, the dust properties of the vast majority of star-forming galaxies at high red- shift remained uninvestigated until recently. The rest-frame far-infrared (FIR) wavelength region is still inaccessible for the typical galaxy at redshifts z 1, so we must look to other portions of the spectrum to directly examine dust properties. Our understand- ing of the mid-IR properties of local and high redshift galaxies advanced considerably with the launch of the
-
Upload
independent -
Category
Documents
-
view
2 -
download
0
Transcript of Star Formation and Extinction in Redshift z~2 Galaxies: Inferences from Spitzer MIPS Observations

arX
iv:a
stro
-ph/
0602
596v
1 2
7 Fe
b 20
06Received 2005 October 06; Accepted 2006 February 23Preprint typeset using LATEX style emulateapj v. 12/14/05
STAR FORMATION AND EXTINCTION IN REDSHIFT Z ∼ 2 GALAXIES: INFERENCES FROM SPITZERMIPS OBSERVATIONS1
Naveen A. Reddy2, Charles C. Steidel2, Dario Fadda3, Lin Yan3, Max Pettini4, Alice E. Shapley5, Dawn K.Erb6, and Kurt L. Adelberger7
Received 2005 October 06; Accepted 2006 February 23
ABSTRACT
Using very deep Spitzer MIPS 24 µm observations, we present an analysis of the bolometric lumi-nosities and UV extinction properties of more than 200 spectroscopically identified, optically selected(UnGR) z ∼ 2 galaxies in the GOODS-N field. The large spectroscopic sample of rest-UV selectedgalaxies is supplemented with photometrically identified near-IR-selected (“BzK” and “DRG”) galax-ies and sub-mm sources at similar redshifts in the same field, providing a representative collectionof relatively massive (M∗ > 1010 M⊙) galaxies at high redshifts. We focus on the redshift range1.5 < z < 2.6, for which the 24 µm observations provide a direct measurement of the strength of themid-IR PAH features in the galaxy spectra; the rest-frame 5 − 8.5 µm luminosities (L5−8.5µm) areparticularly tightly constrained for the objects in our sample with precise spectroscopic redshifts. Wedemonstrate, using stacked X-ray observations and a subset of galaxies with Hα measurements, thatL5−8.5µm provides a reliable estimate of LIR for most star forming galaxies at z ∼ 2. We show that therange of LIR in the optical/near IR-selected samples considered extends from ≃ 1010 L⊙ to > 1012 L⊙,with a mean 〈LIR〉 ≃ 2×10¹¹ L⊙. The LIRG population at z ∼ 2 is essentially the same population ofgalaxies that are selected by their optical/near-IR colors. Objects with LIRG to ULIRG luminositiesare present over the full range of stellar masses in the samples, from 2× 10⁹ M⊙ to 5× 10¹¹ M⊙. Weuse the MIPS 24 µm observations for an independent examination of dust extinction in high redshiftgalaxies, and demonstrate that, as in the local universe, the obscuration ( LIR
L1600) is strongly dependent
on bolometric luminosity, and ranges in value from < 1 to ∼ 1000 within the sample considered.However, the obscuration is ∼ 10 times smaller at a given Lbol (or, equivalently, a similar level ofobscuration occurs at luminosities ∼ 10 times larger) at z ∼ 2 than at z ∼ 0. We show that thevalues of LIR and obscuration inferred from the UV spectral slope β generally agree well with thevalues inferred from L5−8.5µm for Lbol < 1012 L⊙. As found previously by several investigators, for“ultraluminous” objects with Lbol > 1012 L⊙ it is common for UV-based estimates to underpredictLIR by a factor of ∼ 10− 100. Using the specific star formation rate of galaxies (SFR per unit stellarmass) as a proxy for cold gas fraction, we find a wide range in the evolutionary state of galaxies atz ∼ 2, from galaxies that have just begun to form stars to those which have already accumulated mostof their stellar mass and are about to become, or already are, passively-evolving.Subject headings: cosmology: observations — dust, extinction — galaxies: evolution — galaxies: high
redshift — galaxies: stellar content — infrared: galaxies
1. INTRODUCTION
The most direct method currently available for trac-ing the bolometric luminosities of high redshift star-forming galaxies (z & 2) has been from their submil-
1 Based, in part, on data obtained at the W.M. Keck Observa-tory, which is operated as a scientific partnership among the Cal-ifornia Institute of Technology, the University of California, andNASA, and was made possible by the generous financial supportof the W.M. Keck Foundation. Also based in part on observationsmade with the Spitzer Space Telescope, which is operated by theJet Propulsion Laboratory, California Institute of Technology un-der a contract with NASA.
2 California Institute of Technology, MS 105–24, Pasadena, CA91125
3 Spitzer Science Center, California Institute of Technology, MS220–6, Pasadena, CA 91126
4 Institute of Astronomy, Madingley Road, Cambridge CB3OHA, UK
5 Department of Astrophysical Sciences, Peyton Hall-Ivy Lane,Princeton, NJ 08544
6 Harvard-Smithsonian Center for Astrophysics, 60 GardenStreet, Cambridge, MA 02138
7 McKinsey & Company, 1420 Fifth Avenue, Suite 3100, Seattle,WA 98101
limeter emission (e.g., Smail et al. 1997; Hughes et al.1998; Barger et al. 1998). Unfortunately, current sensi-tivity limits of bolometers and submillimeter wave in-terferometers allow for only the most luminous star-burst galaxies to be detected at high redshifts via theirdust emission. Further compounding the problem is thecoarse spatial resolution provided by such instruments,making it difficult to distinguish the counterpart(s) tothe submillimeter emission for subsequent followup, al-though the recently developed method of radio-detectionhas been a breakthrough in alleviating this problem formost, but not all, bright submillimeter galaxies (e.g.,Chapman et al. 2005). Regardless, the dust propertiesof the vast majority of star-forming galaxies at high red-shift remained uninvestigated until recently.
The rest-frame far-infrared (FIR) wavelength regionis still inaccessible for the typical galaxy at redshiftsz & 1, so we must look to other portions of the spectrumto directly examine dust properties. Our understand-ing of the mid-IR properties of local and high redshiftgalaxies advanced considerably with the launch of the

2 Reddy et al.
Infrared Space Observatory (ISO), which was sensitiveenough to detect the mid-IR emission of 1011 L⊙ galax-ies at z ∼ 1 (e.g., Flores et al. 1999; Elbaz et al. 2002;Pozzi et al. 2004; Rowan-Robinson et al. 2004). Theseobservations revealed the almost ubiquitous presence ofmid-IR dust emission features in star forming galaxiesin both the local and z ∼ 1 universe, and suggested thepossibility of using the mid-IR dust emission of galaxiesas a tracer of bolometric luminosity (Boselli et al. 1998;Adelberger & Steidel 2000; Dale et al. 2000; Helou et al.2000; Forster Schreiber et al. 2003).
These advances now continue with the highly success-ful Spitzer Space Telescope, providing the same sensi-tivity as ISO in probing dust emission from 1011 L⊙
galaxies at z ∼ 2. The progress made with Spitzer isparticularly important for studying galaxies at z ∼ 2because this epoch was until recently largely uninvesti-gated, yet is believed to be the most active in terms ofstar formation and the build up of stellar and black holemass (e.g., Dickinson et al. 2003; Rudnick et al. 2003;Madau et al. 1996; Lilly et al. 1996; Steidel et al. 1999;Shaver et al. 1996; Fan et al. 2001; Di Matteo et al.2003; Giavalisco et al. 1996). The sensitivity afforded bythe Spitzer MIPS instrument allows us to examine thetypical L∗ galaxy at z ∼ 2, rather than a limited sliceof the most luminous population, a problem which, asalluded to before, limits the usefulness of submillimeterobservations.
It is fortuitous that the rest-frame mid-IR spectralfeatures observed in local and z ∼ 1 star-forminggalaxies are redshifted into the Spitzer IRS spectraland MIPS imaging passbands at z ∼ 2. The mid-IR spectral region from 3 − 15 µm is rich with emis-sion lines believed to arise from the stochastic heat-ing of small dust grains by UV photons (see review byGenzel & Cesarsky 2000). These unidentified infraredbands (UIBs) are generally attributed to the C = C andC − H stretching and bending vibrational modes of aclass of carbonaceous molecules called polycyclic aro-matic hydrocarbons (PAHs; e.g., Puget & Leger 1989;Tielens et al. 1999), which we assume hereafter. In thetypical spectrum of a star-forming galaxy, these PAHemission lines, along with various fine-structure metaland HI recombination lines (e.g., Sturm et al. 2000), aresuperposed on a mid-IR continuum thought to resultfrom dust emission from very small grains, or VSGs(Desert et al. 1990). In star-forming galaxies, the globalPAH emission is mainly attributed to UV radiationfrom OB stars and has been found to correlate withglobal star formation rate (e.g., Forster Schreiber et al.2004b; Forster Schreiber et al. 2003; Roussel et al.2001), although variations with ionizing intensity andmetallicity are also observed (e.g., Engelbracht et al.2005; Hogg et al. 2005; Alonso-Herrero et al. 2004;Helou et al. 2001; Normand et al. 1995).
Until now, the only way to estimate the bolometricluminosities of most galaxies at z ∼ 2 independent ofextinction was via their stacked X-ray and radio emis-sion: unfortunately these data are not sufficiently sen-sitive to detect individual L∗ galaxies at z ∼ 2 (e.g.,Reddy & Steidel 2004; Nandra et al. 2002; Brandt et al.2001). The Spitzer data considered in this paper are use-ful in assessing the bolometric luminosities of galaxies onan individual basis. One is still limited because detailed
mid-IR spectroscopy is feasible only for the most lumi-nous galaxies at z ∼ 2 (e.g., Yan et al. 2005; Houck et al.2005), but L∗ galaxies at z ∼ 2 (with Lbol ∼ 1011 L⊙)can be detected in deep 24 µm images. We employMIPS 24 µm data to study the rest-frame mid-IR prop-erties of optical and near-IR selected galaxies at redshifts1.5 . z . 2.6. We describe the optical, near-IR, X-ray,and mid-IR data in § 2 and 3. Our large sample of spec-troscopic redshifts for optically-selected galaxies allowsus to very accurately constrain the rest-frame mid-IRfluxes of z ∼ 2 galaxies. In § 4, we describe our methodfor estimating photometric redshifts for near-IR samplesof galaxies where spectroscopy is less feasible. The pro-cedure for estimating infrared luminosities from MIPSdata is outlined in § 5.1. We discuss the infrared lumi-nosity distributions of 24 µm detected and undetectedsources in § 5.2 and 5.3. The dust attenuation propertiesof optical and near-IR selected z ∼ 2 galaxies and thecorrelation of these properties with bolometric luminos-ity are discussed in § 6 and § 7. The stellar populationsand composite rest-frame UV spectral properties of faint24 µm galaxies are discussed in § 8. In § 9 we examine inmore detail the mid-IR properties of massive galaxies atz ∼ 2. We conclude in § 10 by discussing the viability ofoptical and near-IR color criteria in selecting LIRGs andULIRGs at z ∼ 2 and what the Spitzer MIPS observa-tions can reveal about the mass assembly of galaxies athigh redshift. A flat ΛCDM cosmology is assumed withH0 = 70 km s−1 Mpc−1 and ΩΛ = 0.7.
2. SAMPLE SELECTION AND ANCILLARY DATA
2.1. Optical and Near-IR Selection
The star-forming galaxies studied here were drawnfrom the sample of z ∼ 2 galaxies in the GOODS-N field selected based on their observed UnGR col-ors to R = 25.5 (Adelberger et al. 2004; Steidel et al.2004). The optical images used for the selection of can-didates cover an area 11′ by 15′. We refer to “BM” and“BX” galaxies as those which are selected to be at red-shifts 1.5 . z . 2 and 2.0 . z . 2.6, respectively(Adelberger et al. 2004; Steidel et al. 2004). In addi-tion to BX/BM galaxies, we also consider galaxies se-lected using the z ∼ 3 LBG criteria (Steidel et al. 2003).The BX/BM and LBG candidates make up our UnGR,or optically, selected sample. We obtained rest-frameUV spectra with the blue channel of the Low Resolu-tion Imaging Spectrograph (LRIS-B) on Keck I for 386UnGR candidates. The numbers of candidates and spec-troscopically confirmed galaxies in the UnGR sample aresummarized in Table 1. The spectroscopic redshift distri-bution of UnGR galaxies in the GOODS-N field is shownin Figure 1. For efficiency, we preferentially targeted forspectroscopy those UnGR candidates with R-band mag-nitudes in the range R = 22.5−24.5 (AB units) and gavelower priorities for fainter objects where redshift identifi-cation is more difficult from absorption lines and brighterobjects where the contamination fraction (from low red-shift interlopers) is larger. The star formation rate dis-tribution of spectroscopically-confirmed UnGR galaxiesis similar to that of all UnGR galaxies in the targetedredshift range to Ks = 21 (Vega; Reddy et al. 2005; seealso Steidel et al. 2004 for a discussion of spectroscopicbias of galaxy properties with respect to the photometricsample of UnGR galaxies).

Star Formation and Extinction in z ∼ 2 Galaxies 3
TABLE 1Properties of the Samples
ρc
Sample Limits Nca Nx
b (arcmin−2) Nsd 〈z〉e Ng
f fmg
UnGR (BX/BM/LBG) R < 25.5 1571 23 10.2 ± 0.3 313 2.25 ± 0.33 219 0.65BzK/SF Ks < 21.0 221 32 3.1 ± 0.2 53 2.09 ± 0.34 82 0.82BzK/PE Ks < 21.0 17 4 0.24 ± 0.06 0 1.70 ± 0.20 13 0.54DRGh Ks < 21.0 73 19 1.0 ± 0.1 5 2.48 ± 0.35 24 0.71
aNumber of candidates.bNumber of directly-detected X-ray sources, including spectroscopically-confirmed galaxies.cSurface density of candidates. Errors are computed assuming Poisson statistics.dNumber of spectroscopically confirmed objects with z > 1.5. Note that we only obtained spectra
for those BzK and DRG galaxies that satisfy the UnGR criteria.eMean redshift of sample for z > 1.5. For the BzK/PE sample, this is the mean redshift of the
photometric redshift distribution observed for BzK/PE galaxies (e.g., Daddi et al. 2004;Reddy et al.2005). For the DRGs, this is the mean redshift of the spectroscopic redshift distribution observedfor DRGs with z > 1.5 in four of the fields of the z ∼ 2 optical survey (Reddy et al. 2005).
fNumber of non-AGN galaxies (i.e., those with no direct X-ray detections) with spectroscopicredshifts 1.5 < z < 2.6. For the BzK/SF sample, this number includes both spectroscopically-confirmed BzK/SF galaxies (all of which are in the UnGR sample) and those with secure photomet-ric redshifts. For the BzK/PE sample, this includes all candidates without direct X-ray detections.For the DRG sample, this number includes galaxies with photometric redshifts 1.5 < z < 2.6.gFraction of MIPS 24 µm detections to 8 µJy (3 σ) among the Ng galaxies.hThe DRG sample includes both star-forming galaxies and those with little star formation. As
discussed in Reddy et al. (2005), those with spectra (i.e., those DRGs which also satisfy the UnGRcriteria) are likely to be currently forming stars.
Our deep near-IR J and K-band imaging, in ad-dition to publicly available deep optical imaging, al-lows us to select both star-forming galaxies and thosewith little current star formation in the GOODS-Nfield. Details of the optical and near-IR images areprovided in Reddy et al. (2005). The near-IR selec-tion of star-forming galaxies is done using the criteriaof Daddi et al. (2004), resulting in a “BzK/SF” sample(e.g., Daddi et al. 2004; Reddy et al. 2005). The near-IRselected samples of galaxies with very little current starformation are constructed by considering the BzK andJ − Ks colors of candidates satisfying the BzK/PE andDistant Red Galaxy (DRG) criteria (e.g., Reddy et al.2005; Daddi et al. 2004; Franx et al. 2003). Approxi-mately 70% of DRGs to Ks = 21 (Vega) have signa-tures of intense star formation (Papovich et al. 2005;Reddy et al. 2005; van Dokkum et al. 2004)8. The J andK band images cover a large area by near-IR standards(∼ 8.5′ × 8.5′), but are still less than half the area of theoptical UnGR images. The number of near-IR selectedcandidates and their surface densities are presented inTable 1. For the remaining analysis, we use AB units foroptical (UnGR) magnitudes and Vega units for near-IR(Ks) magnitudes.
2.2. X-Ray Data
The very deep Chandra X-ray data in the GOODS-Nfield (Alexander et al. 2003) allow for an independentmeans of assessing the presence of AGN in the samples,which can be quite significant for near-IR selectedsamples (Reddy et al. 2005). In addition, we can stackthe X-ray data for those galaxies lying below the X-raydetection threshold to determine their average emissionproperties (e.g. Laird et al. 2005; Lehmer et al. 2005;
8 In order to ensure our sample is complete, we only considerDRGs to Ks = 21.
Fig. 1.— Spectroscopic redshift distribution of optically (i.e.,UnGR) selected galaxies, with typical error of σ(z) = 0.002. Alsoshown are arbitrarily normalized photometric redshift distributionsof BzK/SF galaxies that do not satisfy the UnGR criteria, andDRGs. The errorbars indicate the average uncertainty in photo-metric redshifts (σ(z) = 0.45) for the near-IR selected BzK galax-ies and DRGs.
Reddy & Steidel 2004; Nandra et al. 2002; Brandt et al.2001). The X-ray data and stacking methods arediscussed in detail in Reddy & Steidel (2004) andReddy et al. (2005). The numbers of directly-detectedX-ray sources in each sample considered here are sum-marized in Table 1.
3. MID-IR DATA
The mid-IR data are obtained from the Spitzer Multi-band Imaging Photometer (MIPS) instrument. The 24

4 Reddy et al.
micron data were taken as part of the GOODS LegacySurvey (P.I.: M. Dickinson) between May 27 and June6, 2004. They consist of 24 AORs (Astronomical Ob-servation Requests) of approximately 3 hours each. Thecombined data reach a depth equivalent to ∼ 10 hours in-tegration at any point in the mosaicked image. The dataare publicly available since August 2004 in the Spitzerarchive. The basic calibrated data (BCD) produced bythe Spitzer pipeline were used as the starting point forthe data reduction. As explained in detail by Fadda(2006), there were several artifacts which added noiseto the images, hampering the detection of faint sources.These artifacts include image latencies from previous ob-servations of bright objects or image dark spots presenton the pick-off mirror that are projected in different po-sitions by the cryogenic scan mirror during observations.Other variations come from the variable zodiacal light.We have corrected each BCD image for these effects us-ing the procedure described by Fadda (2006). The finalmosaic consists of 7198 BCDs combined using MOPEX(Makovoz & Marleau 2005). The final reduced 24 µmmosaic of the GOODS-N region has a pixel size of 1.′′275and covers the entirety of our optical UnGR images andthe measured 3 σ depth is approximately 8 µJy. Thelarge beam-size of MIPS (∼ 5.′′4 at 24 µm) combinedwith the effects of blending make aperture photometryimpractical. Instead, we have chosen to use a PSF fittingmethod to extract 24 µm fluxes for our galaxies, similarto the method used to extract IRAC fluxes for galaxiesas discussed in Shapley et al. (2005).
We first compute an empirical PSF using a two-passapproach. In the first pass, we take the median flux pro-file of several tens of distinct MIPS point sources acrossthe mosaic to create a rough empirical PSF. This PSF isthen used to subtract sources in proximity to the tens ofMIPS point sources in order to better determine the PSFprofile out to larger radii. This is important for the MIPSPSF which contains up to 20% of the point source flux inthe Airy rings. The effects of source confusion are miti-gated by employing the higher spatial resolution SpitzerIRAC data in the GOODS-N field to constrain the MIPSsource positions. The empirical PSF, normalized to unitflux, is fit to these positions and the fluxes are extracted.The PSF used here extends to 15.′′3 radius, and we applya 15% aperture correction based on the observed curves-of-growth of MIPS point source profiles from the FirstLook Survey.
The number of MIPS detections (> 3 σ) and non-detections in each sample are summarized in Table 1.Virtually all of the directly-detected X-ray sources aredetected at 24 µm and all have optical/X-ray flux ratiosindicating that AGN dominate the X-flux (Reddy et al.2005). Submillimeter galaxies are often associatedwith direct X-ray detections (e.g., Alexander et al. 2005;Reddy et al. 2005) even though their bolometric lumi-nosities may still be dominated by star-formation. Sincewe are primarily interested in the mid-IR emission as atracer of star formation, we have excluded all directly-detected X-ray sources (almost all of which are AGN;Reddy et al. 2005) for most of the analysis, unless theyhappen to coincide with a radio-detected SMG from theChapman et al. (2005) (SC05) sample. We caution thatthe resulting sample of 9 SMGs is not meant to beuniform or complete: ∼ 40% of SMGs are not associ-
TABLE 2Local Template Galaxies
LIR
Namea zb (×1010 L⊙)
M82 0.000677 4.8NGC253 0.000811 1.8M83 0.001711 1.9M51 0.002000 2.4NGC1808 0.003319 3.8NGC1097 0.004240 3.8NGC1365 0.005457 8.7NGC520 0.007609 6.5NGC7714 0.009333 5.6NGC3256 0.009386 40NGC6240 0.024480 60IRS9 1.83 1800
aAll galaxies are compiled fromForster Schreiber et al. (2004a) andRoussel et al. (2001), except for IRS9and NGC7714 which are taken fromYan et al. (2005). The bolometricluminosity of IRS9 is constrainedwithin a factor of 2-3 (Yan et al.2005).bRedshifts for local galaxies are
obtained from NASA/IPAC Extra-galactic Database (NED).
ated with radio sources, either because of their higherredshifts or radio faintness (e.g., Chapman et al. 2005;Smail et al. 2002). Furthermore, the submillimeter ob-servations are not uniform over the field. Nonetheless,it is of obvious interest to at least compare the mid-IRproperties of this limited set of radio-detected SMGs tothose of galaxies in other samples.
The MIPS 24 µm filter directly samples the rest-frameluminosity from 5 − 8.5 µm (L5−8.5µm) for redshifts1.5 . z . 2.6. We used the mid-IR spectral shapes ofstar-forming galaxies (listed in Table 2) as templatesin order to K-correct the 24 µm fluxes to determineL5−8.5µm. Figure 2 shows the expected 24 µm fluxes ofthe galaxies listed in Table 2 as a function of redshift.These galaxies were chosen to cover a large range inSFRs (from quiescent spiral galaxies to starbursts andLIRGs/ULIRGs). The mid-IR spectra are obtained fromeither ISO (for local galaxies; Forster Schreiber et al.2004a) or Spitzer IRS (for z ∼ 2 hyper-luminous galax-ies; Yan et al. 2005) observations. Some properties ofthese galaxies are summarized in Table 2. The mid-IRspectrum of each galaxy is redshifted, convolved withthe MIPS 24 µm filter, and the fluxes are normalized tohave L5−8.5µm = 1010 L⊙ to produce the dotted curvesin Figure 2. The small dispersion between the templatesover redshifts 1.5 . z . 2.6 reflects small changes inthe broadband 24 µm fluxes of galaxies due to changesin the relative strengths of the various PAH emissionlines and the ratio of PAH-to-continuum flux. The solidcurve in the figure shows the average of all the templategalaxies. The prominent peak at z ≈ 1.9 is primarily dueto the 7.7 µm feature shifting into the MIPS 24 µm filter.
4. PHOTOMETRIC REDSHIFTS OF NEAR-IR SELECTEDGALAXIES

Star Formation and Extinction in z ∼ 2 Galaxies 5
Fig. 2.— Expected 24 µm fluxes of the local and high redshift template galaxies summarized in Table 2 shown by the dotted curves,normalized so that L5−8.5µm = 1010 L⊙. The solid curve is the average over all the templates. Also shown are the observed fluxes ofUnGR (small points) and BzK/SF galaxies (thin triangles) with spectroscopic redshifts; and BzK/SF (thick triangles), BzK/PE (solidpentagons), and DRGs (open squares) with photometric redshifts. The typical error in photometric redshifts of DRG and BzK galaxiesis σ(z) ∼ 0.45. Radio-detected submillimeter galaxies to S850µm ∼ 4.2 mJy from Chapman et al. (2005) are shown by the open circles.We have removed directly-detected X-ray sources in the samples above, except for those in the SMG sample. Crosses denote hard-bandX-ray sources with spectroscopic redshifts in the UnGR sample. The vertical errorbar in the upper left-hand side of the figure shows thetypical uncertainty in the 24 µm flux. The shaded region indicates the redshift range over which the MIPS 24 µm filter directly samplesthe rest-frame 7.7 µm PAH feature.
Figure 2 illustrates the sensitive dependence of the K-correction on the redshift (e.g., galaxies with a given ob-served f24µm can have a factor of 3 spread in L5−8.5µm
depending on their redshift in the range 1.5 < z < 2.6).Our large spectroscopic sample gives us the distinct ad-vantage of knowing the precise redshifts for the opticallyselected galaxies, removing the added uncertainty intro-duced by photometric redshifts where the precise loca-tion of the PAH features with respect to the MIPS 24 µmfilter is unknown, adding considerable uncertainty to theinferred infrared luminosities (e.g., Papovich et al. 2005).As we show below, the typical error in the photometricredshifts derived for near-IR selected galaxies (even whenusing data across a large baseline in wavelength, from UVthrough Spitzer IRAC), is σ(z) ∼ 0.5. This error in red-shift translates to at least a factor of three uncertaintyin L5−8.5µ m.
Nonetheless, photometric redshifts are the only practi-cal option for optically faint galaxies where spectroscopyis not feasible. This is true for many of the DRGsand BzK/PE galaxies. We supplement our spectro-scopic database of optically selected galaxies with pho-tometric redshifts of near-IR selected galaxies. We madeuse of the HyperZ code to determine photometric red-shifts (Bolzonella et al. 2000). To quantify the uncer-tainties in photometric redshifts, we tested the code onUnGR galaxies with spectroscopic redshifts, fitting to theUnBGV RIz + JK photometry. The BV Iz magnitudesare obtained from the v1.1 release of the GOODS ACScatalogs (Giavalisco et al. 2004). Errors in the opticalUnGR and near-IR JK magnitudes are determined fromMonte Carlo simulations described by Erb et al. (2006b)and Shapley et al. (2005).
The χ2 between the modeled and observed colors was

6 Reddy et al.
Fig. 3.— Left panel: Photometric versus spectroscopic redshifts for UnGR galaxies. The solid line indicates zphot = zspec. Right panel:
∆z, as defined in the text, as a function of stellar mass for galaxies with redshifts 1.5 ≤ z < 2.0 (solid circles) and 2.0 ≤ z ≤ 2.6 (opencircles). The figure only shows objects with > 3 σ detections in at least two IRAC channels.
calculated for each galaxy for a number of different starformation histories (with exponential decay times τ = 10,20, 50, 100, 200, 500, 1000, 2000, and 5000 Myr, andτ = ∞) as a function of redshift. The best-fit photomet-ric redshift is the redshift at which χ2 is minimized. Asa figure of merit of the resulting fit (and for easy com-parison with other studies), we compute
∆z ≡ (zphot − zspec)/(1 + zspec). (1)
The results are shown in the left panel of Figure 3. Thedispersion in ∆z is σ(∆z) ≈ 0.15 for galaxies with spec-troscopic redshifts 1.5 < z < 2.6. The actual error inredshift is typically σ(z) ∼ 0.45. Both the Shapley et al.(2005) code (which uses Bruzual & Charlot (2003) mod-els) and the Benıtez (2000) code gave similar results.We found that adding Spitzer IRAC data does little totighten the scatter between photometric and spectro-scopic redshifts for most galaxies, reflecting the absenceof any distinct features (e.g., strong spectral breaks)across the IRAC bands for z ∼ 2 galaxies. We notefrom the left panel of Figure 3 that photometric red-shifts systematically underestimate the true redshifts ofz > 3 galaxies. This should not significantly affect oursubsequent analysis since we only consider galaxies upto z = 2.6, and most of the BzK/SF and DRG galaxieshave photometric redshifts zphot . 2.5.
The IRAC data are nonetheless a powerful tool in dis-cerning the more massive galaxies from the less mas-sive ones. Since most of the optically-faint DRGs andBzK/PE galaxies are on average amongst the more mas-sive galaxies at z ∼ 2 (e.g., Figure 18 of Reddy et al.(2005)), we have incorporated the IRAC data in the pho-tometric redshift fits. The right panel of Figure 3 shows∆z as a function of inferred stellar mass for UnGR galax-ies computed for the best-fit τ model, normalizing to theobserved colors9. The scatter in ∆z for galaxies with stel-lar masses M∗ & 1010 M⊙ is σ(∆z) ∼ 0.20, and we willassume this value for the error in photometric redshifts of
9 We assume a Salpeter IMF in calculating the stellar mass.
the DRG and BzK/PE galaxies. To extend the compari-son presented by Reddy et al. (2005) between UnGR andBzK selected samples of star-forming galaxies by exam-ining their mid-IR properties, we compute photometricredshifts for BzK/SF galaxies that do not satisfy theUnGR criteria. For the BzK/SF galaxies, we assume anerror of σ(∆z) ∼ 0.15, according to Figure 3a.
We obtained 51 secure photometric redshift fits forBzK/SF galaxies not selected by the UnGR criteria (outof 95 such objects), and their (arbitrarily normalized)photometric redshift distribution is shown in Figure 1.Also shown is the (arbitrarily normalized) photometricredshift distribution for 28 (out of 49) non X-ray de-tected DRGs for which we were able to derive securephotometric redshifts 1 < zphot < 3.5. The remainingDRGs either have zphot < 1 or zphot > 3.5 (and are irrel-evant to the analysis considered below) or had photom-etry that was inconsistent with the Bruzual & Charlot(2003) models considered here, resulting in a large χ2
value between the model and observed colors. The DRGsexamined here appear to span a very large range in red-shift from z ∼ 1 − 3.5, a result similar to that found byPapovich et al. (2005) for DRGs in the GOODS-Southfield. We obtained good photometric redshift fits foronly two of the BzK/PE galaxies: one at z ∼ 1.2 andthe other at z ∼ 1.5. We reiterate that for purposesof redshift identification, we only assumed the photo-metric redshifts for those galaxies for which we wereable to obtain good SED fits (i.e., with χ2 ≈ 1) tothe observed data. There were a number of objectsfor which the photometric redshift errors were relativelylarge (δz/(1 + z) & 1) or had derived redshifts that weremuch larger (z > 4) or smaller (z < 1) than of interesthere, and we excluded such objects from our analysis.Hence, the photometric redshift distributions in Figure 1should not be attributed to the populations as a whole.For the remaining analysis we consider only optically-selected galaxies with spectroscopic redshifts and near-IR selected galaxies with photometric redshifts between1.5 . z . 2.6 where the 24 µm fluxes directly trace the

Star Formation and Extinction in z ∼ 2 Galaxies 7
flux at rest-frame 7.7 µm. This is indicated by the shadedregion in Figure 2.
5. INFRARED LUMINOSITIES OF OPTICAL, NEAR-IR,AND SUBMILLIMETER SELECTED GALAXIES AT Z ∼ 2
5.1. Inferring Infrared Luminosities from L5−8.5µm
The conversion between L5−8.5µm and infrared lumi-nosity will largely depend on the assumed spectral tem-plate relating the mid-IR emission of galaxies to theirtotal infrared luminosities. Fortunately, the deep X-raydata allow us to determine whether L5−8.5µm scales withinfrared luminosity (or star formation rate) independentof any assumed template, adopting the local empiricalrelationship between X-ray and FIR luminosity for star-forming galaxies. Figure 4 shows the ratio of L5−8.5µm
to stacked X-ray luminosity of (X-ray undetected) galax-ies in bins of L5−8.5µm: we only considered optically-selected galaxies with spectroscopic redshifts since it isfor these galaxies which we are able to most accuratelyconstrain the rest-frame X-ray luminosities. Since X-rayemission is sensitive to star formation on time-scales of& 100 Myr (see § 6), Figure 4 shows results excludinggalaxies with inferred ages < 100 Myr. Each bin contains10 − 20 sources except the faintest bin which includes45 galaxies undetected at 24 µm with ages > 100 Myr.The X-ray data for galaxies in each bin were stacked us-ing the procedure described in Reddy et al. (2005). Themean value of the mid-IR-to-X-ray luminosity ratio is〈L5−8.5µm/L2−10 keV〉 ≈ 251 ± 41. The X-ray luminosi-ties of local star-forming galaxies are found to tightlycorrelate with their infrared emission for galaxies with108 . LFIR . 1012 L⊙ (e.g., Ranalli et al. 2003). Usingthe X-ray luminosity as a proxy for infrared luminos-ity therefore implies that the rest-frame mid-IR fluxesfollow the total infrared luminosity (LIR) for the vastmajority of optically-selected galaxies at z ∼ 210. Themid-IR fluxes must also follow the infrared luminosityfor most near-IR selected star-forming galaxies as wellgiven the large overlap (70%−80%) between optical andnear-IR selected samples of z ∼ 2 star-forming galaxies(Reddy et al. 2005). As we show below, the conversionwe assume between rest-frame mid-IR and infrared lu-minosities reproduces the average infrared luminositiespredicted from stacked X-ray analyses (§ 6.1).
To quantify the relationship between rest-frame mid-IR and total infrared luminosity with a minimum num-ber of assumptions, we have made use of the datacompiled by Elbaz et al. (2002), which include IRAS60 and 100 µm measurements and ISO observations of149 local star-forming galaxies with LIR in the range109 . LIR . 1012.6 L⊙. The mean and dispersion ofthe IR/MIR flux ratio for the sample of 149 galaxiesis 〈log(LIR/L5−8.5µm)〉 = 1.24 ± 0.35. Note the large1 σ dispersion of a factor of 2.2 in the IR/MIR flux ra-tio. The dispersion in the IR/MIR flux ratios betweengalaxies may be driven partly by changes in the mid-IR line strengths as the aromatic carriers are dehydro-genated and/or destroyed depending on the intensity ofthe ambient UV ionizing field (e.g., Alonso-Herrero et al.
10 Another commonly used definition of LIR is the total luminos-ity from 1−1000 µm. This will differ from L8−1000µm by only a fewpercent, and for the remaining analysis, we take LIR ≡ L8−1000µm ,as defined by Sanders & Mirabel (1996).
Fig. 4.— Ratio of L5−8.5µm and stacked rest-frame 2−10 keV X-ray luminosity in bins of L5−8.5µm for galaxies with redshifts 1.5 <z < 2.6 and those with inferred ages greater than 100 Myr. Wehave excluded sources directly-detected in the Chandra 2 Ms data.The faintest bin is for galaxies undetected at 24 µm. Horizontalerror bars indicate the 1 σ dispersion in L5−8.5µm in each bin.Vertical error bars show the uncertainty in the mid-IR-to-X-rayluminosity ratio, computed as the uncertainty in the mean X-rayluminosity added in quadrature with the Poisson error in the meanmid-IR luminosity of galaxies in each bin. The dashed horizontalline and shaded region indicate the mean and 1 σ uncertainty ofthe mid-IR-to-X-ray luminosity ratio of ∼ 251 ± 41.
2004; Helou et al. 2001; Dale et al. 2001; Normand et al.1995). Metallicity effects and a changing distribution ofdust with respect to HII regions also likely contribute tothe observed factor of 2−3 dispersion in the IR/MIR ra-tios. Nonetheless, the mean IR/MIR flux ratio is similarto that inferred from the Dale et al. (2001) template SEDfor a median log[fν(60µm)/fν(100µm)] ∼ −0.20. Basedon the sample of 149 galaxies from Elbaz et al. (2002),we assume LIR ≈ 17.2L5−8.5µm to convert L5−8.5µm toLIR.
It is worth noting that the relationship betweenL5−8.5µm and total IR luminosity for local star-forminggalaxies may be described by a more complicated func-tion, such as a two power-law fit (e.g., Elbaz et al. 2002).These complicated relationships may not apply to galax-ies at z ∼ 2 for several reasons. First, the IR/MIR ratiomay change depending on the relative contribution ofolder stellar populations in heating PAH and larger dustgrains. The heating of dust by cooler stars is expectedto be more prevalent for the less luminous local galaxieswith older stellar populations, on average, than for z ∼ 2galaxies with relatively younger stellar populations. Sec-ond, it is found that z ∼ 2 galaxies have metallicities thatare on average 0.3 dex lower than those of local galax-ies at a given stellar mass (Erb et al. 2006a). Therefore,the metallicity dependence of the IR/MIR ratio foundfor local galaxies (e.g., Engelbracht et al. 2005) suggeststhat we may not be able to ascribe the IR/MIR ratiofor a galaxy of a given stellar mass at z = 0 to a galaxyat z ∼ 2 with the same stellar mass. A third possibil-ity, and one that is suggested by the results of this pa-per and other studies (e.g., Adelberger & Steidel 2000;Calzetti & Heckman 1999), is that the dust obscurationof galaxies at a given bolometric luminosity changes as
8 Reddy et al.
function of redshift, a result that may reflect dust enrich-ment and/or a changing configuration of dust as galax-ies age. Therefore, the relative distribution of PAH andlarger dust grains within galaxies may also change as afunction of redshift. Because of these uncertainties, andsince the primary motivation of our study is to indepen-dently establish the validity of MIPS observations to inferthe infrared luminosities of z ∼ 2 galaxies, we adoptedthe simplest conversion that assumes only that the typ-ical IR/MIR luminosity ratio for local galaxies with awide range in infrared luminosity applies at z ∼ 2. Bytaking an average over the local galaxies, we ensure thatthe derived LIR is not more than a factor of 2 − 3 awayfrom that predicted using the IR/MIR ratio of any in-dividual galaxy. As we show below, our constant con-version reproduces within the uncertainties the resultsthat we obtain from stacked X-ray and dust-correctedUV estimates of LIR.
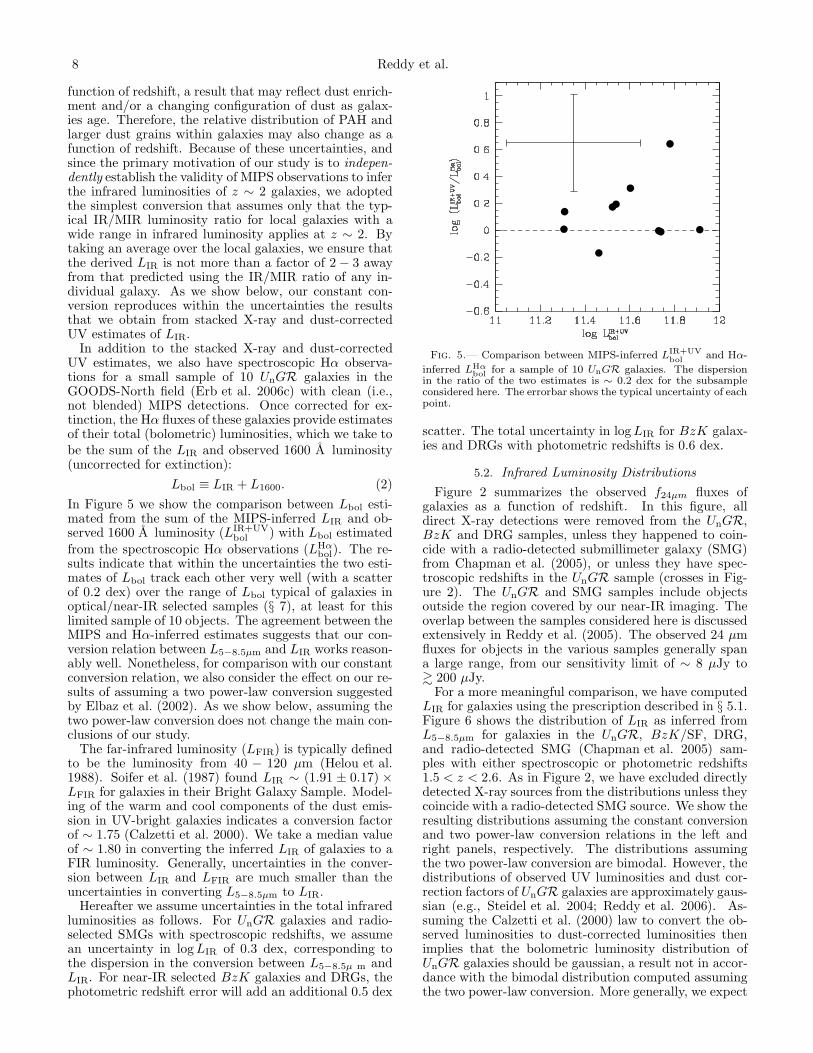
In addition to the stacked X-ray and dust-correctedUV estimates, we also have spectroscopic Hα observa-tions for a small sample of 10 UnGR galaxies in theGOODS-North field (Erb et al. 2006c) with clean (i.e.,not blended) MIPS detections. Once corrected for ex-tinction, the Hα fluxes of these galaxies provide estimatesof their total (bolometric) luminosities, which we take tobe the sum of the LIR and observed 1600 A luminosity(uncorrected for extinction):
Lbol ≡ LIR + L1600. (2)
In Figure 5 we show the comparison between Lbol esti-mated from the sum of the MIPS-inferred LIR and ob-served 1600 A luminosity (LIR+UV
bol ) with Lbol estimated
from the spectroscopic Hα observations (LHαbol). The re-
sults indicate that within the uncertainties the two esti-mates of Lbol track each other very well (with a scatterof 0.2 dex) over the range of Lbol typical of galaxies inoptical/near-IR selected samples (§ 7), at least for thislimited sample of 10 objects. The agreement between theMIPS and Hα-inferred estimates suggests that our con-version relation between L5−8.5µm and LIR works reason-ably well. Nonetheless, for comparison with our constantconversion relation, we also consider the effect on our re-sults of assuming a two power-law conversion suggestedby Elbaz et al. (2002). As we show below, assuming thetwo power-law conversion does not change the main con-clusions of our study.
The far-infrared luminosity (LFIR) is typically definedto be the luminosity from 40 − 120 µm (Helou et al.1988). Soifer et al. (1987) found LIR ∼ (1.91 ± 0.17) ×LFIR for galaxies in their Bright Galaxy Sample. Model-ing of the warm and cool components of the dust emis-sion in UV-bright galaxies indicates a conversion factorof ∼ 1.75 (Calzetti et al. 2000). We take a median valueof ∼ 1.80 in converting the inferred LIR of galaxies to aFIR luminosity. Generally, uncertainties in the conver-sion between LIR and LFIR are much smaller than theuncertainties in converting L5−8.5µm to LIR.
Hereafter we assume uncertainties in the total infraredluminosities as follows. For UnGR galaxies and radio-selected SMGs with spectroscopic redshifts, we assumean uncertainty in log LIR of 0.3 dex, corresponding tothe dispersion in the conversion between L5−8.5µ m andLIR. For near-IR selected BzK galaxies and DRGs, thephotometric redshift error will add an additional 0.5 dex
Fig. 5.— Comparison between MIPS-inferred LIR+UVbol
and Hα-
inferred LHαbol
for a sample of 10 UnGR galaxies. The dispersionin the ratio of the two estimates is ∼ 0.2 dex for the subsampleconsidered here. The errorbar shows the typical uncertainty of eachpoint.
scatter. The total uncertainty in log LIR for BzK galax-ies and DRGs with photometric redshifts is 0.6 dex.
5.2. Infrared Luminosity Distributions
Figure 2 summarizes the observed f24µm fluxes ofgalaxies as a function of redshift. In this figure, alldirect X-ray detections were removed from the UnGR,BzK and DRG samples, unless they happened to coin-cide with a radio-detected submillimeter galaxy (SMG)from Chapman et al. (2005), or unless they have spec-troscopic redshifts in the UnGR sample (crosses in Fig-ure 2). The UnGR and SMG samples include objectsoutside the region covered by our near-IR imaging. Theoverlap between the samples considered here is discussedextensively in Reddy et al. (2005). The observed 24 µmfluxes for objects in the various samples generally spana large range, from our sensitivity limit of ∼ 8 µJy to& 200 µJy.
For a more meaningful comparison, we have computedLIR for galaxies using the prescription described in § 5.1.Figure 6 shows the distribution of LIR as inferred fromL5−8.5µm for galaxies in the UnGR, BzK/SF, DRG,and radio-detected SMG (Chapman et al. 2005) sam-ples with either spectroscopic or photometric redshifts1.5 < z < 2.6. As in Figure 2, we have excluded directlydetected X-ray sources from the distributions unless theycoincide with a radio-detected SMG source. We show theresulting distributions assuming the constant conversionand two power-law conversion relations in the left andright panels, respectively. The distributions assumingthe two power-law conversion are bimodal. However, thedistributions of observed UV luminosities and dust cor-rection factors of UnGR galaxies are approximately gaus-sian (e.g., Steidel et al. 2004; Reddy et al. 2006). As-suming the Calzetti et al. (2000) law to convert the ob-served luminosities to dust-corrected luminosities thenimplies that the bolometric luminosity distribution ofUnGR galaxies should be gaussian, a result not in accor-dance with the bimodal distribution computed assumingthe two power-law conversion. More generally, we expect

Star Formation and Extinction in z ∼ 2 Galaxies 9
Fig. 6.— Distributions of LIR as inferred from L5−8.5µm for galaxies in the UnGR, BzK/SF, DRG, and radio-detected SMG(Chapman et al. 2005) samples with redshifts 1.5 < z < 2.6 assuming our constant conversion between L5−8.5µm and LIR (left panel)and the two power-law conversion of Elbaz et al. (2002) (right panel). We have excluded directly-detected X-ray sources unless they hap-pen to coincide with a radio-detected SMG.
to find gaussian distributions of luminosity for galaxiesin photometric surveys since such galaxies are typicallyselected on a continuous range of observed colors and/ormagnitudes. The bimodality in Figure 6b is likely dueto the sparse data used to establish the two power-lawrelation for galaxies with 1×10¹¹ . LIR ≈. 5×10¹¹ L⊙
(see Figure 5d of Elbaz et al. 2002). This range of LIR
happens to encompass the typical IR luminosity of z ∼ 2galaxies as inferred from X-ray and dust-corrected UV es-timates (Reddy & Steidel 2004) and it is partly for thisreason that we favored our simple constant conversionrelationship.
Regardless of the conversion used, we find that thebulk of the galaxies in the UnGR and BzK/SF samplesand detected at 24 µm have inferred infrared luminositiescomparable to those of local luminous infrared galaxies(LIRGs), with 1011 . LIR . 1012 L⊙. Galaxies in theUnGR sample with f24µm & 8 µJy (corresponding to the3 σ sensitivity limit) have 〈LIR〉 ∼ 3.1 × 10¹¹ L⊙ for theconstant conversion and 〈LIR〉 ∼ 2.1×10¹¹ L⊙ for the twopower-law conversion (the two power-law distribution isbroader than that obtained using the constant conver-sion). Both the UnGR and BzK/SF samples also hostgalaxies which, based on their inferred LIR, would be con-sidered ultra-luminous infrared galaxies (ULIRGs) withLIR & 1012 L⊙. Note that if we excluded all direct X-ray detections, including the submillimeter sources, themaximum inferred LIR of UnGR and BzK/SF galaxiesis ≈ 2.5× 10¹² L⊙, an infrared luminosity which is simi-lar to the detection limit of the Chandra 2 Ms data for agalaxy at z ∼ 2 assuming the Ranalli et al. (2003) con-version between X-ray and FIR luminosity.
The BzK/SF sample distribution shown in Figure 6 in-cludes galaxies that do not satisfy the UnGR criteria (i.e.,BzK/SF–UnGR galaxies). These galaxies (to Ks = 21)have a mean IR luminosity that is identical to that ofUnGR galaxies to Ks = 21. The average IR luminosity ofUnGR galaxies is ∼ 1.8 times fainter than BzK galaxies
since the UnGR sample includes galaxies which extendto fainter Ks magnitudes than those in the BzK sample.Therefore, while the BzK/SF–UnGR galaxies have red-der G−R colors than required to satisfy the UnGR cri-teria, it appears that their infrared luminosities are stillcomparable to those of UnGR galaxies (see also the dis-cussion in § 6), a result consistent with that obtained inX-ray stacking analyses (Reddy et al. 2005). Figure 6 in-dicates the DRG galaxies with photometric redshifts be-tween 1.5 < z < 2.6 also span a large range in LIR, fromluminosities characteristic of LIRGs to ULIRGs. We finda luminosity distribution of DRGs to Ks = 21 that isin good agreement with the LIR distribution found byPapovich et al. (2005) for DRGs (to approximately thesame depth) in the GOODS-South field11. We note thatUnGR galaxies and DRGs to Ks = 20 have the sameinferred LIR as Ks < 20 galaxies selected in other ways(e.g., using the BzK/SF criteria).
The inferred LIR for the one BzK/PE selected galaxywith z ∼ 1.5 is ∼ 1.2 × 10¹² L⊙. The mean f24µm fluxof MIPS-detected (and non X-ray detected) BzK/PEgalaxies without redshifts is 〈f24µm〉 ≈ 81.4 µJy which, atthe mean redshift of BzK/PE galaxies (e.g., Reddy et al.2005; Daddi et al. 2004) of z ∼ 1.7, corresponds toLIR ∼ 6 × 10¹¹ L⊙. The 24 µm detection rate (∼ 50%;Table 1) of non X-ray detected BzK/PE galaxies im-plies some contamination by star-forming galaxies; thisis not unexpected given that photometric scattering canhave a significant effect on samples constructed by colorselection techniques (Reddy et al. 2005).
The radio-detected submillimeter galaxies to S850µm ∼4.2 mJy analyzed here have inferred LIR of 1012 . LIR .1013 L⊙, which can be directly compared with theirbolometric luminosities calculated based on the submil-limeter data presented by Chapman et al. (2005). The
11 The DRG sample of Papovich et al. (2005) extends to Ks =23.2 in AB magnitudes, or Ks ∼ 21.4 in Vega magnitudes, over anarea twice as large as studied here.

10 Reddy et al.
850 µm-inferred bolometric luminosities (L850µmIR ) are
sensitive to the assumed characteristic dust temperatureassociated with a greybody fit to the dust SED and theemissivity. For example, a change in the assumed dusttemperature from Td = 36 K (the median value for thesample of radio-detected SMGs in Chapman et al. 2005)to a cooler temperature of Td = 31 K results in a factorof ∼ 5 decrease in the inferred FIR luminosities. Fig-ure 7 shows the comparison between 850 µm and 24 µminferred bolometric luminosities of radio-detected SMGs.We also show the point corresponding to IRS9 from theYan et al. (2005) sample of hyperluminous z = 2 sourceswith IRS spectroscopy — this source has independentconstraints on its FIR luminosity based on MIPS 70 and160 µm and MAMBO millimeter measurements. Theinfrared luminosity of IRS9 is LIR ∼ 1.8× 10¹³ L⊙ (con-strained to within a factor of 2−3) based on these multi-wavelength measurements (Yan et al. 2005).
Fig. 7.— L850µmIR
, inferred from the submillimeter fluxes of radio-
detected SMGs (Chapman et al. 2005), plotted against L5−8.5µmIR
inferred from L5−8.5µm assuming a IR/MIR flux conversion of17.2 (solid circles) and the two power-law conversion of Elbaz et al.(2002) (crosses). The infrared luminosity of IRS9 is inferred fromMIPS 24, 70, and 160µm data and MAMBO millimeter measure-ments (Yan et al. 2005). Also shown are the local star-formingtemplates listed in Table 2.
Figure 7 shows that the IR/MIR flux ratio for IRS9 iscomparable (to within ∼ 1 σ) to those of the local star-forming galaxies listed in Table 2— these local galaxiesare 1 − 3 orders of magnitude fainter than IRS9. Judg-ing the validity of our conversion for the hyper-luminousgalaxies at z ∼ 2 is difficult given that very few of thesegalaxies have independent constraints on their bolomet-ric luminosities. On the other hand, the submillimeter(850 µm) inferred infrared luminosities of bright SMGsare systematically a factor of 2 − 10 higher than pre-dicted using our conversion between L5−8.5µm and LIR.The crosses in Figure 7 demonstrate that the systematicoffset cannot be completely accounted for if we assumea two power-law conversion between L5−8.5µm and LIR
— there are still 4 of 9 SMGs with L850µmIR that are fac-
tor of 2 − 10 larger than predicted from their 24 µmfluxes, and the distribution of SMG points when con-
sidering the two-power law conversion is not symmetricabout the line of equality (solid line in Figure 7). Onepossibility is that the submillimeter estimates are in factcorrect and that our assumed conversion between mid-IR and IR luminosities does not apply to SMGs. TheIRS sample considered here consists of just one hyper-luminous galaxy at z = 2, and if we ignore this galaxythen the systematic offset of SMGs may indicate a break-down of our assumed conversion for the most luminoussources at redshifts z ∼ 2 with LIR & 1013 L⊙. The sec-ond possibility is that the submillimeter estimates over-predict the infrared luminosities of SMGs and that ourMIR-to-IR conversion is correct. This may not be sur-prising since the conversion between submillimeter fluxand bolometric luminosity is very sensitive to the as-sumed dust temperature, and a decrease in the assumedtemperature of just a few degrees can reduce the in-ferred bolometric luminosity by a factor of ∼ 5 − 10(see example above). Finally, it is possible that nei-ther the submillimeter or mid-IR inferred infrared lu-minosities of bright SMGs is correct. We note that it iscommon for these luminous galaxies to host AGN, andthis can alter the observed mid-IR and IR fluxes beyondwhat would be expected given pure star formation (e.g.,Armus et al. 2004; Fadda et al. 2002; Almaini et al.1999; Fabian & Iwasawa 1999). As another example,Arp 220 has anomalously low PAH emission for its bolo-metric luminosity (when compared with other ULIRGs),suggesting that the galaxy contains a buried quasarand/or a heavily dust-enshrouded starburst such thatthe extinction at rest-frame 7 µm is no longer negligi-ble (e.g., Haas et al. 2001; Charmandaris et al. 1997).Spitzer IRS observations of bright radio-detected SMGswill be useful in quantifying the relationship between the5 − 8.5 µm and bolometric luminosities of these ultralu-minous sources.
A relevant line of investigation is to determine whatthe various optical and near-IR color and magnitude se-lections imply for the infrared luminosity distributionsof the galaxies they select. Figure 8a shows the in-ferred LIR of galaxies with redshifts 1.5 < z < 2.6as a function of Ks magnitude. We have assumed theIR/MIR flux ratio of 17.2 for the radio-detected SMGsshown in the figure. Galaxies with Ks < 20 (e.g.,K20 samples: Cimatti et al. 2002a; Cimatti et al. 2002b)have 〈LIR〉 ∼ (1 − 2) × 1012 L⊙, similar to the valuefound by Daddi et al. (2005) for Ks < 20 BzK selectedgalaxies in the GOODS-N field. Alternatively, we find〈LIR〉 ∼ 5×10¹¹ L⊙ for UnGR, BzK, and DRG galaxieswith 20 < Ks < 21.0. As stated in § 5.1, the uncer-tainties on any individual value of log LIR are 0.3 dex forUnGR galaxies with spectroscopic redshifts and 0.6 dexfor near-IR selected (BzK; DRG) galaxies with photo-metric redshifts. At any given Ks magnitude, the rangein LIR spans an order of magnitude assuming our con-stant conversion and larger than an order of magnitudeassuming the two power-law conversion of Elbaz et al.(2002). Finally we note that galaxies with Ks < 20 atz ∼ 2 which show some signature of star formation (i.e.,those that are MIPS detected) generally have infraredluminosities that are a factor of two larger than thoseof galaxies with 20 < Ks < 21. As discussed elsewhere,there is also a population of massive galaxies with littledetectable star formation (e.g., van Dokkum et al. 2004;

Star Formation and Extinction in z ∼ 2 Galaxies 11
Fig. 8.— Left panel: Distribution of LIR as a function of Ks for galaxies in the various samples. We have assumed a IR/MIR flux ratio of17.2 for all galaxies including the radio-detected SMGs. Right panel: LIR as a function of (z −K)AB color. Symbols are the same as in theleft panel. The arbitrarily normalized histogram indicates the distribution in (z − K)AB color of DRGs and BzK/PE galaxies undetectedat 24 µm.
Reddy et al. 2005).We investigate this quiescent population of massive
galaxies in the context of their star-forming counter-parts by examining LIR as a function of (z −K)AB color(Figure 8b). The (z − K)AB color probes the Balmerand 4000 A breaks for galaxies at the redshifts of in-terest here, and is also sensitive to the current star for-mation rate (e.g., Reddy et al. 2005; Daddi et al. 2004).Figure 8b shows that galaxies with redder (z − K)AB
color (up to (z − K)AB ∼ 3) have higher inferred LIR
(and larger SFRs if the bolometric luminosity is at-tributed to star formation) on average than galaxies withbluer (z − K)AB colors, a trend similar to that foundwhen stacking X-ray data (Reddy et al. 2005). A moreinteresting result is indicated by the histogram whichshows the distribution in (z − K)AB color of DRGs andBzK/PE galaxies that are undetected at 24 µm. Ofthe 13 MIPS-undetected DRGs and BzK/PE galaxies,7 have (z − K)AB > 3. Reddy et al. (2005) found DRGswith (z−K)AB & 3 to have little X-ray emission and hadcolors similar to those of IRAC Extremely Red Objects(IEROs; Yan et al. 2005). The lack of 24 µm detectionsfor these red (z −K)AB sources further supports the no-tion that they have little current star formation. It alsorules out the possibility that they harbor Compton-thickobscured AGN as an explanation for their lack of X-rayemission, since we would then expect them to be brightat 24 µm.
5.3. Stacked 24 µm Flux
The high quality and depth of the MIPS data enable usto study the average properties of galaxies that are (in-dividually) undetected at 24 µm by stacking their emis-sion. The data were stacked by considering all galax-ies undetected at 24 µm and X-ray wavelengths. Toavoid contaminating the stacked signal, we only addedgalaxies to the stack if there were no bright MIPSsources within ≈ 5′′ of those galaxies. To ensure aclean signal, we extracted sub-images around each un-
Fig. 9.— Stacked 24 µm flux of 48 isolated MIPS-undetectedUnGR galaxies (f24µm . 8 µJy) with spectroscopic redshifts 1.5 <z < 2.6, indicating a mean flux per undetected galaxy of 〈f24µm〉 ≈3.30 ± 0.48 µJy.
detected galaxy, subtracted all detected point sourceswithin those sub-images using the empirical PSF, andadded the sub-images together. The stacked flux wasmeasured in a manner similar to the measurement ofdetected MIPS sources. Figure 9 shows the stacked im-age of 48 MIPS-undetected UnGR galaxies with spec-troscopic redshifts 1.5 < z < 2.6. The mean flux perobject is 〈f24µm〉 ≈ 3.30 ± 0.48 µJy, where the erroris the dispersion of the background in the stacked im-age. At a mean redshift of 〈z〉 = 2.05, this flux cor-responds to LIR ≈ 2 × 10¹⁰ L⊙. Combining this re-sult with the mean LIR of MIPS-detected UnGR galax-ies implies a mean across the entire sample, neglecting“confused” sources, of ≈ 2.3 × 10¹¹ L⊙. This meanvalue does not change significantly if we add in directly-detected X-ray sources (including radio-detected SMGs

12 Reddy et al.
to S850µm ∼ 5 mJy) because of their small number com-pared to the typical (less luminous) UnGR galaxy. Themean value of LIR ≈ 2.3 × 10¹¹ L⊙ is in excellent agree-ment with the average of LIR ≈ 3 × 10¹¹ L⊙ foundfrom stacked X-ray/radio and dust corrected UV esti-mates (Reddy & Steidel 2004). This suggests that thenon-detection of galaxies at 24 µm is due to them havinglower SFRs and not because they are deficient in PAHemission for a given LIR. The advantage of the 24 µmdata over X-ray/radio data is that we can estimate bolo-metric luminosities for individual L∗ (LIRG) galaxies atz ∼ 2 rather than ensembles of galaxies.
Combining our estimate of the MIPS-inferred averageIR luminosity of UnGR galaxies with the stacked radioresults of Reddy & Steidel (2004), we find that the radio-IR relation appears valid on average for the sample. Toquantify the radio-IR ratio for the sample, we computethe “q” parameter (Condon et al. 1991):
q ≡ log( FIR
3.75 × 10¹² W m−2
)
− log( S1.4 GHz
W m−2 Hz−1
)
,(3)
where S1.4 GHz is the rest-frame 1.4 GHz flux density inunits of W m−2 Hz−1 and
FIR ≡ 1.26 × 10⁻¹⁴(2.58S60 µm + S100 µm) W m−2,(4)
where S60 µm and S100 µm are the IRAS 60 and 100 µmflux densities in Jy (Helou et al. 1988). The implied “q”value for the UnGR sample is 〈q〉 ∼ 2.5 if we assumelog[S60 µm/S100 µm] ∼ 0.2. This value of q is in excellentagreement with the value of q ∼ 2.4 found for & 1011 L⊙
galaxies in the IRAS 2 Jy sample (Yun et al. 2001). Wealso stacked the 24 µm data for undetected BzK/PE andDRG galaxies in the same manner as described above,which yielded a mean flux per object of 〈f24µm〉 ∼ 2.72±1.65 µJy. As noted in § 5.2, most of these sources havevery red (z−K)AB colors, and their low-level mid-IR andX-ray emission indicate they have low SFRs. Galaxieswith f24µm . 8 µJy are discussed further below.
6. DUST ATTENUATION IN OPTICAL AND NEAR-IRSELECTED GALAXIES
Aside from inferring the infrared luminosity distribu-tions, we can use the MIPS data to examine the re-lationship between dust extinction and rest-frame UVspectral slope. Meurer et al. (1999) found a relationbetween the rest-frame UV spectral slope, β, and theattenuation of local UV-selected starburst galaxies, pa-rameterized by the ratio LFIR/L1600, where L1600 is therest-frame 1600 A luminosity uncorrected for extinc-tion. This relation appears to fail, however, for the mostluminous starbursts such as ULIRGs (Goldader et al.2002) and radio-detected SMGs (Chapman et al. 2005).A greater proportion of the star formation in galaxieswith LIR & 1012 L⊙ will be obscured by dust as com-pared with LIRG-type starbursts (e.g., see § 7). There-fore, whatever UV emission is able to escape from theoptically-thin regions of ULIRGs will constitute a lowerfraction of the total bolometric luminosity. As a result,the rest-frame UV light can substantially underpredict(by a factor of 10−100) the bolometric luminosities of themost luminous starbursts, such as radio-detected SMGs(Chapman et al. 2005). Normal (“quiescent”) star form-ing galaxies also appear to deviate from the Meurer et al.(1999) relation, such that LFIR/L1600 is lower for a given
amount of UV reddening than in starburst galaxies (e.g,Laird et al. 2005; Bell 2002) a result that may be tiedto the varying ratio of current to past-average star for-mation rate of normal star forming galaxies (Kong et al.2004). Alternatively, the star formation in local quies-cent galaxies (i.e., those with low SFRs) is more dis-tributed than in local starbursts so that a failure of thestarburst reddening law may reflect a different distribu-tion of dust with respect to the star forming regions inquiescent galaxies. Observations of radio-detected SMGsand quiescently star-forming galaxies suggests that theMeurer et al. (1999) and Calzetti et al. (2000) laws donot apply to these sources.
The rest-frame UV spectral and mid-IR data of z ∼ 2galaxies allow us to investigate how well the high redshiftgalaxies follow the local dust attenuation relation. Thefull SED modeling of UnGR galaxies in the GOODS-Nfield yields estimates of the best-fit star formation history(τ), age, mass, SFR, and E(B −V ) color excess for eachgalaxy (Erb et al. 2006b; Shapley et al. 2005). The meanfractional uncertainty in E(B − V ) is 〈σE(B−V)/E(B −V )〉 = 0.7 as determined from Monte Carlo simulations.To convert E(B − V ) to β we assumed that 1 mag ofextinction at 1600 A (A1600 = 1) corresponds to E(B −V ) ≈ 0.092 (e.g., Calzetti et al. 2000). For most galaxies,the best-fit star formation history is close to that of aconstant star formation history (with decay time-scaleτ = ∞). The most massive galaxies at z ∼ 2 (withstellar masses M∗ & 1011 M⊙) are generally better fitwith declining star formation histories. We have assumeda CSF model for galaxies unless such a model providesa much poorer fit to the observed data than a decliningstar formation history.
6.1. Results for Optically Selected Galaxies
Figure 10 shows LFIR/L1600 versus β forspectroscopically-confirmed UnGR galaxies withredshifts 1.5 < z < 2.6. The FIR luminosity is computedfrom L5−8.5µm using the procedure described in § 5.1.
We estimated the rest-frame 1600 A luminosity fromeither the Un, G, or R magnitude depending on theredshift of the galaxy. The majority of UnGR galaxieswith inferred ages & 100 Myr (solid circles) appear toagree well with Meurer et al. (1999) relation, shown bythe solid curve12.
UnGR galaxies with the youngest inferred ages (.100 Myr; open circles) exhibit a large offset from theMeurer et al. (1999) relation in the sense that they ex-hibit redder UV colors for a given dust obscuration thanolder galaxies which do follow the relation. Note thatwe have assumed a CSF model for the young galaxiesshown in Figure 10. The inferred ages of these galax-ies are typically smaller than 50 Myr, which is approxi-mately the dynamical time across the galaxy. Assumingsuch small (and unrealistic ages) will cause us to over-estimate E(B − V ) for these sources. The change inE(B − V ) that results from fixing the age of the younggalaxies to 100 Myr (∆E(B − V ) = 0.09) is not enoughto completely account for the offset of the young galax-ies from the Meurer et al. (1999) relation. This suggests
12 Assuming the two power-law conversion to compute LFIR
results in a similar distribution of points around the Meurer et al.(1999) relation but with larger scatter.

Star Formation and Extinction in z ∼ 2 Galaxies 13
Fig. 10.— (Left) Dust absorption, parameterized by FFIR/F1600, versus rest-frame UV spectral slope, β, for galaxies with redshifts1.5 < z < 2.6. Filled and open symbols respectively denote galaxies with inferred ages of > 100 Myr and < 100 Myr. The large pentagonshows the results for UnGR galaxies undetected at 24 µm, using the stacked results of § 5.3. The horizontal and vertical error bars onthis point reflect the dispersion about the mean β and mean LFIR/L1600 of 24 µm undetected sources. The green points represent theresults from an X-ray stacking analysis as described in the text. The solid line indicates the Meurer et al. (1999) relation found for localUV-selected starburst galaxies. (Right) Same as left panel, but excluding galaxies younger than 100 Myr and color-coding objects by Lbol.
that Calzetti et al. (2000) law may not be applicable tothese young galaxies because of a different configurationof dust with respect to the star-forming regions, in whichcase a grayer extinction law may be appropriate. As oneexample, the well-studied lensed Lyman Break GalaxyMS1512-cB58 has an inferred age of ∼ 70−100 Myr andmillimeter continuum observations suggest that its in-frared luminosity is smaller than one would predict fromits UV reddening (Baker et al. 2001). Regardless of theassumed extinction law, these young galaxies in the sam-ples examined here have similar bolometric (sum of ob-served IR and UV) luminosities as older galaxies (see§ 7).
The deep X-ray data in the GOODS-N field allow usto estimate (X-ray inferred) average infrared luminositiesfor well-defined samples of galaxies (e.g., Reddy et al.2005; Laird et al. 2005; Nandra et al. 2002; Brandt et al.2001). The green points in Figure 10 show the expecteddust absorption inferred from the X-ray data as a func-tion of β. These points were determined by stacking theX-ray data for non X-ray detected UnGR galaxies (withages > 100 Myr) in bins of β. We only considered stack-ing galaxies with ages > 100 Myr since the X-ray emis-sion is sensitive to the star formation rate once O and Bstars evolve to produce high mass X-ray binaries, which isroughly 108 years after the onset of star formation. Theaverage X-ray flux per bin was converted to a FIR fluxusing the Ranalli et al. (2003) relation. Dividing the av-erage FIR flux per bin by the average 1600 A luminosityof objects in each bin yields the green points. The hori-zontal error bars indicate the bin width and the verticalerror bars indicate the dispersion in stacked X-ray flux(computed using the procedure described in Reddy et al.(2005) and Reddy & Steidel (2004)) added in quadraturewith the dispersion in the FIR/X-ray luminosity relationfound by Ranalli et al. (2003). The X-ray results re-produce the Meurer et al. (1999) relation very well, pro-viding an independent confirmation that typical UnGR
galaxies abide by the local dust obscuration relation forstarburst galaxies. The X-ray and mid-IR data indicatethat the UV slope can be used to deduce the extinctioncorrections for these typical galaxies and that such galax-ies have UV light that is only moderately extinguished inmost cases. The agreement between the MIPS inferredFIR luminosities and X-ray inferred FIR luminosities(obtained with the empirically-determined Ranalli et al.(2003) relation) suggests that the Ranalli et al. (2003) re-lation provides a reasonable description for most of thegalaxies considered here. For comparison, adopting thePersic et al. (2004) relation would yield FIR luminositiesfive times in excess of those predicted from the 24 µmfluxes for the vast majority of z ∼ 2 galaxies.
We compute the average dust obscuration of UnGRgalaxies undetected at 24 µm using the stacking resultsof § 5.3, and the result is denoted by the large pentagonin Figure 10. The stacked 24 µm FIR luminosity of MIPSundetected galaxies is divided by their average rest-frame1600 A luminosity. For these galaxies, L1600 is on aver-age 1.6 times larger than their inferred LFIR indicatingthey are significantly less obscured than galaxies detectedat 24 µm. These undetected galaxies also have relativelyblue rest-frame UV SEDs (as indicated by their aver-age β) compared to 24 µm detected galaxies. Further-more, the results of Figure 4 indicate these faint sourceshave lower X-ray emission than 24 µm detected galaxies.All of these observations combined suggest that galaxiesare undetected at 24 µm because they have lower SFRsand are less obscured than galaxies with brighter 24 µmfluxes. We further explore the nature of these MIPS un-detected sources in § 8.
6.2. Results for Near-IR and Submillimeter SelectedGalaxies
Also shown in Figure 10 are BzK/SF galaxies to Ks =21 not satisfying the UnGR criteria. As pointed out in§ 5.2, these BzK/SF selected galaxies have inferred LIR

14 Reddy et al.
that are comparable to those of UnGR galaxies to thesame Ks limit, but of course with redder G − R colorsand a R ∼ 0.5 mag fainter on average than UnGR galax-ies to the same Ks limit. The results of Figure 10 suggestthat BzK/SF galaxies lying outside the color range se-lected by the UnGR criteria also follow the Meurer et al.(1999) relation. Similar to the results found in § 6.1for most UnGR galaxies, the mid-IR data indicate thatthe UV light from most BzK/SF galaxies appears to bemoderately extinguished and that the UV slope can beused to estimate their attenuation.
Almost all of the radio-detected SMGs consideredhere have inferred dust absorption factors (when we as-sume the 850 µm-inferred bolometric luminosities) thatare at least a magnitude larger than predicted by theMeurer et al. (1999) relation for a given rest-frame UVslope. The discrepancy is not as substantial (i.e., it isreduced by a factor of 2 − 10) if we inferred LIR of theSMGs from their 24 µm fluxes assuming our conversionbetween MIR and IR luminosity. The UnGR criteria aredesigned to select objects where followup spectroscopy isfeasible, and this usually implies setting a limit to the al-lowed E(B−V ) (or β) of objects in the sample. However,given that at least half the galaxies with Lbol & 1012 L⊙have UV slopes comparable to that of the typical UnGRgalaxy, it is not uncommon to find such dust-obscuredgalaxies in optical surveys.
Of the limited sample of DRGs with photometric red-shifts 1.5 < z < 2.6, at least half lie above the lo-cal starburst attenuation law. We are able to findDRGs that agree with the Meurer et al. (1999) rela-tion since the MIPS data studied here are significantlydeeper (by a factor of ∼ 5) than the data consideredin Papovich et al. (2005). In particular, we find thesurface density of DRGs between 1.5 < z < 2.6 with1 . log(FFIR/F1600) . 2 of & 0.14 arcmin−2 (this isa lower limit since there are number of DRGs withoutphotometric redshifts, some of which may truly lie atredshifts 1.5 < z < 2.6), which is at least a factor of 20higher than in Papovich et al. (2005). Our results sug-gest that the DRG population consists of galaxies witha very wide range in star formation rate, from galax-ies with little or no star formation (DRGs with very red(z − K)AB colors; § 5.2) to those which are heavily ob-scured and rapidly forming stars.
6.3. Relationship between β and Obscuration as aFunction of Luminosity
Figure 10b shows galaxies with ages > 100 Myr withinthe samples, color-coded by their Lbol. Virtually all ob-jects with Lbol in the range 1011 < Lbol < 1012.3 L⊙ haveβ which appear to reproduce their obscuration as inferredfrom the Meurer et al. (1999) and Calzetti et al. (2000)laws. There is some weaker evidence that the galaxieswith the lowest SFRs (undetected at 24 µm) as indicatedby the green pentagon in Figure 10b follow a differentextinction law. More pronounced, however, is the sys-tematic offset of the most luminous galaxies consideredhere with Lbol > 1012.3 L⊙. These ultraluminous galax-ies have rest-frame UV slopes that underpredict theirobscuration by a factor of 10 − 100. The main resultsof Figure 10b indicate that the relationship between UVreddening and obscuration is strongly dependent on thebolometric luminosity, but that most LIRG galaxies at
z ∼ 2 follow the local relation.
7. RELATIONSHIP BETWEEN DUST OBSCURATION ANDBOLOMETRIC LUMINOSITY
The bolometric luminosity of star-forming galaxies canbe well-approximated by the sum of the IR and UV lu-minosities as indicated in Equation 5. Figure 11 showsLbol as a function of dust obscuration for objects in thevarious samples assuming a constant conversion relationbetween mid-IR and total IR luminosity. Typical (LIRG)galaxies at z ∼ 2 will have Lbol ≈ LIR where ∼ 90% ofthe bolometric luminosity is emitted in the infrared. Thebolometric luminosity is strongly correlated with dustobscuration: galaxies with larger bolometric luminosi-ties are more dust obscured than less luminous galaxies.The best-fit linear trend for spectroscopically-confirmedUnGR galaxies detected at 24 µm is
log Lbol = (0.62 ± 0.06) logLIR
L1600+ (10.95 ± 0.07) (5)
(solid line in Figure 11; we note that the two axes arenot independent of each and may partly account for thetight scatter in the correlation). UnGR galaxies unde-tected at 24 µm are indicated by the pentagon. Theseundetected galaxies have an average bolometric luminos-ity of 〈Lbol〉 ∼ 6 × 10¹⁰ L⊙ and have UV luminositiesthat are a factor of ∼ 10 less dust obscured than the typ-ical 24 µm detected UnGR galaxy. Approximately halfof the bolometric luminosity of these 24 µm undetectedgalaxies is emitted in the UV. Galaxies with inferred ages< 100 Myr (yellow symbols in Figure 11) have Lbol com-parable to those of older galaxies at z ∼ 2, suggestingthat these young galaxies have similar IR/MIR ratiosas older galaxies. Therefore, the deviation of the younggalaxies from the Meurer et al. (1999) law as noted in§ 6 suggests that we have over-estimated E(B − V ) forthese young sources and/or they may follow a steeper(e.g., SMC-like) extinction law.
We note that UnGR galaxies with Ks < 21 have bolo-metric luminosities and dust obscuration comparable toBzK galaxies to Ks = 21 that are not optically selected.This implies that objects missed by optical selection butwhich appear in the near-IR selected BzK sample arenot missed because they are more dust obscured, a resultcorroborated by X-ray stacking analyses (Reddy et al.2005). The bright radio-detected SMGs have the highestinferred bolometric luminosities among all galaxies con-sidered here, of order ∼ 1013 L⊙ with dust obscurationfactors & 100. Galaxies in the UnGR, BzK, and radio-detected SMG samples detected at 24 µm mostly followthe linear relation denoted by the solid line in Figure 11.For SMGs, Lbol ≈ LIR, so assuming the submillimeter es-timates of LIR (rather than the mid-IR estimates shownin Figure 11) will move the SMGs in a direction parallelto the z ∼ 2 trend.
DRGs detected at 24 µm span a large range inLIR/L1600. About half the DRGs follow the linear trendestablished for optically selected galaxies at z ∼ 2. Theremaining half of DRGs have similar bolometric lumi-nosities to those which follow the z ∼ 2 trend, but theUV luminosities are a magnitude more attenuated thanwhat we would have predicted from the Meurer et al.(1999) law. The SED analysis (§ 4) demonstrates thatall of the DRGs which follow the z ∼ 2 trend are all rela-

Star Formation and Extinction in z ∼ 2 Galaxies 15
Fig. 11.— Bolometric luminosity, approximated as the sum of the IR and UV luminosities, versus dust obscuration. Shown are thedistributions for z ∼ 2 galaxies, and the solid line indicates the best-fit linear relation for spectroscopically confirmed UnGR galaxiesdetected at 24 µm. For comparison, the pentagon denotes the result for galaxies in the UnGR sample undetected at 24 µm, and the yellowsymbols denote objects with inferred ages < 100 Myr. We also show local galaxies from the compilation of Bell (2003). Galaxies of a givenbolometric luminosity are typically 8 − 10 times less dust obscured at high redshift than at the present epoch.
tively young galaxies (ages . 2 Gyr) and have lower stel-lar masses (M∗ . 1011 M⊙). In contrast, DRGs whichare offset from the trend are all older (ages & 2 Gyr) andall have masses > 1.2×10¹¹ M⊙. The offset could be ex-plained naturally if the dust masses of galaxies increaseas they age, a natural consequence of star formation.Note that if the massive, metal-rich DRGs have strongerPAH flux for a given IR luminosity than the youngergalaxies, then this would serve to only increase the offsetbetween the massive DRGs and the z ∼ 2 trend. In fact,stacking the X-ray data for the younger and older DRGsindicates they have very similar bolometric luminosities,confirming the results obtained by inferring LIR from thePAH flux. The results of Figure 11 suggest that muchof the dust in galaxies with the largest stellar masseswas produced by star formation prior to the episode cur-rently heating the dust. Therefore, such galaxies willhave larger dust obscuration for a given bolometric lu-minosity. Assuming the two power-law conversion of
Elbaz et al. (2002) would result in a z ∼ 2 trend witha slope 20% larger than given in Equation 5, but withapproximately the same intercept within the uncertain-ties, so our conclusions would be unchanged.
As galaxies are enriched with dust as they age, then weexpect to see an even greater difference in dust obscura-tion between z ∼ 2 galaxies and those at the presentepoch. To investigate this, we examined Lbol versusLIR/L1600 for the sample of local galaxies compiled byBell (2003), shown by crosses in Figure 11. The localsample includes the ULIRGs studied by Goldader et al.(2002). Unfortunately, the UV and IR data for localLIRG and ULIRGs are relatively sparse. However, ofthe small sample of local galaxies with Lbol & 1011 L⊙,almost all (10 of 11) lie to the right of the linear trendat z ∼ 2 and at least half occupy the same region as theold, massive DRGs at z ∼ 2. In fact, an interesting corol-lary to the above discussion is that massive, star-formingDRGs at z ∼ 2 are more analogous to local ULIRGs than

16 Reddy et al.
bright SMGs at z ∼ 2, both in terms of bolometric lu-minosity and dust-obscuration. Local ULIRGs undoubt-edly carry a significant amount of dust into their currentstar formation episodes (e.g., Goldader et al. 2002), soit not surprising that they have similar dust-obscurationfactors as massive, star-forming DRGs at z ∼ 2. On theother hand, most galaxies lying on the z ∼ 2 trend, in-cluding many bright SMGs, are likely undergoing theirfirst major episode of star formation and have relativelylow dust-to-gas ratios, unlike the more massive (offset)DRGs and local galaxies.
The offset between z = 0 and z ∼ 2 galaxies can beseen at fainter bolometric luminosities where the localsample includes more galaxies (1010 . Lbol . 1011). Re-stricting our analysis to galaxies in the Bell (2003) samplewith Lbol comparable to those of 24 µm undetected z ∼ 2galaxies, we find that the local sample is on average ∼ 10times more dust obscured than 24 µm undetected galax-ies at z ∼ 2. Further, recent GALEX results indicatethat local near-UV selected galaxies with Lbol = 1011 L⊙
have a mean dust obscuration factor of ≈ 10; this is8 times larger than the inferred dust obscuration of aLbol = 1011 L⊙ galaxy at z = 2 (Burgarella et al. 2005).To summarize, the important result from Figure 11 isthat galaxies of a given bolometric luminosity are on av-erage a factor of 8 − 10 less dust obscured at z ∼ 2 thanat the present epoch, confirming the trend first noted byAdelberger & Steidel (2000) between galaxies at z = 0,z ∼ 1, and z ∼ 3; this result is also suggested by the workof Calzetti & Heckman (1999). Again, this result couldbe anticipated if successive generations of star formationadd to already existing dust within galaxies and/or if thedust distribution within galaxies becomes more compactwith time (e.g., via the effects of mergers which tend todrive gas and dust to the central kpc of the system).The net result of dust enrichment and a more compactdistribution of dust (e.g., after a merger event) is an in-crease in the dust column density towards star-formingregions. The relationship between dust obscuration andLbol (i.e., Eq 5) indicates that for the mean Lbol of theUnGR selected sample of galaxies of Lbol ∼ 2.3×10¹¹ L⊙,the average dust obscuration is 〈LIR/L1600〉 ≈ 4.6. Thisfactor is in excellent agreement with the mean attenu-ation of 4.5 − 5.0 inferred from stacked X-ray analyses(Reddy & Steidel 2004). One would observe a factor of4−5 attenuation in a galaxy one order of magnitude lessluminous at z = 0 than at z ∼ 2. The implication isthat, while it is true that a larger fraction of star forma-tion at high redshifts occurs in dustier systems, the dustobscuration we observe for galaxies of a given Lbol hasless of an impact on observations of high redshift galax-ies than one would have surmised on the basis of presentday galaxies.
8. PROPERTIES OF 24 µM FAINT GALAXIES
8.1. Ages and Masses of Faint 24 µm Galaxies
In addition to the information gleaned from the stack-ing analysis described above, we also have detailed infor-mation on the stellar populations of galaxies with faintmid-IR emission. Optical and near-IR selected galaxiesundetected at 24 µm appear to have a distribution in ageswhich is similar to that of 24 µm detected galaxies (leftpanel of Figure 12), so young ages cannot explain whythey are undetected at 24 µm. Alternatively, although
we find a large range in inferred stellar mass of galaxieswith f24µm < 8 µJy, the mean stellar mass of undetectedobjects is 0.4 dex lower in log M∗ than 24 µm detectedgalaxies (right panel of Figure 12). Regardless of thesesmall differences in the stellar populations of 24 µm de-tected and undetected sources, the X-ray data indicatethat the primary reason why galaxies are undetected at24 µm is because they have lower SFRs (Figure 4). Wedemonstrate in the next section how the rest-frame UVspectral properties of galaxies can be used to interprettheir 24 µm emission.
8.2. Composite UV Spectra
A unique advantage of our optical UnGR selection isthe efficiency with which we are able to obtain rest-frameUV spectra for these galaxies, and this spectroscopy al-lows for an independent probe of the physical conditionsin the ISM. While the S/N of any individual spectrum istypically too low to accurately measure interstellar ab-sorption line widths, we can take advantage of the largenumber of spectra by stacking them to create a higherS/N composite spectrum. To investigate differences inthe ISM as a function of infrared luminosity, we con-structed composite UV spectra for (a) the top quartileof 24 µm detected UnGR galaxies, and (b) all UnGRgalaxies undetected at 24 µm. In order to stack the spec-tra, we first de-redshifted them by the systemic redshift.The systemic redshift was inferred from a weighted com-bination of the measured absorption and/or emission lineredshifts, following the procedure of Adelberger et al.(2003). We used the Rix et al. (2004) prescription tonormalize the composite spectra to the underlying stel-lar continua. The detected and undetected compositespectra consist of 39 and 73 galaxies, respectively, andare shown in Figure 13. For comparison, the mean24 µm flux of MIPS detected and undetected galaxiesis 〈f24 µm〉 ∼ 100 µJy and ∼ 3 µJy, respectively; bothsub-samples have 〈z〉 ∼ 2.1. Table 3 lists the measuredrest-frame equivalent widths of several interstellar ab-sorption lines in the composite spectra. The primarydifference between the rest-frame UV spectra of 24 µmdetected and undetected galaxies is that the latter haveinterstellar absorption lines that are a factor of 2 weakerthan the lines in the 24 µm detected galaxies. Becausethe line strengths are controlled by the combination ofthe velocity spread in outflowing interstellar material andthe covering fraction of optically-thick material, this in-dicates that galaxies weak in mid-IR emission are likelyto have more quiescent ISM than 24 µm-bright galaxies,a result expected if those galaxies undetected by MIPShave lower SFRs, and hence lower energy input into theISM and a lower level of dust enrichment, than 24 µmdetected galaxies.
Comparing the mid-IR detections with nondetections,we find the latter have significantly stronger Lyα emis-sion than the former. The emergent Lyα profiles of galax-ies will depend strongly on a number of physical param-eters including the spectrum of UV radiation (i.e., thestellar IMF), presence of outflows, and dust covering frac-tion. Neglecting all of these effects, galaxies with largerSFRs will have stronger Lyα emission. However, giventhat the bolometric luminosity of star-forming galaxiesscales with dust-obscuration (e.g., Figure 11), we mightexpect 24 µm detected galaxies to have larger dust col-

Star Formation and Extinction in z ∼ 2 Galaxies 17
Fig. 12.— Histograms of the age (left panel) and mass (right panel) distributions for 24 µm detected and non-detected UnGR galaxieswith redshifts 1.5 < z < 2.6. The age distributions of detected and non-detected UnGR galaxies are similar. The mean of the massdistributions are offset such that undetected galaxies have 〈log M∗〉 that is 0.4 dex lower than that of 24 µm detected galaxies.
Fig. 13.— Normalized composite UV spectra for the 39 galaxies in the top quartile of 24 µm detected UnGR galaxies (top) with〈f24µm〉 ∼ 100 µJy and 73 UnGR galaxies undetected at 24 µm (bottom) with 〈f24µm〉 ∼ 3 µJy.

18 Reddy et al.
TABLE 3Interstellar Absorption Line Wavelengths and
Equivalent Widths for 24 µm Detected andUndetected UnGR Galaxies
Line λtransa Detected Wλ
b Undetected Wλb
Si II 1260.4 2.58 0.99OI + Si II 1303.3 2.27 1.58C II 1334.5 2.05 0.94Si II 1526.7 2.36 1.32Fe II 1608.5 0.87 1.15Al II 1670.8 1.85 1.15Al III 1854.7 1.66 0.55Al III 1862.8 0.81 0.64
aTransition wavelength in A.bMeasured rest-frame equivalent width in A.
umn densities than undetected galaxies; this may partlyexplain the absence of Lyα emission in 24 µm detectedgalaxies. In addition, the velocity spread of the ISM willalso affect the emergent Lyα profile: the larger veloc-ity spread in 24 µm detected galaxies, as indicated bytheir stronger interstellar absorption lines, implies mostLyα photons will have larger scattering path-lengths andare more likely to be attenuated by dust and/or scat-tered out of resonance (e.g., Hansen & Peng Oh 2005;Adelberger et al. 2003).
Finally, we note that the stacked X-ray analysis of24 µm-undetected galaxies confirms they have lowerSFRs than 24 µm-detected galaxies. Therefore, galax-ies are undetected at rest-frame 5 − 8.5 µm primarilybecause they have lower SFRs and not because they aredeficient in mid-IR PAH luminosity for a given LIR. Ifsuch undetected galaxies had depressed MIR/IR flux ra-tios, we would not have expected to see as large a differ-ence in the strengths of their interstellar absorption linesas compared with 24 µm detected galaxies.
9. MID-IR PROPERTIES OF MASSIVE GALAXIES AT Z ∼ 2
The epoch between z = 3 and z = 1 appears to bethe most active in terms of the buildup of stellar mass(e.g., Dickinson et al. (2003), see also § 1), but significantnumbers of massive galaxies (M∗ & 1011 L⊙) already ap-pear to be in place by redshifts z ∼ 2. The subsequentevolution of these massive galaxies and their relation tothe local population of massive and passively evolvingelliptical galaxies is an important question. It is usefulto determine, therefore, what the mid-IR properties ofmassive galaxies tell us about their bolometric luminosi-ties.
Figure 14 shows the bolometric luminosity of galaxiesin the UnGR, BzK, and DRG samples as a function ofbest-fit stellar mass. The mass modeling comes from theSED analysis where we have fit for the R+JKs+IRACphotometry assuming a constant star formation (CSF)model. As discussed elsewhere, the stellar mass is themost well determined parameter from the SED analysisand is relatively insensitive to the assumed star forma-tion history (Shapley et al. 2005; Papovich et al. 2001).There are several interesting aspects worth consideringin Figure 14. First, we note that galaxies with theyoungest inferred ages (. 100 Myr) have low stellarmasses (M∗ . 2 × 10¹⁰ M⊙) and span a large range in
Fig. 14.— Inferred Lbol as a function of best-fit stellar massassuming a CSF model for galaxies in the UnGR, BzK, and DRGsamples. We assumed a IR/MIR ratio of 17.2 to convert L5−8.5µm
to LIR. The large solid pentagon and square denote results for un-detected UnGR and the 7 undetected DRG galaxies, respectively.The light gray (yellow) symbols indicate 24 µm-detected galaxieswith inferred ages ≤ 100 Myr.
bolometric luminosity from LIRG- to ULIRG-type galax-ies. Among UnGR galaxies with spectroscopic redshifts1.5 < z < 2.6, we note a trend of increasing Lbol withstellar mass; UnGR galaxies with M∗ & 1011 M⊙ haveinfrared luminosities typical of ULIRGs. The BzK/SFand DRG criteria cull M∗ & 1011 M⊙ galaxies with alarge range in bolometric luminosity, from 1011 L⊙ to& 1012 L⊙. Optically selected sources undetected at24 µm have stellar masses similar to those of detectedUnGR galaxies, but with Lbol a factor of ∼ 10 lower. Asnoted before, the 24 µm emission from these galaxies ap-pears to be primarily dependent on their current star for-mation rate. Finally, we note that DRGs undetected at24 µm have similar stellar masses as those which are de-tected (M∗ & 1011 M⊙), but are on average 40 times lessbolometrically luminous. As noted in § 5.2, these 24 µm-undetected DRGs have very red (z−K)AB colors. Theirfaint 24 µm emission corroborates the results of X-raystacking analyses that indicate these galaxies have verylittle current star formation (Reddy et al. 2005).
The results of Figure 14 suggest that galaxies withlarge stellar masses at z ∼ 2 span a large range in bolo-metric luminosity, from galaxies with little star formationto ULIRG-type systems. The range is likely larger thanwhat one would infer from Figure 14 since we have ex-cluded directly-detected X-ray sources that may be heav-ily star-forming galaxies and/or host AGN. Figure 14suggests that & 70% of massive galaxies (M∗ > 1011 M⊙)with redshifts 1.5 < z < 2.6 in optical and near-IR sur-veys have Lbol & 3 × 10¹¹ L⊙ (or SFRs & 20 M⊙ yr−1,assuming the SFR calibration of Kennicutt 1998a). Ourresults imply that most 1.5 < z < 2.6 galaxies with largestellar masses (M∗ & 1011 M⊙) have levels of star for-mation that exceed those of LIRGs.
10. DISCUSSION
10.1. Selection of LIRGs and ULIRGs at z ∼ 2
In § 5.2 we showed that optical and near-IR selectedsamples to R = 25.5, or Ks = 22, host galaxies with

Star Formation and Extinction in z ∼ 2 Galaxies 19
a wide range in infrared luminosity, from a few times1010 L⊙ up to the most luminous objects at these red-shifts with LIR > 1012 L⊙. Typical galaxies in thesesamples have infrared luminosities in the range 1011 <LIR < 1012 L⊙, similar in luminosity to, but with dust-obscuration a factor of ∼ 10 lower than (see § 7), lo-cal LIRGs. One advantage of optical (i.e., rest-frameUV) selection of LIRGs and ULIRGs at high redshiftis that it allows for the kind of efficient spectroscopicfollowup necessary to accurately interpret the nature of24 µm emission from these galaxies. As shown in § 4,the K-correction depends sensitively on redshift suchthat even for “good” photometric redshift estimates withδz/(1 + z) ∼ 0.1, the corresponding uncertainty in therest-frame 5− 8.5 µm luminosity increases by a factor of5. A particularly unique aspect of our study combiningthe optical sample with MIPS observations is that thespectroscopic database can be used to assess the physi-cal conditions of the ISM in galaxies as function of Lbol,providing an additional method for probing the detailednature of 24 µm galaxies at z ∼ 2 (§ 8.2). Aside fromthe constraints on the mid-IR luminosities possible withspectroscopic redshifts, precise positions of sources fromhigher spatial resolution and shorter wavelength data en-able the deblending of most z ∼ 2 galaxies. The de-blending procedure made possible by optical, near-IR,and Spitzer IRAC observations enable accurate identifi-cation and photometry of faint galaxies well below theMIPS 24 µm confusion limit and will provide a morecomplete “census” of the LIRG population at redshiftz ∼ 2 than possible using MIPS observations alone.
Further, selection by optical colors gives important in-formation on the unobscured component of the star for-mation in galaxies and complements well the informationon the obscured component probed by the 24 µm obser-vations. Objects with lower star formation rates will havebolometric luminosities that are typically dominated bythe observed UV emission and objects with larger starformation rates will have bolometric luminosities thatare dominated by the observed IR emission. The tran-sition between the UV and IR dominated regimes (i.e.,where LIR = L1600) at z ∼ 2 occurs for galaxies withLIR ≈ 1011 L⊙, or about 0.3L∗ (Figure 11). A compar-ison with the z = 0 sample of Bell (2003) shows thatthe bolometric luminosities begin to be dominated by IRemission (i.e., LIR/L1600 > 1) for galaxies which are twoorders of magnitude more luminous at z ∼ 2 than at thepresent epoch. As discussed in § 7, this is plausibly ex-plained as a result of higher dust-to-gas ratios in the localgalaxies. More generally, galaxies of a given dust obscu-ration are anywhere from 2-100 times more luminous atz ∼ 2 than locally (Figure 11), with the greatest dif-ference for galaxies with relatively low LIR/L1600 . 20.The implication of these observations is that while it iscertainly true that a larger fraction of the star forma-tion at high redshifts occurs in dustier galaxies, selec-tion via rest-frame UV colors (and performing followupspectroscopy) is easier at high redshift than locally forgalaxies at a given bolometric luminosity. Optical selec-tion is therefore arguably the most promising and spec-troscopically efficient method for selecting LIRGs (whichundoubtedly account for a significant fraction of the starformation rate density and far-infrared background; e.g.,Adelberger & Steidel 2000) at z ∼ 2.
As demonstrated in § 5.2 and in Reddy et al. (2005),ULIRGs and SMGs at these redshifts also often ap-pear in optical and near-IR selected samples; ∼ 50%of the most luminous SMGs have enough unobscuredstar formation that they satisfy the z ∼ 2 optical crite-ria (Chapman et al. 2005). Accounting for the obscuredportion of star formation in these ultraluminous sourcesof course requires the longer wavelength data since rest-frame UV slopes underpredict their LIR (§ 6). In somesense, 24 µm observations are a more powerful methodof estimating Lbol of these ultra-luminous sources sincetheir detection significance at 24 µm is typically 50−100times larger and the beamsize is a factor of 9 smaller thanat 850 µm. The ability to uniformly cover large areas ofthe sky with MIPS observations provides an additionaladvantage over current submillimeter surveys which suf-fer from areal and depth incompleteness, thus making itdifficult to constrain the volumes probed. Using 24 µmobservations to assess the global energetics of ultralumi-nous sources of course requires that we accurately cali-brate the L5−8.5µm/LIR ratios for these objects.
We have demonstrated that the typical galaxy in op-tical and near-IR samples of z ∼ 2 galaxies has LIR cor-responding to that of LIRGs. A related issue is whethermost LIRGs at z ∼ 2 can be selected by their rest-frameUV or optical colors. A direct comparison of the numbercounts of MIPS sources to the number of 24 µm detectedUnGR and BzK galaxies to 8 µJy (the GOODS-N MIPS24 µm 3 σ sensitivity limit) is not possible since (a) weprimarily relied on the Ks-band data to deblend sourcesin the 24 µm imaging and (b) the redshift distributionof MIPS sources to 8 µJy is not yet well established.Nonetheless, including both optical and near-IR selectedLIRGs at z ∼ 2 ensures that we must be reasonably“complete” for both optically-bright (and 24 µm-faint)LIRGs in the optical sample and optically-faint (and24 µm-bright) LIRGs in the near-IR selected BzK andDRG samples. Galaxies with LIRG luminosities will pre-dominantly have near-IR magnitudes bright enough tobe considered in our analysis (i.e., Ks . 21 according tothe left panel of Figure 8). Objects not selected by thesevarious criteria will likely either fall at different redshifts,not have LIRG luminosities, and/or may be scattered outof the color selection windows due to photometric error(e.g., Reddy et al. 2005). As an example of one form ofphotometric scatter, in the course of the z ∼ 3 LymanBreak Galaxy Survey, we relied on UnGR photometrybased on images of the HDF-North field taken at thePalomar Hale 5 m Telescope (Steidel et al. 2003). Wesubsequently imaged a larger portion of the GOODS-North field using the Keck I Telescope (Steidel et al.2004). Our photometric analysis indicates that of theBX/BM objects to R = 25.5 identified in the Palomarimaging, about 76% were recovered as BX/BM objectsin the Keck imaging. A small fraction of the remain-ing 24% were recovered using LBG selection. The levelof scatter between different photometric realizations inother fields is also typically ∼ 25% and is mostly due tothe narrow photometric windows used to select BX/BMgalaxies. Regardless of these photometric effects, it ishighly unlikely that there exist large numbers of LIRGsat z ∼ 2 with such different optical and near-IR proper-ties that they would be completely absent from all thesamples considered here. Finally, our knowledge of the

20 Reddy et al.
exact positions of optical and near-IR selected galaxiesfrom the higher spatial resolution Ks-band and IRACdata allows us to mitigate the effects of confusion (see§ 3), so we should be reasonably complete for galaxieswhich are detected at 24 µm to 8 µJy but which mightotherwise be confused with brighter sources. It is there-fore reasonable to conclude that the LIRG population atz ∼ 2 is essentially the same population of galaxies thatare selected in optical and near-IR samples.
10.2. Mass Assembly at High Redshift
We demonstrated that LIRGs and ULIRGs are presentover the full range of stellar mass, from ∼ 2× 10⁹ M⊙ to5× 1011 M⊙, for galaxies in the samples considered here(Figure 14). To assess the significance of the current starformation in the buildup of stellar mass, we have com-puted the specific star formation rate, φ, defined as theSFR per unit stellar mass. We show the observed φ forgalaxies in our sample as function of stellar mass in Fig-ure 15. The correlation between φ and M∗ could havebeen predicted from Figure 14 since the range of Lbol issimilar over the range of M∗ considered here. We alsonote that the correlation is accentuated since (a) φ is notindependent of M∗ and (b) there are presumably galaxieswith low φ and low M∗ that would be missing from theoptical and near-IR samples (irrespective of the MIPS de-tection limit). Furthermore, the upper envelope of pointsin Figure 15 is defined by our cut to exclude luminousAGN based on the Chandra X-ray data. Nonetheless, wefind that star-forming galaxies with large stellar massesM∗ & 1011 M⊙ without an AGN signature have specificSFRs that are 1 to 2 orders of magnitude lower thanthose of young galaxies (yellow symbols), implying thatthe current star formation contributes more significantlyto the buildup of stellar mass in low mass galaxies thanhigh mass galaxies at z ∼ 2. This change in specificSFR as a function of mass has been observed at laterepochs as well (e.g., Bell et al. 2005). The shifting of therelationship to lower specific SFRs at later epochs forgalaxies with large stellar masses has been referred to as“downsizing” (Cowie et al. 1996).
The most massive, star-forming DRGs at these red-shifts with large dust-to-gas ratios (see Figure 11) alsohave the lowest φ for MIPS-detected galaxies at z ∼ 2.Papovich et al. (2005) demonstrate that the integratedspecific SFR of these massive DRGs at z ∼ 2 is ∼ 2magnitudes larger than for galaxies with similar masses(M∗ > 1011 M⊙) at lower redshifts 0.3 ≤ z < 0.5, basedon a comparison with the COMBO-17 sample (Bell et al.2005). This decrease in φ suggests that M∗ > 1011 M⊙
galaxies have built up most of their stellar mass by z ∼ 2.In fact, the mass-doubling time becomes increasinglylarge for these massive galaxies if we assume the caseof an exponentially declining star formation model. Inthis case, φ will evolve with time t as
φ(t) =(1 + f) exp(−t/τ)
τ [1 − exp(−t/τ)], (6)
where f is the ratio of the gas mass that is lost due tooutflows to that formed in stars and τ is the star for-mation decay timescale as defined in § 4. Given someinitial SFR, a CSF model (i.e., with τ = ∞) will trackstraight through the points corresponding to galaxies
with M∗ & 1011 M⊙, but such a model would pre-dict a φ at z ∼ 0.4 that is ∼ 5 times larger than ob-served at z ∼ 0.4 in the COMBO-17 survey (Bell et al.2005). Therefore, a declining star-formation history maybe more appropriate for describing the future evolutionof galaxies with large stellar masses at z ∼ 2. In partic-ular, Erb et al. (2006a) find that a model that assumesa super-solar yield of metals (i.e., ratio of mass of metalsejected into the ISM to mass of metals locked in long-lived stars) of y = 1.5 Z⊙ and an outflow rate of 4 × SFR(f = 4) appears to best-fit the observed metallicities ofUnGR galaxies at z ∼ 2 as a function of gas fraction. Ifall star-forming galaxies at z ∼ 2 follow a similar evolu-tionary track as the M∗ > 1011 M⊙ galaxies (i.e., followan exponentially declining star formation history withlarge outflow rate), then the scatter of galaxies with agiven specific SFR simply reflects the range in the finalstellar masses and dark matter halo masses (see also dis-cussion in Erb et al. 2006a).
We can directly relate the specific SFR φ with the coldgas fraction, µ ≡ Mgas/(Mgas + M∗). If we assume thatthe SFR is proportional to the cold gas mass, Mgas, tothe 1.4 power according to the Schmidt law (Kennicutt1998b), then
φ ∝M1.4
gas
M∗. (7)
It then follows that
φ = Cµ1.4
1 − µ, (8)
where C is a constant that depends on the constantof proportionality between the SFR and gas mass sur-face densities in the Schmidt law and the total gas massat virialization (i.e., when star formation commences).There is a one-to-one correspondence between the spe-cific SFR, φ, and gas fraction, µ, such that galaxies withlarge specific SFRs will have a larger fraction of coldgas than galaxies with small specific SFRs. Erb et al.(2006b) demonstrate that µ decreases as a function ofstellar mass for a large sample of UnGR galaxies withHα spectroscopy, with a mean µ across the sample of〈µ〉 ∼ 0.5. The mean specific SFR for these galax-ies is 〈φ〉 ∼ 3 Gyr−1. Using these mean values to es-timate C, we show the range of µ on the right-handaxis of Figure 15. Young galaxies with ages less than100 Myr in our sample also have the largest gas frac-tions (µ ∼ 0.6 − 0.9) and largest specific SFRs (Fig-ure 15) compared with older galaxies at z ∼ 2. These re-sults strongly suggest that the young galaxies have largereservoirs of cold gas and have just begun forming stars.Similarly, galaxies with the largest stellar masses havelower specific SFRs and therefore lower cold gas fractions(µ ∼ 0.1 − 0.3) and are likely to cease star-formationin a relatively short time. The correlation between φand M∗ revealed by Figure 15 is actually expected fromthe trend between µ and M∗ inferred from the Hα spec-troscopic analysis of Erb et al. (2006b). Furthermore,Erb et al. (2006a) find a tight trend between metallic-ity and gas fraction such that galaxies with lower µ aremore metal-rich. These galaxies will therefore be moredust-obscured since metallicity is directly proportionalto dust-to-gas ratio. Our analysis confirms our expecta-tion that the most dust-obscured objects at z ∼ 2 (i.e.,

Star Formation and Extinction in z ∼ 2 Galaxies 21
Fig. 15.— Specific SFR, φ, as a function of stellar mass for galaxies in the samples considered here. Symbols are the same as in Figure 14(yellow symbols indicate galaxies with inferred ages . 100 Myr). The right-hand axis indicates the gas fraction µ associated with galaxiesof a given φ.
the DRGs with the largest dust-to-gas ratios, Figure 11)also have low gas fractions as demonstrated in Figure 15.Figure 15 indicates that the trend in gas fraction versusstellar mass (or, metallicity versus gas fraction) found forUnGR-selected galaxies with Hα spectroscopy (Erb et al.2006a) also applies to galaxies selected by their near-IRcolors.
Combining the optical and near-IR samples, we finda wide range in the evolutionary state of galaxies atz ∼ 2, from those which are just starting to form starsto those which have already accumulated most of theirstellar mass and are about to become passive or alreadyare. Almost all DRGs with the reddest (z − K)AB color((z−K)AB > 3) are undetected at 24 µm and in the deepChandra X-ray data (e.g., see right panel of Figure 8 andFigure 16 in Reddy et al. 2005). The specific SFRs ofthese red DRGs are the lowest observed for the z ∼ 2galaxies considered here; they have cold gas fractions ofless than 5%, confirming that they have essentially shut-off star formation by z ∼ 2. The star-forming DRGswith M∗ > 1011 M⊙ (which are dusty and metal-richas inferred from their large dust-to-gas ratios; cf., Fig-ure 11) are likely to reach this passively-evolving stateby redshifts z . 1.5. A simple model which assumes a
high outflow rate proportional to the SFR and exponen-tially declining star formation history (i.e., the modelwhich appears to best-fit the observed metallicities ofgalaxies as function of gas fraction; Erb et al. 2006a) issufficient to explain the presence of galaxies with largestellar masses and little star formation by z ∼ 2 with-out invoking AGN feedback, despite the fact that a largeAGN fraction of ∼ 25% is observed among galaxies withlarge stellar masses (Reddy et al. 2005).
11. CONCLUSIONS
We use Spitzer MIPS data to examine the bolomet-ric luminosities and extinction properties of optical andnear-IR selected galaxies at redshifts 1.5 . z . 2.6 inthe GOODS-North field. At these redshifts, the mid-IR(5−8.5 µm) features associated with polycyclic aromatichydrocarbon (PAH) emission, which are ubiquitous in lo-cal and z ∼ 1 star-forming galaxies, are shifted into theMIPS 24 µm filter. Extensive multi-wavelength data inthe GOODS-North field, including very deep Chandra X-ray data, allow us to test the validity of inferring the bolo-metric luminosities of high redshift galaxies from theirrest-frame 5 − 8.5 µm emission. Galaxies at z ∼ 2 areselected by their optical (UnGR) and near-IR (BzK andJ−Ks) colors, and for comparison we also consider radio-

22 Reddy et al.
detected submillimeter galaxies (SMGs; Chapman et al.2005). The optically-selected sample is advantageous be-cause we have knowledge of the precise redshifts of & 300galaxies from spectroscopy, allowing for the most accu-rate estimates of the rest-frame mid-IR luminosities ofz ∼ 2 galaxies. In addition to our spectroscopic sample,we use deep optical, near-IR, and Spitzer IRAC data toderive photometric redshifts for BzK galaxies and thosewith red J − Ks > 2.3 colors (Distant Red Galaxies;DRGs). The principle conclusions of this study are asfollows:
1. Using local templates to K -correct the observed24 µm fluxes, we find that the rest-frame 5 − 8.5 µm lu-minosity (L5−8.5µm) of z ∼ 2 galaxies correlates well withtheir stacked X-ray emission. A subset of galaxies withHα measurements have Hα-inferred bolometric luminosi-ties that correlate very well with their L5−8.5µm-inferredbolometric luminosities (with a scatter of 0.2 dex). Theseobservations suggest that L5−8.5µm provides a reliable es-timate of LIR for most star forming galaxies at z ∼ 2.
2. We find that the optical and near-IR selected z ∼ 2galaxies span a very wide range in infrared luminosityfrom LIRG to ULIRG objects. We find a mean infraredluminosity of 〈LIR〉 ∼ 2 × 10¹¹ L⊙ for galaxies in theoptical and near-IR samples, in excellent agreement withthe value obtained from a stacked X-ray analysis. Theoptical and near-IR selected star-forming galaxies likelyaccount for a significant fraction of the LIRG populationat z ∼ 2. Galaxies with Ks < 20 have LIR greater than 2times that of galaxies with Ks > 20.5. Non-AGN galaxieswith the reddest near-IR colors ((z − K)AB > 3) aremostly undetected at 24 µm suggesting they have lowSFRs, a conclusion supported by stacked X-ray analyses.
3. We demonstrate using 24 µm and X-ray stackinganalyses that galaxies undetected to f24µm ∼ 8 µJy arefaint because they have lower SFRs and/or lower ob-scuration than 24 µm detected galaxies, and not be-cause they are deficient in PAH emission at a given LIR.We infer that typically half of the bolometric luminos-ity of these 24 µm-undetected galaxies is emitted in theUV. Comparing the rest-frame UV composite spectra of24 µm-undetected galaxies with those in the top quar-tile of detected objects shows that the latter have low-ionization interstellar absorption lines that are ∼ 2 timesstronger than the former, indicating some combination ofmore turbulent interstellar media and a larger neutral gascovering fraction. This is consistent with our conclusionthat galaxies undetected at 24 µm have lower SFRs than24 µm-detected galaxies, and therefore a lower input ofkinetic energy and dust into their ISM.
4. The 24 µm (and deep X-ray) data indicate thatgalaxies whose current star-formation episodes are olderthan 100 Myr and have infrared luminosities 1010 .LIR . 1012 L⊙ appear to follow the local relation be-tween rest-frame UV slope and dust obscuration, imply-ing that such galaxies at z ∼ 2 have moderate amountsof dust extinction and that their UV slopes can be usedto infer their extinction. Galaxies younger than 100 Myrhave rest-frame UV colors that are redder than expectedgiven their inferred LIR, indicating they may obey asteeper extinction law. These young galaxies have thelowest stellar masses, but span the same range in bolo-metric luminosity as galaxies with larger stellar masses.
5. Galaxies with Lbol & 1012 L⊙, including radio-
detected SMGs, are typically ∼ 10 − 100 times moredust obscured than their UV spectral slopes would indi-cate, assuming their 850 µm-inferred infrared luminosi-ties. The 24 µm-inferred infrared luminosities of radio-detected SMGs are systematically a factor of 2−10 timeslower than those predicted by their 850 µm fluxes; adopt-ing the 24 µm estimates implies dust attenuation factorsthat are ∼ 5 − 50 times larger than their UV spectralslopes would indicate. Regardless, such galaxies will of-ten be blue enough to satisfy the UnGR criteria, so find-ing these dust obscured galaxies in optical surveys is notuncommon.
6. A comparison between the dust obscuration inz ∼ 2 and z = 0 galaxies suggests that galaxies of agiven bolometric luminosity are much less dust obscured(by a factor of ∼ 8 − 10) at high redshift than at thepresent epoch. This result is expected (a) as galaxiesage and go through successive generations of star forma-tion and dust production and (b) if the distribution ofdust and star formation in galaxies becomes more com-pact over time (e.g., through mergers or interactions)resulting in greater dust column densities towards star-forming regions. We find that star-forming Distant RedGalaxies (DRGs) with stellar masses M∗ & 1011 M⊙
and ages & 2 Gyr have bolometric luminosities and dust-obscuration factors similar to those of local ULIRGs, sug-gesting that such DRGs, like local ULIRGs, carry rela-tively large amounts of dust into their current episodesof star formation.
7. Galaxies with the largest stellar masses at z ∼ 2(M∗ & 1011 M⊙) also span a large range in bolomet-ric luminosity, from those which have red near-IR col-ors ((z − K)AB > 3) with little current star forma-tion to those ULIRG objects found among optical andnear-IR selected massive galaxies. Our results suggest& 70% of massive galaxies (M∗ & 1011 M⊙) in opticaland near-IR surveys with redshifts 1.5 < z < 2.6 haveLbol & 3 × 10¹¹ L⊙ (SFRs & 20 M⊙ yr−1), comparableto and exceeding the luminosity of LIRGs.
8. Similar to lower redshift studies, we find a trendbetween specific SFR (SFR per unit stellar mass) andstellar mass at z ∼ 2 which indicates that the observedstar formation contributes more to the buildup of stellarmass in galaxies with low stellar masses than in thosewith larger stellar masses at z ∼ 2. This trend be-tween specific SFR and stellar mass indicates a strongdecrease in cold gas fraction as function of stellar mass,consistent with results from near-IR spectroscopic ob-servations, and suggests that galaxies with large stellarmasses (M∗ > 1011 M⊙) at z ∼ 2 will quickly cease starformation. Combining optical and near-IR selected sam-ples, we find a large range in the evolutionary state ofgalaxies at z ∼ 2, from those which have just begun toform stars and which have large gas fractions to thosewhich are old, massive, and have little remaining coldgas.
We thank Natascha Forster Schreiber and HeleneRoussel for providing their ISO spectra of local galax-ies, and David Elbaz for providing an electronic catalogof the mid-IR and IR luminosities of local star-forminggalaxies. We also thank the referee, Emeric Le Floc’h,for useful comments. The work presented here has been

Star Formation and Extinction in z ∼ 2 Galaxies 23
supported by grant AST 03-07263 from the National Sci-ence Foundation and by the David and Lucile PackardFoundation. We made use of the NASA/IPAC Extra-
galactic Database (NED), which is operated by the JetPropulsion Laboratory, California Institute of Technol-ogy, under contract with NASA.
REFERENCES
Adelberger, K. L. & Steidel, C. C. 2000, ApJ, 544, 218Adelberger, K. L., Steidel, C. C., Shapley, A. E., Hunt, M. P., Erb,
D. K., Reddy, N. A., & Pettini, M. 2004, ApJ, 607, 226Adelberger, K. L., Steidel, C. C., Shapley, A. E., & Pettini, M.
2003, ApJ, 584, 45Alexander, D. M., Bauer, F. E., Chapman, S. C., Smail, I., Blain,
A. W., Brandt, W. N., & Ivison, R. J. 2005, submitted to ApJAlexander, D. M., et al. 2003, AJ, 126, 539Almaini, O., Lawrence, A., & Boyle, B. J. 1999, MNRAS, 305, L59Alonso-Herrero, A., Takagi, T., Baker, A. J., Rieke, G. H., Rieke,
M. J., Imanishi, M., & Scoville, N. Z. 2004, ApJ, 612, 222Armus, L., et al. 2004, ApJS, 154, 178Baker, A. J., Lutz, D., Genzel, R., Tacconi, L. J., & Lehnert, M. D.
2001, A&A, 372, L37Barger, A. J., Cowie, L. L., Sanders, D. B., Fulton, E., Taniguchi,
Y., Sato, Y., Kawara, K., & Okuda, H. 1998, Nature, 394, 248Bell, E. F. 2002, ApJ, 577, 150—. 2003, ApJ, 586, 794Bell, E. F., et al. 2005, ApJ, 625, 23Benıtez, N. 2000, ApJ, 536, 571Bolzonella, M., Miralles, J.-M., & Pello, R. 2000, A&A, 363, 476Boselli, A., et al. 1998, A&A, 335, 53Brandt, W. N., Hornschemeier, A. E., Schneider, D. P., Alexander,
D. M., Bauer, F. E., Garmire, G. P., & Vignali, C. 2001, ApJ,558, L5
Bruzual, G. & Charlot, S. 2003, MNRAS, 344, 1000Burgarella, D., Perez-Gonzalez, P., Buat, V., Takeuchi, T. T.,
Lauger, S., Rieke, G., & Ilbert, O. 2005, ArXiv Astrophysicse-prints
Calzetti, D., Armus, L., Bohlin, R. C., Kinney, . A. L., Koornneef,J., & Storchi-Bergmann, T. 2000, ApJ, 533, 682
Calzetti, D. & Heckman, T. M. 1999, ApJ, 519, 27Chapman, S. C., Blain, A. W., Smail, I., & Ivison, R. J. 2005, ApJ,
622, 772Charmandaris, V., Mirabel, I. F., Tran, D., Laurent, O., Cesarsky,
C. J., Gallais, P., Sauvage, M., & Vigroux, L. 1997, inExtragalactic Astronomy in the Infrared, 283–+
Cimatti, A., et al. 2002a, A&A, 392, 395Cimatti, A., et al. 2002b, A&A, 391, L1Condon, J. J., Anderson, M. L., & Helou, G. 1991, ApJ, 376, 95Cowie, L. L., Songaila, A., Hu, E. M., & Cohen, J. G. 1996, AJ,
112, 839Daddi, E., Cimatti, A., Renzini, A., Fontana, A., Mignoli, M.,
Pozzetti, L., Tozzi, P., & Zamorani, G. 2004, ApJ, 617, 746Daddi, E., et al. 2005, astro-ph/0507504Dale, D. A., Helou, G., Contursi, A., Silbermann, N. A., &
Kolhatkar, S. 2001, ApJ, 549, 215Dale, D. A., et al. 2000, AJ, 120, 583Desert, F.-X., Boulanger, F., & Puget, J. L. 1990, A&A, 237, 215Di Matteo, T., Croft, R. A. C., Springel, V., & Hernquist, L. 2003,
ApJ, 593, 56Dickinson, M., Papovich, C., Ferguson, H. C., & Budavari, T. 2003,
ApJ, 587, 25Elbaz, D., Cesarsky, C. J., Chanial, P., Aussel, H., Franceschini,
A., Fadda, D., & Chary, R. R. 2002, A&A, 384, 848Engelbracht, C. W., Gordon, K. D., Rieke, G. H., Werner, M. W.,
Dale, D. A., & Latter, W. B. 2005, ApJ, 628, L29Erb, D. K., Shapley, A. E., Pettini, M., Steidel, C. C., Reddy,
N. A., & Adelberger, K. L. 2006a, astro-ph/0602473—. 2006b, submitted to ApJ—. 2006c, submitted to ApJForster Schreiber, N. M., Roussel, H., Sauvage, M., &
Charmandaris, V. 2004a, A&A, 419, 501Forster Schreiber, N. M., Sauvage, M., Charmandaris, V., Laurent,
O., Gallais, P., Mirabel, I. F., & Vigroux, L. 2003, A&A, 399,833
Forster Schreiber, et al. 2004b, ApJ, 616, 40Fabian, A. C. & Iwasawa, K. 1999, MNRAS, 303, L34Fadda, D., Flores, H., Hasinger, G., Franceschini, A., Altieri, B.,
Cesarsky, C. J., Elbaz, D., & Ferrando, P. 2002, A&A, 383, 838Fadda, D., et. al. 2006, submitted to AJFan, X., et al. 2001, AJ, 121, 54
Flores, H., et al. 1999, ApJ, 517, 148Franx, M., et al. 2003, ApJ, 587, L79Genzel, R. & Cesarsky, C. J. 2000, ARA&A, 38, 761Giavalisco, M., et al. 2004, ApJ, 600, L93Giavalisco, M., Koratkar, A., & Calzetti, D. 1996, ApJ, 466, 831Goldader, J. D., Meurer, G., Heckman, T. M., Seibert, M., Sanders,
D. B., Calzetti, D., & Steidel, C. C. 2002, ApJ, 568, 651Haas, M., Klaas, U., Muller, S. A. H., Chini, R., & Coulson, I.
2001, A&A, 367, L9Hansen, M. & Peng Oh, S. 2005, astro-ph/0507586Helou, G., Khan, I. R., Malek, L., & Boehmer, L. 1988, ApJS, 68,
151Helou, G., Lu, N. Y., Werner, M. W., Malhotra, S., & Silbermann,
N. 2000, ApJ, 532, L21Helou, G., Malhotra, S., Hollenbach, D. J., Dale, D. A., & Contursi,
A. 2001, ApJ, 548, L73Hogg, D. W., Tremonti, C. A., Blanton, M. R., Finkbeiner, D. P.,
Padmanabhan, N., Quintero, A. D., Schlegel, D. J., & Wherry,N. 2005, ApJ, 624, 162
Houck, J. R., et al. 2005, ApJ, 622, L105Hughes, D. H., et al. 1998, Nature, 394, 241Kennicutt, R. C. 1998a, ARA&A, 36, 189—. 1998b, ApJ, 498, 541Kong, X., Charlot, S., Brinchmann, J., & Fall, S. M. 2004, MNRAS,
349, 769Laird, E., Nandra, K., Adelberger, K. L., Steidel, C. C., & Reddy,
N. A. 2005, astro-ph/0501411Lehmer, B. D., et al. 2005, AJ, 129, 1Lilly, S. J., Le Fevre, O., Hammer, F., & Crampton, D. 1996, ApJ,
460, L1+Madau, P., Ferguson, H. C., Dickinson, M. E., Giavalisco, M.,
Steidel, C. C., & Fruchter, A. 1996, MNRAS, 283, 1388Makovoz, D. & Marleau, F. R. 2005, astro-ph/0507007Meurer, G. R., Heckman, T. M., & Calzetti, D. 1999, ApJ, 521, 64Nandra, K., Mushotzky, R. F., Arnaud, K., Steidel, C. C.,
Adelberger, K. L., Gardner, J. P., Teplitz, H. I., & Windhorst,R. A. 2002, ApJ, 576, 625
Normand, P., Rouan, D., Lacombe, F., & Tiphene, D. 1995, A&A,297, 311
Papovich, C., Dickinson, M., & Ferguson, H. C. 2001, ApJ, 559,620
Papovich, C., et al. 2005, astro-ph/0511289Persic, M., Rephaeli, Y., Braito, V., Cappi, M., Della Ceca, R.,
Franceschini, A., & Gruber, D. E. 2004, A&A, 419, 849Pozzi, F., et al. 2004, ApJ, 609, 122Puget, J. L. & Leger, A. 1989, ARA&A, 27, 161Ranalli, P., Comastri, A., & Setti, G. 2003, A&A, 399, 39Reddy, N. A., Adelberger, K. L., Steidel, C. C., Shapley, A., Pettini,
M., & Erb, D. K. 2006, in preparationReddy, N. A., Erb, D. K., Steidel, C. C., Shapley, A., Adelberger,
K. L., & Pettini, M. 2005, ApJ, 633, 748Reddy, N. A. & Steidel, C. C. 2004, ApJ, 603, L13Rix, S. A., Pettini, M., Leitherer, C., Bresolin, F., Kudritzki, R.-P.,
& Steidel, C. C. 2004, ApJ, 615, 98Roussel, H., Sauvage, M., Vigroux, L., & Bosma, A. 2001, A&A,
372, 427Rowan-Robinson, M., et al. 2004, MNRAS, 351, 1290Rudnick, G., et al. 2003, ApJ, 599, 847Sanders, D. B. & Mirabel, I. F. 1996, ARA&A, 34, 749Shapley, A. E., Steidel, C. C., Erb, D. K., Reddy, N. A.,
Adelberger, K. L., Pettini, M., Barmby, P., & Huang, J. 2005,ApJ, 626, 698
Shaver, P. A., Wall, J. V., Kellermann, K. I., Jackson, C. A., &Hawkins, M. R. S. 1996, Nature, 384, 439
Smail, I., Ivison, R. J., & Blain, A. W. 1997, ApJ, 490, L5+Smail, I., Ivison, R. J., Blain, A. W., & Kneib, J.-P. 2002, MNRAS,
331, 495Soifer, B. T., Sanders, D. B., Madore, B. F., Neugebauer, G.,
Danielson, G. E., Elias, J. H., Lonsdale, C. J., & Rice, W. L.1987, ApJ, 320, 238
Steidel, C. C., Adelberger, K. L., Giavalisco, M., Dickinson, M., &Pettini, M. 1999, ApJ, 519, 1
24 Reddy et al.
Steidel, C. C., Adelberger, K. L., Shapley, A. E., Pettini, M.,Dickinson, M., & Giavalisco, M. 2003, ApJ, 592, 728
Steidel, C. C., Shapley, A. E., Pettini, M., Adelberger, K. L., Erb,D. K., Reddy, N. A., & Hunt, M. P. 2004, ApJ, 604, 534
Sturm, E., Lutz, D., Tran, D., Feuchtgruber, H., Genzel, R., Kunze,D., Moorwood, A. F. M., & Thornley, M. D. 2000, A&A, 358,481
Tielens, A. G. G. M., Hony, S., van Kerckhoven, C., & Peeters, E.1999, in ESA SP-427: The Universe as Seen by ISO, 579–+
van Dokkum, P. G., et al. 2004, ApJ, 611, 703Yan, L., et al. 2005, ApJ, 628, 604Yun, M. S., Reddy, N. A., & Condon, J. J. 2001, ApJ, 554, 803