
ABSTRACT LINEBERRY, CARRIE AMANDA MAE. Using ...
167
ABSTRACT LINEBERRY, CARRIE AMANDA MAE. Using Dynamic Geometry Software to Develop Students’ Conceptual Understanding of Angle. (Under the direction of Dr. Karen Allen Keene). Angle is a complex topic defined in a variety of contexts; some define angle to be as a pair of rays coming from a single point, as a rotation about a single point, or in a curve. Due to the multiple definitions of angle students get confused as to what an angle truly consists of. This study paid close attention to the misconceptions high school geometry students’ hold about the concept of angle and how to help them gain a more conceptual understanding of this essential concept with the use of technology. There are multiple varieties of technologies that can be used to help students learn the concept of angle, or any geometry related concept, the one used in this study was The Geometer’s Sketchpad, which is one version of Dynamic Geometry Software in which students can create a figure and manipulate its shape to discover properties of the shape they created. The study hypothesizes that angle can be learned using interactive software. The students can move the dynamic diagrams around and see what changes with different types of angles. By connecting the following two research areas, student understanding of angle and DGS as a tool for instruction, this study was designed to expand upon the research on incorporating technology into the geometry classroom by concentrating on how the technology is incorporated and if the method has any affect on students’ conceptual understanding. The primary purpose is to discover whether it would be beneficial for students to create their own constructions with DGS given definitions or discover definitions using teacher-constructed diagrams while learning the concept of angle. The results of this
-
Upload
khangminh22 -
Category
Documents
-
view
2 -
download
0
Transcript of ABSTRACT LINEBERRY, CARRIE AMANDA MAE. Using ...

ABSTRACT
LINEBERRY, CARRIE AMANDA MAE. Using Dynamic Geometry Software to Develop Students’ Conceptual Understanding of Angle. (Under the direction of Dr. Karen Allen Keene).
Angle is a complex topic defined in a variety of contexts; some define angle to be as a
pair of rays coming from a single point, as a rotation about a single point, or in a curve. Due
to the multiple definitions of angle students get confused as to what an angle truly consists
of. This study paid close attention to the misconceptions high school geometry students’
hold about the concept of angle and how to help them gain a more conceptual understanding
of this essential concept with the use of technology.
There are multiple varieties of technologies that can be used to help students learn the
concept of angle, or any geometry related concept, the one used in this study was The
Geometer’s Sketchpad, which is one version of Dynamic Geometry Software in which
students can create a figure and manipulate its shape to discover properties of the shape they
created. The study hypothesizes that angle can be learned using interactive software. The
students can move the dynamic diagrams around and see what changes with different types
of angles.
By connecting the following two research areas, student understanding of angle and
DGS as a tool for instruction, this study was designed to expand upon the research on
incorporating technology into the geometry classroom by concentrating on how the
technology is incorporated and if the method has any affect on students’ conceptual
understanding. The primary purpose is to discover whether it would be beneficial for
students to create their own constructions with DGS given definitions or discover definitions
using teacher-constructed diagrams while learning the concept of angle. The results of this

study showed that software was shown to be more beneficial for the students who used
teacher-constructed diagrams to investigate the definitions of important geometric terms.

Using Dynamic Geometry Software to Develop Students’ Conceptual Understanding of Angle
by Carrie Amanda Mae Lineberry
A thesis submitted to the Graduate Faculty of North Carolina State University
in partial fulfillment of the requirements for the degree of
Master of Science
Mathematics Education
Raleigh, North Carolina
2010
APPROVED BY:
_______________________________ ______________________________ Dr. Karen Allen Keene Dr. Karen F. Hollebrands Committee Chair ________________________________ Dr. Molly A. Fenn

ii
DEDICATION
I would like to dedicate this thesis to my mother Terina Reece Lineberry and father
Jeffrey Michael Lineberry who have given me support throughout my entire educational
experience. I would also like to dedicate this thesis to my grandmother and grandfather,
Roger and Carrie Mae Reece who have always given me unconditional love and
encouragement.

iii
BIOGRAPHY
Carrie Amanda Mae Lineberry was born in Yadkin County, North Carolina. She
attended Forbush High School where she graduated with high honors and in the top 5% of
her class in May of 2003. She was then awarded the Prospective Teacher Scholarship, which
is a competitive, merit-based scholarship-loan program. She was then enrolled at
Appalachian State University in August of 2003. She graduated in December of 2006 with a
Bachelor of Science degree in mathematics education with a minor in religion and
philosophy.
Upon gradation, Carrie started teaching mathematics in January of 2007 at Parkland
High School in Winston-Salem, North Carolina, where she taught Geometry, Algebra II, and
Honors Algebra II. After one and a half years at Parkland High School, Carrie decided to
further her education at North Carolina State University. She then moved to Raleigh, North
Carolina and took a job at Millbrook High School. She was also awarded the NC Student
Loan Program for Health, Science and Mathematics. She was enrolled full time into the
graduate school at North Carolina State University in August of 2008 under the direction of
Dr. Karen Allen Keene, while continuing her teaching position at Millbrook High School
where she taught Geometry and Seminar.
Upon completion of her Master of Science degree in mathematics Education, Carrie
will continue her education at North Carolina State University in the doctoral program in the
Department of Mathematics, Science and Technology Education in which she was admitted
on May 2, 2010. Carrie was awarded a Department Teaching Assistantship and a University

iv
Graduate Fellowship for the academic year of 2010-2011, which allows her to pursue her
Ph.D full time at North Carolina State University.

v
ACKNOWLEDGMENTS
First I would like to thank my mother and father, Mike and Terina Lineberry, for all
of their unconditional love and continued support. They have encouraged me during every
step of my journey through high school, college, teaching, a master’s degree, and soon a
doctoral degree. I would also like to thank my fiancé, Dustin Ritter, who has given me his
unconditional love and support throughout this entire process. I would also like to thank my
extended family as well as my fiancé’s parents, Wesley and Bobbie Joe Ritter, and his
brother, Daniel Ritter along with his extended family for all of their continued support and
encouragement. I am fortunate to have the support of two large loving families who have
encouraged me throughout my educational career at North Carolina State University.
I express my gratitude to my committee chair and advisor, Dr. Karen Allen Keene;
none of this would be possible without her continued support and guidance. I would also like
to thank Dr. Karen Hollebrands and Dr. Molly Fenn for serving on my advisory committee. I
express my gratitude to all of my professors at North Carolina State University. Each and
every one of my professors have encouraged me throughout my time at NCSU and
influenced me to pursue a doctoral degree in mathematics education.
Finally, I would also like to thank all of my colleagues, classmates, and friends who I
have worked alongside for the past two years, as well as my colleagues, administration and
friends at Parkland High School. I would also like to thank my best friend Jenna Byrd for
her continued friendship throughout the years.

vi
TABLE OF CONTENTS
LIST OF TABLES…………………………………………………………………………x
LIST OF FIGURES………………………………………………………………………. xii
CHAPTER 1 – Introduction………………………………………………………………..1
Significance and Purpose of the Study…………………………………………….4
Research Questions………………………………………………………………...7
CHAPTER 2 – Literature Review……………………………………………………….…8
Angle Comprehension……………………………………………………………...8
Teaching with Technology…………………………………………………………16
Dynamic Geometry Software ………………………………………………………17
Conclusion………………………………………………………………………….24
CHAPTER 3 – Methods…………………………………………………………………...26
Purpose and Overview of Study……………………………………………………26
Setting ………………………………………………………………………………27
Subjects……………………………………………………………………………..28
Design of the Study………………………………………………………………....31
Data Collection……………………………………………………………………..33
Data Analysis ………………………………………………………………………37
Qualitative…………………………………………………………………..37
Quantitative…………………………………………………………………42
CHAPTER 4 – Results……………………………………………………………………..43

vii
Paired T-Test – Quantitative Data Analysis………………………………………..43
Male vs. Female……………………………………………………………..46
Minority vs. Majority………………………………………………………..49
Sophomores vs. Juniors……………………………………………………..52
Combined Class Pre-Test Analysis – Qualitative Data Analysis.............................55
SCD Class and TCD Class Results………………………………………………...58
Student-constructed (SCD) Individual Results……………………………………59
Student-constructing DGS instructional activity analysis………………….59
Use of DGS with student-constructed diagram (SCD)……………………..61
Use of DGS with student-constructed diagram (SCD) Pre and Post-test
analysis.……………………………………………………………………..63
Teacher-constructed Individual Results…………………………………………...65
Analysis of DGS Teacher-constructed instructional activity worksheet …...66
Segment, line and ray defining……………………………………...63
Angle defining………………………………………………………70
Angle classification…………………………………………………71
Angle-pair relationships defining…………………………………...74
Segment addition postulate descriptions……………………………76
Segment bisector postulate descriptions……………………………78
Angle addition postulate description………………………………..79
Angle bisector postulate descriptions……………………………….81
Use of DGS pre-constructed diagram (TCD) category analysis……………82

viii
Use of DGS pre-constructed diagram (TCD) Pre and Post-test analysis…..84
Clinical Interviews………………………………………………………………….87
Subject 5 – Student-constructing class……………………………...………87
Subject 3 – Student-constructing class…………………………………...…89
Subject 9 – Student-constructing class……………………………...………90
Subject 20 – Teacher-constructing class………………………………...….91
Subject 27 – Teacher-constructing class………………………………...….92
Interview Summary……………………………………………………...…..95
Summary………………………………………………………………………...….95
Student’s Thoughts about the Software and the Instructional Activity………......98
CHAPTER 5 – Discussion & Conclusion…………………………………………………101
First Research Question…………………………………………………………...101
Second Research Question………………………………………………………...105
Limitations…………………………………………………………………………109
Limitations of the materials………………………………………………...110
Limitations of the study…………………………………………………….113
Implications for Teaching…………………………………………………………115
Future Development……………………………………………………………….117
REFERENCES……………………………………………………………………………119
APPENDICES…………………………………………………………………………….124
Appendix A – Informed Consent Form for Research……………………………...125
Appendix B – Informed Consent Form for Video Taped Interview……………….127

ix
Appendix C – Pre-Test…………………………………………………………….129
Appendix D – Student-constructed instructional activity………………………….131
Appendix E – Teacher-constructed instructional activity………………...……….138
Appendix F – Post-Test……………………………………………………………145
Appendix G – Interview protocol………………………………………………….147
Appendix H – Interview figures…………………………………………………...151

x
LIST OF TABLES
Table 1 Mitchelmore and White’s classification concerning angles………………...11
Table 2 The demographics of the subjects who used DGS with student constructed
diagrams………………………………………………………………….….28
Table 3 The demographics of the subjects who used DGS with teacher-constructed
diagrams………………………………………………………………….….29
Table 4 The educational background of the subjects who used DGS with student
constructed diagrams…………………………………………………….….29
Table 5 The educational background of the subjects who used DGS with teacher-
constructed diagrams………………………………………………………..30
Table 6 Design of the study………………………………………………………….31
Table 7 The categories for angle as defined in Euclidian geometry………………...40
Table 8 The categories for angle as defined by a rotation about a single point……..40
Table 9 The t-test statistics for the SCD class……………………………………….44
Table 10 The t-test statistics for the TCD class……………………………………….45
Table 11 The t-test statistics for the SCD class female……………………………….46
Table 12 The t-test statistics for the TCD class female……………………………….47
Table 13 The t-test statistics for the SCD class male…………………………………48
Table 14 The t-test statistics for the TCD class male…………………………………48
Table 15 The t-test statistics for the SCD class non-minority………………………...49
Table 16 The t-test statistics for the SCD class minority……………………………..50

xi
Table 17 The t-test statistics for the TCD class minority……………………………..51
Table 18 The t-test statistics for the SCD class 15 & 16 year old…………………….52
Table 19 The t-test statistics for the TCD class 15 & 16 year old…………………….53
Table 20 The t-test statistics for the SCD class 17 & 18 year old…………………….54
Table 21 The t-test statistics for the TCD class 17 & 18 year old…………………….54
Table 22 Pre-test questions……………………………………………………………56
Table 23 Summary of pre-test responses for both classes…………………………….56
Table 24 Summary of instructional activity responses for student-constructed class...60
Table 25 Student categorization throughout the student-constructed study…………..63
Table 26 The SCD class scores………………………………………………………..64
Table 27 Summary of instructional activity responses for teacher-constructed class....67
Table 28 Categorization throughout the teacher-constructed study……………...……84
Table 29 The teacher-constructed class scores………………………………………...85
Table 30 Percentage of correct descriptions compared between the two instructional
activities……………………………………………………………………...97

xii
LIST OF FIGURES
Figure 1 Coding of Subject 1’s Pre-test………………………………………………41
Figure 2 Segment, Line, and Ray Construction………………………………………68
Figure 3 Angle Construction………………………………………………………….70
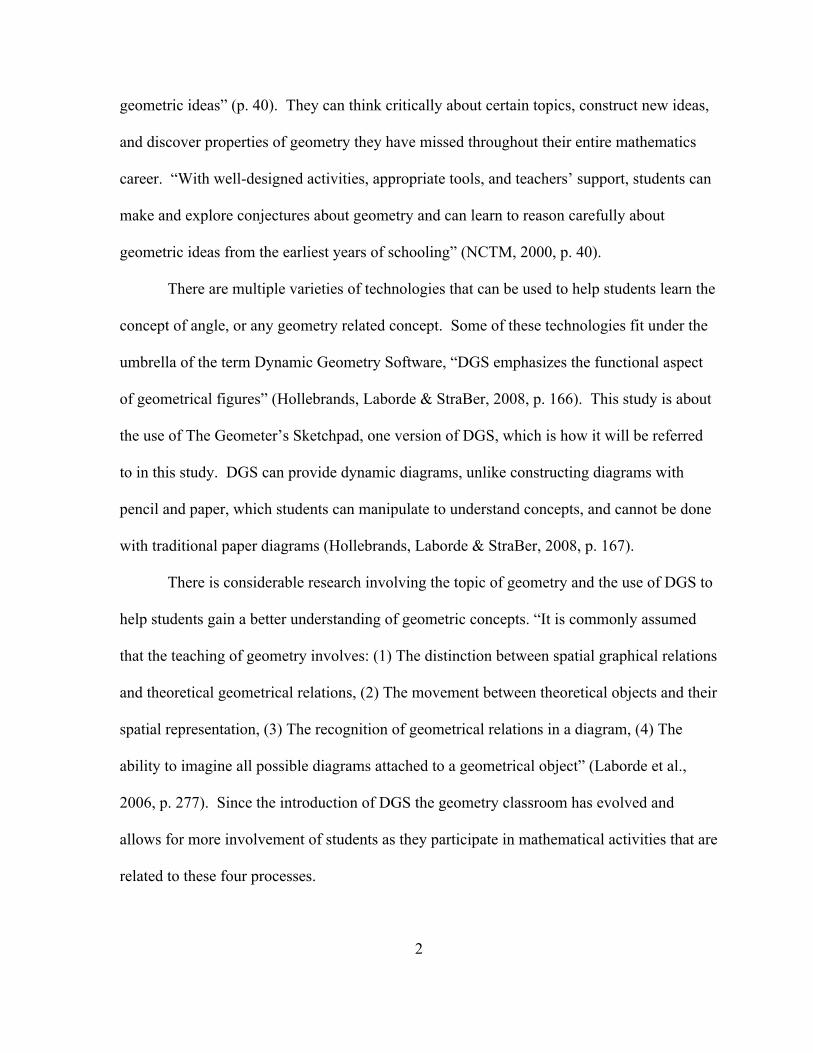
Figure 4 Angle Classification Construction…………………………………………..72
Figure 5 Angle Pair Relationship Construction………………………………………75
Figure 6 Segment Addition Construction…………………………………………….77
Figure 7 Segment Bisector Construction……………………………………………..78
Figure 8 Angle Addition Construction……………………………………………….80
Figure 9 Angle Bisector Construction………………………………………………..81
Figure 10 Interview Curved Shapes……………………………………………………87

1
CHAPTER 1
INTRODUCTION
Envision a class of average geometry students who have learned bits and pieces of
geometry throughout several mathematics courses and enter into their only high school
geometry class with a host of previous knowledge from a variety of somewhat disconnected
instructional experiences. As they discussed the description and properties of angle after
looking at a geometric figure in a dynamic geometry system, a student defined angle as
“basically a bend in a line, so it becomes two rays coming out of a single point.” While two
students analyzed a dynamic diagram of an angle they discussed how the degree of the angle
“either increases or decreases and goes in a 360 degree” rotation. At the same time a student
who is questioning his own beliefs about angle in a curve supposed, “well I count them as no
angles, but I am sure that if you looked at it extremely closely, every curve is like a
minuscule, to a smallest decimal straight line, so that there would be millions in” the curve.
Finally when a student is asked to identify the angles in a quadrilateral you listened to a
student express how a quadrilateral contains only four angles, “unless you count the over
180-degree ones,” which would bring the total to eight angles.
These conversations by students during and after instruction in the researcher’s study
illustrate the National Council of Teachers of Mathematics Principles and Standards (2000)
statement, “Through the study of geometry, students will learn about geometric shapes and
structures and how to analyze their characteristics and relationships … using concrete
models, drawings, and dynamic geometry software, students can engage actively with
2
geometric ideas” (p. 40). They can think critically about certain topics, construct new ideas,
and discover properties of geometry they have missed throughout their entire mathematics
career. “With well-designed activities, appropriate tools, and teachers’ support, students can
make and explore conjectures about geometry and can learn to reason carefully about
geometric ideas from the earliest years of schooling” (NCTM, 2000, p. 40).
There are multiple varieties of technologies that can be used to help students learn the
concept of angle, or any geometry related concept. Some of these technologies fit under the
umbrella of the term Dynamic Geometry Software, “DGS emphasizes the functional aspect
of geometrical figures” (Hollebrands, Laborde & StraBer, 2008, p. 166). This study is about
the use of The Geometer’s Sketchpad, one version of DGS, which is how it will be referred
to in this study. DGS can provide dynamic diagrams, unlike constructing diagrams with
pencil and paper, which students can manipulate to understand concepts, and cannot be done
with traditional paper diagrams (Hollebrands, Laborde & StraBer, 2008, p. 167).
There is considerable research involving the topic of geometry and the use of DGS to
help students gain a better understanding of geometric concepts. “It is commonly assumed
that the teaching of geometry involves: (1) The distinction between spatial graphical relations
and theoretical geometrical relations, (2) The movement between theoretical objects and their
spatial representation, (3) The recognition of geometrical relations in a diagram, (4) The
ability to imagine all possible diagrams attached to a geometrical object” (Laborde et al.,
2006, p. 277). Since the introduction of DGS the geometry classroom has evolved and
allows for more involvement of students as they participate in mathematical activities that are
related to these four processes.

3
There have been numerous studies conducted to discover the benefit of using DGS;
the focus of this study is not to determine if DGS is beneficial in the classroom, but to
determine if the specific style in which is the software is used within the classroom affects
student conceptual understanding. DGS, unlike constructing diagrams with paper and pencil,
can provide dynamic diagrams that students can manipulate to understand concepts
(Hollebrands, Laborde & StraBer, 2008, p. 167). DGS can help students discover more
information by not only constructing the diagrams but being able to drag the points, lines,
segments and other objects around in order to discover new information using previous
knowledge and the properties that were used to construct the diagram. This notion can be
applied to many specific geometric ideas; in this study, angle is the important
conceptualization as angles are quite complex and have multiple characterizations.
Close (1982) studied the assortment of angle definitions used in mathematics along
with many authors who have noted the difference between the definitions as well as between
dynamic (movement) and static (configurational) angles (Close, 1982; Kieran, 1986).
Mitchelmore and White (1998) suggested three different definitions in which the conceptual
understanding of angle can occur, and these will be used throughout the present study. They
proposed that an angle could be a rotation, a pair of half lines that extend from a common
point, or as angle in a curve. Mitchelmore and White (2000a) elaborated on these definitions,
by looking at different types of angles formed by a point and rays and angle as a rotation.
They explained that students as young as grade 2 could understand 2-line angles (e.g.,
corners of a room, road intersection) while understanding 1-line angles (e.g., doors, ramps) is
a more difficult process and normally the students’ have little grasp of this type of angle.

4
They also mention the complexity of angle as a rotation and the fact that students do not
understand this type of angle, also referred to as a 0-line angle (e.g., doorknobs, wheels),
until at least grade 6. Within the present study the researcher focused on the first two
categories, an angle being a rotation about a point or a pair of rays that extend from a
common point. “Defining angle therefore becomes a difficult process because all definitions
put limitations on the concept by focusing more heavily on one facet more than any of the
others” (Keiser, 2004, p. 289).
A variety of studies exist that focus on the “complexity of the concept of angle” and
“that students struggle with that complexity in their own development of the concept”
(Keiser, 2004, p. 286). A study by Mitchelmore & White (1998) concentrated on a more
comprehensive look at the students’ misconceptions and had the students categorize
situations they saw everyday that implicitly concerned angles. Mitchelmore and White
(2000b) believed that it is more difficult for students to understand angle measure and
identify angles when they appear in slopes, turns or any other situation in which one or both
sides are not detectable (Fyhn, 2008, p. 22).
In the next section, the researcher provides details about the significance and purpose
of the study. The last section of the introduction will then introduce the research questions
for the project.
Significance and Purpose of the Study
According to NCTM (2000) learning mathematics for understanding has not been an
outcome of school mathematics instruction (p. 20). This problem surfaced in the 1930’s and

5
has been focus of many studies by educators and psychologists ever since (NCTM, 2000).
More specifically, students need to participate in important instruction in geometry so they
can “analyze characteristics and properties of two-and three-dimensional geometric shapes
and develop mathematical arguments about geometric relationships: analyze properties and
determine attributes of two- and three-dimensional objects; explore relationships (including
congruence and similarity) among classes of two- and three-dimensional geometric objects,
make and test conjectures about them, and solve problems involving them” (NCTM, 2000, p.
308).
Additionally, high school students should be able to develop an extensive range of
representations of geometric ideas in which multiple approaches to geometric problems can
be used (NCTM, 2000, p. 308). DGS may provide students with tools needed for multiple
approaches. “Students can use dynamic software to construct and manipulate their own
diagrams, explore properties of geometric terms using already constructed diagrams and
previous knowledge, construct diagrams in order to gain a deeper understanding of a known
topic in order to conduct proofs and extensions of the known topic and many other
exploratory visual representations of geometric concepts” (Sinclair, 2003, p. 289). Using
DGS “Students should gain experience in using a variety of visual and coordinate
representations to analyze problems and study mathematics” that is an important focus of the
NCTM Principals and Standards (NCTM, 2000, p. 42).
In recent years, more emphasis has been placed on the definition of angle as it
connects to multiple definitions; thus it is no mystery why students can find this concept hard
to comprehend (Keiser, 2004, p. 286). The misunderstanding of angle starts at a young age

6
for students and continues for most until they have completed geometry. This lack of
understanding can be a significant learning issue for students; without this understanding
they can never truly understand geometry or how an angle is represented every day in their
lives. Therefore, this study is paying close attention to the misconceptions high school
geometry students’ hold about the concept of angle and how to help them gain a more
conceptual understanding of this essential concept with the use of technology.
The study hypothesizes that angle can be learned using interactive software. The students
can move the dynamic diagrams around and see what changes with different types of angles.
It provides ways for students to dynamically visualize a topic that may seem unimportant or
lacking life applications from the student’s perspective. They can see why this information is
important, how the properties fit together, have a better understanding of the concept and
take ownership of what they have learned. “When students work hard to solve a difficult
problem or to understand a complex idea, they experience a very special feeling of
accomplishment, which in turn leads to a willingness to continue and extend their
engagement with mathematics” (NCTM, 2000, p. 21). DGS may help students’ conceptual
understanding of geometric concepts and other mathematical topics, but the way in which the
software is incorporated into the curriculum is not always the focus of the research.
By connecting these two research areas, student understanding of angle, and DGS as
a tool for instruction, this study is designed to expand upon the research on incorporating
technology into the geometry classroom by concentrating on how the technology is
incorporated and if the method has any affect on students’ conceptual understanding. The
primary purpose is to discover whether it would be beneficial for students to create their own

7
constructions with DGS or discover new information using teacher-constructed diagrams
while learning the concept of angle. This new research will contribute to the mathematics
education literature as well as provide ideas for using DGS in the classroom.
Research Questions
This study focuses on answering the following research questions:
1. How do students learn the concept of angle supported by the use of dynamic
geometry software and does the use of dynamic geometry software support
diverse subgroups of students differently?
2. How is student learning of angle influenced by the use of student-constructed
diagrams compared to the use of teacher-constructed diagrams using dynamic
geometry software?
In the next few chapters, the researcher will ground the study in the literature, explain the
methods used in the study, and then present the results, which provides answers to these two
questions.

8
CHAPTER 2
LITERATURE REVIEW
The following sections of this chapter are divided into different subsections that were
important to the development of the present study. The first section is called Angle
Comprehension and Misconceptions, which presents research about the complexity of angle,
the multiple definitions of angle and the numerous studies in which the understanding of
angle has been investigated. The second section is Teaching with Technology; this section
discusses the importance of technology in a mathematics classroom and how it has changed
the traditional classroom learning experience. The third section, Dynamic Geometry
Software, explains the value of using DGS as students seek to understand geometry.
Angle Comprehension and Misconceptions
There are several studies that show that students’ conceptual understanding of angle
needs to be investigated due to the level of misunderstanding which students exhibit in the
geometry classroom and beyond (e.g. Mitchelmore & White, 1998; Wilson & Adams, 1992;
Munier & Merle, 2009; Kieran, 1986; Close, 1982; Clements & Burns, 2000). “The angle
concept is exceptional because it arises in so many different contexts. For example, angles
are not only used to describe the shape of the corner of a geometrical figure but they are also
used to specify a direction, an amount of turning or opening, and an inclination or slope”
(Prescott, Mitchelmore & White, 2002, p. 583). In the traditional high school geometry class

9
curriculum the definition of angle used is the definition described by Euclid. According to
The Elements an angle is “the inclination to one another of two lines in a plane which meet
one another and do not lie in a straight line” (Health, 1956, p. 153). Euclid then continued to
define angle introducing what we refer to in this research as the straight angle in which “the
lines containing the angle are straight” this angle is called rectilinear (p. 153). According to
Piaget and Inhelder, “It is the analysis of the angle which marks the transition from
topological relationships to the perception of Euclidean ones. It is not the straight line itself
which the child contrasts with round shapes, but rather the conjunction of straight lines which
go to form an angle” (Health, 1956). “When Euclid specified the rectilinear angles contain
straight lines, he was suggesting that other angles could be composed of lines that are not
straight” instead they are curved (Keiser, 2004, p. 297). This definition of angle is referred to
as angle in a curve in the present study; these curves are arcs from circles. For example of an
angle in a curve one could imagine a “horn-like” angle where the angle was “formed by a
line tangent to a circle and the circle itself … or an angle could also be formed by two circles
tangent to each other” (Proclus, 1970, p. 102). In this study, students do not address this
definition.
In elementary school, when students are introduced to the concept of angle, they are
given a pictorial representation of an angle and taught how to classify it by measurements
without really understanding the concept but instead memorizing a picture and a definition
(Keiser, 2004). Keiser continues to explain that teachers consider the concept of angle to be
a difficult concept to teach even at a preliminary level of understanding. There are many
studies that only define angle as having two rays with a common point (Balacheff, 1988).

10
With this understanding students sometimes misconceive how to measure the actual size of
an angle (Mitchelmore & White, 1998; Wilson & Adams, 1992). Students do not understand
the concept that the size of an angle has no dependency on the length of its rays (Munier &
Merle, 2009, p. 1865).
Munier and Merle (2009) reported that a study conducted by Berthelot and Salin
found that “three-quarters of all pupils cannot make sense out of the concept of angle unless
it is presented in its primitive, schoolbook form, and that children have trouble recognizing
an angle” (p. 1865). Close (1982) discussed the difficulty that students have the
understanding that two rays with the same endpoint actually compose two angles. According
to Close (1982) students have a hard time understanding that these two angles add up to 360˚.
Looking for ways to organize students understanding of angle, Mitchelmore & White
(1998) conducted a study with a more comprehensive look at the students’ misconceptions
and had the students categorize situations they saw everyday that implicitly concerned
angles. The students’ categorized angle in seven classes with 14 subclasses as seen in Table
1.
Each of the three definitions of angle described in the introduction: angle as a
rotation, a pair of rays that extend from a common point, and in a curve, were found within
the Mitchelmore & White categories. These categories influenced the categories created by
the researcher in this study; yet due to the different instruments used to instruct the students
the researcher had to develop her own set of categories following the example set by
Mitchelmore & White. Within the Mitchelmore & White categories classes 2, 3, and 6 refer
to the Euclidean definition of angle being two rays with a common vertex. Classes 1 and 5

11
Table 1
Mitchelmore and White’s classification concerning angles.
Mitchelmore and White’s classifications
1. Real or imaginary rotation around a fixed axis (point)
a. Unlimited: rotation of the body (doll)
b. Limited: door knob or television dial
2. Meeting: an object comprised of two different linear elements
a. Incident: pocketknife blade, hands on a clock
b. Crossed: pair of scissors
3. Inclination: deviation from the horizontal or vertical
a. Line: posts on a mountain side
b. Plane: slope of a roof
4. Corner: part of a rigid object forming an angle with two visible sides
a. Two planes: that form an angle in space, such as walls and the ground
b. Two edges: that form a plane angle, such as the corner of a table or tile
5. Turning: in a series of two or more linear segments
a. Objects: turn in the road
b. Paths: of the LOGO tortoise, rebound of a ball
6. Direction: deviation of a line from an imaginary fixed line
a. Object: needle of a compass
b. Path: movement of a ball, a person, a boat
7. Opening: an area of space delineated by two rays originating at the same point
a. Solid: a fan
b. Fluid: light beam radiating from a lamp

12
definitions can be introduced to students as early as elementary school. In order to better
prepare students for future mathematics courses teachers should use a more comprehensive
approach, presenting angle using the variety of definitions given throughout history (Keiser,
2004).
Teaching a diverse array of definitions may cause confusion about what is actually
being measured when referring to an angle and therefore angle should be taught in great
depth with concern for conceptual understanding as to reduce any misconceptions the
students may gain with this multifaceted approach (Keiser, 2004). Keiser (2009) and Fyhn
(2008) both reported that students struggled with measuring angle size; there need to be
multiple ways of instruction to this complex concept in order for students to gain a deep
understanding they so badly need in order to continue successfully in their mathematical
journey. Along with the multifaceted approach allowing students to define angle themselves,
share their ideas and debate their definitions during a classroom discussion lead by the
teacher will improve their understanding of the concept (Keiser, 2004). Using multiple
approaches and discussion to combine all the students’ definitions will help them gain a
deeper understanding of the concept.
A study done by Keiser (2004) highlights the “complexity of the concept of angle”
for sixth grade students and argues “that students struggle with that complexity in their own
development of the concept” (Keiser, 2004, p. 286). Keiser’s study examines sixth-grade
students and how their conceptual understanding of angle compares to the various precedent
definitions of angle mentioned in the introduction (Keiser, 2004, p. 286). Keiser designed
geometric investigations in order to provide a profound understanding of angle concepts and

13
how the students’ conceptions were similar to previous definitions; “while analyzing the data
I observed similarities between students’ descriptions of angle and definitions or descriptions
that had been recorded since the time of Euclid” (Keiser, 2004, p. 286). Keiser (2004) also
mentions another important aspect of how to present angle, which the present study used to
promote conversation. Keiser (2004) discusses how allowing students to work together,
share each other’s ideas and challenge those ideas about angle will consequently help the
students develop a deeper understanding for the concept that can be applied to many
situations (p. 304-305).
Supporting this type of collaborative work helped the students gain a wide range of
understandings, not only for angle, but other geometric ideas as well (p. 288). Without this
wide range of understanding students digress to their traditional method of learning
mathematics, which is to memorize facts or procedures without any understanding
(Bransford, Brown, and Cocking, 1999, p. 152). A variety of definitions, discussion,
multiple approaches and representations can lead students to step away from memorization
and jump into understanding. This important use of communication, collaboration and
understanding is incorporated in this study while the students work on their DGS
instructional activities in pairs and at the end of the instructional activity where they
summarize the information they discovered using the DGS.
The present study looks at the multiple definitions of angle, used DGS to help
promote student conceptual understanding in order to minimize the presence of the multitude
of angle misconceptions. Clements and Battista (1989) and Kieran (1986) discuss the fact
that students often have many misconceptions about angle and experience difficulty learning

14
the complex topic. Fyhn (2008), conducted a study in which students were to distinguish
between larger and smaller angles among a group of angles (p. 24). Fyhn (2008) reported, “a
widespread misconception is that a small angle has short sides and a large angle has long
sides,” (p. 25). Only 30% of students could answer correctly on which angle was larger (p.
20). Of the 70% that didn’t answer the question correctly, they choose an angle with longer
rays yet smaller measure between the rays to be the larger angle, which is a misunderstanding
in the Keiser study as well as the study conducted by Munier and Merle (p. 20).
Clements and Burns (2000) also mention a different misconception held by students
about the turn of an angle and how they find it difficult to measure turn. The definition of
angle as a rotation introduces the concept of directionality (Clements and Burns, 2000). In
order to master this concept Clements and Burns (2000) use a piece of DGS called LOGO.
“LOGO activities can be beneficial to students’ development of turn concepts and turn
measurement” (Clements and Burns, 2000, p. 31). LOGO provides a situation of visualizing
the turn of an angle (Clements and Burns, 2000). Clements and Burns (2000) studied a group
of “above-average” fourth grade students to participate in “pull out” enhancement meetings.
“These above-average mathematics students did not show initial difficulties with turn
commands previously reported in mixed populations” (Clements and Burns, 2000, p. 31).
Although some students struggled with turn measure as most students in mixed
populations, they also discovered that students also struggle with distance of angle as well
(Clements and Burns, 2000). With the use of LOGO the students in this study showed less
difficulty with the measure of turn or the direction of turn (Clements and Burns, 2000).
Another important fact came about in this study, which was not seen in their earlier work,

15
“that students did not pay much attention to left and right directionality. They appeared to
understand the idea, but used strategies to circumvent thinking about directionality”
(Clements and Burns, 2000, p.40). With the use of LOGO students can build active and
flexible conceptual protractors unlike the traditional protractors used in everyday classrooms
(Clements and Burns, 2000).
The previous studies report the problems students have with understanding the
measure of an angle when everything is visible; therefore, when both sides are not visible it
is no surprise that students would struggle even more with angle in this context (Fyhn, 2008).
Mitchelmore and White (2000b) believed that it is more difficult for students to understand
angle measure and identify angles when they appear as slopes, turns or any other situation in
which one or both sides are not detectable. Wilson and Adams (1992) expanded upon this
supposition; they felt it would be an easier concept for students to understand when they
reach higher-level mathematics if angle were introduced to them in the elementary school
setting in more depth than is currently in the elementary school curriculum.
Mitchelmore (1997) disagreed with Wilson and Adams. He posited that an angle in a
curve is too complex for students to understand. He explained that a more viable
instructional sequence would start by looking for similarities between physical angle contexts
that more clearly involve two lines, including crossing, corners, and bent objects
(Mitchelmore, 1997; Munier & Merle, 2009). Keiser mixed these two conflicting ideas
together; he suggested that it would be best to introduce angle in a curve “with students who
are still forming their concept image for angle” (Keiser, 2004, p. 300). Introducing both

16
topics at the same time would be beneficial for students and improve their mathematics
experience beyond the introduction of angle (Keiser, 2004).
Teaching with Technology
“In the mathematics classrooms envisioned in NCTM’s Principles and Standards,
every student has access to technology to facilitate his or her mathematics learning under
guidance of a skillful teacher” (NCTM, 2000, p. 25). This would be ideal yet is often
unsupported by individual schools due to constraints and other outside influences.
Technology should not be used as a replacement for basic understandings and
intuitions; rather, it can and should be used to foster those understandings and
intuitions…. Electronic technologies, calculators and computers, are essential
tools for teaching, learning, and doing mathematics. They furnish visual images of
mathematical ideas, they facilitate organizing and analyzing data, and they compute
efficiently and accurately. They can support investigation by students in every area
of mathematics, including geometry, statistics, algebra, measurement, and number.
(NCTM, 2000, p. 24)
Technology is expensive and takes more work for the teacher to learn and use the
technology. Students can not only create diagrams and gain a deeper understanding through
investigation but they often show different ways of thinking about mathematics with the use
of technology not detected in normal classroom instruction (NCTM, 2000, p. 25).

17
With technology, students can create diagrams or figures to help them understand a
concept and dig deeper than they previously have in their mathematics education. There are
assortments of technologies that can be used to help students learn the concept of angle, or
any geometry related concept. The DGS used for analyzing and drawing perspective views
in this study “is an interactive geometry software package used to help students learn
geometry principles” (Groman, 1996). “Tools such as dynamic geometry software enable
students to model, and have an interactive experience with, a large variety of two-
dimensional shapes,” such as the terms used in the instructional activity of this study
(NCTM, 2000, p. 40). The use of technology may be used to help students understand the
concepts of angle by being able to manipulate the angle and see what does and does not
change. Groman (1996) reports on a study with secondary math teachers using the same
DGS used in this study to learn geometry themselves. The professor and the class of
teachers’ “reaction to the use of DGS in their geometry course was overwhelmingly positive”
(Groman, 1996).
Dynamic Geometry Software
Students should be involved in their educational experience; they can gain a much
deeper understanding of the concepts they are covering by doing the mathematics instead of
simply watching teachers deliver the information to them. One good way to get students
involved in their education and “doing” mathematics is with the use of technology.
“Students’ engagement with, and ownership of, abstract mathematical ideas can be fostered

18
through technology. Technology enriches the range and quality of investigations by
providing a means of viewing mathematical ideas from multiple perspectives” (NCTM,
2000, p.25). Geometry software can provide dynamic diagrams that students can manipulate
to understand concepts, which can’t be done with traditional paper diagrams (Hollebrands,
Laborde & StraBer, 2008).
When an element of such a diagram is dragged with the mouse, the diagram is
modified while all the geometric relations used in its construction are preserved.
These artificial realities can be compared to entities of the real world. It is as if
diagrams react to the manipulations of the user by following the laws of geometry,
just like material objects react by following the laws of physics. A crucial feature of
these realities is their quasi-independence from the user once they have been created.
When the user drags one element of the diagram, it is modified according to the
geometry of its constructions rather than according to the wishes of the user
(Hollebrands, Laborde & StraBer, 2008, p. 167).
Unlike constructing diagrams with pencil and paper, DGS can help students not only
construct the diagrams but by being able to drag the points, lines, segments they can discover
new information using previous knowledge (Skemp, 1976). Using previous knowledge with
well-connected, conceptually grounded ideas provide a greater opportunity for students to
gain a deeper understanding of the concept (Skemp, 1976).
DGS and other software can also be a means of exploration without student
construction. This would involve the dragging of objects to explore concepts from pre-
constructed diagrams. A pre-constructed sketch is one that someone who knows the topic

19
very well constructs and leads the learner through an investigation to explore the topic they
constructed (Sinclair, 2003, p. 289). “Since the creator of an image knows details that are
hidden from an ordinary viewer, interpreting a pre-constructed sketch is similar to
interpreting a picture that someone else has drawn” (Sinclair, 2003, p. 290). The pre-
constructed diagrams are dependent upon the creator, “Thus, designing pre-constructed
dynamic geometry sketches to support the development of mathematical understanding,
involves understanding visual reasoning and its relationship to dynamic exploration” as well
as a complete understanding of the program being used (Sinclair, 2003, p. 290). One area to
consider when looking specifically at DGS is the idea of the geometric concept “point”.
There are three different ways to consider point, which students can use to discover
information (Hollebrands, Laborde & StraBer, 2008, p. 165). Hollebrands, Laborde and
StraBer described the difference between a free point, a point on an object, and a constructed
point. A free point is one “which can be directly dragged anywhere in the plane,” a point on
an object is one in which the dragging of the point is limited to the object on which it is
drawn, and a constructed point “moves only if an element on which it is dependent is
dragged” (Hollebrands, Laborde & StraBer, 2008, p. 165). DGS uses a sequence of
operations to construct a diagram, thus the elements in the diagram are dependent upon one
another (Hollebrands, Laborde & StraBer, 2008). “The notion of dependency is the
interpretation in a DGS of the notion of geometrical relationship. Geometrical objects that
are linked by geometrical relationships can be viewed as dependent” (Hollebrands, Laborde
& StraBer, 2008, p. 169).

20
With the flexibility of the three different types of points that can help students’
comprehension of certain aspects of a diagram, there are also three different types of
dragging modalities (Hollebrands, Laborde & StraBer, 2008, p. 179). They present these
three types of dragging:
wandering dragging, “lieu muet” dragging, and dragging to test hypotheses.
Wandering dragging refers to a random type of dragging in which the student
searches for regularities or interesting behaviors. Lieu muet dragging refers to
dragging in such a way that some regularity in the drawing is preserved. Dragging to
test hypotheses obviously presupposes that regularities have already been detected
which are now systematically tested (Hollebrands, Laborde & StraBer, 2008, p. 179).
No matter which type of dragging the student uses, when the user drags one element of a
diagram, it is modified according to how the shape was constructed and the properties of the
shape, instead of the thoughts and wishes of the user (Strässer, 2002). This is not the case
with the traditional paper and pencil diagrams in which students can distort in order to prove
something that they think might be true, instead of the actual facts of the geometric
construction (Strässer, 2002).
Students may learn properties of the geometric representations with DGS, since the
properties hold according to the constructions, and there could be fewer misconceptions due
to the manipulation of the diagrams. There are numerous studies that have been conducted
about the use of DGS in geometry classrooms. Angle and other introductory terms in
geometry are good concepts to cover with DGS because it is hard for a teacher to show all the
relationships to students without the use of interactive software to move the diagrams around.

21
They would have to make multiple drawings to help show each property for each introductory
term. Students can construct the terms and move them around to see all the different
properties, unique to each term, at their own pace and with their own adaptation of angle
without making multiple drawings.
Mitchelemore and White (2000b) advocate a teaching method called ‘teaching by
abstraction’, wherein ‘students become familiar with several examples of the concept before
teaching the concept itself.” This kind of teaching works well with dynamic diagrams if it
involves some exploration of the concept (familiarity). Then ‘the concept is taught by
finding and making explicit the similarities underlying familiar examples of that concept’
(similarity). Lastly, ‘as students explore the concept in more detail, it becomes increasingly
mental object in its own right’ (reification). (Munier & Merle, 2009, p. 1861). These authors
thus argue for having students do activities in which they model the world of the senses and
jointly acquire spatial and geometric knowledge. These two approaches which work well
using DGS contrast to traditional methods where ‘abstract concepts and procedures are
taught before concrete examples and applications’ (called the ABC method by Mitchelmore
and White (2000b)). It connects to the NCTM standards, which also recommend
interrelating geometric and spatial knowledge: Geometric ideas are useful in representing and
solving problems in other areas of mathematics and in real-world situations … Spatial
reasoning is helpful in using maps, planning routes, designing floor plans, and creating art.
(NCTM, 2000, p. 41).
A study conducted by Erez & Yerushalmy (2006) concluded that it is beneficial and
“important to the study of learning basic concepts in geometry with the aid of the dragging

22
tool” seen in a variety of DGS (p. 293). “Dragging allows changing a shape by direct
translation of parts of its components on the screen… dragging the shape preserves the
geometric relations according to which is was initially defined. Thus the critical attributes
associated to this definition are preserved during dragging but the non-critical attributes are
changed” (Erez & Yerushalmy, 2006, p. 274). The results of the study conducted and
described in this report support using DGS to help students explore and define basic
geometric terms as shown in the instructional activity of the investigation.
Another study by Frank Monaghan (2000) brought about similar results as the study
by Erez & Yerushalmy (2006). “In this study, the cognitive conflict is brought about by
asking students to describe in their own words the differences between pairs of
quadrilaterals” (Monaghan, 2000, p. 180). Monaghan’s (2000) underlying assumption is that
students will gain a deeper understanding through conversation and hopefully reveal insights
about quadrilaterals with the use of software and class activities creating an environment in
which students can learn and share their discoveries (p. 180). After the study, “what emerges
is that students over-rely on standard representations of shapes as a means of identifying and
discriminating between them. It was shown that curriculum materials tend to underpin such
perceptions” (p. 192). The study concluded that these misconceptions about quadrilaterals
would be reduced using software to aid the instructional activity, allowing students to explore
their ideas about quadrilaterals.
Monoghan’s research supports her beliefs that the use of software can help the
students' understanding of the concept “more easily than otherwise possible. For example,

23
the information underpinning the analysis of the ratio of sides in rectangles was generated in
a matter of seconds” (2000, p. 193) with the use of software, which was never generated with
student discussion without the use of technology. Being able to save time in a classroom is
beneficial; it can create time for a deep discussion or extension of the topic. Monaghan’s
study supports the use of DGS in the investigation in order to gain an understanding of
mathematical concepts and the pairing of students because working in groups will allow
discussions that will deepen the understanding of the concept being covered in the
investigation.
MacGregor and Thomas conducted a study in 2002 involving the value of DGS in the
classroom. The study consisted of a control group with a lecture based learning environment
and the other group of students explored the material through an investigation with DGS.
Although the study concluded that “the instructional model where the teacher provided
structure and directed the problem solving activities of the students resulted in learner
outcomes characterized by greater understanding of the concepts and less frustration” using
the software it still supported the use of DGS due to the progress shown without frustration.
Although the students were frustrated with the investigation, which the study reported might
be due to the fact that the teacher and the students were uncomfortable with the software,
they “expressed a sense of self-confidence and pleasure with their accomplishments” and
learned a great deal of material with the software through discussion and exploration
(MacGregor & Thomas, 2002).
The investigation in this study was designed to be open-ended and use cooperative

24
learning similar to the investigation created by Keiser (2004), thus “permitting students to
share and challenge each other’s ideas which helps students develop a more complete
concept image - one that can be applied to many different situations” (p. 304-305) and would
seem to be more comprehensive and a better preparation for higher level mathematics. The
researcher chose to use DGS in the present study to promote student understanding because
students will be able to drag around objects in order to gain a better understanding of the
terms as validated in the previous studies.
Conclusion
The importance of technology in the mathematics classroom has been investigated
through a variety of venues about a variety of topics throughout mathematics education
research. This study is designed to use this research and expand upon it while investigating
the importance of angle comprehension in the geometry classroom. Concerns about angle
comprehension were discussed through different studies and the mathematics curriculum;
angle needs to be researched further to comprehend the level of misunderstanding which
students hold when it comes to understanding the use of angle. The introduction of Dynamic
Geometry Software (DGS) into the geometry classroom has evolved and can now involve
students in a more active learning environment. This study is not looking to see if the
software is important, this has already been established. Instead, it is designed to expand
upon the importance of technology by researching the use of technology. The question to

25
answer is not if the software is important but how the use of the software is important and
beneficial for students’ conceptual understanding of angle.

26
CHAPTER 3
METHODOLOGY
Purpose and Overview of Study
This study was situated in two different Geometry classes in a large urban high
school. The goal of the study was to answer the research questions:
1. How do students learn the concept of angle supported by the use of dynamic
geometry software and does the use of dynamic geometry software support
diverse subgroups of students differently?
2. How is student learning of angle influenced by the use of student-constructed
diagrams compared to the use of teacher-constructed diagrams using dynamic
geometry software?
These questions frame the overarching idea of researching whether using teacher-constructed
sketches, called pre-constructed sketches by Sinclair (Sinclair, 2003, p. 289) or student-
constructed sketches were more effective when teaching angle. The two classes are referred
to as the student-constructed diagram (SCD) class and the teacher-constructed diagram
(TCD) class. Each class was given the same pre-test, post-test and clinical interview but the
two classes participated in a different set of instructional activities. The students in the SCD
class were given definitions of introductory terms in geometry and asked to construct
pictorial representations based on the definitions. The students in the TCD class were given
teacher-constructed diagrams (figures created by teacher prior to class and already in a DGS

27
document) pictorial representations of the same terms as in the student-constructed
instructional activity and asked to provide the definitions to go along with the pictorial
representations. The following chapter presents the description of the subjects and
investigator involved in the study, the materials used for the study, how the study is designed
including the theoretical framework which emerged, and the procedures used for the analysis
of the data.
Setting
The study took place in two different high school classrooms at the same urban
school located in a large city in the Southeastern United States. The two classes were both
academic geometry classrooms using the same curriculum and with the same teacher, in this
case also the researcher. Academic geometry enrolls a diverse group of students who are
taking regular level, non-honors courses. The study took place in the spring of 2010; it
started at the end of January and was completed by the end of April. Although the study
used technology, the classroom was without computers. For the days in which the students
needed a computer, they went to a lab in the school. During the study the students worked in
pairs to promote dialogue.
The researcher has three years of previous educational teaching experience in two
different schools within two different counties. . She is a professional educator with an A
license for teaching secondary mathematics. She had previously taught Academic Geometry,
Honors Geometry, Academic Algebra II, and Honors Algebra II. She has taught at least two
sections of geometry on a block schedule each semester for the past three years. She has a

28
bachelor’s degree in mathematics education and is pursuing her Master’s Degree in
Mathematics Education.
Subjects
There were 27 students in two different high school academic geometry classrooms in
the spring of 2010. In the SCD class, there were 7 females and 8 males, with more than half
of the students being black or Hispanic. In the TCD class, there were 8 females and 4 males
with the majority of the students being black. The specific demographics of the subjects can
be found in the Table 2 and Table 3.
Table 2
The demographics of the subjects who used DGS with student constructed diagrams.
Subjects Sex Race Age Geometry Grade after the study Subject 1 Female White 17 C Subject 2 Male White 17 B Subject 3 Female Black 15 C Subject 4 Male Black 16 B Subject 5 Male White 15 C Subject 6 Male White 17 D Subject 7 Male Hispanic 16 A Subject 8 Male Black 16 B Subject 9 Male White 16 C Subject 10 Female Black 16 C Subject 11 Male Black 15 C Subject 12 Female Hispanic 15 A Subject 13 Female Black 16 F Subject 14 Female Black 16 B Subject 15 Female Black 17 D

29
Table 3
The demographics of the subjects who used DGS with teacher-constructed diagrams.
Subjects Sex Race Age Geometry Grade after the study Subject 16 Female Black 15 C Subject 17 Female Black 17 F Subject 18 Female Asian 17 C Subject 19 Female Black 16 D Subject 20 Female Hispanic 15 B Subject 21 Female Black 16 C Subject 22 Female Black 16 D Subject 23 Female Black 16 A Subject 24 Male Black 16 B Subject 25 Male Black 16 B Subject 26 Male Black 17 D Subject 27 Male White 16 B
Table 4
The educational background of the subjects who used DGS with student constructed
diagrams.
Subjects Introduction to High School Math Semester Algebra I
Year-‐long Algebra I Geometry
Subject 1 ___ ___ C ___ Subject 2 ___ C ___ ___ Subject 3 ___ B ___ ___ Subject 4 B B ___ ___ Subject 5 ___ C ___ ___ Subject 6 C D ___ ___ Subject 7 ___ B ___ ___ Subject 8 ___ C ___ ___ Subject 9 B D ___ F Subject 10 ___ B ___ ___ Subject 11 ___ C ___ ___ Subject 12 ___ B ___ ___ Subject 13 ___ FF, C ___ ___ Subject 14 ___ C ___ ___ Subject 15 ___ F, D ___ ___

30
As far as the educational background, Table 4 and Table 5 illustrate the mathematics courses
the students had completed before taking the academic Geometry courses. The letters
represent the grades they earned in those courses, a grade of FF is given to students who fail
the course due to lack of attendance.
Table 5
The educational background of the subjects who used DGS with teacher-constructed
diagrams.
Subjects Semester Algebra I
Year-long Algebra I
Technical Math I, II Geometry
Honors Geometry
Semester Algebra II
Subject 16 C ___ ___ ___ ___ ___ Subject 17 C ___ ___ ___ ___ ___ Subject 18 C ___ ___ ___ F ___ Subject 19 ___ D D, D ___ ___ ___ Subject 20 C ___ ___ ___ ___ ___ Subject 21 F, D ___ ___ ___ ___ ___ Subject 22 D ___ ___ ___ ___ ___ Subject 23 ___ C ___ F ___ ___ Subject 24 F, C ___ ___ ___ ___ B Subject 25 B ___ ___ ___ F ___ Subject 26 ___ D ___ ___ ___ ___ Subject 27 C ___ ___ ___ ___ ___
All of the subjects had previously taken Algebra 1; four students previously took
Algebra I more than once, four previously took Geometry, and one student previously took
Algebra II. The student’s ages ranged from 15 years of age to 17 years of age. For the SCD
class, only one student had previously taken Geometry and three had previously failed
Algebra I, which requires them to take Algebra I a second time. For the TCD class, two

31
students had previously taken Geometry, one had previously taken Algebra I more than once,
one student had previously taken Algebra II, and one student had previously taken both
Technical Math I and Technical Math II. Each of the subjects was first introduced to DGS in
the current geometry classroom.
Design of the Study
The study consisted of a pre-test for all students, instruction using DGS in two
different formats as described previously, a post-test for all students and a clinical interview
for a portion of the subjects.
Table 6
Design of the study
Activity Time-‐length Pre-‐test for both classes 45 minutes on Day 1 Instructional activity both classes 270 minutes on Day 2, 3, and 4 Post-‐test for both classes 45 minutes on Day 5 which was 4 weeks
after the completion of the instructional activity
5 student clinical interviews 20 minutes each on a different day 8 weeks after the completion of the instructional activity
The researcher administered the same pre-test and post-test to both classes but the
instructional activities differed in each class. The pre-test and post-test can be found in the
appendices: Appendix C, Investigating students’ conceptual understanding of angle using
dynamic geometry software Pre-Test, Appendix D, Investigating students’ conceptual

32
understanding of angle using dynamic geometry software Post-Test. The instructional
activity for the SCD class of students was designed to have the students construct their own
diagrams related to angle using the technical definitions of the important introductory terms
of the course. The instructional activity can be found in the appendices under Appendix E:
Discovering Geometric Diagrams with Dynamic Geometry Software, which shows the terms
defined, including angle, different classifications of angle and angle pair relationships. The
instructional activity for the TCD class can be found in the appendices under Appendix F:
Discovering Geometric Definitions with Dynamic Geometry Software. This instructional
activity was a student-centered investigation in which the students were guided through
already constructed diagrams of the same introductory terms used in the first instructional
activity. In this instructional activity the subjects used teacher-constructed terms and the
dynamic pre-constructed diagrams to lead them to the definitions of the same terms that the
SCD class was given.
In both classes, the students worked as pairs in order to gain a deeper understanding
through discussion and were required to expand upon prior knowledge from previous
mathematics courses. According to Schoenfeld (1988) mathematics is easier to remember,
understand and apply to other situations when new knowledge is connected to existing
knowledge. Keiser (2004) discusses how allowing students to work together, share each
other’s ideas and challenge those ideas about angle will consequently help the students
develop a deeper understanding for the concept and a more complete image that can be
applied to many situations.

33
Allowing this type of collaborative work helped the students gain a wide range of
understandings (Keiser, 2004). Collaborative pairs are shown to be more beneficial than
independent learning or root memorization. “Teaching methods that foster learning
mathematics by memorization and reproduction of procedures can be contrasted with the
more open approaches in reform-orientated mathematics classrooms, where quite different
learning practices such as discussion and collaboration are valued in building a climate of
intellectual challenge” (Goos, 2004, p. 259).
Data Collection
On the first day of the study the subjects were given a brief overview of the study.
This overview introduced the subjects to educational research and the policies used. Their
part in the study was explained to them and they were told they could stop at any time they
choose without consequences. The teacher explained the pre-test, instructional activity and
post-test, without disclosing any information of the research questions or the purpose of the
study. Each subject was given a consent form that was signed by all the parents of the
participants since they are underage, the consent form can be found in Appendix A. The
subjects in the clinical interviews were given an additional consent form, found in Appendix
B, for videoing purposes that were also signed by all of the parents of the consenting
students.
After the students received the introduction and consent form they were given the
pre-test, found in Appendix C. There were nine questions in the pre-test, each question was
designed to analyze the students’ conceptual understandings of angle, how they visualize an

34
angle, and their understanding of other terms related to angle. Although there were nine
questions, only eight of them were used for analysis due to the difference in question eight on
both the pre-test and post-test. After the pre-test the students participated in three days of
instructional activities on angle. Although, each instructional activity used completely
different procedures to help the students develop an understanding of angle, the purpose was
the same. After a very brief introduction of the software, the students had to familiarize
themselves with the software in order to be able to create any of the diagrams or explore the
already constructed diagrams.
The researcher did not give an in-depth introduction of the software considering the
students would be defining and exploring some of the elements of the DGS and the
researcher wanted to prevent the students from gaining any understanding of the terms from
the researcher before the investigation. The students were taken to a computer lab where
they were assigned a partner but each student had his/her own computer. The students were
seated beside their partner in order for both students to use the software and be able to
discuss their findings with the other. The students were advised to complete responses on
worksheets that consisted of directions for the students to use and blanks for students to fill in
with responses.
The students in the student-constructed instructional activity did not take advantage
of the dragging abilities of the DGS. Since they were to create a drawing, most of them
stopped using the software after creating the diagram. They did not explore the terms with
their constructed diagram unlike the students with the teacher-constructed diagrams that used
the dragging tool to define the terms. Even though the student-constructed instructional

35
activity asked about any new findings found after drawing the diagram, the students did not
investigate their own drawings. This limited their ideas since the dragging tool is one of the
great benefits of using DGS. The dragging tool helps students ground their hypothesis and
conjecture about certain terms because the construction holds the characteristics of the term
as constructed in the software. Therefore, they could discover new aspects of the term that
were not in the definition with the use of dragging.
The limited introduction of the software caused some frustration at the beginning of
the instructional activity for the student-constructed class but the frustration diminished as
the students progressed through the first few definitions. As the researcher was walking
around it was evident that the student’s frustration with the software in the student-
constructed class was short-lived and did not greatly hinder their understanding of the
geometric terms. If the researcher were not familiar with the software it could have been
more frustrating for the students and may have affected their conceptual understanding. Yet,
since the researcher was very experienced with the software she questioned the students in a
manner not to reveal the answer but provide them the means to find it using the software.
In both classes the students worked individually on their computer but discussed their
findings with the DGS as a pair while they recorded their results on their investigation. The
student-constructed class constructed diagrams given definitions on their worksheets (see
Appendix D). The teacher-constructed class’s instructional activity worksheet, Appendix E,
allowed students to create definitions or descriptions of each term given to them in the DGS
document of the pre-constructed diagrams created by the researcher. Each instructional
activity asked the students to summarize their experience with the software at the end. They

36
were asked a series of questions that can be found on Appendix C and Appendix D in order
for the researcher to gain some insight about how each individual student used the software,
benefited from the software, and could draw connections between the topics after the use of
the software.
After the students in both classes completed the three days of instruction using the
DGS class continued as normal, going through the curriculum until a month had passed.
After a month the students were given the post-test, Appendix F. There were also nine
questions in the post-test similar to the questions in the pre-test. Although they were
different tests, the questions were superficially different yet conceptually the same. The only
question that differed conceptually was question 8; therefore, it was not used in the analysis
of the study. The pre-test and post-test were used to compare the results in order to discover
if the students showed a deeper understanding of angle due to the instructional activity, if any
subgroups of students gained a better understanding with the instructional activity, and if one
activity was more efficient than the other.
Five students volunteered for clinical interviews, which were used to analyze their
understanding of angle and the use of DGS. The interview protocol can be found in
Appendix G. The students were introduced to the interview process and asked to get the
permission form signed that allowed permission to video them for the interview. There were
5 tasks in the interview. Each task was about students’ ways of thinking about angle or how
they perceived the use of DGS in the study affected their understanding of angle. The
interviews were analyzed and transcribed in order to determine their conceptual
understanding of angle and whether the software was beneficial.

37
Data Analysis
Data analysis consisted of both qualitative and quantitative analysis. In this section,
the researcher first describes the qualitative analysis, which involved using the theoretical
framework from earlier research and other grounded coding. Then she describes the
quantitative analysis.
Qualitative:
After the collection of data in the pre-test, instructional activity, post-test and
interviews all of the written responses from the pre-test, instructional activity and post-test
were entered into a spreadsheet in order to make conjectures from patterns throughout the
subjects and the questions (Miles & Huberman, 1994). The written responses from the pre-
test, instructional activity and post-test were then color coded to represent the subjects
understanding of the concept being asked. The color coding was as follows: green was given
to a response that was conceptually strong, yellow was given to a response that showed some
conceptual understanding yet contained some misconceptions about the topic, and pink
represented a lack of understanding of the topic being discussed.
Once the responses were coded they were scored based on their color code. The
green code received two points, the yellow code received one point, and the pink code
received no points; this action was taken so the researcher could analyze the students’ gain
scores. The coding was also used to help discover patterns of misconceptions held by the
students throughout the study.

38
After the researcher identified the common misconceptions the students possessed
before the study by analyzing the coding of the pre-test, the researcher started considering
categories or levels of some sort to demonstrate students’ conceptual understanding of angle.
While studying the data, the researcher needed to decide whether categorization or levels of
understanding would best fit this study; the researcher considered these possible
categorizations and levels described below in order to make her decision:
1. Piaget’s stage theory of development: “They defined three stages of
development between the ages of two and 11 years. At state 1, children can only
recognize familiar objects, not shapes. At Stage 2 (pre-operatory level), they
grasp topological (inside-outside, open-close) as well as rectilinear and curvilinear
relations, but not metric or Euclidean relations. At the final stage (operatory
level), children start to apply metric and Euclidean ones” (Munier & Merle, 2009, p.
1859).
2. van Hiele’s levels: Similar to the Piaget’s stages yet “progressing from one stage to
the next depends more on the teaching method adopted than on age, and this makes
the geometry-related experiences of the child a determining factor” (Munier & Merle,
2009, p. 1860).
3. Mitchelmore & White (1998) categories, which can be found in Table 1 in
Chapter 2.
After consideration, the author chose to use a modification of the Mitchelmore & White
categories due to the fact that one cannot say if a students’ understands angle better using any
of the multiple definitions. Since there are multiple definitions, multiple categories are

39
needed to assess students’ conceptual understanding of angle. The researcher took their
categorization table and the data given by the students and created similar categories in this
study. After the researcher created the categories for this study the researcher consulted a
second researcher in the same department for confirmation and collaboration.
The researcher decided to use categories due to the fact that one cannot say if a
student understands an angle better, if they understand angle as defined by Euclidean
geometry or as a rotation about a single point as well as the dependency upon instruction in
this study. Therefore the researcher created the categories in Table 7 and Table 8 to analyze
the students’ conceptual understandings of angle. Since there are multiple definitions of
angle, there are more than one category used to classify the students using the definitions
described earlier that were created by Mitchelmore and White (1998). After the data was
analyzed it was obvious that there was no need to create categories for angle as a sector due
to the limited amount of evidence that showed understanding of angle in this manner evident
throughout the study. There were categories created for the other two definitions as shown:
Euclidean in Table 7 and angle as a rotation in Table 8.
These categories were used to classify the student responses and compare the students
understanding due to their responses on the pre-test, instructional activity and post-test
throughout the study. The following figure exemplifies how the students were coded and
then given a score. Figure 1 is an example of the coding used to gauge Subject 1’s responses
to the pre-test.

40
Table 7
The categories for angle as defined in Euclidean geometry.
Category Definition A0 Subject shows no comprehension of angle. A1 Subject understands angle as a single fixed measurement.
A2 Subject understands angle as multiple fixed measurement, such as right, acute, obtuse or straight.
A3 Subject understands angle as an intersection of two lines, or two lines that meet as a point.
A4 Subject understands angle as a bending line with an array of measurements
A5 Subject shows a complete conceptual understanding of angle as defined in Euclidean geometry
Table 8
The categories for angle as defined by a rotation about a single point.
Category Definition B0 Subject shows no comprehension of angle as a rotation about a point. B1 Subject understands angle as a single rotation about a point. B2 Subject understands angle as a variety of rotations about a single point . B3 Subject shows a complete conceptual understanding of angle as a
rotation about a single point.
Once the scoring was completed, the pre-test responses were organized by subject
and question in order to identify student conceptions and misconceptions about angle at the
start of the study. Both classes were analyzed together since they all had the same pre-test.
After the pre-tests were coded, the researcher studied each student individually to see how
their understanding of angle developed throughout the entire study, from the pre-test to the
instructional activity and finally the post-test. The students were then classified by the
categories created by the researcher as described above. The lesson was broken down into

41
three different phases for categorization purposes: The pre-test and introductory terms,
classifications and relationships, postulates and post-test.
Question
1. Out of the different diagrams below please identify the angle
2. Draw your own diagram of an angle.
3. Draw an angle that measures approximately 30 degrees.
4. Draw two angles that are complementary to each other.
Subject 1 Correct
Correctly drew an angle, yet missing the points. Correct
Drew congruent angles
5. Define angle with detail.
6. What is the difference between angle and square?
7. Draw a picture with 6 angles in it and identify the angles.
9. How many angles are in the diagram below? Identify them and describe why they are angles.
Personal Student Gain Scores
"an angle is where two lines meet"
"a square is closed" Incorrect
"8 they are angles because they meet together"
7
Figure 1 - Coding of Subject 1's Pre-test
A portion of the students volunteered for clinical interviews. The interviews were
analyzed and transcribed in order to determine their conceptual understanding of angle at the
end of instruction and whether the software was beneficial while they developed their
understanding of angle. Their responses and subsequent coding were compared to the
categories already assigned to them in the previous analysis. Their transcriptions were

42
analyzed in order to find any more emerging patterns while seeing if the patterns noticed in
the previous analysis were also seen in the interview.
Quantitative:
The categorization and scoring described above was used to compare students gain
scores from the pre-test to the post-test. The scores were analyzed using statistical software
to perform a paired t-test. A paired t-test was used to see if the means on these two normally
distributed interval variables differ from each other. A paired t-test is used when you have
two related observations (for example, two observations per subject, in this case pre-test and
post-test) (Rao, 2007, p. 143). In each case, the null hypothesis was that the results of the
pre-test and post-test were equal and the alternative hypothesis was that they were different.
The results of the t-tests were used to see if either, or both, methods of instruction were
beneficial to student learning of angle. Additionally, was learning with student constructed
diagrams or teacher constructed diagrams more beneficial was analyzed. Finally, the
researcher analyzed if particular subgroups of students were supported differently by the two
styles of DGS use.

43
CHAPTER 4 – RESULTS
Throughout the study the use of dynamic geometry software improved students’
understanding of angle for both classes. In addition, during the analysis of the pre-test,
instructional activity, post-test and interviews a few patterns emerged from the data as
described in the sections below. The following sections report the results of these
quantitative and qualitative analyses
The results from analyzing the quantitative data are first presented. Then the results
from the pre-test for each class section are explained together as they were analyzed together.
Since each student came from different Algebra I class’s it was important to see where they
were as a whole to see how their understanding of angle as a class had changed after the
instructional activity. Then each student’s responses are analyzed based on which
instructional activity the class used, first the student-constructed class and then the teacher-
constructed class. The five interviews are next presented. Finally, the individual class
results including the commonalities between the classes are compared and summarized.
Paired T-Test - Quantitative Data Analysis
A paired t-test was used to compare the difference between the pre-test score and the
post-test score of each individual student from each class to determine if one method was
more successful than the other. A paired t-test was chosen since it is used when you have
two related observations (for example, two observations per student, in this case pre-test and

44
post-test) (Rao, 2007, p. 143). The result of the t-test was used to see if either, or both,
methods of instruction were significant. The results from the paired t-test are reported in
Tables 9 – 21. The null hypothesis of the paired t-test performed in Table 9 is assuming that
there is no difference between the students’ score on the pre-test and the post-test,
€
H0 : µd ≤ D0. The alternative hypothesis is assuming that the use of the software did in fact
affect the students’ scores on the post-test in comparison to the pre-test scores for the SCD,
€
Ha : µd > D0.
Table 9
The t-test statistics for the SCD class.
Difference N
Lower CL Mean Mean
Upper CL Mean
Lower CL Std Dev Std Dev
Upper CL Std Dev
Standard Error
Pretest-‐posttest 15 -‐3.495 -‐2 -‐0.533 2.5939 3.5429 5.5876 0.9148
Difference df T-‐value Pr > |t| Pretest-‐posttest 14 -‐1.68 0.1159
Looking at the results from the paired t-test for the SCD class, the researcher does not
conclude the instructional activity improved the students’ level of understanding at a 90%
confidence level (p-value of .1159). However, the result from the gain scores does show that
the instructional activity did improve their understanding, just not at a significant level. As
will be seen in the following sections, the data from the qualitative summary supports this; it

45
shows evidence that the instructional activity did help the students improve their level of
understanding but not as much as the investigation from the TCD class.
The null hypothesis of the paired t-test performed in Table 10 is assuming that there
is no difference between the students’ score on the pre-test and the post-test,
€
H0 : µd ≤ D0.
The alternative hypothesis is assuming that the use of the software did in fact affect the
students’ scores on the post-test in comparison to the pre-test scores for the TCD,
€
Ha : µd > D0.
Table 10
The t-test statistics for the TCD class.
Difference N
Lower CL Mean Mean
Upper CL Mean
Lower CL Std Dev Std Dev
Upper CL Std Dev
Standard Error
Pretest-‐posttest 12 -‐4.934 -‐2.92 -‐0.899 2.2495 3.1754 5.3915 0.9167
Difference df T-‐value Pr > |t| Pretest-‐posttest 11 -‐3.18 0.0087
Looking at the results from the paired t-test for the TCD class, it is evident that the
instructional activity did improve the student’s level of understanding with a 95% confidence
level (p-value of 0.0087). This result shows an increase in understanding for the students of
the teacher-constructed class, as will be seen in the following sections. Therefore, both
instructional activities are successful teaching methods due to the improvement in gain scores

46
for each class; yet the TCD classes’ improvement from the pre-test to the post-test is proven
to be significant through the statistical analysis.
Another quantitative question to consider is for which classifications of students the
instructional activity was best. The following sections explain how each activity affected
different groups of students: male vs. female, minority vs. non-minority, and sophomores vs.
juniors.
Male vs. Female
The null hypothesis of the paired t-test performed in Table 11 -14 is assuming that
there is no difference between the female and male students’ score on the pre-test and the
post-test,
€
H0 : µd ≤ D0. The alternative hypothesis is assuming that the use of the software did
in fact affect the students’ scores on the post-test in comparison to the pre-test scores for
females differently than for males,
€
Ha : µd > D0.
Table 11
The t-test statistics for the SCD class female.
Difference N
Lower CL Mean Mean
Upper CL Mean
Lower CL Std Dev Std Dev
Upper CL Std Dev
Standard Error
Pretest-‐posttest 7 -‐6.035 -‐2.86 0.321 2.2145 3.4365 7.5674 1.2989
Difference df T-‐value Pr > |t| Pretest-‐posttest 6 -‐2.20 0.0701

47
Table 12
The t-test statistics for the TCD class female.
Difference N
Lower CL Mean Mean
Upper CL Mean
Lower CL Std Dev Std Dev
Upper CL Std Dev
Standard Error
Pretest-‐posttest 8 -‐3.386 -‐1.86 -‐0.364 1.1952 1.8077 3.6792 0.6391
Difference df T-‐value Pr > |t| Pretest-‐posttest 7 -‐2.93 0.0219
After analyzing the paired t-test for female mean gain scores from each group it is
evident that the software is beneficial for their understanding and can improve their
knowledge on the subject being discovered. Both the SCD and the TCD class improved
significantly, with a 90% confidence level (p-value of 0.0701) for the SCD class and a 95%
confidence level (p-value of 0.0219) according to the results from both paired t-tests shown
above. Therefore, even though the paired t-test for the entire class of SCD students
concluded that the instructional activity was not significant, this data shows us that it was
significant for the females in that class. The males of the study were affected much
differently by the instructional activity, which is shown in Table 13 and Table 14.
According to the results from the paired t-test we cannot say at a 90% confidence
level that the study caused significant improvement for SCD males (p-value of 0.6955) or the
TCD males (p-value of 0.1152). Even though the TCD class as a whole improved
significantly, when you look at the sexes of the student individually it is evident that the
instructional activity was more valuable for the females.

48
Table 13
The t-test statistics for the SCD class male.
Difference N
Lower CL Mean Mean
Upper CL Mean
Lower CL Std Dev Std Dev
Upper CL Std Dev
Standard Error
Pretest-‐posttest 7 -‐2.12 0.429 2.981 1.7787 2.7603 6.7603 1.0433
Difference df T-‐value Pr > |t| Pretest-‐posttest 6 0.41 0.6955
Table 14
The t-test statistics for the TCD class male.
Difference N
Lower CL Mean Mean
Upper CL Mean
Lower CL Std Dev Std Dev
Upper CL Std Dev
Standard Error
Pretest-‐posttest 4 -‐12.23 -‐5 2.233 2.5753 4.5461 16.95 2.273
Difference df T-‐value Pr > |t| Pretest-‐posttest 3 -‐2.20 0.1152
The p-value of 0.1152 for the TCD class is close to 0.10; it is possible that this test did not
produce a significant result because the number of male students in this class was drastically
different than the number of females in this class. With a larger group of students one may
see different results here, the TCD instructional activity could be in fact significant.

49
Minority vs. Non-minority
Testing the significance of the instructional activities for the non-minority of the
students did not return interesting results, as the number of participants became an issue. In
this study I defined minority as Black and Hispanic and non-minority as everyone else. The
null hypothesis of the paired t-test performed in Table 15 - 17 is assuming that there is no
difference between the minority and non-minority students’ score on the pre-test and the
post-test,
€
H0 : µd ≤ D0. The alternative hypothesis is assuming that the use of the software
did in fact affect the students’ scores on the post-test in comparison to the pre-test scores for
minority students’ differently than for non-minority students’,
€
Ha : µd > D0.
Table 15
The t-test statistics for the SCD class non-minority.
Difference N
Lower CL Mean Mean
Upper CL Mean
Lower CL Std Dev Std Dev
Upper CL Std Dev
Standard Error
Pretest-‐posttest 5 -‐1.82 0.6 3.020 1.1679 1.9494 5.6016 0.8718
Difference df T-‐value Pr > |t| Pretest-‐posttest 4 0.69 0.5291
Looking at the paired t-test for non-minority students in the SCD class (p-value of
0.5291) shows that the gain scores on the pre-test compared to the post-test were not
significant at either a 90% or 95% confidence level. Also, we cannot say whether the
instructional activity in the TCD class was significant for the non-minority students as well.

50
There were not enough non-minority students in the TCD class to run the test therefore the
significance of the instructional activity for the non-minority students could not be
calculated.
Analyzing the minority students paired t-test produced much more interesting results.
Even though the SCD class as a whole was not considered significant it was for the minority
students.
Table 16
The t-test statistics for the SCD class minority.
Difference N
Lower CL Mean Mean
Upper CL Mean
Lower CL Std Dev Std Dev
Upper CL Std Dev
Standard Error
Pretest-‐posttest 10 -‐5.281 -‐2.6 0.080
9 2.5777 3.7476 6.8416 1.1851
Difference df T-‐value Pr > |t| Pretest-‐posttest 9 -‐2.19 0.0559
According to the results form the paired t-test we can say that the SCD instructional
activity was significant for the minority of students with a 90% confidence level (p-value of
0.0559). There is a strong difference between the level of improvement seen in the non-
minority students and the minority students for the SCD class. The results for the TCD
minority students were similar.

51
Table 17
The t-test statistics for the TCD class minority.
Difference N
Lower CL Mean Mean
Upper CL Mean
Lower CL Std Dev Std Dev
Upper CL Std Dev
Standard Error
Pretest-‐posttest 10 -‐4.148 -‐2.36 -‐0.579 1.8558 2.656 4.6612 0.8008
Difference df T-‐value Pr > |t| Pretest-‐posttest 9 -‐2.95 0.0145
We can say with 95% confidence (p-value of 0.0145) that the TCD instructional
activity was significant for the minority of students in that class. Since the researcher cannot
calculate the significance of the non-minority for this class, due to the low level of non-
minority students in the class, the researcher cannot say if there is a big difference in mean
gain scores for the non-minority and minority students in the TCD class. Looking at the
results for the SCD class and how it contradicted the significance level for the instructional
activity as a whole could give some insight concerning the non-minority students in the TCD
class. Considering the TCD class paired t-test was proven to be significant if the minority
students were significant one could ponder if the non-minority students were also significant
or did the non-minority students contradict the results of the whole class paired t-test as well.
Yet one can say that both instructional activities were beneficial for minority students and we
know this is not the case for the non-minority students considering the SCD class did not
produce significant results.

52
Sophomores vs. Juniors
The results from the paired t-test for each class of students yielded some interesting
results relating to the age of the student, these are shown in Table 18 –Table 21. The null
hypothesis of the paired t-test performed in Table 18 - 21 is assuming that there is no
difference between the sophomore and junior students’ score on the pre-test and the post-test,
€
H0 : µd ≤ D0. The alternative hypothesis is assuming that the use of the software did in fact
affect the students’ scores on the post-test in comparison to the pre-test scores for
sophomores differently than for juniors,
€
Ha : µd > D0.
The sophomores in the SCD class improved significantly with a 90% confidence level
(p-value of 0.0683) along with the sophomores in the TCD class who improved significantly
with a 99% confidence level (p-value of 0.0100). This was not the case for the juniors in the
study.
Table 18
The t-test statistics for the SCD class 15 & 16 year old.
Difference N
Lower CL Mean Mean
Upper CL Mean
Lower CL Std Dev Std Dev
Upper CL Std Dev
Standard Error
Pretest-‐posttest 11 -‐4.752 2.273 0.206
4 2.5785 3.6903 6.4762 1.1127
Difference df T-‐value Pr > |t| Pretest-‐posttest 10 -‐2.04 0.0683

53
Table 19
The t-test statistics for the TCD class 15 & 16 year old.
Difference N
Lower CL Mean Mean
Upper CL Mean
Lower CL Std Dev Std Dev
Upper CL Std Dev
Standard Error
Pretest-‐posttest 9 -‐6.187 -‐3.67 -‐1.146 2.2146 3.2787 6.2813 1.0929
Difference df T-‐value Pr > |t| Pretest-‐posttest 8 -‐3.35 0.0100
The results from the t-test for juniors was completely opposite from the results of the
sophomores. Geometry is a sophomore mathematics course in the state in which the study
was taken. This would suggest that these students were following the correct path of
mathematics courses and had more success than the juniors. The juniors are also more likely
to be in geometry for the second time, therefore being less successful in their mathematics
courses.
Looking at the p-values for the juniors, one can see how different the instructional
activity affected the juniors compared to the sophomores. The results from the paired t-test
show that no significance can be shown for the juniors in the SCD class (p-value of 0.7027)
or the juniors in the TCD class (p-value of 0.5286) with a 95% or 90% confidence level.
Looking at the pre-test scores for the juniors it is evident that they did not start at a higher
level.

54
Table 20
The t-test statistics for the SCD class 17 & 18 year old.
Difference N
Lower CL Mean Mean
Upper CL Mean
Lower CL Std Dev Std Dev
Upper CL Std Dev
Standard Error
Pretest-‐posttest 4 -‐3.288 0.5 4.287 1.3485 2.3805 8.8757 1.1902
Difference df T-‐value Pr > |t| Pretest-‐posttest 3 0.42 0.7027
Table 21
The t-test statistics for the TCD class 17 & 18 year old.
Difference N
Lower CL Mean Mean
Upper CL Mean
Lower CL Std Dev Std Dev
Upper CL Std Dev
Standard Error
Pretest-‐posttest 3 -‐4.461 -‐0.67 3.127
9 0.7953 1.5275 9.6001 0.8819
Difference df T-‐value Pr > |t| Pretest-‐posttest 2 -‐0.76 0.5286
For the SCD class only one student, Subject 6, started with a high score of 10. Although
Subject 6 started with a higher score they reduced their score by 3 points, from scoring a 10
on the pre-test to a 7 on the post-test. The change in pre-test score to post-test score for
Subject 6 brought up another question, did all juniors decrease? No, about half of the juniors
in the SCD class improved while the other half decreased. Their scores only varied by one or

55
two points from the pre-test to the post-test. There were no patterns seen in the correlation of
the students’ age and their sex or gender in the SCD class, therefore there is no connection to
any of the previous t-tests and the lack of significance of the juniors.
Looking at the TCD class there is one student, Subject 18, who started with a higher
score but they only improved two points after the instructional activity. If you leave out
Subject 18 one can see that the same results from the SCD class can be found in the TCD
class. Neglecting Subject 18, again half of this group of students improved their score while
the other half decreased their score from the pre-test to the post-test. As seen with the SCD
class, their scores only varied by one or two points from the pre-test to the post-test and there
were no patterns seen in the correlation of the students’ age and their sex or gender for the
TCD class either. According to this data the juniors did not benefit from the software, it
seem as if they were affected very little from the computer experience with the instructional
activity while the sophomores were greatly affected.
Combined Class Pre-Test Analysis – Qualitative Data Analysis
All of the students had been introduced to angle in earlier mathematics courses, but
this was their first exposure in their current geometry course. Every student showed some
knowledge of angle, which is evidenced considering 27 out of 27 (100%) of the students
could either identify an angle within a variety of shapes, draw their own angle, or both.
Table 1 provides the questions of the pre-test while Table 2 gives a summary of the responses
for the pre-test with a combination of the two classes: student-constructed class with 15
subjects and the teacher-constructed class with 12 subjects.

56
Table 22
Pre-test questions
Question 1 Out of the different diagrams below please identify the angle: 2 Draw your own diagram of an angle. 3 Draw an angle that measures approximately 30 degrees. 4 Draw two angles that are complementary to each other. 5 Define angle with detail. 6 What is the difference between angle and square? 7 Draw a picture with 6 angles in it and identify the angles. 8 Think of a real world example of an angle. Give a detailed description of
the example and draw a diagram below. 9 How many angles are in the diagram below? Identify them and describe
why they are angles.
Table 23
Summary of pre-test responses for both classes
Question Conceptual
Understanding Limited
Understanding No Understanding
Blank 1 25 out of 27 (93%) 2 out of 27 (7%) 2 4 out of 27 (15%) 22 out of 27 (81%) 1 out of 27 (4%) 3 13 out of 27 (48%) 14 out of 27 (51%) 4 27 out of 27
(100%)
5 3 out of 27 (11%) 8 out of 27 (30%) 16 out of 27 (60%) 6 4 out of 27 (15%) 14 out of 27 (52%) 9 out of 27 (33%) 7 11 out of 27 (41%) 13 out of 27 (48%) 3 8 12 out of 27 (44%) 7 out of 27 (26%) 4 out of 27 (15%) 4 9 5 out of 27 (19%) 22 out of 27 (81%)
Total 77 out of 243 (27%)
65 out of 243 (27%)
94 out of 243 (39%)
7

57
Although, 25 out of 27 (93%) students could identify an angle from the variety of shapes,
when these 25 students were asked to draw their own representation 22 out of 27 (88%)
forget to use important components such as points and rays in their own diagrams and 1 out
of 27 (4%) student drew a square with 2 diagonals creating multiple angles without
identifying any of the angles in the diagram. 26 out of 27 (96%) of the students’ definitions
and pictorial representations were imperfect due to their lack of correct terminology needed
to help express their true conceptual understanding of angle. As a whole, the word ray was
not used as often as the word line during the pre-test, this may be because some previous
knowledge was never understood or forgotten. None of the students knew what the word
complementary meant; 27 out of 27 (100%) students got this confused with congruent,
adjacent, supplementary, right, acute, vertical, parallel line, intersecting lines and triangle.
The students did not pay attention to the detail needed to clearly draw nor define angle before
the instructional activity.
When it came to being able to define an angle, the students showed a very limited
understanding; 3 out of 27 (11%) of the students correctly defined angle with appropriate
terminology and specifications. 8 out of 27 (30%) of the students defined angle with limited
conceptual understanding and terminology; for example Subject 1 wrote, “ where two lines
meet.” Two intersecting lines form multiple angles; therefore that definition is not sufficient.
16 out of 27 (59%) of the students were severely lacking conceptual understanding. 4 out of
27 (15%) students understand angle as being a right angle and nothing more; for example
Subject 7 defines angle as “is 90 degrees.” 2 out of 27 (7%) students can see beyond the
right angle but still have a difficult time understanding angle as anything but a fixed degree;

58
for example Subject 3 defines angle as “either typically 90 degrees, 180 degrees, 360
degrees.”
Although the students could not define angle with accuracy, 8 out of 27 (30%)
students showed some understanding of angle and how the length of the rays continued
having no affect on the measure of the angle. Subject 3 describes the difference between an
angle and a square as follows: "angle is two lines and a square has 4 angles” also an angle is
“opened and squares are closed." 9 Subjects out of 27 (33%) could not express the difference
between a square and an angle; for example Subject 17 said “angle measures 90 degrees” and
a “square cannot measure.” This quote and many other quotes from the students highlight
the need for the study. Once students reach 10th grade geometry an angle should be a
concept very familiar with them, yet that is not the case.
SCD class results and TCD class results
Throughout the study the students appeared to gain some understanding of angle.
Even though there were two different instructional activities using DGS, both instructional
activities improved the students’ understanding of angle. The following sections report an
analysis of each class’s responses to the worksheets that they completed during the
instructional activity: the student-constructed class and then the teacher-constructed class.
Following the individual class results the commonalities between the classes are compared
and summarized including a synopsis of the clinical interviews of 5 different students: 3 from
the student-constructed class and 2 from the teacher-constructed class.

59
Student-constructed (SCD) individual results
Student-constructed DGS instructional activity worksheet analysis
On the instructional activity, which the students completed during the two days of
instruction, the students were given 32 definitions, which they were to illustrate using
pictorial representations and record their findings on their worksheet. The instructional
activity was designed to cover the curriculum of the class, therefore incorporating all the
introductory terms. The instructional activity included a variety of introductory terms
including angle, angle classifications, angle pair relationships, and postulates. The researcher
analyzed the responses to the 15 terms, which had to do with angle. There were 240
diagrams, 16 each for the 15 students. 81 out of 240 (54%) of the diagrams were
conceptually correct. 130 out of 240 (54%) were limited in conceptual understanding or a
lack of detail, not a complete conceptual understanding. For instance, if a student were to
draw an angle without points and rays clearly identified, they would fall into the limited
understanding group. With this lack of detail it is hard to see if the student shows a
conceptual understanding without asking the student about the diagram. 13 out of 240 (5%)
diagrams of the terms were completely incorrect. Overall, the student-constructed
instructional activity was a success for the students considering only 5% of the overall
responses were incorrect and 211 out of 240 (88%) of the responses showed some conceptual
understanding of the term that was being defined.
Looking at the responses with more detail highlighted some interesting results. When
the students were just asked to draw an angle, 9 out of 15 (60%) student’s pictorial
representations were lacking detail, such as points or rays.

60
Table 24
Summary of instructional activity responses for student-constructed class
Geometric Term
Conceptual Understanding
Limited Understanding
No Understanding Blank
Segment 14 out of 15 (93%) 1 out of 15 (7%)
Line 8 out of 15 (53%) 7 out of 15 (47%) Ray 12 out of 15
(80%) 3 out of 15 (20%)
Angle 6 out of 15 (40%) 9 out of 15 (60%) Acute Angle 6 out of 15 (40%) 9 out of 15 (60%) Right Angle 5 out of 15 (33%) 10 out of 15
(67%)
Obtuse Angle 4 out of 15 (27%) 11 out of 15 (73%)
Straight Angle 11 out of 15 (73%)
4 out of 15 (27%)
Adjacent Angles 1 out of 15 (7%) 14 out of 15 (93%)
Complementary Angles 1 out of 15 (7%) 13 out of 15
(87%) 1 out of 15 (7%)
Supplementary Angles 3 out of 15 (20%) 11 out of 15
(73%) 1 out of 15 (7%)
Vertical Angles 1 out of 15 (7%) 13 out of 15 (87%) 1
Segment Addition 9 out of 15 (60%) 2 out of 15 (13%) 1 out of 15 (7%) 3
Segment Bisector 6 out of 15 (40%) 2 out of 15 (13%) 4 out of 15
(27%) 3
Angle Addition 3 out of 15 (20%) 8 out of 15 (53%) 4 Angle Bisector 2 out of 15 (13%) 7 out of 15 (47%) 1 out of 15 (7%) 5 Total -‐ 240 81 (34%) 130 (54%) 13 (5%) 16
When it comes to looking at the classification of angles, the same information is true for
acute, right and obtuse. Each response was correct yet lacking detail such as points and rays.
9 out of 15 (40%) student’s pictorial representations were lacking detail for the acute angle,

61
10 out of 15 (67%) were lacking detail for the right angle, and 11 out of 15 (73%) were
lacking detail for the obtuse angle. This may be due to the fact that the students can create
two lines within DGS and then uses the dragging tool to cross those two lines forming many
angles without a point forming in the middle or the use of rays and the students would
reproduce what they saw in the DGS instead of correctly constructing an angle.
All of the students showed difficulty constructing a straight angle and being able to
tell the difference between their diagram and a line. No student drew a completely correct
picture of a straight angle and 4 out of 15 (27%) showed a complete misunderstanding of
what a straight angle was. Subject 8 constructed a correct diagram of a straight angle and
stated, “If the angle goes further the degrees would decrease.” This might be due to the
limitation of the DGS, the software does not measure an angle as a rotation about a point.
Once you construct an angle and measure that angle, if you drag one ray further than 180
degrees the software starts decreasing the measure of the angle, essentially changing the
angle it is measuring. The largest an angle can be measured in the DGS is 180 degrees,
which did not help the students’ conceptual understanding of angle as a rotation.
Use of DGS with student constructed diagram (SCD)
After analyzing the instructional activity, the researcher analyzed each student’s
specific responses during three phases of the study. The categories in which the responses
were given in each of the three phases are described in the methodology section. There were
two different sets of categories, one for the definition of angle according to Euclidean
geometry (A) and as a rotation about a point (B). None of the students in the SCD class

62
mentioned angle as a rotation so category B was not used in this section of the analysis.
Category A can be found in the methodology section and Table 7 is repeated below.
Table 7
The categories for angle as defined in Euclidean geometry.
Category Definition A0 Subject shows no comprehension of angle. A1 Subject understands angle as a single fixed measurement.
A2 Subject understands angle as multiple fixed measurement, such as right, acute, obtuse or straight.
A3 Subject understands angle as an intersection of two lines, or two lines that meet as a point.
A4 Subject understands angle as a bending line with an array of measurements
A5 Subject shows a complete conceptual understanding of angle as defined in Euclidean geometry
The worksheet for the instructional activity was broken up into three different phases for the
category analysis: Pre-test & Basic Terminology, Classifications and Relationships, and
Postulates & Post-Test. The basic terminology covers the pre-test along with defining
segment, line, ray, and angle. Classifications and relationships include the definitions of
acute angle, right angle, obtuse angle, straight angle, adjacent angles, complementary angles,
supplementary angles and vertical angles. The last section is postulates and the post-test,
which includes segment addition, segment bisector, angle addition, and angle bisector.
Looking at the students within each phase of the study demonstrated at which category the
student’s responses were in throughout the study, shown in Table 25.

63
Table 25
Student categorization throughout the student-constructed study
Subjects Introductory Terms &
Pre-‐Test Classifications & Relationships
Postulates & Post-‐Test
Subject 1 A3 A3 A3 Subject 2 A3 A2 A3 Subject 3 A2 A2 A1 Subject 4 A4 A3 A3 Subject 5 A1 A2 A1 Subject 6 A2 A2 A2 Subject 7 A1 A1 A1 Subject 8 A1 A3 A3 Subject 9 A3 A3 A3 Subject 10 A3 A3 A1 Subject 11 A1 A3 A2 Subject 12 A1 A3 A3 Subject 13 A0 A2 A2 Subject 14 A2 A3 A2 Subject 15 A1 A2 A1
Analyzing Table 25 one can see that 4 out of 15 (27%) students showed an improvement of
conceptual understanding of angle throughout the study. 7 out of 15 (47%) were categorized
the same in both the 1st and 3rd phase of the study, yet each had different results during phase
2. 4 out of 15 (27%) students’ conceptual understanding of angle seemed to decrease as a
result of the study.
Use of DGS with student-constructed diagram (SCD) Pre and Post-test analysis.
The student-constructed class showed improvement in their understanding of angle
with an average of 1.52 points. Table 26 lists the student-constructed gain scores.

64
Table 26
The SCD class scores.
Subject Student-‐constructed Pre-‐test Score
Student-‐constructed Post-‐test Score
Student-‐constructed Gain Score
Subject 1 7 9 2 Subject 2 7 5 -‐2 Subject 3 9 9 0 Subject 4 11 7 -‐4 Subject 5 7 7 0 Subject 6 10 7 -‐3 Subject 7 5 8 3 Subject 8 9 12 3 Subject 9 9 9 0 Subject 10 9 8 -‐1 Subject 11 6 12 6 Subject 12 5 14 9 Subject 13 6 11 5 Subject 14 5 9 4 Subject 15 6 7 1 Total 111 134 23 Average 7.4 8.93 1.53
There were no significant differences when it comes to the first question on the post-
test, which involved identifying an angle from a multitude of shapes and terms. On the
second question, 2 out of 15 (13%) students improved their diagram of an angle to include
the details needed to draw a correct diagram. 4 out of 15 (27%) students drew a less detailed
diagram after using the software. This pattern of lacking details is also seen in the next
question on the post-test. They left out important details to an angle such as points and rays
on the post-test which they included on the pre-test. The students were asked to draw a 120-
degree angle. For this question 9 out of the 15 (60%) students drew less detailed pictures.

65
This pattern is evident throughout the rest of the questions; the students seem to have left out
details that they previously knew and demonstrated on the pre-test.
The student’s conceptual understanding of angle showed improvement despite the
lack of detail. On the pre-test 6 out of 15 (40%) students showed a complete or some
conceptual understanding of angle. On the post-test 10 out of 15 (67%) students showed a
complete or some conceptual understanding of angle. Therefore, after the instructional
activity 12 out of 15 (80%) of the students showed some conceptual understanding as
opposed to the 6 out of 15 (40%) before. The students definitely displayed a better
understanding of angle pair relationships after the instructional activity. Before the
instructional activity on the pre-test all 15 out of 15 (100%) students did not know how to
draw complementary angles, on the post-test only 1 out of 15 (7%) student did not know how
to draw supplementary angles.
Teacher-constructed class individual results
Analysis of DGS Teacher-constructed instructional activity worksheet
In the TCD activity worksheet, the students defined 16 terms including segment, line,
ray, angle, acute angle, right angle, obtuse angle, straight angle, adjacent angles,
complementary angles, supplementary angles, vertical angles, segment addition and bisector,
along with angle addition and bisector. The 12 students in the teacher-constructed class
created a total of 181 definitions on the worksheet during the instructional activity. 108 out
of 181 (60%) of the definitions were conceptually correct. 58 out of 108 conceptually correct
definitions (32%) were correct yet lacking some important details in order to determine their

66
complete conceptual understanding. 15 out of 181 (8%) showed no conceptual
understanding within the definitions of the terms. Therefore, 166 out of 181 (92%) of the
definitions given by the students showed some conceptual understanding of the concept they
were defining, which was similar to the percentage seen in the student-constructed
instructional activity results.
Segment, line and ray defining
Table 27 consists of a summary of the results of analysis of the worksheet responses.
Following Table 27, the responses that are connected to each teacher-constructed DGS
diagram are analyzed in detail. Figure 2 shows the DGS construction for the first three
terms, segment, line and ray. In order to discover the definitions of the following terms the
students can drag each of the points in the figure. The segment was constructed from a line
so when you drag the points it changes the size of the segment. The segment was constructed
parallel to the line so the students would be able to drag the segment onto the line and see
that a segment is part of a line. The points on the line just stay on the line and move as
dragged. There are two different reactions seen when you drag the points on the rays, one
can either extend the length of the ray or move the ray to lie on the line to show that is part of
the line. The rays were constructed parallel as well, so they could be dragged onto the line
and see that two opposite rays form a line. The other point on the ray stays on the ray and
just simply moves on the ray. While dragging the points around the researcher intended the
students would get to the following definitions: segment – “is part of a line that consists of

67
two points, called endpoints, and all points on the line that are between the endpoints”, line –
“extends in one dimension” (Larson, Boswell & Stiff, 2002).
Table 27
Summary of instructional activity responses for student-constructed class
Geometric Term
Conceptual Understanding
Limited Understanding
No Understanding Blank
Segment 11 out of 12 (92%) 1 out of 12 (8%)
Line 9 out of 12 (75%) 2 out of 12 (17%) 1 Ray 10 out of 12
(83%) 1 out of 12 (8%) 1 out of 12 (8%)
Angle 6 out of 12 (50%) 5 out of 12 (42%) 1 out of 12 (8%) Acute Angle 2 out of 12 (17%) 10 out of 12
(83%)
Right Angle 10 out of 12 (83%) 1 out of 12 (8%) 1
Obtuse Angle 4 out of 12 (33%) 8 out of 12 (67%) Straight Angle 6 out of 12 (50%) 4 out of 12 (33%) 2 out of 12
(17%)
Adjacent Angles 6 out of 12 (50%) 2 out of 12 (17%) 2 out of 12 (17%) 2
Complementary Angles 7 out of 12 (58%) 4 out of 12 (33%) 1
Supplementary Angles 5 out of 12 (42%) 5 out of 12 (42%) 1 out of 12 (8%) 1
Vertical Angles 2 out of 12 (17%) 5 out of 12 (42%) 2 out of 12 (17%) 3
Segment Addition 7 out of 12 (58%) 2 out of 12 (17%) 2 out of 12
(17%) 1
Segment Bisector 6 out of 12 (50%) 3 out of 12 (25%) 2 out of 12
(17%)
Angle Addition 11 out of 12 (92%) 1 out of 12 (8%)
Angle Bisector 7 out of 12 (58%) 5 out of 12 (42%) 1 Total -‐ 192 109 (57%) 58 (30%) 14 (7%) 11

68
Figure 2 - Segment, Line and Ray Construction
The first term the students were asked to define was segment, seen in Figure 2. 12
out of 12 (100%) students took advantage of the dragging tool to help them define this
segment. For example, Subject 19 wrote “as you drag it, it moves, it gets bigger and
smaller.” Therefore, she defines segment as being “a line that has two endpoints.” Another
student, Subject 26, defined segment as follows, “Is a part of a line with two points.” The
DGS diagram constructed by the teacher was designed in a way for students to drag the
segment onto the line to see that the segment is part of the line. This design was good for
some students but the way it was constructed led to some misconceptions for other students.
The segment was constructed to be parallel so the students would not intersect the lines and
they could be placed on top of each other. This became a problem with their descriptions as
they moved the segment around. Subject 16 states that the “segment do not intersect” the
line and that it is “also parallel and can get shorter and longer.” Subject 16’s definitions may

69
have been affected by this unintended but visible parallel relationship because her definition
was the only incorrect definition. Subject 25 observes the segment while dragging the point
to reflect that “no matter which point is moved, the segment stays parallel to the line.”
Although, he was discussing the parallel relationship hidden through the construction while
dragging the points his definitions was still sufficient, “a line with 2 endpoints,” unlike
Subject 16 who was completely caught up on the parallel relationship.
The second term the students were asked to describe was line, seen in Figure 2. The
dragging tool of the software was again beneficial for the students, 7 out of 12 (58%) noticed
that “point D does not move, from side to side, it moves up and down” while “point C moves
the line” as stated by Subject 20. 3 out of 12 (25%) were misled by the construction again
and focused their response on the fact that the lines were constructed to be parallel, instead of
the fact that “the line does not end” as stated by Subject 22. Along with Subject 22, Subject
21 also noticed “it goes on forever.” 9 out of 12 (75%) students correctly described line
looking at different aspects. For example Subject 21 noticed that a line is a “ray that moves
on forever both ways.” While Subject 20 stated that a line “is an undefined line that does not
end.” 2 out of the 3 (67%) students who were focused on the fact that the lines were parallel
did not give a description that showed conceptual understanding.
All of the students mentioned dragging points around and never mentioned the fact
that the terms were parallel while defining ray. 10 out of 12 (83%) of the students defined
ray correctly, for example, the definition of ray given by Subject 24 was “a line with a start
point that continues indefinitely from the start point.” 1 out of 12 (8%) students, Subject 19,
left out details needed to make sure she understood what a ray really was, according to her a

70
ray “has two points and one initial point.” This is true, without the mention of the ray
continuing indefinitely in one direction it is hard to say whether see really understood what a
ray was or simply described the picture she observed. 1 out of 12 (8%) students, Subject 23,
showed no understanding by her definition she seems to have gotten confused between
segment and ray; her definition was “the segment becomes part of the line.”
Angle defining
Figure 3 shows the DGS construction for the students to explore and define angle.
When the students drag A or C it changes the degree of the angle and the length of the ray. A
and C can make a full rotation about the point B. When B is dragged the angle diagram
moves. Anytime the angle degree changes the software reports what the exact degree is of
the angle on the screen. While dragging the points around the researcher intended the
students would get to the following definition: angle – “consists of two different rays that
have the same initial point. The rays are the sides of the angle, and the initial point is the
vertex of the angle or as a rotation about a single point” (Larson, Boswell & Stiff, 2002).
Figure 3 - Angle Construction

71
The next term is shown in Figure 3. When the students were asked to drag the point
C around and report what happens 10 out of 12 (83%) of the student’s responses had
something to do with the degree or angle shifting. 2 out of 12 (17%) of the students had
completely different observations. For example, Subject 26 said, “it moves the line” while
Subject 23 said, “the space gets longer or smaller.” 6 out of 12 (50%) correctly defined angle
as in Euclidean geometry yet without the crucial detail of being never ending. Subject 22
said an angle was “the space between 2 lines diverging from a point” and Subject 19 defined
angle as “two rays that are connected at a point.” 5 out of 12 (42%) showed limited
understanding of angle and 1 out of 12 (8%) student’s definition was too vague to determine
any understanding. 11 out of 12 (92%) students could define angle. They were describing
what they saw but not what an angle is conceptually.
Angle classification
The next four terms have to do with classifying angles: acute, right, obtuse and
straight. The vertices of the following angles are fixed. The acute angle is ∠ABC, when you
drag C the angle stays between 1 and 89 degrees yet when you drag A the measure of the
angle does not change. The right angle is ∠DEF, D and F are fixed on a hidden
perpendicular so the points just move along the line and the measure of the angle does not
change. The obtuse angle is ∠GHI, G is a fixed point and when a student drags point I
around the measure of the angle stays between 91 and 179. The straight angle is ∠JKL, all
points are constructed on a hidden line, and the measure of the angle does not change when
you drag any of the points on the angle. While dragging the points around the researcher
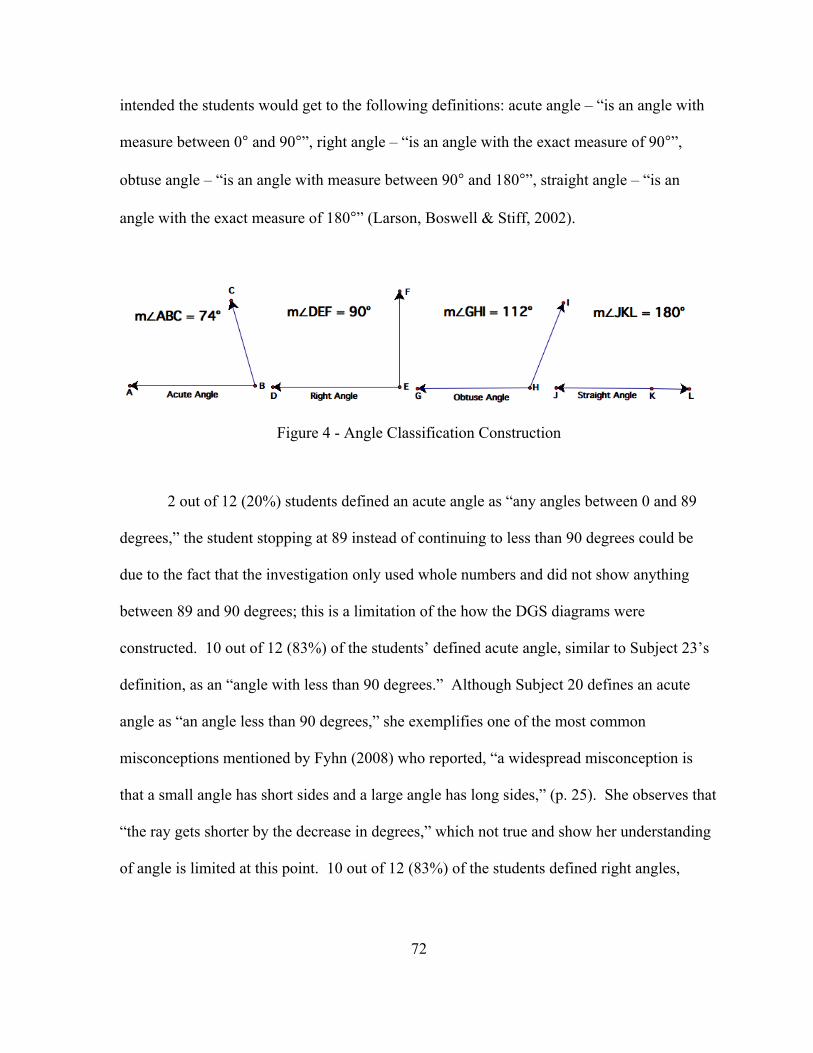
72
intended the students would get to the following definitions: acute angle – “is an angle with
measure between 0° and 90°”, right angle – “is an angle with the exact measure of 90°”,
obtuse angle – “is an angle with measure between 90° and 180°”, straight angle – “is an
angle with the exact measure of 180°” (Larson, Boswell & Stiff, 2002).
Figure 4 - Angle Classification Construction
2 out of 12 (20%) students defined an acute angle as “any angles between 0 and 89
degrees,” the student stopping at 89 instead of continuing to less than 90 degrees could be
due to the fact that the investigation only used whole numbers and did not show anything
between 89 and 90 degrees; this is a limitation of the how the DGS diagrams were
constructed. 10 out of 12 (83%) of the students’ defined acute angle, similar to Subject 23’s
definition, as an “angle with less than 90 degrees.” Although Subject 20 defines an acute
angle as “an angle less than 90 degrees,” she exemplifies one of the most common
misconceptions mentioned by Fyhn (2008) who reported, “a widespread misconception is
that a small angle has short sides and a large angle has long sides,” (p. 25). She observes that
“the ray gets shorter by the decrease in degrees,” which not true and show her understanding
of angle is limited at this point. 10 out of 12 (83%) of the students defined right angles,

73
similar to Subject 24’s definition, “an angle that is exactly 90 degrees.” 1 out of 12 (8%)
student defined right angle as “two perpendicular lines that form an angle that equals 90
degrees at all times.” It is puzzling that Subject 17 would define a right angle this way
considering there were no perpendicular lines on the investigation. 4 out of 12 (33%)
correctly defined obtuse while 8 out of 12 (67%) left important details out of the definition.
For example, Subject 19 defined an obtuse angle as “anything above 90 degrees.”
Looking over the responses from start to finish throughout the instructional activity, it
appears their understanding increases. For example, when Subject 23 moves the acute angle
around she says “the space gets longer or smaller,” but she does not mention degree as the
rest of the students did. Subject 23’s observation while moving the right angle around is that
“it do not move it just go up and down,” here again she is actually looking at the angle, the
entire angle instead of the degree to make her definitions. While she is moving the obtuse
angle around she comments, “the angle gets longer, but not smaller.” With the use of the
software Subject 23 has moved past the misconception that the length of the rays affect the
measure of the angle.
The next definition the students were asked to define is straight angle, as seen in
Figure 3. This was a difficult concept for them, 6 out of 12 (50%) of the students started
using the term line to help define the term, which they had not used for earlier definitions.
The students did not see the difference between a line and a straight angle. A line is an
undefined term that is described as follows: “In Euclidean geometry, a line is undefined.
You can think of a line as a series of points that extend in two directions without end” (Bass
et. al., 2004, p. 734). Differently from a line, a straight angle can be defined as follows: a
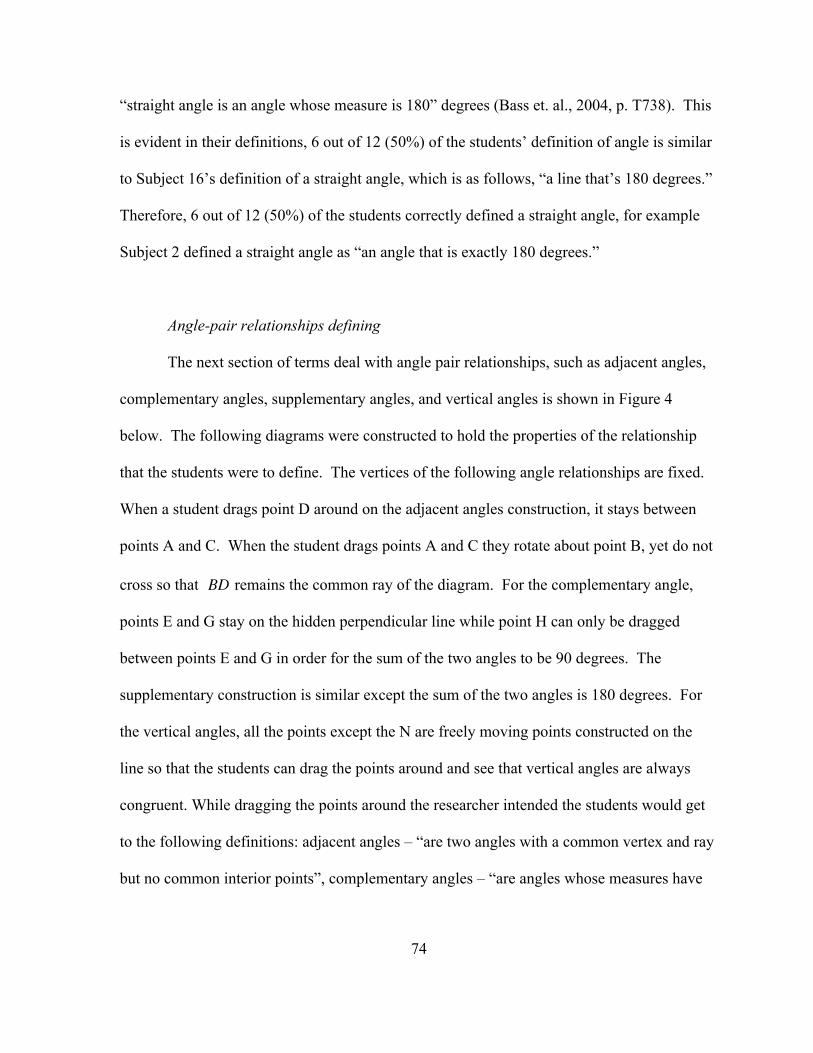
74
“straight angle is an angle whose measure is 180” degrees (Bass et. al., 2004, p. T738). This
is evident in their definitions, 6 out of 12 (50%) of the students’ definition of angle is similar
to Subject 16’s definition of a straight angle, which is as follows, “a line that’s 180 degrees.”
Therefore, 6 out of 12 (50%) of the students correctly defined a straight angle, for example
Subject 2 defined a straight angle as “an angle that is exactly 180 degrees.”
Angle-pair relationships defining
The next section of terms deal with angle pair relationships, such as adjacent angles,
complementary angles, supplementary angles, and vertical angles is shown in Figure 4
below. The following diagrams were constructed to hold the properties of the relationship
that the students were to define. The vertices of the following angle relationships are fixed.
When a student drags point D around on the adjacent angles construction, it stays between
points A and C. When the student drags points A and C they rotate about point B, yet do not
cross so that remains the common ray of the diagram. For the complementary angle,
points E and G stay on the hidden perpendicular line while point H can only be dragged
between points E and G in order for the sum of the two angles to be 90 degrees. The
supplementary construction is similar except the sum of the two angles is 180 degrees. For
the vertical angles, all the points except the N are freely moving points constructed on the
line so that the students can drag the points around and see that vertical angles are always
congruent. While dragging the points around the researcher intended the students would get
to the following definitions: adjacent angles – “are two angles with a common vertex and ray
but no common interior points”, complementary angles – “are angles whose measures have

75
the sum 90°”, supplementary angles – “are angles whose measures have the sum 180°”,
vertical angles – “are two angles whose sides form two pairs of opposite rays” (Larson,
Boswell & Stiff, 2002).
Figure 5 - Angle Pair Relationship Construction
8 out of 12 (67%) students gave a correct definition of adjacent angles, while two of
those students definition was lacking minor details, their understanding was still clear. This
question is the first time the definition of an angle as a rotation was seen in the student’s
responses from both classes throughout the entire study. 2 out of 12 (17%) of the students
mention the rotation of an angle and the sum of a single rotation being 360 degrees. Subject
20 first mentions this rotation with her comment that “the points can increase/decrease and
go 360 degrees around,” as well as Subject 23 who notices that the angles “either increase or
decrease and goes in a 360 degrees.”
The next term that was defined is complementary angles, shown in Figure 5, in which
7 out of 12 (58%) students correctly defined the term. For example, Subject 26 defines
complementary angles as “two angles that is combined makes up 90 degree.” 4 out of 12
(33%) students showed a limited understanding, yet 0 out of 12 (0%) students showed no

76
understanding of this term after the investigation. This is interesting considering the entire
class showed no understanding of the term on the pre-test. Following complementary angles,
the students are asked to define supplementary angle, as shown in Figure 5. 5 out of 12
(42%) students correctly defined supplementary angles while 5 out of 12 (42%) students
showed a limited definition of the term. 1 out of 12 (8%) had an incorrect definition of the
term, for example, Subject 21 defined supplementary angles as “angles formed of one or
more rays off of an obtuse angle.” When it came to defining vertical angles, 2 out of 12
(17%) of the students gave a correct definition, 5 out of 12 (42%) of the students gave a
limited definition and 2 out of 12 (17%) students gave an incorrect definition.
Segment addition postulate descriptions
In this section the students were asked to define applications of segment and angle:
segment addition, segment bisector, angle addition and angle bisector, which are shown in
the following figures. Although, segment addition and segment bisector do not contribute to
the comprehension of angle directly, they are explored in this investigation in order to help
the students understand angle addition and angle bisector. From the researchers experience
of teaching geometry, the students normally have a harder time defining angle addition and
angle bisector, so the researcher decided to have the students define the segment postulates to
lead them to the idea of the angle postulates. In the following figure points B, C, D and E
remain in the order in which they are shown, the students can just drag them between the
points on either side of them. Points A and F extend or shorten the segment. While dragging
the points around the researcher intended the students would get to the following description:
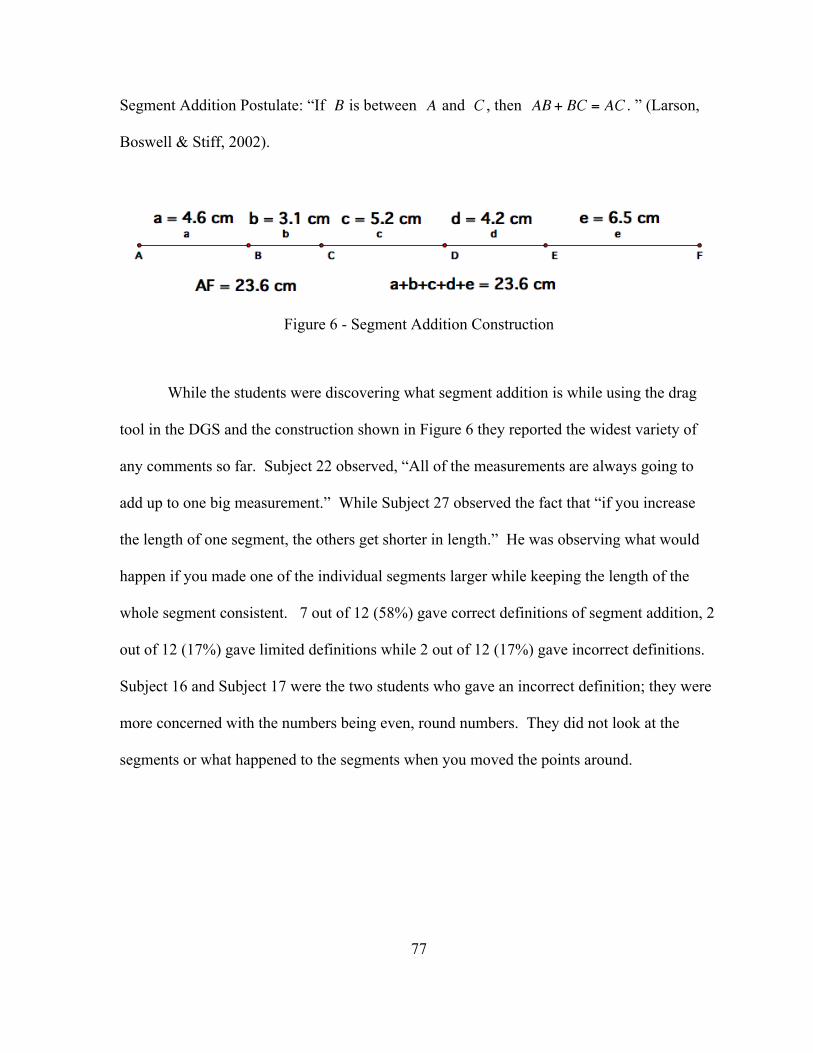
77
Segment Addition Postulate: “If is between and , then . ” (Larson,
Boswell & Stiff, 2002).
Figure 6 - Segment Addition Construction
While the students were discovering what segment addition is while using the drag
tool in the DGS and the construction shown in Figure 6 they reported the widest variety of
any comments so far. Subject 22 observed, “All of the measurements are always going to
add up to one big measurement.” While Subject 27 observed the fact that “if you increase
the length of one segment, the others get shorter in length.” He was observing what would
happen if you made one of the individual segments larger while keeping the length of the
whole segment consistent. 7 out of 12 (58%) gave correct definitions of segment addition, 2
out of 12 (17%) gave limited definitions while 2 out of 12 (17%) gave incorrect definitions.
Subject 16 and Subject 17 were the two students who gave an incorrect definition; they were
more concerned with the numbers being even, round numbers. They did not look at the
segments or what happened to the segments when you moved the points around.

78
Segment bisector descriptions
After segment addition, the investigation guided them to define segment bisector, as
seen in Figure 7. Point B remains the midpoint of , as points A and C simply extend or
shorten the segment. The points on the segment bisector can also move, yet they either rotate
about point B or extend and shorten the bisector. While dragging the points around the
researcher intended the students would get to the following description: “A segment bisector
is a segment, ray, line, or plane that intersects a segment at its midpoint” (Larson, Boswell &
Stiff, 2002).
Figure 7 - Segment Bisector Construction
As the students started to learn what a segment bisector is, they first dragged the
points on the bisector and saw what modifications occurred. Subject 23 said, “The line goes
360 degrees, but stays in the middle when she used the drag feature of the software.”
Another student, Subject 20 observed that the two segments “make up one whole segment.”

79
Then Subject 24 states, “They stay equal to each other.” When combined, the students came
up with some good definitions. For example Subject 24 defined a segment bisector as a
“segment that cuts through a line, whose smaller segments stay equal to each other” and
Subject 25 explained that a segment bisector is “a line that cuts a line in half, and the two cut
pieces are congruent to each other.” 6 out of 12 (50%) provide correct definitions, 4 out of
12 (33%) provide limited definitions and 2 out of 12 (17%) provide incorrect definitions,
these two subjects were concerned about the segment bisector being perpendicular to the
segment, which caused them to define the term incorrectly using supplementary angles. The
construction was not made in this fashion so the students must have made them perpendicular
and then quit using the drag feature of the software and created incorrect definitions.
Angle addition postulate description
After defining segment addition and segment bisector, the students were led to
investigate angle addition and angle bisector in the same fashion they discovered the
postulates before. When a student drags points D and E around they always remain with in
the interior of ∠ABC. Moving points A and C extend the rays or change the degree of all the
angles in the diagram. While dragging the points around the researcher intended the students
would get to the following description: “Angle Addition Postulate: If is in the interior of
, then ” (Larson, Boswell & Stiff, 2002).
It is perplexing how 11 out of 12 (92%) correctly defined angle addition, 1 out of 12
(8%) had limited definitions and 0 out of 12 (0%) had an incorrect definition given the
students observations before they were asked to define angle addition. Subject 22 drags the

80
points and notes that “they do not go higher than 31 degrees, they all equal 40 degrees” along
with 6 other students who are also fixated on the degrees on the screen without dragging the
diagram around.
Figure 8 - Angle Addition Construction
The researcher posits that 5 out of 12 (42%) students did not drag the diagram around
considering the common numbers were 31, 32 and 40 degrees. Subject 25 says that “it don’t
matter where the points are moved ∠ABC = 40 degrees still,” yet he defines angle addition
as “when all angles are added up in one sum.” 8 out of 12 (67%) students defined angle
addition as “adding angles,” yet they were completely concerned with the exact measures
while going through the investigation.

81
Angle bisector descriptions
The final term the students were asked to define was angle bisector. Throughout the
lesson, all students improved their understanding of angle at some point before reaching this
last and final term. When point D is dragged both angles including D remain the same
measure and between ∠ABC. While dragging the points around the researcher intended the
students would get to the following description: “An angle bisector is a ray that divides an
angle into two adjacent angles that are congruent” (Larson, Boswell & Stiff, 2002).
Figure 9 - Angle Bisector Construction
Once the students got past angle addition they started looking more at the angle
instead of just the measurements. Subject 16 notices that “no matter when you move D it
will always be the same measurement, when you move A & C the measurements changes.”
Subject 17 explains that “they still remain equally split. The angle bisector as the out points
are altered.” 6 out of 12 (50%) of the students gave correct definitions, for example Subject
25 said, “A line bisects an angle & makes the 2 angles congruent to each other.” Also,

82
Subject 20 defined angle bisector as “a ray that goes though the middle of an angle.” 5 out of
20 (42%) of the students gave limited definitions, for example, Subject 22 defines angle
bisector as “an angle who is cut in half,” yet the bisector is the actual ray that cuts the angle
in half, not the angle itself.
Use of DGS pre-constructed diagram (TCD) category analysis
After analyzing the worksheets from the instructional activity, the researcher
analyzed each student’s specific responses during three phases of the study. The categories
described in the methodology section and repeated in the tables below. There were two
different set of categories, one for the definition of an angle according to Euclidean geometry
(A) and as a rotation about a point (B).
Table 7
The categories for angle as defined in Euclidean geometry.
Category Definition A0 Subject shows no comprehension of angle. A1 Subject understands angle as a single fixed measurement.
A2 Subject understands angle as multiple fixed measurement, such as right, acute, obtuse or straight.
A3 Subject understands angle as an intersection of two lines, or two lines that meet as a point.
A4 Subject understands angle as a bending line with an array of measurements
A5 Subject shows a complete conceptual understanding of angle as defined in Euclidean geometry

83
Table 8
The categories for angle as defined by a rotation about a single point.
Category Definition B0 Subject shows no comprehension of angle as a rotation about a point. B1 Subject understands angle as a single rotation about a point. B2 Subject understands angle as a variety of rotations about a single point . B3 Subject shows a complete conceptual understanding of angle as a
rotation about a single point.
The worksheet for the instructional activity was broken up into three different phases
for the category analysis: Pre-test & Basic Terminology, Classifications and Relationships,
and Postulates & Post-Test. The basic terminology covers defining segment, line, ray, and
angle. Classifications and relationships include the definitions of acute angle, right angle,
obtuse angle, straight angle, adjacent angles, complementary angles, supplementary angles
and vertical angles. The last section is the post-test and postulates, which include segment
addition, segment bisector, angle addition, and angle bisector. Looking at the students within
each phase of the study demonstrated in which category the student’s responses were
throughout the study, shown in Table 12.
6 out of 12 (50%) students showed an enhanced conceptual understanding of angle
throughout the study. 4 out of 12 (33%) were categorized the same in both the 1st and 3rd
phase of the study, yet each had different results during phase 2. 2 out of 12 (17%) students’
conceptual understanding of angle seemed to decrease as a result of the study. Only 2 out of
12 (17%) of the students mention the rotation of an angle and the sum of a single rotation
being 360 degrees.

84
Table 28
Categorization throughout the teacher-constructed study
Subjects Introductory Terms &
Pre-‐Test Classifications & Relationships
Postulates & Post-‐Test
Subject 16 A0 A2 A2 Subject 17 A1 A3 A1 Subject 18 A1 A3 A4 Subject 19 A3 A3 A3 Subject 20 A3 A2, B1 A3 Subject 21 A2 A3 A3 Subject 22 A3 A2 A3 Subject 23 A2 A4, B1 A3 Subject 24 A3 A4 A5 Subject 25 A2 A2 A3 Subject 26 A3 A2 A1 Subject 27 A1 A2 A3
Subject 20 first mentions this rotation with her comment that “the points can
increase/decrease and go 360 degrees around,” as well as Subject 22 who notices that the
angles “either increase or decrease and goes in a 360 degrees.” This definition of angle as a
rotation about a single point was shown through the instructional activity and this
categorization of the teacher-constructed class for Subject 20 and 22, yet nowhere else in the
study.
Use of DGS pre-constructed diagram (TCD) Pre and Post-test analysis.
According to the mean gain between the Pre- and Post-test this class’s conceptual
understanding of angle showed improvement after constructing the diagrams given the
definitions along with the student-constructed class.

85
Table 29
The teacher-constructed class scores.
Subject Student-‐constructed Pre-‐test Score
Student-‐constructed Post-‐test Score
Student-‐constructed Gain Score
Subject 16 4 7 3 Subject 17 4 5 1 Subject 18 10 12 2 Subject 19 6 11 5 Subject 20 8 9 1 Subject 21 8 11 3 Subject 22 6 7 1 Subject 23 6 5 -‐1 Subject 24 7 15 8 Subject 25 5 9 4 Subject 26 6 5 -‐1 Subject 27 2 11 9 Total 72 96 35 Average 6 8 2.92
Looking at the data you can see that the class as a whole increased by an average of
2.92 points per student. 10 out of 12 (83%) students improved their score while 2 out of 12
(17%) students’ scores decreased. When you look at the mean gain score for females and
males, the results are interesting. The female mean gain score is 1.75 while the male mean
gain score is 5.00. Although the mean gain score is higher, one cannot say that it was
significantly better for males.
According to the paired t-test the males in the TCD group did have a lower p-value
yet not low enough to claim significance. This may be due to the few number of male
students in this class. Comparing the gain scores for above average performing students and
below average performing students, a difference in mean gain score is also observed. The

86
above average students mean gain score was 3.375, while the below average student’s mean
gain score was 1.75. The software was beneficial for both groups since both above average
and below average students mean score was increased, yet it was more beneficial to the
above average students. As mentioned in the results section of the student-constructed class
category section, this may also be contributed to the fact that they are above and below
average students and their level of effort and questioning with the software would be
different for each class.
The students definitely showed a better understanding of angle pair relationships after
the instructional activity in the teacher-constructed class. Before the instructional activity on
the pre-test all 12 out of 12 (100%) students did not know how to draw complementary
angles, on the post-test only 1 out of 12 (8%) student did not know how to draw
supplementary angles, and the exact same result is observed in the student-constructed class.
The students’ conceptual understanding of angle also showed improvement after the
instructional activity. On the pre-test 5 out of 12 (42%) students showed complete or some
conceptual understanding of angle. On the post-test 7 out of 12 (58%) students showed a
complete or some conceptual understanding of angle. According to the student’s answers on
just this question, defining an angle, 2 out of 12 (13%) showed less conceptual understanding
according to their definition. Therefore, after the instructional activity 10 out of 12 (83%) of
the students showed some conceptual understanding after the instructional activity as
opposed to the 6 out of 12 (50%) before. The class’s overall conceptual understanding
apparently improved.

87
Clinical Interviews
5 students participated in clinical interviews. The interview protocol can be found in
Appendix G. Following is a brief discussion of the interviews. The first three subjects are
from the SCD class and the 4th and 5th subjects are from the TCD class.
Subject 5 – Student-constructed class
When Subject 5 was asked to define angle in his own words he said, “Where two
straight edges meet.” In task two he was asked to find all of the angles within some given
shapes. He correctly found all of the angles in the shapes with straight edges and pushed the
curved shapes aside. The following transcription involves the curved shapes found in Figure
9, which can also be found in Appendix H.
Figure 10 - Interview Curved Shapes
Interviewer: So why are there no angles in those?
Subject 5: They don’t meet at a point. There’re rounded.
Here we can see that Subject 5 does not see an angle in a curve, yet if the shape has straight
lines and meet at a point, he says the shape has angles. He continued to correctly classify the

88
remaining angles in the shapes on the table. The third task had to do with the instructional
activity in the lab. Subject 5 was in the student-constructed class and he enjoyed the
experience as shown in the transcription below:
Interviewer: Do you remember the dynamic geometry software we used in the
lab?
Subject 5: Yeah.
Interviewer: All right, so how did you like using that software?
Subject 5: I liked it more than drawing them because it gave you the numbers and
it seemed to fit together better than drawing them.
Interviewer: Did the software help your understanding of angle?
Subject 5: Not really, it was just like drawing them on the computer.
Interview: So why didn’t it help?
Subject 5: It wasn’t a different way of looking at it, it was just doing the same
thing a different way.
One can see that after drawing the figures on the computer Subject 5 did not drag the objects
around and take advantage of the software. Also, when asked if he liked dragging the objects
he said, “yes, you did not have to redraw them” which sounds like he did not use the
dragging feature of the software for the correct purpose of the feature. At this point it is not
clear if he used the dragging tool to explore the objects or to have a correct diagram.

89
Subject 3 – Student-constructed class
Subject 3 defines angle “as a line that has a certain degree.” When the interviewer
asked her to explain an angle further she drew an example of a right, obtuse and then acute
angle. When asked why she defined angle the way she did, she said, “These are like the
main three angles we learn about.” At this point in the interview, the researcher wonders if
the students, including Subject 3, who mention the measurements when defining angle see
the three classifications as separate definitions of angle and do not understand that an angle is
an array including the three different types.
Throughout all the tasks, Subject 3 focused on the measure of the angle versus an
angle as an array, even when given a pivoting angle she used the protractor and never
mentioned an array of measurements, just the classifications, or definitions, she had used
previously. When she was asked about the lab activity she said, “It was fun”. When asked
what she remembered most about the activity she said:
Subject 3: Um, we connected points and angles together. By using, I don’t know
what it is called, its like um, it was like just a plane slide thing and we put
points on there and connected them together and made triangles and
shapes and stuff.
Interviewer: Did the software help your understanding of what we were covering?
Subject 3: Yeah.
Interviewer: How?
Subject 3: Because um usually when we write it down its like, its just there. Like
you can just erase it and make it something else. But on there it showed

90
that this is it, you can change it by keeping it in the same spot. Like on the
software it showed like if you just move one point it will just drag it on,
but with a pencil and paper you can erase it and you wont see the effect of
it.
This statement shows the benefit of using the DGS. She mentioned that on paper you would
have to erase the figure and redraw a figure, yet with the DGS she could drag the points and
see the effect it would have versus erasing the shape and never seeing that relationship.
Subject 9 – Student-constructed class
Subject 9’s definition of angle was “a measure in which two lines come to a point.”
When asked why he defined angle this way he said, “Because when two lines come to a
point, even if it is a straight line, it is still a degree.” Subject 9 thought the software was a
little difficult.
Subject 9: It helped in some ways but it is difficult to, um, have more room to do
other angles and stuff you would have to click and do all these different points
and then you click clear and it just disappears. Its kind-of like, it definitely
helps just a little hard to use.
Subject 9’s statements here shows that the student-constructed class also benefited from the
use of the DGS yet it was more difficult for them due to the fact that they had to learn the
software and then construct the terms, whereas the teacher-constructed class did not need to
be extremely familiar with the software to explore their instructional activity. He said the
software helped his understanding of angle, but that he would not use it in the future because

91
he did not know the software very well. It has been previously mentioned that the researcher
did not think the students in the student-constructed class were using the dragging tool as
much as the teacher-constructed class. This was shown though the interviews, Subject 9 or 5
did not mention the dragging tool or the change effect it had on the shapes as Subject 3 did.
Subject 20 – Teacher-constructed class
The fourth student interview was conducted with Subject 20, who was in the teacher-
constructed class. She defined angle, as “an angle is a line that is bent to a degree, because
its like to arrows that are infinitive, that keep going and are bent together.” She discussed
how a straight line is 180 degrees and a bending line is the degrees between the two rays.
She used her hands to show the array of an angle, since she did not use acute, obtuse or right
to define angle and demonstrated an array of measurements she would showed a deeper
understanding of angle than the other three interviews mentioned above who never
mentioned an array of measurements. Also, when asked about the software she said she
enjoyed the software because you could see how far an angle could go and it helped her
define the different types of angles.
Interviewer: What do you remember most about the activity?
Subject 20: “Um, how we were able to keep moving the lines up and down and
how far they can go, if they are infinitive or not.”
Here the mentioning of the dragging tool being very useful shows how dependent the
teacher-constructed class was upon the dragging tool and how beneficial it was to their
understanding of the terms they were dragging to define.

92
Subject 27 – Teacher-constructed class
The last interview to be discussed is another student from the teacher-constructed
class, Subject 27. The interview starts out by asking him how to define angle as with all the
other interviews and his response was as follows:
Interviewer: Can you define angle in your own words?
Subject 27: It is basically a bend in a line, so it becomes two rays coming out of a
single point.
In task two, Subject 27 was asked to show the researcher all the angles in the octagon. He
pointed out the angles correctly, and took the task a step further. He asked if he could draw
on the shape and came up with the following:
Subject 27: Or if you are thinking in having the different lines of symmetry in it. It
would also be a lot of angles in the center.
Here he drew all the lines of symmetry and showed all the angles in the middle of the
octagon where the lines of symmetry met. Unlike the other students, Subject 27, took each
task beyond what the researcher was asking. Also, when he was working on Task two and
got to the curved shapes his responses to knowing if the curved objects had angles was
interesting.
Subject 27: This one has no straight angles, because it has curves instead of
points. (Holding the rectangular shape with rounded edges.)
Interviewer: Ok, All right. So are those not angles? (Pointing at the curved
edges.)

93
Subject 27: Um, well I count them as no angles, but I am sure that if you looked at
it extremely closely, like every curve is like a minuscule, to a smallest
decimal straight line, so that there would be millions in that though, but it
is too hard to count so… so it doesn’t matter. (He discarded the shape
down on the table and picked up the next shape.)
Subject 27: Uh, this one is a trapezoid. It has, well like that one, it has four
different angles, unless you count the over 180-degree ones, it would have
eight because it would be on the outside too.
Interviewer: Ok, ok. What do you mean be on the outside?
Subject 27: It would be on the outside how these other angles on the inside of the
trapezoid. They would be on the outside; they wouldn’t be on the face of
the trapezoid.
His comments show that he not only conceptually understands angle, he also understands that
two rays and a single point in fact create two angles in stead of the misconception that most
students hold in which they believe only one angle is created by two rays and a single point.
This did not come out in any of the previous materials, but after this interview his answers
would be classified A5 (Subject shows a complete conceptual understanding of angle as
defined in Euclidean geometry) and B1 (Subject understands angle as a single rotation about
a point) due to his ability to recognize, define and describe all different kinds of angles. He
was the only student in the entire study to mention an angle bigger than 180 degrees on the
outside of a shape, corresponding with the angle on the inside of the shape that was less than
180 degrees. Soon after these comments, he brought up the straight angles on the shapes. He

94
said it was hard to tell if they were 0 degrees, a line, or 180 degrees, an angle, by looking at
the shape. When asked to show what the difference would be, he drew a line and said this is
a line, 0 degrees, and then he put a point in the middle to make it an angle with 180 degrees.
During Subject 27’s interview, he mentioned that the software was fun but he said
that the software really did not change his understanding of angle, as he also mentioned in his
instructional activity.
Interviewer: Do you remember the dynamic geometry software instructional activity
we completed in the lab?
Subject 27: Yes.
Interviewer: All right, how did you like using that software?
Subject 27: Fun, It was uh, I knew a bunch of the stuff, it was pretty easy to figure
everything out because it would usually tell you what the angle is and uh,
it is easy to find out the property because you know you could just tell by
looking at the measurements it has at the top of the screen. Also it was
fun to play with because you just move the mouse around and mess with
the angle. And move some of the angles around to make a picture; I did
that when I was done.
Later Subject 27 was asked if the “moving” as he called it helped him and how. He
explained how he did not know what complementary and supplementary waere, but when he
tried to move something and it would not move, he knew it had to stay that way.

95
Interview Summary
After looking at all the interviews, the two students in the teacher-constructed class
did show a deeper understanding of angle and mentioned using the dragging tool more often
to figure out different properties of the shapes. The interviews results supported the
qualitative data, it showed that both classes improved their understanding of angle after the
instructional activity, enjoyed their experience with the software, enjoyed being able to move
things around and not be constricted to a piece of paper, and how the teacher-constructed
class experienced more success with the software.
Summary
After analyzing the pre-test, instructional activity, post-test, gain scores, and
categorization of students it is evident that both classes improved their level of understanding
of angle, yet the teacher-constructed class improved more. When it came to looking at the
results from the responses of the subjects by gender, the female students improved
significantly in the student-constructed class as well as in the teacher-constructed class. The
males in each class did not improve significantly even though their mean gain score shows
some improvement; it was not enough to declare significance. It is interesting that the two
different instructional activities were completely beneficial to opposite sexes. When it came
to looking at the results from the responses of the subjects by class performance the results
were less interesting. The above average group improved significantly for both instructional
activities while the below average group barely improved. This is what one would expect
from an instructional activity, it could have been due to the fact that the majority of above

96
average students have more drive than below average students so they could have been more
focused on the instructional activity. Although below average students barely improved, the
teacher-constructed below average students did increase their mean score more than the
student-constructed below average students.
Looking at the results from the instructional activity for each group and comparing
them one can see that the two instructional activities differed greatly. When it came to
defining the first term, segment, around the same percentage of students correctly defined
segment in both classes. Looking at the descriptions of line, 53% of the student-constructed
class correctly described line compared to 75% in the teacher-constructed class. The teacher-
constructed class also had a high percentage when defining ray, although the student-
constructed class was not far behind. This trend that the teacher-constructed class had higher
percentages than the student-constructed class continues and is shown in Table 30. For the
majority of the terms, the teacher-constructed class had more correct definitions, besides
acute angle and segment addition. For 3 out of the 16 (19%) terms that were defined, the
student-constructed class had a higher percentage. For 13 out of the 16 (81%) terms that
were defined, the teacher-constructed class had a higher percentage. From this it is evident
that the teacher-constructed class was more successful at their instructional activity.
Analyzing the categories between the student-constructed (SCD) class and the
teacher-constructed (TCD) class one can see that 40% of the students in the student-
constructed class showed an improvement in their conceptual understanding of angle while
50% of the students showed an improvement in their conceptual understanding of angle in
the teacher-constructed class. 27% of the students’ conceptual understanding of angle
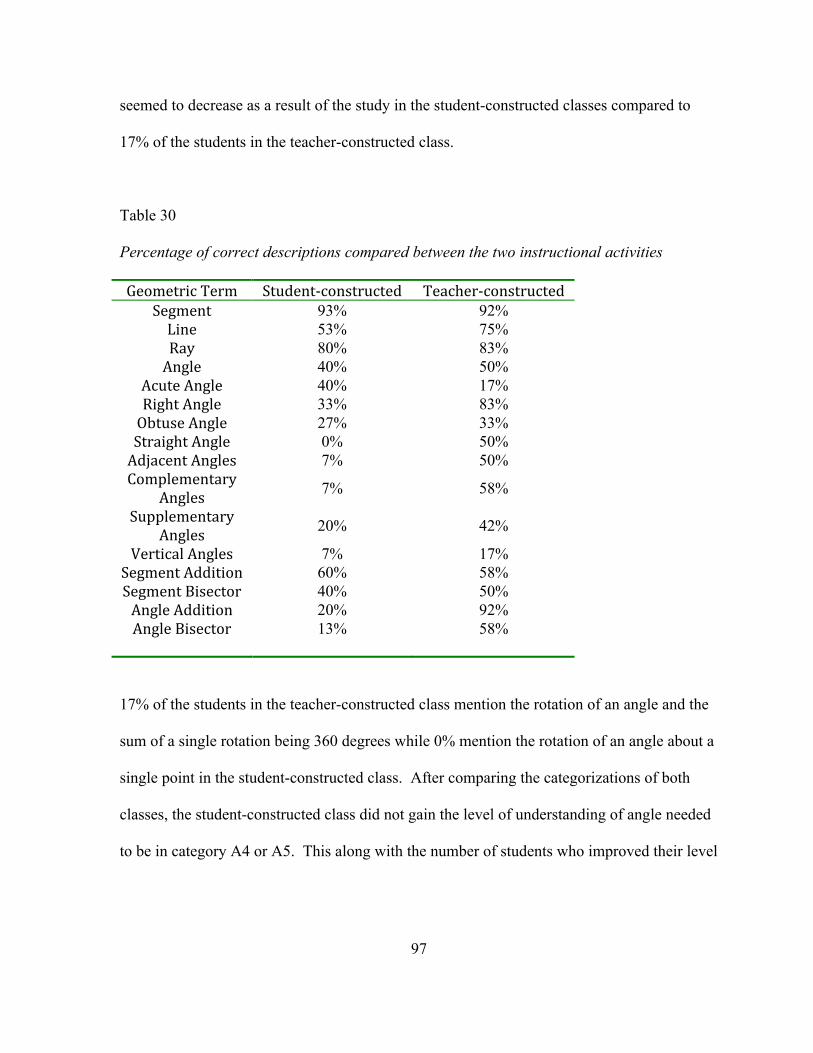
97
seemed to decrease as a result of the study in the student-constructed classes compared to
17% of the students in the teacher-constructed class.
Table 30
Percentage of correct descriptions compared between the two instructional activities
Geometric Term Student-‐constructed Teacher-‐constructed Segment 93% 92% Line 53% 75% Ray 80% 83% Angle 40% 50%
Acute Angle 40% 17% Right Angle 33% 83% Obtuse Angle 27% 33% Straight Angle 0% 50% Adjacent Angles 7% 50% Complementary
Angles 7% 58%
Supplementary Angles 20% 42%
Vertical Angles 7% 17% Segment Addition 60% 58% Segment Bisector 40% 50% Angle Addition 20% 92% Angle Bisector 13% 58%
17% of the students in the teacher-constructed class mention the rotation of an angle and the
sum of a single rotation being 360 degrees while 0% mention the rotation of an angle about a
single point in the student-constructed class. After comparing the categorizations of both
classes, the student-constructed class did not gain the level of understanding of angle needed
to be in category A4 or A5. This along with the number of students who improved their level
98
of understanding throughout the study shows the efficiency of the teacher-constructed class.
The teacher-constructed class seems to be more efficient and this was proven with the results
of the quantitative analysis.
Student’s thoughts about the software and the instructional activity
Each class was asked three questions at the end of their instructional activity about
the software which they used in the study. The students from the student-constructed class
reported that they had complications with the software. 10 out of 15 (67%) of the students
responded that the software was difficult at times. For example Subject 3 expressed that they
had complications “because I did not understand the words and remember how to draw
everything out.” Subject 4 also said yes to this question and that “I had to learn how to create
the shapes and get used to the buttons.”
The remainder of the students who had some complications centered their responses
on not remembering the terminology. For example Subject 14 wrote, “Yes, this was hard I
did not know most of the terms or how they look.” Also, Subject 13 reported, “yes, because I
didn’t know what the pictures were supposed to look like,” “I like it but I don’t like doing
vocab in the computer.” 3 out of 15 (20%) students left the question blank and 1 out of 15
(7%) students said no. For the teacher-constructed class 7 out of 12 (58%) students also
agreed with the student-constructed class, although they did have fewer difficulties. Some of
the difficulties for the teacher-constructed class were expressed by Subject 3, “the auto
rounding to the sum and limited activity on something’s, but it told us that the optional
answer was incorrect” and Subject 2, “It would not do things I thought it would do.” Subject

99
12 had a hard time because “sometimes the lines won’t move when you drag them.” 5 out of
12 (42%) of the students showed no difficulties with the software. Subject 8 said “we did not
have any,” the rest said no or nothing, not a lot of elaboration was given. The teacher-
constructed class reported less difficulty than the student-constructed class, this may be due
to the fact that they did not construct anything; therefore they did not need to know the
software as well as the student-constructed class.
Another question the students were asked is if they understood the terms better after
the instructional activity. Within the student-constructed class 9 out of 15 (60%) said that
they did understand the terms after the construction. 3 out of 15 (20%) said no and 3 out of
15 (20%) left the question blank. Subject 4 said, “Yes because seeing them is better than
hearing about them.” While Subject 14 said, “I still do not know how they looked.” Subject
13’s response was very interesting; she said, “a little bit I guess. I’m understanding that it’s
kind of like you have to use the context clues and put things together to know how to make
them.” Subject 13 improved 5 gain score points and started the instructional activity at A0
and finished the instructional activity at A2. This method was a good method for her.
It was already mentioned that females performed better with this instructional activity
than the teacher-constructed. Within the teacher-constructed class 9 out of 12 (75%) said
they did understand the terms better after dragging the constructions around, 3 out of 12
(25%) disagreed. According to the three students who did not gain a better understanding of
the material after the instructional activity “It was hard” (Subject 21), “It was complicated to
me” (Subject 18), and “It only lets you drag points around and does not define anything”
(Subject 27). Subject 16 completely disagreed with Subject 27, she said, “the movements of

100
each points help me figure out what to do.” Not only is the dragging feature of the software
beneficial for conceptual understanding, Subject 17 expressed, “I learn better with visual
examples.”

101
CHAPTER 5
DISCUSSION AND CONCLUSION
This study was conducted to see if dynamic geometry software aided students’
conceptual understanding of angle and analyze how to best use this software to help students.
Different sets of instructional activities were given to two academic geometry classes to see
how students worked with the software and study if their knowledge deepened as a result of
how the DGS was used in the classroom. In this chapter, answers to both research questions
will be discussed as well as the limitations of the study, the implications of the study for
teaching purposes, and future research that can extend the results shown in this chapter.
First Research Question
How do students learn the concept of angle supported by the use of dynamic geometry
software and does the use of dynamic geometry software support diverse subgroups of
students differently?
According to the mean gain score for each class the instructional activities with the
use of DGS helped the students gain insight into the concept of angle, which may not have
occurred without the use of the software. 92% of the definitions given by the teacher
constructed (TCD) students showed some conceptual understanding of the concept they were
defining, which was the exact same percentage as seen in the student constructed (SCD)
instructional activity results. This shows that the software was a beneficial learning tool for

102
both classes. The majority of all the students from each group felt the software was a great
aid to their educational experience. Within the SCD class 60% of the students said that their
understanding of the terms was enhanced after the construction, 58% of the students in the
TCD class also made similar statements. After the TCD instructional activity 80% of the
students showed some conceptual understanding of angle as opposed to the 40% before. The
TCD class’s overall conceptual understanding of angle improved.
After looking at the value of the software for each group of students, the researcher
divided the groups into subgroups and tested if their difference in understanding was
significant after the use of the software. The subgroups consisted of females vs. males,
minority vs. non-minority, and the age of the students. Based on the results of the t-test
conducted for each group of female students, the software was beneficial and significant in
helping their understanding of angle. On the contrary the t-test for each male group showed
that the software had little influence on the students conceptual understanding according to
their mean gain score from the pre-test to the post-test. Looking at the results from the t-test
for the minority students for each group, one can see that the instructional activity was
obviously beneficial for their understanding unlike the results from the non-minority students
who did not improve as much. After analyzing the results from the t-test for sophomores and
juniors it is evident that the sophomores improved significantly where the juniors did not.
Therefore, the use of the software was more beneficial for the younger students of the class.
This is a topic that could be researched further. At what age should the use of DGS be
introduced into the classroom? More research could say at what age the software is most
beneficial.

103
All of the students dramatically improved their understanding of many terms,
especially angle pair relationships; this is shown throughout the analysis of the pre-test
compared to the post-test. One term the students were asked to draw on the pre-test was a
pair of complementary angles. All of the students incorrectly drew a pair of complementary
angles on the pre-test, while 58% students correctly defined the term during the instructional
activity. While 58% of the students showed a correct diagram for complementary angles, a
relatively low percentage, all of the other students showed some conceptual understanding of
complementary angles yet lacked important details such as points, rays and more. This shows
how beneficial the software is for students’ conceptual understanding of geometric terms
considering the entire class showed no understanding of the term on the pre-test.
The software was an important teaching tool yet the SCD class struggled whereas the
TCD class did not report a high level of difficulty using the software. It was more difficult
for the SCD class due to the fact that they had to learn how to use the software while learning
what the terms looked like in order to be able to construct the terms, whereas the TCD class
did not need to be extremely familiar with the software to explore their instructional activity.
Being unfamiliar with the software created some frustrations throughout the activity. 67% of
the students responded that the software was difficult at the beginning of the instructional
activity. “It has been often reported that beginners have difficulty in constructing diagrams
in a DGE that is resistant to the drag mode (i.e. preserves relationships upon dragging) and
resort to construction strategies by eye” (Healy, Hoelzl & Hoyles, 1994). Although, the
software used in the study did have the drag mode, the SCD class was not as apt to use the

104
drag mode. Therefore they demonstrated less conceptual understanding than the teacher-
constructed class, which was totally dependent upon the drag mode.
The researcher hypothesized the students would analyze the terms in order to
determine the correct diagram, thereby gaining a deeper understanding of the material, but
this was not the case. The TCD class did analyze the diagrams using the drag mode, yet the
SCD class was reluctant to use the drag mode after creating their own diagrams. Once they
had a sufficient diagram they moved to the next term instead of investigating their current
diagram to gain insight about the term not given in the definition. The remainder of the
students who showed some complications centered their responses on not remembering the
terminology. Within the TCD class 75% of the students said they did understand the terms
better after dragging the constructions around. Not only is the dragging feature of the
software beneficial for conceptual understanding, the visual representation of the different
introductory terms of geometry are also beneficial according to the student responses. If the
researcher had probed the students to analyze their diagrams more, the results for the SCD
class may have differed in significance.
Dynamic geometry software was beneficial for students’ conceptual understanding of
angle in most cases based on their gain score, the paired t-test data, or the student responses:
pictorially, written or orally. The DGS used in this study was shown to be beneficial for
students’ conceptual understanding of angle using the definition of angle given by Euclid
(1956). Only a few students showed a better understanding of angle as a rotation while using
the software, this was a limitation of the instructional activities that will be discussed in the
following sections.
105
Additionally, no students demonstrated a better understanding of angle in a curve
during the instructional activity, yet one student did show some conceptual understanding of
angle in a curve during the interview process. The DGS has a variety of tools that were not
used in this study that could help students understand angle as a rotation and angle in a curve.
The instructional activity could have led the students to use the drag mode of the software to
drag the rays around a point to better understand angle as a rotation. The software could
have also been used with sine or cosine functions to investigate angle in a curve, yet
geometry students are not familiar with these graphs as they enter their geometry classroom.
Therefore, the software was shown to be beneficial for students’ conceptual understanding of
angle as defined by Euclid and could be used to understand angle as a rotation and in a curve.
Second research question
How is student learning of angle influenced by the use of student-constructed diagrams
compared to the use of teacher-constructed diagrams using dynamic geometry software?
The pictorial representations created by the SCD students with the help of the
software was beneficial, especially since some of the terms were completely new information
to the students, as they had not covered it in previous mathematical courses. The pre-
constructed diagrams the TCD class used to define the introductory terms helped them
visualize and define the terms with the use of the software and its many features. Although
each instructional activity had its own instructional advantages, according to the mean gain
scores and the paired t-test conducted on the data the TCD group improved significantly
where as the SCD group did improve, but not significantly.

106
The TCD class as a whole increased their mean gain score by an average of 2.92
points per student where as the mean gain score for the SCD class is 1.53. 83% of the TCD
students improved their score while 17% of the students’ scores decreased. Within the SCD
class the results were considerably lower. 47% of the SCD students improved their score
while 27% of the students’ scores decreased. According to the paired t-test the SCD class
did not improve their understanding of angle significantly, yet they did have a positive mean
gain score meaning that the class on average deepened their conceptual understanding of the
concept. Differing considerably from the SCD class was the TCD classes mean score.
According to the paired t-test computed with this data the instructional activity given to the
TCD class deepened the students understanding of angle with a 95% confidence level.
When it comes to the categorizations of the students for each group the same trend
appears. The TCD class reaches more categories of understanding and the calculated
percentages are higher for the TCD class. 50% of the students in the TCD class improved
their conceptual understanding of angle throughout the study while 40% of the SCD students
showed an improvement in their conceptual understanding. 17% of the students in the TCD
classes’ conceptual understanding of angle seemed to decrease as a result of the study while
27% of the students in the SCD class decreased. These decreased percentages were the same
for both categories and mean gain scores fro the pre-test to the post-test. When one looks at
the actual categories reached by the different groups of students it was evident that the TCD
group showed a deeper understanding of angle.
The TCD class reached levels A4 (Subject understands angle as a bending line with
an array of measurements), A5 (Subject shows a complete conceptual understanding of angle

107
as defined in Euclidean geometry), and B1 (Subject understands angle as a single rotation
about a point), which the SCD did not reach. No SCD students mentioned angle as a single
rotation being 360 degrees while 17% of the students in the teacher-constructed class did
mention angle by this definition. The researcher attributes this to the amount of students who
took advantage of the dragging tool in the TCD group, which was apparently higher than the
SCD group. According to the quantitative and qualitative data it is evident that the TCD
class was more successful using the software with their instructional activity and the pre-
constructed diagrams.
When it comes to looking at the terms individually for each group of students, the
TCD class had more correct definitions that the SCD class had correct diagrams. The second
question on the post-test asks the students to draw their own diagram of an angle; this
question leaves you pondering if the software is beneficial for the comprehension of angle.
33% students improved their diagram of an angle to include the details needed to draw a
correct diagram. 0% students drew a less detailed diagram after using the software. This
was contradictory to the SCD group in which 27% students drew less detailed pictures after
the use of the software.
The pattern of lacking details seen with the SCD group was not as prevalent in the
TCD group. On the pre-test the students were asked to draw a 30 degree angle, on the post-
test the students were asked to draw a 120-degree angle. For this question 60% of the
students in the SCD group drew less detailed pictures. They left out important details to an
angle such as points and rays on the post-test which they included on the pre-test. For the
TCD group only 16% of the students drew less detailed pictures while 4 out of 12 (33%)

108
drew more detailed pictures. Here a trend between the two different instructions is starting to
appear. The students in the TCD group are adding details to their diagrams and definitions
where the students in the SCD group are leaving out details they once knew were important.
“Students can use dynamic software to construct and manipulate their own diagrams”
(Sinclair, 2003, p. 289). The SCD students were not completely perfect with constructing
their diagrams so they developed some misconceptions if they did drag the diagrams around.
This may have contributed to the level of significance and the lack of detail seen in the SCD
class results.
According to these results the pre-constructed diagrams were more beneficial for
entry-level geometry students, which might not be the case for upper level students or adult
learners using the software. This issue of pre-constructed diagrams vs. constructed diagrams
needs to be researched for all ages because constructed diagrams have been proven important
to the study and learning of geometry, yet for this age the pre-constructed diagrams were
more apparent.
In summary, the software was more beneficial for the teacher-constructed class than
the student constructed class no matter if the student was male or female, minority or non-
minority, or if they were a sophomore or a junior. Therefore, dynamic geometry software
would be best used in the classroom with teacher-constructed diagrams with similar
conditions as the study conducted at hand. It cannot be said that teacher-constructed
diagrams would always be more valuable. Research could be done with the student-
constructed class using students who were more familiar with the software to determine if
their performance would have matched the performance shown in this study. More research

109
is needed to answer this question definitively, yet for this study, and for other classrooms
with similar dynamics, teacher-constructed diagrams were shown to be more advantageous to
promote student conceptual understanding of angle.
Limitations
Throughout the study, limitations were found throughout in the instructional activities
and the analysis. This study needed a collaboration of multiple different resources and
factors to benefit all students and improve each student’s conceptual understanding of angle,
considering the goal is to have the students’ gain a deep conceptual understanding of angle as
multiple definitions. Hollebrands (2008) explains how improving students’ conceptual
understanding takes more than a good instructional activity in order to get successful results.
“It must be stressed that it results from the conjunction of the use of a DGS, of a careful
design of the teaching/learning situations and of the tasks, of the social organization, and of
the role of the teacher” (Hollebrands, Laborde & StraBer, 2008, p. 186).
While the researcher took all of these elements into account while designing the
instructional activity and the use of software for the study, more could have been done to
ensure more accurate results. While analyzing the different factors of this study some
limitations were found throughout the instructional materials and the analysis of the data,
which is explained in the following sections.

110
Limitations of the materials
The limited introduction of the software given by the teacher and present on the
instructional activity caused some frustration at the beginning of the instructional activity but
the frustration diminished as the students progressed through the first few definitions. In a
different setting, where the students are not discovering the preliminary terms of the high
school geometry curriculum, which are also key elements of the software used in the study, it
would be valuable for the students to have a day or two involving activities in which their
sole purpose would be to familiarize them with the technology so they can benefit from all of
its capabilities.
One of the most advantageous components of the software is the use of the drag
mode. The percentage of students who used the dragging tool was not consistent throughout
both instructional activities. The students in the student-constructed class did not take
advantage of the dragging abilities of the DGS while the teacher-constructed class utilized
the tool to discover the definitions in their investigation. Since the SCD students were to
create a drawing, most of them stopped using the software after creating the diagram. Unlike
the TCD class that used the dragging tool for exploration, the SCD class did not use the tool
to explore their constructed diagram of the term with the use of the software. Some of the
SCD students simply drew the constructions as if they were using pencil and paper and did
not take advantage of the software and its many capabilities. Even though the SCD
instructional activity asked about any new findings found after drawing the diagram, the
students did not investigate their own drawings. The instructional activity should have

111
pushed them to use the dragging feature of the software in order to have significantly
improved their understanding of angle.
Due to the limited introduction of the software and the students’ lack of knowledge
from previous mathematics courses for the terms needed to construct the new ideas of the
curriculum. For example, all of the students had a difficult time constructing a straight angle
and being able to tell the difference between their diagram and a line. This result may be
contributed to the software considering students could create what looks like an angle by
simply constructing two lines and intersect them. This would lead them to believe that an
angle does not need a point in which to rotate around to form an angle. This misconception
could lead to the misunderstanding of a straight angle because without the important pivoting
point of the straight angle it would be difficult to describe the difference. This would be due
to another limitation of the DGS; when an angle is constructed and rotated above 180
degrees, the measurement of the angle decreases after rotating 180 degrees and does not
show the students a full rotation about a single point. Due to this limitation of the
software, the instructional activity did not provide a way for the students to define angle in
multiple ways to see if they understood a variety of angle definitions rather than the
definition stated in Euclidean geometry. When it comes to defining angle as a rotation about
a point, the limitation of the software prevented the majority of students from looking at an
angle as a rotation about a single point. Here some other materials should have been
introduced into the study to gain this understanding of angle. When it comes to angle in a
curve, the DGS could have been used, yet the investigation did not open up this opportunity
to the students.

112
Another limitation of the teacher-constructed activity was the way in which some of
the diagrams were constructed. In order for the students to be able to correctly define
segment and ray as being part of a line, the terms were constructed to be parallel so when a
student would drag a segment or ray to the line they would appear to be apart of the line.
This confused some of the students and they felt that being parallel was important to
definition of the terms, which is not the case. Another limitation of the constructions was
how the acute and obtuse angles were created to always hold their properties. Right angles
(angles equal to 90 degrees) were used to make the angles hold their properties by never
getting greater than 90 degrees (acute) or smaller than 90 degrees (obtuse). While creating
the different classifications of angle the researcher noticed that the measure of the angle may
have been misleading since the construction didn’t show that an acute angle was anything
less than 90 degrees but greater than 0 degrees and that an obtuse angle was anything greater
than 90 degrees while not exceeding 180 degrees. So the researcher decided to use whole
numbers. This was not a good decision considering the students in the TCD class defined
acute angles as being from 0 to 89 degrees instead of being less than 90 degrees. This
limitation could explain why the SCD class defined acute and obtuse more accurately than
the TCD class.
While comparing the pre-test and the post-test, the researcher discovered that
question 8 of the post-test differed greatly from the pre-test, therefore resulting in the
elimination of the question for the analysis. Also, the pre-test and post-test did not analyze
student understanding of angle as a rotation about a single point or in a curve. This was also
seen through the analysis of the worksheets used in the instructional activities for both

113
classes. Throughout this entire study only 7% of the students mention the rotation of an
angle and the sum of a single rotation being 360 degrees. This percentage may be since the
software does not construct an angle to show a full rotation about a single point or the fact
that the researcher did not introduce new materials or another software in which the different
definitions of angle could have been explored.
Limitations of the study
As mentioned in the limitations of the materials, the students did not get a chance to
see angle as a rotation about a single point or in a curve unless they were in an interview. In
order to see if more students understood angle as more than what is defined in Euclidean
geometry they would have all needed to be interviewed, the researcher could have made
some alterations to the instructional activity or introduced new materials such as those used
in the interview. Since this did not occur the study did not effectively analyze student’s
conceptual understanding of angle, except for as defined in Euclidean geometry.
Another two limitations of the study were the time and subject number constraints in
which the study took place. Considering the researcher was the teacher she was required to
work together with her professional learning team limiting the number of days set aside for
the students to explore angle with the use of the software and gain a deeper understanding of
angle. The instructional activity was only 3 days and there were only 27 subjects in the
study. Therefore, the study would have been more convincing with a longer instructional
activity that looked at multiple definitions of angle and with more subjects to analyze. The

114
time constraint also prevented the researcher from testing the materials prior to the study and
conducting a trial run before initiating the study.
As mentioned before, the researcher was the teacher; this might be called a limitation
in itself. Since the researcher was the teacher, a collaborative team was not readily available
to work with and help analyze the data. The researcher did consult another researcher in her
department, yet the second researcher was not in the classroom for the implementation of the
study restricting her ability to assist the researcher. If the researcher was not the teacher
there could have been a collaborative team to gain an understanding of how the students
learn the concept of angle by view how the students were learning as the teacher was leading
the students through the instructional activities. With a team of researchers the study would
have been more effective considering a group of researchers could discuss a variety of ideas
and decide how to create the materials used in the study.
There could have also been an opportunity for a pilot study to discover the fact that
the instructional activity did not lead the students to multiple definitions of angle. With a
pilot study the students in the study may have reached a deeper understanding of angle as a
rotation or in a curve with the use of multiple manipulations as done in the interview. Along
with a pilot of the instructional activities, a pilot of the interview could have been completed.
If the interview were analyzed before the implementation of the lesson multiple
representations of angle would have been incorporated since the need was obvious after the
interviews.

115
Implications for Teaching
“Technology is not a panacea. As with any teaching tool, it can be used well or
poorly” (NCTM, 2000, 25). This study shows that starting the students off constructing
diagrams, which they are not familiar with, is not the best way in which to use the software.
First the teacher should have the students explore already constructed diagrams and then
hopefully construct diagrams by themselves or in a collaborative group. The students would
benefit more from the pre-constructed diagrams at the start of a topic yet constructing the
terms after becoming very familiar with the topic would also be beneficial for the students.
Constructing the diagrams themselves is very important due to the fact that whoever
constructs a diagram that is a true diagram of a certain term has to really understand the
terms in order to create a diagram that will always hold to the condition of the constructed
term. Being able to construct the terms themselves as an extension of a lesson would help
ground the knowledge and help the students explore more properties of the term than is
usually covered in a typical classroom environment. Along with the software used in this
study, a variety of software and materials should be used to instruct the students in order to
gain conceptual understanding of angle as multiple definitions so all representations of angle
could be analyzed, compared and contrasted as the students are developing their
understanding of angle.
It is also evident though this study and other studies that the students should have an
intense introduction to the software in order to know and understand how to best use the
software to help them discover information in the instructional activity which they are
completing. Also, the software should be used throughout the classroom as the students

116
continue to gain this understanding of angle. Since the teacher was the researcher, she could
see how the students understanding of angle developed though the entire course. Being able
to use the software throughout the classroom would be beneficial for the students
understanding of angle and other vital geometric concepts.
Students would also benefit from an in depth introduction to the software in order for
them to use the software outside of class to help understand important terms or how to prove
certain theorems. Many of the students in this study said the software was beneficial for their
understanding and that they enjoyed the experience yet they admitted that they would not use
the software outside of class because they were not familiar with it and all of its capabilities.
The software was a little confusing, if a teacher could fix the confusions I believe students
would use the software outside of class to help their understanding of certain terms while the
teacher is not around to assist with their learning experience.
An observation by Goos (2004) while conducting a study of DGS was also seen in
this study, “A small number of students resisted the teachers’ efforts to move them toward
more independent and critical engagement with mathematical tasks, for example, by waiting
for the teacher to hand over the required knowledge or by avoiding constructive interaction
with peers” which will limit their ability to learn from their peers and reach higher levels of
geometric thinking (p. 282). Being able to work the software, other mathematical
manipulations and group collaboration into the classroom would be beneficial and students
would stop being so dependent on the teacher. This would provide an opportunity for the
students to think critically about the concept, which is sadly quite rare in everyday
mathematics courses.

117
Future Development
This study leaves questions to be answered. The instructional activities were
designed to promote students’ conceptual understanding of angle involving two completely
different processes, which affected each gender differently. Females benefited greatly from
the student-constructed lesson as the males benefited greatly from the teacher-constructed
instructional activity. This could be an interesting fact to study and see if this were to happen
in future studies. How does the gender of the student make a difference in how the software
influences their conceptual understanding of topics?
As mentioned above, the software should be used throughout the course. Future
research could use a longitudinal study, without the time constraints of this study. This type
of long-term study would allow the possibility for the students to use the software for an
extended period of time in order to see if the student’s conceptual understanding of angle
would increase or decrease over an extensive period of time.
Being an effective teacher of mathematics is a complicated endeavor; there are no
recipes on how to teach students’ to understand mathematical concepts (NCTM, 2000, 17).
“Unfortunately, learning mathematics without understanding has long been a common
outcome of school mathematics instruction. In fact, learning without understanding has been
a persistent problem since at least the 1930s, and it has been the subject of much discussion
and research by psychologists and educators over the years” (NCTM, 2000, p. 20).
There is an evident need for research to discover the best way to teach our students
for understanding. Not only does the focus need to be what kind of mathematical
technologies, manipulatives and other techniques can be added to the classroom to assist

118
instruction but how these aids can best be used to benefit each and every student. It would be
extremely valuable if researchers could discover how to teach each type of student so no one
student is given an unfair advantage. In order for this to be accomplished more research like
this study is needed to look at how certain mathematical tools can be used in the classroom
and which subgroups are affected more significantly by the addition of the mathematical
tools.

119
REFERENCES
Balacheff, N. (1988). Study of the process of proving in mathematics among middle
school students (p. 395-464). Unpublished thesis, Université de Grenoble,
France.
Bass, L. E., Charles, R. I., & Johnson, A. (2004). Prentice Hall mathematics: Geometry.
Upper Saddle River, NJ: Pearson Prentice Hall.
Bransford, J. D., Brown, A. L., & Cocking, R. R. (1999). How people learn: Brain, mind,
experience, and school. Washington, DC: National Academy Press.
Clements, D. H., & Battista, M. T. (1992). Geometry and spatial reasoning (D. A.
Grouws ed.). Handbook of research on mathematics teaching and learning.
Macmillan, New York, 420-464.
Clements, D. H., & Burns, B. A. (2000). Students' development of strategies for turn and
angle measure. Educational Studies in Mathematics, 41, 31-45.
Close, G. S. (1982). Children’s understanding of angle at primary/secondary transfer
age. Master of science, Polytechnic of the South Bank, London, UK.
Erez, M. M. & Yerushalmy, M. (2006). "If you can turn a rectangle into a square, you can
turn a square into a rectangle..." young students experiences the dragging tool.
International Journal of Computers for Mathematical Learning, 11, 271-299.
Euclid. (1956). The thirteen books of Euclid's elements translated from the text of Heiberg
with introduction and commentary (S. Health, Trans.). New York: Dover
Publications.

120
Fyhn, A. B. (2008). A climbing class' reinvention of angles. Educational Studies in
Mathematics, 67, 19-35.
Goos, M. (2004). Learning mathematics in a classroom community of inquiry. Journal for
Research in Mathematics Education, 35(4), 258-291.
Groman, M. W. (1996). Integrating "Geometer's Sketchpad" into a geometry course for
secondary education mathematics majors. Association of Small Computer Users in
Education (ASCUE) Summer Conference Proceedings (29th, North Myrtle Beach,
SC, June 9-13, 1996), 1-6.
Healy, L., Hoelzl, R., & Hoyles, C. (1994). Messing up: Reflections on introducing Cabri
Géométre. Micromath, 10(1), 14-16.
Hollebrands, K., Laborde, C., & StraBer, R. (2008). Technology and the learning of
geometry at the secondary level. Research on Technology and the Teaching and
Learning of Mathematics, 1, 155-205.
Keiser, J. M. (2004). Struggles with developing the concept of angles: Comparing sixth-
grade students' discourse to the history of the angle concept. Mathematical
Thinking and Learning, 6(3), 285-306.
Kieran, C. (1986). LOGO and the notion of angle among fourth and sixth grade children (L.
Burton & C. Hoyles Eds.). Proceedings of the 10th International Conference on the
Psychology of Mathematics Education, 99-104. London: Program Committee.
Laborde, C., Kynigos, C., Hollebrands, K., & Strässer, R. (2006). Teaching and learning
geometry with technology. Handbook of Research on the Psychology of
Mathematics Education: Past, Present and Future, 275-304.

121
Larson, R., Boswell, L., & Stiff, L. (2004). Geometry: North Carolina teacher's edition.
Evanson, IL: McDougal Littell: A Houghton Mifflin Company.
MacGregor, K. S. & Thomas, R. W. (2002). Learning geometry dynamically: Teacher
structure or facilitation? NECC 2002: National Educational Computing Conference
Proceedings (23rd, San Antonio, Texas, June 17-19, 2002), 1-14.
Miles, M. B., & Huberman, M. A. (1994). Qualitative data analysis. Thousand Oaks, CA:
SAGE publications.
Mitchelmore, M. (1997). Children’s informal knowledge of physical angle situations.
Learning and Instruction, 7(1), 1-19.
Mitchelmore, M., & White, P. (1998). Development of angle concepts: A framework for
research. Mathematics Education Research Journal, 10(3), 4-27.
Mitchelmore, M., & White, P. (2000a). Development of angle concepts by progressive
abstraction and generalization. Educational Studies in Mathematics, 41, 209-238.
Mitchelmore, M., & White, P. (2000b). Teaching for abstraction reconstructing
constructivism. In J. Bana & A. Chapman (Eds.), Proceedings of the 23rd annual
conference of the Mathematics Education Research Association of Australasia (p.
432-439). Freemantle, Australia.
Monaghan, F. (2000). What difference does it make? Children's views of the differences
between some quadrilaterals. Educational Studies in Mathematics, 42, 179-196.
Munier, V., & Merle, H. (2009). Interdisciplinary mathematics - physics approaches to
teaching the concept of angle in elementary school. International Journal of Science
Education, 31(14), 1857-1895.

122
National Council of Teachers of Mathematics (NCTM). (2000). Principles and standards for
school mathematics. Reston, VA.
Piaget, J., Inhelder, B. (1956). The child’s conception of space. London: Routledge & Kegan
Paul.
Prescott, A., Mitchelmore, M., & White, P. (2002). Student difficulties in abstracting angle
concepts from physical activities with concrete materials. Proceedings of the 25th
Annual Conference of the Mathematics Education Research Group of Australasia
Incorporated, 1, 583-591.
Proclus (1970). Proclus: A commentary on the first book of Euclid’s elements (G. R.
Marrow, Trans.). Princeton, NJ: Princeton University Press.
Rao, P. V. (2007). Inferences about One or Two Populations: Interval Data. In M. Baird, M.
Staudt, & M. Stranz (Eds.), Statistical research methods in life sciences (pp. 126-
168). Mason, OH: Thomson Wadsworth.
Schoenfeld, A. H. (1988). When good teaching leads to bad results: The disasters of well
taught mathematics classes. Educational Phychologist, 23, 66-145.
Sinclair, M. P. (2003). Some implications of the results of a case study for the design of pre-
constructed, dynamic geometry sketches and accompanying materials. Educational
Studies in Mathematics, 52, 289-317.
Skemp, R. R. (1976). Relational understanding and instrumental understanding. Mathematics
Teaching, 77, 9-15.
Strässer, R. (2002). Research on dynamic geometry software (DGS) – An introduction.
Zentralblatt für Didakit der Mathematic, 34(3), 65.

123
Wilson, P. S., & Adams, V.M. (1992). A dynamic way to teach angle and angle measure.
Arithmetic Teacher, 39(5), 6-13.

124
APPENDICES

125
Appendix A
North Carolina State University INFORMED CONSENT FORM for RESEARCH
Student Understanding of Angle Principal Investigator: Carrie Lineberry Faculty Sponsor: Dr. Karen Keene What are some general things you should know about research studies? You are being asked to take part in a research study. Your participation in this study is voluntary. You have the right to be a part of this study, to choose not to participate or to stop participating at any time without penalty. Your child’s participation in the study will be greatly appreciated, although your child is not required to participate and will not be penalized if you decide you do not want them to be a part of the study. Their grades will not be affected by not participating, anyone who is present for these lessons will get credit if they do the work, regardless if they are in the study or not. If you decide to participate and want to stop later you can, your child can tell me they want to stop their participation at any time. If you decide to decline your child's participation in the study, or want to stop participating, I will not use your child’s documents for the study and will shred them after the students have completed their activities. The purpose of research studies is to gain a better understanding of a certain topic or issue. You are not guaranteed any personal benefits from being in a study. In this consent form you will find specific details about the research in which you are being asked to participate. If you do not understand something in this form it is your right to ask the researcher for clarification or more information. A copy of this consent form will be provided to you. If at any time you have questions about your participation, do not hesitate to contact the researcher(s) named above. What is the purpose of this study? The intent of this project is to determine students’ conceptual understanding of angle. The importance of this work lies in its potential to increase teachers’ pedagogical content knowledge, student understanding, and achievement. What will happen if you take part in the study? If you agree to participate in this study, you will be asked to participate in a pre-test, complete a lesson using dynamic geometry software to gain an understanding of all the introductory terms in your geometry class and complete a post-test. The study will take approximately three days, each being 90 minute classrooms, to complete the pre-test, post-test and lesson during regular class time. Risks There are no physical or emotional risks associated with participation in this study. Benefits Your participation may increase your understanding of introductory terms you will need throughout your entire geometry course. Participating in this study could increase your understanding and lead to deeper understandings of your geometry course and potentially help you be successful in geometry.

126
Confidentiality The information in the study records will be kept strictly confidential. Data will be stored securely in a locked cabinet in the principle investigators office. No reference will be made in oral or written reports which could link you to the study so that no one can match your identity to the answers that you provide. Compensation You will not receive anything for participating. What if you have questions about this study? If you have questions at any time about the study or the procedures, you may contact the researcher, Carrie Lineberry at [email protected] or 336-466-1197. What if you have questions about your rights as a research participant? If you feel you have not been treated according to the descriptions in this form, or your rights as a participant in research have been violated during the course of this project, you may contact Arnold Bell, PhD, Chair of the NCSU IRB for the Use of Human Subjects in Research Committee, Box 7514, NCSU Campus (919/ 515-4420) or Mr. Matthew Ronning, Assistant Vice Chancellor, Research Administration, Box 7514, NCSU Campus (919/513-2148) Consent To Participate “My students and I have read and understand the above information. I have received a copy of this form. I agree to participate in this study with the understanding that I may choose not to participate or to stop participating at any time without penalty or loss of benefits to which I am otherwise entitled.”
Subject's signature_______________________________________ Date _________________ Parent’s signature______________________________________ Date__________________(Only if under age 18) Investigator's signature__________________________________ Date _________________
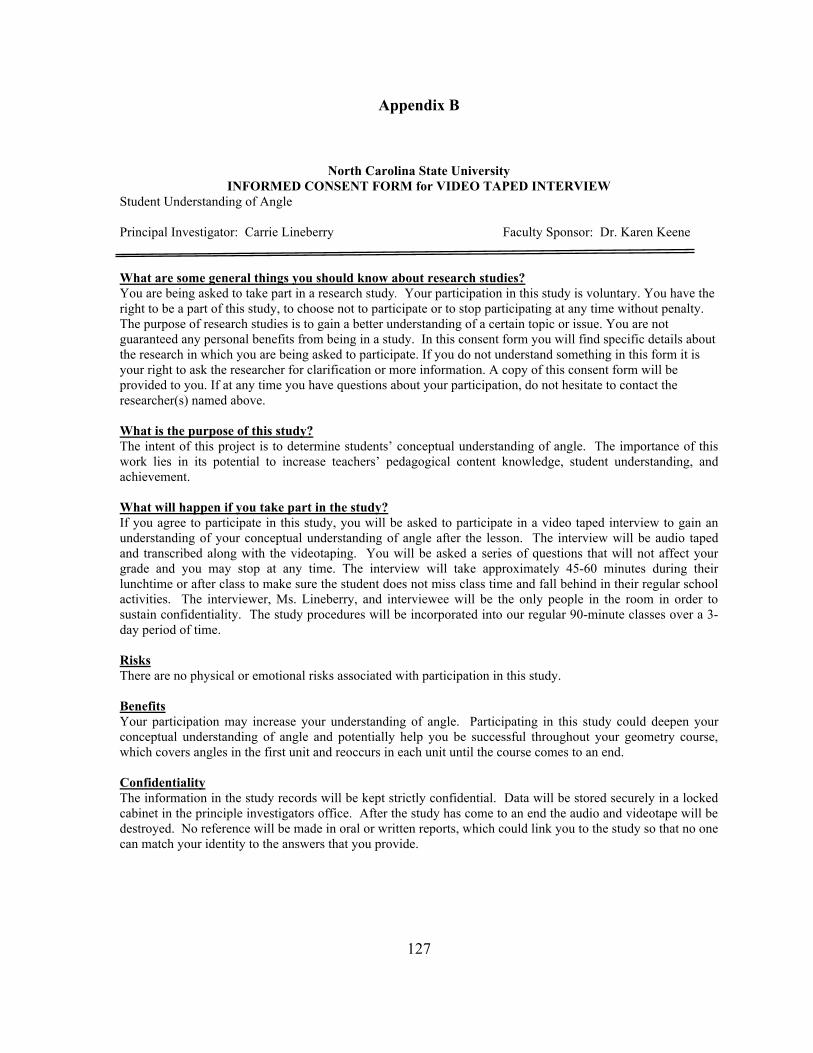
127
Appendix B
North Carolina State University INFORMED CONSENT FORM for VIDEO TAPED INTERVIEW
Student Understanding of Angle Principal Investigator: Carrie Lineberry Faculty Sponsor: Dr. Karen Keene What are some general things you should know about research studies? You are being asked to take part in a research study. Your participation in this study is voluntary. You have the right to be a part of this study, to choose not to participate or to stop participating at any time without penalty. The purpose of research studies is to gain a better understanding of a certain topic or issue. You are not guaranteed any personal benefits from being in a study. In this consent form you will find specific details about the research in which you are being asked to participate. If you do not understand something in this form it is your right to ask the researcher for clarification or more information. A copy of this consent form will be provided to you. If at any time you have questions about your participation, do not hesitate to contact the researcher(s) named above. What is the purpose of this study? The intent of this project is to determine students’ conceptual understanding of angle. The importance of this work lies in its potential to increase teachers’ pedagogical content knowledge, student understanding, and achievement. What will happen if you take part in the study? If you agree to participate in this study, you will be asked to participate in a video taped interview to gain an understanding of your conceptual understanding of angle after the lesson. The interview will be audio taped and transcribed along with the videotaping. You will be asked a series of questions that will not affect your grade and you may stop at any time. The interview will take approximately 45-60 minutes during their lunchtime or after class to make sure the student does not miss class time and fall behind in their regular school activities. The interviewer, Ms. Lineberry, and interviewee will be the only people in the room in order to sustain confidentiality. The study procedures will be incorporated into our regular 90-minute classes over a 3-day period of time. Risks There are no physical or emotional risks associated with participation in this study. Benefits Your participation may increase your understanding of angle. Participating in this study could deepen your conceptual understanding of angle and potentially help you be successful throughout your geometry course, which covers angles in the first unit and reoccurs in each unit until the course comes to an end. Confidentiality The information in the study records will be kept strictly confidential. Data will be stored securely in a locked cabinet in the principle investigators office. After the study has come to an end the audio and videotape will be destroyed. No reference will be made in oral or written reports, which could link you to the study so that no one can match your identity to the answers that you provide.

128
Compensation You will not receive anything for participating. What if you have questions about this study? If you have questions at any time about the study or the procedures, you may contact the researcher, Carrie Lineberry at [email protected] or 336-466-1197. What if you have questions about your rights as a research participant? If you feel you have not been treated according to the descriptions in this form, or your rights as a participant in research have been violated during the course of this project, you may contact Arnold Bell, PhD, Chair of the NCSU IRB for the Use of Human Subjects in Research Committee, Box 7514, NCSU Campus (919/ 515-4420) or Mr. Matthew Ronning, Assistant Vice Chancellor, Research Administration, Box 7514, NCSU Campus (919/513-2148) Consent To Participate “My student and I have read and understand the above information. I have received a copy of this form. I agree to participate in this study with the understanding that I may choose not to participate or to stop participating at any time without penalty or loss of benefits to which I am otherwise entitled.”
Subject's signature_______________________________________ Date _________________ Parent’s signature______________________________________ Date__________________ (Only if under age 18) Investigator's signature__________________________________ Date _________________

129
Appendix C
Investigating students’ conceptual understanding of angle using dynamic geometry software Pre-Test
1. Out of the different diagrams below please identify the angle. 2. Draw your own diagram of an angle. 3. Draw an angle that measures approximately 30°. 4. Draw two angles that are complementary to each other. 5. Define angle with detail. 6. What is the difference between angle and a square?

130
7. Draw a picture with 6 angles in it and identify the angles. 8. Think of a real world example of an angle. Give a detailed description of the example and draw a diagram below. 9. How many angles are in the diagram below? Identify them and describe why they are angles.

131
Appendix D
Discovering Geometric Diagrams with Geometers Sketchpad Opening the document in Geometers Sketchpad (DGS)
1. Login onto the computer 2. Look at the Novell Screen and Click on the Math Tab 3. Find the application Geometers Sketchpad which looks like the following icon:
4. Start the investigation constructing each of the terms below. 5. When you need a new page because you have filled up a page do not open a
new document. Click on FILE and then New Sketch. 6. When you have completed the Investigation you need to save the
investigation with you and your partner’s first name only in the following location.
7. Click Save. 8. Choose the Shared Drive. 9. Click on School. 10. Click on Media. 11. Click on Lineberry and save!!!
Direction: After you open the document you need to read each term below and construct it in Geometers Sketchpad. After you create the term move points around and fill in the table where it says “Discovered Facts.” Then paste the picture of the term in the table where it says “Picture Representation”. Use the buttons to the left to create your object. If you click on the one that looks like a point and then place it into the DGS document you will create a point. Another place you will need to discover is the tab at the top titled “Construct” to make most of the terms and “Measure” to measure their length or angle. To measure an object you need to click on the points in the order you want the object to be measured. DGS will not allow you to construct or measure objects that are not highlighted, so make sure you highlight what you want to construct or measure. If you have any questions just ask.
Geometric Term Discovered Facts
Picture Representation
1. A point has no dimension. It is usually represented by a small dot.

132
2. A plane extends in two dimensions. It is usually represented by a shape that looks like a tabletop or wall. You must imagine that the plane extends without end, even though the drawing of a plane appears to have edges.
3. Two congruent objects are two objects that have the exact same length or measure. The symbol for “is congruent to” is ≅ .
4. A line extends in one dimension. It is usually represented by a straight line with two arrow heads to indicate that the line extends without end in two directions. In this class a line is name with a lower case letter or named by two points on the line, for example
.
5. A line segment is part of a line that consists of two points, called endpoints, and all points on the line that are between the endpoints. A segment is named by the endpoints, for example .
6. A ray is part of a line that consists of a point, called an initial point, and all points on the line that extend in one direction. A ray is named by the initial point and another point on the ray, for example .
7. If C is between A and B, then and are opposite rays.
8. Collinear points are points that lie on the same line.
9. Coplanar points are points that lie on the same plane.

133
10. The intersection of the figures is the set of points the figures have in common.
11. An angle consists of two different rays that have the same initial point. The rays are the sides of the angle, and the initial point is the vertex of the angle. The angle symbol is ∠.
12. An acute angle is an angle with measure between 0° and 90°.
13. A right angle is an angle with the exact measure of 90°.
14. An obtuse angle is an angle with measure between 90° and 180°.
15. A straight angle is an angle with the exact measure of 180°.
16. Adjacent angles are two angles with a common vertex and ray but no common interior points.
17. Complementary angles are angles whose measures have the sum 90°.

134
18. Supplementary angles are angles whose measures have the sum 180°.
19. A linear pair are two adjacent angles whose non-‐common sides are opposite rays.
20. Vertical angles are two angles whose sides form two pairs of opposite rays.
21. Rules that are accepted without proof are called postulates or axioms.
22. Rules that are proved are called theorems.
23. The distance or length between two points A and B, written as , is the absolute value of the difference between the coordinates of A and B.
24. Segments that have the same length are called congruent segments.
25. Angles that have the same measure are called congruent angles.

135
26. A point is in the interior of an angle if it is between points that lie on each side of the angle.
27. A point is in the exterior of an angle if it is not on the angle or in its interior.
28. The midpoint of a segment is the point that divides, or bisects, the segment into two congruent segments.
29. Segment Addition Postulate: If is between and , then . Point is the midpoint of .
30. A segment bisector is a segment, ray, line, or plane that intersects a segment at its midpoint.
31. Angle Addition Postulate: If is in the interior of , then
.
32. An angle bisector is a ray that divides an angle into two adjacent angles that are congruent.

136
How did you like DGS? 1. Did you have any complications constructing the different geometric terms
above?
2. Do you understand the terms better after the construction?
3. What did you learn today? (Summarize in a paragraph written below.) Then continue to the last page and fill in the charts!

137
Summary: Fill in the following charts comparing and contrasting the geometric terms you defined using DGS. Compare acute, right, obtuse and straight angles!
Contrast acute, right, obtuse and straight angles!
Compare segment bisector and angle
bisector Contrast segment bisector and angle
bisector
Compare segments, lines and rays!
Contrast segments, lines and rays!

138
Appendix E
Discovering Geometric Definitions with Dynamic Geometry Software Opening the document in Geometers Sketchpad (DGS)
1. Login onto the computer 2. Look at the Novell Screen and Click on File Management 3. Go to the Shared Drive and Click on School 4. Click on Media 5. Click on Lineberry 6. Find the application Geometers Sketchpad DGS 4.06 which looks like the
following icon: 7. Double click to open. 8. Click FILE 9. Click Open 10. Click on the folder titled Unit 1 DGS 11. Click on Discover Geometric Concepts 12. Click Open (If you close this window DO NOT SAVE CHANGES!!! You can
go through the process again if you want to open the original document again!)
DGS Notation: Notation: means the measure of the angle formed by points A, B and C. These letters can change but means the measure of an angle. means the distance from point A to point B. These letters can change but the two letters put together represent the distance from one point to another. Needed terminology and definitions to help complete the task. A point has no dimension. It is usually represented by a small dot. A plane extends in two dimensions. It is usually represented by a shape that looks like a tabletop or wall. You must imagine that the plane extends without end, even though the drawing of a plane appears to have edges. Two congruent objects are two objects that have the exact same length or measure. The symbol for “is congruent to” is ≅ . The distance or length between two points A and B, written as , is the absolute value of the difference between the coordinates of A and B. Click on the first tab at the bottom titled “Segments/Lines/Rays”
1. Look at the segment, drag both points around, what do you notice?
2. Define segment:

139
3. Look at the line, drag both points around, what do you notice?
4. Define line:
5. Look at the ray, drag both points around, what do you notice?
6. Define ray:
7. Drag the segment to the line, what do you notice?
8. Drag the ray to the line, what do you notice?
9. Compare the segment, the line and the ray. What conclusions can you
make? What do they have in common? Could one turn into another?
Click on the Second tab at the bottom titled “What is an angle?”
1. Drag the point C around, what changes do you notice?
2. Define an angle:
Click on the Third tab at the bottom titled “Types of angles”
1. Look at the acute angle, drag point C around, what changes do you notice?
2. Define an acute angle:
3. Look at the right angle, drag point F around, what changes do you notice?
4. Define a right angle:
5. Look at the obtuse angle, drag point I around, what changes do you notice?

140
6. Define an obtuse angle?
7. Look at the straight angle, drag point L around, what changes do you notice?
8. Define a straight angle:
Click on the Forth tab at the bottom titled “Angle Pair Relationships”
1. Look at the adjacent angles, drag points A, B, C and D around, what changes do you notice?
2. Define a pair of adjacent angles:
3. Look at the complementary angles, drag point E, F, G and H around, what changes do you notice?
4. Define a pair of complementary angles:
5. Look at the supplementary angles, drag point I, J, k and L around, what changes do you notice?
6. Define a pair of supplementary angles:
7. Look at the vertical angles, drag point M, N, O P, and Q around, what
changes do you notice?
8. Define a pair of vertical angles:

141
Click on the fifth tab at the bottom titled “Segment Addition” 1. Each lower case letter represents the segment between the points labeled
with upper case letters. Look at each lower case letter’s measurement. Compare these measurements with the measurements labeled at the top of the segments from one point to another. How are they related?
2. Look at all the segments added together and some of the other measurements on the page. Can you draw any conclusions about segment addition?
3. Define segment addition:
Click on the sixth tab at the bottom titled “Segment Bisector”
1. Click on the points of the segment bisector and move them around. What do you notice?
2. Click on the points A, B and C and drag them around. What do you notice? What happens to the measurements at the top of the page?
3. Is there any relationship between segment a and segment b?
4. Click on the segment bisector again and move it around, what happens to segment a and segment b? Can you conclude anything about the segment bisector?
5. Define segment bisector:

142
Click on the seventh tab at the bottom titled “Angle Addition” 1. Drag point D around, what do you notice about the and ?
What do you notice about their sum? What do you notice about and the sum of and ? Do you have any ideas about angle addition?
2. Drag point E around, what do you notice about the and ? What do you notice about their sum? What do you notice about and the sum of and ? Do you have any ideas about angle addition?
3. Drag all the points around and look at the individual measurements of each of the three angles to the left and compare their measurements to the sum of the three angles together on the right of the page. What do you notice? What do you notice about the sum of all three angles and ? Does it matter where you move the points? What kinds of relationships can you find about all three angles.
4. Define angle addition:
Click on the eighth tab at the bottom titled “Angle Bisector”
1. Drag point D around, what do you notice about the angle bisector?
2. Drag A, D and C around. Look at their measurements, what do you notice? Can you draw any conclusions about the angle bisector?
3. Define angle bisector:

143
How did you like DGS? 1. Did the constructions help you define the terms? How? Explain with detail.
2. What difficulties did you encounter with the use of DGS?
3. What did you learn today? (Summarize in a paragraph written below, you can use the next page as well.) Then continue to the last page and fill in the charts!

144
Summary: Fill in the following charts comparing and contrasting the geometric terms you defined using DGS. Compare acute, right, obtuse and straight angles!
Contrast acute, right, obtuse and straight angles!
Compare segment bisector and angle
bisector Contrast segment bisector and angle
bisector
Compare segments, lines and rays!
Contrast segments, lines and rays!

145
Appendix F
Investigating students’ conceptual understanding of angle using dynamic geometry software Post-Test
1. Out of the different diagrams below please identify an angle. 2. Draw your own diagram of an angle. 3. Draw an angle that measures approximately 120°. 4. Draw two angles that are supplementary to each other. 5. Define angle with detail. 6. What is the difference between an angle and triangle?

146
7. Draw a picture with exactly 8 angles in it and identify the angles. 8. Think of a career that uses angles. Explain this career and why it needs to use angles. Draw a diagram below of the career. 9. How many angles are in the diagram below? Identify them and describe why they are angles.
147
Appendix G
Investigating students’ conceptual understanding of angle using dynamic geometry software Interview Protocol
Introduction Materials: Video camera, microphone, calculator, ruler, protractor, compass, paper, marker, scissors Permission Form: Ask the student if (s)he has any questions about the permission form and be sure to collect it. Introduction: Say: Hi, I’m _______. I really appreciate your taking the time to meet with me today. As you may know, I am interested in learning about how you think about geometry. The problems that I will show you today may or may not be similar to what you are doing in class right now. Keep in mind that what you do will not have any effect on your grade in your mathematics class and what you say will remain anonymous. Roles: Say: Because I am interested in how you think about geometry, it would really help me if you would talk as much as you can. While you are working and talking, I will probably ask questions to be sure I understand what you are saying. I am asking because I am really interested. I am not asking a question because what you are doing is correct or incorrect, but rather I just want to make sure I understand what you are saying. Chances are I probably just missed something you said or did. Likewise, if I ask a question that does not make sense to you, please tell me. Recording: Say: I might take a few notes to help me remember what you are saying. But, because I don’t want to take too many notes, I would like to tape our conversation. The video camera will be focused on what you are writing or doing. I’d also like to use a tape recorder to record what you and I talk about because the video camera does not always record sound very well. Both of us will need to put on a microphone. Awareness of materials: Say: I have a compass/straightedge/protractor/calculator /paper/scissors/marker available for you to use. I would like for you to write using this marker because it is darker than a pencil and will be easier for me to see what you are writing know and on the video camera.
148
Preparation: Make a variety of shapes with and without angles for Task 2 including a circle, square, trapezoid, triangle, oval and more. Make a variety of angles including acute, obtuse, right and straight angles. Make an angle in which the rays can be rotated. Make two more angles, bigger, to give the student to help explain angle addition and an angle bisector. Make an angle resembling an angle in spherical geometry for Task 5. Task 1 Given the student all of the materials and let them know they are allowed to use any of the materials on the table at any time during the interview. Ask: Can you define angle in your own words? Ask: Can you explain why you choose to define angle they you did? Remember, you can use any of the materials on the table to help explain your reasoning. Task 2 Give the student a variety of shapes with and without a variety of angles. Ask: Can you please point out all the angles and explain to me why you consider them angles. Ask: Why is this an angle? If students use names of figures in the classification (e. g., acute, right, obtuse, etc) why do you know these figures are angles? If students don’t use names Ask: Do you have a name for this angle? Once names are introduced, use the names they choose and Ask: And what makes them different from the other angles on the table? I expect student to be able to identify the angles. Yet, if the student cannot identify the angles we will keep asking the questions above until they say they can’t. Task 3 Provide paper for the student and the researcher to take notes. Ask: Do you remember the dynamic geometry software instructional activity we completed in the lab? (If not I can provide the student with their instructional activity to help remind them). Ask: How did you like using the software? (Did you like being able to drag the diagrams around? Did you feel you learned more about angles using the software? Did the software

149
hinder your learning experience in any way? Would you use the software in the future to help understand certain concepts?) Ask: What do you remember most about the activity? Ask: Did the software help your understanding of angle? Explain. Ask: Is there anything else you would like to tell me about the software and the instructional activity experience? Task 4: Provide a variety of angles, some fixed angles at certain degrees of measurement, an angle in which you can rotate the rays, and two other triangles to help gain knowledge about angle addition and angle bisectors. Say: Here are a variety of angles. Ask: Can you tell me the measurement of these angles? (The fixed angles, the investigator may need to help the student use a protractor without leading the student too much in order for the student to correctly measure the angles.) Get the angle in which you can rotate the rays. Say: Look at this figure, (the angle which you can rotate the rays) what is different about this figure than the other figures we just worked with? Ask: Can you show me a 90° angle? Does this angle have a name? Ask: Can you show me a 30° angle? Does this angle have a name? (If the student is confused the interviewer will change the question to approximate the measure of a 30° angle.) Ask: Can you show me a 120° angle? Does this angle have a name? Ask: Can you show me a 180° angle? Does this angle have a name? Get the other two angles to help probe the interviewee about angle addition and angle bisectors. Say: Here are two angles. I want you to use them to show me something.

150
Ask: Can you take this angle (point to either one, does not matter) and explain angle addition to me? Remember that you can use any materials on the table to help explain your reasoning. Ask: Are there any special properties about angle addition you can show me? (Continue to probe the student until they disclose the properties of angle addition needed for their geometry class and show their conceptual understanding of the concept.) Ask: Can you take this angle (point to either one, doesn’t matter) and explain an angle bisector to me? Remember that you can use any materials on the table to help explain your reasoning. Ask: Are there any special properties about an angle bisector you can show me? (Continue to probe the student until they disclose the properties of an angle bisector needed for their geometry class and show their conceptual understanding of the concept.) Task 5 Say: A mathematician invented a geometry that says this shape is an angle. Ask: What do you think about that? Ask: Do you think this is an angle? Case 1: No, that is not true. Ask: Why do you think this isn’t an angle? Case 2: Yes, that might be true. Ask: Why do you think it is true? (Maybe probe to get the student to think about different geometries.) Conclusion Ask: Is there anything else about angle that you would like to tell me? Do you have any questions about the interview? Say: Thank you for your time, this was a great interview and I really appreciate you taking the time to help me learn how you are thinking about a variety of angles.

151
Appendix H

152

153