We cordially invite you to attend SLM Corporation's - Sallie Mae
Upload
khangminh22Category
view
5download
0
Prospectus Supplement(To REMIC Prospectus dated September 18, 1998)
$1,362,843,208
Guaranteed REMIC Pass-Through CertiÑcatesFannie Mae REMIC Trust 1999-32
The CertiÑcates Original FinalClass Principal Interest Interest CUSIP Distribution
Class Group Balance Type Rate Type Number DateWe, the Federal National Mortgage As-A ÏÏÏÏÏÏÏÏ 1 $110,000,000 SEQ 6.0% FIX 31359WHH7 April 2026sociation (""Fannie Mae''), will issue theB ÏÏÏÏÏÏÏÏ 1 40,000,000 SEQ 6.0 FIX 31359WHJ3 July 2029classes of certiÑcates listed in the chartPA ÏÏÏÏÏÏÏÏ 2 91,360,000 PAC 6.5 FIX 31359WHK0 January 2020
on this page. PC ÏÏÏÏÏÏÏÏ 2 56,090,545 PAC 6.5 FIX 31359WHL8 August 2024YA ÏÏÏÏÏÏÏÏ 2 68,156,097 TAC 6.5 FIX 31359WHM6 November 2025
Payments to CertiÑcateholders FA ÏÏÏÏÏÏÏÏ 2 50,000,000 SUP (1) FLT 31359WHN4 August 2026SA ÏÏÏÏÏÏÏÏ 2 11,538,462 SUP (1) INV 31359WHP9 August 2026
We will make monthly payments on the VA ÏÏÏÏÏÏÏÏ 2 70,200,000 SEQ 6.5 FIX 31359WHQ7 April 2021ZA ÏÏÏÏÏÏÏÏ 2 22,699,764 SEQ 6.5 FIX/Z 31359WHR5 July 2029certiÑcates. You, the investor, willPD ÏÏÏÏÏÏÏÏ 3 70,300,000 PAC 6.0 FIX 31359WHS3 August 2017receivePE ÏÏÏÏÏÏÏÏ 3 15,800,000 PAC 6.0 FIX 31359WHT1 July 2019PG ÏÏÏÏÏÏÏÏ 3 41,100,000 PAC 6.0 FIX 31359WHU8 April 2023‚ interest accrued on the balance ofPH ÏÏÏÏÏÏÏÏ 3 27,800,000 PAC 6.0 FIX 31359WHV6 May 2025your certiÑcate (except in the case ofPK ÏÏÏÏÏÏÏÏ 3 46,800,000 PAC 6.0 FIX 31359WHW4 February 2028
an accrual class) and PL ÏÏÏÏÏÏÏÏ 3 29,500,000 PAC 6.0 FIX 31359WHX2 July 2029FB ÏÏÏÏÏÏÏÏ 3 76,729,412 SUP (1) FLT 31359WHY0 October 2027
‚ principal to the extent available for SB ÏÏÏÏÏÏÏÏ 3 31,970,588 SUP (1) INV 31359WHZ7 October 2027ZB ÏÏÏÏÏÏÏÏ 3 10,000,000 SUP 6.0 FIX/Z 31359WJA0 July 2029payment on your class.PMÏÏÏÏÏÏÏÏ 4 87,900,000 PAC 7.0 FIX 31359WJB8 January 2022
We may pay principal at rates that vary PN ÏÏÏÏÏÏÏÏ 4 102,000,000 PAC 7.0 FIX 31359WJC6 July 2029from time to time. We may not pay princi- JA ÏÏÏÏÏÏÏÏ 4 31,200,000 PAC 7.5 FIX 31359WJD4 July 2029
CA(2)ÏÏÏÏÏ 4 16,300,000 SUP 7.5 FIX 31359WJE2 June 2028pal to certain classes for long periods ofCB(2)ÏÏÏÏÏ 4 11,260,000 SUP 7.5 FIX 31359W J F 9 December 2028
time. DA ÏÏÏÏÏÏÏÏ 4 3,114,000 SUP 7.5 FIX 31359WJG7 February 2009DB ÏÏÏÏÏÏÏÏ 4 1,403,000 SUP 7.5 FIX 31359WJH5 November 2011
The Fannie Mae Guaranty DC ÏÏÏÏÏÏÏÏ 4 2,060,000 SUP 7.5 FIX 31359W J J 1 February 2015DE ÏÏÏÏÏÏÏÏ 4 6,423,000 SUP 7.5 FIX 31359WJK8 December 2021
We will guarantee that required pay- ZC ÏÏÏÏÏÏÏÏ 4 3,000,000 SUP 7.5 FIX/Z 31359W J L 6 July 2029EA ÏÏÏÏÏÏÏÏ 4 5,340,000 SUP (3) PO 31359WJM4 July 2029ments of principal and interest on theFC(2)ÏÏÏÏÏ 5 72,576,679 SC/PT (1) FLT 31359WJN2 June 2029certiÑcates are distributed to investorsSC(2)ÏÏÏÏÏ 5 30,240,283 SC/PT (1) INV 31359WJP7 June 2029
on time.FD(2)ÏÏÏÏÏ 6 84,692,737 SC/PT (1) FLT 31359WJQ5 June 2029SD(2)ÏÏÏÏÏ 6 35,288,641 SC/PT (1) INV 31359WJR3 June 2029
The Trust and its AssetsR ÏÏÏÏÏÏÏÏ 0 NPR 0 NPR 31359WJS1 July 2029
The trust will own(1) Based on LIBOR.(2) Exchangeable classes.‚ Fannie Mae MBS and(3) Principal only class.
‚ underlying REMIC certiÑcates backedIf you own certiÑcates of certain classes, you can exchange them for the correspond-by Fannie Mae MBS.ing RCR certiÑcates to be issued at the time of the exchange. The C, JC, JD, FE and
The mortgage loans underlying the Fan-SE Classes are the RCR classes, as further described in this prospectus supplement.
nie Mae MBS are Ñrst lien, single-family,Ñxed-rate loans. The dealer will oÅer the certiÑcates from time to time in negotiated transactions at
varying prices. We expect the settlement date to be June 30, 1999.
Carefully consider the risk factors starting on page S-9 of this prospectus supplement and on page 10 of the REMICprospectus. Unless you understand and are able to tolerate these risks, you should not invest in the certiÑcates.
You should read the REMIC prospectus as well as this prospectus supplement.
The certiÑcates, together with interest thereon, are not guaranteed by the United States and do not constitute a debt orobligation of the United States or any agency or instrumentality thereof other than Fannie Mae.
The certiÑcates are exempt from registration under the Securities Act of 1933 and are ""exempted securities'' under theSecurities Exchange Act of 1934.
Salomon Smith BarneyThe date of this Prospectus Supplement is May 13, 1999.

TABLE OF CONTENTS
Page Page
AVAILABLE INFORMATIONÏÏÏÏÏÏÏÏÏÏ S- 3 Group 3 Cash Flow Distribution
Amount ÏÏÏÏÏÏÏÏÏÏÏÏÏÏÏÏÏÏÏÏÏÏÏÏÏ S-19REFERENCE SHEET ÏÏÏÏÏÏÏÏÏÏÏÏÏÏÏÏÏÏ S- 4
Group 4 Principal Distribution Amount S-19ADDITIONAL RISK FACTORS ÏÏÏÏÏÏÏÏ S- 9
ZC Accrual Amount ÏÏÏÏÏÏÏÏÏÏÏÏÏÏÏÏ S-19DESCRIPTION OF THE
CERTIFICATES ÏÏÏÏÏÏÏÏÏÏÏÏÏÏÏÏÏÏÏÏÏ S-10 Group 4 Cash Flow Distribution
Amount ÏÏÏÏÏÏÏÏÏÏÏÏÏÏÏÏÏÏÏÏÏÏÏÏÏ S-19GENERAL ÏÏÏÏÏÏÏÏÏÏÏÏÏÏÏÏÏÏÏÏÏÏÏÏÏÏÏÏÏÏ S-10
Group 5 Principal Distribution Amount S-19Structure ÏÏÏÏÏÏÏÏÏÏÏÏÏÏÏÏÏÏÏÏÏÏÏÏÏÏÏÏ S-10
Group 6 Principal Distribution Amount S-19Fannie Mae Guaranty ÏÏÏÏÏÏÏÏÏÏÏÏÏÏÏÏ S-11
STRUCTURING ASSUMPTIONSÏÏÏÏÏÏÏÏÏÏÏÏÏ S-20Characteristics of CertiÑcates ÏÏÏÏÏÏÏÏÏÏ S-11
Authorized Denominations ÏÏÏÏÏÏÏÏÏÏÏÏ S-11 Pricing AssumptionsÏÏÏÏÏÏÏÏÏÏÏÏÏÏÏÏÏÏ S-20
Distribution DatesÏÏÏÏÏÏÏÏÏÏÏÏÏÏÏÏÏÏÏÏ S-11 Prepayment Assumptions ÏÏÏÏÏÏÏÏÏÏÏÏÏ S-20
Record Date ÏÏÏÏÏÏÏÏÏÏÏÏÏÏÏÏÏÏÏÏÏÏÏÏÏ S-12 Structuring Ranges and Rate ÏÏÏÏÏÏÏÏÏÏ S-20
Class Factors ÏÏÏÏÏÏÏÏÏÏÏÏÏÏÏÏÏÏÏÏÏÏÏÏ S-12 Initial EÅective Ranges ÏÏÏÏÏÏÏÏÏÏÏÏÏÏÏ S-20
Optional TerminationÏÏÏÏÏÏÏÏÏÏÏÏÏÏÏÏÏ S-12 YIELD TABLES ÏÏÏÏÏÏÏÏÏÏÏÏÏÏÏÏÏÏÏÏÏÏÏÏÏ S-21
Voting the Underlying REMIC General ÏÏÏÏÏÏÏÏÏÏÏÏÏÏÏÏÏÏÏÏÏÏÏÏÏÏÏÏÏ S-21CertiÑcates ÏÏÏÏÏÏÏÏÏÏÏÏÏÏÏÏÏÏÏÏÏÏÏÏ S-12
The Inverse Floating Rate ClassesÏÏÏÏÏÏ S-22COMBINATION AND RECOMBINATION ÏÏÏÏÏÏ S-12
The Principal Only ClassÏÏÏÏÏÏÏÏÏÏÏÏÏÏ S-23General ÏÏÏÏÏÏÏÏÏÏÏÏÏÏÏÏÏÏÏÏÏÏÏÏÏÏÏÏÏ S-12
WEIGHTED AVERAGE LIVES OF THEProceduresÏÏÏÏÏÏÏÏÏÏÏÏÏÏÏÏÏÏÏÏÏÏÏÏÏÏÏ S-12 CERTIFICATESÏÏÏÏÏÏÏÏÏÏÏÏÏÏÏÏÏÏÏÏÏÏÏÏ S-24Additional Considerations ÏÏÏÏÏÏÏÏÏÏÏÏÏ S-13 DECREMENT TABLESÏÏÏÏÏÏÏÏÏÏÏÏÏÏÏÏÏÏÏÏ S-24
THE TRUST MBS ÏÏÏÏÏÏÏÏÏÏÏÏÏÏÏÏÏÏÏÏÏÏ S-13 CHARACTERISTICS OF THE R CLASSÏÏÏÏÏÏÏ S-30THE UNDERLYING REMIC CERTIFICATES S-14
CERTAIN ADDITIONAL FEDERALFINAL DATA STATEMENTÏÏÏÏÏÏÏÏÏÏÏÏÏÏÏÏ S-14 INCOME TAX CONSEQUENCES ÏÏÏÏ S-30
DISTRIBUTIONS OF INTEREST ÏÏÏÏÏÏÏÏÏÏÏÏ S-15 REMIC ELECTION AND SPECIAL TAX
ATTRIBUTES ÏÏÏÏÏÏÏÏÏÏÏÏÏÏÏÏÏÏÏÏÏÏÏÏÏ S-30Categories of ClassesÏÏÏÏÏÏÏÏÏÏÏÏÏÏÏÏÏÏ S-15
TAXATION OF BENEFICIAL OWNERS OFGeneral ÏÏÏÏÏÏÏÏÏÏÏÏÏÏÏÏÏÏÏÏÏÏÏÏÏÏÏÏÏ S-15REGULAR CERTIFICATESÏÏÏÏÏÏÏÏÏÏÏÏÏÏÏ S-31
Interest Accrual Periods ÏÏÏÏÏÏÏÏÏÏÏÏÏÏ S-16TAXATION OF BENEFICIAL OWNERS OFAccrual ClassesÏÏÏÏÏÏÏÏÏÏÏÏÏÏÏÏÏÏÏÏÏÏÏ S-16
RESIDUAL CERTIFICATES ÏÏÏÏÏÏÏÏÏÏÏÏÏÏ S-31Floating Rate and Inverse Floating Rate
TAXATION OF BENEFICIAL OWNERS OFClasses ÏÏÏÏÏÏÏÏÏÏÏÏÏÏÏÏÏÏÏÏÏÏÏÏÏÏÏÏ S-16RCR CERTIFICATESÏÏÏÏÏÏÏÏÏÏÏÏÏÏÏÏÏÏÏ S-31
CALCULATION OF LIBORÏÏÏÏÏÏÏÏÏÏÏÏÏÏÏÏ S-16General ÏÏÏÏÏÏÏÏÏÏÏÏÏÏÏÏÏÏÏÏÏÏÏÏÏÏÏÏÏ S-31
DISTRIBUTIONS OF PRINCIPALÏÏÏÏÏÏÏÏÏÏÏÏ S-17Combination RCR Classes ÏÏÏÏÏÏÏÏÏÏÏÏÏ S-31
Categories of ClassesÏÏÏÏÏÏÏÏÏÏÏÏÏÏÏÏÏÏ S-17Exchanges ÏÏÏÏÏÏÏÏÏÏÏÏÏÏÏÏÏÏÏÏÏÏÏÏÏÏÏ S-32
Principal Distribution Amount ÏÏÏÏÏÏÏÏ S-17PLAN OF DISTRIBUTIONÏÏÏÏÏÏÏÏÏÏÏÏÏ S-32
Group 1 Principal Distribution Amount S-18General ÏÏÏÏÏÏÏÏÏÏÏÏÏÏÏÏÏÏÏÏÏÏÏÏÏÏÏÏÏ S-32
Group 2 Principal Distribution Amount S-18Increase in CertiÑcatesÏÏÏÏÏÏÏÏÏÏÏÏÏÏÏÏ S-32
ZA Accrual Amount ÏÏÏÏÏÏÏÏÏÏÏÏÏÏÏÏ S-18LEGAL MATTERSÏÏÏÏÏÏÏÏÏÏÏÏÏÏÏÏÏÏÏÏÏ S-32
Group 2 Cash Flow DistributionEXHIBIT A ÏÏÏÏÏÏÏÏÏÏÏÏÏÏÏÏÏÏÏÏÏÏÏÏÏÏÏÏ A- 1Amount ÏÏÏÏÏÏÏÏÏÏÏÏÏÏÏÏÏÏÏÏÏÏÏÏÏ S-18
SCHEDULE 1ÏÏÏÏÏÏÏÏÏÏÏÏÏÏÏÏÏÏÏÏÏÏÏÏÏÏ A- 2Group 3 Principal Distribution Amount S-18
ZB Accrual Amount ÏÏÏÏÏÏÏÏÏÏÏÏÏÏÏÏ S-18 PRINCIPAL BALANCE SCHEDULES B- 1
S-2

AVAILABLE INFORMATION
You should purchase the certiÑcates only if you have read and understand this prospectussupplement and the following documents (the ""Disclosure Documents''):
‚ our Prospectus for Guaranteed REMIC Pass-Through CertiÑcates dated September 18, 1998(the ""REMIC Prospectus'');
‚ our Prospectus for Guaranteed Mortgage Pass-Through CertiÑcates dated October 1, 1998 (the""MBS Prospectus'');
‚ our Information Statement dated March 31, 1999 and its supplements (the ""InformationStatement''); and
‚ the disclosure document relating to the underlying REMIC certiÑcates (the ""UnderlyingREMIC Disclosure Document'').
You can obtain the Disclosure Documents by writing or calling us at:
Fannie MaeMBS Helpline3900 Wisconsin Avenue, N.W., Area 2H-3SWashington, D.C. 20016(telephone 1-800-237-8627 or 202-752-6547).
Most of the Disclosure Documents, together with the class factors, are available on our website locatedat http://www.fanniemae.com.
You also can obtain the Disclosure Documents, except the Underlying REMIC Disclosure Document,by writing or calling the dealer at:
Salomon Smith Barney Inc.Prospectus DepartmentBrooklyn Army Terminal140 58th Street, Suite 8-GBrooklyn, New York 11220(telephone 718-765-6732).
S-3

REFERENCE SHEET
This reference sheet is not a summary of the transaction and does not contain completeinformation about the certiÑcates. You should purchase the certiÑcates only after readingthis prospectus supplement and each of the additional disclosure documents listed onpage S-3.
Assets underlying each Group of Classes
Group Assets
1 Group 1 MBS
2 Group 2 MBS
3 Group 3 MBS
4 Group 4 MBS
5 Class 1999-28-JA REMIC CertiÑcate
6 Class 1999-28-YA REMIC CertiÑcate
Assumed Characteristics of the Mortgage Loans underlying the Trust MBS(as of June 1, 1999)
ApproximateOriginal Weighted Average Approximate
Approximate Term to Remaining Term Calculated ApproximatePrincipal Maturity to Maturity Loan Age WeightedBalance (in months) (in months) (in months) Average Coupon
Group 1 MBS ÏÏÏÏÏÏÏÏÏÏÏÏ $150,000,000 360 346 13 6.72%Group 2 MBS ÏÏÏÏÏÏÏÏÏÏÏÏ 308,370,723 360 336 22 7.21%
61,674,145 360 278 69 7.00%Group 3 MBS ÏÏÏÏÏÏÏÏÏÏÏÏ 350,000,000 360 346 13 6.72%Group 4 MBS ÏÏÏÏÏÏÏÏÏÏÏÏ 270,000,000 360 326 30 7.60%
The actual remaining terms to maturity, calculated loan ages and interest rates of most of themortgage loans will diÅer from the weighted averages shown above, perhaps signiÑcantly.
Characteristics of the Underlying REMIC CertiÑcates
Exhibit A describes the underlying REMIC certiÑcates, including certain information about therelated mortgage loans. To learn more about the underlying REMIC certiÑcates, you should obtain thecurrent principal factors and disclosure document for the underlying REMIC certiÑcates from us asdescribed on page S-3.
Class Factors
The class factors are numbers that, when multiplied by the initial principal balance of acertiÑcate, can be used to calculate the current principal balance of that certiÑcate (after taking intoaccount distributions in the same month). We publish the class factors on or shortly after the 11thday of each month.
Settlement Date
We expect to issue the certiÑcates on June 30, 1999.
S-4

Distribution Dates
We will make payments on the certiÑcates on the 25th day of each calendar month, or on the nextbusiness day if the 25th day is not a business day.
Book-Entry and Physical CertiÑcates
We issue book-entry certiÑcates through the U.S. Federal Reserve Banks, which will electronicallytrack ownership of the certiÑcates and payments on them. We will issue physical certiÑcates inregistered, certiÑcated form.
We will issue the classes of certiÑcates in the following forms:
Fed Book-Entry Physical
All classes other than the R Class R Class
Exchanging CertiÑcates Through Combination and Recombination
If you own certain certiÑcates, you will be able to exchange them for a proportionate interest inthe related RCR certiÑcates as shown on Schedule 1. We will issue the RCR certiÑcates upon suchexchange. You can exchange your certiÑcates by notifying us and paying an exchange fee. We use theprincipal and interest of the certiÑcates exchanged to pay principal and interest on the related RCRcertiÑcates. Schedule 1 lists all of the available combinations of the certiÑcates eligible for exchangeand the related RCR certiÑcates.
Interest Rates
During each interest accrual period, the Ñxed rate classes will bear interest at the applicableannual interest rates listed on the cover.
During the initial interest accrual period, the Öoating rate and inverse Öoating rate classes willbear interest at the initial interest rates listed below. During subsequent interest accrual periods, theÖoating rate and inverse Öoating rate classes will bear interest based on the formulas indicated below,but always subject to the speciÑed maximum and minimum interest rates:
Initial Maximum Minimum Formula forInterest Interest Interest Calculation of
Class Rate Rate Rate Interest Rate(1)
FA ÏÏÏÏÏÏÏÏÏÏÏÏÏÏÏÏ 5.37120% 8.00000% 0.45% LIBOR ° 45 basis pointsSA ÏÏÏÏÏÏÏÏÏÏÏÏÏÏÏÏ 11.39147% 32.71667% 0.00% 32.71667% ¿ (4.33333333 £ LIBOR)FB ÏÏÏÏÏÏÏÏÏÏÏÏÏÏÏÏ 5.48940% 8.50000% 0.55% LIBOR ° 55 basis pointsSB ÏÏÏÏÏÏÏÏÏÏÏÏÏÏÏÏ 7.22544% 19.08000% 0.00% (7.95% ¿ LIBOR) £ 2.4FC ÏÏÏÏÏÏÏÏÏÏÏÏÏÏÏÏ 5.45000% 8.50000% 0.45% LIBOR ° 45 basis pointsSC ÏÏÏÏÏÏÏÏÏÏÏÏÏÏÏÏ 7.32000% 19.32000% 0.00% (8.05% ¿ LIBOR) £ 2.4FD ÏÏÏÏÏÏÏÏÏÏÏÏÏÏÏÏ 5.45000% 8.50000% 0.45% LIBOR ° 45 basis pointsSD ÏÏÏÏÏÏÏÏÏÏÏÏÏÏÏÏ 7.32000% 19.32000% 0.00% (8.05% ¿ LIBOR) £ 2.4FE ÏÏÏÏÏÏÏÏÏÏÏÏÏÏÏÏ 5.45000% 8.50000% 0.45% LIBOR ° 45 basis pointsSE ÏÏÏÏÏÏÏÏÏÏÏÏÏÏÏÏ 7.32000% 19.32000% 0.00% (8.05% ¿ LIBOR) £ 2.4
(1) We will establish LIBOR on the basis of the ""BBA Method.''
We will apply interest payments from exchanged certiÑcates to the corresponding RCR certiÑ-cates, on a pro rata basis, following any exchange.
S-5

Distributions of Principal
Group 1 Principal Distribution Amount
To the A and B Classes, in that order, to zero.
Group 2 Principal Distribution Amount
ZA Accrual Amount
To the VA Class to zero, and thereafter to the ZA Class.
Group 2 Cash Flow Distribution Amount
1. To the PA and PC Classes, in that order, to their Planned Balances.
2. To the YA Class to its Targeted Balance.
3. To the FA and SA Classes, pro rata, to zero.
4. To the YA Class to zero.
5. To the PA and PC Classes, in that order, to zero.
6. To the VA and ZA Classes, in that order, to zero.
Group 3 Principal Distribution Amount
ZB Accrual Amount
To the FB and SB Classes, pro rata, to zero, and thereafter to the ZB Class.
Group 3 Cash Flow Distribution Amount
1. To the PD, PE, PG, PH, PK and PL Classes, in that order, to their Planned Balances.
2. To the FB and SB Classes, pro rata, to zero.
3. To the ZB Class to zero.
4. To the PD, PE, PG, PH, PK and PL Classes, in that order, to zero.
Group 4 Principal Distribution Amount
ZC Accrual Amount
To the DA, DB, DC and DE Classes, in that order, to zero, and thereafter to the ZC Class.
Group 4 Cash Flow Distribution Amount
1. To the PM and PN Classes, in that order, to their Planned Balances.
2. 6.666666667% of the remaining amount to the EA Class to zero.
3. To the JA Class to its Planned Balance.
4. To the CA, CB, DA, DB, DC, DE and ZC Classes, in that order, to zero.
5. To the JA, PM and PN Classes, in that order, to zero.
Group 5 Principal Distribution Amount
To the FC and SC Classes, pro rata, to zero.
S-6

Group 6 Principal Distribution Amount
To the FD and SD Classes, pro rata, to zero.
We will apply principal payments from exchanged certiÑcates to the corresponding RCRcertiÑcates, on a pro rata basis, following any exchange.
Weighted Average Lives (years)*
PSA Prepayment Assumption
Group 1 Classes 0% 100% 136% 350% 500%
A ÏÏÏÏÏÏÏÏÏÏÏÏÏÏÏÏÏÏÏÏÏÏÏÏÏÏÏÏÏÏÏÏÏÏÏÏÏÏÏÏÏÏÏÏÏ 18.0 6.8 5.5 2.5 1.8B ÏÏÏÏÏÏÏÏÏÏÏÏÏÏÏÏÏÏÏÏÏÏÏÏÏÏÏÏÏÏÏÏÏÏÏÏÏÏÏÏÏÏÏÏÏ 28.4 21.4 18.9 9.5 6.7
PSA Prepayment Assumption
Group 2 Classes 0% 100% 171% 250% 500%
PA ÏÏÏÏÏÏÏÏÏÏÏÏÏÏÏÏÏÏÏÏÏÏÏÏÏÏÏÏÏÏÏÏÏÏÏÏÏÏÏÏÏÏÏÏ 10.5 2.6 2.6 2.6 1.8PC ÏÏÏÏÏÏÏÏÏÏÏÏÏÏÏÏÏÏÏÏÏÏÏÏÏÏÏÏÏÏÏÏÏÏÏÏÏÏÏÏÏÏÏÏ 19.0 6.0 6.0 6.0 3.1YA ÏÏÏÏÏÏÏÏÏÏÏÏÏÏÏÏÏÏÏÏÏÏÏÏÏÏÏÏÏÏÏÏÏÏÏÏÏÏÏÏÏÏÏÏ 22.3 7.4 5.0 3.2 0.9FA and SAÏÏÏÏÏÏÏÏÏÏÏÏÏÏÏÏÏÏÏÏÏÏÏÏÏÏÏÏÏÏÏÏÏÏÏÏÏ 25.8 12.6 5.0 1.2 0.4VA ÏÏÏÏÏÏÏÏÏÏÏÏÏÏÏÏÏÏÏÏÏÏÏÏÏÏÏÏÏÏÏÏÏÏÏÏÏÏÏÏÏÏÏÏ 13.4 12.4 10.3 8.3 4.7ZA ÏÏÏÏÏÏÏÏÏÏÏÏÏÏÏÏÏÏÏÏÏÏÏÏÏÏÏÏÏÏÏÏÏÏÏÏÏÏÏÏÏÏÏÏ 28.6 22.1 19.0 15.7 9.1
PSA Prepayment Assumption
Group 3 Classes 0% 100% 135% 250% 500%
PD ÏÏÏÏÏÏÏÏÏÏÏÏÏÏÏÏÏÏÏÏÏÏÏÏÏÏÏÏÏÏÏÏÏÏÏÏÏÏÏÏÏÏÏÏ 9.0 2.5 2.5 2.5 1.9PE ÏÏÏÏÏÏÏÏÏÏÏÏÏÏÏÏÏÏÏÏÏÏÏÏÏÏÏÏÏÏÏÏÏÏÏÏÏÏÏÏÏÏÏÏ 15.4 4.5 4.5 4.5 2.7PG ÏÏÏÏÏÏÏÏÏÏÏÏÏÏÏÏÏÏÏÏÏÏÏÏÏÏÏÏÏÏÏÏÏÏÏÏÏÏÏÏÏÏÏÏ 18.1 6.0 6.0 6.0 3.2PHÏÏÏÏÏÏÏÏÏÏÏÏÏÏÏÏÏÏÏÏÏÏÏÏÏÏÏÏÏÏÏÏÏÏÏÏÏÏÏÏÏÏÏÏ 20.8 8.0 8.0 8.0 4.1PK ÏÏÏÏÏÏÏÏÏÏÏÏÏÏÏÏÏÏÏÏÏÏÏÏÏÏÏÏÏÏÏÏÏÏÏÏÏÏÏÏÏÏÏÏ 23.0 11.0 11.0 11.0 5.6PL ÏÏÏÏÏÏÏÏÏÏÏÏÏÏÏÏÏÏÏÏÏÏÏÏÏÏÏÏÏÏÏÏÏÏÏÏÏÏÏÏÏÏÏÏ 25.1 18.0 18.0 18.0 9.7FB and SBÏÏÏÏÏÏÏÏÏÏÏÏÏÏÏÏÏÏÏÏÏÏÏÏÏÏÏÏÏÏÏÏÏÏÏÏÏ 22.7 13.1 8.6 1.9 0.8ZB ÏÏÏÏÏÏÏÏÏÏÏÏÏÏÏÏÏÏÏÏÏÏÏÏÏÏÏÏÏÏÏÏÏÏÏÏÏÏÏÏÏÏÏÏ 29.1 25.2 23.5 6.1 1.7
PSA Prepayment Assumption
Group 4 Classes 0% 100% 182% 250% 500%
PMÏÏÏÏÏÏÏÏÏÏÏÏÏÏÏÏÏÏÏÏÏÏÏÏÏÏÏÏÏÏÏÏÏÏÏÏÏÏÏÏÏÏÏÏ 12.5 2.5 2.5 2.5 1.6PN ÏÏÏÏÏÏÏÏÏÏÏÏÏÏÏÏÏÏÏÏÏÏÏÏÏÏÏÏÏÏÏÏÏÏÏÏÏÏÏÏÏÏÏÏ 23.4 10.5 10.5 10.5 5.3EA ÏÏÏÏÏÏÏÏÏÏÏÏÏÏÏÏÏÏÏÏÏÏÏÏÏÏÏÏÏÏÏÏÏÏÏÏÏÏÏÏÏÏÏÏ 28.4 18.5 7.8 2.3 0.6
PSA Prepayment Assumption
0% 100% 152% 182% 250% 500%
JA ÏÏÏÏÏÏÏÏÏÏÏÏÏÏÏÏÏÏÏÏÏÏÏÏÏÏÏÏÏÏÏÏÏÏÏÏÏ 27.4 13.6 2.6 2.6 2.6 1.0CA ÏÏÏÏÏÏÏÏÏÏÏÏÏÏÏÏÏÏÏÏÏÏÏÏÏÏÏÏÏÏÏÏÏÏÏÏÏ 28.5 19.0 11.6 2.7 0.6 0.2CB ÏÏÏÏÏÏÏÏÏÏÏÏÏÏÏÏÏÏÏÏÏÏÏÏÏÏÏÏÏÏÏÏÏÏÏÏÏ 29.1 22.0 16.8 11.8 1.7 0.4DAÏÏÏÏÏÏÏÏÏÏÏÏÏÏÏÏÏÏÏÏÏÏÏÏÏÏÏÏÏÏÏÏÏÏÏÏÏ 5.3 5.3 5.3 5.3 2.2 0.5DBÏÏÏÏÏÏÏÏÏÏÏÏÏÏÏÏÏÏÏÏÏÏÏÏÏÏÏÏÏÏÏÏÏÏÏÏÏ 11.0 11.0 11.0 11.0 2.7 0.6DCÏÏÏÏÏÏÏÏÏÏÏÏÏÏÏÏÏÏÏÏÏÏÏÏÏÏÏÏÏÏÏÏÏÏÏÏÏ 14.0 14.0 14.0 13.9 2.9 0.6DEÏÏÏÏÏÏÏÏÏÏÏÏÏÏÏÏÏÏÏÏÏÏÏÏÏÏÏÏÏÏÏÏÏÏÏÏÏ 19.3 19.3 18.5 16.3 3.6 0.7ZC ÏÏÏÏÏÏÏÏÏÏÏÏÏÏÏÏÏÏÏÏÏÏÏÏÏÏÏÏÏÏÏÏÏÏÏÏÏ 29.7 25.2 23.3 21.8 6.0 0.8C ÏÏÏÏÏÏÏÏÏÏÏÏÏÏÏÏÏÏÏÏÏÏÏÏÏÏÏÏÏÏÏÏÏÏÏÏÏ 28.8 20.2 13.7 6.4 1.0 0.3
PSA Prepayment Assumption
Group 5 Classes 0% 100% 130% 350% 500%
FC, SC and JC ÏÏÏÏÏÏÏÏÏÏÏÏÏÏÏÏÏÏÏÏÏÏÏÏÏÏÏÏÏÏÏÏÏ 23.6 7.4 4.0 1.7 1.3PSA Prepayment Assumption
Group 6 Classes 0% 100% 130% 350% 500%
FD, SD and JDÏÏÏÏÏÏÏÏÏÏÏÏÏÏÏÏÏÏÏÏÏÏÏÏÏÏÏÏÏÏÏÏÏ 24.2 6.8 3.2 1.6 1.3
S-7

PSA Prepayment Assumption
Groups 5 and 6 Classes 0% 100% 130% 350% 500%
FE‰ and SE‰‰ÏÏÏÏÏÏÏÏÏÏÏÏÏÏÏÏÏÏÏÏÏÏÏÏÏÏÏÏÏÏÏÏÏÏ 23.9 7.1 3.5 1.6 1.3
* Determined as speciÑed under ""Description of the CertiÑcatesÌWeighted Average Lives of the CertiÑcates''herein.
‰ The FE Class is formed from a combination of the FC Class in Group 5 and the FD Class in Group 6. SeeSchedule 1 in this prospectus supplement.
‰‰ The SE Class is formed from a combination of the SC Class in Group 5 and the SD Class in Group 6. SeeSchedule 1 in this prospectus supplement.
S-8

ADDITIONAL RISK FACTORS
Rate of principal payments on the certiÑ- ‚ such classes otherwise have performed ascates will be aÅected by the rate of principal originally anticipated.payments on the underlying mortgage loans.
You may obtain additional informationThe rate that you receive principal payments onabout the underlying REMIC certiÑcates by re-the certiÑcates will be sensitive to the rate ofviewing our current class factors in light of otherprincipal payments on the mortgage loans un-information available in the related disclosurederlying the related MBS, including prepay-document. You may obtain this document fromments. Because borrowers generally may prepayus as described on page S-3.their mortgage loans at any time without pen-
alty, the rate of principal payments on the mort- Yields may be lower than expected due togage loans is likely to vary over time. It is highly unexpected rate of principal payments. The ac-unlikely that the mortgage loans will prepay tual yield on your certiÑcates probably will be
lower than you expect:‚ at any of the prepayment rates we as-
sumed in this prospectus supplement, or ‚ if you bought your certiÑcates at a pre-mium and principal payments are faster
‚ at any constant prepayment rate untilthan you expected, or
maturity.
‚ if you bought your certiÑcates at a dis-Principal payments on certain classes will count and principal payments are slower
also be aÅected by payment priorities governing than you expected.the underlying REMIC certiÑcates. If you investin any Group 5 or 6 Classes, the rate that you Furthermore, in the case of certiÑcates pur-receive principal payments will also be aÅected chased at a premium, you could lose money onby the priority sequence governing principal your investment if prepayments occur at a rapidpayments on the related underlying REMIC rate.certiÑcates.
You must make your own decisionsabout the various applicable assumptions,As described in the related disclosure docu-including prepayment assumptions, whenment, the underlying REMIC certiÑcates maydeciding whether to purchase thebe subsequent in payment priority to certaincertiÑcates.other classes issued from the related underlying
REMIC trust. As a result, such other classesWeighted average lives and yields on themay receive principal before principal is paid on
certiÑcates are aÅected by actual characteristicsthe underlying REMIC certiÑcates, possibly forof the underlying mortgage loans. We have as-long periods.sumed that the mortgage loans underlying theMBS have certain characteristics. However, theIn addition, the underlying REMIC certiÑ-actual mortgage loans probably will have diÅer-cates have principal balance schedules and, as aent characteristics from those we assumed. As aresult, may receive principal payments at ratesresult, your yields could be lower than you ex-faster or slower than would otherwise have beenpect, even if the mortgage loans prepay at thethe case. In some cases, they may receive noindicated constant prepayment rates. In addi-principal payments for extended periods. Pre-tion, slight diÅerences between the assumedpayments on the related mortgage loans maymortgage loan characteristics and the actualhave occurred at a rate faster or slower than themortgage loans could aÅect the weighted aver-rate initially assumed. This prospectus supple-age lives of the classes of certiÑcates.ment contains no information as to whether
Level of Öoating rate index aÅects yields on‚ such classes have adhered to their princi-certain certiÑcates. The yield on any Öoatingpal balance schedules,rate or inverse Öoating rate certiÑcate will be
‚ any related support classes remain out- aÅected by the level of its interest rate index. Ifstanding, or the level of the index diÅers from the level you
S-9

expect, then your actual yield may be lower than Some investors may be unable to buy cer-you expect. tain classes. Investors whose investment activi-
ties are subject to legal investment laws andDelay classes have lower yields and market
regulations, or to review by regulatory authori-values. Since certain classes do not receive inter-
ties, may be unable to buy certain certiÑcates.est immediately following each interest accrual
You should get legal advice to determineperiod, these classes have lower yields and lower
whether you may purchase the certiÑcates.market values than they would if there were nosuch delay. Uncertain market for the certiÑcates could
make them diÇcult to sell and cause their valuesReinvestment of certiÑcate payments may
to Öuctuate. We cannot be sure that a market fornot achieve same yields as certiÑcates. The rate
resale of the certiÑcates will develop. Further, ifof principal payments of the certiÑcates is un-
a market develops, it may not continue or becertain. You may be unable to reinvest the pay-
suÇciently liquid to allow you to sell your certif-ments on the certiÑcates at the same yields
icates. Even if you are able to sell your certiÑ-provided by the certiÑcates.
cates, the sale price may not be comparable toUnpredictable timing of last payment af- similar investments that have a developed mar-
fects yields on certiÑcates. The actual Ñnal pay- ket. Moreover, you may not be able to sell smallment of your class is likely to occur earlier, and or large amounts of certiÑcates at prices compa-could occur much earlier, than the Ñnal distribu- rable to those available to other investors. Yoution date listed on the cover page. If you as- should purchase certiÑcates only if you under-sumed the actual Ñnal payment will occur on the stand and can tolerate the risk that the value ofÑnal distribution date speciÑed, your yield could your certiÑcates will vary over time and thatbe lower than you expect. your certiÑcates may not be easily sold.
DESCRIPTION OF THE CERTIFICATES
The material under this heading summarizes certain features of the CertiÑcates. You will Ñndadditional information about the CertiÑcates in the other sections of this Prospectus Supplement, aswell as in the additional Disclosure Documents and the Trust Agreement. If we use a capitalized termin this Prospectus Supplement without deÑning it, you will Ñnd the deÑnition of such term in theapplicable Disclosure Documents or in the Trust Agreement.
General
Structure. We will create the Fannie Mae REMIC Trust speciÑed on the cover (the ""Trust'')pursuant to a trust agreement dated as of June 1, 1999. We will issue the Guaranteed REMIC Pass-Through CertiÑcates (the ""REMIC CertiÑcates'') pursuant to that trust agreement. We will issue theCombinable and Recombinable REMIC CertiÑcates (the ""RCR CertiÑcates'' and, together with theREMIC CertiÑcates, the ""CertiÑcates'') pursuant to a separate trust agreement dated as of June 1,1999 (together with the trust agreement relating to the REMIC CertiÑcates, the ""Trust Agreement'').We will execute the Trust Agreement in our corporate capacity and as trustee (the ""Trustee''). Ingeneral, the term ""Classes'' includes the Classes of REMIC CertiÑcates and RCR CertiÑcates.
The Trust will constitute a ""real estate mortgage investment conduit'' (""REMIC'') under theInternal Revenue Code of 1986, as amended (the ""Code'').
‚ The REMIC CertiÑcates (except the R Class) will be ""regular interests'' in the Trust.
‚ The R Class will be the ""residual interest'' in the Trust.
The assets of the Trust will consist of
‚ four groups of Fannie Mae Guaranteed Mortgage Pass-Through CertiÑcates (the ""Group 1MBS'', ""Group 2 MBS'', ""Group 3 MBS'' and ""Group 4 MBS'' and, together, the ""TrustMBS''), and
S-10

‚ certain previously issued REMIC certiÑcates (the ""Group 5 Underlying REMIC CertiÑcate''and ""Group 6 Underlying REMIC CertiÑcate'' and, together, the ""Underlying REMIC CertiÑ-cates'') evidencing beneÑcial ownership interests in the related Fannie Mae REMIC trust (the""Underlying REMIC Trust'') as further described in Exhibit A.
The assets of the Underlying REMIC Trust evidence direct or indirect beneÑcial ownershipinterests in certain Fannie Mae Guaranteed Mortgage Pass-Through CertiÑcates (together with theTrust MBS, the ""MBS'').
Each MBS represents a beneÑcial ownership interest in a pool (each, a ""Pool'') of Ñrst lien,single-family, Ñxed-rate residential mortgage loans (the ""Mortgage Loans'') having the characteristicsdescribed herein.
Fannie Mae Guaranty. We guarantee that we will distribute to CertiÑcateholders:
‚ required installments of principal and interest on the CertiÑcates on time, and
‚ the principal balance of each Class of CertiÑcates no later than its Final Distribution Date,whether or not we have received suÇcient payments on the MBS.
In addition, we guarantee that we will distribute to each holder of an MBS:
‚ scheduled installments of principal and interest on the underlying Mortgage Loans on time,whether or not the related borrowers pay us, and
‚ the full principal balance of any foreclosed Mortgage Loan, whether or not we recover it.
Our guaranty obligations with respect to the Underlying REMIC CertiÑcates are described in theUnderlying REMIC Disclosure Document. Our guarantees are not backed by the full faith and creditof the United States. See ""Description of CertiÑcatesÌThe Fannie Mae Guaranty'' in the REMICProspectus, ""Description of CertiÑcatesÌThe Fannie Mae Guaranty'' in the MBS Prospectus, and""Description of the CertiÑcatesÌGeneralÌFannie Mae Guaranty'' in the Underlying REMIC Disclo-sure Document.
Characteristics of CertiÑcates. We will issue the CertiÑcates (except the R Class) in book-entryform on the book-entry system of the U.S. Federal Reserve Banks. Entities whose names appear onthe book-entry records of a Federal Reserve Bank as having had CertiÑcates deposited in theiraccounts are ""Holders'' or ""CertiÑcateholders.'' A Holder is not necessarily the beneÑcial owner of aCertiÑcate. BeneÑcial owners ordinarily will hold CertiÑcates through one or more Ñnancial in-termediaries, such as banks, brokerage Ñrms and securities clearing organizations. See ""Description ofCertiÑcatesÌDenominations, CertiÑcate Form'' in the REMIC Prospectus.
We will issue the R CertiÑcate in fully registered, certiÑcated form. The ""Holder'' or ""CertiÑcate-holder'' of the R CertiÑcate is its registered owner. The R CertiÑcate can be transferred at thecorporate trust oÇce of the Transfer Agent, or at the oÇce of the Transfer Agent in New York, NewYork. State Street Bank and Trust Company in Boston, Massachusetts (""State Street'') will be theinitial Transfer Agent. We may impose a service charge for any registration of transfer of theR CertiÑcate and may require payment to cover any tax or other governmental charge. See also""Characteristics of the R Class.''
The Holder of the R Class will receive the proceeds of any remaining assets of the Trust only bypresenting and surrendering such CertiÑcate at the oÇce of the Paying Agent. State Street will be theinitial Paying Agent.
Authorized Denominations. We will issue the CertiÑcates, other than the R CertiÑcate, inminimum denominations of $1,000 and whole dollar increments. We will issue the R Class as a singleCertiÑcate with no principal balance.
Distribution Dates. We will make monthly payments on the CertiÑcates on the 25th day of eachmonth (or, if the 25th is not a business day, on the Ñrst business day after the 25th). We refer to each
S-11

such date as a ""Distribution Date.'' We will make the Ñrst payments to CertiÑcateholders the monthafter we issue the CertiÑcates.
Record Date. On each Distribution Date, we will make each monthly payment on the CertiÑ-cates to Holders of record on the last day of the preceding month.
Class Factors. On or shortly after the eleventh calendar day of each month, we will publish afactor (carried to eight decimal places) for each Class of CertiÑcates. When the factor is multiplied bythe original principal balance of a CertiÑcate of that Class, the product will equal the current principalbalance of that CertiÑcate after taking into account payments on the Distribution Date in the samemonth (as well as any addition to principal in the case of each Accrual Class).
Optional Termination. We will not terminate the Trust by exercising our right to repurchase theMortgage Loans underlying any MBS unless
‚ only one Mortgage Loan remains in the related Pool, or
‚ the principal balance of the Pool is less than one percent of its original level.
See ""Description of CertiÑcatesÌTermination'' in the MBS Prospectus.
Voting the Underlying REMIC CertiÑcates. Holders of certiÑcates of the Underlying REMICTrust may be asked to vote on issues arising under the applicable trust agreement. If so, the Trusteewill vote the related Underlying REMIC CertiÑcates as instructed by Holders of CertiÑcates of theClasses backed by such Underlying REMIC CertiÑcates. The Trustee must receive instructions fromHolders of CertiÑcates having principal balances totaling at least 51% of the aggregate principalbalance of all such Classes outstanding. In the absence of such instructions, the Trustee will vote in amanner consistent, in its sole judgment, with the best interests of CertiÑcateholders.
Combination and Recombination
General. You are permitted to exchange all or a portion of the CA, CB, FC, SC, FD andSD Classes of REMIC CertiÑcates for a proportionate interest in the related Combinable andRecombinable REMIC CertiÑcates (""RCR CertiÑcates'') in the combinations shown on Schedule 1.You also may exchange all or a portion of the RCR CertiÑcates for the related REMIC CertiÑcates inthe same manner. This process may occur repeatedly.
Holders of RCR CertiÑcates will be the beneÑcial owners of a proportionate interest in the relatedREMIC CertiÑcates and will receive a proportionate share of the distributions on the related REMICCertiÑcates.
The Classes of REMIC CertiÑcates and RCR CertiÑcates that are outstanding at any given time,and the outstanding principal balances of these Classes, will depend upon any related distributions ofprincipal, as well as any exchanges that occur. The principal balances of the REMIC CertiÑcates andRCR CertiÑcates involved in any exchange will bear the same relationship as that borne by theoriginal principal balances of the related Classes.
Procedures. If a CertiÑcateholder wishes to exchange CertiÑcates, the CertiÑcateholder mustnotify our Structured Transactions Department through one of our ""REMIC Dealer Group'' dealers inwriting or by telefax no later than two business days before the proposed exchange date. The exchangedate can be any business day other than the Ñrst or last business day of the month subject to ourapproval. The notice must include the outstanding principal balance of both the CertiÑcates to beexchanged and the CertiÑcates to be received, and the proposed exchange date. After receiving theHolder's notice, we will telephone the dealer with delivery and wire payment instructions. Noticebecomes irrevocable on the second business day before the proposed exchange date.
In connection with each exchange, the Holder must pay us a fee equal to 1/32 of 1% of theoutstanding principal balance (exclusive of any notional principal balance) of the CertiÑcates to beexchanged. In no event, however, will our fee be less than $2,000.
S-12

We will make the Ñrst distribution on a REMIC CertiÑcate or an RCR CertiÑcate received in anexchange transaction on the Distribution Date in the following month. We will make such distributionto the Holder of record as of the close of business on the last day of the month of the exchange.
Additional Considerations. The characteristics of RCR CertiÑcates will reÖect the characteris-tics of the REMIC CertiÑcates used to form such RCR CertiÑcates. You should also consider a numberof factors that will limit a CertiÑcateholder's ability to exchange REMIC CertiÑcates for RCRCertiÑcates or vice versa:
‚ At the time of the proposed exchange, a CertiÑcateholder must own CertiÑcates of the relatedClass or Classes in the proportions necessary to make the desired exchange.
‚ A CertiÑcateholder that does not own the CertiÑcates may be unable to obtain the necessaryREMIC CertiÑcates or RCR CertiÑcates.
‚ The CertiÑcateholder of needed CertiÑcates may refuse to sell them at a reasonable price (orany price) or may be unable to sell them.
‚ Certain CertiÑcates may have been purchased and placed into other Ñnancial structures andthus be unavailable.
‚ Principal distributions will decrease the amounts available for exchange over time.
‚ Only the combinations listed on Schedule 1 are permitted.
The Trust MBS
The following table contains certain information about the Trust MBS. The Trust MBS includedin each speciÑed Group will have the aggregate unpaid principal balance and Pass-Through Rateshown below and the general characteristics described in the MBS Prospectus. The Trust MBS willprovide that principal and interest on the related Mortgage Loans will be passed through monthly,beginning in the month after we issue the Trust MBS. The Mortgage Loans underlying the TrustMBS will be conventional Level Payment Mortgage Loans secured by Ñrst mortgages or deeds of truston one- to four-family (""single-family'') residential properties. These Mortgage Loans will haveoriginal maturities of up to 30 years. See ""The Mortgage Pools'' and ""Yield Considerations'' in theMBS Prospectus. We expect the characteristics of the Group 1 MBS, Group 2 MBS, Group 3 MBSand Group 4 MBS and the related Mortgage Loans as of June 1, 1999 (the ""Issue Date'') to be asfollows:
Group 1 MBSAggregate Unpaid Principal BalanceÏÏÏÏÏÏÏÏÏÏÏÏÏÏÏÏÏÏÏÏÏÏ $150,000,000MBS Pass-Through Rate ÏÏÏÏÏÏÏÏÏÏÏÏÏÏÏÏÏÏÏÏÏÏÏÏÏÏÏÏÏÏÏ 6.00%
Related Mortgage LoansRange of WACs (per annum percentages) ÏÏÏÏÏÏÏÏÏÏÏÏÏÏÏÏ 6.25% to 8.50%Range of WAMs ÏÏÏÏÏÏÏÏÏÏÏÏÏÏÏÏÏÏÏÏÏÏÏÏÏÏÏÏÏÏÏÏÏÏÏÏÏÏÏ 241 months to 360 monthsApproximate Weighted Average WAMÏÏÏÏÏÏÏÏÏÏÏÏÏÏÏÏÏÏÏÏ 346 monthsApproximate Weighted Average CAGE ÏÏÏÏÏÏÏÏÏÏÏÏÏÏÏÏÏÏÏ 13 months
S-13

Group 2 MBSAggregate Unpaid Principal BalanceÏÏÏÏÏÏÏÏÏÏÏÏÏÏÏÏÏÏÏÏÏÏ $370,044,868MBS Pass-Through Rate ÏÏÏÏÏÏÏÏÏÏÏÏÏÏÏÏÏÏÏÏÏÏÏÏÏÏÏÏÏÏÏ 6.50%
Related Mortgage LoansRange of WACs (per annum percentages) ÏÏÏÏÏÏÏÏÏÏÏÏÏÏÏÏ 6.75% to 9.00%Range of WAMs ÏÏÏÏÏÏÏÏÏÏÏÏÏÏÏÏÏÏÏÏÏÏÏÏÏÏÏÏÏÏÏÏÏÏÏÏÏÏÏ 241 months to 360 monthsApproximate Weighted Average WAMÏÏÏÏÏÏÏÏÏÏÏÏÏÏÏÏÏÏÏÏ 326 monthsApproximate Weighted Average CAGE ÏÏÏÏÏÏÏÏÏÏÏÏÏÏÏÏÏÏÏ 30 months
Group 3 MBSAggregate Unpaid Principal BalanceÏÏÏÏÏÏÏÏÏÏÏÏÏÏÏÏÏÏÏÏÏÏ $350,000,000MBS Pass-Through Rate ÏÏÏÏÏÏÏÏÏÏÏÏÏÏÏÏÏÏÏÏÏÏÏÏÏÏÏÏÏÏÏ 6.00%
Related Mortgage LoansRange of WACs (per annum percentages) ÏÏÏÏÏÏÏÏÏÏÏÏÏÏÏÏ 6.25% to 8.50%Range of WAMs ÏÏÏÏÏÏÏÏÏÏÏÏÏÏÏÏÏÏÏÏÏÏÏÏÏÏÏÏÏÏÏÏÏÏÏÏÏÏÏ 241 months to 360 monthsApproximate Weighted Average WAMÏÏÏÏÏÏÏÏÏÏÏÏÏÏÏÏÏÏÏÏ 346 monthsApproximate Weighted Average CAGE ÏÏÏÏÏÏÏÏÏÏÏÏÏÏÏÏÏÏÏ 13 months
Group 4 MBSAggregate Unpaid Principal BalanceÏÏÏÏÏÏÏÏÏÏÏÏÏÏÏÏÏÏÏÏÏÏ $270,000,000MBS Pass-Through Rate ÏÏÏÏÏÏÏÏÏÏÏÏÏÏÏÏÏÏÏÏÏÏÏÏÏÏÏÏÏÏÏ 7.00%
Related Mortgage LoansRange of WACs (per annum percentages) ÏÏÏÏÏÏÏÏÏÏÏÏÏÏÏÏ 7.25% to 9.50%Range of WAMs ÏÏÏÏÏÏÏÏÏÏÏÏÏÏÏÏÏÏÏÏÏÏÏÏÏÏÏÏÏÏÏÏÏÏÏÏÏÏÏ 241 months to 360 monthsApproximate Weighted Average WAMÏÏÏÏÏÏÏÏÏÏÏÏÏÏÏÏÏÏÏÏ 326 monthsApproximate Weighted Average CAGE ÏÏÏÏÏÏÏÏÏÏÏÏÏÏÏÏÏÏÏ 30 months
The Underlying REMIC CertiÑcates
The Underlying REMIC CertiÑcates represent beneÑcial ownership interests in the relatedUnderlying REMIC Trust. The assets of this trust evidence direct or indirect beneÑcial ownershipinterests in certain MBS having the general characteristics set forth in the MBS Prospectus. EachMBS evidences beneÑcial ownership interests in a Pool of conventional Level Payment MortgageLoans secured by Ñrst mortgages or deeds of trust on single-family residential properties, as describedunder ""The Mortgage Pools'' and ""Yield Considerations'' in the MBS Prospectus. Distributions onthe Underlying REMIC CertiÑcates will be passed through monthly, beginning in the month after weissue the CertiÑcates. The general characteristics of the Underlying REMIC CertiÑcates are describedin the Underlying REMIC Disclosure Document.
See Exhibit A for additional information about the Underlying REMIC CertiÑcates.
For further information about the Underlying REMIC CertiÑcates, telephone us at 1-800-237-8627 or 202-752-6547. You also may obtain certain information in electronic form by calling us at1-800-752-6440 or 202-752-6000. There may have been material changes in facts and circumstancessince the date we prepared the Underlying REMIC Disclosure Document. These may include changesin prepayment speeds, prevailing interest rates and other economic factors. As a result, the usefulnessof the information set forth in such document may be limited.
Final Data Statement
After issuing the CertiÑcates, we will prepare a Final Data Statement containing certaininformation, including the principal balances of the Underlying REMIC CertiÑcates as of the IssueDate, and with respect to the Trust MBS, the Pool number, the current WAC (or original WAC, if thecurrent WAC is not available) and the current WAM (or Adjusted WAM, if the current WAM is notavailable) of the Mortgage Loans underlying the Trust MBS. The Final Data Statement will also
S-14

include the weighted averages of all the current or original WACs and the weighted averages of all thecurrent or Adjusted WAMs, based on the current unpaid principal balances of the Mortgage Loansunderlying each of the Trust MBS as of the Issue Date. You may obtain the Final Data Statement bytelephoning us at 1-800-237-8627 or 202-752-6547. The contents of the Final Data Statement andother data speciÑc to the CertiÑcates are available in electronic form by calling us at 1-800-752-6440or 202-752-6000.
Distributions of Interest
Categories of Classes
For the purpose of interest payments, the Classes will be categorized as follows:
Interest Type* Classes
Group 1 ClassesFixed Rate A and B
Group 2 ClassesFixed Rate PA, PC, YA, VA and ZAFloating Rate FAInverse Floating Rate SAAccrual ZA
Group 3 ClassesFixed Rate PD, PE, PG, PH, PK, PL and ZBFloating Rate FBInverse Floating Rate SBAccrual ZB
Group 4 ClassesFixed Rate PM, PN, JA, CA, CB, DA, DB, DC, DE and ZCAccrual ZCPrincipal Only EARCR** C
Group 5 ClassesFloating Rate FCInverse Floating Rate SCRCR** JC, FE‰ and SE‰‰
Group 6 ClassesFloating Rate FDInverse Floating Rate SDRCR** JD, FE‰ and SE‰‰
No Payment Residual R
* See ""Description of CertiÑcatesÌClass DeÑnitions and Abbreviations'' in the REMIC Prospectus.** See ""Description of the CertiÑcatesÌCombination and Recombination'' herein and Schedule 1 for a further
description of the RCR Classes.‰ The FE Class is formed from a combination of the FC Class in Group 5 and the FD Class in Group 6. See
Schedule 1 in this prospectus supplement.‰‰ The SE Class is formed from a combination of the SC Class in Group 5 and the SD Class in Group 6. See
Schedule 1 in this prospectus supplement.
General. We will pay interest on the interest-bearing CertiÑcates at the applicable annualinterest rates shown on the cover or described in this prospectus supplement. We calculate interestbased on a 360-day year consisting of twelve 30-day months. We pay interest monthly (except in thecase of the Accrual Classes) on each Distribution Date, beginning in the month after the SettlementDate speciÑed in the Reference Sheet.
S-15

Interest to be paid (or added to principal, in the case of the Accrual Classes) on each CertiÑcateon a Distribution Date will consist of one month's interest on the outstanding balance of thatCertiÑcate immediately prior to such Distribution Date. For a description of the Accrual Classes, see""ÌAccrual Classes.''
Interest payments on exchangeable REMIC CertiÑcates will be applied to the corresponding RCRCertiÑcates, on a pro rata basis, following any exchange.
Interest Accrual Periods. Interest to be paid on each Distribution Date will accrue on theinterest-bearing CertiÑcates during the applicable one-month periods set forth below (each, an""Interest Accrual Period'').
Classes Interest Accrual Periods
All Fixed Rate Classes (collectively, the Calendar month preceding the month in""Delay Classes'') which the Distribution Date occurs
All Floating Rate and Inverse Floating Rate One month period ending on the dayClasses preceding the Distribution Date
See ""Additional Risk Factors'' in this Prospectus Supplement.
We will treat the EA Class as a Delay Class for the sole purpose of facilitating trading.
Accrual Classes. The ZA, ZB and ZC Classes are Accrual Classes. Interest will accrue on theAccrual Classes at the applicable annual rates listed on the cover. However, we will not pay anyinterest on the Accrual Classes. Instead, interest accrued on the Accrual Classes will be added asprincipal to their principal balances on each Distribution Date. We will pay principal on the AccrualClasses as described under ""Distributions of Principal'' below.
Floating Rate and Inverse Floating Rate Classes. During each Interest Accrual Period, theFloating Rate and Inverse Floating Rate Classes will bear interest at rates determined as describedunder ""Reference SheetÌInterest Rates.''
Changes in the speciÑed interest rate index (the ""Index'') will aÅect the yields with respect to therelated Classes. These changes may not correspond to changes in mortgage interest rates. Lowermortgage interest rates could occur while an increase in the level of the Index occurs. Similarly, highermortgage interest rates could occur while a decrease in the level of the Index occurs.
Our establishment of each Index value and our determination of the interest rate for eachapplicable Class for the related Interest Accrual Period will be Ñnal and binding in the absence ofmanifest error. You may obtain each such interest rate by telephoning us at 1-800-237-8627 or202-752-6547.
Calculation of LIBOR
On each Index Determination Date, we will calculate LIBOR for the related Interest AccrualPeriod. We will calculate LIBOR on the basis of the ""BBA Method'' as described in the REMICProspectus under ""Description of CertiÑcatesÌIndexes for Floating Rate Classes and InverseFloating Rate ClassesÌLIBOR.''
If we are unable to calculate LIBOR on the initial Index Determination Date, LIBOR for thefollowing Interest Accrual Period will be equal to 4.9212% for the FA and SA Classes, 4.9394% for theFB and SB Classes, and 5.0% for the FC, FD, FE, SC, SD and SE Classes.
S-16

Distributions of Principal
Categories of Classes
For the purpose of principal payments, the Classes fall into the following categories:
Principal Type* Classes
Group 1 ClassesSequential Pay A and B
Group 2 ClassesPAC PA and PCTAC YASupport FA and SASequential Pay VA and ZAAccretion Directed VA
Group 3 ClassesPAC PD, PE, PG, PH, PK and PLSupport FB, SB and ZBAccretion Directed FB and SB
Group 4 ClassesPAC PM, PN and JASupport CA, CB, DA, DB, DC, DE, ZC and EAAccretion Directed DA, DB, DC and DERCR** C
Group 5 ClassesStructured Collateral/Pass-Through FC and SCRCR** JC, FE‰ and SE‰‰
Group 6 ClassesStructured Collateral/Pass-Through FD and SDRCR** JD, FE‰ and SE‰‰
No Payment Residual R
* See ""Description of CertiÑcatesÌClass DeÑnitions and Abbreviations'' in the REMIC Prospectus.** See ""Description of the CertiÑcatesÌCombination and Recombination'' herein and Schedule 1 for a further
description of the RCR Class.‰ The FE Class is formed from a combination of the FC Class in Group 5 and the FD Class in Group 6. See
Schedule 1 in this prospectus supplement.‰‰ The SE Class is formed from a combination of the SC Class in Group 5 and the SD Class in Group 6. See
Schedule 1 in this prospectus supplement.
Principal Distribution Amount
On the Distribution Date in each month, we will pay principal on the CertiÑcates in an aggregateamount (the ""Principal Distribution Amount'') equal to the sum of
‚ the principal then paid on the Group 1 MBS (the ""Group 1 Principal Distribution Amount''),
‚ the principal then paid on the Group 2 MBS (the ""Group 2 Cash Flow Distribution Amount'')plus any interest then accrued and added to the principal balance of the ZA Class (the""ZA Accrual Amount,'' and together with the Group 2 Cash Flow Distribution Amount, the""Group 2 Principal Distribution Amount''),
‚ the principal then paid on the Group 3 MBS (the ""Group 3 Cash Flow Distribution Amount'')plus any interest then accrued and added to the principal balance of the ZB Class (the ""ZBAccrual Amount,'' and together with the Group 3 Cash Flow Distribution Amount, the""Group 3 Principal Distribution Amount''),
S-17

‚ the principal then paid on the Group 4 MBS (the ""Group 4 Cash Flow Distribution Amount'')plus any interest then accrued and added to the principal balance of the ZC Class (the ""ZCAccrual Amount,'' and together with the Group 4 Cash Flow Distribution Amount, the""Group 4 Principal Distribution Amount''),
‚ the principal then paid on the Group 5 Underlying REMIC CertiÑcate (the ""Group 5 PrincipalDistribution Amount''), and
‚ the principal then paid on the Group 6 Underlying REMIC CertiÑcate (the ""Group 6 PrincipalDistribution Amount'').
The portion of each class of Underlying REMIC CertiÑcates held by the Lower Tier REMIC willbe set forth in Exhibit A.
Group 1 Principal Distribution Amount
On each Distribution Date, we will pay the Group 1 Principal Distribution Amount, E
SequentialPaysequentially, as principal of the A and B Classes, in that order, until their principal F
Classes
balances are reduced to zero. H
Group 2 Principal Distribution Amount
ZA Accrual Amount
AccretionOn each Distribution Date, we will pay the ZA Accrual Amount as principal of the EDirectedClassVA Class, until its principal balance is reduced to zero. Thereafter, we will pay the ZA FandAccrualAccrual Amount as principal of the ZA Class. HClass
Group 2 Cash Flow Distribution Amount
On each Distribution Date, we will pay the Group 2 Cash Flow Distribution Amount as principalof the Group 2 Classes in the following priority:
E(i) sequentially, to the PA and PC Classes, in that order, until their principal PACFClasses
balances are reduced to their Planned Balances for such Distribution Date; H
E(ii) to the YA Class, until its principal balance is reduced to its Targeted TACFClass
Balance for such Distribution Date; H
E(iii) concurrently, to the FA and SA Classes, pro rata (or 81.2499993906% and SupportFClasses
18.7500006094%, respectively), until their principal balances are reduced to zero; H
E(iv) to the YA Class, without regard to its Targeted Balance and until its TACFClass
principal balance is reduced to zero; H
E(v) sequentially, to the PA and PC Classes, in that order, without regard to PACFClassestheir Planned Balances and until their principal balances are reduced to zero; andH
ESequential(vi) sequentially, to the VA and ZA Classes, in that order, until their principalPay
F
Classesbalances are reduced to zero.H
Group 3 Principal Distribution Amount
ZB Accrual Amount
On each Distribution Date, we will pay the ZB Accrual Amount, concurrently, as EAccretionDirectedprincipal of the FB and SB Classes, pro rata (or 70.5882355106% and 29.4117644894%, Classes
Fandrespectively), until their principal balances are reduced to zero. Thereafter, we will pay AccrualClassthe ZB Accrual Amount as principal of the ZB Class. H
S-18

Group 3 Cash Flow Distribution Amount
On each Distribution Date, we will pay the Group 3 Cash Flow Distribution Amount as principalof the Group 3 Classes in the following priority:
E(i) sequentially, to the PD, PE, PG, PH, PK and PL Classes, in that order,PAC
Funtil their principal balances are reduced to their Planned Balances for such Distribu- Classes
tion Date; H
E(ii) concurrently, to the FB and SB Classes, pro rata, until their principalSupportbalances are reduced to zero;
FClasses
(iii) to the ZB Class, until its principal balance is reduced to zero; and H
E(iv) sequentially, to the PD, PE, PG, PH, PK and PL Classes, in that order,PAC
Fwithout regard to their Planned Balances and until their principal balances are Classes
reduced to zero. H
Group 4 Principal Distribution Amount
ZC Accrual Amount
On each Distribution Date, we will pay the ZC Accrual Amount, sequentially, as EAccretionDirectedprincipal of the DA, DB, DC and DE Classes, in that order, until their principal balances Classes
Fandare reduced to zero. Thereafter, we will pay the ZC Accrual Amount as principal of the AccrualClassZC Class. H
Group 4 Cash Flow Distribution Amount
On each Distribution Date, we will pay the Group 4 Cash Flow Distribution Amount as principalof the Group 4 Classes in the following priority:
E(i) sequentially, to the PM and PN Classes, in that order, until their principal PACFClasses
balances are reduced to their Planned Balances for such Distribution Date; H
E(ii) 6.666666667% of the remaining amount to the EA Class, until its principal SupportFClass
balance is reduced to zero; H
E(iii) to the JA Class, until its principal balance is reduced to its Planned PACFClass
Balance for such Distribution Date; H
E(iv) sequentially, to the CA, CB, DA, DB, DC, DE and ZC Classes, in that SupportFClasses
order, until their principal balances are reduced to zero; and H
E(v) sequentially, to the JA, PM and PN Classes, in that order, without regard PACFClasses
to their Planned Balances and until their principal balances are reduced to zero. H
Group 5 Principal Distribution Amount
On each Distribution Date, we will pay the Group 5 Principal Distribution Amount, EStructuredCollateral/concurrently, as principal of the FC and SC Classes, pro rata (or 70.5882352369% and FPass-ThroughClasses29.4117647631%, respectively), until their principal balances are reduced to zero. H
Group 6 Principal Distribution Amount
On each Distribution Date, we will pay the Group 6 Principal Distribution Amount, EStructuredCollateral/concurrently, as principal of the FD and SD Classes, pro rata (or 70.5882349509% and FPass-ThroughClasses29.4117650491%, respectively), until their principal balances are reduced to zero. H
S-19

Principal payments on exchangeable REMIC CertiÑcates will be applied to the correspondingRCR CertiÑcates, on a pro rata basis, following any exchange.
Structuring Assumptions
Pricing Assumptions. Except where otherwise noted, the information in the tables in thisprospectus supplement has been prepared based on the actual characteristics of each Pool of MortgageLoans underlying the Underlying REMIC CertiÑcates, the priority sequence aÅecting the principalpayments on the Underlying REMIC CertiÑcates and the following assumptions (such characteristicsand assumptions, the ""Pricing Assumptions''):
‚ the Mortgage Loans underlying the Trust MBS have the original terms to maturity, remainingterms to maturity, CAGEs and interest rates speciÑed under ""Reference SheetÌAssumedCharacteristics of the Mortgage Loans underlying the Trust MBS'';
‚ the Mortgage Loans prepay at the constant percentages of PSA speciÑed in the related table;and
‚ the settlement date for the sale of the CertiÑcates is June 30, 1999.
Prepayment Assumptions. Prepayments of mortgage loans commonly are measured relative to aprepayment standard or model. The model used here is The Bond Market Association's standardprepayment model (""PSA''). To assume a speciÑed rate of PSA is to assume a speciÑed rate ofprepayment each month of the then-outstanding principal balance of a pool of new mortgage loanscomputed as described under ""Description of CertiÑcatesÌPrepayment Models'' in the REMICProspectus. It is highly unlikely that prepayments will occur at any constant PSA rate or at any otherconstant rate.
Structuring Ranges and Rate. The Principal Balance Schedules are found beginning onpage B-1. The Principal Balance Schedules have been prepared on the basis of the Pricing Assump-tions and the assumption that the Mortgage Loans will prepay at a constant PSA rate within theapplicable Structuring Range or at the applicable rate set forth below.
Principal BalanceSchedule References Related Classes Structuring Ranges and Rate
Planned Balances PA, PC, PD, PE, PG, PH, PK, PL, Between 100% and 250%PM and PN
Planned Balances JA Between 152% and 250%Targeted Balances YA 171%
We cannot assure you that the balance of any Class listed above will conform on anyDistribution Date to the speciÑed balance in the Principal Balance Schedules. As a result,we cannot assure you that payments of principal of any Class listed above will begin or endon the Distribution Dates speciÑed in the Principal Balance Schedules. We will distribute anyexcess of principal payments over the amount needed to reduce a Class to its scheduled balance on aDistribution Date. Accordingly, the ability to reduce a Class to its scheduled balance will not beimproved by the averaging of high and low principal payments from month to month. In addition,even if the related Mortgage Loans prepay at rates falling within the applicable Structuring Range,principal distributions may be insuÇcient to reduce the related Classes to their scheduled balances ifsuch prepayments do not occur at a constant PSA rate. Moreover, because of the diverse remainingterms to maturity of the related Mortgage Loans, which may include recently originated MortgageLoans, the Classes speciÑed above may not be reduced to their scheduled balances, even if prepay-ments occur at a constant rate within the applicable Structuring Range or at the applicable ratespeciÑed above.
Initial EÅective Ranges. The EÅective Range for a Class is the range of prepayment rates(measured by constant PSA rates) that would reduce such Class to its scheduled balance on each
S-20

Distribution Date. The Initial EÅective Ranges shown in the table below are based upon the assumedcharacteristics of the related Mortgage Loans speciÑed in the Pricing Assumptions.
Classes Initial EÅective Ranges
PA Between 100% and 286%PC Between 100% and 260%PD Between 100% and 300%PE Between 100% and 278%PG Between 100% and 252%PH Between 100% and 250%PK Between 100% and 250%PL Between 80% and 250%PM Between 100% and 265%PN Between 100% and 250%JA Between 152% and 250%
The actual EÅective Ranges at any time will be based upon the actual characteristics of therelated Mortgage Loans at that time, which are likely to vary (and may vary considerably) from thePricing Assumptions. The actual EÅective Ranges calculated on the basis of the actual characteristicsare likely to diÅer from the Initial EÅective Ranges. As a result, the applicable Classes might not bereduced to their scheduled balances even if prepayments were to occur at a constant PSA rate withintheir Initial EÅective Ranges. This is so particularly if such rate were at the lower or higher end ofsuch ranges. In addition, even if prepayments occur at rates falling within the actual EÅective Ranges,principal distributions may be insuÇcient to reduce the applicable Classes to their scheduled balancesif such prepayments do not occur at a constant PSA rate. It is highly unlikely that the relatedMortgage Loans will prepay at any constant PSA rate. In general, the actual EÅective Ranges maynarrow, widen or shift upward or downward to reÖect actual prepayment experience over time. Thestability in principal payment of the PAC Classes will be supported in part by the related TAC andSupport Classes. When such related TAC and Support Classes are retired, the PAC Classes, if stilloutstanding, may no longer have EÅective Ranges and will be more sensitive to prepayments.
Yield Tables
General. The tables below illustrate the sensitivity of the pre-tax corporate bond equivalentyields to maturity of the applicable Classes to various constant percentages of PSA. We calculated theyields set forth in the tables by
‚ determining the monthly discount rates that, when applied to the assumed streams of cashÖows to be paid on the applicable Classes, would cause the discounted present values of suchassumed streams of cash Öows to equal the assumed aggregate purchase prices of such Classes,and
‚ converting such monthly rates to corporate bond equivalent rates.
These calculations do not take into account variations in the interest rates at which you could reinvestdistributions on the CertiÑcates. Accordingly, these calculations do not illustrate the return on anyinvestment in the CertiÑcates when such reinvestment rates are taken into account.
We cannot assure you that
‚ the pre-tax yields on the applicable CertiÑcates will correspond to any of the pre-tax yieldsshown here or
‚ the aggregate purchase prices of the applicable CertiÑcates will be as assumed.
In addition, because some of the Mortgage Loans are likely to have remaining terms to maturityshorter or longer than those assumed and interest rates higher or lower than those assumed, the
S-21

principal payments on the CertiÑcates are likely to diÅer from those assumed. This would be the caseeven if all Mortgage Loans prepay at the indicated constant percentages of PSA. Moreover, it isunlikely that
‚ the Mortgage Loans will prepay at a constant PSA rate until maturity,
‚ all of such Mortgage Loans will prepay at the same rate or
‚ the level of the Index will remain constant.
The Inverse Floating Rate Classes. The yields on the Inverse Floating Rate Classes will besensitive in varying degrees to the rate of principal payments, including prepayments, ofthe related Mortgage Loans and to the level of the Index. The related Mortgage Loansgenerally can be prepaid at any time without penalty. In addition, the rate of principalpayments (including prepayments) of the Mortgage Loans is likely to vary, and may varyconsiderably, from Pool to Pool.
Changes in the Index may not correspond to changes in prevailing mortgage interest rates. It ispossible that lower prevailing mortgage interest rates, which might be expected to result in fasterprepayments, could occur while the level of the Index increased.
The information shown in the yield tables has been prepared on the basis of the PricingAssumptions and the assumptions that
‚ the interest rates for the Inverse Floating Rate Classes for the initial Interest Accrual Periodare the rates listed in the table under ""Reference SheetÌInterest Rates'' and for each followingInterest Accrual Period will be based on the speciÑed level of the Index, and
‚ the aggregate purchase prices of such Classes (expressed in each case as a percentage of originalprincipal balance) are as follows:
Class Price*
SA ÏÏÏÏÏÏÏÏÏÏÏÏÏÏÏÏÏÏÏÏÏÏÏÏÏÏÏÏÏÏÏÏÏÏÏÏÏÏÏÏÏÏÏÏÏÏÏÏÏÏÏÏÏÏÏÏÏÏÏÏÏÏÏÏ 94.0%SB ÏÏÏÏÏÏÏÏÏÏÏÏÏÏÏÏÏÏÏÏÏÏÏÏÏÏÏÏÏÏÏÏÏÏÏÏÏÏÏÏÏÏÏÏÏÏÏÏÏÏÏÏÏÏÏÏÏÏÏÏÏÏÏÏ 95.0%SC ÏÏÏÏÏÏÏÏÏÏÏÏÏÏÏÏÏÏÏÏÏÏÏÏÏÏÏÏÏÏÏÏÏÏÏÏÏÏÏÏÏÏÏÏÏÏÏÏÏÏÏÏÏÏÏÏÏÏÏÏÏÏÏÏ 88.0%SD ÏÏÏÏÏÏÏÏÏÏÏÏÏÏÏÏÏÏÏÏÏÏÏÏÏÏÏÏÏÏÏÏÏÏÏÏÏÏÏÏÏÏÏÏÏÏÏÏÏÏÏÏÏÏÏÏÏÏÏÏÏÏÏÏ 90.0%SE ÏÏÏÏÏÏÏÏÏÏÏÏÏÏÏÏÏÏÏÏÏÏÏÏÏÏÏÏÏÏÏÏÏÏÏÏÏÏÏÏÏÏÏÏÏÏÏÏÏÏÏÏÏÏÏÏÏÏÏÏÏÏÏÏ 89.5%
* The prices do not include accrued interest. Accrued interest has been added to such prices incalculating the yields set forth in the tables below.
Sensitivity of the SA Class to Prepayments and LIBOR(Pre-Tax Yields to Maturity)
PSA Prepayment Assumption
LIBOR 50% 100% 171% 250% 500%
2.9212%ÏÏÏÏÏÏÏÏÏÏÏÏÏÏÏÏÏÏÏÏÏ 22.2% 22.3% 23.3% 27.2% 38.7%4.9212%ÏÏÏÏÏÏÏÏÏÏÏÏÏÏÏÏÏÏÏÏÏ 12.5% 12.7% 13.7% 18.0% 30.3%6.9212%ÏÏÏÏÏÏÏÏÏÏÏÏÏÏÏÏÏÏÏÏÏ 3.2% 3.4% 4.3% 9.0% 22.2%7.5500%ÏÏÏÏÏÏÏÏÏÏÏÏÏÏÏÏÏÏÏÏÏ 0.4% 0.6% 1.4% 6.2% 19.7%
S-22

Sensitivity of the SB Class to Prepayments and LIBOR(Pre-Tax Yields to Maturity)
PSA Prepayment Assumption
LIBOR 50% 100% 135% 250% 500%
2.9394%ÏÏÏÏÏÏÏÏÏÏÏÏÏÏÏÏÏÏÏÏÏ 13.1% 13.2% 13.5% 15.5% 19.0%4.9394%ÏÏÏÏÏÏÏÏÏÏÏÏÏÏÏÏÏÏÏÏÏ 7.9% 8.0% 8.3% 10.5% 14.2%6.9394%ÏÏÏÏÏÏÏÏÏÏÏÏÏÏÏÏÏÏÏÏÏ 2.8% 3.0% 3.2% 5.5% 9.5%7.9500%ÏÏÏÏÏÏÏÏÏÏÏÏÏÏÏÏÏÏÏÏÏ 0.3% 0.4% 0.7% 3.0% 7.1%
Sensitivity of the SC Class to Prepayments and LIBOR(Pre-Tax Yields to Maturity)
PSA Prepayment Assumption
LIBOR 50% 100% 130% 350% 500%
3.00% ÏÏÏÏÏÏÏÏÏÏÏÏÏÏÏÏÏÏÏÏÏÏÏ 15.0% 16.2% 18.0% 21.7% 23.8%5.00% ÏÏÏÏÏÏÏÏÏÏÏÏÏÏÏÏÏÏÏÏÏÏÏ 9.3% 10.4% 12.3% 16.3% 18.5%7.00% ÏÏÏÏÏÏÏÏÏÏÏÏÏÏÏÏÏÏÏÏÏÏÏ 3.8% 4.8% 6.6% 11.1% 13.2%8.05% ÏÏÏÏÏÏÏÏÏÏÏÏÏÏÏÏÏÏÏÏÏÏÏ 1.0% 1.9% 3.7% 8.3% 10.5%
Sensitivity of the SD Class to Prepayments and LIBOR(Pre-Tax Yields to Maturity)
PSA Prepayment Assumption
LIBOR 50% 100% 130% 350% 500%
3.00% ÏÏÏÏÏÏÏÏÏÏÏÏÏÏÏÏÏÏÏÏÏÏÏ 14.6% 15.7% 17.6% 20.2% 21.7%5.00% ÏÏÏÏÏÏÏÏÏÏÏÏÏÏÏÏÏÏÏÏÏÏÏ 9.0% 10.0% 12.0% 14.9% 16.5%7.00% ÏÏÏÏÏÏÏÏÏÏÏÏÏÏÏÏÏÏÏÏÏÏÏ 3.6% 4.6% 6.6% 9.7% 11.3%8.05% ÏÏÏÏÏÏÏÏÏÏÏÏÏÏÏÏÏÏÏÏÏÏÏ 0.8% 1.7% 3.7% 7.1% 8.7%
Sensitivity of the SE Class to Prepayments and LIBOR(Pre-Tax Yields to Maturity)
PSA Prepayment Assumption
LIBOR 50% 100% 130% 350% 500%
3.00% ÏÏÏÏÏÏÏÏÏÏÏÏÏÏÏÏÏÏÏÏÏÏÏ 14.7% 15.7% 17.5% 20.5% 22.2%5.00% ÏÏÏÏÏÏÏÏÏÏÏÏÏÏÏÏÏÏÏÏÏÏÏ 9.1% 10.1% 11.9% 15.2% 17.0%7.00% ÏÏÏÏÏÏÏÏÏÏÏÏÏÏÏÏÏÏÏÏÏÏÏ 3.6% 4.6% 6.4% 10.0% 11.8%8.05% ÏÏÏÏÏÏÏÏÏÏÏÏÏÏÏÏÏÏÏÏÏÏÏ 0.9% 1.7% 3.6% 7.3% 9.1%
The Principal Only Class. The EA Class will not bear interest. As indicated in the tablebelow, a low rate of principal payments (including prepayments) on the related MortgageLoans will have a negative eÅect on the yield to investors in the EA Class.
The information shown in the following table has been prepared on the basis of the PricingAssumptions and the assumption that the aggregate purchase price of the EA Class (expressed as apercentage of original principal balance) is as follows:
Class Price
EA ÏÏÏÏÏÏÏÏÏÏÏÏÏÏÏÏÏÏÏÏÏÏÏÏÏÏÏÏÏÏÏÏÏÏÏÏÏÏÏÏÏÏÏÏÏÏÏÏÏÏÏÏÏÏÏÏÏÏÏÏÏÏÏÏ 76.0%
S-23

Sensitivity of the EA Class to Prepayments(Pre-Tax Yields to Maturity)
PSA Prepayment Assumption
Class 50% 100% 182% 250% 500%
EA ÏÏÏÏÏÏÏÏÏÏÏÏÏÏÏÏÏÏÏÏÏÏÏÏÏ 1.2% 1.5% 4.1% 13.5% 51.5%
Weighted Average Lives of the CertiÑcates
The weighted average life of a CertiÑcate is determined by
(a) multiplying the amount of the reduction, if any, of the principal balance of such CertiÑcatefrom one Distribution Date to the next Distribution Date by the number of years from theSettlement Date to the second such Distribution Date,
(b) summing the results, and
(c) dividing the sum by the aggregate amount of the reductions in principal balance of suchCertiÑcate referred to in clause (a).
For a description of the factors which may inÖuence the weighted average life of a CertiÑcate, see""Description of CertiÑcatesÌWeighted Average Life and Final Distribution Date'' in the REMICProspectus.
In general, the weighted average lives of the CertiÑcates will be shortened if the level ofprepayments of principal of the related Mortgage Loans increases. However, the weighted averagelives will depend upon a variety of other factors, including
‚ the timing of changes in such rate of principal payments,
‚ the priority sequences of distributions of principal of the Group 1, Group 2, Group 3 andGroup 4 Classes,
‚ in the case of the Group 5 and Group 6 Classes, the priority sequence aÅecting distributions onthe related Underlying REMIC CertiÑcates, and
‚ in the case of certain Group 2, Group 3 and Group 4 Classes, the payment of principal of suchClasses in accordance with the Principal Balance Schedules.
See ""Distributions of Principal'' in this Prospectus Supplement and ""Description of the CertiÑ-catesÌDistributions of Principal'' in the Underlying REMIC Disclosure Document.
The eÅect of these factors may diÅer as to various Classes and the eÅects on any Class may varyat diÅerent times during the life of that Class. Accordingly, we can give no assurance as to theweighted average life of any Class. Further, to the extent the prices of the CertiÑcates representdiscounts or premiums to their original principal balances, variability in the weighted average lives ofsuch Classes of CertiÑcates could result in variability in the related yields to maturity. For an exampleof how the weighted average lives of the Classes may be aÅected at various constant prepayment rates,see the Decrement Tables below.
Decrement Tables
The following tables indicate the percentages of original principal balances of the speciÑed Classesthat would be outstanding after each date shown at various constant PSA rates and the correspondingweighted average lives of such Classes. The tables have been prepared on the basis of the PricingAssumptions. However, in the case of the information set forth for each Class under 0% PSA, we
S-24

assumed that the underlying Mortgage Loans have the original and remaining terms to maturity andbear interest at the annual rates speciÑed in the table below.
Original RemainingMortgage Loans Relating to Terms Terms to InterestTrust Assets SpeciÑed Below to Maturity Maturity Rates
Group 1 MBS 360 months 360 months 8.5%Group 2 MBS 360 months 360 months 9.0%Group 3 MBS 360 months 360 months 8.5%Group 4 MBS 360 months 360 months 9.5%
Group 5 Underlying REMIC CertiÑcate 360 months 359 months 8.5%Group 6 Underlying REMIC CertiÑcate 360 months 359 months 8.5%
It is unlikely
‚ that all of the underlying Mortgage Loans will have the interest rates, CAGEs or remainingterms to maturity assumed or
‚ that the underlying Mortgage Loans will prepay at any constant PSA level.
In addition, the diverse remaining terms to maturity of the Mortgage Loans could produce sloweror faster principal distributions than indicated in the tables at the speciÑed constant PSA rates. Thisis the case even if the dispersion of weighted average remaining terms to maturity and the weightedaverage CAGEs of the Mortgage Loans are identical to the dispersion speciÑed in the PricingAssumptions.
Percent of Original Principal Balances Outstanding
A Class B Class PA Class PC Class
PSA Prepayment PSA Prepayment PSA Prepayment PSA PrepaymentAssumption Assumption Assumption Assumption
Date 0% 100% 136% 350% 500% 0% 100% 136% 350% 500% 0% 100% 171% 250% 500% 0% 100% 171% 250% 500%
Initial PercentÏÏÏÏÏÏÏÏÏ 100 100 100 100 100 100 100 100 100 100 100 100 100 100 100 100 100 100 100 100June 2000ÏÏÏÏÏÏÏÏÏÏÏÏÏ 99 93 91 80 72 100 100 100 100 100 99 90 90 90 90 100 100 100 100 100June 2001ÏÏÏÏÏÏÏÏÏÏÏÏÏ 98 84 80 55 39 100 100 100 100 100 96 63 63 63 36 100 100 100 100 100June 2002ÏÏÏÏÏÏÏÏÏÏÏÏÏ 97 75 69 35 16 100 100 100 100 100 93 37 37 37 0 100 100 100 100 57June 2003ÏÏÏÏÏÏÏÏÏÏÏÏÏ 95 67 59 19 0 100 100 100 100 99 89 13 13 13 0 100 100 100 100 0June 2004ÏÏÏÏÏÏÏÏÏÏÏÏÏ 94 59 50 7 0 100 100 100 100 68 85 0 0 0 0 100 83 83 83 0June 2005ÏÏÏÏÏÏÏÏÏÏÏÏÏ 92 52 41 0 0 100 100 100 92 47 81 0 0 0 0 100 48 48 48 0June 2006ÏÏÏÏÏÏÏÏÏÏÏÏÏ 91 45 33 0 0 100 100 100 71 32 76 0 0 0 0 100 15 15 15 0June 2007ÏÏÏÏÏÏÏÏÏÏÏÏÏ 89 39 26 0 0 100 100 100 55 22 71 0 0 0 0 100 0 0 0 0June 2008ÏÏÏÏÏÏÏÏÏÏÏÏÏ 87 32 20 0 0 100 100 100 43 15 65 0 0 0 0 100 0 0 0 0June 2009ÏÏÏÏÏÏÏÏÏÏÏÏÏ 84 27 14 0 0 100 100 100 33 10 59 0 0 0 0 100 0 0 0 0June 2010ÏÏÏÏÏÏÏÏÏÏÏÏÏ 82 21 9 0 0 100 100 100 25 7 52 0 0 0 0 100 0 0 0 0June 2011ÏÏÏÏÏÏÏÏÏÏÏÏÏ 79 16 4 0 0 100 100 100 19 5 45 0 0 0 0 100 0 0 0 0June 2012ÏÏÏÏÏÏÏÏÏÏÏÏÏ 77 11 0 0 0 100 100 98 15 3 37 0 0 0 0 100 0 0 0 0June 2013ÏÏÏÏÏÏÏÏÏÏÏÏÏ 73 7 0 0 0 100 100 87 11 2 28 0 0 0 0 100 0 0 0 0June 2014ÏÏÏÏÏÏÏÏÏÏÏÏÏ 70 3 0 0 0 100 100 76 8 1 18 0 0 0 0 100 0 0 0 0June 2015ÏÏÏÏÏÏÏÏÏÏÏÏÏ 66 0 0 0 0 100 96 67 6 1 7 0 0 0 0 100 0 0 0 0June 2016ÏÏÏÏÏÏÏÏÏÏÏÏÏ 62 0 0 0 0 100 86 58 5 1 0 0 0 0 0 93 0 0 0 0June 2017ÏÏÏÏÏÏÏÏÏÏÏÏÏ 58 0 0 0 0 100 76 51 4 * 0 0 0 0 0 73 0 0 0 0June 2018ÏÏÏÏÏÏÏÏÏÏÏÏÏ 53 0 0 0 0 100 67 43 3 * 0 0 0 0 0 50 0 0 0 0June 2019ÏÏÏÏÏÏÏÏÏÏÏÏÏ 48 0 0 0 0 100 58 37 2 * 0 0 0 0 0 25 0 0 0 0June 2020ÏÏÏÏÏÏÏÏÏÏÏÏÏ 43 0 0 0 0 100 50 31 1 * 0 0 0 0 0 0 0 0 0 0June 2021ÏÏÏÏÏÏÏÏÏÏÏÏÏ 36 0 0 0 0 100 42 26 1 * 0 0 0 0 0 0 0 0 0 0June 2022ÏÏÏÏÏÏÏÏÏÏÏÏÏ 30 0 0 0 0 100 35 21 1 * 0 0 0 0 0 0 0 0 0 0June 2023ÏÏÏÏÏÏÏÏÏÏÏÏÏ 23 0 0 0 0 100 28 16 * * 0 0 0 0 0 0 0 0 0 0June 2024ÏÏÏÏÏÏÏÏÏÏÏÏÏ 15 0 0 0 0 100 22 12 * * 0 0 0 0 0 0 0 0 0 0June 2025ÏÏÏÏÏÏÏÏÏÏÏÏÏ 6 0 0 0 0 100 16 9 * * 0 0 0 0 0 0 0 0 0 0June 2026ÏÏÏÏÏÏÏÏÏÏÏÏÏ 0 0 0 0 0 91 10 5 * * 0 0 0 0 0 0 0 0 0 0June 2027ÏÏÏÏÏÏÏÏÏÏÏÏÏ 0 0 0 0 0 63 4 2 * * 0 0 0 0 0 0 0 0 0 0June 2028ÏÏÏÏÏÏÏÏÏÏÏÏÏ 0 0 0 0 0 33 0 0 0 0 0 0 0 0 0 0 0 0 0 0June 2029ÏÏÏÏÏÏÏÏÏÏÏÏÏ 0 0 0 0 0 0 0 0 0 0 0 0 0 0 0 0 0 0 0 0Weighted Average
Life (years)** ÏÏÏÏÏÏ 18.0 6.8 5.5 2.5 1.8 28.4 21.4 18.9 9.5 6.7 10.5 2.6 2.6 2.6 1.8 19.0 6.0 6.0 6.0 3.1
* Indicates an outstanding balance greater than 0% and less than 0.5% of the original principal balance.** Determined as speciÑed under ""Weighted Average Lives of the CertiÑcates'' herein.
S-25

YA Class FA and SA Classes VA Class ZA Class
PSA Prepayment PSA Prepayment PSA Prepayment PSA PrepaymentAssumption Assumption Assumption Assumption
Date 0% 100% 171% 250% 500% 0% 100% 171% 250% 500% 0% 100% 171% 250% 500% 0% 100% 171% 250% 500%
Initial PercentÏÏÏÏÏÏÏÏÏ 100 100 100 100 100 100 100 100 100 100 100 100 100 100 100 100 100 100 100 100June 2000ÏÏÏÏÏÏÏÏÏÏÏÏÏ 98 80 76 76 46 100 96 76 50 0 98 98 98 98 98 107 107 107 107 107June 2001ÏÏÏÏÏÏÏÏÏÏÏÏÏ 98 80 66 66 0 100 96 66 19 0 96 96 96 96 96 114 114 114 114 114June 2002ÏÏÏÏÏÏÏÏÏÏÏÏÏ 98 80 58 55 0 100 96 58 0 0 93 93 93 93 93 121 121 121 121 121June 2003ÏÏÏÏÏÏÏÏÏÏÏÏÏ 98 80 52 35 0 100 96 52 0 0 90 90 90 90 81 130 130 130 130 130June 2004ÏÏÏÏÏÏÏÏÏÏÏÏÏ 98 80 47 21 0 100 96 47 0 0 88 88 88 88 40 138 138 138 138 138June 2005ÏÏÏÏÏÏÏÏÏÏÏÏÏ 98 80 44 13 0 100 96 44 0 0 85 85 85 85 10 148 148 148 148 148June 2006ÏÏÏÏÏÏÏÏÏÏÏÏÏ 98 80 42 8 0 100 96 42 0 0 81 81 81 81 0 157 157 157 157 123June 2007ÏÏÏÏÏÏÏÏÏÏÏÏÏ 98 66 33 0 0 100 96 33 0 0 78 78 78 72 0 168 168 168 168 84June 2008ÏÏÏÏÏÏÏÏÏÏÏÏÏ 98 42 20 0 0 100 96 20 0 0 74 74 74 47 0 179 179 179 179 57June 2009ÏÏÏÏÏÏÏÏÏÏÏÏÏ 98 19 9 0 0 100 96 9 0 0 71 71 71 25 0 191 191 191 191 39June 2010ÏÏÏÏÏÏÏÏÏÏÏÏÏ 98 0 0 0 0 100 93 0 0 0 66 66 63 5 0 204 204 204 204 26June 2011ÏÏÏÏÏÏÏÏÏÏÏÏÏ 98 0 0 0 0 100 70 0 0 0 62 62 41 0 0 218 218 218 181 18June 2012ÏÏÏÏÏÏÏÏÏÏÏÏÏ 98 0 0 0 0 100 49 0 0 0 57 57 21 0 0 232 232 232 148 12June 2013ÏÏÏÏÏÏÏÏÏÏÏÏÏ 98 0 0 0 0 100 29 0 0 0 52 52 3 0 0 248 248 248 120 8June 2014ÏÏÏÏÏÏÏÏÏÏÏÏÏ 98 0 0 0 0 100 10 0 0 0 47 47 0 0 0 264 264 218 97 5June 2015ÏÏÏÏÏÏÏÏÏÏÏÏÏ 98 0 0 0 0 100 0 0 0 0 41 34 0 0 0 282 282 185 78 4June 2016ÏÏÏÏÏÏÏÏÏÏÏÏÏ 98 0 0 0 0 100 0 0 0 0 35 13 0 0 0 301 301 156 62 2June 2017ÏÏÏÏÏÏÏÏÏÏÏÏÏ 98 0 0 0 0 100 0 0 0 0 28 0 0 0 0 321 299 130 49 2June 2018ÏÏÏÏÏÏÏÏÏÏÏÏÏ 98 0 0 0 0 100 0 0 0 0 22 0 0 0 0 343 258 107 38 1June 2019ÏÏÏÏÏÏÏÏÏÏÏÏÏ 98 0 0 0 0 100 0 0 0 0 14 0 0 0 0 366 219 87 30 1June 2020ÏÏÏÏÏÏÏÏÏÏÏÏÏ 96 0 0 0 0 100 0 0 0 0 6 0 0 0 0 390 183 69 22 *June 2021ÏÏÏÏÏÏÏÏÏÏÏÏÏ 72 0 0 0 0 100 0 0 0 0 0 0 0 0 0 409 148 54 16 *June 2022ÏÏÏÏÏÏÏÏÏÏÏÏÏ 45 0 0 0 0 100 0 0 0 0 0 0 0 0 0 409 116 40 12 *June 2023ÏÏÏÏÏÏÏÏÏÏÏÏÏ 16 0 0 0 0 100 0 0 0 0 0 0 0 0 0 409 89 29 8 *June 2024ÏÏÏÏÏÏÏÏÏÏÏÏÏ 0 0 0 0 0 82 0 0 0 0 0 0 0 0 0 409 65 20 5 *June 2025ÏÏÏÏÏÏÏÏÏÏÏÏÏ 0 0 0 0 0 43 0 0 0 0 0 0 0 0 0 409 42 13 3 *June 2026ÏÏÏÏÏÏÏÏÏÏÏÏÏ 0 0 0 0 0 1 0 0 0 0 0 0 0 0 0 409 21 6 1 *June 2027ÏÏÏÏÏÏÏÏÏÏÏÏÏ 0 0 0 0 0 0 0 0 0 0 0 0 0 0 0 287 0 0 0 0June 2028ÏÏÏÏÏÏÏÏÏÏÏÏÏ 0 0 0 0 0 0 0 0 0 0 0 0 0 0 0 150 0 0 0 0June 2029ÏÏÏÏÏÏÏÏÏÏÏÏÏ 0 0 0 0 0 0 0 0 0 0 0 0 0 0 0 0 0 0 0 0Weighted Average
Life (years)** ÏÏÏÏÏÏ 22.3 7.4 5.0 3.2 0.9 25.8 12.6 5.0 1.2 0.4 13.4 12.4 10.3 8.3 4.7 28.6 22.1 19.0 15.7 9.1
PD Class PE Class PG Class PH Class
PSA Prepayment PSA Prepayment PSA Prepayment PSA PrepaymentAssumption Assumption Assumption Assumption
Date 0% 100% 135% 250% 500% 0% 100% 135% 250% 500% 0% 100% 135% 250% 500% 0% 100% 135% 250% 500%
Initial PercentÏÏÏÏÏÏÏÏÏ 100 100 100 100 100 100 100 100 100 100 100 100 100 100 100 100 100 100 100 100June 2000ÏÏÏÏÏÏÏÏÏÏÏÏÏ 100 97 97 97 97 100 100 100 100 100 100 100 100 100 100 100 100 100 100 100June 2001ÏÏÏÏÏÏÏÏÏÏÏÏÏ 96 64 64 64 48 100 100 100 100 100 100 100 100 100 100 100 100 100 100 100June 2002ÏÏÏÏÏÏÏÏÏÏÏÏÏ 91 32 32 32 0 100 100 100 100 0 100 100 100 100 73 100 100 100 100 100June 2003ÏÏÏÏÏÏÏÏÏÏÏÏÏ 86 2 2 2 0 100 100 100 100 0 100 100 100 100 0 100 100 100 100 59June 2004ÏÏÏÏÏÏÏÏÏÏÏÏÏ 81 0 0 0 0 100 0 0 0 0 100 93 93 93 0 100 100 100 100 0June 2005ÏÏÏÏÏÏÏÏÏÏÏÏÏ 75 0 0 0 0 100 0 0 0 0 100 48 48 48 0 100 100 100 100 0June 2006ÏÏÏÏÏÏÏÏÏÏÏÏÏ 69 0 0 0 0 100 0 0 0 0 100 5 5 5 0 100 100 100 100 0June 2007ÏÏÏÏÏÏÏÏÏÏÏÏÏ 62 0 0 0 0 100 0 0 0 0 100 0 0 0 0 100 47 47 47 0June 2008ÏÏÏÏÏÏÏÏÏÏÏÏÏ 55 0 0 0 0 100 0 0 0 0 100 0 0 0 0 100 0 0 0 0June 2009ÏÏÏÏÏÏÏÏÏÏÏÏÏ 47 0 0 0 0 100 0 0 0 0 100 0 0 0 0 100 0 0 0 0June 2010ÏÏÏÏÏÏÏÏÏÏÏÏÏ 38 0 0 0 0 100 0 0 0 0 100 0 0 0 0 100 0 0 0 0June 2011ÏÏÏÏÏÏÏÏÏÏÏÏÏ 28 0 0 0 0 100 0 0 0 0 100 0 0 0 0 100 0 0 0 0June 2012ÏÏÏÏÏÏÏÏÏÏÏÏÏ 18 0 0 0 0 100 0 0 0 0 100 0 0 0 0 100 0 0 0 0June 2013ÏÏÏÏÏÏÏÏÏÏÏÏÏ 7 0 0 0 0 100 0 0 0 0 100 0 0 0 0 100 0 0 0 0June 2014ÏÏÏÏÏÏÏÏÏÏÏÏÏ 0 0 0 0 0 75 0 0 0 0 100 0 0 0 0 100 0 0 0 0June 2015ÏÏÏÏÏÏÏÏÏÏÏÏÏ 0 0 0 0 0 15 0 0 0 0 100 0 0 0 0 100 0 0 0 0June 2016ÏÏÏÏÏÏÏÏÏÏÏÏÏ 0 0 0 0 0 0 0 0 0 0 81 0 0 0 0 100 0 0 0 0June 2017ÏÏÏÏÏÏÏÏÏÏÏÏÏ 0 0 0 0 0 0 0 0 0 0 54 0 0 0 0 100 0 0 0 0June 2018ÏÏÏÏÏÏÏÏÏÏÏÏÏ 0 0 0 0 0 0 0 0 0 0 24 0 0 0 0 100 0 0 0 0June 2019ÏÏÏÏÏÏÏÏÏÏÏÏÏ 0 0 0 0 0 0 0 0 0 0 0 0 0 0 0 88 0 0 0 0June 2020ÏÏÏÏÏÏÏÏÏÏÏÏÏ 0 0 0 0 0 0 0 0 0 0 0 0 0 0 0 36 0 0 0 0June 2021ÏÏÏÏÏÏÏÏÏÏÏÏÏ 0 0 0 0 0 0 0 0 0 0 0 0 0 0 0 0 0 0 0 0June 2022ÏÏÏÏÏÏÏÏÏÏÏÏÏ 0 0 0 0 0 0 0 0 0 0 0 0 0 0 0 0 0 0 0 0June 2023ÏÏÏÏÏÏÏÏÏÏÏÏÏ 0 0 0 0 0 0 0 0 0 0 0 0 0 0 0 0 0 0 0 0June 2024ÏÏÏÏÏÏÏÏÏÏÏÏÏ 0 0 0 0 0 0 0 0 0 0 0 0 0 0 0 0 0 0 0 0June 2025ÏÏÏÏÏÏÏÏÏÏÏÏÏ 0 0 0 0 0 0 0 0 0 0 0 0 0 0 0 0 0 0 0 0June 2026ÏÏÏÏÏÏÏÏÏÏÏÏÏ 0 0 0 0 0 0 0 0 0 0 0 0 0 0 0 0 0 0 0 0June 2027ÏÏÏÏÏÏÏÏÏÏÏÏÏ 0 0 0 0 0 0 0 0 0 0 0 0 0 0 0 0 0 0 0 0June 2028ÏÏÏÏÏÏÏÏÏÏÏÏÏ 0 0 0 0 0 0 0 0 0 0 0 0 0 0 0 0 0 0 0 0June 2029ÏÏÏÏÏÏÏÏÏÏÏÏÏ 0 0 0 0 0 0 0 0 0 0 0 0 0 0 0 0 0 0 0 0Weighted Average
Life (years)** ÏÏÏÏÏÏ 9.0 2.5 2.5 2.5 1.9 15.4 4.5 4.5 4.5 2.7 18.1 6.0 6.0 6.0 3.2 20.8 8.0 8.0 8.0 4.1
* Indicates an outstanding balance greater than 0% and less than 0.5% of the original principal balance.** Determined as speciÑed under ""Weighted Average Lives of the CertiÑcates'' herein.
S-26

PK Class PL Class FB and SB Classes ZB Class
PSA Prepayment PSA Prepayment PSA Prepayment PSA PrepaymentAssumption Assumption Assumption Assumption
Date 0% 100% 135% 250% 500% 0% 100% 135% 250% 500% 0% 100% 135% 250% 500% 0% 100% 135% 250% 500%
Initial PercentÏÏÏÏÏÏÏÏÏ 100 100 100 100 100 100 100 100 100 100 100 100 100 100 100 100 100 100 100 100June 2000ÏÏÏÏÏÏÏÏÏÏÏÏÏ 100 100 100 100 100 100 100 100 100 100 97 85 81 66 35 106 106 106 106 106June 2001ÏÏÏÏÏÏÏÏÏÏÏÏÏ 100 100 100 100 100 100 100 100 100 100 97 84 74 42 0 113 113 113 113 0June 2002ÏÏÏÏÏÏÏÏÏÏÏÏÏ 100 100 100 100 100 100 100 100 100 100 96 84 69 23 0 120 120 120 120 0June 2003ÏÏÏÏÏÏÏÏÏÏÏÏÏ 100 100 100 100 100 100 100 100 100 100 95 83 64 9 0 127 127 127 127 0June 2004ÏÏÏÏÏÏÏÏÏÏÏÏÏ 100 100 100 100 73 100 100 100 100 100 95 82 60 0 0 135 135 135 120 0June 2005ÏÏÏÏÏÏÏÏÏÏÏÏÏ 100 100 100 100 31 100 100 100 100 100 94 81 57 0 0 143 143 143 53 0June 2006ÏÏÏÏÏÏÏÏÏÏÏÏÏ 100 100 100 100 1 100 100 100 100 100 93 81 54 0 0 152 152 152 15 0June 2007ÏÏÏÏÏÏÏÏÏÏÏÏÏ 100 100 100 100 0 100 100 100 100 70 92 80 52 0 0 161 161 161 1 0June 2008ÏÏÏÏÏÏÏÏÏÏÏÏÏ 100 96 96 96 0 100 100 100 100 48 91 78 50 0 0 171 171 171 1 0June 2009ÏÏÏÏÏÏÏÏÏÏÏÏÏ 100 68 68 68 0 100 100 100 100 33 90 76 47 0 0 182 182 182 1 0June 2010ÏÏÏÏÏÏÏÏÏÏÏÏÏ 100 46 46 46 0 100 100 100 100 22 89 72 43 0 0 193 193 193 1 0June 2011ÏÏÏÏÏÏÏÏÏÏÏÏÏ 100 27 27 27 0 100 100 100 100 15 88 67 38 0 0 205 205 205 1 0June 2012ÏÏÏÏÏÏÏÏÏÏÏÏÏ 100 11 11 11 0 100 100 100 100 10 87 61 33 0 0 218 218 218 1 0June 2013ÏÏÏÏÏÏÏÏÏÏÏÏÏ 100 0 0 0 0 100 96 96 96 7 86 55 28 0 0 231 231 231 1 0June 2014ÏÏÏÏÏÏÏÏÏÏÏÏÏ 100 0 0 0 0 100 78 78 78 5 84 48 23 0 0 245 245 245 1 0June 2015ÏÏÏÏÏÏÏÏÏÏÏÏÏ 100 0 0 0 0 100 63 63 63 3 83 42 17 0 0 261 261 261 1 0June 2016ÏÏÏÏÏÏÏÏÏÏÏÏÏ 100 0 0 0 0 100 51 51 51 2 82 34 11 0 0 277 277 277 1 0June 2017ÏÏÏÏÏÏÏÏÏÏÏÏÏ 100 0 0 0 0 100 41 41 41 1 80 27 6 0 0 294 294 294 1 0June 2018ÏÏÏÏÏÏÏÏÏÏÏÏÏ 100 0 0 0 0 100 32 32 32 1 78 20 * 0 0 312 312 312 1 0June 2019ÏÏÏÏÏÏÏÏÏÏÏÏÏ 100 0 0 0 0 100 25 25 25 1 77 13 0 0 0 331 331 274 1 0June 2020ÏÏÏÏÏÏÏÏÏÏÏÏÏ 100 0 0 0 0 100 20 20 20 * 75 5 0 0 0 351 351 235 1 0June 2021ÏÏÏÏÏÏÏÏÏÏÏÏÏ 88 0 0 0 0 100 15 15 15 * 73 0 0 0 0 373 351 198 1 0June 2022ÏÏÏÏÏÏÏÏÏÏÏÏÏ 52 0 0 0 0 100 11 11 11 * 71 0 0 0 0 396 294 163 1 0June 2023ÏÏÏÏÏÏÏÏÏÏÏÏÏ 12 0 0 0 0 100 8 8 8 * 68 0 0 0 0 421 239 131 1 0June 2024ÏÏÏÏÏÏÏÏÏÏÏÏÏ 0 0 0 0 0 50 5 5 5 * 66 0 0 0 0 446 186 100 1 0June 2025ÏÏÏÏÏÏÏÏÏÏÏÏÏ 0 0 0 0 0 3 3 3 3 * 56 0 0 0 0 474 135 71 1 0June 2026ÏÏÏÏÏÏÏÏÏÏÏÏÏ 0 0 0 0 0 2 2 2 2 * 32 0 0 0 0 503 86 45 1 0June 2027ÏÏÏÏÏÏÏÏÏÏÏÏÏ 0 0 0 0 0 1 1 1 1 * 5 0 0 0 0 534 39 20 1 0June 2028ÏÏÏÏÏÏÏÏÏÏÏÏÏ 0 0 0 0 0 0 0 0 0 0 0 0 0 0 0 309 0 0 0 0June 2029ÏÏÏÏÏÏÏÏÏÏÏÏÏ 0 0 0 0 0 0 0 0 0 0 0 0 0 0 0 0 0 0 0 0Weighted Average
Life (years)** ÏÏÏÏÏÏ 23.0 11.0 11.0 11.0 5.6 25.1 18.0 18.0 18.0 9.7 22.7 13.1 8.6 1.9 0.8 29.1 25.2 23.5 6.1 1.7
PM Class PN Class JA Class
PSA Prepayment PSA Prepayment PSA PrepaymentAssumption Assumption Assumption
Date 0% 100% 182% 250% 500% 0% 100% 182% 250% 500% 0% 100% 152% 182% 250% 500%
Initial PercentÏÏÏÏÏÏÏÏÏ 100 100 100 100 100 100 100 100 100 100 100 100 100 100 100 100June 2000ÏÏÏÏÏÏÏÏÏÏÏÏÏ 98 78 78 78 78 100 100 100 100 100 100 100 75 75 75 48June 2001ÏÏÏÏÏÏÏÏÏÏÏÏÏ 96 58 58 58 31 100 100 100 100 100 100 100 55 55 55 0June 2002ÏÏÏÏÏÏÏÏÏÏÏÏÏ 94 38 38 38 0 100 100 100 100 87 100 100 38 38 38 0June 2003ÏÏÏÏÏÏÏÏÏÏÏÏÏ 91 20 20 20 0 100 100 100 100 60 100 100 24 24 24 0June 2004ÏÏÏÏÏÏÏÏÏÏÏÏÏ 88 3 3 3 0 100 100 100 100 41 100 100 14 14 14 0June 2005ÏÏÏÏÏÏÏÏÏÏÏÏÏ 85 0 0 0 0 100 89 89 89 29 100 100 6 6 6 0June 2006ÏÏÏÏÏÏÏÏÏÏÏÏÏ 82 0 0 0 0 100 76 76 76 20 100 100 1 1 1 0June 2007ÏÏÏÏÏÏÏÏÏÏÏÏÏ 78 0 0 0 0 100 63 63 63 13 100 100 0 0 0 0June 2008ÏÏÏÏÏÏÏÏÏÏÏÏÏ 74 0 0 0 0 100 52 52 52 9 100 97 0 0 0 0June 2009ÏÏÏÏÏÏÏÏÏÏÏÏÏ 70 0 0 0 0 100 43 43 43 6 100 91 0 0 0 0June 2010ÏÏÏÏÏÏÏÏÏÏÏÏÏ 65 0 0 0 0 100 36 36 36 4 100 82 0 0 0 0June 2011ÏÏÏÏÏÏÏÏÏÏÏÏÏ 60 0 0 0 0 100 29 29 29 3 100 72 0 0 0 0June 2012ÏÏÏÏÏÏÏÏÏÏÏÏÏ 54 0 0 0 0 100 24 24 24 2 100 60 0 0 0 0June 2013ÏÏÏÏÏÏÏÏÏÏÏÏÏ 47 0 0 0 0 100 20 20 20 1 100 47 0 0 0 0June 2014ÏÏÏÏÏÏÏÏÏÏÏÏÏ 40 0 0 0 0 100 16 16 16 1 100 33 0 0 0 0June 2015ÏÏÏÏÏÏÏÏÏÏÏÏÏ 32 0 0 0 0 100 13 13 13 1 100 18 0 0 0 0June 2016ÏÏÏÏÏÏÏÏÏÏÏÏÏ 24 0 0 0 0 100 10 10 10 * 100 3 0 0 0 0June 2017ÏÏÏÏÏÏÏÏÏÏÏÏÏ 14 0 0 0 0 100 8 8 8 * 100 0 0 0 0 0June 2018ÏÏÏÏÏÏÏÏÏÏÏÏÏ 4 0 0 0 0 100 6 6 6 * 100 0 0 0 0 0June 2019ÏÏÏÏÏÏÏÏÏÏÏÏÏ 0 0 0 0 0 93 5 5 5 * 100 0 0 0 0 0June 2020ÏÏÏÏÏÏÏÏÏÏÏÏÏ 0 0 0 0 0 83 4 4 4 * 100 0 0 0 0 0June 2021ÏÏÏÏÏÏÏÏÏÏÏÏÏ 0 0 0 0 0 71 3 3 3 * 100 0 0 0 0 0June 2022ÏÏÏÏÏÏÏÏÏÏÏÏÏ 0 0 0 0 0 58 2 2 2 * 100 0 0 0 0 0June 2023ÏÏÏÏÏÏÏÏÏÏÏÏÏ 0 0 0 0 0 43 1 1 1 * 100 0 0 0 0 0June 2024ÏÏÏÏÏÏÏÏÏÏÏÏÏ 0 0 0 0 0 27 1 1 1 * 100 0 0 0 0 0June 2025ÏÏÏÏÏÏÏÏÏÏÏÏÏ 0 0 0 0 0 10 * * * * 100 0 0 0 0 0June 2026ÏÏÏÏÏÏÏÏÏÏÏÏÏ 0 0 0 0 0 0 0 0 0 * 72 0 0 0 0 0June 2027ÏÏÏÏÏÏÏÏÏÏÏÏÏ 0 0 0 0 0 0 0 0 0 0 8 0 0 0 0 0June 2028ÏÏÏÏÏÏÏÏÏÏÏÏÏ 0 0 0 0 0 0 0 0 0 0 0 0 0 0 0 0June 2029ÏÏÏÏÏÏÏÏÏÏÏÏÏ 0 0 0 0 0 0 0 0 0 0 0 0 0 0 0 0Weighted Average
Life (years)** ÏÏÏÏÏÏ 12.5 2.5 2.5 2.5 1.6 23.4 10.5 10.5 10.5 5.3 27.4 13.6 2.6 2.6 2.6 1.0
* Indicates an outstanding balance greater than 0% and less than 0.5% of the original principal balance.** Determined as speciÑed under ""Weighted Average Lives of the CertiÑcates'' herein.
S-27

CA Class CB Class DA Class
PSA Prepayment PSA Prepayment PSA PrepaymentAssumption Assumption Assumption
Date 0% 100% 152% 182% 250% 500% 0% 100% 152% 182% 250% 500% 0% 100% 152% 182% 250% 500%
Initial PercentÏÏÏÏÏÏÏÏÏ 100 100 100 100 100 100 100 100 100 100 100 100 100 100 100 100 100 100June 2000ÏÏÏÏÏÏÏÏÏÏÏÏÏ 100 100 100 72 10 0 100 100 100 100 100 0 93 93 93 93 93 0June 2001ÏÏÏÏÏÏÏÏÏÏÏÏÏ 100 100 100 51 0 0 100 100 100 100 19 0 84 84 84 84 84 0June 2002ÏÏÏÏÏÏÏÏÏÏÏÏÏ 100 100 100 35 0 0 100 100 100 100 0 0 76 76 76 76 0 0June 2003ÏÏÏÏÏÏÏÏÏÏÏÏÏ 100 100 100 23 0 0 100 100 100 100 0 0 66 66 66 66 0 0June 2004ÏÏÏÏÏÏÏÏÏÏÏÏÏ 100 100 100 15 0 0 100 100 100 100 0 0 56 56 56 56 0 0June 2005ÏÏÏÏÏÏÏÏÏÏÏÏÏ 100 100 100 10 0 0 100 100 100 100 0 0 45 45 45 45 0 0June 2006ÏÏÏÏÏÏÏÏÏÏÏÏÏ 100 100 100 7 0 0 100 100 100 100 0 0 34 34 34 34 0 0June 2007ÏÏÏÏÏÏÏÏÏÏÏÏÏ 100 100 95 2 0 0 100 100 100 100 0 0 21 21 21 21 0 0June 2008ÏÏÏÏÏÏÏÏÏÏÏÏÏ 100 100 87 0 0 0 100 100 100 92 0 0 8 8 8 8 0 0June 2009ÏÏÏÏÏÏÏÏÏÏÏÏÏ 100 100 75 0 0 0 100 100 100 79 0 0 0 0 0 0 0 0June 2010ÏÏÏÏÏÏÏÏÏÏÏÏÏ 100 100 61 0 0 0 100 100 100 64 0 0 0 0 0 0 0 0June 2011ÏÏÏÏÏÏÏÏÏÏÏÏÏ 100 100 46 0 0 0 100 100 100 47 0 0 0 0 0 0 0 0June 2012ÏÏÏÏÏÏÏÏÏÏÏÏÏ 100 100 29 0 0 0 100 100 100 31 0 0 0 0 0 0 0 0June 2013ÏÏÏÏÏÏÏÏÏÏÏÏÏ 100 100 12 0 0 0 100 100 100 14 0 0 0 0 0 0 0 0June 2014ÏÏÏÏÏÏÏÏÏÏÏÏÏ 100 100 0 0 0 0 100 100 92 0 0 0 0 0 0 0 0 0June 2015ÏÏÏÏÏÏÏÏÏÏÏÏÏ 100 100 0 0 0 0 100 100 68 0 0 0 0 0 0 0 0 0June 2016ÏÏÏÏÏÏÏÏÏÏÏÏÏ 100 100 0 0 0 0 100 100 43 0 0 0 0 0 0 0 0 0June 2017ÏÏÏÏÏÏÏÏÏÏÏÏÏ 100 77 0 0 0 0 100 100 20 0 0 0 0 0 0 0 0 0June 2018ÏÏÏÏÏÏÏÏÏÏÏÏÏ 100 49 0 0 0 0 100 100 0 0 0 0 0 0 0 0 0 0June 2019ÏÏÏÏÏÏÏÏÏÏÏÏÏ 100 20 0 0 0 0 100 100 0 0 0 0 0 0 0 0 0 0June 2020ÏÏÏÏÏÏÏÏÏÏÏÏÏ 100 0 0 0 0 0 100 89 0 0 0 0 0 0 0 0 0 0June 2021ÏÏÏÏÏÏÏÏÏÏÏÏÏ 100 0 0 0 0 0 100 49 0 0 0 0 0 0 0 0 0 0June 2022ÏÏÏÏÏÏÏÏÏÏÏÏÏ 100 0 0 0 0 0 100 10 0 0 0 0 0 0 0 0 0 0June 2023ÏÏÏÏÏÏÏÏÏÏÏÏÏ 100 0 0 0 0 0 100 0 0 0 0 0 0 0 0 0 0 0June 2024ÏÏÏÏÏÏÏÏÏÏÏÏÏ 100 0 0 0 0 0 100 0 0 0 0 0 0 0 0 0 0 0June 2025ÏÏÏÏÏÏÏÏÏÏÏÏÏ 100 0 0 0 0 0 100 0 0 0 0 0 0 0 0 0 0 0June 2026ÏÏÏÏÏÏÏÏÏÏÏÏÏ 100 0 0 0 0 0 100 0 0 0 0 0 0 0 0 0 0 0June 2027ÏÏÏÏÏÏÏÏÏÏÏÏÏ 100 0 0 0 0 0 100 0 0 0 0 0 0 0 0 0 0 0June 2028ÏÏÏÏÏÏÏÏÏÏÏÏÏ 0 0 0 0 0 0 73 0 0 0 0 0 0 0 0 0 0 0June 2029ÏÏÏÏÏÏÏÏÏÏÏÏÏ 0 0 0 0 0 0 0 0 0 0 0 0 0 0 0 0 0 0Weighted Average
Life (years)** ÏÏÏÏÏÏ 28.5 19.0 11.6 2.7 0.6 0.2 29.1 22.0 16.8 11.8 1.7 0.4 5.3 5.3 5.3 5.3 2.2 0.5
DB Class DC Class DE Class
PSA Prepayment PSA Prepayment PSA PrepaymentAssumption Assumption Assumption
Date 0% 100% 152% 182% 250% 500% 0% 100% 152% 182% 250% 500% 0% 100% 152% 182% 250% 500%
Initial PercentÏÏÏÏÏÏÏÏÏ 100 100 100 100 100 100 100 100 100 100 100 100 100 100 100 100 100 100June 2000ÏÏÏÏÏÏÏÏÏÏÏÏÏ 100 100 100 100 100 0 100 100 100 100 100 0 100 100 100 100 100 0June 2001ÏÏÏÏÏÏÏÏÏÏÏÏÏ 100 100 100 100 100 0 100 100 100 100 100 0 100 100 100 100 100 0June 2002ÏÏÏÏÏÏÏÏÏÏÏÏÏ 100 100 100 100 0 0 100 100 100 100 13 0 100 100 100 100 100 0June 2003ÏÏÏÏÏÏÏÏÏÏÏÏÏ 100 100 100 100 0 0 100 100 100 100 0 0 100 100 100 100 19 0June 2004ÏÏÏÏÏÏÏÏÏÏÏÏÏ 100 100 100 100 0 0 100 100 100 100 0 0 100 100 100 100 0 0June 2005ÏÏÏÏÏÏÏÏÏÏÏÏÏ 100 100 100 100 0 0 100 100 100 100 0 0 100 100 100 100 0 0June 2006ÏÏÏÏÏÏÏÏÏÏÏÏÏ 100 100 100 100 0 0 100 100 100 100 0 0 100 100 100 100 0 0June 2007ÏÏÏÏÏÏÏÏÏÏÏÏÏ 100 100 100 100 0 0 100 100 100 100 0 0 100 100 100 100 0 0June 2008ÏÏÏÏÏÏÏÏÏÏÏÏÏ 100 100 100 100 0 0 100 100 100 100 0 0 100 100 100 100 0 0June 2009ÏÏÏÏÏÏÏÏÏÏÏÏÏ 84 84 84 84 0 0 100 100 100 100 0 0 100 100 100 100 0 0June 2010ÏÏÏÏÏÏÏÏÏÏÏÏÏ 49 49 49 49 0 0 100 100 100 100 0 0 100 100 100 100 0 0June 2011ÏÏÏÏÏÏÏÏÏÏÏÏÏ 11 11 11 11 0 0 100 100 100 100 0 0 100 100 100 100 0 0June 2012ÏÏÏÏÏÏÏÏÏÏÏÏÏ 0 0 0 0 0 0 80 80 80 80 0 0 100 100 100 100 0 0June 2013ÏÏÏÏÏÏÏÏÏÏÏÏÏ 0 0 0 0 0 0 50 50 50 50 0 0 100 100 100 100 0 0June 2014ÏÏÏÏÏÏÏÏÏÏÏÏÏ 0 0 0 0 0 0 18 18 18 1 0 0 100 100 100 100 0 0June 2015ÏÏÏÏÏÏÏÏÏÏÏÏÏ 0 0 0 0 0 0 0 0 0 0 0 0 95 95 95 61 0 0June 2016ÏÏÏÏÏÏÏÏÏÏÏÏÏ 0 0 0 0 0 0 0 0 0 0 0 0 83 83 83 22 0 0June 2017ÏÏÏÏÏÏÏÏÏÏÏÏÏ 0 0 0 0 0 0 0 0 0 0 0 0 70 70 70 0 0 0June 2018ÏÏÏÏÏÏÏÏÏÏÏÏÏ 0 0 0 0 0 0 0 0 0 0 0 0 56 56 52 0 0 0June 2019ÏÏÏÏÏÏÏÏÏÏÏÏÏ 0 0 0 0 0 0 0 0 0 0 0 0 41 41 0 0 0 0June 2020ÏÏÏÏÏÏÏÏÏÏÏÏÏ 0 0 0 0 0 0 0 0 0 0 0 0 25 25 0 0 0 0June 2021ÏÏÏÏÏÏÏÏÏÏÏÏÏ 0 0 0 0 0 0 0 0 0 0 0 0 7 7 0 0 0 0June 2022ÏÏÏÏÏÏÏÏÏÏÏÏÏ 0 0 0 0 0 0 0 0 0 0 0 0 0 0 0 0 0 0June 2023ÏÏÏÏÏÏÏÏÏÏÏÏÏ 0 0 0 0 0 0 0 0 0 0 0 0 0 0 0 0 0 0June 2024ÏÏÏÏÏÏÏÏÏÏÏÏÏ 0 0 0 0 0 0 0 0 0 0 0 0 0 0 0 0 0 0June 2025ÏÏÏÏÏÏÏÏÏÏÏÏÏ 0 0 0 0 0 0 0 0 0 0 0 0 0 0 0 0 0 0June 2026ÏÏÏÏÏÏÏÏÏÏÏÏÏ 0 0 0 0 0 0 0 0 0 0 0 0 0 0 0 0 0 0June 2027ÏÏÏÏÏÏÏÏÏÏÏÏÏ 0 0 0 0 0 0 0 0 0 0 0 0 0 0 0 0 0 0June 2028ÏÏÏÏÏÏÏÏÏÏÏÏÏ 0 0 0 0 0 0 0 0 0 0 0 0 0 0 0 0 0 0June 2029ÏÏÏÏÏÏÏÏÏÏÏÏÏ 0 0 0 0 0 0 0 0 0 0 0 0 0 0 0 0 0 0Weighted Average
Life (years)** ÏÏÏÏÏÏ 11.0 11.0 11.0 11.0 2.7 0.6 14.0 14.0 14.0 13.9 2.9 0.6 19.3 19.3 18.5 16.3 3.6 0.7
** Determined as speciÑed under ""Weighted Average Lives of the CertiÑcates'' herein.
S-28

ZC Class EA Class C Class
PSA Prepayment PSA Prepayment PSA PrepaymentAssumption Assumption Assumption
Date 0% 100% 152% 182% 250% 500% 0% 100% 182% 250% 500% 0% 100% 152% 182% 250% 500%
Initial PercentÏÏÏÏÏÏÏÏÏ 100 100 100 100 100 100 100 100 100 100 100 100 100 100 100 100 100June 2000ÏÏÏÏÏÏÏÏÏÏÏÏÏ 108 108 108 108 108 0 100 100 84 70 20 100 100 100 84 47 0June 2001ÏÏÏÏÏÏÏÏÏÏÏÏÏ 116 116 116 116 116 0 100 100 70 47 0 100 100 100 71 8 0June 2002ÏÏÏÏÏÏÏÏÏÏÏÏÏ 125 125 125 125 125 0 100 100 60 30 0 100 100 100 62 0 0June 2003ÏÏÏÏÏÏÏÏÏÏÏÏÏ 135 135 135 135 135 0 100 100 52 17 0 100 100 100 55 0 0June 2004ÏÏÏÏÏÏÏÏÏÏÏÏÏ 145 145 145 145 72 0 100 100 46 9 0 100 100 100 50 0 0June 2005ÏÏÏÏÏÏÏÏÏÏÏÏÏ 157 157 157 157 19 0 100 100 41 3 0 100 100 100 47 0 0June 2006ÏÏÏÏÏÏÏÏÏÏÏÏÏ 169 169 169 169 8 0 100 100 38 1 0 100 100 100 45 0 0June 2007ÏÏÏÏÏÏÏÏÏÏÏÏÏ 182 182 182 182 5 0 100 100 37 * 0 100 100 97 42 0 0June 2008ÏÏÏÏÏÏÏÏÏÏÏÏÏ 196 196 196 196 5 0 100 99 35 * 0 100 100 92 38 0 0June 2009ÏÏÏÏÏÏÏÏÏÏÏÏÏ 211 211 211 211 5 0 100 96 33 * 0 100 100 85 32 0 0June 2010ÏÏÏÏÏÏÏÏÏÏÏÏÏ 228 228 228 228 5 0 100 93 31 * 0 100 100 77 26 0 0June 2011ÏÏÏÏÏÏÏÏÏÏÏÏÏ 245 245 245 245 5 0 100 88 29 * 0 100 100 68 19 0 0June 2012ÏÏÏÏÏÏÏÏÏÏÏÏÏ 264 264 264 264 5 0 100 83 26 * 0 100 100 58 13 0 0June 2013ÏÏÏÏÏÏÏÏÏÏÏÏÏ 285 285 285 285 5 0 100 78 23 * 0 100 100 48 6 0 0June 2014ÏÏÏÏÏÏÏÏÏÏÏÏÏ 307 307 307 307 5 0 100 72 21 * 0 100 100 38 0 0 0June 2015ÏÏÏÏÏÏÏÏÏÏÏÏÏ 331 331 331 331 5 0 100 66 18 * 0 100 100 28 0 0 0June 2016ÏÏÏÏÏÏÏÏÏÏÏÏÏ 356 356 356 356 5 0 100 60 16 * 0 100 100 18 0 0 0June 2017ÏÏÏÏÏÏÏÏÏÏÏÏÏ 384 384 384 348 5 0 100 53 14 * 0 100 87 8 0 0 0June 2018ÏÏÏÏÏÏÏÏÏÏÏÏÏ 414 414 414 296 5 0 100 47 12 * 0 100 70 0 0 0 0June 2019ÏÏÏÏÏÏÏÏÏÏÏÏÏ 446 446 444 248 5 0 100 41 10 * 0 100 53 0 0 0 0June 2020ÏÏÏÏÏÏÏÏÏÏÏÏÏ 481 481 369 203 5 0 100 35 8 * 0 100 36 0 0 0 0June 2021ÏÏÏÏÏÏÏÏÏÏÏÏÏ 518 518 298 163 5 0 100 29 7 * 0 100 20 0 0 0 0June 2022ÏÏÏÏÏÏÏÏÏÏÏÏÏ 533 533 232 125 5 0 100 23 5 * 0 100 4 0 0 0 0June 2023ÏÏÏÏÏÏÏÏÏÏÏÏÏ 533 429 170 91 5 0 100 17 4 * 0 100 0 0 0 0 0June 2024ÏÏÏÏÏÏÏÏÏÏÏÏÏ 533 290 113 61 5 0 100 12 2 * 0 100 0 0 0 0 0June 2025ÏÏÏÏÏÏÏÏÏÏÏÏÏ 533 156 61 33 5 0 100 6 1 * 0 100 0 0 0 0 0June 2026ÏÏÏÏÏÏÏÏÏÏÏÏÏ 533 23 9 5 2 0 88 1 * * 0 100 0 0 0 0 0June 2027ÏÏÏÏÏÏÏÏÏÏÏÏÏ 533 0 0 0 0 0 62 0 0 0 0 100 0 0 0 0 0June 2028ÏÏÏÏÏÏÏÏÏÏÏÏÏ 533 0 0 0 0 0 32 0 0 0 0 30 0 0 0 0 0June 2029ÏÏÏÏÏÏÏÏÏÏÏÏÏ 0 0 0 0 0 0 0 0 0 0 0 0 0 0 0 0 0Weighted Average
Life (years)** ÏÏÏÏÏÏ 29.7 25.2 23.3 21.8 6.0 0.8 28.4 18.5 7.8 2.3 0.6 28.8 20.2 13.7 6.4 1.0 0.3
FC, SC and JC Classes FD, SD and JD Classes FE and SE Classes
PSA Prepayment PSA Prepayment PSA PrepaymentAssumption Assumption Assumption
Date 0% 100% 130% 350% 500% 0% 100% 130% 350% 500% 0% 100% 130% 350% 500%
Initial PercentÏÏÏÏÏÏÏÏÏ 100 100 100 100 100 100 100 100 100 100 100 100 100 100 100June 2000ÏÏÏÏÏÏÏÏÏÏÏÏÏ 97 81 77 75 75 97 80 75 73 73 97 81 76 74 74June 2001ÏÏÏÏÏÏÏÏÏÏÏÏÏ 94 57 47 40 0 94 53 43 36 0 94 55 45 38 0June 2002ÏÏÏÏÏÏÏÏÏÏÏÏÏ 93 49 34 1 0 92 45 28 1 0 93 47 31 1 0June 2003ÏÏÏÏÏÏÏÏÏÏÏÏÏ 93 49 30 0 0 92 45 24 0 0 92 47 27 0 0June 2004ÏÏÏÏÏÏÏÏÏÏÏÏÏ 92 49 27 0 0 92 45 21 0 0 92 46 23 0 0June 2005ÏÏÏÏÏÏÏÏÏÏÏÏÏ 92 48 24 0 0 92 45 18 0 0 92 46 21 0 0June 2006ÏÏÏÏÏÏÏÏÏÏÏÏÏ 92 48 22 0 0 92 45 16 0 0 92 46 19 0 0June 2007ÏÏÏÏÏÏÏÏÏÏÏÏÏ 92 48 20 0 0 92 45 14 0 0 92 46 17 0 0June 2008ÏÏÏÏÏÏÏÏÏÏÏÏÏ 92 47 19 0 0 92 44 13 0 0 92 45 15 0 0June 2009ÏÏÏÏÏÏÏÏÏÏÏÏÏ 91 45 16 0 0 92 41 10 0 0 92 43 13 0 0June 2010ÏÏÏÏÏÏÏÏÏÏÏÏÏ 91 41 12 0 0 92 38 6 0 0 92 39 9 0 0June 2011ÏÏÏÏÏÏÏÏÏÏÏÏÏ 91 37 8 0 0 92 33 2 0 0 92 35 4 0 0June 2012ÏÏÏÏÏÏÏÏÏÏÏÏÏ 91 31 4 0 0 92 27 0 0 0 92 29 2 0 0June 2013ÏÏÏÏÏÏÏÏÏÏÏÏÏ 91 25 3 0 0 92 21 0 0 0 92 23 1 0 0June 2014ÏÏÏÏÏÏÏÏÏÏÏÏÏ 90 19 2 0 0 92 14 0 0 0 91 16 1 0 0June 2015ÏÏÏÏÏÏÏÏÏÏÏÏÏ 90 12 1 0 0 92 7 0 0 0 91 10 * 0 0June 2016ÏÏÏÏÏÏÏÏÏÏÏÏÏ 90 5 * 0 0 92 * 0 0 0 91 3 * 0 0June 2017ÏÏÏÏÏÏÏÏÏÏÏÏÏ 89 0 0 0 0 92 0 0 0 0 91 0 0 0 0June 2018ÏÏÏÏÏÏÏÏÏÏÏÏÏ 89 0 0 0 0 92 0 0 0 0 91 0 0 0 0June 2019ÏÏÏÏÏÏÏÏÏÏÏÏÏ 89 0 0 0 0 92 0 0 0 0 91 0 0 0 0June 2020ÏÏÏÏÏÏÏÏÏÏÏÏÏ 88 0 0 0 0 92 0 0 0 0 90 0 0 0 0June 2021ÏÏÏÏÏÏÏÏÏÏÏÏÏ 88 0 0 0 0 92 0 0 0 0 90 0 0 0 0June 2022ÏÏÏÏÏÏÏÏÏÏÏÏÏ 87 0 0 0 0 92 0 0 0 0 90 0 0 0 0June 2023ÏÏÏÏÏÏÏÏÏÏÏÏÏ 87 0 0 0 0 92 0 0 0 0 90 0 0 0 0June 2024ÏÏÏÏÏÏÏÏÏÏÏÏÏ 68 0 0 0 0 73 0 0 0 0 71 0 0 0 0June 2025ÏÏÏÏÏÏÏÏÏÏÏÏÏ 45 0 0 0 0 48 0 0 0 0 47 0 0 0 0June 2026ÏÏÏÏÏÏÏÏÏÏÏÏÏ 19 0 0 0 0 21 0 0 0 0 20 0 0 0 0June 2027ÏÏÏÏÏÏÏÏÏÏÏÏÏ 0 0 0 0 0 0 0 0 0 0 0 0 0 0 0June 2028ÏÏÏÏÏÏÏÏÏÏÏÏÏ 0 0 0 0 0 0 0 0 0 0 0 0 0 0 0June 2029ÏÏÏÏÏÏÏÏÏÏÏÏÏ 0 0 0 0 0 0 0 0 0 0 0 0 0 0 0Weighted Average
Life (years)** ÏÏÏÏÏÏ 23.6 7.4 4.0 1.7 1.3 24.2 6.8 3.2 1.6 1.3 23.9 7.1 3.5 1.6 1.3
* Indicates an outstanding balance greater than 0% and less than 0.5% of the original principal balance.** Determined as speciÑed under ""Weighted Average Lives of the CertiÑcates'' herein.
S-29

Characteristics of the R Class
The R Class will not have a principal balance and will not bear interest. If any assets of the Trustremain after the principal balances of all Classes are reduced to zero, we will pay the Holder of theR Class the proceeds from those assets. Fannie Mae does not expect that any material assets willremain in such case.
The R Class will be subject to certain transfer restrictions. We will not permit transfer of recordor beneÑcial ownership of an R CertiÑcate to a ""disqualiÑed organization.'' In addition, we will notpermit transfer of record or beneÑcial ownership of an R CertiÑcate to any person that is not a ""U.S.Person'' without our written consent. Treasury Department regulations (the ""Regulations'') providethat a transfer of a ""noneconomic residual interest'' to a U.S. Person will be disregarded for all federaltax purposes unless no signiÑcant purpose of the transfer is to impede the assessment or collection oftax. The R Class will constitute a noneconomic residual interest under the Regulations. Any transfereeof an R CertiÑcate must execute and deliver an aÇdavit and an Internal Revenue Service Form W-9on which the transferee provides its taxpayer identiÑcation number. See ""Description of CertiÑ-catesÌSpecial Characteristics of Residual CertiÑcates'' and ""Certain Federal Income Tax Conse-quencesÌTaxation of BeneÑcial Owners of Residual CertiÑcates'' in the REMIC Prospectus.Transferors of an R CertiÑcate should consult with their own tax advisors for further informationregarding such transfers.
The Holder of the R Class will be considered to be the holder of the ""residual interest'' in theREMIC constituted by the Trust. See ""Certain Federal Income Tax Consequences'' in the REMICProspectus. Pursuant to the Trust Agreement, we will be obligated to provide to such Holder(i) information necessary to enable it to prepare its federal income tax returns and (ii) any reportsregarding the R Class that may be required under the Code.
CERTAIN ADDITIONAL FEDERAL INCOME TAX CONSEQUENCES
The CertiÑcates and payments on the CertiÑcates are not generally exempt from taxation.Therefore, you should consider the tax consequences of holding a CertiÑcate before you acquire one.The following tax discussion supplements the discussion under the caption ""Certain Federal IncomeTax Consequences'' in the REMIC Prospectus. When read together, the two discussions describe thecurrent federal income tax treatment of beneÑcial owners of CertiÑcates. These two tax discussions donot purport to deal with all federal tax consequences applicable to all categories of beneÑcial owners,some of which may be subject to special rules. In addition, these discussions may not apply to yourparticular circumstances for one of the reasons explained in the REMIC Prospectus. You shouldconsult your own tax advisors regarding the federal income tax consequences of holding and disposingof CertiÑcates as well as any tax consequences arising under the laws of any state, local or foreigntaxing jurisdiction.
REMIC Election and Special Tax Attributes
We will elect to treat the Trust as a REMIC for federal income tax purposes. The REMICCertiÑcates, other than the R Class, will be designated as the ""regular interests,'' and the R Class willbe designated as the ""residual interest,'' in the REMIC constituted by the Trust.
Because the Trust will qualify as a REMIC, the REMIC CertiÑcates and any related RCRCertiÑcates generally will be treated as ""regular or residual interests in a REMIC'' for domesticbuilding and loan associations, ""real estate assets'' for real estate investment trusts, and, except forthe R Class, as ""qualiÑed mortgages'' for other REMICs. See ""Certain Federal Income TaxConsequencesÌREMIC Election and Special Tax Attributes'' in the REMIC Prospectus.
S-30

Taxation of BeneÑcial Owners of Regular CertiÑcates
The Accrual Classes, the Principal Only Class and the PL Class will be issued with original issuediscount (""OID''), and certain other Classes of REMIC CertiÑcates may be issued with OID. If aClass is issued with OID, a beneÑcial owner of a CertiÑcate of that Class generally must recognizesome taxable income in advance of the receipt of the cash attributable to that income. See ""CertainFederal Income Tax ConsequencesÌTaxation of BeneÑcial Owners of Regular CertiÑcatesÌTreat-ment of Original Issue Discount'' in the REMIC Prospectus. In addition, certain Classes of REMICCertiÑcates may be treated as having been issued at a premium. See ""Certain Federal Income TaxConsequencesÌTaxation of BeneÑcial Owners of Regular CertiÑcatesÌRegular CertiÑcates Pur-chased at a Premium'' in the REMIC Prospectus.
The Prepayment Assumptions that will be used in determining the rate of accrual of OID will beas follows:
Class Group PSA Prepayment Assumption
1 136%2 171%3 135%4 182%5 130%6 130%
See ""Certain Federal Income Tax ConsequencesÌTaxation of BeneÑcial Owners of Regular CertiÑ-catesÌTreatment of Original Issue DiscountÌDaily Portions of Original Issue Discount'' in theREMIC Prospectus. No representation is made as to whether the Mortgage Loans underlying theMBS will prepay at any of those rates or any other rate. See ""Description of the CertiÑcatesÌWeighted Average Lives of the CertiÑcates'' in this prospectus supplement and ""Description ofCertiÑcatesÌWeighted Average Life and Final Distribution Date'' in the REMIC Prospectus.
Taxation of BeneÑcial Owners of Residual CertiÑcates
For purposes of determining the portion of the taxable income of the Trust that generally will notbe treated as excess inclusions, the rate to be used is 120% of the ""federal long-term rate.'' The ratewill be published on or about May 20, 1999. See ""Certain Federal Income Tax ConsequencesÌTaxation of BeneÑcial Owners of Residual CertiÑcatesÌTreatment of Excess Inclusions'' and ""ÌFor-eign InvestorsÌResidual CertiÑcates'' in the REMIC Prospectus.
Taxation of BeneÑcial Owners of RCR CertiÑcates
General. The RCR Classes will be created, sold and administered pursuant to an arrangementthat will be classiÑed as a grantor trust under subpart E, part I of subchapter J of the Code. TheREMIC CertiÑcates that are exchanged for RCR CertiÑcates (including any exchanges eÅective onthe Settlement Date) will be the assets of the trust, and the RCR CertiÑcates will represent anownership interest in those REMIC CertiÑcates. For a general discussion of the federal income taxtreatment of beneÑcial owners of REMIC CertiÑcates, see ""Certain Federal Income Tax Conse-quences'' in the REMIC Prospectus.
The RCR Classes (each, a ""Combination RCR Class'') will represent the beneÑcial ownership ofthe underlying REMIC CertiÑcates set forth in Schedule 1. Each CertiÑcate of a Combination RCRClass (a ""Combination RCR CertiÑcate'') will represent beneÑcial ownership of undivided interests intwo or more underlying REMIC CertiÑcates.
Combination RCR Classes. A beneÑcial owner of a Combination RCR CertiÑcate will be treatedas the beneÑcial owner of a proportionate interest in the REMIC CertiÑcates underlying thatCombination RCR CertiÑcate. A beneÑcial owner of a Combination RCR CertiÑcate must allocate itscost to acquire that CertiÑcate among the underlying REMIC CertiÑcates in proportion to theirrelative fair market values at the time of acquisition. Such owner should account for its ownership
S-31

interest in each underlying REMIC CertiÑcate as described under ""ÌTaxation of BeneÑcial Ownersof Regular CertiÑcates'' in this prospectus supplement and ""Certain Federal Income Tax Conse-quencesÌTaxation of BeneÑcial Owners of Regular CertiÑcates'' in the REMIC Prospectus. When abeneÑcial owner sells a Combination RCR CertiÑcate, the owner must allocate the sale proceedsamong the underlying REMIC CertiÑcates in proportion to their relative fair market values at thetime of sale.
Exchanges. If a beneÑcial owner exchanges one or more REMIC CertiÑcates for the related RCRCertiÑcate or CertiÑcates in the manner described under ""Description of the CertiÑcatesÌCombina-tion and Recombination'' in this prospectus supplement, the exchange will not be taxable. Likewise, ifa beneÑcial owner exchanges one or more RCR CertiÑcates for the related REMIC CertiÑcate orCertiÑcates in the manner described in that discussion, the exchange will not be a taxable exchange. Ineach of these cases, the beneÑcial owner will be treated as continuing to own after the exchange thesame combination of interests in the related REMIC CertiÑcates (or the same interest in the relatedREMIC CertiÑcate) that it owned immediately prior to the exchange.
PLAN OF DISTRIBUTION
General. We are obligated to deliver the CertiÑcates to Salomon Smith Barney Inc. (the""Dealer'') in exchange for the Trust MBS and the Underlying REMIC CertiÑcates. The Dealerproposes to oÅer the CertiÑcates directly to the public from time to time in negotiated transactions atvarying prices to be determined at the time of sale. The Dealer may eÅect these transactions to orthrough other dealers.
Increase in CertiÑcates. Before the Settlement Date, we and the Dealer may agree to oÅerGroup 1, Group 2, Group 3 and Group 4 Classes in addition to those contemplated as of the date ofthis prospectus supplement. In this event, we will increase the related Trust MBS in principal balance,but we expect that all these additional Trust MBS will have the same characteristics as describedunder ""Description of the CertiÑcatesÌThe Trust MBS.'' The proportion that the original principalbalance of each Group 1, Group 2, Group 3 and Group 4 Class bears to the aggregate original principalbalance of all Group 1, Group 2, Group 3 or Group 4 Classes, respectively, will remain the same.
LEGAL MATTERS
Brown & Wood LLP will provide legal representation for Fannie Mae. Cleary, Gottlieb, Steen &Hamilton will provide legal representation for the Dealer.
S-32

A-1
Exhib
it A
Underly
ing R
EM
IC C
erti
Ñcate
s
Approxim
ate
Approxim
ate
Orig
inal
June
Approxim
ate
Weig
hte
dW
eig
hte
dU
nderly
ing
Date
Fin
al
Prin
cip
al
1999
Prin
cip
al
Weig
hte
dA
verage
Average
Underly
ing
RE
MIC
of
CU
SIP
Inte
rest
Inte
rest
Dis
trib
uti
on
Prin
cip
al
Bala
nce
Cla
ssB
ala
nce i
nA
verage
WA
MC
AG
ESecurit
yC
lass
Trust
Cla
ssIs
sue
Num
ber
Rate
Type(1)
Date
Type(1)
of
Cla
ssF
acto
rth
e T
rust
WA
C(in
month
s)(in
month
s)T
ype
Group
1999-2
8JA
May
1999
31359W
AK
76.0
%FIX
June
2029
SC
H$136,4
00,0
00
0.9
8483681
$102,8
16,9
62
6.7
99%
345
13
MB
S5
1999-2
8Y
AM
ay 1
999
31359W
AE
16.0
FIX
June
2029
SC
H125,0
00,0
00
0.9
8345392
119,9
81,3
78
6.7
99
345
13
MB
S6
(1)
See
""D
escr
iption o
f C
ertiÑca
tesÌ
Cla
ss D
eÑnitio
ns
and A
bbre
via
tions'
' in
the
RE
MIC
Pro
spec
tus.

A-2
Schedule
1
Available
Recom
bin
ati
ons(
1)
RE
MIC
Certi
Ñcate
sR
CR
Certi
Ñcate
s
Orig
inal
Orig
inal
Fin
al
Prin
cip
al
RC
RP
rin
cip
al
Inte
rest
Inte
rest
Prin
cip
al
CU
SIP
Dis
trib
uti
on
Cla
sses
Bala
nce
Cla
sses
Bala
nce
Rate
Type(2)
Type(2)
Num
ber
Date
Recom
bin
ati
on 1
CA
$16,3
00,0
00
C$
27,5
60,0
00
7.5
%FIX
SU
P31359W
JT
9D
ecem
ber
2028
CB
11,2
60,0
00
Recom
bin
ati
on 2
FC
72,5
76,6
79
JC
102,8
16,9
62
6.0
FIX
SC
/PT
31359W
JU
6June
2029
SC
30,2
40,2
83
Recom
bin
ati
on 3
FD
84,6
92,7
37
JD
119,9
81,3
78
6.0
FIX
SC
/PT
31359W
JV
4June
2029
SD
35,2
88,6
41
Recom
bin
ati
on 4
FC
72,5
76,6
79
FE
157,2
69,4
16
(3)
FLT
SC
/PT
31359W
JW
2June
2029
FD
84,6
92,7
37
Recom
bin
ati
on 5
SC
30,2
40,2
83
SE
65,5
28,9
24
(3)
INV
SC
/PT
31359W
JX
0June
2029
SD
35,2
88,6
41
(1)
The
pri
nci
pal
bal
ance
s of th
e R
EM
IC C
ertiÑca
tes an
d R
CR
Cer
tiÑca
tes
involv
ed in a
ny e
xch
ange
will bea
r th
e sa
me
rela
tionsh
ip a
s th
at b
orn
e by the
ori
ginal
pri
nci
pal
bal
ance
s of th
e re
late
d C
lass
es.
(2)
See
""D
escr
iption o
f C
ertiÑca
tesÌ
Cla
ss D
eÑnitio
ns
and A
bbre
via
tions'
' in
the
RE
MIC
Pro
spec
tus
and ""D
escr
iption o
f th
e C
ertiÑca
tesÌ
Dis
trib
utions
of In
tere
st'' a
nd ""Ì
Dis
trib
utions
of P
rinci
pal
''her
ein.
(3)
For
a des
crip
tion o
f th
is inte
rest
rat
e, s
ee ""D
escr
iption o
f th
e C
ertiÑca
tesÌ
Dis
trib
utions
of
Inte
rest
'' h
erei
n.

Principal Balance Schedules
PA Class Planned Balances
Distribution Planned Distribution Planned Distribution PlannedDate Balance Date Balance Date Balance
Initial Balance June 2001 ÏÏÏÏÏÏÏÏÏÏÏ $57,522,687.39 November 2002 ÏÏÏÏÏÏ $24,420,062.16through July 2001 ÏÏÏÏÏÏÏÏÏÏÏ 55,496,587.42 December 2002 ÏÏÏÏÏÏ 22,559,030.93February 2000 ÏÏÏÏÏÏÏ $91,360,000.00
August 2001 ÏÏÏÏÏÏÏÏÏ 53,480,605.04 January 2003 ÏÏÏÏÏÏÏÏ 20,707,264.19March 2000 ÏÏÏÏÏÏÏÏÏ 89,164,684.26September 2001ÏÏÏÏÏÏ 51,474,687.96 February 2003 ÏÏÏÏÏÏÏ 18,864,714.05April 2000ÏÏÏÏÏÏÏÏÏÏÏ 86,980,360.23October 2001 ÏÏÏÏÏÏÏÏ 49,478,784.19May 2000 ÏÏÏÏÏÏÏÏÏÏÏ 84,806,971.15 March 2003 ÏÏÏÏÏÏÏÏÏ 17,031,332.86November 2001 ÏÏÏÏÏÏ 47,492,841.98June 2000 ÏÏÏÏÏÏÏÏÏÏÏ 82,644,460.53 April 2003ÏÏÏÏÏÏÏÏÏÏÏ 15,207,073.22December 2001 ÏÏÏÏÏÏ 45,516,809.85July 2000 ÏÏÏÏÏÏÏÏÏÏÏ 80,492,772.20 May 2003 ÏÏÏÏÏÏÏÏÏÏÏ 13,391,887.97January 2002 ÏÏÏÏÏÏÏÏ 43,550,636.60August 2000 ÏÏÏÏÏÏÏÏÏ 78,351,850.25
June 2003 ÏÏÏÏÏÏÏÏÏÏÏ 11,585,730.20February 2002 ÏÏÏÏÏÏÏ 41,594,271.26September 2000ÏÏÏÏÏÏ 76,221,639.07July 2003 ÏÏÏÏÏÏÏÏÏÏÏ 9,788,553.23March 2002 ÏÏÏÏÏÏÏÏÏ 39,647,663.16October 2000 ÏÏÏÏÏÏÏÏ 74,102,083.33August 2003 ÏÏÏÏÏÏÏÏÏ 8,000,310.61April 2002ÏÏÏÏÏÏÏÏÏÏÏ 37,710,761.89November 2000 ÏÏÏÏÏÏ 71,993,127.98September 2003ÏÏÏÏÏÏ 6,220,956.17May 2002 ÏÏÏÏÏÏÏÏÏÏÏ 35,783,517.27December 2000 ÏÏÏÏÏÏ 69,894,718.28
June 2002 ÏÏÏÏÏÏÏÏÏÏÏ 33,865,879.39 October 2003 ÏÏÏÏÏÏÏÏ 4,450,443.94January 2001 ÏÏÏÏÏÏÏÏ 67,806,799.75July 2002 ÏÏÏÏÏÏÏÏÏÏÏ 31,957,798.59February 2001 ÏÏÏÏÏÏÏ 65,729,318.18 November 2003 ÏÏÏÏÏÏ 2,688,728.20August 2002 ÏÏÏÏÏÏÏÏÏ 30,059,225.48March 2001 ÏÏÏÏÏÏÏÏÏ 63,662,219.67 December 2003 ÏÏÏÏÏÏ 935,763.46September 2002ÏÏÏÏÏÏ 28,170,110.92April 2001ÏÏÏÏÏÏÏÏÏÏÏ 61,605,450.56 January 2004 and
May 2001 ÏÏÏÏÏÏÏÏÏÏÏ 59,558,957.50 October 2002 ÏÏÏÏÏÏÏÏ 26,290,406.03 thereafter ÏÏÏÏÏÏÏÏÏ 0.00
PC Class Planned Balances
Distribution Planned Distribution Planned Distribution PlannedDate Balance Date Balance Date Balance
Initial Balance ÏÏÏÏÏÏÏ $56,090,545.00 November 2001 ÏÏÏÏÏÏ $56,090,545.00 April 2004ÏÏÏÏÏÏÏÏÏÏÏ $50,101,057.92
July 1999 ÏÏÏÏÏÏÏÏÏÏÏ 56,090,545.00 December 2001 ÏÏÏÏÏÏ 56,090,545.00 May 2004 ÏÏÏÏÏÏÏÏÏÏÏ 48,391,173.99
August 1999 ÏÏÏÏÏÏÏÏÏ 56,090,545.00 January 2002 ÏÏÏÏÏÏÏÏ 56,090,545.00 June 2004 ÏÏÏÏÏÏÏÏÏÏÏ 46,689,773.00
September 1999ÏÏÏÏÏÏ 56,090,545.00 February 2002 ÏÏÏÏÏÏÏ 56,090,545.00 July 2004 ÏÏÏÏÏÏÏÏÏÏÏ 44,996,811.07
October 1999 ÏÏÏÏÏÏÏÏ 56,090,545.00 March 2002 ÏÏÏÏÏÏÏÏÏ 56,090,545.00 August 2004 ÏÏÏÏÏÏÏÏÏ 43,312,244.55
November 1999 ÏÏÏÏÏÏ 56,090,545.00 April 2002ÏÏÏÏÏÏÏÏÏÏÏ 56,090,545.00 September 2004ÏÏÏÏÏÏ 41,636,030.00
December 1999 ÏÏÏÏÏÏ 56,090,545.00 May 2002 ÏÏÏÏÏÏÏÏÏÏÏ 56,090,545.00 October 2004 ÏÏÏÏÏÏÏÏ 39,968,124.24
January 2000 ÏÏÏÏÏÏÏÏ 56,090,545.00 June 2002 ÏÏÏÏÏÏÏÏÏÏÏ 56,090,545.00 November 2004 ÏÏÏÏÏÏ 38,308,484.28
February 2000 ÏÏÏÏÏÏÏ 56,090,545.00 July 2002 ÏÏÏÏÏÏÏÏÏÏÏ 56,090,545.00 December 2004 ÏÏÏÏÏÏ 36,657,067.35
March 2000 ÏÏÏÏÏÏÏÏÏ 56,090,545.00 August 2002 ÏÏÏÏÏÏÏÏÏ 56,090,545.00 January 2005 ÏÏÏÏÏÏÏÏ 35,013,830.92
April 2000ÏÏÏÏÏÏÏÏÏÏÏ 56,090,545.00 September 2002ÏÏÏÏÏÏ 56,090,545.00 February 2005 ÏÏÏÏÏÏÏ 33,378,732.66
May 2000 ÏÏÏÏÏÏÏÏÏÏÏ 56,090,545.00 October 2002 ÏÏÏÏÏÏÏÏ 56,090,545.00 March 2005 ÏÏÏÏÏÏÏÏÏ 31,751,730.47
June 2000 ÏÏÏÏÏÏÏÏÏÏÏ 56,090,545.00 November 2002 ÏÏÏÏÏÏ 56,090,545.00 April 2005ÏÏÏÏÏÏÏÏÏÏÏ 30,132,782.46
July 2000 ÏÏÏÏÏÏÏÏÏÏÏ 56,090,545.00 December 2002 ÏÏÏÏÏÏ 56,090,545.00 May 2005 ÏÏÏÏÏÏÏÏÏÏÏ 28,521,846.95
August 2000 ÏÏÏÏÏÏÏÏÏ 56,090,545.00 January 2003 ÏÏÏÏÏÏÏÏ 56,090,545.00 June 2005 ÏÏÏÏÏÏÏÏÏÏÏ 26,918,882.48
September 2000ÏÏÏÏÏÏ 56,090,545.00 February 2003 ÏÏÏÏÏÏÏ 56,090,545.00 July 2005 ÏÏÏÏÏÏÏÏÏÏÏ 25,323,847.81
October 2000 ÏÏÏÏÏÏÏÏ 56,090,545.00 March 2003 ÏÏÏÏÏÏÏÏÏ 56,090,545.00 August 2005 ÏÏÏÏÏÏÏÏÏ 23,736,701.91
November 2000 ÏÏÏÏÏÏ 56,090,545.00 April 2003ÏÏÏÏÏÏÏÏÏÏÏ 56,090,545.00 September 2005ÏÏÏÏÏÏ 22,157,403.95
December 2000 ÏÏÏÏÏÏ 56,090,545.00 May 2003 ÏÏÏÏÏÏÏÏÏÏÏ 56,090,545.00 October 2005 ÏÏÏÏÏÏÏÏ 20,585,913.31
January 2001 ÏÏÏÏÏÏÏÏ 56,090,545.00 June 2003 ÏÏÏÏÏÏÏÏÏÏÏ 56,090,545.00 November 2005 ÏÏÏÏÏÏ 19,022,189.59
February 2001 ÏÏÏÏÏÏÏ 56,090,545.00 July 2003 ÏÏÏÏÏÏÏÏÏÏÏ 56,090,545.00 December 2005 ÏÏÏÏÏÏ 17,466,192.59
March 2001 ÏÏÏÏÏÏÏÏÏ 56,090,545.00 August 2003 ÏÏÏÏÏÏÏÏÏ 56,090,545.00 January 2006 ÏÏÏÏÏÏÏÏ 15,917,882.33
April 2001ÏÏÏÏÏÏÏÏÏÏÏ 56,090,545.00 September 2003ÏÏÏÏÏÏ 56,090,545.00 February 2006 ÏÏÏÏÏÏÏ 14,377,219.00
May 2001 ÏÏÏÏÏÏÏÏÏÏÏ 56,090,545.00 October 2003 ÏÏÏÏÏÏÏÏ 56,090,545.00 March 2006 ÏÏÏÏÏÏÏÏÏ 12,844,163.04
June 2001 ÏÏÏÏÏÏÏÏÏÏÏ 56,090,545.00 November 2003 ÏÏÏÏÏÏ 56,090,545.00 April 2006ÏÏÏÏÏÏÏÏÏÏÏ 11,318,675.07
July 2001 ÏÏÏÏÏÏÏÏÏÏÏ 56,090,545.00 December 2003 ÏÏÏÏÏÏ 56,090,545.00 May 2006 ÏÏÏÏÏÏÏÏÏÏÏ 9,800,715.91
August 2001 ÏÏÏÏÏÏÏÏÏ 56,090,545.00 January 2004 ÏÏÏÏÏÏÏÏ 55,282,049.53 June 2006 ÏÏÏÏÏÏÏÏÏÏÏ 8,290,246.58
September 2001ÏÏÏÏÏÏ 56,090,545.00 February 2004 ÏÏÏÏÏÏÏ 53,546,451.24 July 2006 ÏÏÏÏÏÏÏÏÏÏÏ 6,787,228.32
October 2001 ÏÏÏÏÏÏÏÏ 56,090,545.00 March 2004 ÏÏÏÏÏÏÏÏÏ 51,819,468.89 August 2006 ÏÏÏÏÏÏÏÏÏ 5,291,622.55
B-1

PC Class (Continued)
Distribution Planned Distribution PlannedDate Balance Date Balance
September 2006ÏÏÏÏÏÏ $ 3,803,390.89 November 2006 ÏÏÏÏÏÏ $ 848,897.37
December 2006 andOctober 2006 ÏÏÏÏÏÏÏÏ 2,322,495.16 thereafter ÏÏÏÏÏÏÏÏÏ 0.00
YA Class Targeted Balances
Distribution Targeted Distribution Targeted Distribution TargetedDate Balance Date Balance Date Balance
Initial Balance ÏÏÏÏÏÏÏ $68,156,097.00 February 2003 ÏÏÏÏÏÏÏ $36,820,707.95 October 2006 ÏÏÏÏÏÏÏÏ $28,186,239.01
July 1999 ÏÏÏÏÏÏÏÏÏÏÏ 66,566,890.89 March 2003 ÏÏÏÏÏÏÏÏÏ 36,489,636.35 November 2006 ÏÏÏÏÏÏ 28,108,125.74
August 1999 ÏÏÏÏÏÏÏÏÏ 64,940,064.62 April 2003ÏÏÏÏÏÏÏÏÏÏÏ 36,165,923.49 December 2006 ÏÏÏÏÏÏ 27,709,840.61
September 1999ÏÏÏÏÏÏ 63,276,540.71 May 2003 ÏÏÏÏÏÏÏÏÏÏÏ 35,849,483.40 January 2007 ÏÏÏÏÏÏÏÏ 26,873,491.05
October 1999 ÏÏÏÏÏÏÏÏ 61,577,275.02 June 2003 ÏÏÏÏÏÏÏÏÏÏÏ 35,540,230.97 February 2007 ÏÏÏÏÏÏÏ 26,045,109.53
November 1999 ÏÏÏÏÏÏ 59,843,255.71 July 2003 ÏÏÏÏÏÏÏÏÏÏÏ 35,238,081.99 March 2007 ÏÏÏÏÏÏÏÏÏ 25,224,623.08
December 1999 ÏÏÏÏÏÏ 58,075,502.09 August 2003 ÏÏÏÏÏÏÏÏÏ 34,942,953.08 April 2007ÏÏÏÏÏÏÏÏÏÏÏ 24,411,959.40
January 2000 ÏÏÏÏÏÏÏÏ 56,275,063.21 September 2003ÏÏÏÏÏÏ 34,654,761.71 May 2007 ÏÏÏÏÏÏÏÏÏÏÏ 23,607,046.84
February 2000 ÏÏÏÏÏÏÏ 54,443,016.59 October 2003 ÏÏÏÏÏÏÏÏ 34,373,426.18 June 2007 ÏÏÏÏÏÏÏÏÏÏÏ 22,809,814.41
March 2000 ÏÏÏÏÏÏÏÏÏ 53,781,678.37 November 2003 ÏÏÏÏÏÏ 34,098,865.64 July 2007 ÏÏÏÏÏÏÏÏÏÏÏ 22,020,191.75
April 2000ÏÏÏÏÏÏÏÏÏÏÏ 53,131,451.80 December 2003 ÏÏÏÏÏÏ 33,831,000.05 August 2007 ÏÏÏÏÏÏÏÏÏ 21,238,109.13
May 2000 ÏÏÏÏÏÏÏÏÏÏÏ 52,492,213.22 January 2004 ÏÏÏÏÏÏÏÏ 33,569,750.21 September 2007ÏÏÏÏÏÏ 20,463,497.46
June 2000 ÏÏÏÏÏÏÏÏÏÏÏ 51,863,840.26 February 2004 ÏÏÏÏÏÏÏ 33,315,037.70 October 2007 ÏÏÏÏÏÏÏÏ 19,696,288.29
July 2000 ÏÏÏÏÏÏÏÏÏÏÏ 51,246,211.70 March 2004 ÏÏÏÏÏÏÏÏÏ 33,066,784.90 November 2007 ÏÏÏÏÏÏ 18,936,413.76
August 2000 ÏÏÏÏÏÏÏÏÏ 50,639,207.57 April 2004ÏÏÏÏÏÏÏÏÏÏÏ 32,824,914.99 December 2007 ÏÏÏÏÏÏ 18,183,806.63
September 2000ÏÏÏÏÏÏ 50,042,709.10 May 2004 ÏÏÏÏÏÏÏÏÏÏÏ 32,589,351.95 January 2008 ÏÏÏÏÏÏÏÏ 17,438,400.29
October 2000 ÏÏÏÏÏÏÏÏ 49,456,598.69 June 2004 ÏÏÏÏÏÏÏÏÏÏÏ 32,360,020.50 February 2008 ÏÏÏÏÏÏÏ 16,700,128.71
November 2000 ÏÏÏÏÏÏ 48,880,759.92 July 2004 ÏÏÏÏÏÏÏÏÏÏÏ 32,136,846.18 March 2008 ÏÏÏÏÏÏÏÏÏ 15,968,926.46
December 2000 ÏÏÏÏÏÏ 48,315,077.51 August 2004 ÏÏÏÏÏÏÏÏÏ 31,919,755.25 April 2008ÏÏÏÏÏÏÏÏÏÏÏ 15,244,728.71
January 2001 ÏÏÏÏÏÏÏÏ 47,759,437.36 September 2004ÏÏÏÏÏÏ 31,708,674.74 May 2008 ÏÏÏÏÏÏÏÏÏÏÏ 14,527,471.21
February 2001 ÏÏÏÏÏÏÏ 47,213,726.49 October 2004 ÏÏÏÏÏÏÏÏ 31,503,532.43 June 2008 ÏÏÏÏÏÏÏÏÏÏÏ 13,817,090.30March 2001 ÏÏÏÏÏÏÏÏÏ 46,677,833.06 November 2004 ÏÏÏÏÏÏ 31,304,256.84 July 2008 ÏÏÏÏÏÏÏÏÏÏÏ 13,113,522.88April 2001ÏÏÏÏÏÏÏÏÏÏÏ 46,151,646.36 December 2004 ÏÏÏÏÏÏ 31,110,777.21 August 2008 ÏÏÏÏÏÏÏÏÏ 12,416,706.43May 2001 ÏÏÏÏÏÏÏÏÏÏÏ 45,635,056.76 January 2005 ÏÏÏÏÏÏÏÏ 30,923,023.53 September 2008ÏÏÏÏÏÏ 11,726,579.00June 2001 ÏÏÏÏÏÏÏÏÏÏÏ 45,127,955.74 February 2005 ÏÏÏÏÏÏÏ 30,740,926.49 October 2008 ÏÏÏÏÏÏÏÏ 11,043,079.19July 2001 ÏÏÏÏÏÏÏÏÏÏÏ 44,630,235.87 March 2005 ÏÏÏÏÏÏÏÏÏ 30,564,417.50 November 2008 ÏÏÏÏÏÏ 10,366,146.17August 2001 ÏÏÏÏÏÏÏÏÏ 44,141,790.80 April 2005ÏÏÏÏÏÏÏÏÏÏÏ 30,393,428.67 December 2008 ÏÏÏÏÏÏ 9,695,719.65September 2001ÏÏÏÏÏÏ 43,662,515.25 May 2005 ÏÏÏÏÏÏÏÏÏÏÏ 30,227,892.83 January 2009 ÏÏÏÏÏÏÏÏ 9,031,739.88October 2001 ÏÏÏÏÏÏÏÏ 43,192,304.98 June 2005 ÏÏÏÏÏÏÏÏÏÏÏ 30,067,743.48 February 2009 ÏÏÏÏÏÏÏ 8,374,147.66November 2001 ÏÏÏÏÏÏ 42,731,056.79 July 2005 ÏÏÏÏÏÏÏÏÏÏÏ 29,912,914.81 March 2009 ÏÏÏÏÏÏÏÏÏ 7,722,884.32December 2001 ÏÏÏÏÏÏ 42,278,668.56 August 2005 ÏÏÏÏÏÏÏÏÏ 29,763,341.69 April 2009ÏÏÏÏÏÏÏÏÏÏÏ 7,077,891.74January 2002 ÏÏÏÏÏÏÏÏ 41,835,039.15 September 2005ÏÏÏÏÏÏ 29,618,959.66 May 2009 ÏÏÏÏÏÏÏÏÏÏÏ 6,439,112.29February 2002 ÏÏÏÏÏÏÏ 41,400,068.46 October 2005 ÏÏÏÏÏÏÏÏ 29,479,704.93 June 2009 ÏÏÏÏÏÏÏÏÏÏÏ 5,806,488.90March 2002 ÏÏÏÏÏÏÏÏÏ 40,973,657.40 November 2005 ÏÏÏÏÏÏ 29,345,514.37 July 2009 ÏÏÏÏÏÏÏÏÏÏÏ 5,179,964.98April 2002ÏÏÏÏÏÏÏÏÏÏÏ 40,555,707.84 December 2005 ÏÏÏÏÏÏ 29,216,325.50 August 2009 ÏÏÏÏÏÏÏÏÏ 4,559,484.48May 2002 ÏÏÏÏÏÏÏÏÏÏÏ 40,146,122.69 January 2006 ÏÏÏÏÏÏÏÏ 29,092,076.49 September 2009ÏÏÏÏÏÏ 3,944,991.85June 2002 ÏÏÏÏÏÏÏÏÏÏÏ 39,744,805.81 February 2006 ÏÏÏÏÏÏÏ 28,972,706.15 October 2009 ÏÏÏÏÏÏÏÏ 3,336,432.03July 2002 ÏÏÏÏÏÏÏÏÏÏÏ 39,351,662.03 March 2006 ÏÏÏÏÏÏÏÏÏ 28,858,153.92 November 2009 ÏÏÏÏÏÏ 2,733,750.49August 2002 ÏÏÏÏÏÏÏÏÏ 38,966,597.16 April 2006ÏÏÏÏÏÏÏÏÏÏÏ 28,748,359.87 December 2009 ÏÏÏÏÏÏ 2,136,893.14September 2002ÏÏÏÏÏÏ 38,589,517.94 May 2006 ÏÏÏÏÏÏÏÏÏÏÏ 28,643,264.70 January 2010 ÏÏÏÏÏÏÏÏ 1,545,806.44October 2002 ÏÏÏÏÏÏÏÏ 38,220,332.04 June 2006 ÏÏÏÏÏÏÏÏÏÏÏ 28,542,809.71 February 2010 ÏÏÏÏÏÏÏ 960,437.30November 2002 ÏÏÏÏÏÏ 37,858,948.09 July 2006 ÏÏÏÏÏÏÏÏÏÏÏ 28,446,936.83 March 2010 ÏÏÏÏÏÏÏÏÏ 380,733.11December 2002 ÏÏÏÏÏÏ 37,505,275.63 August 2006 ÏÏÏÏÏÏÏÏÏ 28,355,588.56 April 2010 andJanuary 2003 ÏÏÏÏÏÏÏÏ 37,159,225.13 September 2006ÏÏÏÏÏÏ 28,268,708.05 thereafter ÏÏÏÏÏÏÏÏÏ 0.00
B-2

PD Class Planned Balances
Distribution Planned Distribution Planned Distribution PlannedDate Balance Date Balance Date Balance
Initial Balance June 2001 ÏÏÏÏÏÏÏÏÏÏÏ $45,169,295.78 August 2002 ÏÏÏÏÏÏÏÏÏ $19,007,309.83through July 2001 ÏÏÏÏÏÏÏÏÏÏÏ 43,238,271.90 September 2002ÏÏÏÏÏÏ 17,208,783.35May 2000 ÏÏÏÏÏÏÏÏÏÏÏ $70,300,000.00
August 2001 ÏÏÏÏÏÏÏÏÏ 41,317,032.99 October 2002 ÏÏÏÏÏÏÏÏ 15,419,359.53June 2000 ÏÏÏÏÏÏÏÏÏÏÏ 68,535,513.28September 2001ÏÏÏÏÏÏ 39,405,528.67July 2000 ÏÏÏÏÏÏÏÏÏÏÏ 66,720,045.69 November 2002 ÏÏÏÏÏÏ 13,638,991.49October 2001 ÏÏÏÏÏÏÏÏ 37,503,708.81August 2000 ÏÏÏÏÏÏÏÏÏ 64,854,397.07 December 2002 ÏÏÏÏÏÏ 11,867,632.59November 2001 ÏÏÏÏÏÏ 35,611,523.53September 2000ÏÏÏÏÏÏ 62,939,391.93 January 2003 ÏÏÏÏÏÏÏÏ 10,105,236.43December 2001 ÏÏÏÏÏÏ 33,728,923.23October 2000 ÏÏÏÏÏÏÏÏ 60,975,878.81
February 2003 ÏÏÏÏÏÏÏ 8,351,756.86January 2002 ÏÏÏÏÏÏÏÏ 31,855,858.54November 2000 ÏÏÏÏÏÏ 58,964,729.69March 2003 ÏÏÏÏÏÏÏÏÏ 6,607,147.95February 2002 ÏÏÏÏÏÏÏ 29,992,280.36December 2000 ÏÏÏÏÏÏ 56,963,778.13April 2003ÏÏÏÏÏÏÏÏÏÏÏ 4,871,364.02March 2002 ÏÏÏÏÏÏÏÏÏ 28,138,139.84January 2001 ÏÏÏÏÏÏÏÏ 54,972,971.61
April 2002ÏÏÏÏÏÏÏÏÏÏÏ 26,293,388.38 May 2003 ÏÏÏÏÏÏÏÏÏÏÏ 3,144,359.62February 2001 ÏÏÏÏÏÏÏ 52,992,257.90
May 2002 ÏÏÏÏÏÏÏÏÏÏÏ 24,457,977.63March 2001 ÏÏÏÏÏÏÏÏÏ 51,021,585.04 June 2003 ÏÏÏÏÏÏÏÏÏÏÏ 1,426,089.54June 2002 ÏÏÏÏÏÏÏÏÏÏÏ 22,631,859.48April 2001ÏÏÏÏÏÏÏÏÏÏÏ 49,060,901.31 July 2003 and
May 2001 ÏÏÏÏÏÏÏÏÏÏÏ 47,110,155.28 July 2002 ÏÏÏÏÏÏÏÏÏÏÏ 20,814,986.08 thereafter ÏÏÏÏÏÏÏÏÏ 0.00
PE Class Planned Balances
Distribution Planned Distribution Planned Distribution PlannedDate Balance Date Balance Date Balance
Initial Balance October 2003 ÏÏÏÏÏÏÏÏ $10,439,456.13 March 2004 ÏÏÏÏÏÏÏÏÏ $ 2,147,356.33through
November 2003 ÏÏÏÏÏÏ 8,764,187.46June 2003 ÏÏÏÏÏÏÏÏÏÏÏ $15,800,000.00April 2004ÏÏÏÏÏÏÏÏÏÏÏ 513,993.04December 2003 ÏÏÏÏÏÏ 7,097,386.65July 2003 ÏÏÏÏÏÏÏÏÏÏÏ 15,516,508.79
January 2004 ÏÏÏÏÏÏÏÏ 5,439,010.08August 2003 ÏÏÏÏÏÏÏÏÏ 13,815,572.61 May 2004 andSeptember 2003ÏÏÏÏÏÏ 12,123,236.49 February 2004 ÏÏÏÏÏÏÏ 3,789,014.36 thereafter ÏÏÏÏÏÏÏÏÏ 0.00
PG Class Planned Balances
Distribution Planned Distribution Planned Distribution PlannedDate Balance Date Balance Date Balance
Initial Balance February 2005 ÏÏÏÏÏÏÏ $25,727,279.63 December 2005 ÏÏÏÏÏÏ $10,624,406.64through
March 2005 ÏÏÏÏÏÏÏÏÏ 24,182,386.53 January 2006 ÏÏÏÏÏÏÏÏ 9,155,694.03April 2004ÏÏÏÏÏÏÏÏÏÏÏ $41,100,000.00April 2005ÏÏÏÏÏÏÏÏÏÏÏ 22,645,289.74 February 2006 ÏÏÏÏÏÏÏ 7,694,385.30May 2004 ÏÏÏÏÏÏÏÏÏÏÏ 39,988,881.77
June 2004 ÏÏÏÏÏÏÏÏÏÏÏ 38,371,980.01 May 2005 ÏÏÏÏÏÏÏÏÏÏÏ 21,115,949.11 March 2006 ÏÏÏÏÏÏÏÏÏ 6,240,442.30July 2004 ÏÏÏÏÏÏÏÏÏÏÏ 36,763,245.48 June 2005 ÏÏÏÏÏÏÏÏÏÏÏ 19,594,324.68 April 2006ÏÏÏÏÏÏÏÏÏÏÏ 4,793,827.09August 2004 ÏÏÏÏÏÏÏÏÏ 35,162,636.11
July 2005 ÏÏÏÏÏÏÏÏÏÏÏ 18,080,376.70 May 2006 ÏÏÏÏÏÏÏÏÏÏÏ 3,354,501.92September 2004ÏÏÏÏÏÏ 33,570,110.05August 2005 ÏÏÏÏÏÏÏÏÏ 16,574,065.63 June 2006 ÏÏÏÏÏÏÏÏÏÏÏ 1,922,429.23October 2004 ÏÏÏÏÏÏÏÏ 31,985,625.67September 2005ÏÏÏÏÏÏ 15,075,352.13November 2004 ÏÏÏÏÏÏ 30,409,141.54 July 2006 ÏÏÏÏÏÏÏÏÏÏÏ 497,571.66October 2005 ÏÏÏÏÏÏÏÏ 13,584,197.05December 2004 ÏÏÏÏÏÏ 28,840,616.45 August 2006 and
January 2005 ÏÏÏÏÏÏÏÏ 27,280,009.41 November 2005 ÏÏÏÏÏÏ 12,100,561.47 thereafter ÏÏÏÏÏÏÏÏÏ 0.00
PH Class Planned Balances
Distribution Planned Distribution Planned Distribution PlannedDate Balance Date Balance Date Balance
Initial Balance November 2006 ÏÏÏÏÏÏ $22,669,551.97 April 2007ÏÏÏÏÏÏÏÏÏÏÏ $15,792,463.09through
December 2006 ÏÏÏÏÏÏ 21,280,216.22 May 2007 ÏÏÏÏÏÏÏÏÏÏÏ 14,437,743.46July 2006 ÏÏÏÏÏÏÏÏÏÏÏ $27,800,000.00January 2007 ÏÏÏÏÏÏÏÏ 19,897,875.40 June 2007 ÏÏÏÏÏÏÏÏÏÏÏ 13,089,840.42August 2006 ÏÏÏÏÏÏÏÏÏ 26,879,892.03February 2007 ÏÏÏÏÏÏÏ 18,522,493.48 July 2007 ÏÏÏÏÏÏÏÏÏÏÏ 11,748,718.83September 2006ÏÏÏÏÏÏ 25,469,353.37
October 2006 ÏÏÏÏÏÏÏÏ 24,065,918.88 March 2007 ÏÏÏÏÏÏÏÏÏ 17,154,034.60 August 2007 ÏÏÏÏÏÏÏÏÏ 10,414,343.76
B-3

PH Class (Continued)
Distribution Planned Distribution Planned Distribution PlannedDate Balance Date Balance Date Balance
September 2007ÏÏÏÏÏÏ $ 9,086,680.45 January 2008 ÏÏÏÏÏÏÏÏ $ 3,964,188.20 April 2008ÏÏÏÏÏÏÏÏÏÏÏ $ 313,119.57
May 2008 andOctober 2007 ÏÏÏÏÏÏÏÏ 7,778,025.14February 2008 ÏÏÏÏÏÏÏ 2,729,418.48 thereafter ÏÏÏÏÏÏÏÏÏ 0.00November 2007 ÏÏÏÏÏÏ 6,488,233.21
December 2007 ÏÏÏÏÏÏ 5,217,040.93 March 2008 ÏÏÏÏÏÏÏÏÏ 1,512,478.78
PK Class Planned Balances
Distribution Planned Distribution Planned Distribution PlannedDate Balance Date Balance Date Balance
Initial Balance December 2009 ÏÏÏÏÏÏ $26,462,468.07 September 2011ÏÏÏÏÏÏ $10,416,291.74through January 2010 ÏÏÏÏÏÏÏÏ 25,580,346.64 October 2011 ÏÏÏÏÏÏÏÏ 9,769,747.04
April 2008ÏÏÏÏÏÏÏÏÏÏÏ $46,800,000.00February 2010 ÏÏÏÏÏÏÏ 24,711,107.35 November 2011 ÏÏÏÏÏÏ 9,132,759.16
May 2008 ÏÏÏÏÏÏÏÏÏÏÏ 45,931,094.77March 2010 ÏÏÏÏÏÏÏÏÏ 23,854,568.85 December 2011 ÏÏÏÏÏÏ 8,505,192.72June 2008 ÏÏÏÏÏÏÏÏÏÏÏ 44,766,161.68April 2010ÏÏÏÏÏÏÏÏÏÏÏ 23,010,552.31 January 2012 ÏÏÏÏÏÏÏÏ 7,886,914.22July 2008 ÏÏÏÏÏÏÏÏÏÏÏ 43,618,080.94May 2010 ÏÏÏÏÏÏÏÏÏÏÏ 22,178,881.35 February 2012 ÏÏÏÏÏÏÏ 7,277,792.02August 2008 ÏÏÏÏÏÏÏÏÏ 42,486,616.49June 2010 ÏÏÏÏÏÏÏÏÏÏÏ 21,359,382.04 March 2012 ÏÏÏÏÏÏÏÏÏ 6,677,696.29September 2008ÏÏÏÏÏÏ 41,371,535.51July 2010 ÏÏÏÏÏÏÏÏÏÏÏ 20,551,882.85 April 2012ÏÏÏÏÏÏÏÏÏÏÏ 6,086,499.01October 2008 ÏÏÏÏÏÏÏÏ 40,272,608.39August 2010 ÏÏÏÏÏÏÏÏÏ 19,756,214.61 May 2012 ÏÏÏÏÏÏÏÏÏÏÏ 5,504,073.93November 2008 ÏÏÏÏÏÏ 39,189,608.68September 2010ÏÏÏÏÏÏ 18,972,210.50 June 2012 ÏÏÏÏÏÏÏÏÏÏÏ 4,930,296.55December 2008 ÏÏÏÏÏÏ 38,122,313.05October 2010 ÏÏÏÏÏÏÏÏ 18,199,705.99 July 2012 ÏÏÏÏÏÏÏÏÏÏÏ 4,365,044.10January 2009 ÏÏÏÏÏÏÏÏ 37,070,501.26November 2010 ÏÏÏÏÏÏ 17,438,538.83 August 2012 ÏÏÏÏÏÏÏÏÏ 3,808,195.51February 2009 ÏÏÏÏÏÏÏ 36,033,956.08December 2010 ÏÏÏÏÏÏ 16,688,549.02March 2009 ÏÏÏÏÏÏÏÏÏ 35,012,463.28 September 2012ÏÏÏÏÏÏ 3,259,631.39January 2011 ÏÏÏÏÏÏÏÏ 15,949,578.77April 2009ÏÏÏÏÏÏÏÏÏÏÏ 34,005,811.60 October 2012 ÏÏÏÏÏÏÏÏ 2,719,234.00February 2011 ÏÏÏÏÏÏÏ 15,221,472.46May 2009 ÏÏÏÏÏÏÏÏÏÏÏ 33,013,792.67 November 2012 ÏÏÏÏÏÏ 2,186,887.24March 2011 ÏÏÏÏÏÏÏÏÏ 14,504,076.63June 2009 ÏÏÏÏÏÏÏÏÏÏÏ 32,036,201.00 December 2012 ÏÏÏÏÏÏ 1,662,476.62April 2011ÏÏÏÏÏÏÏÏÏÏÏ 13,797,239.94July 2009 ÏÏÏÏÏÏÏÏÏÏÏ 31,072,833.93 January 2013 ÏÏÏÏÏÏÏÏ 1,145,889.24May 2011 ÏÏÏÏÏÏÏÏÏÏÏ 13,100,813.15August 2009 ÏÏÏÏÏÏÏÏÏ 30,123,491.60 February 2013 ÏÏÏÏÏÏÏ 637,013.77June 2011 ÏÏÏÏÏÏÏÏÏÏÏ 12,414,649.08September 2009ÏÏÏÏÏÏ 29,187,976.90 March 2013 ÏÏÏÏÏÏÏÏÏ 135,740.42July 2011 ÏÏÏÏÏÏÏÏÏÏÏ 11,738,602.58October 2009 ÏÏÏÏÏÏÏÏ 28,266,095.44 April 2013 and
November 2009 ÏÏÏÏÏÏ 27,357,655.52 August 2011 ÏÏÏÏÏÏÏÏÏ 11,072,530.52 thereafter ÏÏÏÏÏÏÏÏÏ 0.00
PL Class Planned Balances
Distribution Planned Distribution Planned Distribution PlannedDate Balance Date Balance Date Balance
Initial Balance July 2014 ÏÏÏÏÏÏÏÏÏÏÏ $22,565,343.71 January 2016 ÏÏÏÏÏÏÏÏ $16,424,049.32through August 2014 ÏÏÏÏÏÏÏÏÏ 22,177,908.74 February 2016 ÏÏÏÏÏÏÏ 16,130,267.53
March 2013 ÏÏÏÏÏÏÏÏÏ $29,500,000.00September 2014ÏÏÏÏÏÏ 21,796,341.27 March 2016 ÏÏÏÏÏÏÏÏÏ 15,841,005.90
April 2013ÏÏÏÏÏÏÏÏÏÏÏ 29,141,960.93October 2014 ÏÏÏÏÏÏÏÏ 21,420,557.18 April 2016ÏÏÏÏÏÏÏÏÏÏÏ 15,556,199.13
May 2013 ÏÏÏÏÏÏÏÏÏÏÏ 28,655,568.54November 2014 ÏÏÏÏÏÏ 21,050,473.51 May 2016 ÏÏÏÏÏÏÏÏÏÏÏ 15,275,782.81
June 2013 ÏÏÏÏÏÏÏÏÏÏÏ 28,176,457.98December 2014 ÏÏÏÏÏÏ 20,686,008.47 June 2016 ÏÏÏÏÏÏÏÏÏÏÏ 14,999,693.46
July 2013 ÏÏÏÏÏÏÏÏÏÏÏ 27,704,525.43January 2015 ÏÏÏÏÏÏÏÏ 20,327,081.39 July 2016 ÏÏÏÏÏÏÏÏÏÏÏ 14,727,868.47
August 2013 ÏÏÏÏÏÏÏÏÏ 27,239,668.52February 2015 ÏÏÏÏÏÏÏ 19,973,612.75 August 2016 ÏÏÏÏÏÏÏÏÏ 14,460,246.12
September 2013ÏÏÏÏÏÏ 26,781,786.31 March 2015 ÏÏÏÏÏÏÏÏÏ 19,625,524.12 September 2016ÏÏÏÏÏÏ 14,196,765.54October 2013 ÏÏÏÏÏÏÏÏ 26,330,779.26 April 2015ÏÏÏÏÏÏÏÏÏÏÏ 19,282,738.18 October 2016 ÏÏÏÏÏÏÏÏ 13,937,366.72November 2013 ÏÏÏÏÏÏ 25,886,549.20 May 2015 ÏÏÏÏÏÏÏÏÏÏÏ 18,945,178.68 November 2016 ÏÏÏÏÏÏ 13,681,990.49December 2013 ÏÏÏÏÏÏ 25,448,999.35 June 2015 ÏÏÏÏÏÏÏÏÏÏÏ 18,612,770.43 December 2016 ÏÏÏÏÏÏ 13,430,578.52January 2014 ÏÏÏÏÏÏÏÏ 25,018,034.26 July 2015 ÏÏÏÏÏÏÏÏÏÏÏ 18,285,439.30 January 2017 ÏÏÏÏÏÏÏÏ 13,183,073.29February 2014 ÏÏÏÏÏÏÏ 24,593,559.81 August 2015 ÏÏÏÏÏÏÏÏÏ 17,963,112.20 February 2017 ÏÏÏÏÏÏÏ 12,939,418.08March 2014 ÏÏÏÏÏÏÏÏÏ 24,175,483.19 September 2015ÏÏÏÏÏÏ 17,645,717.04 March 2017 ÏÏÏÏÏÏÏÏÏ 12,699,556.97April 2014ÏÏÏÏÏÏÏÏÏÏÏ 23,763,712.88 October 2015 ÏÏÏÏÏÏÏÏ 17,333,182.76 April 2017ÏÏÏÏÏÏÏÏÏÏÏ 12,463,434.84
May 2014 ÏÏÏÏÏÏÏÏÏÏÏ 23,358,158.65 November 2015 ÏÏÏÏÏÏ 17,025,439.28 May 2017 ÏÏÏÏÏÏÏÏÏÏÏ 12,230,997.32
June 2014 ÏÏÏÏÏÏÏÏÏÏÏ 22,958,731.51 December 2015 ÏÏÏÏÏÏ 16,722,417.51 June 2017 ÏÏÏÏÏÏÏÏÏÏÏ 12,002,190.82
B-4
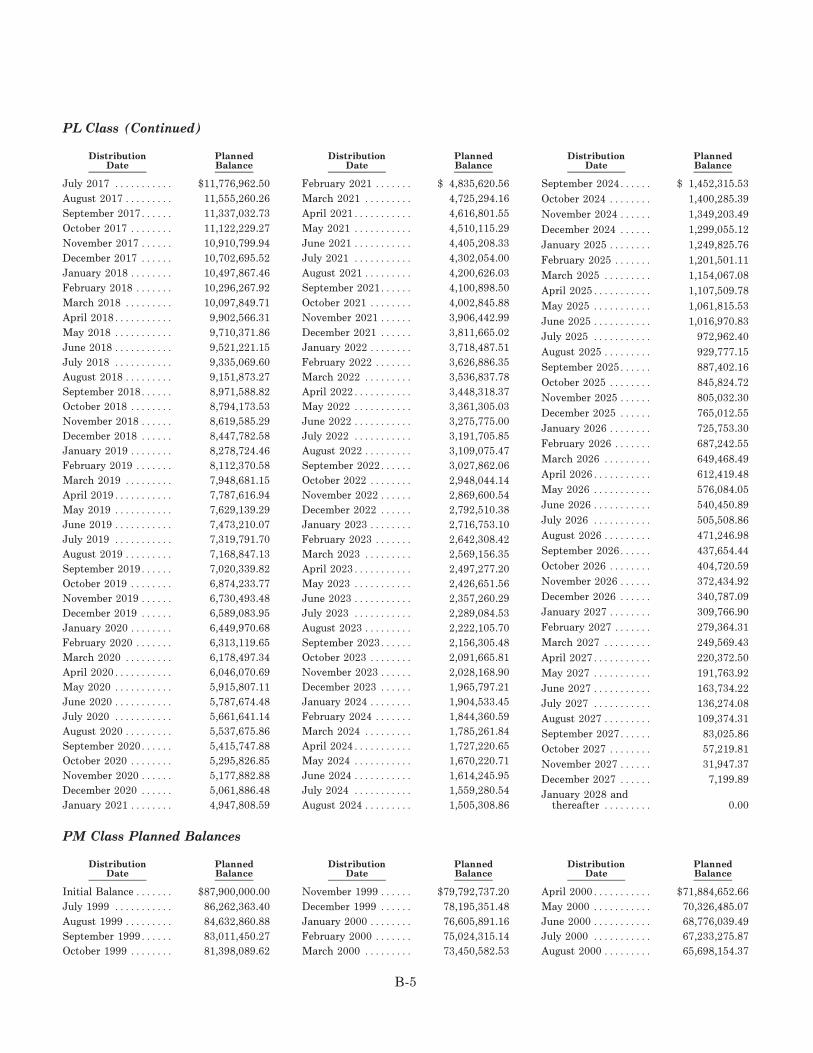
PL Class (Continued)
Distribution Planned Distribution Planned Distribution PlannedDate Balance Date Balance Date Balance
July 2017 ÏÏÏÏÏÏÏÏÏÏÏ $11,776,962.50 February 2021 ÏÏÏÏÏÏÏ $ 4,835,620.56 September 2024ÏÏÏÏÏÏ $ 1,452,315.53
August 2017 ÏÏÏÏÏÏÏÏÏ 11,555,260.26 March 2021 ÏÏÏÏÏÏÏÏÏ 4,725,294.16 October 2024 ÏÏÏÏÏÏÏÏ 1,400,285.39
September 2017ÏÏÏÏÏÏ 11,337,032.73 April 2021ÏÏÏÏÏÏÏÏÏÏÏ 4,616,801.55 November 2024 ÏÏÏÏÏÏ 1,349,203.49
October 2017 ÏÏÏÏÏÏÏÏ 11,122,229.27 May 2021 ÏÏÏÏÏÏÏÏÏÏÏ 4,510,115.29 December 2024 ÏÏÏÏÏÏ 1,299,055.12
November 2017 ÏÏÏÏÏÏ 10,910,799.94 June 2021 ÏÏÏÏÏÏÏÏÏÏÏ 4,405,208.33 January 2025 ÏÏÏÏÏÏÏÏ 1,249,825.76December 2017 ÏÏÏÏÏÏ 10,702,695.52 July 2021 ÏÏÏÏÏÏÏÏÏÏÏ 4,302,054.00 February 2025 ÏÏÏÏÏÏÏ 1,201,501.11January 2018 ÏÏÏÏÏÏÏÏ 10,497,867.46 August 2021 ÏÏÏÏÏÏÏÏÏ 4,200,626.03 March 2025 ÏÏÏÏÏÏÏÏÏ 1,154,067.08February 2018 ÏÏÏÏÏÏÏ 10,296,267.92 September 2021ÏÏÏÏÏÏ 4,100,898.50 April 2025ÏÏÏÏÏÏÏÏÏÏÏ 1,107,509.78March 2018 ÏÏÏÏÏÏÏÏÏ 10,097,849.71 October 2021 ÏÏÏÏÏÏÏÏ 4,002,845.88 May 2025 ÏÏÏÏÏÏÏÏÏÏÏ 1,061,815.53April 2018ÏÏÏÏÏÏÏÏÏÏÏ 9,902,566.31 November 2021 ÏÏÏÏÏÏ 3,906,442.99 June 2025 ÏÏÏÏÏÏÏÏÏÏÏ 1,016,970.83May 2018 ÏÏÏÏÏÏÏÏÏÏÏ 9,710,371.86 December 2021 ÏÏÏÏÏÏ 3,811,665.02 July 2025 ÏÏÏÏÏÏÏÏÏÏÏ 972,962.40June 2018 ÏÏÏÏÏÏÏÏÏÏÏ 9,521,221.15 January 2022 ÏÏÏÏÏÏÏÏ 3,718,487.51 August 2025 ÏÏÏÏÏÏÏÏÏ 929,777.15July 2018 ÏÏÏÏÏÏÏÏÏÏÏ 9,335,069.60 February 2022 ÏÏÏÏÏÏÏ 3,626,886.35 September 2025ÏÏÏÏÏÏ 887,402.16August 2018 ÏÏÏÏÏÏÏÏÏ 9,151,873.27 March 2022 ÏÏÏÏÏÏÏÏÏ 3,536,837.78
October 2025 ÏÏÏÏÏÏÏÏ 845,824.72September 2018ÏÏÏÏÏÏ 8,971,588.82 April 2022ÏÏÏÏÏÏÏÏÏÏÏ 3,448,318.37
November 2025 ÏÏÏÏÏÏ 805,032.30October 2018 ÏÏÏÏÏÏÏÏ 8,794,173.53 May 2022 ÏÏÏÏÏÏÏÏÏÏÏ 3,361,305.03
December 2025 ÏÏÏÏÏÏ 765,012.55November 2018 ÏÏÏÏÏÏ 8,619,585.29 June 2022 ÏÏÏÏÏÏÏÏÏÏÏ 3,275,775.00
January 2026 ÏÏÏÏÏÏÏÏ 725,753.30December 2018 ÏÏÏÏÏÏ 8,447,782.58 July 2022 ÏÏÏÏÏÏÏÏÏÏÏ 3,191,705.85
February 2026 ÏÏÏÏÏÏÏ 687,242.55January 2019 ÏÏÏÏÏÏÏÏ 8,278,724.46 August 2022 ÏÏÏÏÏÏÏÏÏ 3,109,075.47
March 2026 ÏÏÏÏÏÏÏÏÏ 649,468.49February 2019 ÏÏÏÏÏÏÏ 8,112,370.58 September 2022ÏÏÏÏÏÏ 3,027,862.06
April 2026ÏÏÏÏÏÏÏÏÏÏÏ 612,419.48March 2019 ÏÏÏÏÏÏÏÏÏ 7,948,681.15 October 2022 ÏÏÏÏÏÏÏÏ 2,948,044.14
May 2026 ÏÏÏÏÏÏÏÏÏÏÏ 576,084.05April 2019ÏÏÏÏÏÏÏÏÏÏÏ 7,787,616.94 November 2022 ÏÏÏÏÏÏ 2,869,600.54
June 2026 ÏÏÏÏÏÏÏÏÏÏÏ 540,450.89May 2019 ÏÏÏÏÏÏÏÏÏÏÏ 7,629,139.29 December 2022 ÏÏÏÏÏÏ 2,792,510.38July 2026 ÏÏÏÏÏÏÏÏÏÏÏ 505,508.86June 2019 ÏÏÏÏÏÏÏÏÏÏÏ 7,473,210.07 January 2023 ÏÏÏÏÏÏÏÏ 2,716,753.10August 2026 ÏÏÏÏÏÏÏÏÏ 471,246.98July 2019 ÏÏÏÏÏÏÏÏÏÏÏ 7,319,791.70 February 2023 ÏÏÏÏÏÏÏ 2,642,308.42September 2026ÏÏÏÏÏÏ 437,654.44August 2019 ÏÏÏÏÏÏÏÏÏ 7,168,847.13 March 2023 ÏÏÏÏÏÏÏÏÏ 2,569,156.35October 2026 ÏÏÏÏÏÏÏÏ 404,720.59September 2019ÏÏÏÏÏÏ 7,020,339.82 April 2023ÏÏÏÏÏÏÏÏÏÏÏ 2,497,277.20November 2026 ÏÏÏÏÏÏ 372,434.92October 2019 ÏÏÏÏÏÏÏÏ 6,874,233.77 May 2023 ÏÏÏÏÏÏÏÏÏÏÏ 2,426,651.56December 2026 ÏÏÏÏÏÏ 340,787.09November 2019 ÏÏÏÏÏÏ 6,730,493.48 June 2023 ÏÏÏÏÏÏÏÏÏÏÏ 2,357,260.29January 2027 ÏÏÏÏÏÏÏÏ 309,766.90December 2019 ÏÏÏÏÏÏ 6,589,083.95 July 2023 ÏÏÏÏÏÏÏÏÏÏÏ 2,289,084.53
February 2027 ÏÏÏÏÏÏÏ 279,364.31January 2020 ÏÏÏÏÏÏÏÏ 6,449,970.68 August 2023 ÏÏÏÏÏÏÏÏÏ 2,222,105.70
March 2027 ÏÏÏÏÏÏÏÏÏ 249,569.43February 2020 ÏÏÏÏÏÏÏ 6,313,119.65 September 2023ÏÏÏÏÏÏ 2,156,305.48
March 2020 ÏÏÏÏÏÏÏÏÏ 6,178,497.34 October 2023 ÏÏÏÏÏÏÏÏ 2,091,665.81 April 2027ÏÏÏÏÏÏÏÏÏÏÏ 220,372.50
April 2020ÏÏÏÏÏÏÏÏÏÏÏ 6,046,070.69 November 2023 ÏÏÏÏÏÏ 2,028,168.90 May 2027 ÏÏÏÏÏÏÏÏÏÏÏ 191,763.92
May 2020 ÏÏÏÏÏÏÏÏÏÏÏ 5,915,807.11 December 2023 ÏÏÏÏÏÏ 1,965,797.21 June 2027 ÏÏÏÏÏÏÏÏÏÏÏ 163,734.22June 2020 ÏÏÏÏÏÏÏÏÏÏÏ 5,787,674.48 January 2024 ÏÏÏÏÏÏÏÏ 1,904,533.45 July 2027 ÏÏÏÏÏÏÏÏÏÏÏ 136,274.08July 2020 ÏÏÏÏÏÏÏÏÏÏÏ 5,661,641.14 February 2024 ÏÏÏÏÏÏÏ 1,844,360.59 August 2027 ÏÏÏÏÏÏÏÏÏ 109,374.31August 2020 ÏÏÏÏÏÏÏÏÏ 5,537,675.86 March 2024 ÏÏÏÏÏÏÏÏÏ 1,785,261.84 September 2027ÏÏÏÏÏÏ 83,025.86September 2020ÏÏÏÏÏÏ 5,415,747.88 April 2024ÏÏÏÏÏÏÏÏÏÏÏ 1,727,220.65 October 2027 ÏÏÏÏÏÏÏÏ 57,219.81October 2020 ÏÏÏÏÏÏÏÏ 5,295,826.85 May 2024 ÏÏÏÏÏÏÏÏÏÏÏ 1,670,220.71 November 2027 ÏÏÏÏÏÏ 31,947.37November 2020 ÏÏÏÏÏÏ 5,177,882.88 June 2024 ÏÏÏÏÏÏÏÏÏÏÏ 1,614,245.95 December 2027 ÏÏÏÏÏÏ 7,199.89December 2020 ÏÏÏÏÏÏ 5,061,886.48 July 2024 ÏÏÏÏÏÏÏÏÏÏÏ 1,559,280.54 January 2028 andJanuary 2021 ÏÏÏÏÏÏÏÏ 4,947,808.59 August 2024 ÏÏÏÏÏÏÏÏÏ 1,505,308.86 thereafter ÏÏÏÏÏÏÏÏÏ 0.00
PM Class Planned Balances
Distribution Planned Distribution Planned Distribution PlannedDate Balance Date Balance Date Balance
Initial Balance ÏÏÏÏÏÏÏ $87,900,000.00 November 1999 ÏÏÏÏÏÏ $79,792,737.20 April 2000ÏÏÏÏÏÏÏÏÏÏÏ $71,884,652.66
July 1999 ÏÏÏÏÏÏÏÏÏÏÏ 86,262,363.40 December 1999 ÏÏÏÏÏÏ 78,195,351.48 May 2000 ÏÏÏÏÏÏÏÏÏÏÏ 70,326,485.07
August 1999 ÏÏÏÏÏÏÏÏÏ 84,632,860.88 January 2000 ÏÏÏÏÏÏÏÏ 76,605,891.16 June 2000 ÏÏÏÏÏÏÏÏÏÏÏ 68,776,039.49
September 1999ÏÏÏÏÏÏ 83,011,450.27 February 2000 ÏÏÏÏÏÏÏ 75,024,315.14 July 2000 ÏÏÏÏÏÏÏÏÏÏÏ 67,233,275.87
October 1999 ÏÏÏÏÏÏÏÏ 81,398,089.62 March 2000 ÏÏÏÏÏÏÏÏÏ 73,450,582.53 August 2000 ÏÏÏÏÏÏÏÏÏ 65,698,154.37
B-5

PM Class (Continued)
Distribution Planned Distribution Planned Distribution PlannedDate Balance Date Balance Date Balance
September 2000ÏÏÏÏÏÏ $64,170,635.34 February 2002 ÏÏÏÏÏÏÏ $39,328,547.22 July 2003 ÏÏÏÏÏÏÏÏÏÏÏ $16,488,412.12
October 2000 ÏÏÏÏÏÏÏÏ 62,650,679.35 March 2002 ÏÏÏÏÏÏÏÏÏ 37,931,320.94 August 2003 ÏÏÏÏÏÏÏÏÏ 15,203,519.49November 2000 ÏÏÏÏÏÏ 61,138,247.16 April 2002ÏÏÏÏÏÏÏÏÏÏÏ 36,540,981.43 September 2003ÏÏÏÏÏÏ 13,924,929.95December 2000 ÏÏÏÏÏÏ 59,633,299.73 May 2002 ÏÏÏÏÏÏÏÏÏÏÏ 35,157,492.93 October 2003 ÏÏÏÏÏÏÏÏ 12,652,610.74January 2001 ÏÏÏÏÏÏÏÏ 58,135,798.23 June 2002 ÏÏÏÏÏÏÏÏÏÏÏ 33,780,819.85 November 2003 ÏÏÏÏÏÏ 11,386,529.25February 2001 ÏÏÏÏÏÏÏ 56,645,704.03 July 2002 ÏÏÏÏÏÏÏÏÏÏÏ 32,410,926.80
December 2003 ÏÏÏÏÏÏ 10,126,653.05March 2001 ÏÏÏÏÏÏÏÏÏ 55,162,978.69 August 2002 ÏÏÏÏÏÏÏÏÏ 31,047,778.55
January 2004 ÏÏÏÏÏÏÏÏ 8,872,949.87April 2001ÏÏÏÏÏÏÏÏÏÏÏ 53,687,583.97 September 2002ÏÏÏÏÏÏ 29,691,340.08
February 2004 ÏÏÏÏÏÏÏ 7,625,387.60May 2001 ÏÏÏÏÏÏÏÏÏÏÏ 52,219,481.82 October 2002 ÏÏÏÏÏÏÏÏ 28,341,576.52March 2004 ÏÏÏÏÏÏÏÏÏ 6,383,934.31June 2001 ÏÏÏÏÏÏÏÏÏÏÏ 50,758,634.40 November 2002 ÏÏÏÏÏÏ 26,998,453.20April 2004ÏÏÏÏÏÏÏÏÏÏÏ 5,148,558.23July 2001 ÏÏÏÏÏÏÏÏÏÏÏ 49,305,004.06 December 2002 ÏÏÏÏÏÏ 25,661,935.62May 2004 ÏÏÏÏÏÏÏÏÏÏÏ 3,919,227.74August 2001 ÏÏÏÏÏÏÏÏÏ 47,858,553.33 January 2003 ÏÏÏÏÏÏÏÏ 24,331,989.45
September 2001ÏÏÏÏÏÏ 46,419,244.95 February 2003 ÏÏÏÏÏÏÏ 23,008,580.55 June 2004 ÏÏÏÏÏÏÏÏÏÏÏ 2,695,911.39
October 2001 ÏÏÏÏÏÏÏÏ 44,987,041.84 March 2003 ÏÏÏÏÏÏÏÏÏ 21,691,674.94 July 2004 ÏÏÏÏÏÏÏÏÏÏÏ 1,478,577.90November 2001 ÏÏÏÏÏÏ 43,561,907.12 April 2003ÏÏÏÏÏÏÏÏÏÏÏ 20,381,238.83 August 2004 ÏÏÏÏÏÏÏÏÏ 267,196.14December 2001 ÏÏÏÏÏÏ 42,143,804.08 May 2003 ÏÏÏÏÏÏÏÏÏÏÏ 19,077,238.60 September 2004 andJanuary 2002 ÏÏÏÏÏÏÏÏ 40,732,696.22 June 2003 ÏÏÏÏÏÏÏÏÏÏÏ 17,779,640.79 thereafter ÏÏÏÏÏÏÏÏÏ 0.00
PN Class Planned Balances
Distribution Planned Distribution Planned Distribution PlannedDate Balance Date Balance Date Balance
Initial Balance February 2007 ÏÏÏÏÏÏÏ $ 68,545,249.42 September 2009ÏÏÏÏÏÏ $ 42,109,329.89through March 2007 ÏÏÏÏÏÏÏÏÏ 67,503,770.67 October 2009 ÏÏÏÏÏÏÏÏ 41,439,249.07
August 2004 ÏÏÏÏÏÏÏÏÏ $102,000,000.00April 2007ÏÏÏÏÏÏÏÏÏÏÏ 66,467,504.62 November 2009 ÏÏÏÏÏÏ 40,778,913.20
September 2004ÏÏÏÏÏÏ 101,061,735.14May 2007 ÏÏÏÏÏÏÏÏÏÏÏ 65,446,086.49 December 2009 ÏÏÏÏÏÏ 40,128,185.92
October 2004 ÏÏÏÏÏÏÏÏ 99,862,164.09June 2007 ÏÏÏÏÏÏÏÏÏÏÏ 64,439,310.02 January 2010 ÏÏÏÏÏÏÏÏ 39,486,932.76
November 2004 ÏÏÏÏÏÏ 98,668,452.34July 2007 ÏÏÏÏÏÏÏÏÏÏÏ 63,446,971.75 February 2010 ÏÏÏÏÏÏÏ 38,855,021.07
December 2004 ÏÏÏÏÏÏ 97,480,569.40August 2007 ÏÏÏÏÏÏÏÏÏ 62,468,871.00 March 2010 ÏÏÏÏÏÏÏÏÏ 38,232,320.04
January 2005 ÏÏÏÏÏÏÏÏ 96,298,484.93September 2007ÏÏÏÏÏÏ 61,504,809.86 April 2010ÏÏÏÏÏÏÏÏÏÏÏ 37,618,700.66
February 2005 ÏÏÏÏÏÏÏ 95,122,168.75October 2007 ÏÏÏÏÏÏÏÏ 60,554,593.11 May 2010 ÏÏÏÏÏÏÏÏÏÏÏ 37,014,035.68
March 2005 ÏÏÏÏÏÏÏÏÏ 93,951,590.84November 2007 ÏÏÏÏÏÏ 59,618,028.20 June 2010 ÏÏÏÏÏÏÏÏÏÏÏ 36,418,199.60April 2005ÏÏÏÏÏÏÏÏÏÏÏ 92,786,721.32December 2007 ÏÏÏÏÏÏ 58,694,925.23 July 2010 ÏÏÏÏÏÏÏÏÏÏÏ 35,831,068.65May 2005 ÏÏÏÏÏÏÏÏÏÏÏ 91,627,530.47January 2008 ÏÏÏÏÏÏÏÏ 57,785,096.89 August 2010 ÏÏÏÏÏÏÏÏÏ 35,252,520.76June 2005 ÏÏÏÏÏÏÏÏÏÏÏ 90,473,988.72February 2008 ÏÏÏÏÏÏÏ 56,888,358.44 September 2010ÏÏÏÏÏÏ 34,682,435.53July 2005 ÏÏÏÏÏÏÏÏÏÏÏ 89,326,066.66March 2008 ÏÏÏÏÏÏÏÏÏ 56,004,527.66 October 2010 ÏÏÏÏÏÏÏÏ 34,120,694.23August 2005 ÏÏÏÏÏÏÏÏÏ 88,183,735.03April 2008ÏÏÏÏÏÏÏÏÏÏÏ 55,133,424.83 November 2010 ÏÏÏÏÏÏ 33,567,179.75September 2005ÏÏÏÏÏÏ 87,046,964.71May 2008 ÏÏÏÏÏÏÏÏÏÏÏ 54,274,872.69 December 2010 ÏÏÏÏÏÏ 33,021,776.59October 2005 ÏÏÏÏÏÏÏÏ 85,915,726.73June 2008 ÏÏÏÏÏÏÏÏÏÏÏ 53,428,696.42 January 2011 ÏÏÏÏÏÏÏÏ 32,484,370.85November 2005 ÏÏÏÏÏÏ 84,789,992.28July 2008 ÏÏÏÏÏÏÏÏÏÏÏ 52,594,723.58 February 2011 ÏÏÏÏÏÏÏ 31,954,850.19December 2005 ÏÏÏÏÏÏ 83,669,732.69August 2008 ÏÏÏÏÏÏÏÏÏ 51,772,784.09 March 2011 ÏÏÏÏÏÏÏÏÏ 31,433,103.81January 2006 ÏÏÏÏÏÏÏÏ 82,554,919.44September 2008ÏÏÏÏÏÏ 50,962,710.22 April 2011ÏÏÏÏÏÏÏÏÏÏÏ 30,919,022.45February 2006 ÏÏÏÏÏÏÏ 81,445,524.15October 2008 ÏÏÏÏÏÏÏÏ 50,164,336.52 May 2011 ÏÏÏÏÏÏÏÏÏÏÏ 30,412,498.33March 2006 ÏÏÏÏÏÏÏÏÏ 80,341,518.59November 2008 ÏÏÏÏÏÏ 49,377,499.82 June 2011 ÏÏÏÏÏÏÏÏÏÏÏ 29,913,425.17April 2006ÏÏÏÏÏÏÏÏÏÏÏ 79,242,874.68December 2008 ÏÏÏÏÏÏ 48,602,039.18 July 2011 ÏÏÏÏÏÏÏÏÏÏÏ 29,421,698.16May 2006 ÏÏÏÏÏÏÏÏÏÏÏ 78,149,564.47January 2009 ÏÏÏÏÏÏÏÏ 47,837,795.86 August 2011 ÏÏÏÏÏÏÏÏÏ 28,937,213.91June 2006 ÏÏÏÏÏÏÏÏÏÏÏ 77,061,560.17February 2009 ÏÏÏÏÏÏÏ 47,084,613.31 September 2011ÏÏÏÏÏÏ 28,459,870.47July 2006 ÏÏÏÏÏÏÏÏÏÏÏ 75,978,834.12
March 2009 ÏÏÏÏÏÏÏÏÏ 46,342,337.13 October 2011 ÏÏÏÏÏÏÏÏ 27,989,567.29August 2006 ÏÏÏÏÏÏÏÏÏ 74,901,358.81
April 2009ÏÏÏÏÏÏÏÏÏÏÏ 45,610,815.01 November 2011 ÏÏÏÏÏÏ 27,526,205.21September 2006ÏÏÏÏÏÏ 73,829,106.87
May 2009 ÏÏÏÏÏÏÏÏÏÏÏ 44,889,896.76 December 2011 ÏÏÏÏÏÏ 27,069,686.43October 2006 ÏÏÏÏÏÏÏÏ 72,762,051.06
June 2009 ÏÏÏÏÏÏÏÏÏÏÏ 44,179,434.23 January 2012 ÏÏÏÏÏÏÏÏ 26,619,914.49November 2006 ÏÏÏÏÏÏ 71,700,164.30
July 2009 ÏÏÏÏÏÏÏÏÏÏÏ 43,479,281.32 February 2012 ÏÏÏÏÏÏÏ 26,176,794.28December 2006 ÏÏÏÏÏÏ 70,643,419.63
January 2007 ÏÏÏÏÏÏÏÏ 69,591,790.23 August 2009 ÏÏÏÏÏÏÏÏÏ 42,789,293.91 March 2012 ÏÏÏÏÏÏÏÏÏ 25,740,231.98
B-6

PN Class (Continued)
Distribution Planned Distribution Planned Distribution PlannedDate Balance Date Balance Date Balance
April 2012ÏÏÏÏÏÏÏÏÏÏÏ $ 25,310,135.08 September 2016ÏÏÏÏÏÏ $ 9,748,829.62 February 2021 ÏÏÏÏÏÏÏ $ 2,958,604.80
May 2012 ÏÏÏÏÏÏÏÏÏÏÏ 24,886,412.33 October 2016 ÏÏÏÏÏÏÏÏ 9,560,253.77 March 2021 ÏÏÏÏÏÏÏÏÏ 2,878,969.86
June 2012 ÏÏÏÏÏÏÏÏÏÏÏ 24,468,973.75 November 2016 ÏÏÏÏÏÏ 9,374,612.93 April 2021ÏÏÏÏÏÏÏÏÏÏÏ 2,800,677.68
July 2012 ÏÏÏÏÏÏÏÏÏÏÏ 24,057,730.59 December 2016 ÏÏÏÏÏÏ 9,191,864.74 May 2021 ÏÏÏÏÏÏÏÏÏÏÏ 2,723,708.23
August 2012 ÏÏÏÏÏÏÏÏÏ 23,652,595.34 January 2017 ÏÏÏÏÏÏÏÏ 9,011,967.44 June 2021 ÏÏÏÏÏÏÏÏÏÏÏ 2,648,041.79
September 2012ÏÏÏÏÏÏ 23,253,481.68 February 2017 ÏÏÏÏÏÏÏ 8,834,879.86 July 2021 ÏÏÏÏÏÏÏÏÏÏÏ 2,573,658.89
October 2012 ÏÏÏÏÏÏÏÏ 22,860,304.49 March 2017 ÏÏÏÏÏÏÏÏÏ 8,660,561.39 August 2021 ÏÏÏÏÏÏÏÏÏ 2,500,540.36
November 2012 ÏÏÏÏÏÏ 22,472,979.83 April 2017ÏÏÏÏÏÏÏÏÏÏÏ 8,488,971.99 September 2021ÏÏÏÏÏÏ 2,428,667.28
December 2012 ÏÏÏÏÏÏ 22,091,424.91 May 2017 ÏÏÏÏÏÏÏÏÏÏÏ 8,320,072.18 October 2021 ÏÏÏÏÏÏÏÏ 2,358,021.02
January 2013 ÏÏÏÏÏÏÏÏ 21,715,558.09 June 2017 ÏÏÏÏÏÏÏÏÏÏÏ 8,153,823.04 November 2021 ÏÏÏÏÏÏ 2,288,583.20
February 2013 ÏÏÏÏÏÏÏ 21,345,298.84 July 2017 ÏÏÏÏÏÏÏÏÏÏÏ 7,990,186.18 December 2021 ÏÏÏÏÏÏ 2,220,335.71
March 2013 ÏÏÏÏÏÏÏÏÏ 20,980,567.77 August 2017 ÏÏÏÏÏÏÏÏÏ 7,829,123.76 January 2022 ÏÏÏÏÏÏÏÏ 2,153,260.69
April 2013ÏÏÏÏÏÏÏÏÏÏÏ 20,621,286.56 September 2017ÏÏÏÏÏÏ 7,670,598.45 February 2022 ÏÏÏÏÏÏÏ 2,087,340.53
May 2013 ÏÏÏÏÏÏÏÏÏÏÏ 20,267,377.99 October 2017 ÏÏÏÏÏÏÏÏ 7,514,573.46 March 2022 ÏÏÏÏÏÏÏÏÏ 2,022,557.88
June 2013 ÏÏÏÏÏÏÏÏÏÏÏ 19,918,765.90 November 2017 ÏÏÏÏÏÏ 7,361,012.50 April 2022ÏÏÏÏÏÏÏÏÏÏÏ 1,958,895.63
July 2013 ÏÏÏÏÏÏÏÏÏÏÏ 19,575,375.18 December 2017 ÏÏÏÏÏÏ 7,209,879.80 May 2022 ÏÏÏÏÏÏÏÏÏÏÏ 1,896,336.91
August 2013 ÏÏÏÏÏÏÏÏÏ 19,237,131.76 January 2018 ÏÏÏÏÏÏÏÏ 7,061,140.08 June 2022 ÏÏÏÏÏÏÏÏÏÏÏ 1,834,865.10
September 2013ÏÏÏÏÏÏ 18,903,962.59 February 2018 ÏÏÏÏÏÏÏ 6,914,758.55 July 2022 ÏÏÏÏÏÏÏÏÏÏÏ 1,774,463.81
October 2013 ÏÏÏÏÏÏÏÏ 18,575,795.65 March 2018 ÏÏÏÏÏÏÏÏÏ 6,770,700.92 August 2022 ÏÏÏÏÏÏÏÏÏ 1,715,116.89
November 2013 ÏÏÏÏÏÏ 18,252,559.89 April 2018ÏÏÏÏÏÏÏÏÏÏÏ 6,628,933.37 September 2022ÏÏÏÏÏÏ 1,656,808.41
December 2013 ÏÏÏÏÏÏ 17,934,185.25 May 2018 ÏÏÏÏÏÏÏÏÏÏÏ 6,489,422.56 October 2022 ÏÏÏÏÏÏÏÏ 1,599,522.67
January 2014 ÏÏÏÏÏÏÏÏ 17,620,602.65 June 2018 ÏÏÏÏÏÏÏÏÏÏÏ 6,352,135.62 November 2022 ÏÏÏÏÏÏ 1,543,244.20
February 2014 ÏÏÏÏÏÏÏ 17,311,743.96 July 2018 ÏÏÏÏÏÏÏÏÏÏÏ 6,217,040.12 December 2022 ÏÏÏÏÏÏ 1,487,957.74
March 2014 ÏÏÏÏÏÏÏÏÏ 17,007,541.99 August 2018 ÏÏÏÏÏÏÏÏÏ 6,084,104.11 January 2023 ÏÏÏÏÏÏÏÏ 1,433,648.25
April 2014ÏÏÏÏÏÏÏÏÏÏÏ 16,707,930.48 September 2018ÏÏÏÏÏÏ 5,953,296.07 February 2023 ÏÏÏÏÏÏÏ 1,380,300.92
May 2014 ÏÏÏÏÏÏÏÏÏÏÏ 16,412,844.10 October 2018 ÏÏÏÏÏÏÏÏ 5,824,584.92 March 2023 ÏÏÏÏÏÏÏÏÏ 1,327,901.13
June 2014 ÏÏÏÏÏÏÏÏÏÏÏ 16,122,218.40 November 2018 ÏÏÏÏÏÏ 5,697,940.03 April 2023ÏÏÏÏÏÏÏÏÏÏÏ 1,276,434.48
July 2014 ÏÏÏÏÏÏÏÏÏÏÏ 15,835,989.84 December 2018 ÏÏÏÏÏÏ 5,573,331.20 May 2023 ÏÏÏÏÏÏÏÏÏÏÏ 1,225,886.77
August 2014 ÏÏÏÏÏÏÏÏÏ 15,554,095.76 January 2019 ÏÏÏÏÏÏÏÏ 5,450,728.63 June 2023 ÏÏÏÏÏÏÏÏÏÏÏ 1,176,244.01
September 2014ÏÏÏÏÏÏ 15,276,474.37 February 2019 ÏÏÏÏÏÏÏ 5,330,102.97 July 2023 ÏÏÏÏÏÏÏÏÏÏÏ 1,127,492.40
October 2014 ÏÏÏÏÏÏÏÏ 15,003,064.72 March 2019 ÏÏÏÏÏÏÏÏÏ 5,211,425.26 August 2023 ÏÏÏÏÏÏÏÏÏ 1,079,618.35
November 2014 ÏÏÏÏÏÏ 14,733,806.73 April 2019ÏÏÏÏÏÏÏÏÏÏÏ 5,094,666.95 September 2023ÏÏÏÏÏÏ 1,032,608.45
December 2014 ÏÏÏÏÏÏ 14,468,641.13 May 2019 ÏÏÏÏÏÏÏÏÏÏÏ 4,979,799.90 October 2023 ÏÏÏÏÏÏÏÏ 986,449.49
January 2015 ÏÏÏÏÏÏÏÏ 14,207,509.48 June 2019 ÏÏÏÏÏÏÏÏÏÏÏ 4,866,796.35 November 2023 ÏÏÏÏÏÏ 941,128.46
February 2015 ÏÏÏÏÏÏÏ 13,950,354.15 July 2019 ÏÏÏÏÏÏÏÏÏÏÏ 4,755,628.95 December 2023 ÏÏÏÏÏÏ 896,632.51
March 2015 ÏÏÏÏÏÏÏÏÏ 13,697,118.32 August 2019 ÏÏÏÏÏÏÏÏÏ 4,646,270.71 January 2024 ÏÏÏÏÏÏÏÏ 852,949.00
April 2015ÏÏÏÏÏÏÏÏÏÏÏ 13,447,745.94 September 2019ÏÏÏÏÏÏ 4,538,695.05 February 2024 ÏÏÏÏÏÏÏ 810,065.46
May 2015 ÏÏÏÏÏÏÏÏÏÏÏ 13,202,181.75 October 2019 ÏÏÏÏÏÏÏÏ 4,432,875.73 March 2024 ÏÏÏÏÏÏÏÏÏ 767,969.60
June 2015 ÏÏÏÏÏÏÏÏÏÏÏ 12,960,371.26 November 2019 ÏÏÏÏÏÏ 4,328,786.91 April 2024ÏÏÏÏÏÏÏÏÏÏÏ 726,649.30
July 2015 ÏÏÏÏÏÏÏÏÏÏÏ 12,722,260.73 December 2019 ÏÏÏÏÏÏ 4,226,403.09 May 2024 ÏÏÏÏÏÏÏÏÏÏÏ 686,092.62
August 2015 ÏÏÏÏÏÏÏÏÏ 12,487,797.16 January 2020 ÏÏÏÏÏÏÏÏ 4,125,699.15 June 2024 ÏÏÏÏÏÏÏÏÏÏÏ 646,287.79
September 2015ÏÏÏÏÏÏ 12,256,928.30 February 2020 ÏÏÏÏÏÏÏ 4,026,650.30 July 2024 ÏÏÏÏÏÏÏÏÏÏÏ 607,223.21
October 2015 ÏÏÏÏÏÏÏÏ 12,029,602.62 March 2020 ÏÏÏÏÏÏÏÏÏ 3,929,232.12 August 2024 ÏÏÏÏÏÏÏÏÏ 568,887.45
November 2015 ÏÏÏÏÏÏ 11,805,769.30 April 2020ÏÏÏÏÏÏÏÏÏÏÏ 3,833,420.52 September 2024ÏÏÏÏÏÏ 531,269.24
December 2015 ÏÏÏÏÏÏ 11,585,378.24 May 2020 ÏÏÏÏÏÏÏÏÏÏÏ 3,739,191.76 October 2024 ÏÏÏÏÏÏÏÏ 494,357.48
January 2016 ÏÏÏÏÏÏÏÏ 11,368,380.02 June 2020 ÏÏÏÏÏÏÏÏÏÏÏ 3,646,522.42 November 2024 ÏÏÏÏÏÏ 458,141.22
February 2016 ÏÏÏÏÏÏÏ 11,154,725.92 July 2020 ÏÏÏÏÏÏÏÏÏÏÏ 3,555,389.43 December 2024 ÏÏÏÏÏÏ 422,609.66
March 2016 ÏÏÏÏÏÏÏÏÏ 10,944,367.89 August 2020 ÏÏÏÏÏÏÏÏÏ 3,465,770.04 January 2025 ÏÏÏÏÏÏÏÏ 387,752.18
April 2016ÏÏÏÏÏÏÏÏÏÏÏ 10,737,258.55 September 2020ÏÏÏÏÏÏ 3,377,641.81 February 2025 ÏÏÏÏÏÏÏ 353,558.29
May 2016 ÏÏÏÏÏÏÏÏÏÏÏ 10,533,351.18 October 2020 ÏÏÏÏÏÏÏÏ 3,290,982.62 March 2025 ÏÏÏÏÏÏÏÏÏ 320,017.67
June 2016 ÏÏÏÏÏÏÏÏÏÏÏ 10,332,599.72 November 2020 ÏÏÏÏÏÏ 3,205,770.67 April 2025ÏÏÏÏÏÏÏÏÏÏÏ 287,120.13
July 2016 ÏÏÏÏÏÏÏÏÏÏÏ 10,134,958.73 December 2020 ÏÏÏÏÏÏ 3,121,984.46 May 2025 ÏÏÏÏÏÏÏÏÏÏÏ 254,855.64
August 2016 ÏÏÏÏÏÏÏÏÏ 9,940,383.42 January 2021 ÏÏÏÏÏÏÏÏ 3,039,602.80 June 2025 ÏÏÏÏÏÏÏÏÏÏÏ 223,214.32
B-7

PN Class (Continued)
Distribution Planned Distribution Planned Distribution PlannedDate Balance Date Balance Date Balance
July 2025 ÏÏÏÏÏÏÏÏÏÏÏ $ 192,186.42 October 2025 ÏÏÏÏÏÏÏÏ $ 102,687.87 January 2026 ÏÏÏÏÏÏÏÏ $ 18,372.55
August 2025 ÏÏÏÏÏÏÏÏÏ 161,762.33 November 2025 ÏÏÏÏÏÏ 74,018.97February 2026 and
September 2025ÏÏÏÏÏÏ 131,932.59 December 2025 ÏÏÏÏÏÏ 45,916.84 thereafter ÏÏÏÏÏÏÏÏÏ 0.00
JA Class Planned Balances
Distribution Planned Distribution Planned Distribution PlannedDate Balance Date Balance Date Balance
Initial Balance ÏÏÏÏÏÏÏ $31,200,000.00 January 2002 ÏÏÏÏÏÏÏÏ $13,832,616.94 August 2004 ÏÏÏÏÏÏÏÏÏ $ 3,959,842.84
July 1999 ÏÏÏÏÏÏÏÏÏÏÏ 30,496,438.02 February 2002 ÏÏÏÏÏÏÏ 13,410,015.55 September 2004ÏÏÏÏÏÏ 3,740,963.54
August 1999 ÏÏÏÏÏÏÏÏÏ 29,803,384.40 March 2002 ÏÏÏÏÏÏÏÏÏ 12,995,074.05 October 2004 ÏÏÏÏÏÏÏÏ 3,527,600.82
September 1999ÏÏÏÏÏÏ 29,120,734.20 April 2002ÏÏÏÏÏÏÏÏÏÏÏ 12,587,713.30 November 2004 ÏÏÏÏÏÏ 3,319,695.30
October 1999 ÏÏÏÏÏÏÏÏ 28,448,383.41 May 2002 ÏÏÏÏÏÏÏÏÏÏÏ 12,187,854.89 December 2004 ÏÏÏÏÏÏ 3,117,188.13
November 1999 ÏÏÏÏÏÏ 27,786,228.95 June 2002 ÏÏÏÏÏÏÏÏÏÏÏ 11,795,421.12January 2005 ÏÏÏÏÏÏÏÏ 2,920,021.04
December 1999 ÏÏÏÏÏÏ 27,134,168.70 July 2002 ÏÏÏÏÏÏÏÏÏÏÏ 11,410,335.01February 2005 ÏÏÏÏÏÏÏ 2,728,136.27
January 2000 ÏÏÏÏÏÏÏÏ 26,492,101.42 August 2002 ÏÏÏÏÏÏÏÏÏ 11,032,520.29March 2005 ÏÏÏÏÏÏÏÏÏ 2,541,476.62
February 2000 ÏÏÏÏÏÏÏ 25,859,926.82 September 2002ÏÏÏÏÏÏ 10,661,901.36April 2005ÏÏÏÏÏÏÏÏÏÏÏ 2,359,985.42
March 2000 ÏÏÏÏÏÏÏÏÏ 25,237,545.50 October 2002 ÏÏÏÏÏÏÏÏ 10,298,403.34May 2005 ÏÏÏÏÏÏÏÏÏÏÏ 2,183,606.53
April 2000ÏÏÏÏÏÏÏÏÏÏÏ 24,624,858.95 November 2002 ÏÏÏÏÏÏ 9,941,952.02June 2005 ÏÏÏÏÏÏÏÏÏÏÏ 2,012,284.33
May 2000 ÏÏÏÏÏÏÏÏÏÏÏ 24,021,769.54 December 2002 ÏÏÏÏÏÏ 9,592,473.89July 2005 ÏÏÏÏÏÏÏÏÏÏÏ 1,845,963.72
June 2000 ÏÏÏÏÏÏÏÏÏÏÏ 23,428,180.56 January 2003 ÏÏÏÏÏÏÏÏ 9,249,896.10
August 2005 ÏÏÏÏÏÏÏÏÏ 1,684,590.11July 2000 ÏÏÏÏÏÏÏÏÏÏÏ 22,843,996.14 February 2003 ÏÏÏÏÏÏÏ 8,914,146.47
September 2005ÏÏÏÏÏÏ 1,528,109.43August 2000 ÏÏÏÏÏÏÏÏÏ 22,269,121.29 March 2003 ÏÏÏÏÏÏÏÏÏ 8,585,153.49
October 2005 ÏÏÏÏÏÏÏÏ 1,376,468.12September 2000ÏÏÏÏÏÏ 21,703,461.88 April 2003ÏÏÏÏÏÏÏÏÏÏÏ 8,262,846.30
November 2005 ÏÏÏÏÏÏ 1,229,613.11October 2000 ÏÏÏÏÏÏÏÏ 21,146,924.62 May 2003 ÏÏÏÏÏÏÏÏÏÏÏ 7,947,154.69
December 2005 ÏÏÏÏÏÏ 1,087,491.84November 2000 ÏÏÏÏÏÏ 20,599,417.07 June 2003 ÏÏÏÏÏÏÏÏÏÏÏ 7,638,009.11
January 2006 ÏÏÏÏÏÏÏÏ 950,052.23December 2000 ÏÏÏÏÏÏ 20,060,847.65 July 2003 ÏÏÏÏÏÏÏÏÏÏÏ 7,335,340.65
February 2006 ÏÏÏÏÏÏÏ 817,242.70January 2001 ÏÏÏÏÏÏÏÏ 19,531,125.58 August 2003 ÏÏÏÏÏÏÏÏÏ 7,039,081.01
February 2001 ÏÏÏÏÏÏÏ 19,010,160.91 September 2003ÏÏÏÏÏÏ 6,749,162.56 March 2006 ÏÏÏÏÏÏÏÏÏ 689,012.16
March 2001 ÏÏÏÏÏÏÏÏÏ 18,497,864.52 October 2003 ÏÏÏÏÏÏÏÏ 6,465,518.25 April 2006ÏÏÏÏÏÏÏÏÏÏÏ 565,309.98
April 2001ÏÏÏÏÏÏÏÏÏÏÏ 17,994,148.08 November 2003 ÏÏÏÏÏÏ 6,188,081.68 May 2006 ÏÏÏÏÏÏÏÏÏÏÏ 452,615.33
May 2001 ÏÏÏÏÏÏÏÏÏÏÏ 17,498,924.08 December 2003 ÏÏÏÏÏÏ 5,916,787.05 June 2006 ÏÏÏÏÏÏÏÏÏÏÏ 351,128.89
June 2001 ÏÏÏÏÏÏÏÏÏÏÏ 17,012,105.80 January 2004 ÏÏÏÏÏÏÏÏ 5,651,569.18 July 2006 ÏÏÏÏÏÏÏÏÏÏÏ 260,652.47
July 2001 ÏÏÏÏÏÏÏÏÏÏÏ 16,533,607.29 February 2004 ÏÏÏÏÏÏÏ 5,392,363.49August 2006 ÏÏÏÏÏÏÏÏÏ 180,990.81
August 2001 ÏÏÏÏÏÏÏÏÏ 16,063,343.41 March 2004 ÏÏÏÏÏÏÏÏÏ 5,139,105.98September 2006ÏÏÏÏÏÏ 111,951.53
September 2001ÏÏÏÏÏÏ 15,601,229.78 April 2004ÏÏÏÏÏÏÏÏÏÏÏ 4,891,733.26October 2006 ÏÏÏÏÏÏÏÏ 53,345.11
October 2001 ÏÏÏÏÏÏÏÏ 15,147,182.79 May 2004 ÏÏÏÏÏÏÏÏÏÏÏ 4,650,182.52November 2006 ÏÏÏÏÏÏ 4,984.83
November 2001 ÏÏÏÏÏÏ 14,701,119.59 June 2004 ÏÏÏÏÏÏÏÏÏÏÏ 4,414,391.54December 2006 and
December 2001 ÏÏÏÏÏÏ 14,262,958.09 July 2004 ÏÏÏÏÏÏÏÏÏÏÏ 4,184,298.67 thereafter ÏÏÏÏÏÏÏÏÏ 0.00
B-8

®THIS PAGE INTENTIONALLY LEFT BLANK©

No one is authorized to give information or to $1,362,843,208make representations in connection with theCertiÑcates other than the information and rep-resentations contained in this Prospectus Sup-plement and the additional DisclosureDocuments. You must not rely on any unautho-rized information or representation. This Pro-spectus Supplement and the additionalDisclosure Documents do not constitute an oÅeror solicitation with regard to the CertiÑcates if itis illegal to make such an oÅer or solicitation toyou under state law. By delivering this Prospec-tus Supplement and the additional DisclosureDocuments at any time, no one implies that theinformation contained herein or therein is cor-rect after the date hereof or thereof.
The Securities and Exchange Commission hasnot approved or disapproved the CertiÑcates ordetermined if this Prospectus Supplement istruthful and complete. Any representation to thecontrary is a criminal oÅense.
Guaranteed REMICPass-Through CertiÑcates
TABLE OF CONTENTS
Page Fannie Mae REMIC Trust 1999-32
Table of Contents ÏÏÏÏÏÏÏÏÏÏÏÏÏÏÏÏÏÏÏÏÏÏ S- 2
Available Information ÏÏÏÏÏÏÏÏÏÏÏÏÏÏÏÏÏÏÏ S- 3
Reference Sheet ÏÏÏÏÏÏÏÏÏÏÏÏÏÏÏÏÏÏÏÏÏÏÏ S- 4
Additional Risk Factors ÏÏÏÏÏÏÏÏÏÏÏÏÏÏÏÏÏ S- 9
Description of the CertiÑcates ÏÏÏÏÏÏÏÏÏÏÏ S-10
Certain Additional Federal Income TaxConsequences ÏÏÏÏÏÏÏÏÏÏÏÏÏÏÏÏÏÏÏÏÏÏÏ S-30
Plan of Distribution ÏÏÏÏÏÏÏÏÏÏÏÏÏÏÏÏÏÏÏÏÏ S-32
Legal Matters ÏÏÏÏÏÏÏÏÏÏÏÏÏÏÏÏÏÏÏÏÏÏÏÏÏÏ S-32 Salomon Smith BarneyExhibit A ÏÏÏÏÏÏÏÏÏÏÏÏÏÏÏÏÏÏÏÏÏÏÏÏÏÏÏÏÏÏ A- 1
Schedule 1 ÏÏÏÏÏÏÏÏÏÏÏÏÏÏÏÏÏÏÏÏÏÏÏÏÏÏÏÏ A- 2Prospectus Supplement
Principal Balance Schedules ÏÏÏÏÏÏÏÏÏÏÏÏ B- 1 May 13, 1999
Copyright © 2022 FDOKUMEN