town of jupiter staff report for angelo's pizza expansion town ...
Upload
independentCategory
view
0download
0
Astronomy & Astrophysics manuscript no. KOI183˙v5 c© ESO 2014September 30, 2014
KOI-183b: a half-Jupiter mass planet transitinga very old solar-like star?,??
D. Gandolfi1,2, H. Parviainen3, H. J. Deeg4,5, A. F. Lanza2, M. Fridlund6, P. G. Prada Moroni7,8, R. Alonso4,5,T. Augusteijn9, J. Cabrera6, T. Evans3, S. Geier9, A. P. Hatzes10, T. Holczer11, S. Hoyer4,5, T. Kangas12,9, T. Mazeh11,
I. Pagano2, L. Tal-Or11, and B. Tingley13
1 Landessternwarte Konigstuhl, Zentrum fur Astronomie der Universitat Heidelberg, Konigstuhl 12, D-69117 Heidelberg, Germanye-mail: [email protected]
2 INAF - Osservatorio Astrofisico di Catania, Via S. Sofia 78, 95123 Catania, Italy3 Department of Physics, University of Oxford, Oxford, OX1 3RH, United Kingdom4 Instituto de Astrofısica de Canarias, C/ Vıa Lactea s/n, 38205 La Laguna, Spain5 Departamento de Astrofısica, Universidad de La Laguna, 38206 La Laguna, Spain6 Institute of Planetary Research, German Aerospace Center, Rutherfordstrasse 2, 12489 Berlin, Germany7 Physics Department “E. Fermi” University of Pisa, Largo B. Pontecorvo 3, 56127 Pisa, Italy8 Istituto Nazionale di Fisica Nucleare, Largo B. Pontecorvo 3, 56127 Pisa, Italy9 Nordic Optical Telescope, Apartado 474, 38700 Santa Cruz de La Palma, Spain
10 Thuringer Landessternwarte, Sternwarte 5, D-07778 Tautenburg, Germany11 School of Physics and Astronomy, Raymond and Beverly Sackler Faculty of Exact Sciences, Tel Aviv University, Tel Aviv, Israel12 Tuorla Observatory, Department of Physics and Astronomy, University of Turku, Vaisalantie 20, FI-21500 Piikkio, Finland13 Stellar Astrophysics Centre, Department of Physics and Astronomy, Århus Uni., Ny Munkegade 120, DK-8000 Århus C, Denmark
Received / Accepted
ABSTRACT
We report the spectroscopic confirmation of the Kepler object of interest KOI-183b (also known as KOI-183.01), a half-Jupiter massplanet transiting an old solar-like star every 2.7 days. Our analysis is the first to combine the full Kepler photometry (quarters 1-17)with high-precision radial velocity measurements taken with the FIES spectrograph at the Nordic Optical Telescope. We simulta-neously modelled the photometric and spectroscopic data-sets using Bayesian approach coupled with Markov chain Monte Carlosampling. We found that the Kepler pre-search data conditioned light curve of KOI-183 exhibits quarter-to-quarter systematic varia-tions of the transit depth, with a peak-to-peak amplitude of ∼4.3 % and seasonal trends reoccurring every four quarters. We attributedthese systematics to an incorrect assessment of the quarterly variation of the crowding metric. The host star KOI-183 is a G4 dwarfwith M? = 0.85 ± 0.04 M, R? = 0.95 ± 0.04 R, Teff = 5560 ± 80 K, [M/H]=−0.10±0.05 dex, and with an age of 11 ± 2 Gyr. Theplanet KOI-183b has a mass of Mp = 0.595 ± 0.081 MJup and a radius of Rp = 1.192 ± 0.052 RJup, yielding a planetary bulk densityof ρp = 0.459 ± 0.083 g cm−3. The radius of KOI-183b is consistent with both theoretical models for irradiated coreless giant planetsand expectations based on empirical laws. The inclination of the stellar spin axis suggests that the system is aligned along the lineof sight. We detected a tentative secondary eclipse of the planet at a 2-σ confidence level (∆Fec = 14.2 ± 6.6 ppm) and found thatthe orbit might have a small non-zero eccentricity of 0.019+0.028
−0.014. With a Bond albedo of AB = 0.037 ± 0.019, KOI-183b is one of thegas-giant planets with the lowest albedo known so far.
Key words. planetary systems – stars: fundamental parameters – stars: individual: KOI-183 – planets and satellites: detection –planets and satellites: fundamental parameters – techniques: photometric – techniques: radial velocities – techniques: spectroscopic
1. Introduction
We can rightfully argue that space-based transit surveys such asCoRoT (Baglin et al. 2006) and Kepler (Borucki et al. 2010)have revolutionised the field of exoplanetary science. Their high-precision and nearly uninterrupted photometry has opened up
? Based on observations obtained with the Nordic Optical Telescope,operated on the island of La Palma jointly by Denmark, Finland,Iceland, Norway, and Sweden, in the Spanish Observatorio del Roquede los Muchachos of the Instituto de Astrofisica de Canarias, in timeallocated by OPTICON and the Spanish Time Allocation Committee(CAT).?? The research leading to these results has received funding from theEuropean Community’s Seventh Framework Programme (FP7/2007-2013) under grant agreement number RG226604 (OPTICON) and267251 (AstroFIt).
the doors to planet parameter spaces that are not easily accessi-ble from ground, most notably, the Earth-radius planet domain(e.g., Leger et al. 2009; Sanchis-Ojeda et al. 2013; Quintana etal. 2014).
When combined with high-resolution spectroscopy, space-based photometry provides us with the most precise planetaryand stellar parameters, which in turn are essential to investigateplanet internal structure, migration, and evolution (Rauer et al.2013). The exquisite photometric accuracy allows us to detectthe eclipse of hot Jupiters even in the visible (e.g., Coughlin& Lopez-Morales 2012; Parviainen et al. 2013). Measuring theeclipse of transiting exoplanets – also known as planet occul-tation, secondary eclipse, and secondary transit – is a powerfultool for probing their atmospheres, in particular their albedosand brightness temperatures (Winn et al. 2010a). The timing and
1
arX
iv:1
409.
8245
v1 [
astr
o-ph
.EP]
29
Sep
2014

Gandolfi et al.: The transiting planet KOI-183b
Table 1. KIC, GSC2.3, USNO-A2, and 2MASS identifiers of theplanet-hosting star KOI-183. Equatorial coordinates and opticalSDSS-g,-r,-i,-z photometry are from the Kepler Input Catalogue.Infrared J,H,Ks and W1,W2,W3,W4 data are from the 2MASS(Cutri et al. 2003) and WISE All-Sky Data Release (Wright etal. 2010; Cutri et al. 2012) database, respectively.
Main identifiers
KIC 9651668GSC2.3 ID N2JG036249USNO-A2 ID 1350-106697262MASS ID 19312537+4623282
Equatorial coordinates
RA (J2000) 19h 31m 25.s378Dec (J2000) +46 23′ 28.′′240
Magnitudes
Filter (λe f f ) Mag Error
g ( 0.48 µm) 14.729 0.030r ( 0.63 µm) 14.225 0.030i ( 0.77 µm) 14.102 0.030z ( 0.91 µm) 14.028 0.030J ( 1.24 µm) 13.142 0.023H ( 1.66 µm) 12.847 0.018Ks ( 2.16 µm) 12.799 0.031W1 ( 3.35 µm) 12.704 0.025W2 ( 4.60 µm) 12.771 0.026W3 (11.56 µm) 12.776a -W4 (22.09 µm) 9.536a -
Notes. (a) Upper limit
duration of the secondary eclipse, coupled with the timing andduration of the transit, enable us to measure small non-zero ec-centricities (e . 0.1) that are not easily detectable with radial ve-locity (RV) measurements. The latter is an important parameterto investigate star-planet tidal interactions, planet-planet gravita-tional perturbations, and migration mechanisms of hot Jupiters.
Ever since June 2010 the Kepler team has been releasingand updating a list of transiting planet candidates, also knownas Kepler Object of Interests (KOIs), which as for August 2014amount to 7305 objects1. Whereas Kepler multi-transiting sys-tem candidates have a low probability of being false positives(Lissauer et al. 2014; Rowe et al. 2014), the same does not applyfor those where a single planet is observed to transit (Santerne etal. 2012; Sliski & Kipping 2014). These require ground-basedfollow-up observations for validation, such as high-resolutionspectroscopy and high-precision radial velocity measurements.The aim of follow-up observations is thus twofold: a) to rule outfalse-positive scenarios and confirm that the photometric signalis caused by a bona fide transiting planet; b) to characterise thesystem by exploiting simultaneously both the photometric andspectroscopic data.
We herein report the confirmation of the Kepler transitingplanet KOI-183b (also known as KOI-183.01). We combined thefull Kepler photometry with high-resolution spectroscopy fromFIES@NOT to confirm the planetary nature of the transiting ob-ject and derive the system parameters.
1 Available at http://exoplanetarchive.ipac.caltech.edu/cgi-bin/ExoTables/nph-exotbls?dataset=cumulative.
Fig. 1. Example section of median-normalised long cadencelight curve of KOI-183. Data are from Kepler quarter 13.
This paper is organized as follows. Section 2 describes theavailable Kepler photometry of KOI-183, whereas Section 3reports on our spectroscopic follow-up with FIES@NOT. InSection 4, we detail how the fundamental parameters of the hoststar were derived. In Section 5, we outline our global Bayesiananalysis and report on the quarter-to-quarter instrumental sys-tematics affecting the Kepler photometry. Results are discussedin Sect. 6 and conclusions are given in Sect. 7.
2. Kepler photometry
The Kepler object KIC 9651668 – whose main designations,equatorial coordinates, and optical and infrared photometry arelisted in Table 1 – was previously identified as a Kepler planet-hosting star candidate by Borucki et al. (2011) and Batalha et al.(2013) and assigned the identifier KOI-183.
KOI-183’s Kepler photometry2 covers quarters 1 – 17 (Q1 –Q17), offering four years of nearly continuous observations,from 13 May 2009 to 11 May 2013. The short cadence (SC;Texp=58.85 sec) data are available for Q4 – Q8 and Q13, andencompass 190 individual transits. The long cadence (LC;Texp=1765.46 sec) photometry contains the SC transits and 311additional LC-only transits observed in Q1 – Q3, Q9 – Q12, andQ14 – Q17.
In this work we used the Kepler simple aperture photometry(SAP; Jenkins et al. 2010), as well as the same data processedwith the new version of the pre-search data conditioning (PDC)pipeline (Stumpe et al. 2012), which uses a Bayesian maximuma posteriori (MAP) approach to remove the majority of instru-mental artefacts and systematic trends (Smith et al. 2012). Theiterative filtering procedure by Aigrain & Irwin (2004) with a 5-σ clipping algorithm was applied to both the SAP and the PDC-MAP light curves to identify and reject further outliers. We alsoperformed a visual inspection of the Kepler light curves to re-move photometric discontinuities across the data gaps that coin-cide with the quarterly rolls of the spacecraft. The point-to-pointscatter estimates for the PDC-MAP SC and LC light curve are1146 ppm (1.24 mmag) and 292 ppm (0.32 mmag), respectively(Table 5).
Figure 1 shows the median-normalised LC data of KOI-183from Kepler quarter 13. The ∼1.8%-deep transit signals occur-ring every 2.7 days are clearly visible, along with a ∼0.5 %(peak-to-peak) out-of-transit modulation. Given the spectral typeof the planet host star (G4 V; see Sect. 4.1), this variability islikely to be due to magnetic active regions carried around by
2 Available at http://archive.stsci.edu/kepler.
2

Gandolfi et al.: The transiting planet KOI-183b
Table 2. FIES radial velocity measurements of KOI-183. TheCCF bisector spans and the S/N ratio per pixel at 5500 Å arelisted in the last two columns.
BJD RV σRV Bisector S/N/pixel(− 2 450 000) km s−1 km s−1 km s−1 @5500 Å
6470.57575 −3.095 0.040 0.045 136472.44994 −3.099 0.037 0.001 116472.68480 −3.141 0.044 0.049 106473.55655 −3.024 0.039 −0.010 156473.68685 −3.024 0.037 −0.005 166485.48160 −3.026 0.022 0.018 216485.63175 −3.039 0.028 0.026 186486.45254 −3.122 0.025 0.019 196486.63451 −3.117 0.028 0.018 186487.47598 −2.958 0.021 0.002 226487.63967 −2.927 0.027 −0.002 186544.39613 −2.955 0.030 0.032 13
stellar rotation. Using an algorithm based on the autocorrela-tion function of the Q3 – Q14 time-series, McQuillan et al. (2013)found a stellar rotation period of Prot = 22.047 ± 0.121 days.
3. High-resolution spectroscopy
The spectroscopic follow-up of KOI-183 was performed withthe FIbre-fed Echelle Spectrograph (FIES; Frandsen & Lindberg1999; Telting et al. 2014) mounted at the 2.56-m Nordic OpticalTelescope (NOT) of Roque de los Muchachos Observatory (LaPalma, Spain). The observations were carried out between Juneand September 2013, under OPTICON and CAT observing pro-grammes 2013A025 and 79-NOT14/13A, respectively. We usedthe 1.3 ′′ high-res fibre, which provides, in conjunction with a50-µm slit at the fibre exit, a resolving power of R = 67000 inthe spectral range 3600 – 7400 Å. Three consecutive exposuresof 1200 seconds were taken per epoch observation to removecosmic ray hits. Following the observing strategy described inBuchhave et al. (2010), we traced the RV drift of the instrumentby acquiring long-exposed (Texp=15 sec) ThAr spectra right be-fore and after each epoch observation. The data were reducedusing a customised IDL software suite, which includes bias sub-traction, flat fielding, order tracing and extraction, and wave-length calibration. Radial velocity measurements were derivedvia multi-order cross-correlation technique with the RV standardstar HD 182572 – observed with the same instrument set-up asthe target object – and for which we adopted an heliocentric ra-dial velocity of −100.350 km s−1, as measured by Udry et al.(1999).
The FIES RV measurements are listed in Table 2 alongwith the cross-correlation function (CCF) bisector spans and thesignal-to-noise (S/N) ratio per pixel at 5500 Å. The upper panelof Fig. 2 shows the FIES RVs of KOI-183 and the Keplerianfit to the data – as obtained from the global analysis describedin Sect. 5 – whereas the lower panel displays the CCF bisectorspans plotted against the RV measurements, assuming that theerror bars of the former are twice those of the latter. We followedthe method described in Loyd & France (2014) to account for theuncertainties of our measurements and found that the probabil-ity that uncorrelated random datasets can reproduce the observedarrangement of points (null hypothesis) is about 50 %. The lackof significant correlation between the CCF bisector spans andthe RVs indicates that most likely the Doppler shifts observed
Fig. 2. Upper panel: FIES radial velocities of KOI-183 – af-ter subtracting the systemic velocity Vγ – versus BarycentricJulian day and Keplerian fit to the data. Lower panel: Bisectorspans of the FIES cross-correlation functions versus RV mea-surements, after subtracting the systemic velocity Vγ. Error barsin the CCF bisector spans are taken to be twice the uncertaintiesin the RV data.
in KOI-183 are induced by the orbital motion of the compan-ion rather than stellar activity or a blended eclipsing binary (see,e.g., Queloz et al. 2001).
4. Properties of the host star
4.1. Photospheric parameters
We derived the fundamental photospheric parameters of the hoststar KOI-183 using the co-added FIES spectrum, which has aS/N ratio of about 60 per pixel at 5500 Å. Two independentanalyses were performed. The first method compares the co-added FIES spectrum with a grid of theoretical models fromCastelli & Kurucz (2004), Coelho et al. (2005), and Gustafssonet al. (2008), using spectral features that are sensitive to differentphotospheric parameters. We adopted the calibration equationsfor Sun-like dwarf stars from Bruntt et al. (2010) and Doyleet al. (2014) to determine the microturbulent vmicro and macro-turbulent vmacro velocities, respectively. The projected rotationalvelocity v sin i? was measured by fitting the profile of severalclean and unblended metal lines. The second method relies onthe use of the spectral analysis package SME 2.1, which calcu-lates synthetic spectra of stars and fits them to observed high-resolution spectra (Valenti & Piskunov 1996; Valenti & Fischer2005). It uses a non-linear least squares algorithm to solve for the
3

Gandolfi et al.: The transiting planet KOI-183b
Fig. 3. Modified Hertzsprung-Russell diagram showing the stel-lar bulk density versus effective temperature. The position ofKOI-183 is over-plotted on theoretical evolutionary tracks andisochrones from the Pisa Stellar Evolution Data Base for low-mass stars. The blue hatched areas represent different masses(0.81, 0.85, and 0.89 M from right to left), while the greys rep-resent the age isochrones (9, 11, and 13 Gyr from bottom totop), computed for an initial metal content between Z=0.012 andZ=0.014.
model atmosphere parameters. The two analysis provided con-sistent results well within the errors bars. The final adopted val-ues are Teff = 5560 ± 80 K, log g = 4.44 ± 0.10 (log10 g cm−2),[M/H] = −0.10 ± 0.05 dex, vmicro = 1.0 ± 0.1 km s−1, vmacro =2.8 ± 0.4 km s−1, and v sin i? = 2.5 ± 0.5 km s−1. Using theStraizys & Kuriliene (1981) calibration scale for dwarf star, theeffective temperature of KOI-183 translates to a G4 V spectraltype.
4.2. Stellar mass, radius, and age
Stellar mass, radius, and age were determined using the effectivetemperature Teff and metallicity [M/H], as derived from the spec-tral analysis (Sect. 4.1), along with the stellar bulk density ρ?, asobtained from the modelling of the transit light curve (Sect. 5).We compared the position of KOI-183 on a ρ?-versus-Teff dia-gram with a grid of ad hoc evolutionary tracks (Fig. 3).
We generated stellar models using an updated version ofthe FRANEC code (Degl’Innocenti et al. 2008; Tognelli et al.2011) and adopting the same input physics and parameters asthose used in the Pisa Stellar Evolution Data Base for low-mass stars3 (see, e.g., Dell’Omodarme et al. 2012, for a detaileddescription). To account for the current surface metallicity ofKOI-183 ([M/H] = −0.10 ± 0.05 dex) and microscopic diffu-sion of heavy elements towards the centre of the star, we com-puted evolutionary tracks assuming an initial metal content ofZ=0.010, Z=0.011, Z=0.012, Z=0.013, Z=0.014, and Z=0.015.The corresponding initial helium abundances, i.e., Y=0.268,0.271, 0.273, 0.275, 0.277, and 0.279, were determined assum-ing a helium-to-metal enrichment ratio ∆Y/∆Z=2 (Jimenez etal. 2003; Casagrande 2007; Gennaro et al. 2010) and a cosmo-logical 4He abundance Yp=0.2485 (Cyburt 2004; Peimbert et al.2007a,b). For each chemical composition, we generated a veryfine grid of evolutionary tracks in the mass domain M? = 0.70–
3 Available at http://astro.df.unipi.it/stellar-models/.
1.10 M, with step of ∆M? = 0.01 M, leading to a total of 246stellar tracks.
We found that evolutionary tracks with initial metal contentbetween Z=0.012 and Z=0.014 have to be used to reproducethe current photospheric metallicity of KOI-183. We derived amass of M? = 0.85 ± 0.04 M a radius of R? = 0.95 ± 0.04 Rand an age of t = 11 ± 2 Gyr (Table 5). Mass and radius im-ply a surface gravity of log g = 4.41 ± 0.04 (log10 g cm−2),which agrees with the spectroscopically derived value log g =4.44 ± 0.10 (log10 g cm−2).
Using pre-main sequence (PMS) evolutionary tracks wouldlead to consistent results in terms of stellar mass and radius, butwould also yield an age of 25± 5 Myr. Given the relatively rapidevolutionary time-scale of PMS stars, we note that the likelihoodof finding KOI-183 still contracting towards the zero-age mainsequence (ZAMS) is about 600 times lower than probability forthe star to be found in the post ZAMS phase. Moreover, such ayoung scenario is at odds with: a) the distance from the galacticplane, which amounts to 166 ± 17 pc (given the spectroscopicdistance of 725 ± 75 pc – see below – and galactic latitude of+12.92 ); b) the relatively long rotation period of the star (Prot =22.047 ± 0.121 days); c) the absence of high magnetic activitylevel (the peak-to-peak photometric variation is ∼0.5%); d) thelack of detectable Li i λ6708 Å absorption line in the co-addedFIES spectrum. Short rotation period (Prot . 5 days), coupledwith high magnetic activity and strong Li i λ6708 Å absorptionline (EWLi & 300 mÅ), are usually regarded as youth indicatorsin PMS low-mass stars (see, e.g., Marilli et al. 2007; Gandolfi etal. 2008).
4.3. Interstellar extinction and distance
We followed the method described in Gandolfi et al. (2008) toderive the interstellar extinction Av and spectroscopic distanced of the system. We simultaneously fitted the available opticaland infrared colours listed in Table 1 with synthetic theoreti-cal magnitudes obtained from the NextGen model spectrum withthe same photospheric parameters as the star (Hauschildt et al.1999). We excluded the W3 and W4 WISE magnitudes, owingto the poor photometry (Cutri et al. 2012). Assuming a normalextinction (Rv = 3.1) and a black body emission at the star’s ef-fective temperature and radius, we found that KOI-183 suffers anegligible interstellar extinction of Av = 0.044 ± 0.044 mag andthat its distance is d = 725 ± 75 pc (Table 5).
5. Bayesian and MCMC global analysis
5.1. Approach
We estimated the system parameters, i.e., stellar, planetary, andorbital parameters for which inference can be made based onphotometry and radial velocities, using a Bayesian approachwhere the photometric and RV data are modelled simultane-ously, similarly to the work described in Gandolfi et al. (2013)and Parviainen et al. (2014). The model describes the primarytransits, secondary eclipses, and RV variations. The significanceof a possible secondary eclipse signal (Sect. 6.2) was assessedseparately using a method based on Bayesian model comparison(Parviainen et al. 2013).
We obtained an estimate of the model posterior distributionusing the Markov chain Monte Carlo (MCMC) technique. Thesampling was carried out using emcee4 (Foreman-Mackey et al.
4 Available at github.com/dfm/emcee.
4

Gandolfi et al.: The transiting planet KOI-183b
750
0
750
O-M
[ppm
] PDC-MAP data
750
0
750
O-M
[ppm
] SAP data
0 100 200 300 400 500Transit number
750
0
750
O-M
[ppm
] PDC-MAP + quarterly crowding metric correction
Q1 Q2 Q3 Q4 Q5 Q6 Q7 Q8 Q9 Q10 Q11 Q12 Q13 Q14 Q15 Q16 Q17
Fig. 4. Upper panel. Average, observed−modelled (O−M) flux residual of the photometric points encompassing the second (T2)and third transit contact (T3) as a function of the transit numbers for the PDC-MAP data, assuming that the Kepler contaminationmetric has been properly estimated. The light blue lines show the standard error of the mean for each transit. The beginning ofeach Kepler quarter is marked with dashed grey vertical lines. Middle panel. As in the upper panel, but for the SAP data. Lowerpanel. Same as before, but for the PDC-MAP cotrended data, following our quarterly crowding metric correction constrained by aninformative prior (see text for more details).
Table 3. Model parametrisation used in the basic system charac-terisation.
Model Parameter Notation
Planetary orbital period PorbPlanetary mid-transit epoch T0Stellar bulk density ρ?Impact parameter bOrbit eccentricity eArgument of periastron ω
Planet-to-star area ratio R2p/R
2?
Planet-to-star surface brightness ratioa f
Linear limb-darkening coefficient u1Quadratic limb-darkening coefficient u2Kepler LC data scatter σLCKepler SC data scatter σSC
Systemic radial velocity Vγ
Radial velocity semi-amplitude K
Quarterly crowding metric Ci, with i ∈ [1..17]
Notes. (a) We defined the planet-to-star surface brightness ratio f asthe flux ratio per projected unit area (instead of as eclipse depth). Theeclipse depth is thus ∆Fec = f × R2
p/R2?.
2012), a Python implementation of the Affine Invariant Markovchain Monte Carlo sampler (Goodman & Weare 2010). We used
PyDE5, a Python implementation of the differential evolution al-gorithm for global optimization, to generate an initial populationof parameter vectors clumped close to the global posterior max-imum used to initialize the MCMC sampling. The sampling wascarried out with 500 simultaneous walkers (chains). The samplerwas first run iteratively through a burn-in period consisting of 20runs of 500 steps each, after which the walkers had convergedto sample the posterior distribution. The chains were consideredto have converged to sample the posterior distribution after theensemble properties of the chains did not change during severalsets of 500 iterations, and the results from different walker sub-sets agreed with each other. The final sample consists of 1500iterations with a thinning factor of 50 (chosen based on the av-erage parameter autocorrelation lengths to ensure that we hadindependent samples), leading to 15000 independent posteriorsamples.
5.2. Dataset
The dataset consists of the 12 FIES RVs (Sect. 3), subsets of theSC and LC data for the transit modelling, and subsets of the LCdata for the secondary eclipse modelling.
The photometric data for the transit modelling included 12hours of data around each transit, where each segment was de-trended using a second-order polynomial fitted to the out-of-transit points. We preferred short time cadence light curves whenavailable, and excluded the LC transits for which SC data wasavailable. The final SC and LC transit light curves contain about138400 and 12100 points, respectively. We chose not to usePDC-MAP data due to the issues in the crowding metric correc-
5 Available at github.com/hpparvi/PyDE.
5

Gandolfi et al.: The transiting planet KOI-183b
tion applied by the pipeline, but used the PDC-MAP cotrendedfluxes instead (see Sect. 5.4).
The eclipse model was evaluated using LC data only. We in-cluded about 18 hours of data centred on half-phase from eachindividual orbit – enough to allow for eccentricities up to 0.2– and did not detrend the individual data segments (we usedGaussian processes to model the baseline instead).
5.3. Log-posterior probability density and parametrisation
The non-normalised log-posterior probability density is de-scribed as
log P(θ|D) = log P(θ)+ log P(FSC|θ) + log P(FLC|θ)+ log P(FEC|θ)+ log P(RV |θ),
(1)
where FSC and FLC are the short- and long-cadence photometricdata for the primary transit, FEC is the long cadence photomet-ric data for the secondary eclipse, RV corresponds to the FIESradial velocity data, θ is the parameter vector containing the pa-rameters listed in Table 3, and D the combined dataset. The firstterm in the right-hand side of Eq. 1, namely log P(θ), is the loga-rithm of the joint prior probability, i.e., the product of individualparameter prior probabilities, and the four remaining terms arethe likelihoods for the RV and light curve data.
The likelihoods for the combined RV and photometricdataset D follow the basic form for a likelihood assuming inde-pendent identically distributed errors from normal distribution:
log P(D|θ) = −ND
2log(2π) − ND log(σD)
−12
ND∑i=1
(Di − M(ti, θ)
σD
)2
,
(2)
where Di is the single observed data point i, M(ti, θ) the modelexplaining the data, ti the centre time for a data point i, ND thenumber of data points, and σD the standard deviation of the errordistribution (see, e.g., Gregory 2005).
The likelihood for the secondary eclipse data was calculatedusing Gaussian processes (GPs) to reduce our sensitivity to sys-tematic noise (Rasmussen & Williams 2006; Gibson et al. 2012).We modelled the residuals as a GP with an exponential kernel,with the kernel hyper-parameters fixed to values optimized to thedata.
The radial velocity model follows from equation
RV = Vγ + K[cos(ω + ν) + e cosω], (3)
where Vγ is the systemic velocity, K the radial velocity semi-amplitude, ω the argument of periastron, ν the true anomaly, ande the eccentricity.
The transit model used PyTransit, an optimized implemen-tation of the (Gimenez 2006) transit shape model6. The long-cadence and planetary eclipse models were super-sampled using8 subsamples per LC exposure to reduce the effects from the ex-tended integration time (Kipping 2010).
We defined the planet-to-star surface brightness ratio f as theflux ratio per projected unit area (instead of as eclipse depth).The eclipse depth is thus ∆Fec = f × R2
p/R2?.
6 Available at github.com/hpparvi/PyTransit.
Fig. 5. Upper panel: Quarterly median transit depth residuals,as derived from the Kepler PDC-MAP light curve of KOI-183,against Kepler crowding metrics. Error bars are the median ab-solute deviations. Quarters sharing the same Kepler observingseason are plotted with the same symbol and colour: Q1, Q5,Q9, Q13, and Q17 (upward green triangles); Q2, Q6, Q10, and Q14(downward black triangles); Q3, Q7, Q11, and Q15 (blue squares);Q4, Q8, Q12, and Q16 (red circles). Lower panel: Same as before,but for the PDC-MAP cotrended data, following our quarterlycrowding metric correction constrained by an informative prior.The x-axis reports our estimates of the quarterly crowding met-rics.
5.4. Systematic effects in the Kepler photometry of KOI183:quarterly transit depth variation
Van Eylen et al. (2013) recently observed systematic depth vari-ations in the Kepler transit light curves of HAT-P-7, which werefound to be related to the 90-degree rolling of the spacecraftoccurring every quarter (i.e., every ∼90 days). They proposedfour possible causes for the variations, i.e., unaccounted-for lightcontamination, too small aperture photometric masks, instru-mental non-linearities, and colour-dependence in the pixel re-sponse function, but noted that it is not possible to choose themost likely cause based on Kepler data only.
We searched for similar instrument systematics in the Keplerlight curve of KOI-183 by subtracting, from each PDC-MAPand SAP transit light curve, the corresponding best-fitting tran-sit model obtained using simultaneously all the Kepler segments(Sect. 5.2). The upper panel of Fig. 4 displays the transit depthresidual as a function of the transit number for the PDC-MAPdata. We found a significant (∼16-σ) quarter-to-quarter system-atic variation of the transit depth, with a seasonal trend reoccur-ring every four quarters and with the Q4, Q8, Q12, and Q16 datayielding the deepest transit light curves. The peak-to-peak am-
6
Gandolfi et al.: The transiting planet KOI-183b
Table 4. Kepler quarterly crowding metrics (second column).Our estimates of the crowding metrics with their 1-σ uncertain-ties from the MCMC posterior sampling are listed in the last twocolumns.
Quarter Kepler crowding Derived crowding σCi
(Qi) metric metric (Ci)
Q1 0.9756 0.9638 0.0035Q2 0.9614 0.9572 0.0029Q3 0.9708 0.9563 0.0029Q4 0.9354 0.9571 0.0028Q5 0.9738 0.9644 0.0029Q6 0.9574 0.9612 0.0028Q7 0.9708 0.9611 0.0027Q8 0.9354 0.9585 0.0026Q9 0.9736 0.9690 0.0029Q10 0.9574 0.9550 0.0030Q11 0.9709 0.9662 0.0030Q12 0.9347 0.9555 0.0029Q13 0.9732 0.9610 0.0027Q14 0.9574 0.9593 0.0029Q15 0.9708 0.9632 0.0028Q16 0.9351 0.9550 0.0029Q17 0.9727 0.9546 0.0034
plitude is about 800 parts per million (ppm), which correspondsto ∼4.3 % of the mean transit depth.
Intriguingly, there is no significant (∼2-σ) quarter-to-quartervariation of the transit depth in the SAP data, as shown in themiddle panel of Fig. 4. The SAP residuals exhibit, however,intra-quarter systematic trends that might result from the mo-tion of the target within its photometric aperture due to telescopefocus variation, differential velocity aberration, and spacecraftpointing (Kinemuchi et al. 2012). The PDC-MAP data are cor-rected for these effects using cotrending basic vectors generatedfrom a suitable ensemble of highly-correlated light curves on thesame channel (Stumpe et al. 2012). Because different behavioursof the Kepler detectors would most likely cause systematics vis-ible in both PDC-MAP and SAP data, we can safely exclude thechannel-to-channel non-linearity difference as the source of thequarter-to-quarter transit depth variation. Moreover, the KeplerCCD non-linearity is reported to be 3 % over the whole dynamicrange (Caldwell et al. 2010) and the systematic variations areat least one order of magnitude larger than the expected non-linearity effect at the transit depth signal.
This leaves the crowding metric correction performed bythe PDC-MAP pipeline as the most plausible explanation. Thecrowding metric is defined as the fraction of light in the photo-metric aperture arising from the target star. Since apertures aredefined for each quarter – to account for the redistribution of tar-get flux over a new CCD occurring at each roll of the spacecraft– the crowding metrics are computed quarterly for each target.The excess flux due to crowding within the photometric apertureis automatically removed by the PDC-MAP pipeline from theSAP light curve. The upper panel of Figure 5 shows the quarterlymedian transit depth residuals – as derived from the PDC-MAPlight curve – plotted against the crowding metrics – as extractedfrom the header keyword CROWDSAP listed in the Kepler data(Table 4, second column). We found a significant correlationbetween the two quantities, with a null hypothesis probabilityof only 0.15 %. The lack of significant quarter-to-quarter transitdepth variation in the SAP data (Fig. 4, middle panel) suggeststhat the crowding metric variation among quarters is most likely
2 4 6 8 10 12 14 16quarter
95.0
95.5
96.0
96.5
97.0
97.5
Crow
ding
[%]
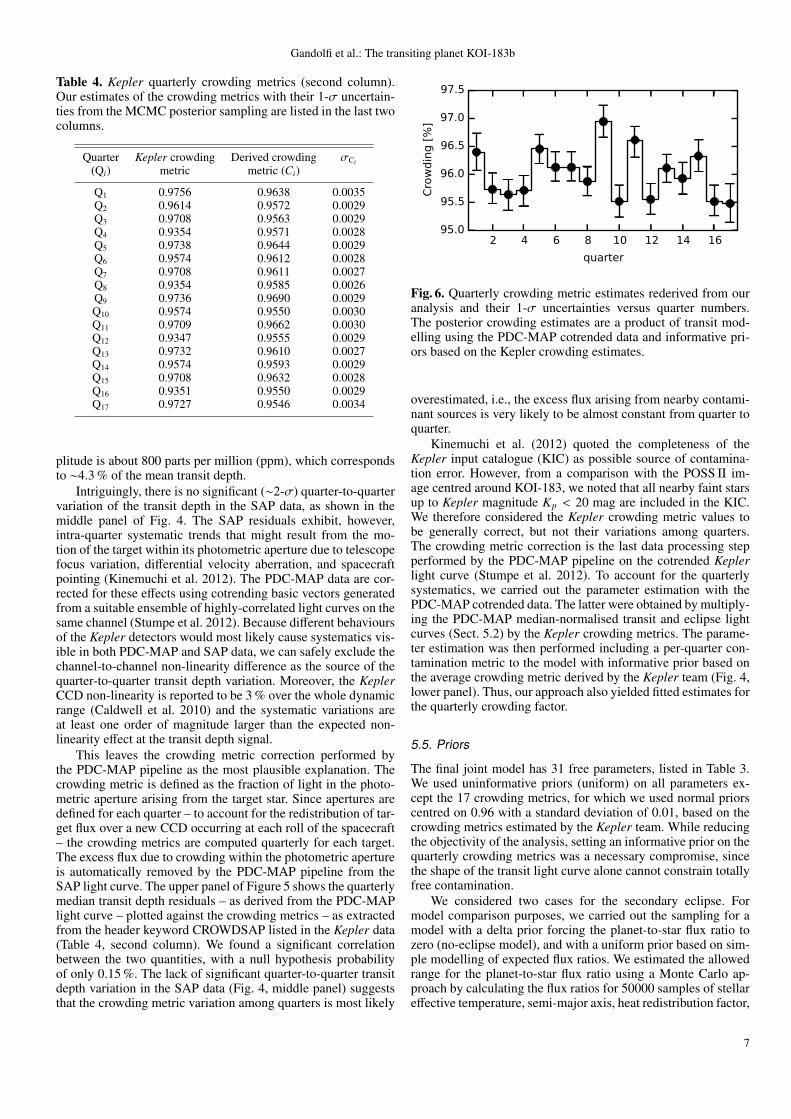
Fig. 6. Quarterly crowding metric estimates rederived from ouranalysis and their 1-σ uncertainties versus quarter numbers.The posterior crowding estimates are a product of transit mod-elling using the PDC-MAP cotrended data and informative pri-ors based on the Kepler crowding estimates.
overestimated, i.e., the excess flux arising from nearby contami-nant sources is very likely to be almost constant from quarter toquarter.
Kinemuchi et al. (2012) quoted the completeness of theKepler input catalogue (KIC) as possible source of contamina-tion error. However, from a comparison with the POSS II im-age centred around KOI-183, we noted that all nearby faint starsup to Kepler magnitude Kp < 20 mag are included in the KIC.We therefore considered the Kepler crowding metric values tobe generally correct, but not their variations among quarters.The crowding metric correction is the last data processing stepperformed by the PDC-MAP pipeline on the cotrended Keplerlight curve (Stumpe et al. 2012). To account for the quarterlysystematics, we carried out the parameter estimation with thePDC-MAP cotrended data. The latter were obtained by multiply-ing the PDC-MAP median-normalised transit and eclipse lightcurves (Sect. 5.2) by the Kepler crowding metrics. The parame-ter estimation was then performed including a per-quarter con-tamination metric to the model with informative prior based onthe average crowding metric derived by the Kepler team (Fig. 4,lower panel). Thus, our approach also yielded fitted estimates forthe quarterly crowding factor.
5.5. Priors
The final joint model has 31 free parameters, listed in Table 3.We used uninformative priors (uniform) on all parameters ex-cept the 17 crowding metrics, for which we used normal priorscentred on 0.96 with a standard deviation of 0.01, based on thecrowding metrics estimated by the Kepler team. While reducingthe objectivity of the analysis, setting an informative prior on thequarterly crowding metrics was a necessary compromise, sincethe shape of the transit light curve alone cannot constrain totallyfree contamination.
We considered two cases for the secondary eclipse. Formodel comparison purposes, we carried out the sampling for amodel with a delta prior forcing the planet-to-star flux ratio tozero (no-eclipse model), and with a uniform prior based on sim-ple modelling of expected flux ratios. We estimated the allowedrange for the planet-to-star flux ratio using a Monte Carlo ap-proach by calculating the flux ratios for 50000 samples of stellareffective temperature, semi-major axis, heat redistribution factor,
7

Gandolfi et al.: The transiting planet KOI-183b
2 1 0 1 2
Time - T0 [h]
Norm
aliz
ed f
lux 0.995
0.990
0.985
0.980
2 1 0 1 2
Time - T0 [h]
Fig. 7. Phase-folded transit light curves of KOI-183b, best fitting model, and residuals. LC data are shown on the left panel, SCon the right panel, both binned at ∼1.9 minutes. The shaded area corresponds to the 3-σ errors in the binned fluxes. The dashedlines mark the T14 limits, and the dotted lines the T23 limits. The blurring of the transit shape – due to the long integration time – isobvious in the LC plot (left panel).
0.0 0.2 0.4 0.6 0.8 1.0
Orbital phase
3.20
3.15
3.10
3.05
3.00
2.95
2.90
Radia
l velo
city
[km
/s]
Fig. 8. Radial velocity data with the median and 68% and 99%percentile limits of the posterior predictive distribution.
and Bond albedo. The effective temperature and semi-major axisdistributions are based on estimated values, the heat distributionfactor values are drawn from uniform distribution U(1/4, 2/3)and the Bond albedo values from uniform distribution U(0, 0.5).The resulting distribution is nearly uniform, and extends from0.0 to 0.012 (99th percentile), and thus we decided to set a uni-form prior U(0, 0.012) on the flux ratio.
6. Results and discussions
We list our results in Table 5. The system’s parameter estimateswere taken to be the median values of the posterior probabil-ity distributions. Error bars were defined at the 68 % confidencelimit. We show the phase-folded transit and RV curves alongwith the fitted models in Figs.7 and 8, respectively.
The quarterly correction estimates, along with their 1-σ un-certainties, are listed in Table 4. For the sake of illustration,they are also plotted in Fig. 6. We found no significant corre-
Fig. 9. Mass-radius diagram for transiting hot Jupiters (grey cir-cles; Porb < 10 days and 0.1 < Mp < 15 MJup, from theExtrasolar Planet Encyclopedia at http://exoplanet.eu/, asof 15 September 2014). KOI-183b is marked with a thicker bluecircle. The Fortney et al. (2007) isochrones for a planet coremass of 0, 25, 50 M⊕ – interpolated to the solar equivalent semi-major axis of KOI-183b and extrapolated to an age of 11 Gyr– are overplotted with thick green lines from bottom to top.Isodensity lines for density ρp = 0.25, 0.5, 1, 2, and 4 g cm−3
are overlaid with dashed lines from left to right.
lation (51 % null hypothesis probability) between the quarterlytransit depth – as derived from the PDC-MAP cotrended lightcurve, following our correction for contamination factor – andthe crowding metric, as displayed in the lower panel of Figure 5.We note that neglecting the quarter-to-quarter transit depth vari-ation leads to a significant (7-σ) underestimate of the planet-to-star radius ratio by about 1.5 % and doubles its uncertainty.
6.1. Planet properties
The planet KOI-183b has a mass of Mp = 0.595 ± 0.081 MJupand a radius of Rp = 1.192 ± 0.052 RJup, yielding a plane-
8

Gandolfi et al.: The transiting planet KOI-183b
Fig. 10. Secondary eclipse light curve of KOI-183, phase-foldedto the orbital period of the planet. Kepler data are median-binnedin intervals of 0.015 cycles in phase (∼1 hour). The 1-σ errorbars are the median absolute deviations of the data points insidethe bin, divided by the square root of the number of points. Thebest fitting transit model is overplotted with a red line.
tary bulk density of ρp = 0.459 ± 0.083 g cm−3. We show inFig. 9 how KOI-183b compares on a mass-radius diagram toall other known transiting hot Jupiters (Porb < 10 days; 0.1 <Mp < 15 MJup). With a system age of 11 Gyr, the radius ofKOI-183b is consistent within 1.5-σ with the expected theoret-ical value for an irradiated coreless gas-giant planet (Fortney etal. 2007). Alternatively, the planet might have a core and be in-flated because of unaccounted-for heating source, atmosphericenhanced opacities, and reduced interior heat transport (Guillot2008; Baraffe et al. 2014). It is worth noting that the radius ofKOI-183b agrees within 1-σ to the empirical radius relationshipfor Jupiter-mass planets from Enoch et al. (2012), which pre-dicts a radius of 1.28 ± 0.14 RJup, given the planetary mass Mp,equilibrium temperature Teq, and semi-major axis ap listed inTable 5.
6.2. Secondary eclipse and planet albedo
We detected a tentative secondary eclipse of KOI-183b in theKepler long cadence light curve and measured a depth of 14.2 ±6.6 ppm (Fig. 10). The eclipse signal is relatively weak and couldin theory be due to random instrumental or astrophysical events.We set to verify the eclipse signal and assessed its significanceusing a method based on Bayesian model selection, as describedby Parviainen et al. (2013). We introduced some additional im-provements that we briefly describe in the following paragraph7.The Bayesian evidence integration could be carried out usingsimple Monte Carlo integration because of the low dimensional-ity of the effective parameter space.
We considered two models, one without an eclipse signal(M0) and one with an eclipse signal (M1), and assigned equalprior weights on both models. We calculated the Bayes factorin favour of M1 cumulatively for each orbit, i.e., we calculatedthe Bayesian evidences for both models separately for every in-dividual 18 hour-long data segment. Since we assumed that themodel global likelihoods – or Bayesian evidences – are indepen-dent from orbit to orbit, the final global likelihood is the productof the model likelihoods for each orbit – or a sum of the modellog-likelihoods. A real eclipse signal that exists from orbit to or-
7 For a detailed explanation, see Parviainen et al. 2014, in prepara-tion.
4 3 2 1 0 1 2 3 4
Transit center - 0.5× period [h]
4
3
2
1
0
1
2
3
log P
1 -
log P
0
Fig. 11. Differences between the individual posterior samplesfor the eclipse model (M1) and no-eclipse model (M0) plottedagainst the eclipse centre (light blue circles), mapped from thesampling space that uses eccentricity and argument of perias-tron. A Bayes factor map produced by sliding a uniform priorwith a width of 15 minutes along the transit centre is overlaidwith a black thick line.
bit leads to a steadily increasing Bayes factor in favour of M1.8 Incontrast, a signal from an individual event mimicking an eclipsewould be visible as a jump in the cumulative Bayes factor trace.
The Bayes factor in favour of the eclipse model was foundto depend strongly on our choice of priors on eccentricity andflux ratio. Assuming a uniform prior on eccentricity between0 and 0.2 and a Jeffreys’ prior on flux ratio encompassing allphysically plausible values for planetary albedos up to 0.5 (i.e.,flux ratios between 0 and 0.008) results in a Bayes factor onlyslightly higher than unity. Lowering the maximum eccentricityto 0.05 and maximum flux ratio to 0.0015 (based on our MCMCposterior sampling, which is going to the grey area of Bayesianmodel selection) yielded a Bayes factor of ∼2.6, correspondingto positive support for the eclipse model.
We show the log posteriors sample differences and the Bayesfactor in favour of the eclipse model mapped as a function ofeclipse centre – itself a function of the eccentricity and argumentof periastron – in Fig. 11, and the cumulative Bayes factor inFig. 12.
The Bayes factor map is used as an expository tool to probethe Bayes-factor space as a function of our prior assumptions,and in this case shows that a) the tentative eclipse found near 0.5phase is the only eclipse-like signal inside the sampling volumeconstrained by our priors; b) while the Bayes factor is only mod-erately in favour of the eclipse model, it is against the eclipsemodel for eclipse signals occurring away from the identifiedeclipse (with a peak-to-peak log Bayes factor difference being∼4). However, the Bayes factor trace (Fig. 12) shows that thesupport for the eclipse-model is mostly from a small continuoussubset of orbits (but not from a single orbit that would indicatea jump in the data). Thus, we must consider the detected eclipsesignal to be only tentative.
The depth of the planetary eclipse would imply a planet-to-star surface brightness ratio of f = (8.93±4.13)×10−4, allowing
8 We stress that this is a slight simplification, as the cumulative Bayesfactor behaves more as a directed random walk, especially for weaksignals.
9

Gandolfi et al.: The transiting planet KOI-183b
us to constraint the geometric Ag and Bond Ab albedo of theplanet. From the effective stellar temperature, eccentricity, andscaled semi-major listed in Table 5, and assuming Ag = 1.5 ×AB and heat redistribution factor between 1/4 and 2/3, we foundtentative values of Ag = 0.055 ± 0.028, AB = 0.037 ± 0.019,and a planet brightness temperature of Tbr = 1950± 250 K. Thiswould make KOI-183 one of the gas-giant planets with lowestBond albedo known so far (see, e.g., Angerhausen et al. 2014).
6.3. Tidal interaction and non-zero eccentricity
The RV data alone constrain the eccentricity to e < 0.16 (99th
percentile of the posterior distribution). The inclusion of the pho-tometric data and the tentative detection of the planet occultationgive a small non-zero eccentricity of 0.019+0.028
−0.014. We stress thatignoring the planet eclipse signal and imposing a circular orbithave a negligible effect on the values of the derived planetaryparameters.
We estimated the tidal evolution time-scales of the systemusing the model of Leconte et al. (2010), which is valid for arbi-trary eccentricity and obliquity. However, instead of using a con-stant time lag ∆t between the tidal bulge and the tidal potential,we recast their model equations using a constant modified tidalquality factor Q′, for an easy comparison with results for otherplanetary systems usually given in terms of Q′. Specifically, weassumed that ∆t = 3/(2k2nQ′), where k2 is the potential Lovenumber of the second degree and n the mean orbital motion. Thisapproximation is the same as, e.g., in Mardling & Lin (2002) andis justified for a first estimate of the time-scales in view of ourlimited knowledge of tidal dissipation efficiency inside stars andplanets.
The rotation period of the star is longer than the orbital pe-riod of the planet, therefore tides act to reduce the semi-majoraxis of the orbit a and to spin up the star. Assuming Q′∗ = 106
for the star, we obtain a tidal decay time-scale |(1/a)(da/dt)|−1 ∼
4 Gyr, while the time-scales for spin alignment and spin up areboth |(1/Ω)(dΩ/dt)|−1 ∼ 10 Gyr, all comparable to the age ofthe system. This suggests that a substantial orbital decay accom-panied by a spin up of the star could have occurred during themain-sequence evolution of the system. Applying standard gy-rochronology to the star (Barnes 2007), we estimated an age of∼3.7 Gyr for the observed rotation period of 22.046 days, whichsupports the conclusion that stellar magnetic braking is counter-acted by the planet. The expected rotation period is ∼40 days foran age of 11 Gyr, i.e., the star is rotating about 1.8 times fasterthan expected. The present orbital angular momentum is about2.5 times the stellar spin angular momentum. If the angular mo-mentum of excess rotation comes from the initial orbital angularmomentum, its minimum value was ∼1.25 the present orbital an-gular momentum, corresponding to an initial orbital period of atleast 4.9 days for a planet of constant mass. If the stellar tidalquality factor Q′∗ >∼ 107, as suggested by Ogilvie & Lin (2007)for non-synchronous systems as in KOI-183’s case, the orbitaldecay and the stellar spin up would have been negligible duringthe main-sequence evolution of the host and the excess rotationcould be associated with a reduced efficiency of the stellar winddue to the magnetic perturbations induced by the planet (Lanza2010; Cohen et al. 2010).
On the other hand, the decay of the orbital eccentricity ismainly ruled by tides inside the planet. Assuming Q′p = 105, i.e.,comparable to that measured for Jupiter (Lainey et al. 2009), thetime-scale for the decay of the eccentricity |(1/e)(de/dt)|−1 ∼
6 Myr. This suggests that, if the orbit is indeed eccentric, theremight be a third body perturbing the motion of the planet.
0
2
4
Log B
10
0 50 100 150 200 250 300 350 400
Orbit number
3
2
1
0
1
2
3
T0 -
P/2
[h]
2
1
0
1
2
3
4
Log B
10
Fig. 12. The cumulation of log B10 as a function of increasingdata. The upper plot shows the trace for the maximum log B10case (identified as a slashed line in the lower plot), and the lowerplot shows log B10 mapped as a function of a sliding prior on theeclipse centre (as in Fig. 11) on the y-axis, with the amount ofdata (number of orbits included) increasing on the x-axis.
However, this scenario seems to be excluded by the lack ofdetectable transit timing variations (Sect. 6.5). Alternatively,the eccentricity can be of primordial origin if Q′∗ ≥ 107 andQ′p ≥ 108, as suggested by Goodman & Lackner (2009) in thecase of coreless giant planets. This would agree with the possiblecoreless planet scenario described in Sect. 6.1.
6.4. Spin-orbit alignment along the line of sight
The spin-orbit angle, i.e., the angle between the stellar spin axisand the angular momentum vector of the orbit, is regarded akey parameter to study planet migration mechanisms (see, e.g.,Winn et al. 2010b; Gandolfi et al. 2012; Crida & Batygin 2014).Assuming that a star rotates as a rigid body, one can infer theinclination of the stellar spin with respect to the line of sight (i?)through
sin i? = Prot (v sin i?)/2 πR?, (4)
where Prot, R?, and v sin i? are the stellar rotation period, radius,and projected rotational velocity, respectively. Since a transitingplanet is seen nearly edge-on (ip ≈ 90), the inclination of thestellar spin axis can tell us whether the system is aligned alongthe line of sight or not. However, the method does not allow us todistinguish between prograde and retrograde systems, as i? andπ − i? angles provide both the same sin i?.
Using the values reported in Table 5, we found that sin i? =1.15 ± 0.23, which implies that i? is between ∼70 and 90 or∼160 and 180. Given the fact that the measurements of theRossiter-McLaughlin effect have shown that retrograde systemsaround relatively cool stars (Teff.6250 K) are rare (see, e.g.Winn et al. 2010b; Albrecht et al. 2012; Hirano et al. 2014),our findings are consistent with spin-orbit alignment along theline of sight. Moreover, as seen in Sect 6.3, the tidal interac-tion time-scale for the evolution of the obliquity is comparableto the age of the system, implying that any primordial misalign-ment of the planet has most likely been damped down by tidalforces. This agrees with the general trend observed in systemswith short tidal interaction time-scales (Albrecht et al. 2012).
6.5. Search for transit timing variations
We carried out a search for additional perturbing objects inthe system by looking for gravitationally-induced variations inthe transit centre times of KOI-183b, the so-called transit tim-
10

Gandolfi et al.: The transiting planet KOI-183b
ing variations (TTVs). The TTV search was carried out usingMCMC and exploiting – for the first time – the full Kepler lightcurve of KOI-183, from Q1 to Q17. The transit centre posteriorswere estimated by fitting a transit model to the individual tran-sits with parameter posteriors from the main characterisation runused as priors for all the parameters except the transit centre. Awide uniform prior centred on the expected transit centre time,assuming no TTVs, was used for the transit centre.
Our results are shown in the upper panel of Fig. 13. The tran-sit centres do not deviate significantly from the linear ephemerisand the results allow us to rule out TTVs with peak-to-peakamplitude larger than about 2 minutes. Our finding agrees withthose from Ford et al. (2011) and Mazeh et al. (2013), and fur-ther confirm the trend that stars hosting hot Jupiters are oftenobserved to have no other close-in planets (Steffen et al. 2012;Szabo et al. 2013).
The Lomb-Scargle periodogram of the KOI-183’s TTV datashows no peaks with false alarm probability smaller than 1 %.However, it is worth noting that there are peaks at the stellar rota-tion period and its first harmonic (Fig. 13, middle panel), whichmight be due to the passage of KOI-183b in front of active pho-tospheric regions (see, e.g., Oshagh et al. 2013). The peak at halfthe stellar rotation period might be caused by the occultations ofstarspots at opposite stellar longitudes. As a matter of fact, theKepler light curve shows also quasi-periodic variations recurringevery ∼11 days (i.e., half the stellar rotation period), which arevisible in the second half of the Q13 data plotted in Fig. 1.
As recently suggested by Mazeh et al. (2014), the anti-correlation (correlation) between the TTV and the slope of thelight curve around each transit can be used to identify prograde(retrograde) planetary motion with respect to the stellar rotation.The lower panel of Figure 13 shows that there is no significantcorrelation (anti-correlation) in our data between TTVs and localphotometric slopes, the linear Pearson correlation coefficient andnull hypothesis probability being −0.16 and 13 %, respectively.
The lack of TTV-versus-slope correlation (anti-correlation)might imply that there are no detectable spot-crossing events inthe TTV data, and that the photometric variation observed in theKepler light curve is mainly dominated by active regions that arenot occulted by the planet. Alternatively, there might be spot-crossing events whose signal in the TTV data is just below thenoise. As a sanity check, we performed a visual inspection of theSC transits – the only ones in which a spot-crossing event canpotentially be identified by eye – and found only one significantevent. However, we believe that our data are mainly dominatedby noise, because the TTVs are normally distributed around zerowith a standard deviation (∼22 sec) comparable with the averageuncertainty of our measurements (∼19 sec).
7. Conclusions
We spectroscopically confirmed the planetary nature of theKepler transiting candidate KOI-183b. We derived the systemsparameters exploiting – for the the first time – the whole avail-able Kepler photometry and combined it with high-precision RVmeasurements taken with FIES@NOT.
We found that the PDC-MAP Kepler data are affected by sea-sonal systematic transit depth variations recurring every 4 quar-ters. We believe that these systematics are caused by an uncor-rected estimate of the quarterly variation of the crowding metric,rather than different behaviours of the Kepler detectors (linear-ity), and treated them as such.
KOI183b is a moderately inflated hot Jupiter with a mass ofMp = 0.595±0.081 MJup and a radius of Rp = 1.192±0.052 RJup,
Fig. 13. Upper panel: Differences between the observed andmodelled transit centre times of KOI-183 (TTVs). Transit tim-ing variations extracted from the short cadence data are plottedwith red triangles, while long cadence TTVs are shown with bluecircles. Middle panel: Lomb-Scargle periodogram of the TTVdata in the 5–30 day period range. The two arrows mark thepeak close to the stellar rotation period and its first harmonic.Lower panel: Transit timing variation versus local transit slope.The straight blue line marks the linear fit to the data.
translating into a bulk density of ρp = 0.459±0.083 g cm−3. Theradius is consistent with both theoretical models for irradiatedcoreless giant planets and expectations based on empirical laws.KOI-183b transits every 2.7 days an old, G4 V star with an ageof 11±2 Gyr. The inclination of the stellar spin axis is consistentwith the system being aligned along the line-of-sight.
We found no detectable TTVs at a level of ∼22 sec (1-σ confidence level), confirming the “lonely” trend observed inhot Jupiter data. Our tentative detection of the planetary eclipseyields a small non-zero eccentricity of 0.019+0.028
−0.014, and geo-metric and Bond albedo of Ag = 0.055 ± 0.028 and Ab =0.035 ± 0.014, respectively, placing KOI-183 amongst the gas-giant planets with the lowest albedo known so far.
Acknowledgements. We are infinitely grateful to the staff members at the NordicOptical Telescope for their valuable and unique support during the observations.Davide Gandolfi would like to thank Gabriele Cologna for the interesting conver-sations on the properties of the planetary system. Hannu Parviainen has receivedsupport from the Rocky Planets Around Cool Stars (RoPACS) project duringthis research, a Marie Curie Initial Training Network funded by the European
11

Gandolfi et al.: The transiting planet KOI-183b
Commission’s Seventh Framework Programme. He has also received fundingfrom the Vaisala Foundation through the Finnish Academy of Science andLetters and from the Leverhulme Research Project grant RPG-2012-661. TheIAC team acknowledges funding by the grant number AYA2012-39346-C02-02and financial support under the 2011 Severo Ochoa Program SEV-2011-0187,both from the Spanish Ministry of Economy and Competitiveness (MINECO).This paper includes data collected by the Kepler mission. Funding for the Keplermission is provided by the NASA Science Mission Directorate. The Kepler datapresented in this paper were obtained from the Mikulski Archive for SpaceTelescopes (MAST). STScI is operated by the Association of Universities forResearch in Astronomy, Inc., under NASA contract NAS5-26555. Support forMAST for non-HST data is provided by the NASA Office of Space Science viagrant NNX13AC07G and by other grants and contracts. This research has madean intensive use of the Simbad database and the VizieR catalogue access tool,CDS, Strasbourg, France. The original description of the VizieR service waspublished in A&AS, 143, 23.
ReferencesAigrain, S. & Irwin, M. 2004, MNRAS, 350, 331Albrecht, S., Winn, J. N., Johnson, J. A., et al. 2012, ApJ, 757, 18Angerhausen, D., DeLarme, E., Morse, J. A. 2014, eprint arXiv: 1404.4348Baglin, A., Auvergne, M., Boisnard, L., et al. 2006, 36th COSPAR Scientific
Assembly, 36, 3749Baraffe, I., Chabrier, G., Fortney, J., et al. 2014, eprint arXiv: 1401.4738Barnes, S. A. 2007, ApJ, 669, 1167Batalha, N. M., Rowe, J. F., Bryson, S. T., et al. 2013, ApJS, 204, 24Borucki, W. J., Koch, D., Basri, G., et al. 2010, Science, 327, 977Borucki, W. J., Koch, D., Basri, G., et al. 2011, ApJ, 728, 117Bruntt, H., Bedding, T. R., Quirion, P.-O., et al. 2010, MNRAS, 405, 1907Buchhave, L. A., Bakos, G. A., Hartman, J. D., et al. 2010, ApJ, 720, 1118Caldwell, D. A., Kolodziejczak, J. J., van Cleve, J. E., et al. 2010, ApJ, 713, L92Casagrande, L. 2007, ASPC, 374, 71Castelli, F. & Kurucz, R. L. 2004, eprint arXiv: astro-ph/0405087Coelho, P., Barbuy, B., Melendez, J., et al. 2005, A&A, 443, 735Cohen, O., Drake, J. J., Kashyap, V. L., et al. 2010, ApJ, 723, L64Coughlin, J. L. & Lopez-Morales, M. 2012, AJ, 143, 39Crida, A., & Batygin, K. 2014, A&A, 567, A42Cutri, R. M., Skrutskie, M. F., van Dyk, S., et al. 2003, in “2MASS All-Sky
Catalog of Point Sources”, NASA/IPAC Infrared Science ArchiveCutri, R. M., et al. 2012, yCat, 2311, 0Cyburt, R. H., 2004, PhRvD, 70, 023505Degl’Innocenti, S., Prada Moroni, P. G., Marconi, M., Ruoppo, A. 2008, Ap&SS,
316, 25Dell’Omodarme, M., Valle, G., Degl’Innocenti, S., Prada Moroni, P. G. 2012,
A&A, 540, A26Doyle, A. P., Davies, G. R., Smalley, B., et al. 2014, MNRAS, 444, 3592Enoch, B., Collier Cameron, A. & Horne, K. 2012, A&A, 540, A99Ford, E. B., Rowe, J. F., Fabrycky, D. C., et al. 2011, ApJS, 197, 2Foreman-Mackey, D., Hogg, D W., Lang, D., et al. 2013, PASP, 125, 306Fortney, J. J., Marley, M. S., Barnes, J. W. 2007, ApJ, 659, 1661Frandsen, S. & Lindberg, B. 1999, in “Astrophysics with the NOT”, proceedings
Eds: Karttunen, H. & Piirola, V., anot. conf, 71Gandolfi, D., Alcala, J. M., Leccia, S., et al. 2008, ApJ, 687, 1303Gandolfi, D., Hebrard, G., Alonso, R., et al. 2010, A&A, 524, A55Gandolfi, D., Collier Cameron, A., Endl, M., et al. 2012, A&A, 543, L5Gandolfi, D., Parviainen, H., Fridlund, M., et al. 2013, A&A557, A74Gennaro, M., Prada Moroni, P. G. & Degl’Innocenti, S. 2010, A&A, 518, A13Gibson, N. P., Aigrain, S., Roberts, S., et al. 2012, MNRAS, 419, 2683Gimenez, A. 2006, A&A, 450, 1231Goodman, J., & Lackner, C. 2009, ApJ, 696, 2054Goodman, J. & Weare, J. 2010, Communications in Applied Mathematics and
Computational Science, 5, 65Gregory, P. C. 2005, in “Bayesian Logical Data Analysis for the Physical
Sciences: A Comparative Approach with ‘Mathematica’ Support”,Cambridge University Press
Guillot, T. 2008, PhST, 130, 014023Gustafsson, B., Edvardsson, B., Eriksson, K., et al. 2008, A&A, 486, 951Hauschildt, P. H., Allard, F. & Baron, E. 1999, ApJ, 512, 377Hirano, T., Sanchis-Ojeda, R., Takeda, Y., et al. 2014, ApJ, 783, 9Jenkins J. M., Caldwell, D. A., Chandrasekaran, H., et al. 2010, ApJ, 713, L12Jimenez, R., Flynn, C., MacDonald, J., et al. 2003, Science, 299, 1552Kinemuchi, K., Barclay, T., Fanelli, M., et al. 2012, PASP, 124, 963Kipping, D. M. 2010, MNRAS, 408, 1758Lainey, V., Arlot, J.-E., Karatekin, O., & van Hoolst, T. 2009, Nature, 459, 957Lanza, A. F. 2010, A&A, 512, A77Leconte, J., Chabrier, G., Baraffe, I., & Levrard, B. 2010, A&A, 516, A64
Leger, A., Rouan, D., Schneider, J., et al. 2009, A&A, 506, 287Lissauer, J. J., Marcy, G. W., Bryson, S. T., et al. 2014, ApJ, 784, 44Loyd, R. O. P. & France, K. 2014, ApJS, 211, 9Mardling, R. A., & Lin, D. N. C. 2002, ApJ, 573, 829Marilli, E., Frasca, A., Covino, E., et al. 2007, A&A463, 1081Mazeh, T., Nachmani, G., Holczer, T., et al. 2013, ApJS, 208, 16Mazeh, T., Holczer, T., Shporer, A., 2014, eprint arXiv:1407.1979McQuillan, A., Mazeh, T., Aigrain, S. 2013, ApJ, 775, L11Ogilvie, G. I., & Lin, D. N. C. 2007, ApJ, 661, 1180Oshagh, M., Santos, N. C., Boisse, I., et al. 2013, A&A, 556, A19Parviainen, H., Deeg, H. J. & Belmonte, J. A. 2013, A&A, 550, A67Parviainen, H., Gandolfi, D., Deleuil, M., et al. 2014, A&A, 562, A140Peimbert, M., Luridiana, V., Peimbert, A., Carigi, L. 2007a, ASPC, 374, 81Peimbert, M, Luridiana, V. & Peimbert, A. 2007b, ApJ, 666, 636Queloz, D., Henry, G. W., Sivan, J. P., et al. 2001, A&A, 379, 279Quintana, E. V., Barclay, T., Raymond, S. N., et al. 2014, Science, 344, 277Rasmussen, C. E. & Williams, C. 2006, in “Gaussian processes for machine
learning”, ed. “The MIT Press”Rauer, H., Catala, C., Aerts, C., et al. 2013, eprint arXiv:1310.0696Rowe J. F., Bryson, S. T.; Marcy, G. W. et al. 2014, ApJ, 784, 45Sanchis-Ojeda, R., Winn, J. N., Marcy, G. W. et al. 2013, ApJ, 775, 54Santerne, A., Dıaz, R. F., Moutou, C., et al. 2012, A&A, 545, A76Sliski D., H., Kipping D. M. 2014, ApJ, 788, 148Smith, J. C., Stumpe, M. C., Van Cleve, J. E., et al. 2012, PASP, 124, 1000Steffen, J. H., Ragozzine, D., Fabrycky, D. C. et al. 2012, PNAS, 109, 7982Straizys, V. & Kuriliene, G. 1981, Ap&SS, 80, 353Stumpe, M. C., Smith, J. C., Van Cleve, J. E., et al. 2012, PASP, 124, 985Szabo, R., Szabo, Gy. M., Dalya, G., et al. 2013, A&A, 553, A17Telting, J. H., Avila, G., Buchhave, L., et al. 2014, AN, 335, 41Tognelli, E., Prada Moroni, P. G. & Degl’Innocenti, S. 2011, A&A, 533, A109Udry, S., Mayor, M., Queloz, D. 1999, ASPC, 185, 367Valenti, J. A. & Piskunov, N. 1996, A&AS, 118, 595Valenti, J. A. & Fischer, D. A. 2005, ApJS, 159, 141Van Eylen, V., Lindholm Nielsen, M., Hinrup, B., et al. 2013, ApJ, 774, L19Winn, J. N., in “Exoplanets” 2010a, ed. S. Seager, University of Arizona Press
(Tucson, AZ)Winn, J. N., Fabrycky, D. C., Albrecht, S., et al. 2010b, ApJ, 718, L145Wright, E. L., Eisenhardt, P. R. M., Mainzer, A. K., et al. 2010, AJ, 140, 1868
12

Gandolfi et al.: The transiting planet KOI-183b
Table 5. KOI-183 system parameters.
Model parameters
Planet orbital period Porb (day) 2.68432850 ± 0.00000007Planetary mid-transit epoch T0 (HJD-2 450 000 day) 4966.35480997 ± 0.00002124Planet-to-star area ratio R2
p/R2? 0.015872 ± 0.000062
Planet-to-star surface brightness ratio f (8.93 ± 4.13) × 10−4
Impact parameter b 0.3006 ± 0.0100Bulk stellar density ρ? ( g cm−3) 1.398 ± 0.096Linear limb-darkening coefficient u1 0.4650 ± 0.0100Quadratic limb-darkening coefficient u2 0.1518 ± 0.0228Radial velocity semi-amplitude K ( km s−1) 0.0967 ± 0.0118Systemic radial velocity Vγ ( km s−1) −3.0410 ± 0.0081Orbit eccentricity e 0.019+0.028
−0.014
Argument of periastron ω (degree) 120.26+77.01−33.88
Kepler LC data scatter σLC (ppm) 292.2 ± 2.4Kepler SC data scatter σSC (ppm) 1145.7 ± 2.1
Derived parameters
Planet-to-star radius ratio Rp/R? 0.12599 ± 0.00024Planetary eclipse depth ∆Fec (ppm) 14.2 ± 6.6Scaled semi-major axis of the planetary orbit ap/R? 8.106+0.117
−0.259
Semi-major axis of the planetary orbit ap (AU) 0.03585+0.00052−0.00114
Orbital inclination angle ip (degree) 87.828 ± 0.126Planetary transit duration T14 (hour) 2.7220 ± 0.0019Transit ingress and egress duration T12 = T34 (hour) 0.3330 ± 0.0024
Stellar fundamental parameters
Effective temperature Teff (K) 5560 ± 80Surface gravitya log g (log10 g cm−2) 4.44 ± 0.10Surface gravityb log g (log10 g cm−2) 4.41 ± 0.04Metallicity [M/H] (dex) −0.10 ± 0.05Microturbulent velocityc vmicro ( km s−1) 1.0 ± 0.1Macroturbulent velocityc vmacro ( km s−1) 2.8 ± 0.4Projected stellar rotational velocity v sin i? ( km s−1) 2.5 ± 0.5Spectral typed G4 VStar mass M? (M) 0.85 ± 0.04Star radius R? (R) 0.95 ± 0.04Star age t (Gyr) 11 ± 2Star rotation periode Prot (day) 22.047 ± 0.121Interstellar extinction AV (mag) 0.044 ± 0.044Distance of the system d (pc) 725 ± 75
Planetary fundamental parameters
Planet mass f Mp (MJup) 0.595 ± 0.081Planet radius f Rp (RJup) 1.192 ± 0.052Planet density ρp ( g cm−3) 0.459 ± 0.083Equilibrium temperature Teq (K) 1605 ± 120Brightness temperatureg Tbr (K) 1950 ± 250Geometric albedog Ag 0.055 ± 0.028Bond albedog AB 0.037 ± 0.019
Notes.(a) Obtained from the spectroscopic analysis. (b) Obtained from Teff , [M/H], and ρ?, along with the Pisa Stellar Evolution Data Base for low-massstars. (c) Using the calibration equations of Bruntt et al. (2010) and Doyle et al. (2014). (d) With an accuracy of ± 1 sub-class. (e) From McQuillanet al. (2013). ( f ) Radius and mass of Jupiter taken as 6.9911×109 cm and 1.89896×1030 g, respectively. (g) Assuming Ag = 1.5 × AB and heatredistribution factor between 1/4 and 2/3.
13
Copyright © 2022 FDOKUMEN


![Abhishek [Male] Om Sri During Uttarayana period; with Jupiter i](https://static.fdokumen.com/doc/165x107/63122a9b7efb61247603d5e5/abhishek-male-om-sri-during-uttarayana-period-with-jupiter-i.jpg)